Embed Size (px)
Citation preview

Global Competitiveness Report 2015-2016Caroline Galvan
Vilnius, 01.12.2015

World Economic Forum
Our
Conversation
Today
2
01
Methodology
02
Global Ranking
and Key
Messages
03
Performance of
the EU with a
focus on CEE
and Lithuania

Methodology
3

The set of institutions,
policies, and factors that
determine the level of
productivity of a country.
The level of productivity,
in turn, sets the level of
prosperity that can be
earned by an economy.
4

The Global Competitiveness Index:
What lies behind different growth path?
0
5.000
10.000
15.000
20.000
25.000
30.000
35.000
40.000
1980 1983 1986 1989 1992 1995 1998 2001 2004 2007 2010 2013
GD
P (
PP
P)
per
cap
ita
Madagascar Brazil China Korea

The Global Competitiveness Index:
The Global Competitiveness Index
6
The Global Competitiveness Index
Factor-driven
1.Institutions
2.Infrastructure
3. Macroeconomic
environment
4. Health and
primary education
Efficiency-
driven
Innovation-
driven
5. Higher education
and training
6. Goods market
efficiency
7. Labor market
efficiency
8. Financial market
development
9. Technological
readiness
10. Market size
11. Business
sophistication
12. Innovation

The Global Competitiveness Index:
Stages of development and drivers of competitiveness
Innovation-driven stageTransition stageEfficiency-driven
stage
Transition
stage
Factor-driven
stage
Basic
Innovation
Efficiency
$2,0
0 0
$3,0
0 0
$9,0
0 0
$17,0 00
GDP per capitaUS$ (not to scale)
Competitiveness
drivers

The Global Competitiveness Index:
Data sources
Quantitative data sourced from
international organizations.
Qualitative data sourced from the annual
Executive Opinion Survey carried out by
the network of the World Economic
Forum’s Partner Institutes.

Global Ranking and Key Messages
9

The Global Competitiveness Report:
Rankings
10
Switzerland retains its 7-year long reign at the top, stable Top-3 this year
Germany overtakes Finland as the most competitive country in the EU at 4th, Greece closes at 81st
Mixed picture in emerging markets: China confirms its 28th place, South Africa re-enters Top 50, India climbs 16 positions to 55th, Brazil least competitive BRIC economy at 75th
Chile remains the most competitive economy in Latin America, at 35th.
Mauritius remains sub- Saharan Africa’s most competitive economy; 15 out of bottom-20 economies are, however, from the region.
Rank Economy1 Switzerland 5.8
2 Singapore 5.7
3 United States 5.6
4 Germany 5.5
5 Netherlands 5.5
6 Japan 5.5
7 Hong Kong SAR 5.5
8 Finland 5.5
9 Sweden 5.4
10 United Kingdom 5.4
11 Norway 5.4
12 Denmark 5.3
13 Canada 5.3
15 Taiwan 5.3
17 United Arab Emirates 5.2
18 Malaysia 5.2
19 Belgium 5.2
22 France 5.1
28 China 4.9
Rank Economy Score
33 Spain 4.6
35 Chile 4.6
37 Indonesia 4.5
38 Portugal 4.5
43 Italy 4.5
45 Russian Federation 4.4
46 Mauritius 4.4
47 Philippines 4.4
49 South Africa 4.4
51 Turkey 4.4
55 India 4.3
56 Vietnam 4.3
57 Mexico 4.3
75 Brazil 4.1
81 Greece 4.0
106 Argentina 3.8
124 Nigeria 3.5
131 Myanmar 3.3
140 Guinea 2.8

The Global Competitiveness Report 2015-2016:
Not settling for the “new normal”
11
In most countries, productivity
growth has slowed down in the
last decade.
This leads to lower levels of
economic growth and higher
unemployment rates.
Improving competitiveness is
key to escape this “new
normal”.
Difference in total factor productivity, unemployment and GDP per capita growth between the
1995–2004 and 2005–14 decades
Sources: The Conference Board; IMF World Economic Outlook (April 2015); World Bank World Development
Indicators

The Global Competitiveness Report 2015-2016:
Competitiveness improves resilience
12
A number of risks could derail
the current recovery (e.g.
geopolitical tensions, currency
and commodity price
fluctuations)
More competitive economies
are better placed to withstand
external shocks
Growth rates of the most and least competitive economies, by income group
Average annual growth rate, 2007–14
Sources: IMF World Economic Outlook (April 2015); World Economic Forum

The Global Competitiveness Report 2015-2016: :
Leveraging the human factor – talent at heart of competitive economies
Performance of selected advanced economies on selected human capital–related indicators. Rank out of 140

Performance of the EU with a focus on CEE and Lithuania
14

The Global Competitiveness Report:
Ranking of EU28 economies (out of 140 economies)
15
Germany overtakes Finland as the most competitive country in the EU at 4th, Greece closes at 81st
Lithuania is now the third most competitive economy in Central and Eastern Europe (behind Estonia and the Czech Republic)
Thanks to reform packages aimed at improving the functioning of markets, Spain and Italy climb two and six places respectively. Similar improvements in the product and labour market in France (22nd) and Portugal (38th) are outweighed by a weakening performance in other areas.
Rank Economy Score
36 Lithuania 4.6
38 Portugal 4.5
41 Poland 4.5
43 Italy 4.5
44 Latvia 4.5
48 Malta 4.4
53 Romania 4.3
54 Bulgaria 4.3
59 Slovenia 4.3
63 Hungary 4.3
65 Cyprus 4.2
67 Slovak Republic 4.2
77 Croatia 4.1
81 Greece 4.0
Rank Economy Score
4 Germany 5.5
5 Netherlands 5.5
8 Finland 5.5
9 Sweden 5.4
10 United Kingdom 5.4
12 Denmark 5.3
19 Belgium 5.2
20 Luxembourg 5.2
22 France 5.1
23 Austria 5.1
24 Ireland 5.1
30 Estonia 4.7
31 Czech Republic 4.7
33 Spain 4.6

The Global Competitiveness Report 2015-2016:
Performance of EU 28 in the 12 pillars of competitiveness (Score 1-7)
16
Sources: Global Competitiveness Report 2015-2016

The Global Competitiveness Index 2015-2016:
Performance of EU15 and CEE (compared to the US)
17
Overall, CEE performs close to
par with many EU 15
economies
Yet, still considerable gaps in
institutions, infrastructure,
and innovation factors; to
some extent technological
readiness
Sources: World Economic Forum

The Global Competitiveness Index 2015-2016:
Performance of Lithuania vs. EU 15
18
LT third most competitive
economy among CEE
economies (36th)
Performs on par with many EU
15 economies in
technological readiness
(22nd)
LT ranks 24th in higher
education and training (third
best in CEE)
Yet, still considerable gaps in
institutions, infrastructure,
and innovation
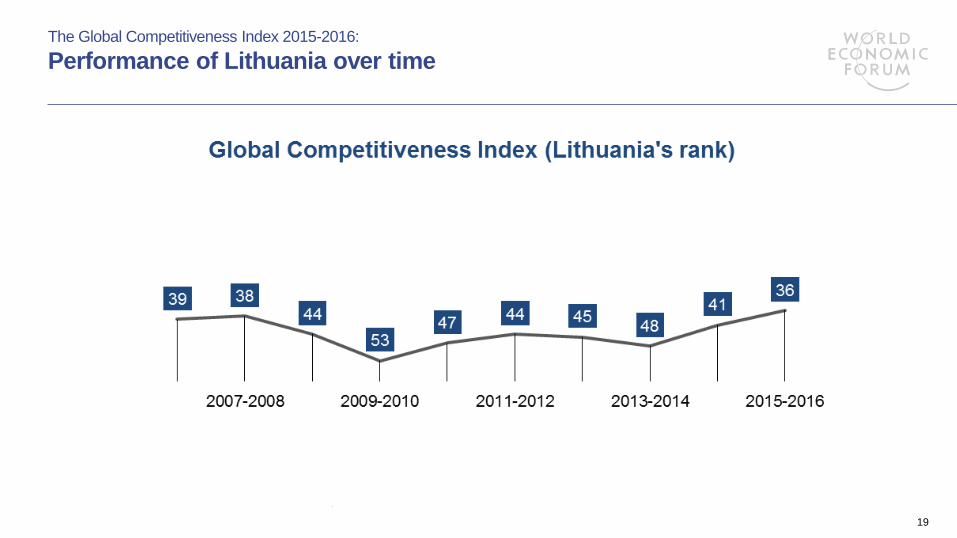
The Global Competitiveness Index 2015-2016:
Performance of Lithuania over time
19

The Global Competitiveness Index 2015-2016:
Leveraging the human factor – CEE compared to EU most competitive
economies (Rank out of 140)
21
Economy Manufac
turing %
GDP -
2014
Global
Competitive
ness Index
Quality of the
educational
system
Extent of
staff training
Quality of
math and
science
education
Availability
of scientists
and
engineers
Pay and
productivity
Hiring and
firing
practices
Cooperation
in labor-
employer
relations
Flexibility of
wage
determinati
on
Country
capacity to
retain
talent
Country
capacity to
attract
talent
rank rank rank rank rank rank rank rank rank rank rank
Top-1 Sw itzerland 1 1 1 4 23 4 2 1 16 1 1
Germany 22 4 10 13 16 15 13 107 20 132 13 19
Netherlands 12 5 8 9 7 22 46 89 8 131 11 13
Finland 16 8 4 10 2 1 42 87 22 140 7 61
Sw eden 16 9 25 8 43 14 44 106 7 133 15 25
United Kingdom 9 10 21 21 46 18 21 11 21 15 9 4
Estonia 16 30 34 32 14 73 10 13 28 1 93 86
Czech Republic 25 31 60 39 57 66 18 98 40 17 58 85
Lithuania 20 36 53 35 20 61 27 120 72 11 108 116
Poland 19 41 73 65 51 53 65 97 97 28 116 126
Latvia 12 44 64 42 40 101 23 63 30 2 104 110
Romania n/a 53 90 89 26 57 67 77 90 59 131 113
Bulgaria n/a 54 93 118 62 90 77 86 106 72 133 132
Slovenia 23 59 50 58 13 62 81 136 105 124 98 118
Hungary 23 63 99 114 75 51 87 35 82 68 123 121
Slovak Republic 20 67 121 82 76 80 38 128 98 102 127 129
Croatia 14 77 103 123 31 78 74 129 130 57 134 135
Centr
al a
nd E
aste
rn E
uro
pe
Top-5
EU
Source: World Bank, World Development Indicators and Global Competitiveness Report 2015-2016

The Global Competitiveness Report 2015-2016:
Most problematic factors for doing business
22
Inefficient government
bureaucracy, tax rate,
and restrictive labor
regulations remain the
most problematic
factors for doing
business in Lithuania.
An inadequately
educated workforce
ranks 4th – addressing
the labor pool will be
important going forward.
From the list of factors, respondents were asked to select the five most problematic for doing business in their country and to rank them between 1 (most problematic) and 5. The score corresponds to the responses
weighted according to their rankings.

The Global Competitiveness Report 2015-2016:
Key messages
1. The EU28 hosts some of the most competitive
economies globally – closing the competitive
gap between Europe’s least and most
competitive economies will be important.
2. From a CEE perspective, the biggest
contribution will be to focus efforts to close the
performance gap in institutions, infrastructure,
and the innovation ecosystem.
3. Efforts to move towards an knowledge-driven
economy with a focus on institutions, talent, and
the innovation ecosystem.
European Union
Central and Eastern
Europe
Lithuania

Thank you for your attention