Embed Size (px)
Citation preview
Global Conflict & Terrorism Trends
National Press ClubMonday, September 14, 2009
Peace and Conflict Ledger and Conflict Trends
Joseph HewittCIDCM
University of Maryland
Over the past two years, the risks of instability and conflict have increased significantly in the regions of the world where those dangers were already very high.
What is one of the most serious threats to international stability?
The recurrence of armed hostilities in conflicts that have recently come to an end.
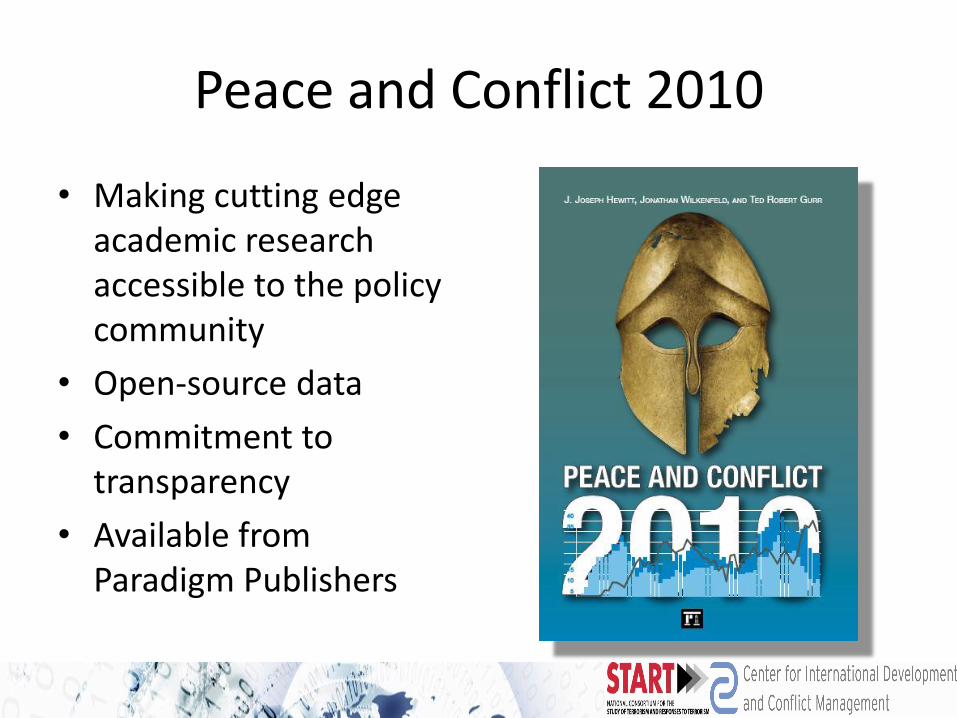
Peace and Conflict 2010
• Making cutting edge academic research accessible to the policy community
• Open-source data
• Commitment to transparency
• Available from Paradigm Publishers
Peace and Conflict Ledger
• What does the Peace and Conflict Ledger measure?
• The risk of an instability event occurring in a country in the next three years.
Some Key Details
• The focus is on how structural attributes of states influence the risk of instability
• Four domains of government activity (economics, politics, security, and social)
• Estimated a statistical model on data from 1950-2003 (training data)
• Obtain country risk estimates by inputting 2007 values for all countries
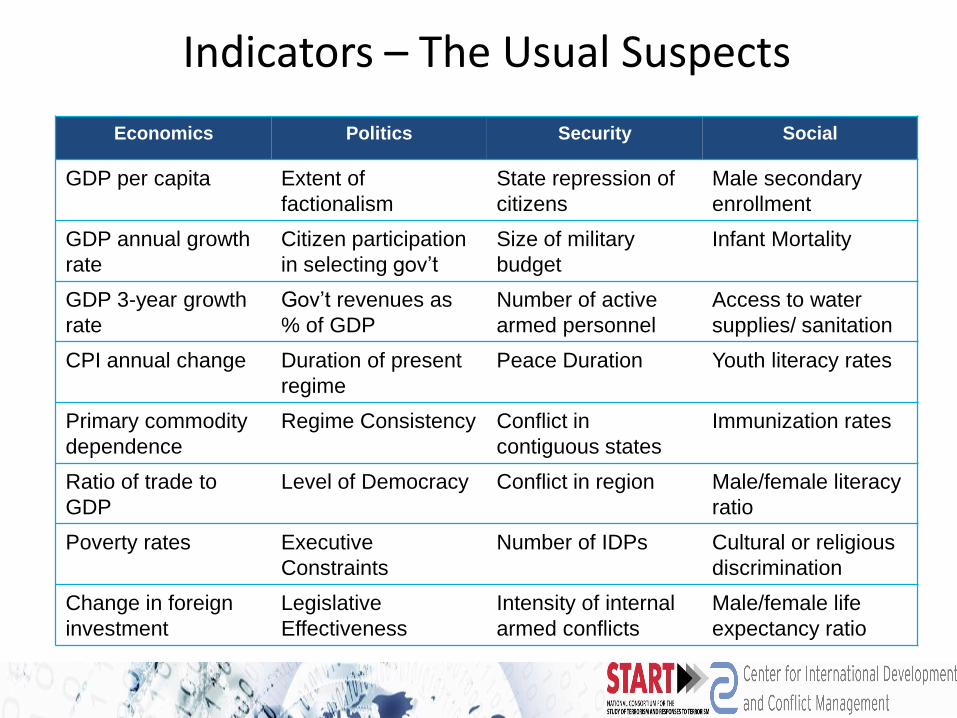
Indicators – The Usual Suspects
Economics Politics Security Social
GDP per capita Extent of
factionalism
State repression of
citizens
Male secondary
enrollment
GDP annual growth
rate
Citizen participation
in selecting gov’t
Size of military
budget
Infant Mortality
GDP 3-year growth
rate
Gov’t revenues as
% of GDP
Number of active
armed personnel
Access to water
supplies/ sanitation
CPI annual change Duration of present
regime
Peace Duration Youth literacy rates
Primary commodity
dependence
Regime Consistency Conflict in
contiguous states
Immunization rates
Ratio of trade to
GDP
Level of Democracy Conflict in region Male/female literacy
ratio
Poverty rates Executive
Constraints
Number of IDPs Cultural or religious
discrimination
Change in foreign
investment
Legislative
Effectiveness
Intensity of internal
armed conflicts
Male/female life
expectancy ratio
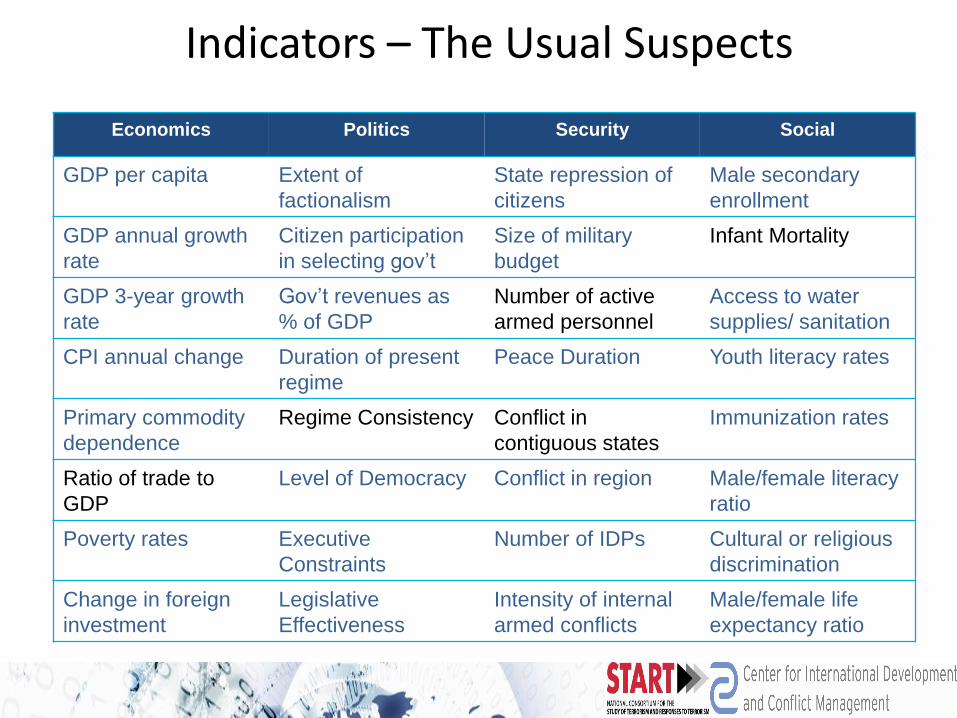
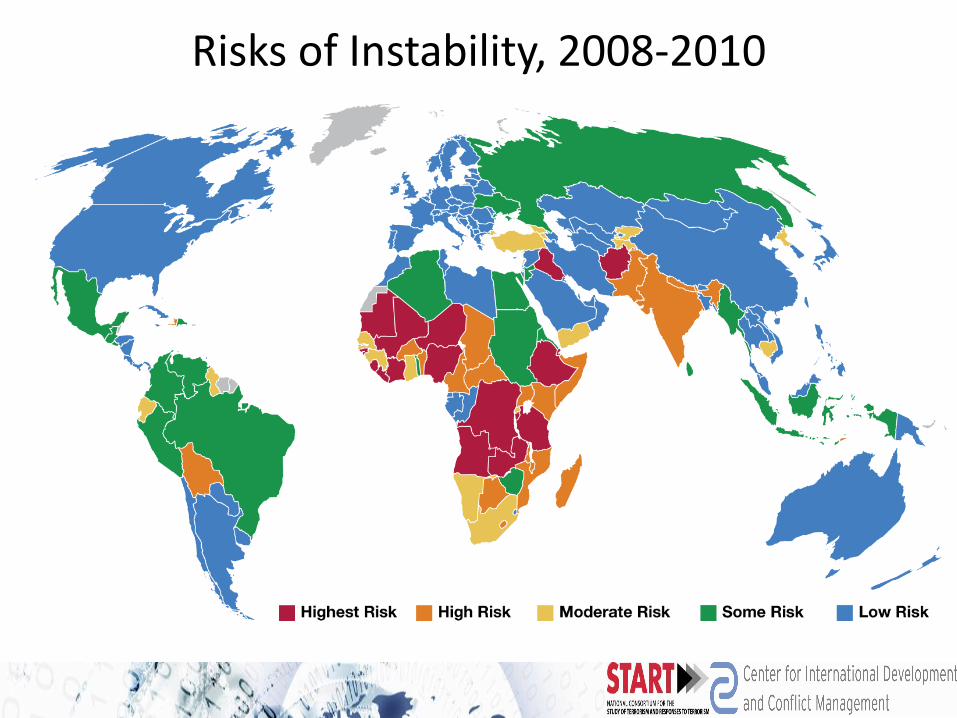
Risks of Instability, 2008-2010
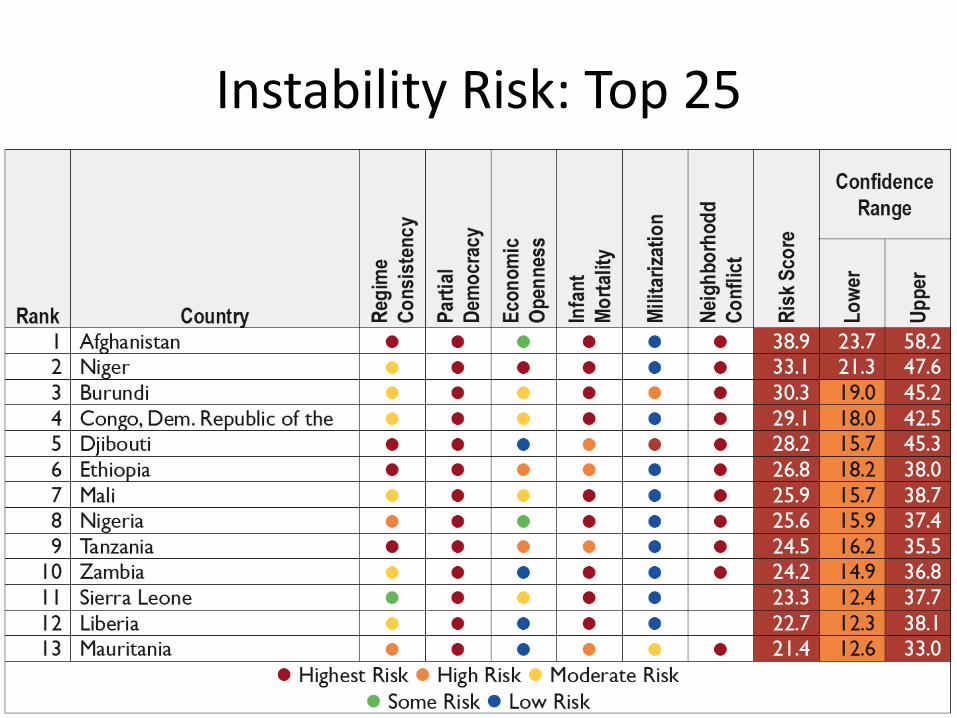
Instability Risk: Top 25
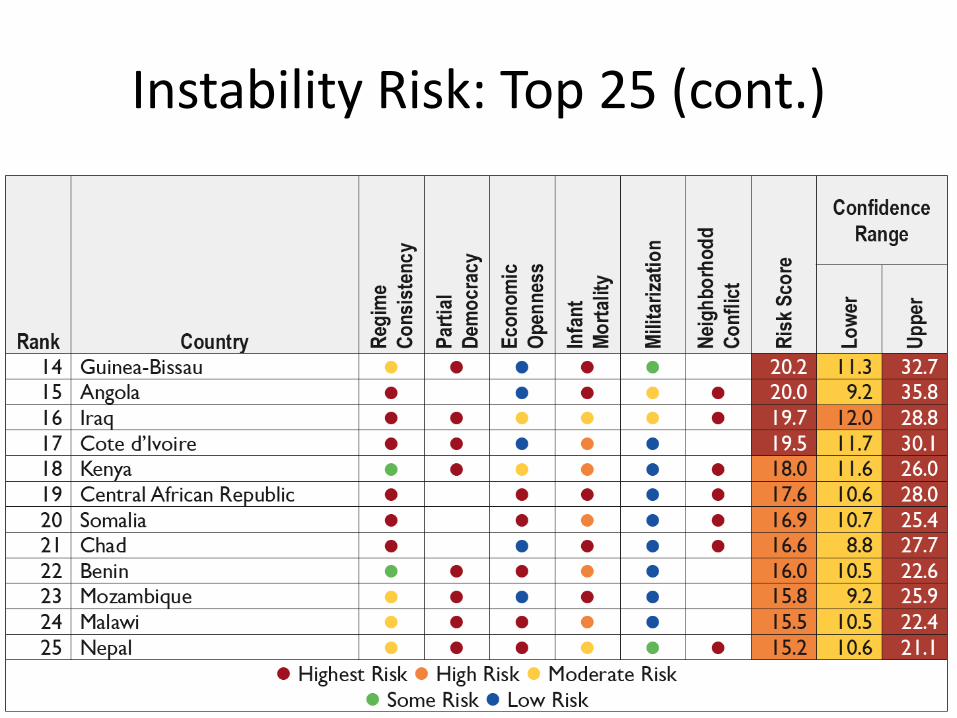
Instability Risk: Top 25 (cont.)
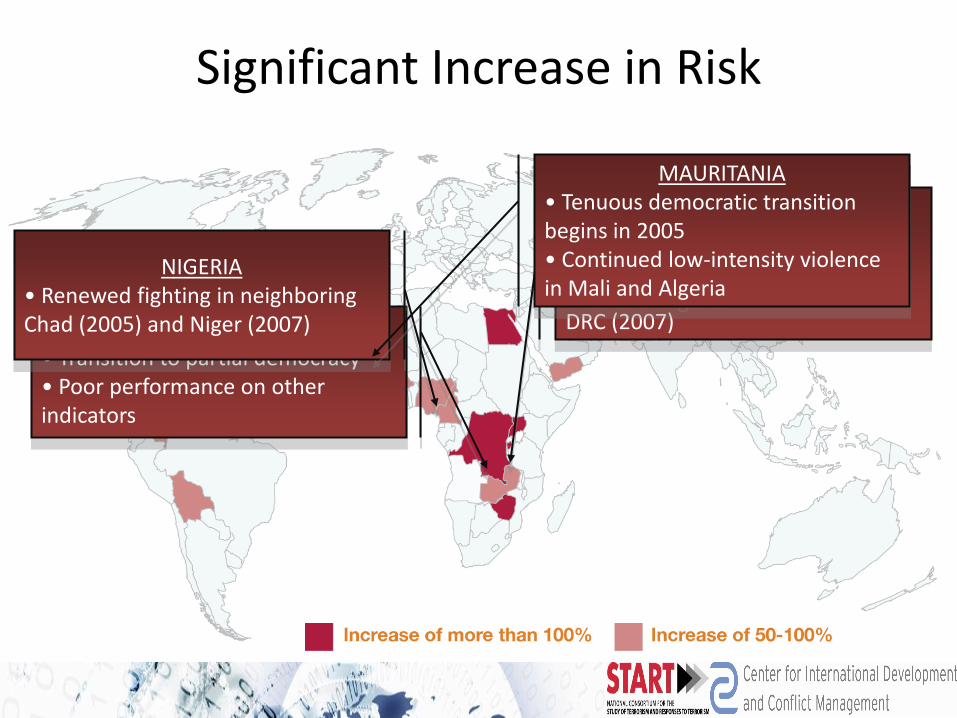
Significant Increase in Risk
DEMOCRATIC REPUBLIC OF CONGO• Transition to partial democracy• Poor performance on other indicators
BURUNDI• Democratic transition begins in 2005• Renewed fighting in neighboring DRC (2007)
NIGERIA• Renewed fighting in neighboring Chad (2005) and Niger (2007)
MAURITANIA• Tenuous democratic transition begins in 2005• Continued low-intensity violence in Mali and Algeria
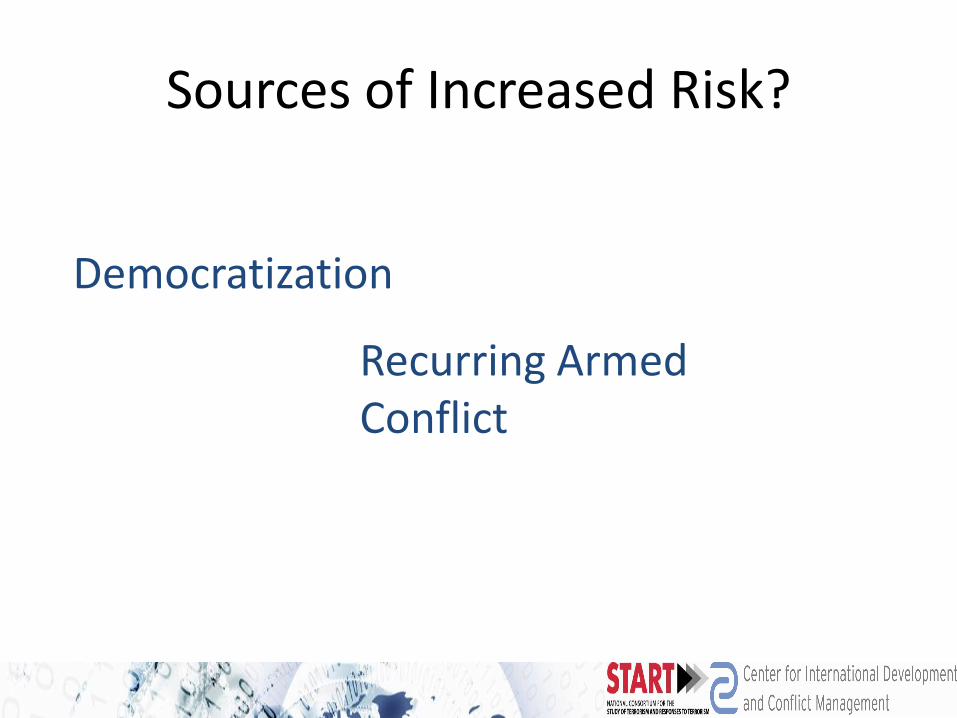
Sources of Increased Risk?
Democratization
Recurring Armed Conflict
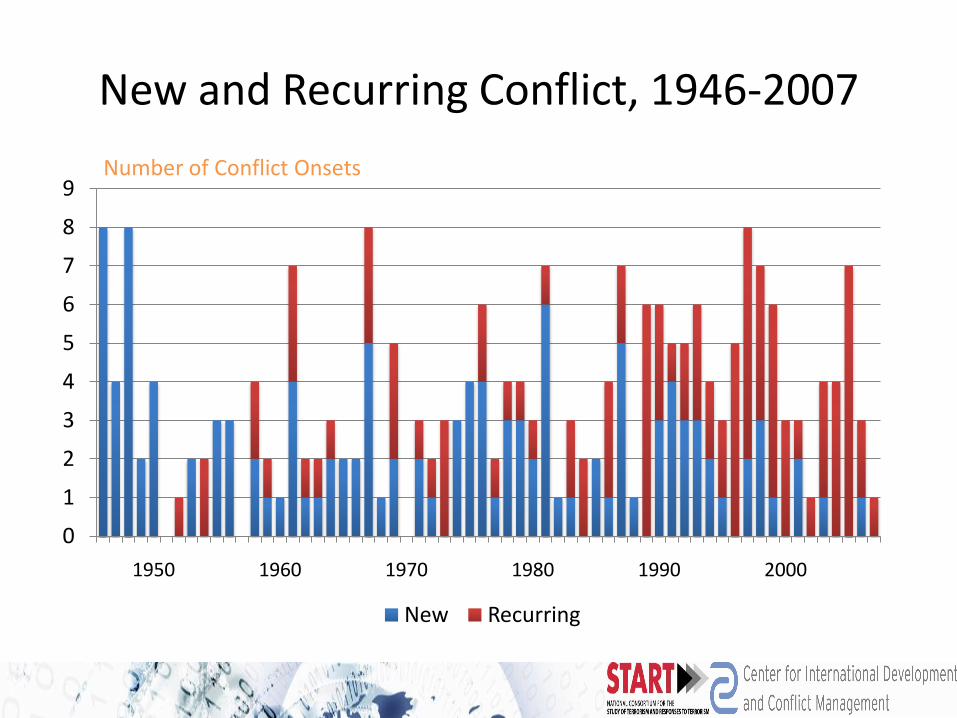
New and Recurring Conflict, 1946-2007
0
1
2
3
4
5
6
7
8
9
1950 1960 1970 1980 1990 2000
New Recurring
Number of Conflict Onsets
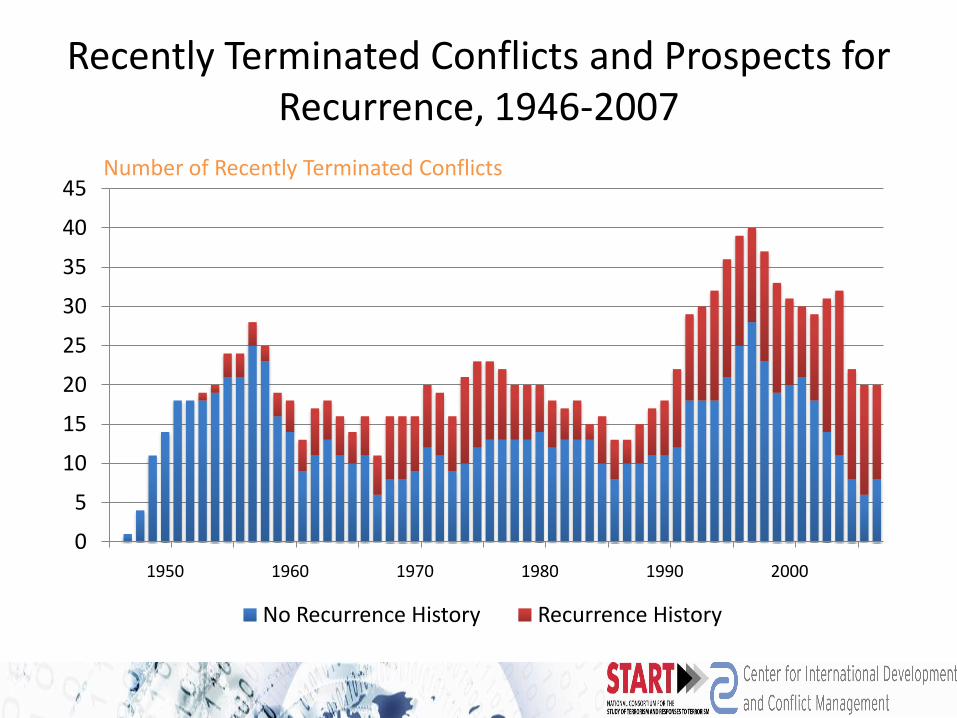
Recently Terminated Conflicts and Prospects for Recurrence, 1946-2007
0
5
10
15
20
25
30
35
40
45
1950 1960 1970 1980 1990 2000
No Recurrence History Recurrence History
Number of Recently Terminated Conflicts

Conclusion
• Devastating costs of state failure
• Stay tuned
• Diagnostic tools for policy-makers to support effective policies to mitigate conflict risks
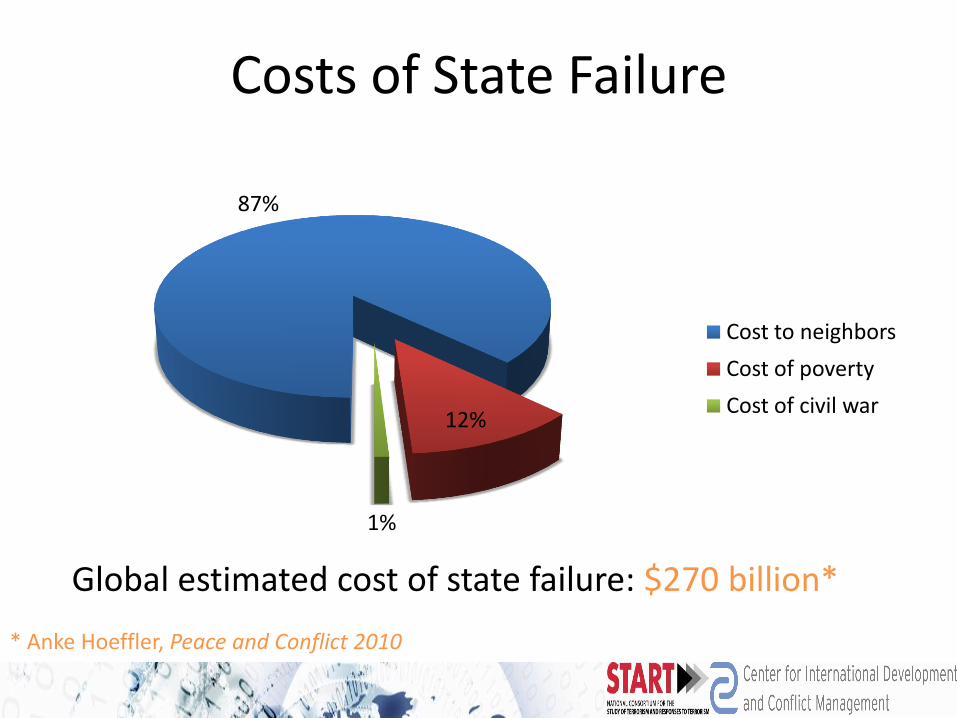
Costs of State Failure
87%
12%
1%
Cost to neighbors
Cost of poverty
Cost of civil war
Global estimated cost of state failure: $270 billion*
* Anke Hoeffler, Peace and Conflict 2010
Conclusion
• Devastating costs of state failure
• Stay tuned
• Diagnostic tools for policy-makers to support effective policies to mitigate conflict risks
GLOBAL TERRORISM TRENDS
Gary LaFree
Director, START Center
University of Maryland
• Frequency of terrorist attacks is on the rise worldwide, including an increased number of fatal attacks
• Terrorist activity has been especially more frequent in the Middle East and Asia this decade
• Countries emerging as “terrorist hotspots” are not necessarily the countries at risk of instability
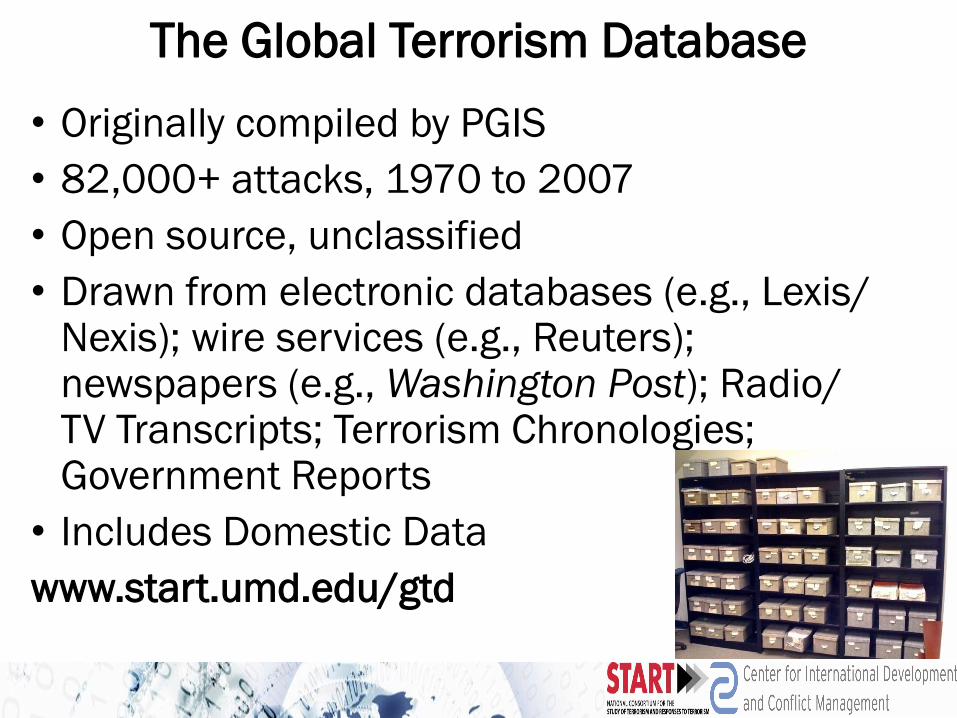
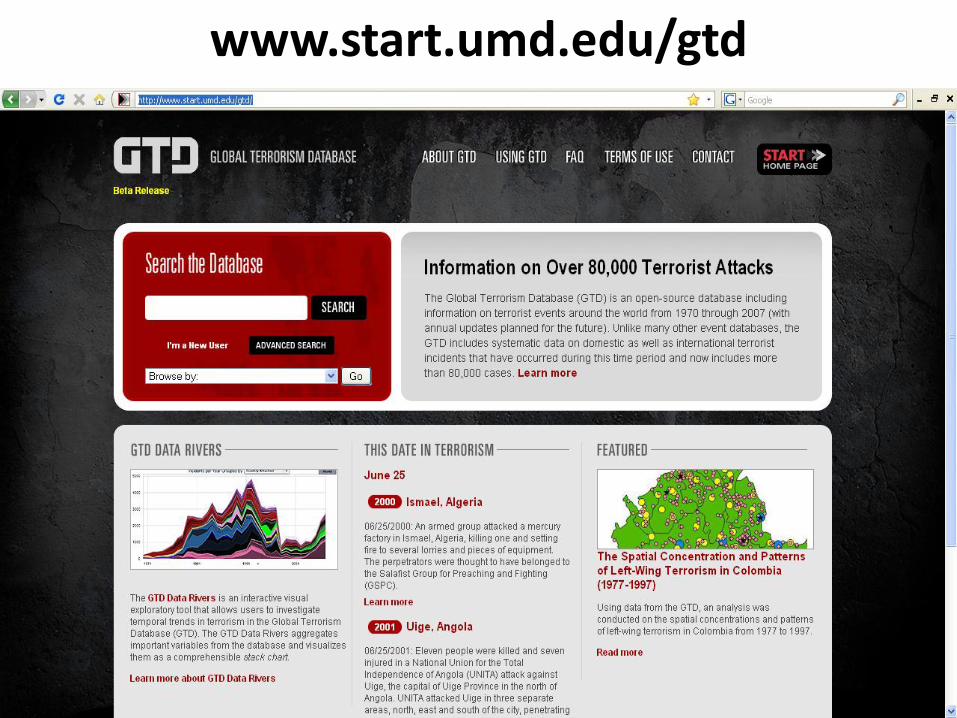
The Global Terrorism Database
• Originally compiled by PGIS
• 82,000+ attacks, 1970 to 2007
• Open source, unclassified
• Drawn from electronic databases (e.g., Lexis/ Nexis); wire services (e.g., Reuters); newspapers (e.g., Washington Post); Radio/ TV Transcripts; Terrorism Chronologies; Government Reports
• Includes Domestic Data
www.start.umd.edu/gtd
Defining Terrorism
The GTD defines terrorism as acts
by non state actors involving the
threatened or actual use of illegal
force or violence to attain a
political, economic, religious or
social goal through fear, coercion or
intimidation.
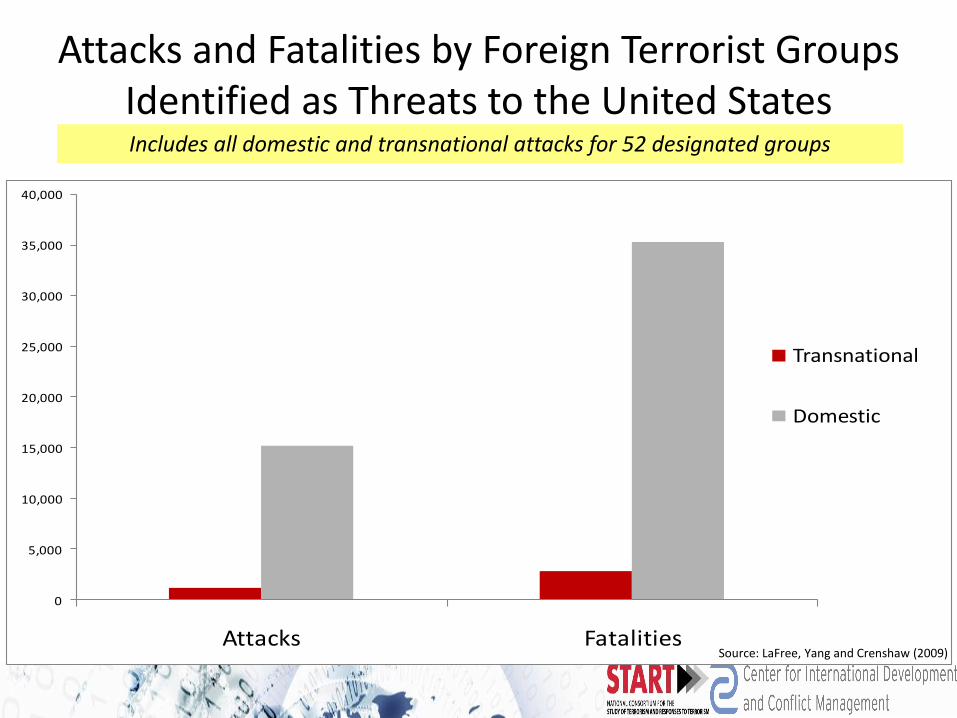
Attacks and Fatalities by Foreign Terrorist Groups Identified as Threats to the United States
6.9%(1,121)
7.3%(2,791)
93.1%(15,225)
92.7%(35,322)
0
5,000
10,000
15,000
20,000
25,000
30,000
35,000
40,000
Attacks Fatalities
Transnational
Domestic
Includes all domestic and transnational attacks for 52 designated groups
Source: LaFree, Yang and Crenshaw (2009)
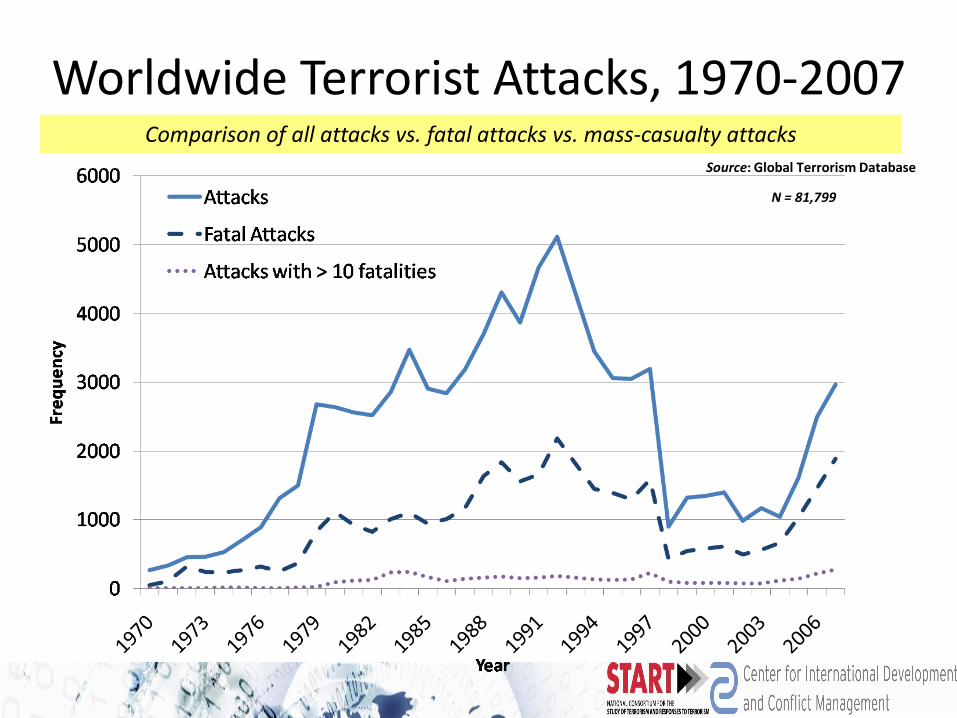
Worldwide Terrorist Attacks, 1970-2007Comparison of all attacks vs. fatal attacks vs. mass-casualty attacks
Source: Global Terrorism Database
N = 81,799
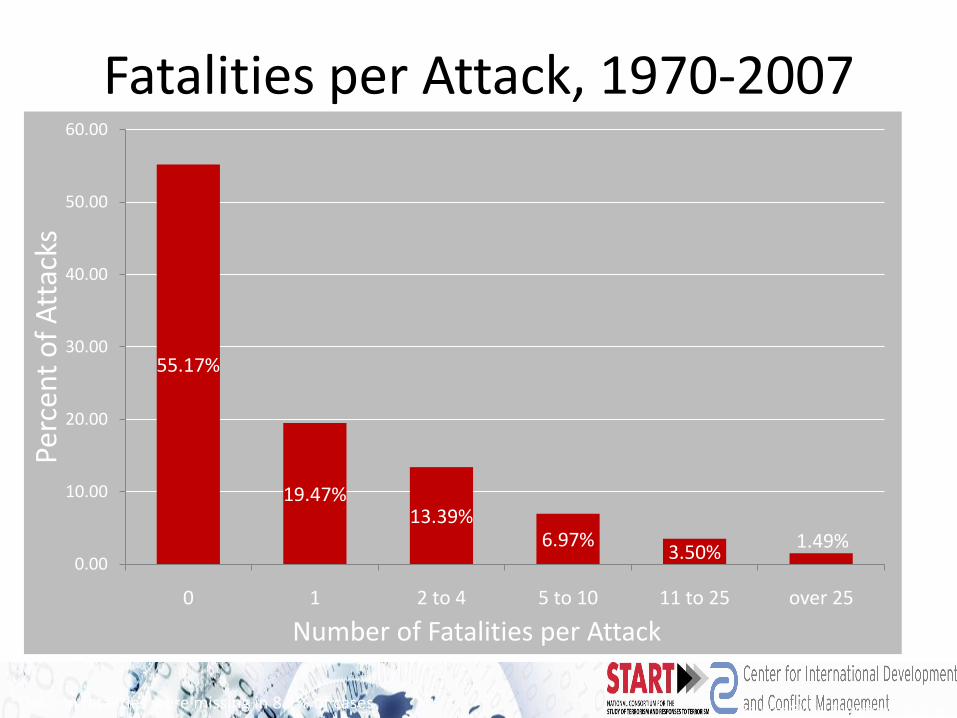
55.17%
19.47%13.39%
6.97%3.50%
1.49%0.00
10.00
20.00
30.00
40.00
50.00
60.00
0 1 2 to 4 5 to 10 11 to 25 over 25
Perc
en
t o
f A
ttac
ks
Number of Fatalities per Attack
Total Fatalities per Terrorist Attack, 1970-2007 (n=82,910*)
*Data on fatalities were missing in 8.1% of cases Source: Global Terrorism Database
Fatalities per Attack, 1970-2007
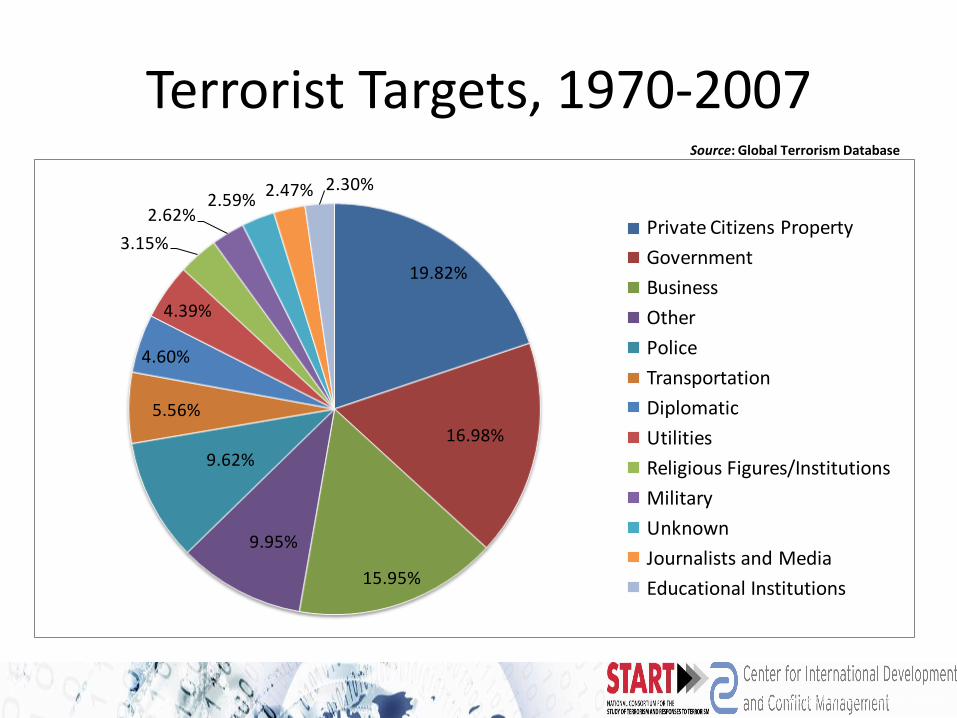
Terrorist Targets, 1970-2007
19.82%
16.98%
15.95%
9.95%
9.62%
5.56%
4.60%
4.39%
3.15%
2.62%2.59%
2.47% 2.30%
Private Citizens Property
Government
Business
Other
Police
Transportation
Diplomatic
Utilities
Religious Figures/Institutions
Military
Unknown
Journalists and Media
Educational Institutions
Source: Global Terrorism Database
Source: Global Terrorism Database
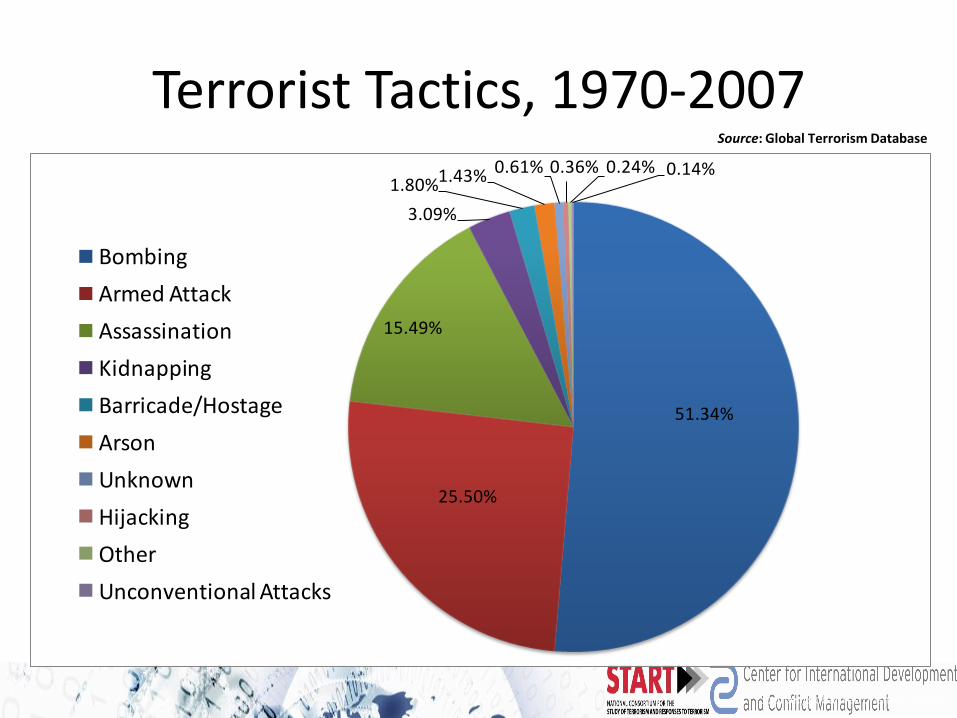
Terrorist Tactics, 1970-2007
51.34%
25.50%
15.49%
3.09%
1.80%1.43% 0.61% 0.36% 0.24% 0.14%
Bombing
Armed Attack
Assassination
Kidnapping
Barricade/Hostage
Arson
Unknown
Hijacking
Other
Unconventional Attacks
Source: Global Terrorism Database
Source: Global Terrorism Database
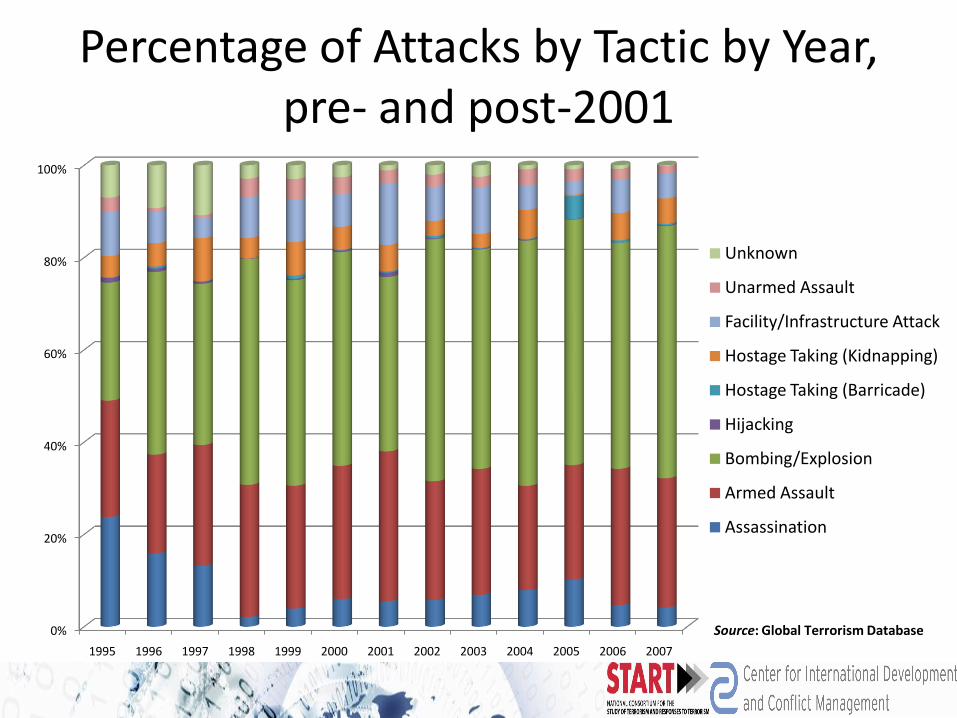
Percentage of Attacks by Tactic by Year,pre- and post-2001
0%
20%
40%
60%
80%
100%
1995 1996 1997 1998 1999 2000 2001 2002 2003 2004 2005 2006 2007
Unknown
Unarmed Assault
Facility/Infrastructure Attack
Hostage Taking (Kidnapping)
Hostage Taking (Barricade)
Hijacking
Bombing/Explosion
Armed Assault
Assassination
Source: Global Terrorism Database
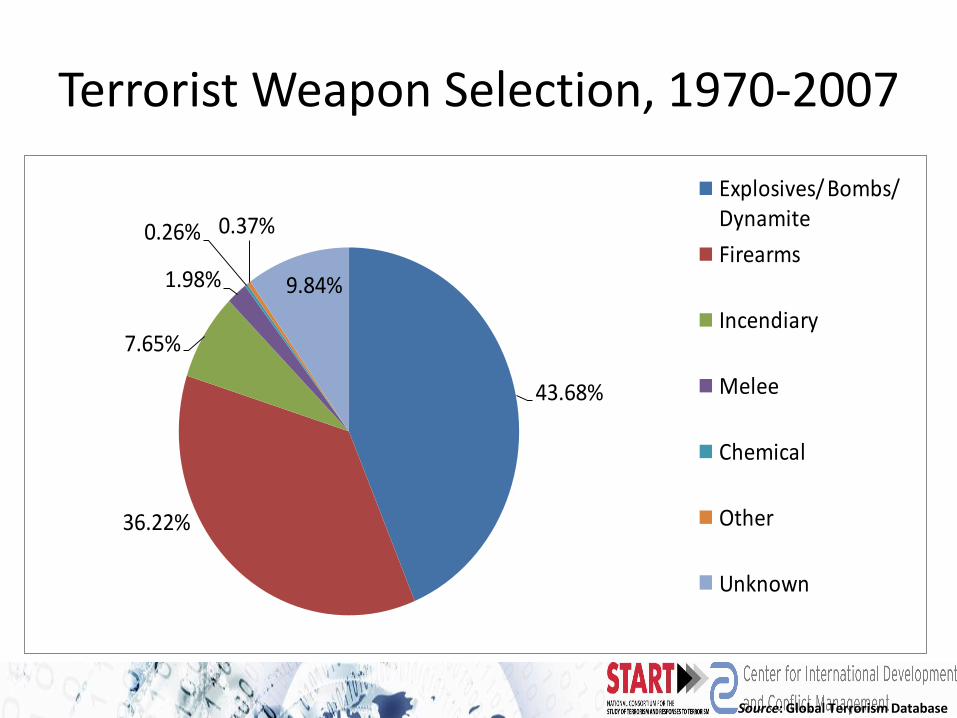
Terrorist Weapon Selection, 1970-2007
43.68%
36.22%
7.65%
1.98%
0.26% 0.37%
9.84%
Explosives/ Bombs/ Dynamite
Firearms
Incendiary
Melee
Chemical
Other
Unknown
Source: Global Terrorism Database
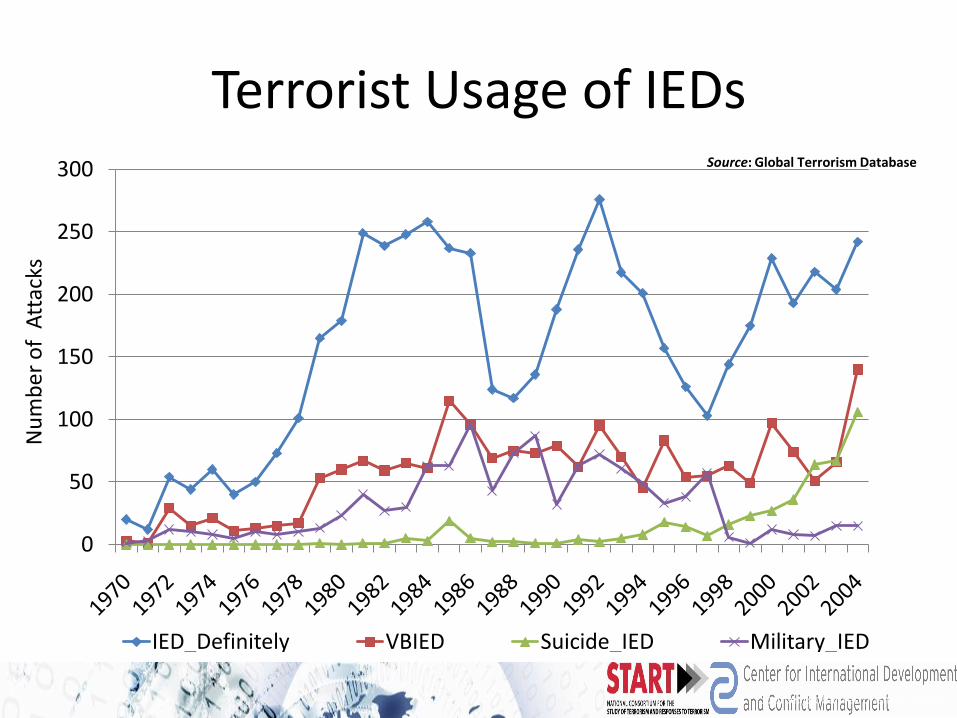
Terrorist Usage of IEDs
0
50
100
150
200
250
300
IED_Definitely VBIED Suicide_IED Military_IED
Source: Global Terrorism Database
Source: Global Terrorism Database
Nu
mb
er
of
Att
acks
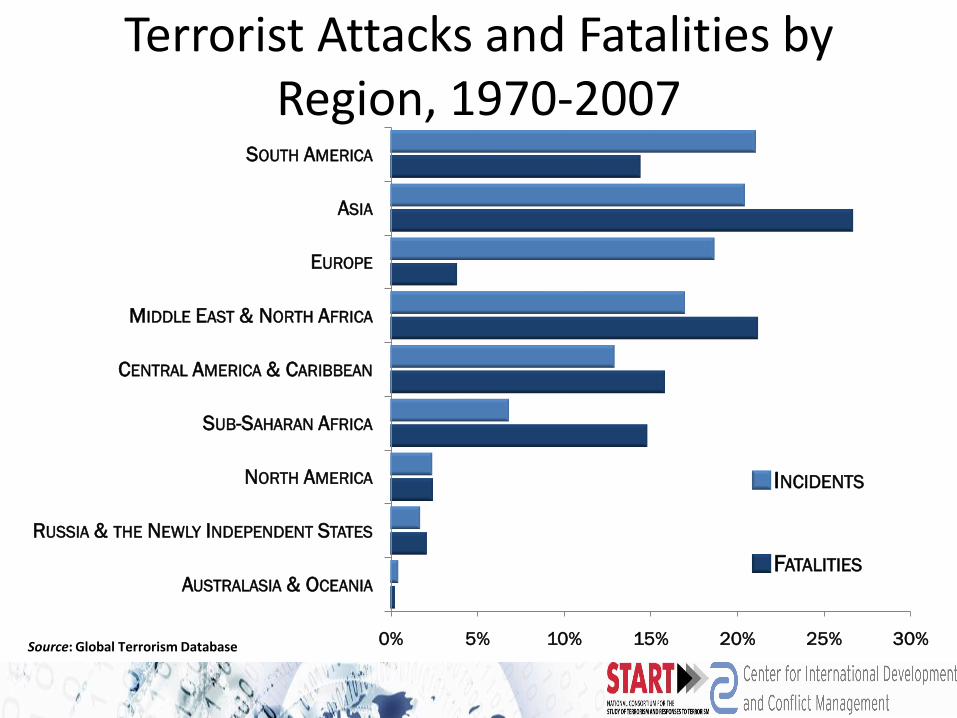
Terrorist Attacks and Fatalities by Region, 1970-2007
0% 5% 10% 15% 20% 25% 30%
AUSTRALASIA & OCEANIA
RUSSIA & THE NEWLY INDEPENDENT STATES
NORTH AMERICA
SUB-SAHARAN AFRICA
CENTRAL AMERICA & CARIBBEAN
MIDDLE EAST & NORTH AFRICA
EUROPE
ASIA
SOUTH AMERICA
INCIDENTS
FATALITIES
Source: Global Terrorism DatabaseSource: Global Terrorism Database
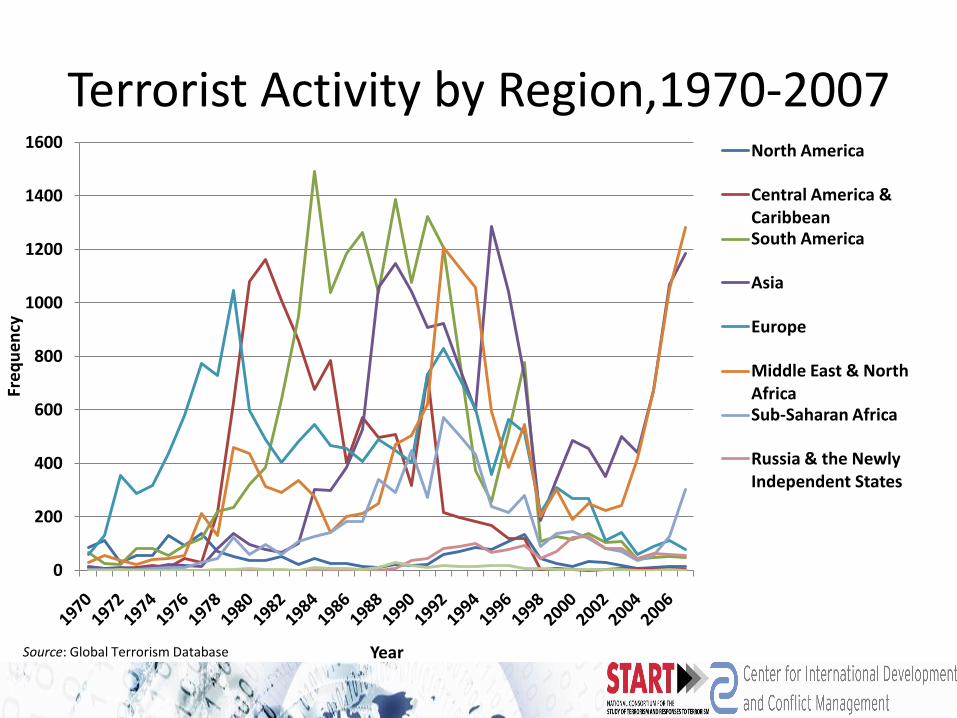
Terrorist Activity by Region,1970-2007
0
200
400
600
800
1000
1200
1400
1600
Fre
qu
en
cy
Year
North America
Central America & CaribbeanSouth America
Asia
Europe
Middle East & North AfricaSub-Saharan Africa
Russia & the Newly Independent States
Source: Global Terrorism Database
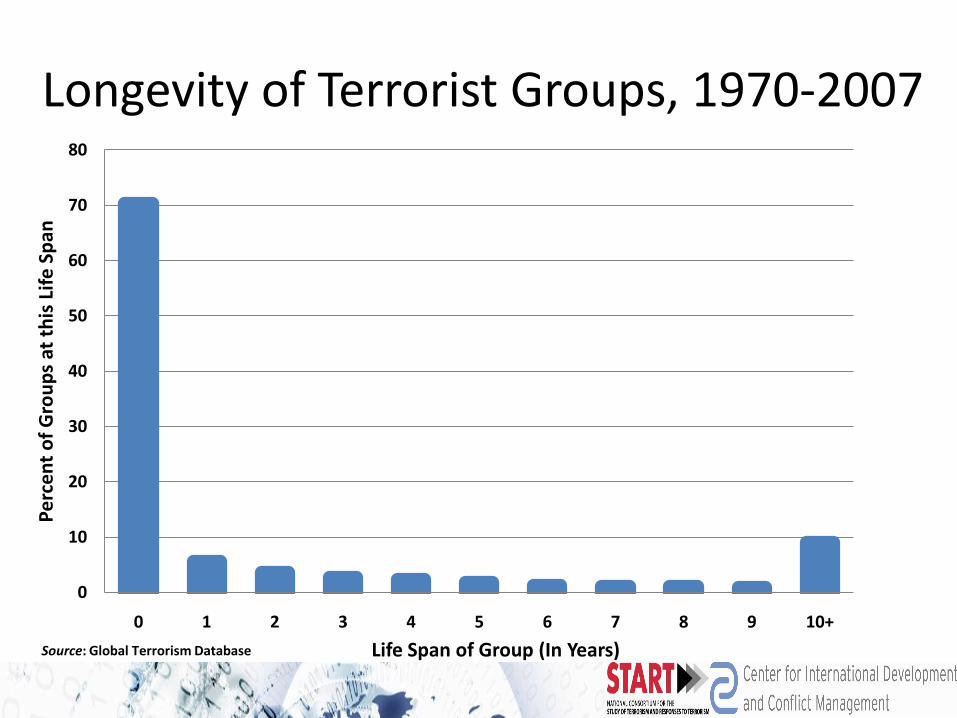
Longevity of Terrorist Groups, 1970-2007
0
10
20
30
40
50
60
70
80
0 1 2 3 4 5 6 7 8 9 10+
Pe
rce
nt
of
Gro
up
s at
th
is L
ife
Sp
an
Life Span of Group (In Years)Source: Global Terrorism Database
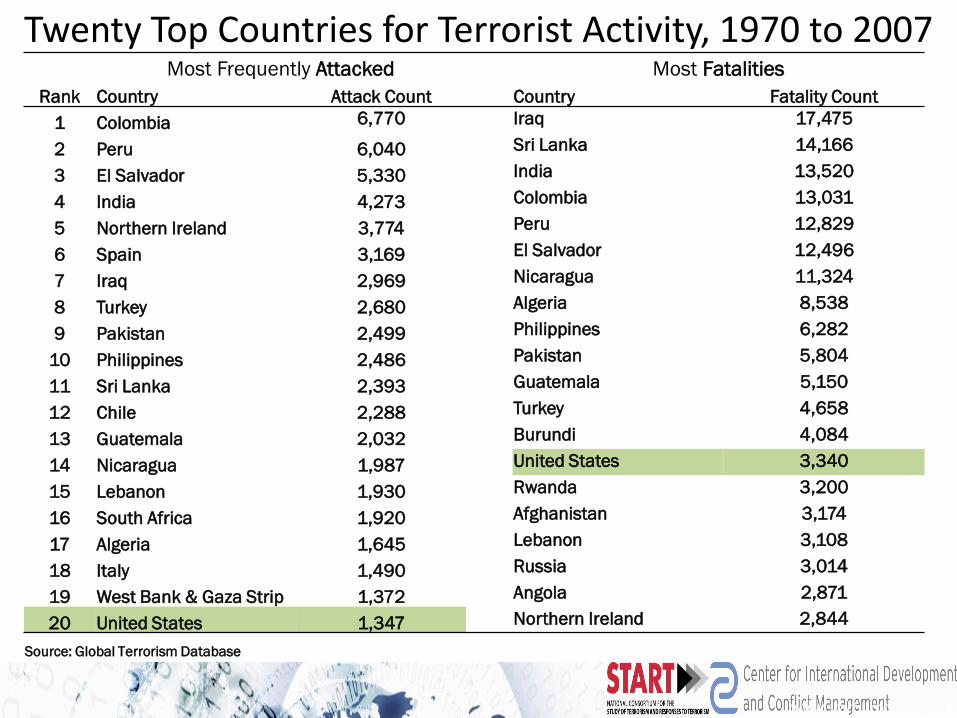
Twenty Top Countries for Terrorist Activity, 1970 to 2007Most Frequently Attacked Most Fatalities
Rank Country Attack Count Country Fatality Count
1 Colombia 6,770 Iraq 17,475
2 Peru 6,040 Sri Lanka 14,166
3 El Salvador 5,330 India 13,520
4 India 4,273 Colombia 13,031
5 Northern Ireland 3,774 Peru 12,829
6 Spain 3,169 El Salvador 12,496
7 Iraq 2,969 Nicaragua 11,324
8 Turkey 2,680 Algeria 8,538
9 Pakistan 2,499 Philippines 6,282
10 Philippines 2,486 Pakistan 5,804
11 Sri Lanka 2,393 Guatemala 5,150
12 Chile 2,288 Turkey 4,658
13 Guatemala 2,032 Burundi 4,084
14 Nicaragua 1,987 United States 3,340
15 Lebanon 1,930 Rwanda 3,200
16 South Africa 1,920 Afghanistan 3,174
17 Algeria 1,645 Lebanon 3,108
18 Italy 1,490 Russia 3,014
19 West Bank & Gaza Strip 1,372 Angola 2,871
20 United States 1,347 Northern Ireland 2,844
Source: Global Terrorism Database
www.start.umd.edu/gtd
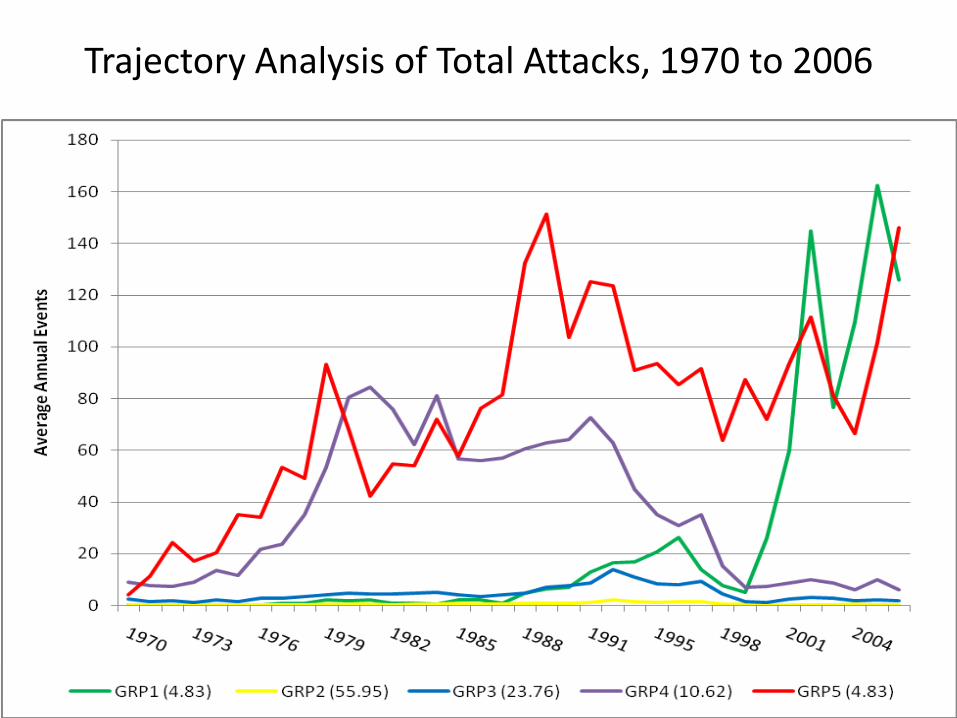
Trajectory Analysis of Total Attacks, 1970 to 2006
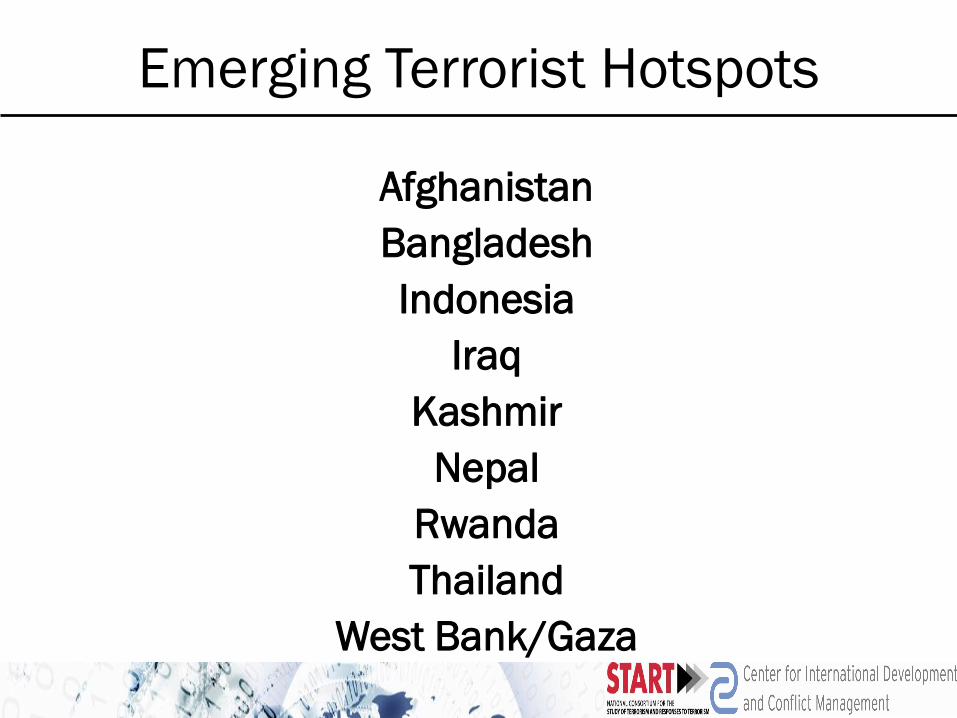
Emerging Terrorist Hotspots
Afghanistan
Bangladesh
Indonesia
Iraq
Kashmir
Nepal
Rwanda
Thailand
West Bank/Gaza
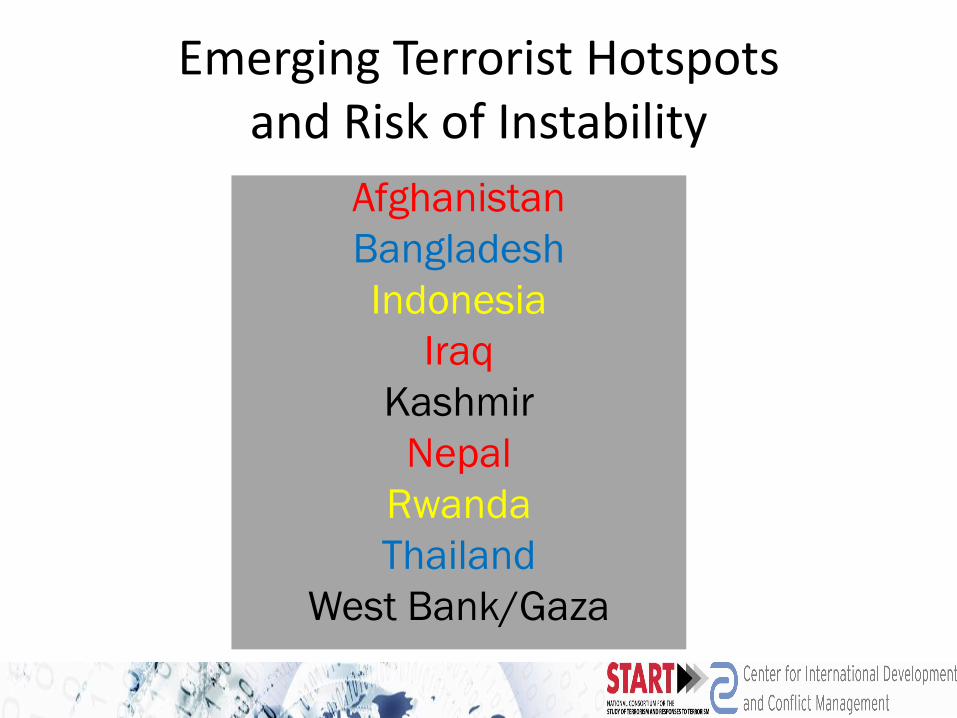
Emerging Terrorist Hotspotsand Risk of Instability
Afghanistan
Bangladesh
Indonesia
Iraq
Kashmir
Nepal
Rwanda
Thailand
West Bank/Gaza
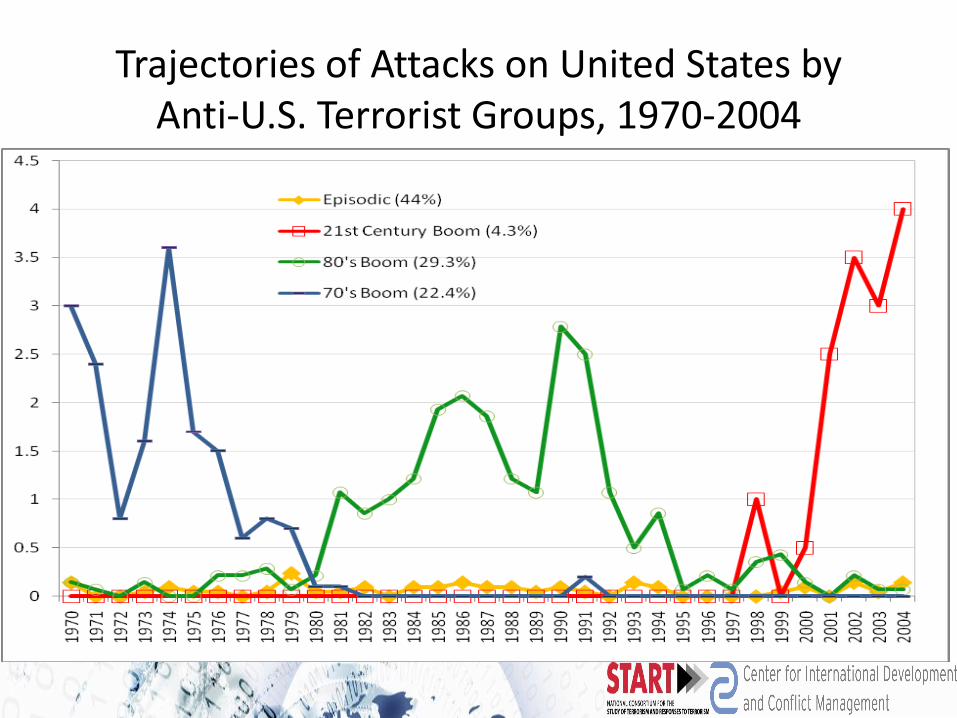
Trajectories of Attacks on United States byAnti-U.S. Terrorist Groups, 1970-2004
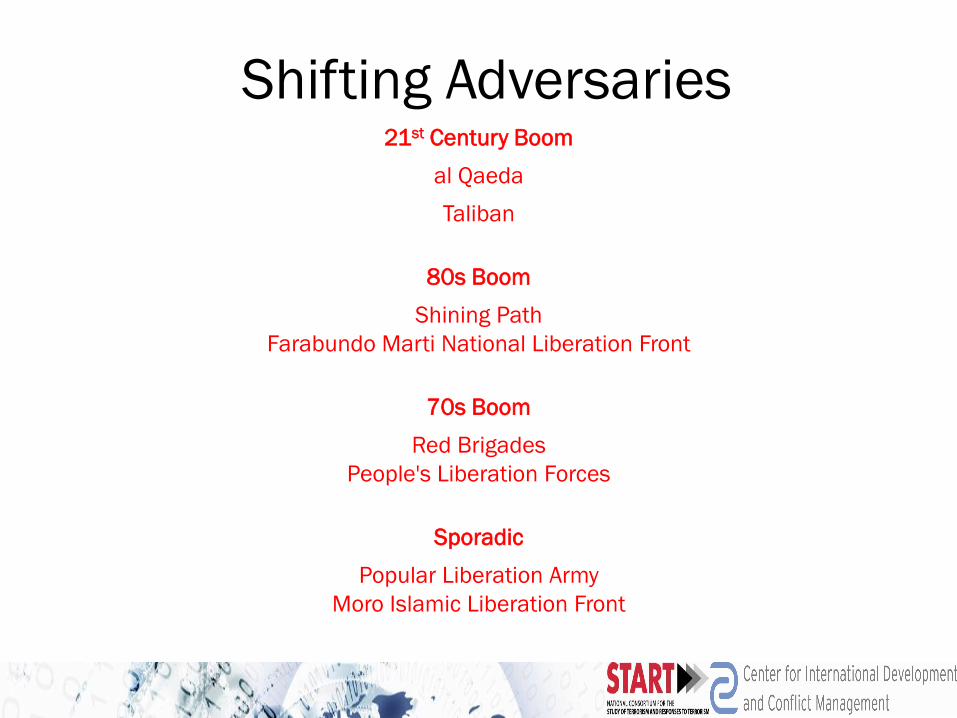
Shifting Adversaries21st Century Boom
al Qaeda
Taliban
80s Boom
Shining Path
Farabundo Marti National Liberation Front
70s Boom
Red Brigades
People's Liberation Forces
Sporadic
Popular Liberation Army
Moro Islamic Liberation Front
www.start.umd.edu/gtd

Thank You
Gary LaFree
START Director
Tel: (301) 405-6600
GTD Online at:
www.start.umd.edu
Political Organizations in the
Middle East and the Use and
Non-use of Violence
Jonathan WilkenfeldCIDCM, START
University of Maryland
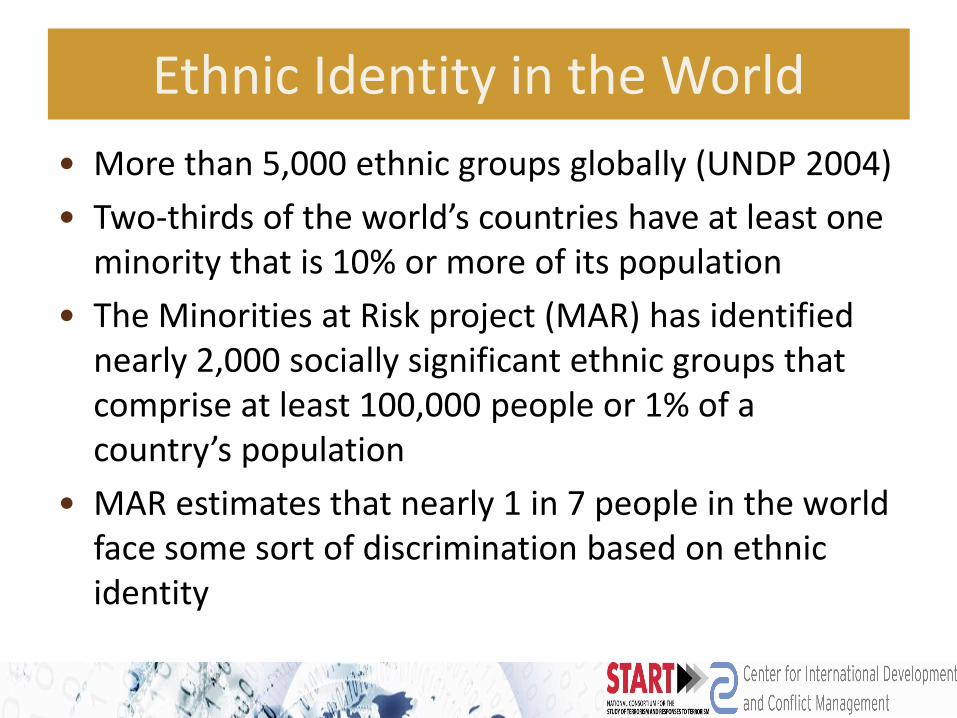
Ethnic Identity in the World
• More than 5,000 ethnic groups globally (UNDP 2004)
• Two-thirds of the world’s countries have at least one minority that is 10% or more of its population
• The Minorities at Risk project (MAR) has identified nearly 2,000 socially significant ethnic groups that comprise at least 100,000 people or 1% of a country’s population
• MAR estimates that nearly 1 in 7 people in the world face some sort of discrimination based on ethnic identity
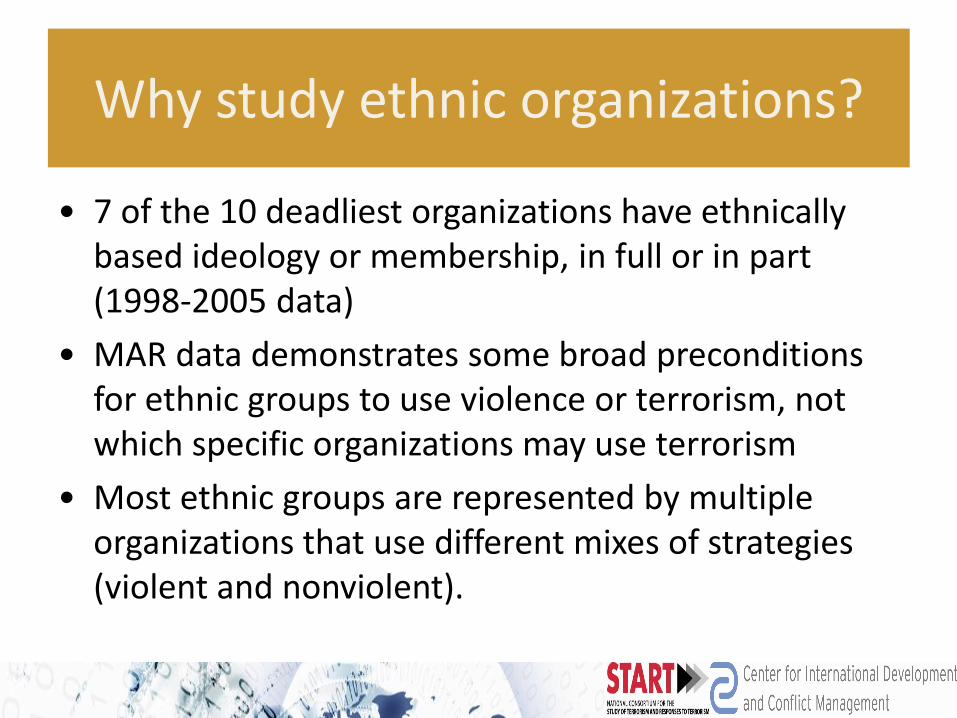
Why study ethnic organizations?
• 7 of the 10 deadliest organizations have ethnically based ideology or membership, in full or in part (1998-2005 data)
• MAR data demonstrates some broad preconditions for ethnic groups to use violence or terrorism, not which specific organizations may use terrorism
• Most ethnic groups are represented by multiple organizations that use different mixes of strategies (violent and nonviolent).
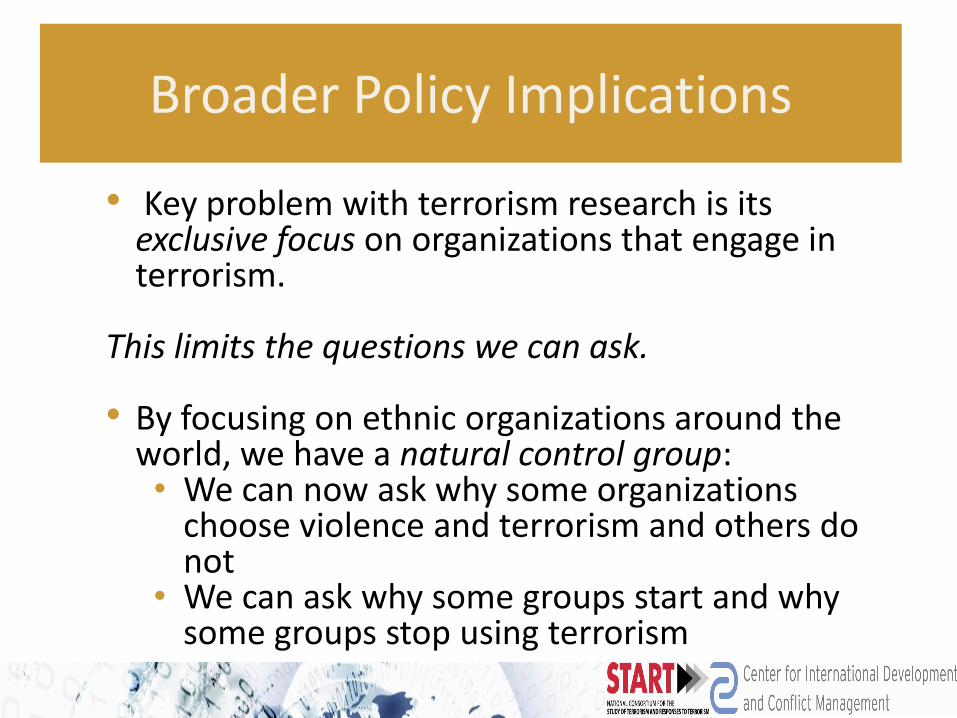
Broader Policy Implications
• Key problem with terrorism research is its exclusive focus on organizations that engage in terrorism.
This limits the questions we can ask.
• By focusing on ethnic organizations around the world, we have a natural control group:• We can now ask why some organizations
choose violence and terrorism and others do not
• We can ask why some groups start and why some groups stop using terrorism
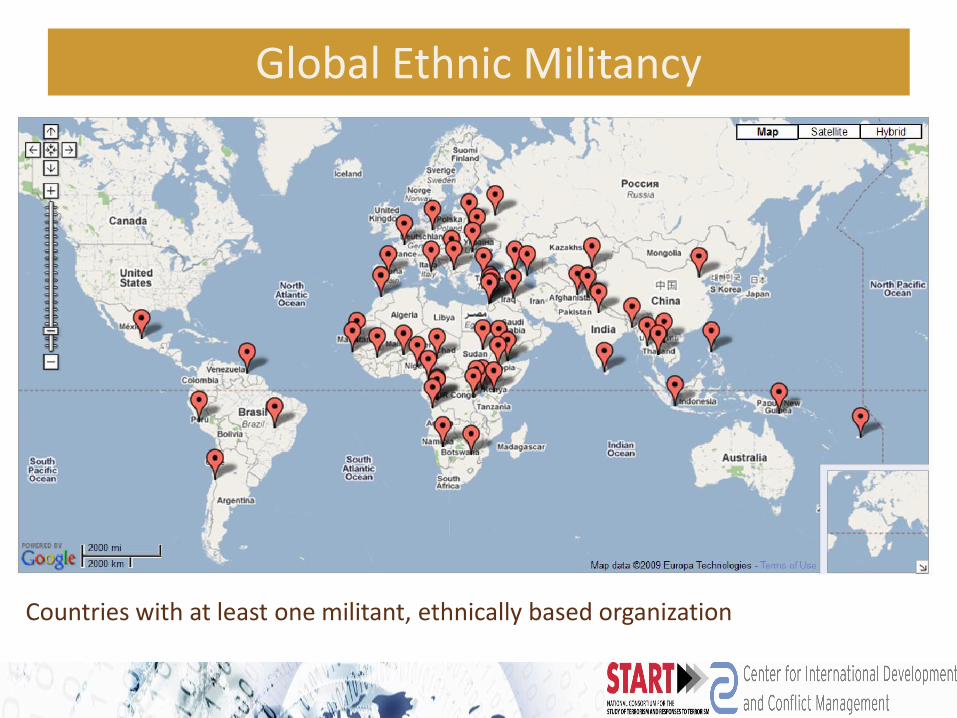
Global Ethnic Militancy
Countries with at least one militant, ethnically based organization
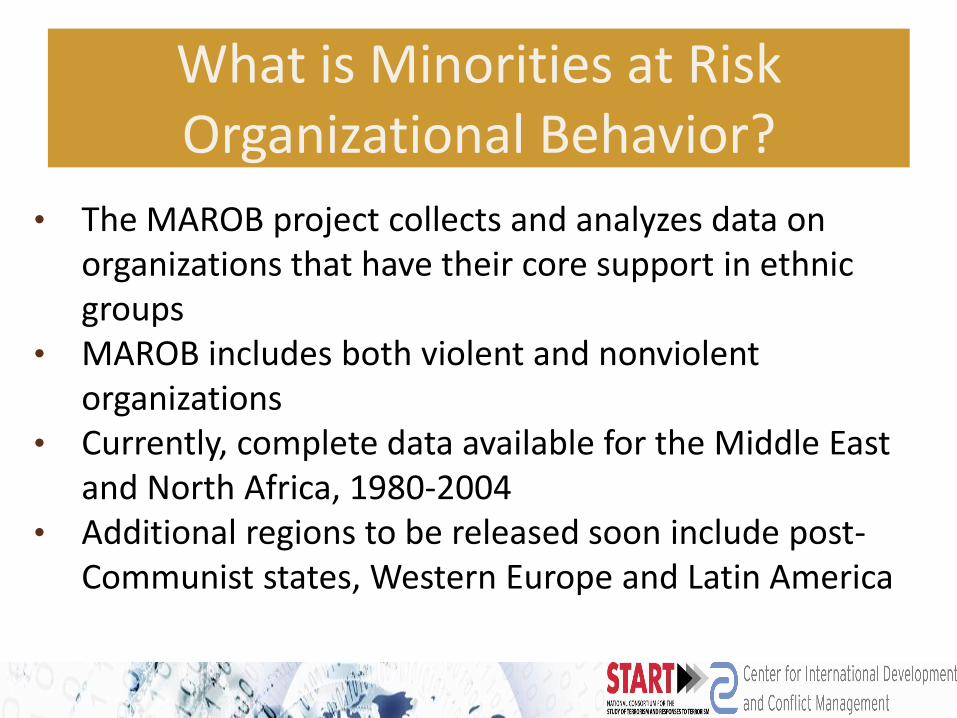
• The MAROB project collects and analyzes data on organizations that have their core support in ethnic groups
• MAROB includes both violent and nonviolent organizations
• Currently, complete data available for the Middle East and North Africa, 1980-2004
• Additional regions to be released soon include post-Communist states, Western Europe and Latin America
What is Minorities at Risk Organizational Behavior?
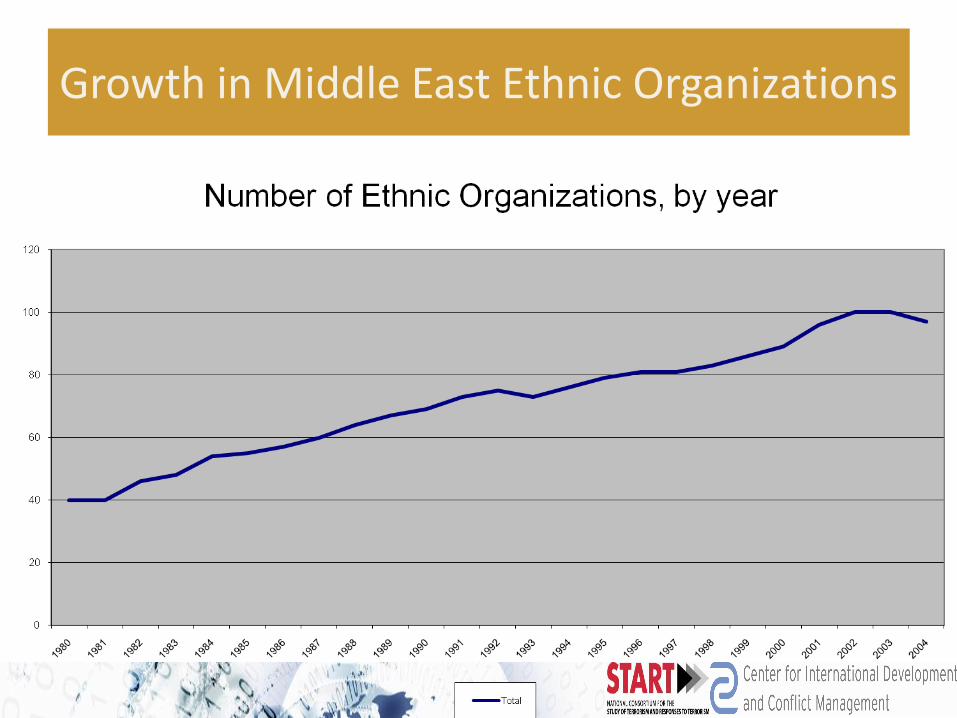
Growth in Middle East Ethnic Organizations
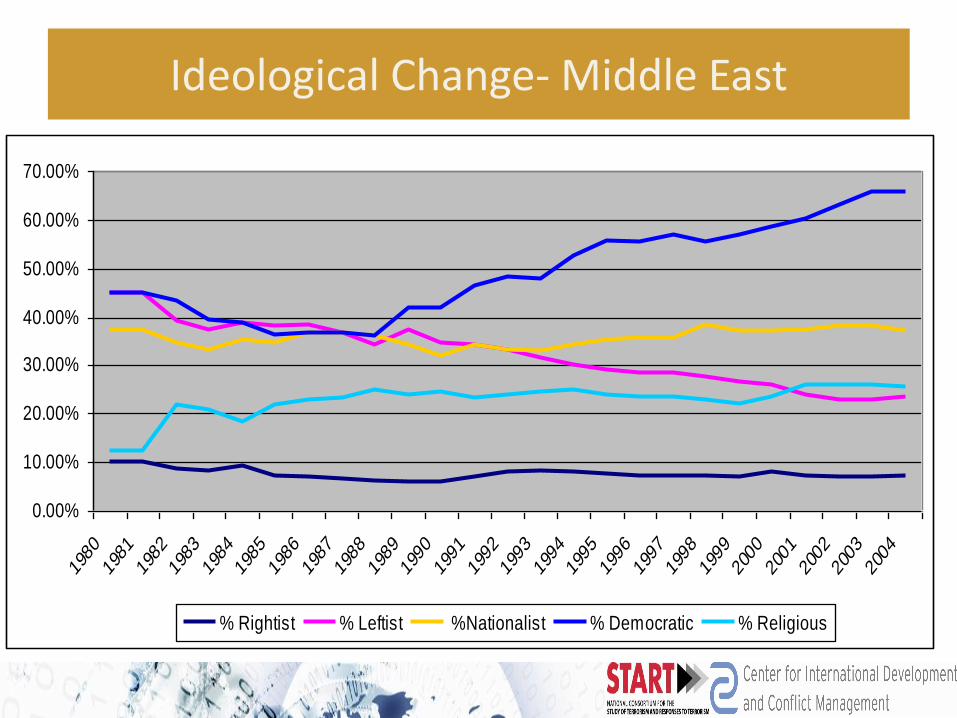
Ideological Change- Middle East
0.00%
10.00%
20.00%
30.00%
40.00%
50.00%
60.00%
70.00%
1980
1981
1982
1983
1984
1985
1986
1987
1988
1989
1990
1991
1992
1993
1994
1995
1996
1997
1998
1999
2000
2001
2002
2003
2004
% Rightist % Leftist %Nationalist % Democratic % Religious
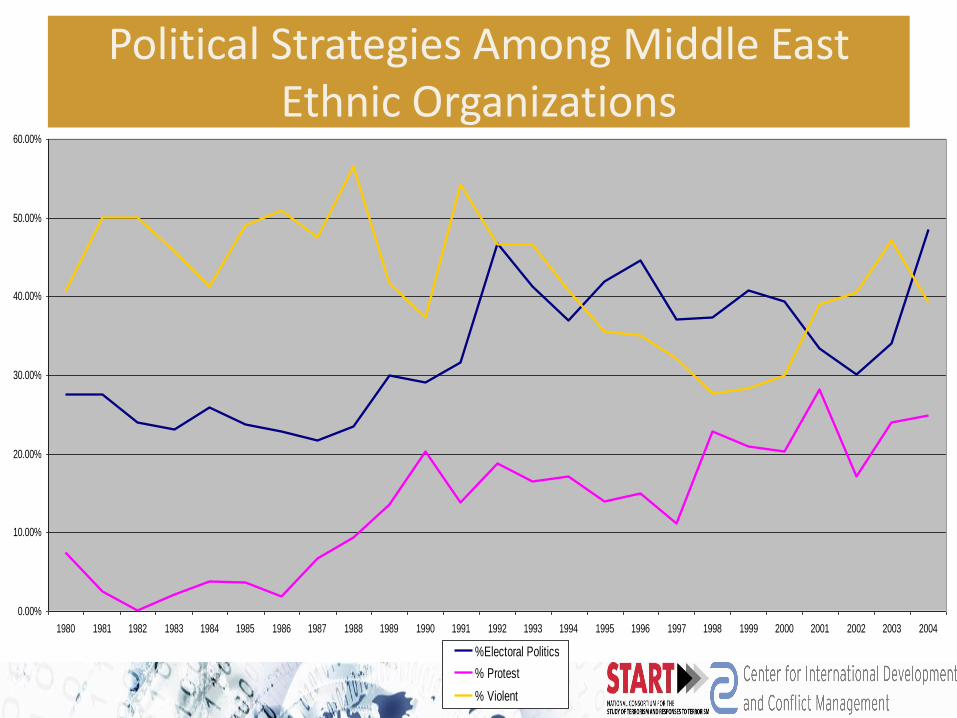
Political Strategies Among Middle East Ethnic Organizations
0.00%
10.00%
20.00%
30.00%
40.00%
50.00%
60.00%
1980 1981 1982 1983 1984 1985 1986 1987 1988 1989 1990 1991 1992 1993 1994 1995 1996 1997 1998 1999 2000 2001 2002 2003 2004
%Electoral Politics
% Protest
% Violent
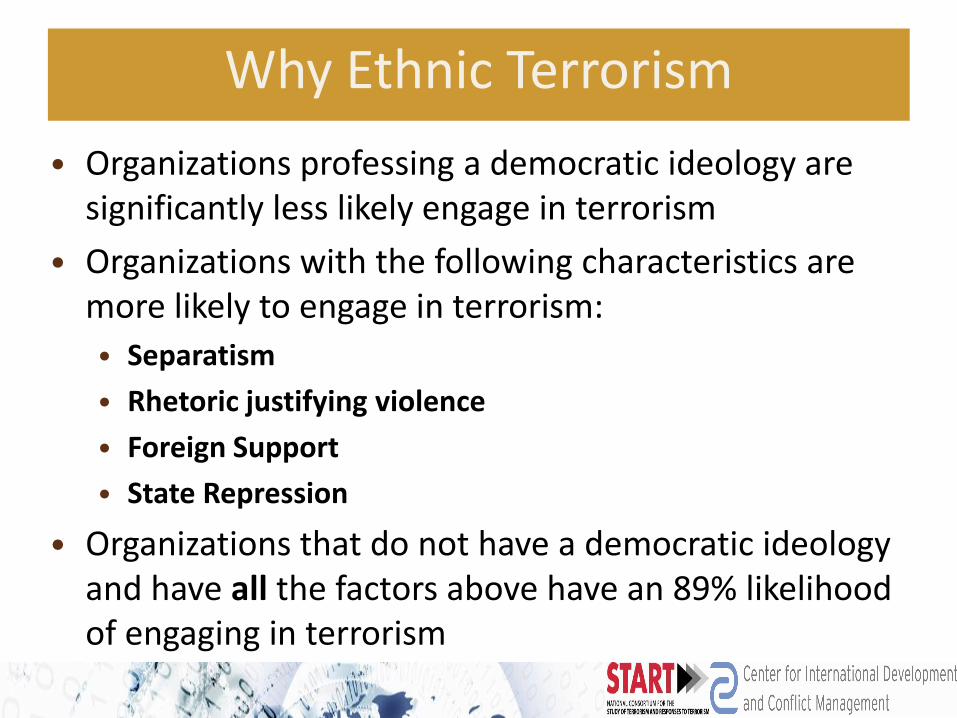
Why Ethnic Terrorism
• Organizations professing a democratic ideology are significantly less likely engage in terrorism
• Organizations with the following characteristics are more likely to engage in terrorism:
• Separatism
• Rhetoric justifying violence
• Foreign Support
• State Repression
• Organizations that do not have a democratic ideology and have all the factors above have an 89% likelihood of engaging in terrorism
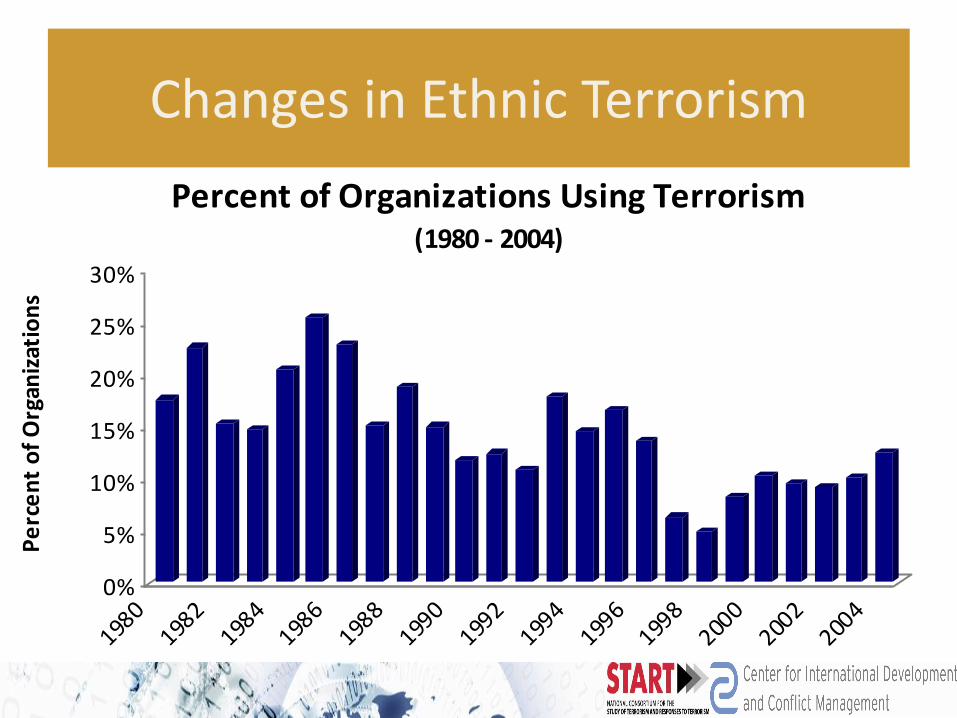
Changes in Ethnic Terrorism
0%
5%
10%
15%
20%
25%
30%
Pe
rce
nt
of
Org
aniz
atio
ns
1980
1982
1984
1986
1988
1990
1992
1994
1996
1998
2000
2002
2004
Percent of Organizations Using Terrorism(1980 - 2004)
Jonathan Wilkenfeld
Center for International Development and Conflict Management
University of [email protected]
www.cidcm.umd.edu/mar
Global Conflict & Terrorism Trends
www.start.umd.edu www.cidcm.umd.edu