Embed Size (px)
Citation preview
InfoWatch Analytical Center www.infowatch.com/analytics
© InfoWatch Analytical Center. 2016
Global Data Leakage Report, 2015
InfoWatch Analytical Center Global Data Leakage Report, 2015
2
Table of contents Table of contents ....................................................................................................... 2
In figures .................................................................................................................... 3
Summary .................................................................................................................... 4
Methodology .............................................................................................................. 5
Report findings .......................................................................................................... 6
Leak channels ......................................................................................................... 11
Industry-specific map ............................................................................................. 14
Regional specifics ................................................................................................... 19
Conclusion and findings ........................................................................................ 21
Leakage monitoring on InfoWatch's website ........................................................ 22
Glossary ................................................................................................................... 23
InfoWatch Analytical Center Global Data Leakage Report, 2015
3
In figures In 2015, InfoWatch Analytical Center registered 1,505 data leaks revealed (in the
media and other sources) worldwide, which is 7.8% more than in 2014. External attacks were behind 32% of data leaks. Share of externally pushed data
leaks added 7.2 p.p. year over year. 90.8% of data leaks exposed personal data. More than 965.9 million records have
been compromised over the reporting period. The year of 2015 has seen 21 'mega leaks', each resulted in the loss of over 10
million personal data records. The mega leaks harvested 84.3% of all the records compromised.
Inside companies, employees were responsible for 51.2% of the leaks, while executives caused 1.1% of the cases.
Transportation companies—along with online services, retailers, educational and healthcare institutions—are the biggest sources of personal data leaks.
Russia came in second in terms of the number of leaks on record. Over the reporting period, 118 confidential data leaks hit Russian companies and public agencies. If compared to 2014, the number of leaks in Russia dropped by 28.1%.
InfoWatch Analytical Center Global Data Leakage Report, 2015
4
Summary This is a report on confidential data leaks in 2015 prepared by InfoWatch Analytical Center. Data leak reports have occupied the front pages of mainstream media because attacks are widespread, compromise millions of data records and hit well-known brands. Victim list includes Anthem, Apple, AT&T, British Airways, DreamWorks, Electronic Arts, Equifax, FIA, Google, HBO, HSBC, HTC, JP Morgan Chase, Kia Motors, Lenovo, Lufthansa, Microsoft, Morgan Stanley, NVIDIA, PayPal, PwC, Samsung, Starbucks, Tele2, Toyota, Twitter, Uber, United Airlines, and Yahoo. Hackers had no mercy on government agencies, regional administrations, ministries, law enforcers, police departments (and even NSA and CIA) in a variety of countries. Such famous politicians as Hillary Clinton, Jeb Bush, and Dmitry Medvedev made the news with data leak stories. However, these celebrity incidents are just the tip of the iceberg. In 2015, the most common case was a leak caused by ordinary staff, either deliberately or negligently. Here is a typical data leak in 2015:
The Washington Post: Three women employed with the U.S. Department of State were indicted in Houston for an alleged identity theft scheme using personal information. Since 2010, the defendants used the stolen names, addresses and Social Security numbers from people’s passports to create fake documents and used those identities to borrow money to purchase electronics, including iPhones and iPads.
Another common scenario is an external attack aimed at stealing aggregated personal data:
securitylab.ru: Unknown intruders hacked into the network of insurer Excellus BlueCross BlueShield and obtained access to personal data of its customers, with over 10M people's personal records exposed. Social security numbers, payment data, addresses, birth dates of the Excellus customers came to the hackers' hands. The company stated that it was a nearly 2-year old intrusion campaign.
Data leak analysis drifts away from investigating particular incidents towards Big Data based studying of regularities. The most important points are: what data channel is currently the most vulnerable and why; what industry is the most attractable for hackers; and whether external attack or evil-minded insider is more dangerous. The purpose of the report is to have all these and many other questions answered. The authors have no doubts that the results will be of interest to information and economic security practitioners, journalists, business owners, and executives who operate restricted information (trade, bank, and tax secrets) and other valuable information assets.
InfoWatch Analytical Center Global Data Leakage Report, 2015
5
Methodology The report is powered by the InfoWatch Analytical Center's own database updated and managed by its experts since 2004. The database aggregates publicly available cases1 of data leaks,2 which hit commercial and non-commercial (public, municipal) organizations and resulted from malicious or negligent actions3 by employees or other parties4. The InfoWatch leak database consists of several thousand registered incidents. Where possible, each leak being logged into the database (if such information is available in the leak report) is classified according to several criteria such as organization size5, field of activity (industry), size of damage6, leak type (by intent), leak channel7, types of leaked data, etc. Until recently, data leaks caused from the outside (targeted attack, phishing, web resource hacking, etc.) were not on our radar. Since 2014, such data leaks have also been added to the database, along with internally pushed data leaks. The leak criteria list now includes an attack vector8. Moreover, since 2014 incidents have been classified by nature of intruder's actions. The report also covers cases when either authorized officers tamper with payment details and nonpublic information, or employees abuse their access rights to get data they do not need for the job. The research covers a maximum of 1%9 of all assumed leaks. However, InfoWatch selected leak classification criteria in such a way that each category could contain sufficient or excessive number of elements (actual data leaks). This approach to survey fielding allows having theoretical sample, with the findings and trends identified in the sample being feasible for the entire assembly. The report authors deliberately excluded both inadequately large data leaks (over 10 million personal data records) and inadequately small ones (less than 100 records) from the Industry Map and its diagrams, in order to avoid any misrepresentations. The use of a limited sample for diagrams in the above section is expressly specified.
1 Data leak cases reported by public agencies, mass media, bloggers or found in Internet forums and other open sources. 2 Information (data) leak means an act or omission committed by a person, who has authorized access to confidential information, and
leading to the loss of control over such information or confidentiality breach due to either inside or external attack. 3 Data leaks are divided into intentional (malicious) and unintentional (accidental) depending on whether or not a guilty party intends to
cause a data leak (see the Glossary). The terms "intentional" and "malicious" ("unintentional" and "accidental") are equal and used as synonyms herein.
4 In this report, the authors provide leak breakdown by offenders. Along with malicious insiders, the classification includes external intruders.
5 InfoWatch Analytical Center ranks companies by size based on the known or estimated number of personal computers (PCs) installed: small companies with up to 50 PCs; medium-size, with 50 to 500 PCs; and large, with over 500 PCs.
6 Damage size and number of records compromised are taken directly from mass media publications. 7 In the report, leak channel is a certain scenario when acts (omissions) by a corporate information system user towards hardware or
software services result in the loss of control over such information or confidentiality breach. Leak channel classification is given in the glossary. Leak channels are determined only for the leaks caused by acts/omissions of internal offenders.
8 Attack vector means a signature of intruder's actions behind data leakage, including intruder's attacks on company's web resources and information infrastructure from the outside and insider's unauthorized access to classified resources and confidential information misuse, etc.
9 The share of data leaks identified in Russia in the total number of leaks occurred in the country will more likely be much (enormously) less than 1%.
InfoWatch Analytical Center Global Data Leakage Report, 2015
6
In addition, the sampling did not include confidentiality breach (identified vulnerabilities), other information security incidents (such as DDoS attacks) that did not result in data leaks, or leaks from an unclear data source (where the compromised data owner cannot be identified). The authors did not have a goal of either finding the total number of data leaks, or estimating actual or potential damage. The report is focused on identifying trends and pace in the global, industry-specific, and regional data leakage maps.
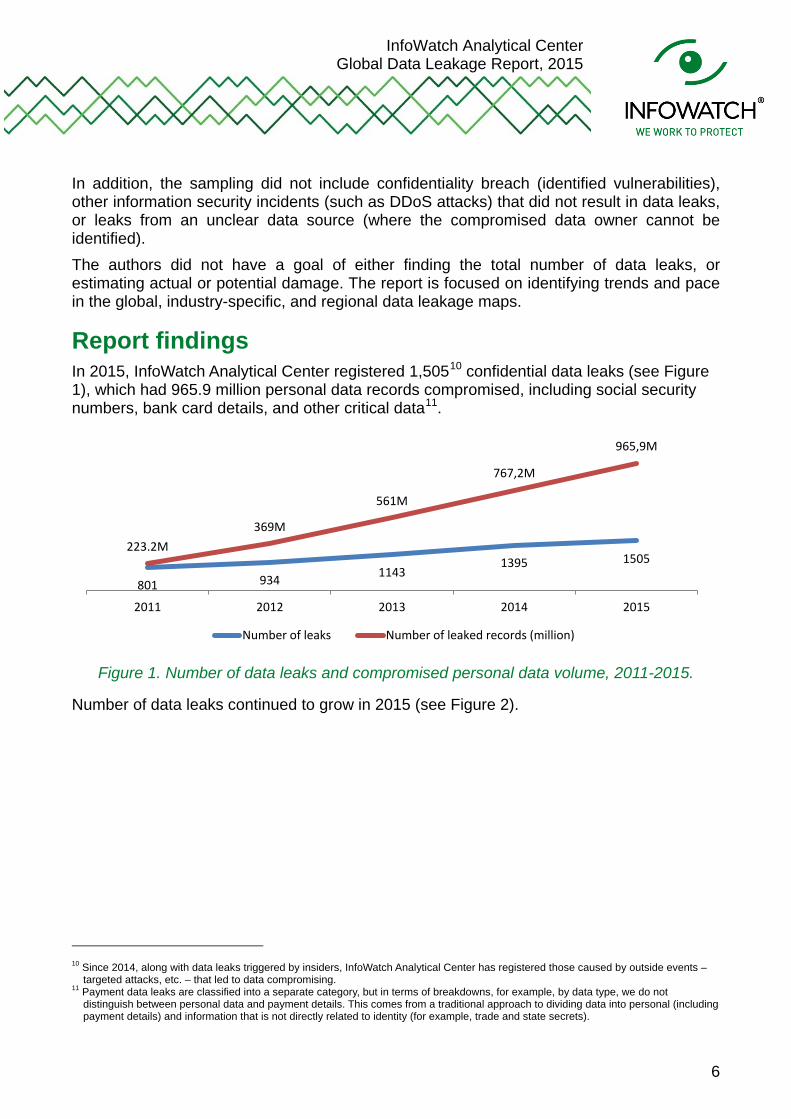
Report findings In 2015, InfoWatch Analytical Center registered 1,50510 confidential data leaks (see Figure 1), which had 965.9 million personal data records compromised, including social security numbers, bank card details, and other critical data11.
Figure 1. Number of data leaks and compromised personal data volume, 2011-2015.
Number of data leaks continued to grow in 2015 (see Figure 2).
10 Since 2014, along with data leaks triggered by insiders, InfoWatch Analytical Center has registered those caused by outside events –
targeted attacks, etc. – that led to data compromising. 11 Payment data leaks are classified into a separate category, but in terms of breakdowns, for example, by data type, we do not
distinguish between personal data and payment details. This comes from a traditional approach to dividing data into personal (including payment details) and information that is not directly related to identity (for example, trade and state secrets).
801 934 1143 1395 1505
223.2M 369M
561M
767,2M
965,9M
2011 2012 2013 2014 2015
Number of leaks Number of leaked records (million)

InfoWatch Analytical Center Global Data Leakage Report, 2015
7
Figure 2. Number of registered data leaks, 2006-2015.
However, the number of leaks grows slower. In 2015, the growth rate stagnated around 7.8% year over year, instead of a 22% increase a year earlier. The growth in compromised data volumes slowed down to 25.9% YoY (see Figure 3).
Figure 3. Growth rates for number of leaks and compromised personal data volumes.
Records of compromised personal data per leak, 2011-2015.
The average number of personal data records compromised per leak is 640,000 — a 16% increase, as compared to 2014.
2006 2007 2008 2009 2010 2011 2012 2013 2014 2015 Number of leaks 198 333 530 747 794 801 934 1143 1395 1505
0 200 400 600 800
1000 1200 1400 1600
16,60% 22,38% 22,05%
7,89%
65,34%
52,03%
36,75%
25,91%
2011 2012 2013 2014 2015
Growth rates. Number of leaks
Growth rates. Volume of data records
0.28M
0.40M
0.49M 0.55M
0.64M
2011 2012 2013 2014 2015
Records per leak
InfoWatch Analytical Center Global Data Leakage Report, 2015
8
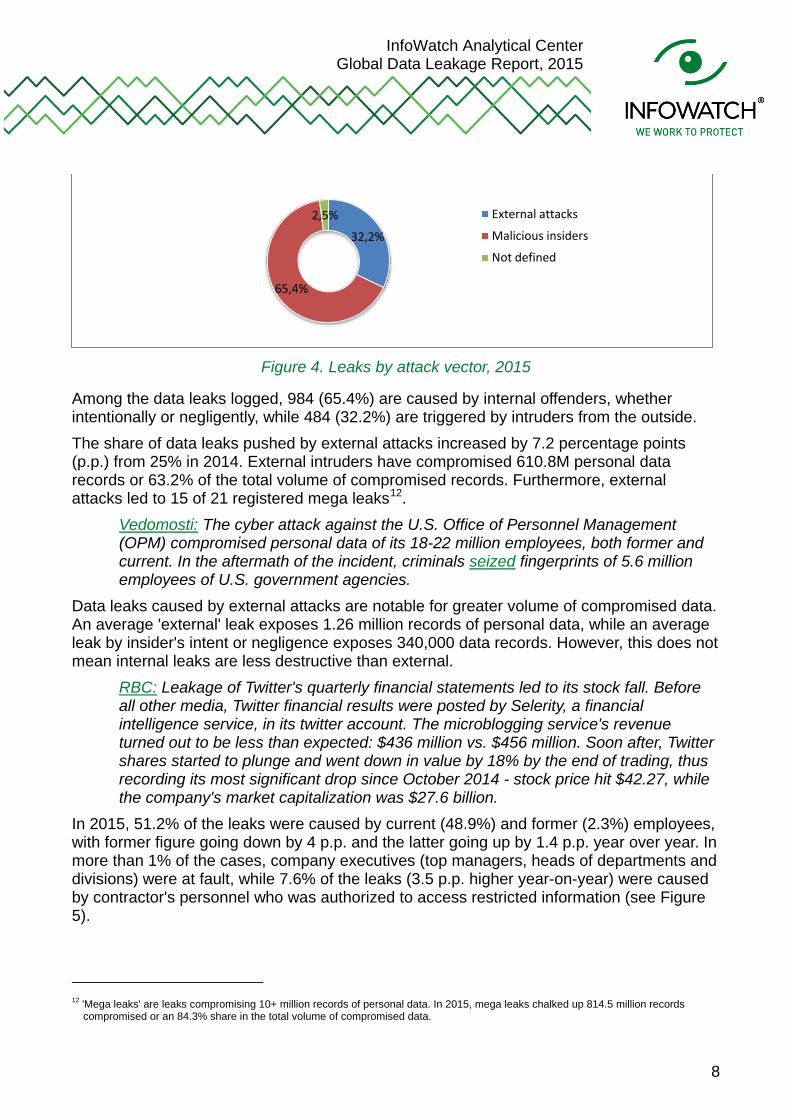
Figure 4. Leaks by attack vector, 2015
Among the data leaks logged, 984 (65.4%) are caused by internal offenders, whether intentionally or negligently, while 484 (32.2%) are triggered by intruders from the outside. The share of data leaks pushed by external attacks increased by 7.2 percentage points (p.p.) from 25% in 2014. External intruders have compromised 610.8M personal data records or 63.2% of the total volume of compromised records. Furthermore, external attacks led to 15 of 21 registered mega leaks12.
Vedomosti: The cyber attack against the U.S. Office of Personnel Management (OPM) compromised personal data of its 18-22 million employees, both former and current. In the aftermath of the incident, criminals seized fingerprints of 5.6 million employees of U.S. government agencies.
Data leaks caused by external attacks are notable for greater volume of compromised data. An average 'external' leak exposes 1.26 million records of personal data, while an average leak by insider's intent or negligence exposes 340,000 data records. However, this does not mean internal leaks are less destructive than external.
RBC: Leakage of Twitter's quarterly financial statements led to its stock fall. Before all other media, Twitter financial results were posted by Selerity, a financial intelligence service, in its twitter account. The microblogging service's revenue turned out to be less than expected: $436 million vs. $456 million. Soon after, Twitter shares started to plunge and went down in value by 18% by the end of trading, thus recording its most significant drop since October 2014 - stock price hit $42.27, while the company's market capitalization was $27.6 billion.
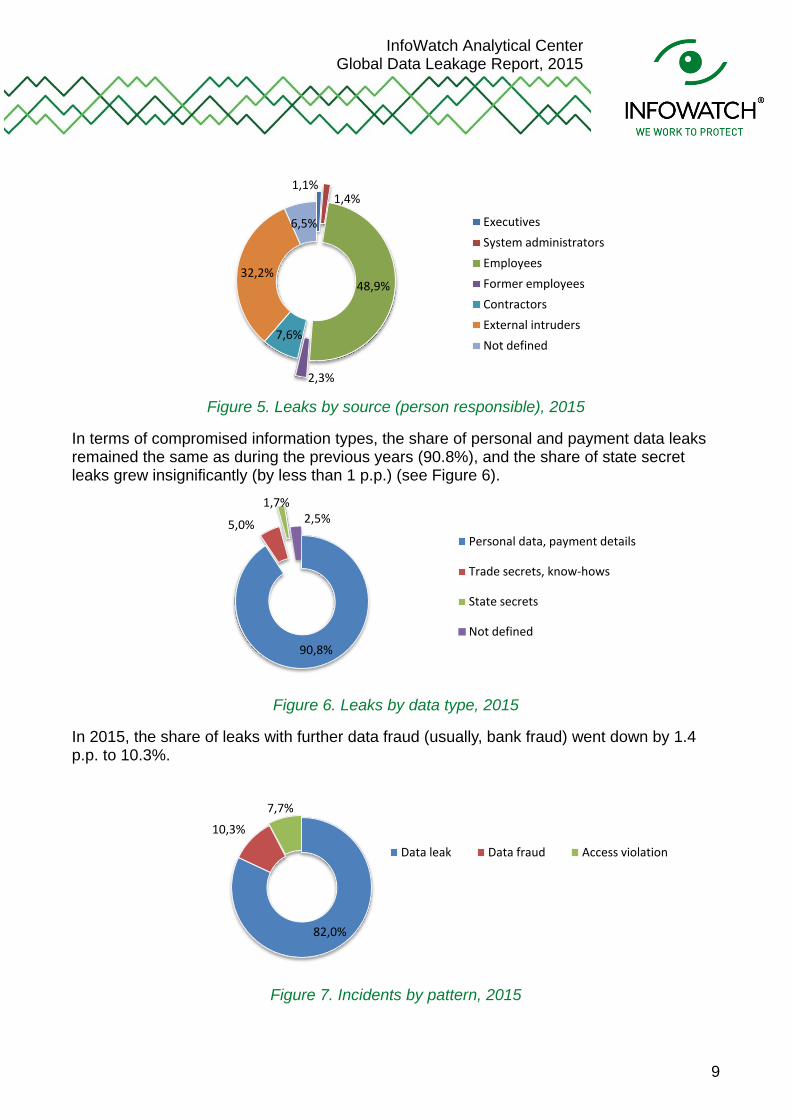
In 2015, 51.2% of the leaks were caused by current (48.9%) and former (2.3%) employees, with former figure going down by 4 p.p. and the latter going up by 1.4 p.p. year over year. In more than 1% of the cases, company executives (top managers, heads of departments and divisions) were at fault, while 7.6% of the leaks (3.5 p.p. higher year-on-year) were caused by contractor's personnel who was authorized to access restricted information (see Figure 5).
12 'Mega leaks' are leaks compromising 10+ million records of personal data. In 2015, mega leaks chalked up 814.5 million records
compromised or an 84.3% share in the total volume of compromised data.
32,2%
65,4%
2,5% External attacks
Malicious insiders
Not defined
InfoWatch Analytical Center Global Data Leakage Report, 2015
9
Figure 5. Leaks by source (person responsible), 2015
In terms of compromised information types, the share of personal and payment data leaks remained the same as during the previous years (90.8%), and the share of state secret leaks grew insignificantly (by less than 1 p.p.) (see Figure 6).
Figure 6. Leaks by data type, 2015
In 2015, the share of leaks with further data fraud (usually, bank fraud) went down by 1.4 p.p. to 10.3%.
Figure 7. Incidents by pattern, 2015
1,1% 1,4%
48,9%
2,3%
7,6%
32,2%
6,5% Executives System administrators Employees Former employees Contractors External intruders Not defined
90,8%
5,0%
1,7% 2,5%
Personal data, payment details
Trade secrets, know-hows
State secrets
Not defined
82,0%
10,3%
7,7%
Data leak Data fraud Access violation

InfoWatch Analytical Center Global Data Leakage Report, 2015
10
The authors classify 7.7% of the incidents as violations associated with unauthorized access to information (access rights abuse, manipulation of data personnel does not need for the job).
Conclusion: The primary trend in the global sample is the growing share of data leaks triggered by external intruders. Almost 2/3 of the total volume of personal data compromised in 2015 leaked after external attacks. The most notorious incidents of 2015 were associated with illegal actions of hackers, intrusion into companies' infrastructure, and stealing aggregated data about employees and clients.
InfoWatch Analytical Center Global Data Leakage Report, 2015
11
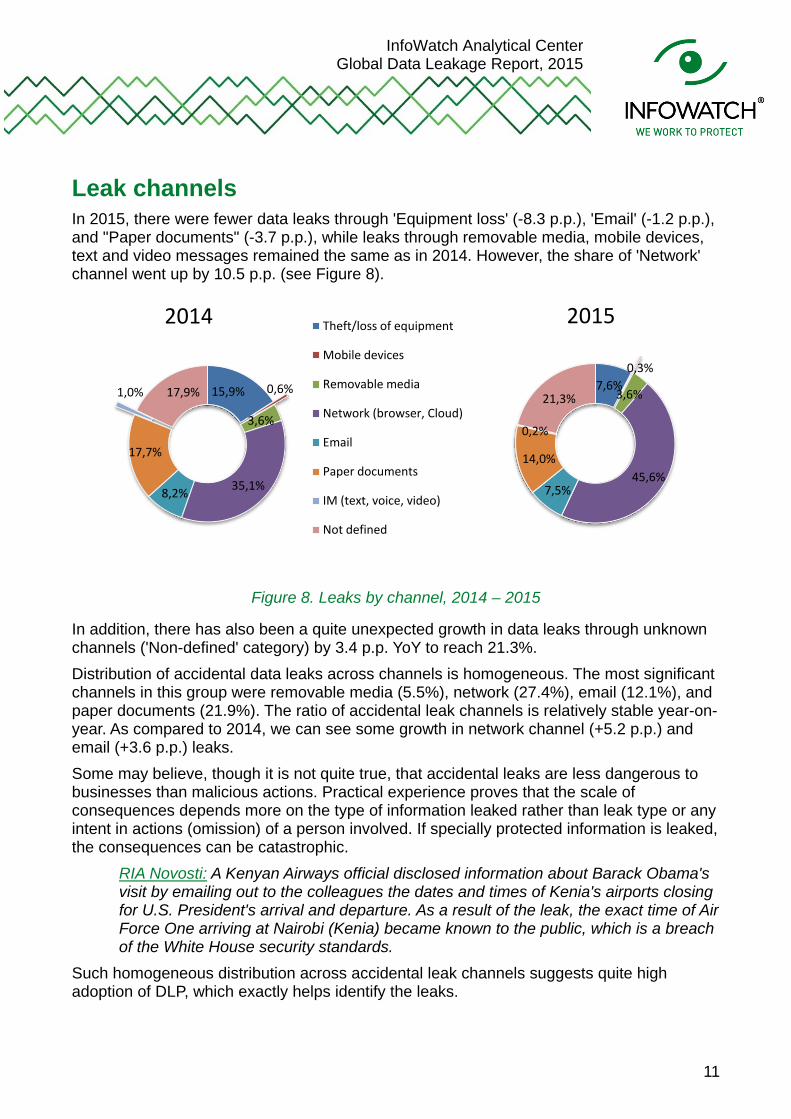
Leak channels In 2015, there were fewer data leaks through 'Equipment loss' (-8.3 p.p.), 'Email' (-1.2 p.p.), and "Paper documents" (-3.7 p.p.), while leaks through removable media, mobile devices, text and video messages remained the same as in 2014. However, the share of 'Network' channel went up by 10.5 p.p. (see Figure 8).
Figure 8. Leaks by channel, 2014 – 2015
In addition, there has also been a quite unexpected growth in data leaks through unknown channels ('Non-defined' category) by 3.4 p.p. YoY to reach 21.3%. Distribution of accidental data leaks across channels is homogeneous. The most significant channels in this group were removable media (5.5%), network (27.4%), email (12.1%), and paper documents (21.9%). The ratio of accidental leak channels is relatively stable year-on-year. As compared to 2014, we can see some growth in network channel (+5.2 p.p.) and email (+3.6 p.p.) leaks. Some may believe, though it is not quite true, that accidental leaks are less dangerous to businesses than malicious actions. Practical experience proves that the scale of consequences depends more on the type of information leaked rather than leak type or any intent in actions (omission) of a person involved. If specially protected information is leaked, the consequences can be catastrophic.
RIA Novosti: A Kenyan Airways official disclosed information about Barack Obama's visit by emailing out to the colleagues the dates and times of Kenia's airports closing for U.S. President's arrival and departure. As a result of the leak, the exact time of Air Force One arriving at Nairobi (Kenia) became known to the public, which is a breach of the White House security standards.
Such homogeneous distribution across accidental leak channels suggests quite high adoption of DLP, which exactly helps identify the leaks.
15,9% 0,6%
3,6%
35,1% 8,2%
17,7%
1,0% 17,9%
2014 Theft/loss of equipment
Mobile devices
Removable media
Network (browser, Cloud)
Paper documents
IM (text, voice, video)
Not defined
7,6% 0,3%
3,6%
45,6% 7,5%
14,0%
0,2%
21,3%
2015
InfoWatch Analytical Center Global Data Leakage Report, 2015
12
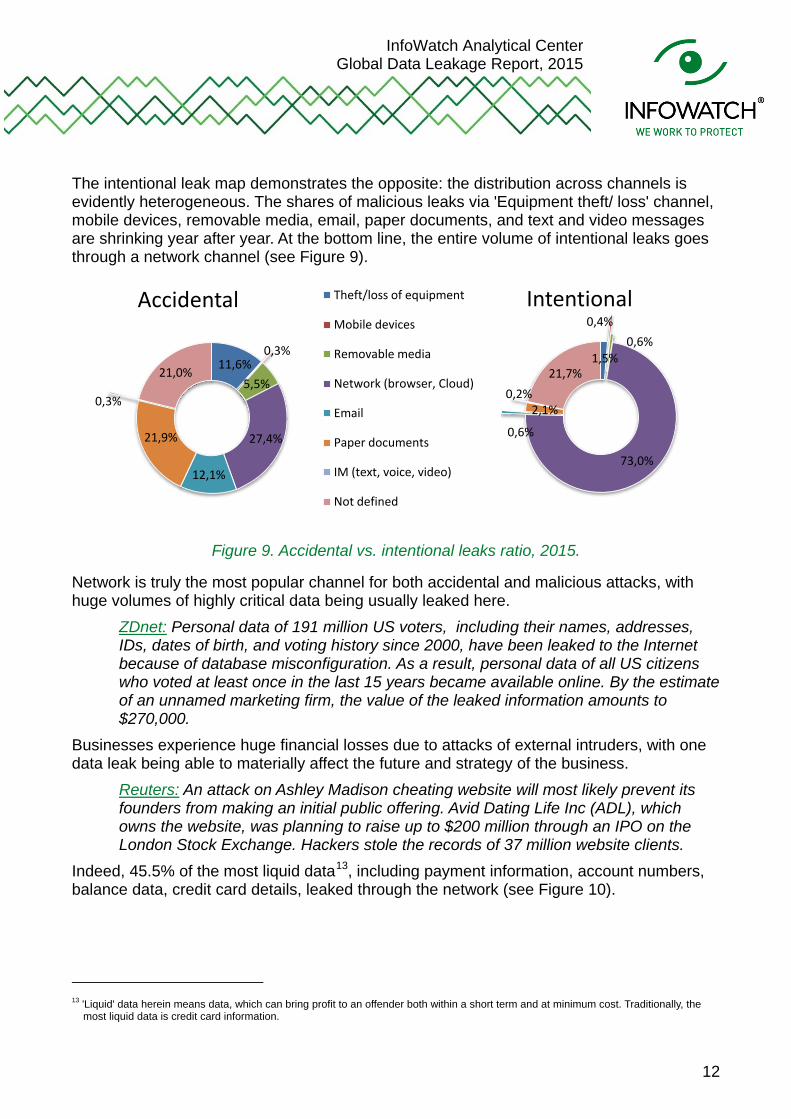
The intentional leak map demonstrates the opposite: the distribution across channels is evidently heterogeneous. The shares of malicious leaks via 'Equipment theft/ loss' channel, mobile devices, removable media, email, paper documents, and text and video messages are shrinking year after year. At the bottom line, the entire volume of intentional leaks goes through a network channel (see Figure 9).
Figure 9. Accidental vs. intentional leaks ratio, 2015.
Network is truly the most popular channel for both accidental and malicious attacks, with huge volumes of highly critical data being usually leaked here.
ZDnet: Personal data of 191 million US voters, including their names, addresses, IDs, dates of birth, and voting history since 2000, have been leaked to the Internet because of database misconfiguration. As a result, personal data of all US citizens who voted at least once in the last 15 years became available online. By the estimate of an unnamed marketing firm, the value of the leaked information amounts to $270,000.
Businesses experience huge financial losses due to attacks of external intruders, with one data leak being able to materially affect the future and strategy of the business.
Reuters: An attack on Ashley Madison cheating website will most likely prevent its founders from making an initial public offering. Avid Dating Life Inc (ADL), which owns the website, was planning to raise up to $200 million through an IPO on the London Stock Exchange. Hackers stole the records of 37 million website clients.
Indeed, 45.5% of the most liquid data13, including payment information, account numbers, balance data, credit card details, leaked through the network (see Figure 10).
13 'Liquid' data herein means data, which can bring profit to an offender both within a short term and at minimum cost. Traditionally, the
most liquid data is credit card information.
11,6% 0,3%
5,5%
27,4%
12,1%
21,9%
0,3%
21,0%
Accidental Theft/loss of equipment
Mobile devices
Removable media
Network (browser, Cloud)
Paper documents
IM (text, voice, video)
Not defined
1,5%
0,4% 0,6%
73,0%
0,6%
2,1% 0,2%
21,7%
Intentional

InfoWatch Analytical Center Global Data Leakage Report, 2015
13
Figure 10. Payment data leaks by channel, 2015
Offenders use mobile devices, removable media, e-mail, and paper documents to obtain data less and less. Technically savvy intruders know that the cutting-edge control tools can intercept the transfer of confidential information through the above channels, and so they don't risk being caught.
Conclusion: The fact that the Internet is now a main channel for accidental and intentional leaks shows its growing importance for business. An abundance of web-based communication services and annually increasing number of human errors expand a share of accidental leaks when distributing, posting data over the Internet, etc. On the other hand, offenders less often use knowingly controlled data transfer channels, such as e-mail and instant messengers. Indeed, the network is the only malicious insiders' channel, which is somehow controlled.
7,57% 3,56%
45,57%
7,49% 14,00%
21,27%
0
0,2
0,4
0,6
InfoWatch Analytical Center Global Data Leakage Report, 2015
14
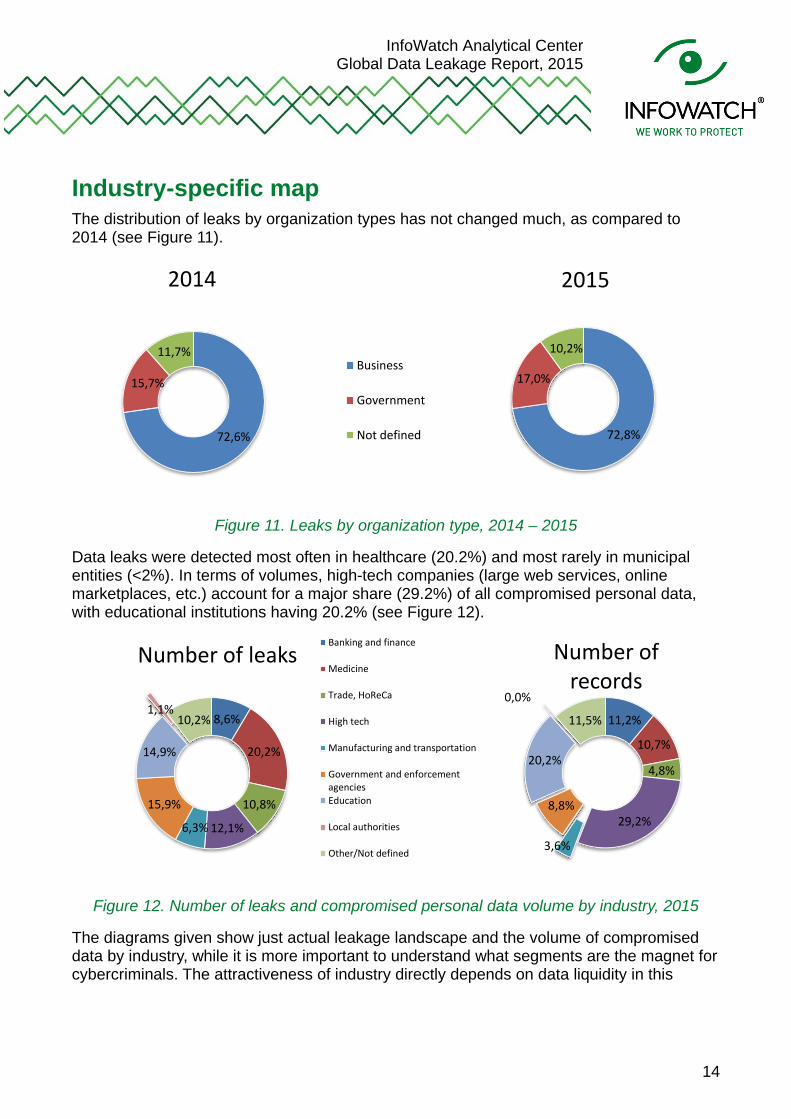
Industry-specific map The distribution of leaks by organization types has not changed much, as compared to 2014 (see Figure 11).
Figure 11. Leaks by organization type, 2014 – 2015
Data leaks were detected most often in healthcare (20.2%) and most rarely in municipal entities (<2%). In terms of volumes, high-tech companies (large web services, online marketplaces, etc.) account for a major share (29.2%) of all compromised personal data, with educational institutions having 20.2% (see Figure 12).
Figure 12. Number of leaks and compromised personal data volume by industry, 2015
The diagrams given show just actual leakage landscape and the volume of compromised data by industry, while it is more important to understand what segments are the magnet for cybercriminals. The attractiveness of industry directly depends on data liquidity in this
72,6%
15,7%
11,7%
2014
Business
Government
Not defined 72,8%
17,0%
10,2%
2015
8,6%
20,2%
10,8%
12,1% 6,3%
15,9%
14,9%
1,1% 10,2%
Number of leaks Banking and finance
Medicine
Trade, HoReCa
High tech
Manufacturing and transportation
Government and enforcement agencies Education
Local authorities
Other/Not defined
11,2%
10,7%
4,8%
29,2%
3,6%
8,8%
20,2%
0,0%
11,5%
Number of records
InfoWatch Analytical Center Global Data Leakage Report, 2015
15
segment14. Industry may be less attractive if hackers believe its data protection is sophisticated enough. Industry attractiveness is expressed in the number of registered malicious data leaks. Indeed, the more 'liquid' and unprotected the data looks, the more often hackers are ready to attack the industry. To put it simply, here is a formula:
𝐷𝑎𝑡𝑎 𝑙𝑖𝑞𝑢𝑖𝑑𝑖𝑡𝑦𝐷𝑎𝑡𝑎 𝑠𝑒𝑐𝑢𝑟𝑖𝑡𝑦 𝑒𝑥𝑝𝑒𝑐𝑡𝑎𝑡𝑖𝑜𝑛𝑠
→ 𝑁𝑢𝑚𝑏𝑒𝑟 𝑜𝑓 𝑖𝑛𝑡𝑒𝑛𝑡𝑖𝑜𝑛𝑎𝑙 𝑙𝑒𝑎𝑘𝑠
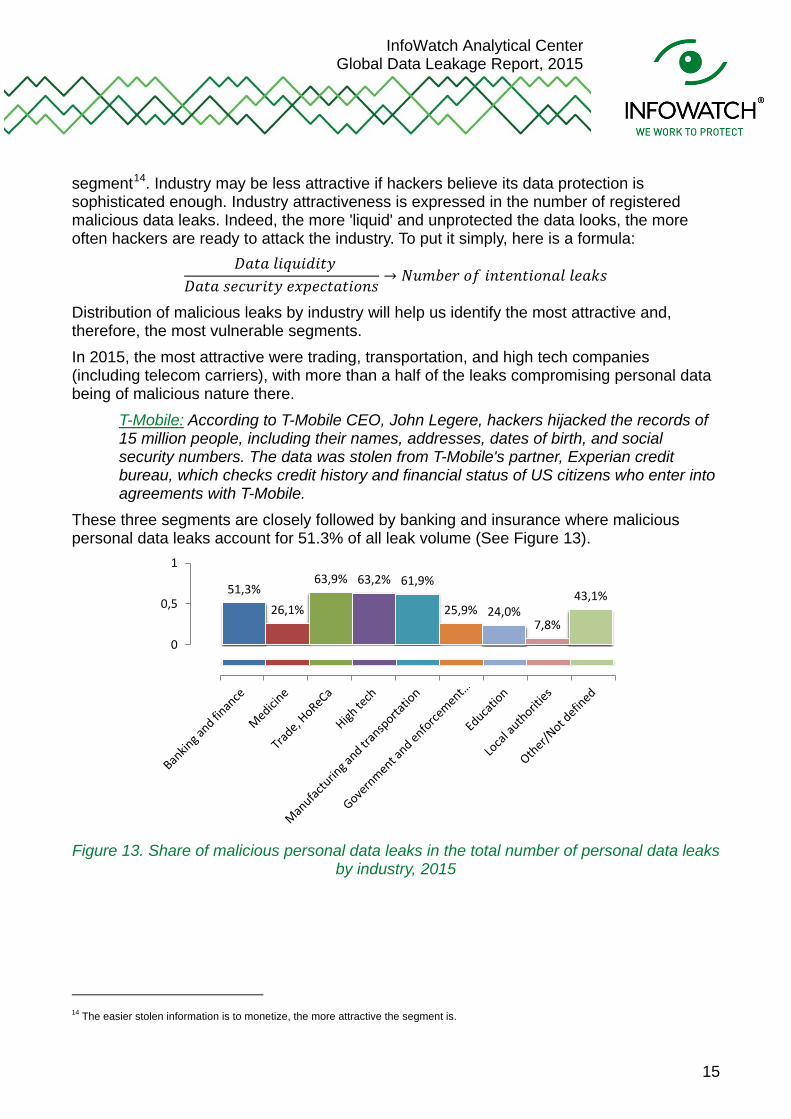
Distribution of malicious leaks by industry will help us identify the most attractive and, therefore, the most vulnerable segments. In 2015, the most attractive were trading, transportation, and high tech companies (including telecom carriers), with more than a half of the leaks compromising personal data being of malicious nature there.
T-Mobile: According to T-Mobile CEO, John Legere, hackers hijacked the records of 15 million people, including their names, addresses, dates of birth, and social security numbers. The data was stolen from T-Mobile's partner, Experian credit bureau, which checks credit history and financial status of US citizens who enter into agreements with T-Mobile.
These three segments are closely followed by banking and insurance where malicious personal data leaks account for 51.3% of all leak volume (See Figure 13).
Figure 13. Share of malicious personal data leaks in the total number of personal data leaks
by industry, 2015
14 The easier stolen information is to monetize, the more attractive the segment is.
51,3% 26,1%
63,9% 63,2% 61,9%
25,9% 24,0% 7,8%
43,1%
0
0,5
1
InfoWatch Analytical Center Global Data Leakage Report, 2015
16
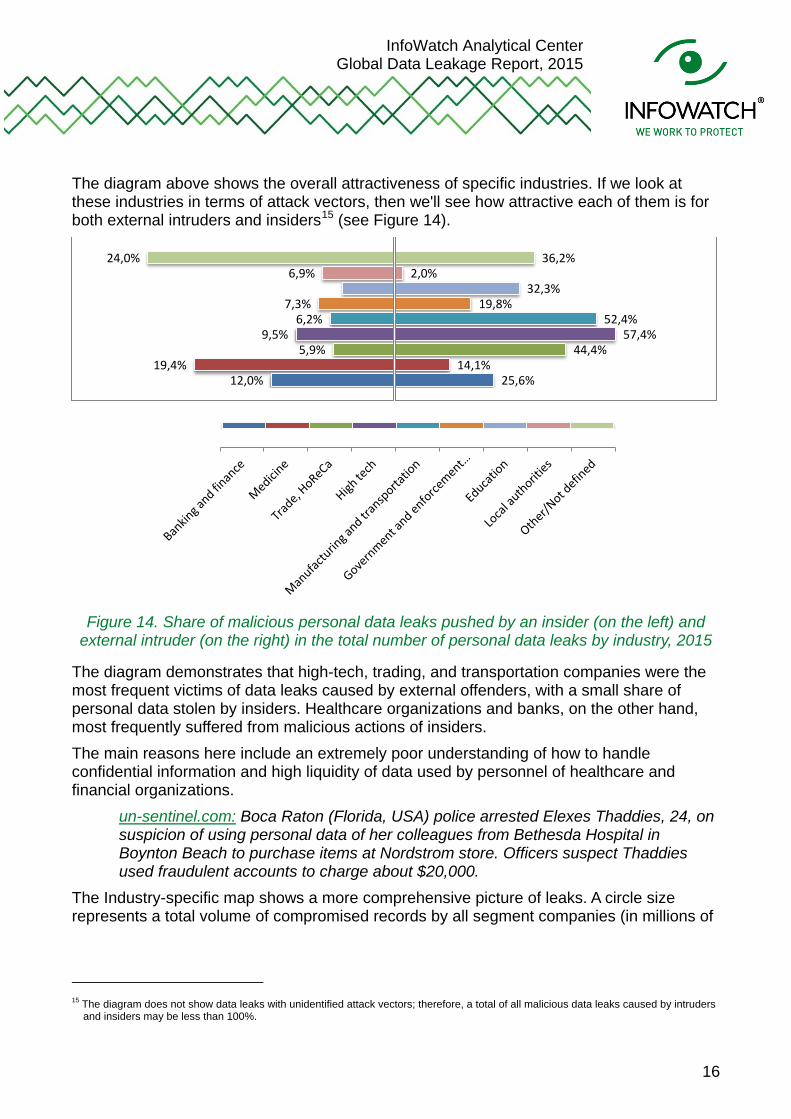
The diagram above shows the overall attractiveness of specific industries. If we look at these industries in terms of attack vectors, then we'll see how attractive each of them is for both external intruders and insiders15 (see Figure 14).
Figure 14. Share of malicious personal data leaks pushed by an insider (on the left) and
external intruder (on the right) in the total number of personal data leaks by industry, 2015
The diagram demonstrates that high-tech, trading, and transportation companies were the most frequent victims of data leaks caused by external offenders, with a small share of personal data stolen by insiders. Healthcare organizations and banks, on the other hand, most frequently suffered from malicious actions of insiders. The main reasons here include an extremely poor understanding of how to handle confidential information and high liquidity of data used by personnel of healthcare and financial organizations.
un-sentinel.com: Boca Raton (Florida, USA) police arrested Elexes Thaddies, 24, on suspicion of using personal data of her colleagues from Bethesda Hospital in Boynton Beach to purchase items at Nordstrom store. Officers suspect Thaddies used fraudulent accounts to charge about $20,000.
The Industry-specific map shows a more comprehensive picture of leaks. A circle size represents a total volume of compromised records by all segment companies (in millions of
15 The diagram does not show data leaks with unidentified attack vectors; therefore, a total of all malicious data leaks caused by intruders
and insiders may be less than 100%.
12,0% 19,4%
5,9% 9,5%
6,2% 7,3%
6,9% 24,0%
25,6% 14,1%
44,4% 57,4%
52,4% 19,8%
32,3% 2,0%
36,2%
InfoWatch Analytical Center Global Data Leakage Report, 2015
17
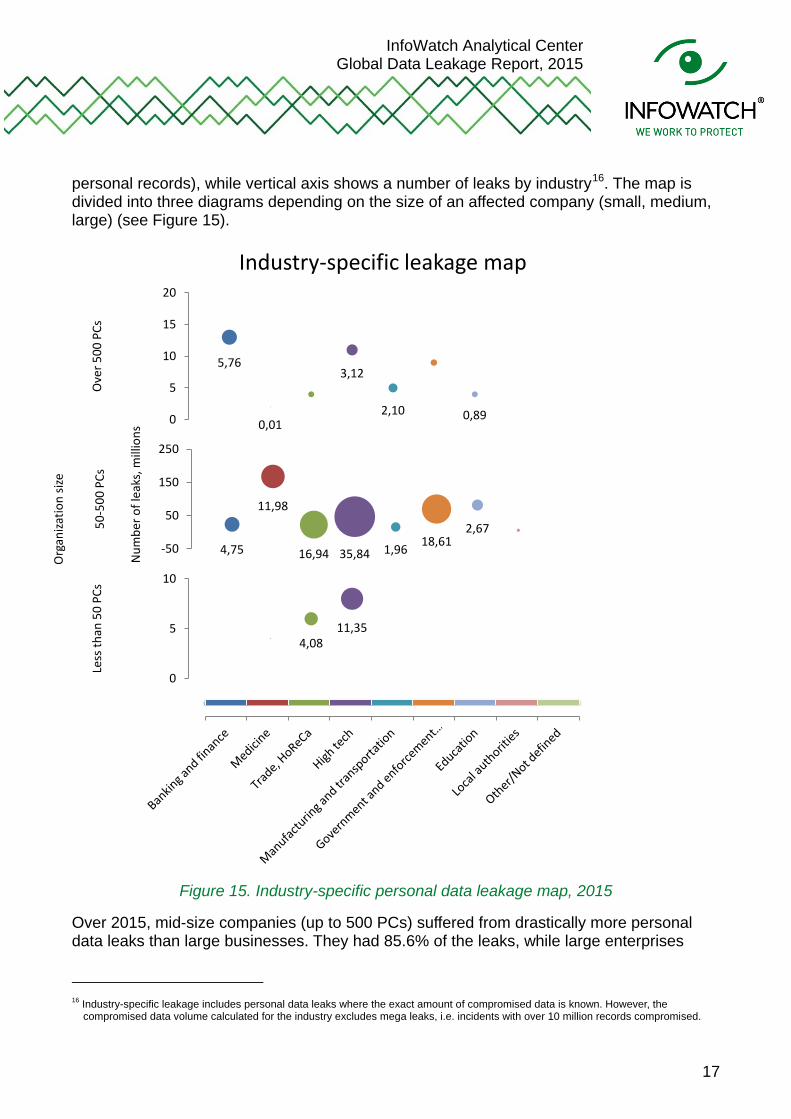
personal records), while vertical axis shows a number of leaks by industry16. The map is divided into three diagrams depending on the size of an affected company (small, medium, large) (see Figure 15).
Figure 15. Industry-specific personal data leakage map, 2015
Over 2015, mid-size companies (up to 500 PCs) suffered from drastically more personal data leaks than large businesses. They had 85.6% of the leaks, while large enterprises
16 Industry-specific leakage includes personal data leaks where the exact amount of compromised data is known. However, the
compromised data volume calculated for the industry excludes mega leaks, i.e. incidents with over 10 million records compromised.
5,76
0,01
3,12
2,10 0,89 0
5
10
15
20
Ove
r 500
PCs
Industry-specific leakage map
4,75
11,98
16,94 35,84 1,96 18,61 2,67
-50
50
150
250
50-5
00 P
Cs
4,08 11,35
0
5
10
Less
than
50
PCs
Num
ber o
f lea
ks, m
illio
ns
Org
aniza
tion
size
InfoWatch Analytical Center Global Data Leakage Report, 2015
18
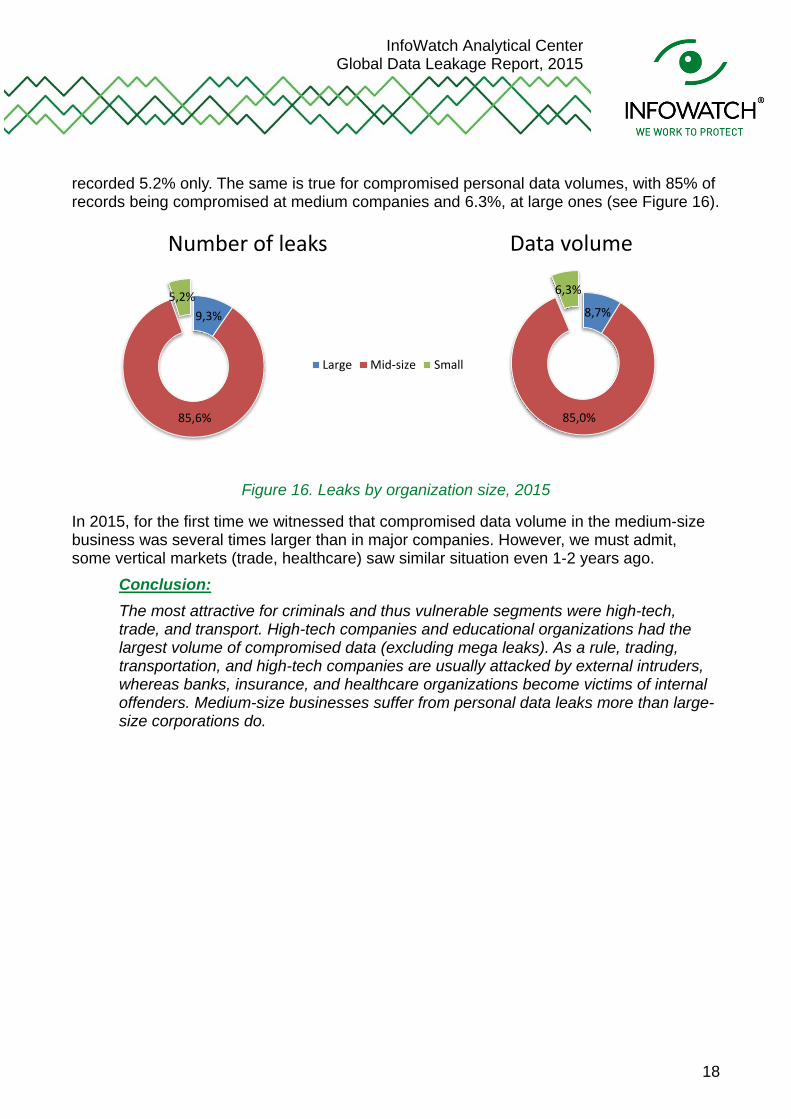
recorded 5.2% only. The same is true for compromised personal data volumes, with 85% of records being compromised at medium companies and 6.3%, at large ones (see Figure 16).
Figure 16. Leaks by organization size, 2015
In 2015, for the first time we witnessed that compromised data volume in the medium-size business was several times larger than in major companies. However, we must admit, some vertical markets (trade, healthcare) saw similar situation even 1-2 years ago.
Conclusion: The most attractive for criminals and thus vulnerable segments were high-tech, trade, and transport. High-tech companies and educational organizations had the largest volume of compromised data (excluding mega leaks). As a rule, trading, transportation, and high-tech companies are usually attacked by external intruders, whereas banks, insurance, and healthcare organizations become victims of internal offenders. Medium-size businesses suffer from personal data leaks more than large-size corporations do.
9,3%
85,6%
5,2%
Number of leaks
Large Mid-size Small
8,7%
85,0%
6,3%
Data volume
InfoWatch Analytical Center Global Data Leakage Report, 2015
19
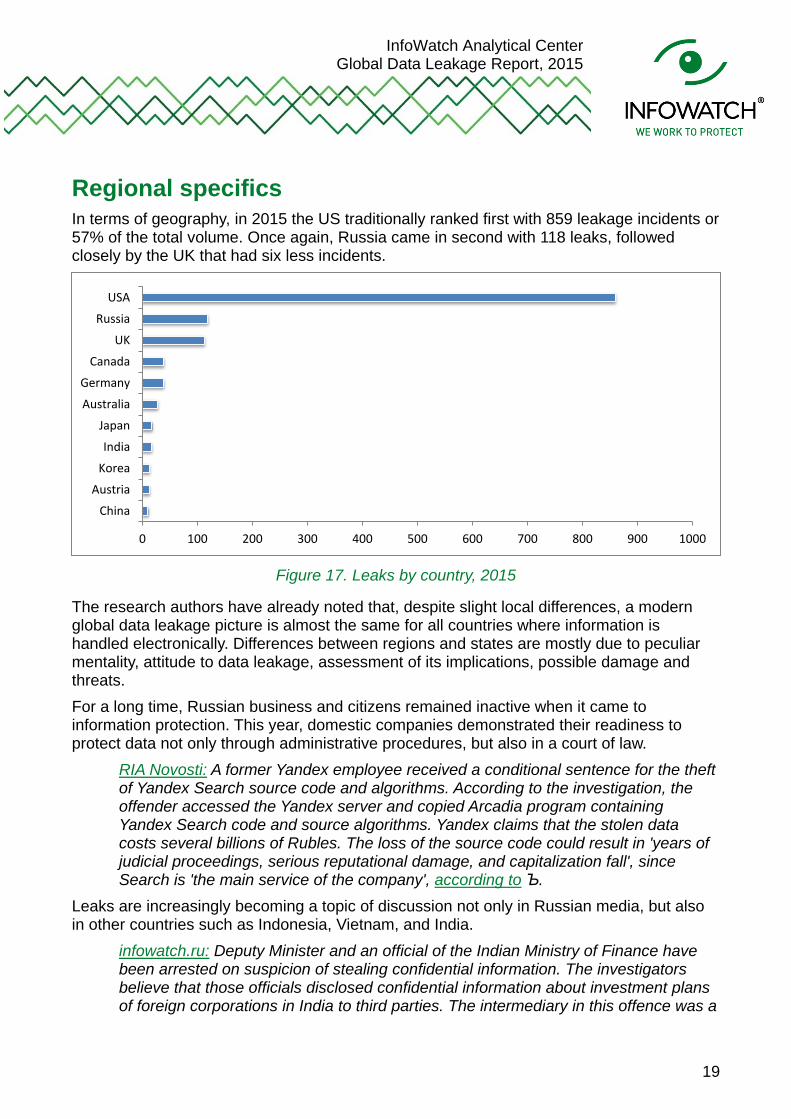
Regional specifics In terms of geography, in 2015 the US traditionally ranked first with 859 leakage incidents or 57% of the total volume. Once again, Russia came in second with 118 leaks, followed closely by the UK that had six less incidents.
Figure 17. Leaks by country, 2015
The research authors have already noted that, despite slight local differences, a modern global data leakage picture is almost the same for all countries where information is handled electronically. Differences between regions and states are mostly due to peculiar mentality, attitude to data leakage, assessment of its implications, possible damage and threats. For a long time, Russian business and citizens remained inactive when it came to information protection. This year, domestic companies demonstrated their readiness to protect data not only through administrative procedures, but also in a court of law.
RIA Novosti: A former Yandex employee received a conditional sentence for the theft of Yandex Search source code and algorithms. According to the investigation, the offender accessed the Yandex server and copied Arcadia program containing Yandex Search code and source algorithms. Yandex claims that the stolen data costs several billions of Rubles. The loss of the source code could result in 'years of judicial proceedings, serious reputational damage, and capitalization fall', since Search is 'the main service of the company', according to Ъ.
Leaks are increasingly becoming a topic of discussion not only in Russian media, but also in other countries such as Indonesia, Vietnam, and India.
infowatch.ru: Deputy Minister and an official of the Indian Ministry of Finance have been arrested on suspicion of stealing confidential information. The investigators believe that those officials disclosed confidential information about investment plans of foreign corporations in India to third parties. The intermediary in this offence was a
0 100 200 300 400 500 600 700 800 900 1000
China
Austria
Korea
India
Japan
Australia
Germany
Canada
UK
Russia
USA
InfoWatch Analytical Center Global Data Leakage Report, 2015
20
consultant of a company in Mumbai. The documents were transferred by e-mail or courier. As part of searches conducted by the Indian Central Bureau of Investigation in Mumbai and Delhi, investigators found 60M Sri Lankan rupees in cash (approximately $500,000) in the consultant's office, as well as copies of confidential documents.
InfoWatch Analytical Center Global Data Leakage Report, 2015
21
Conclusion and findings In 2014, we declared the dawn of the 'mega leak' era17. Over the last year, the situation got worse, with 55 leaks each compromising over 1 million personal data records, including 21 mega leaks hitting 10 million records or more. External attacks are the key driver to the increase in compromised data volume, with almost 1 billion personal data records being compromised by external intruders. This trend will most likely continue. Even now, external attackers are responsible for up to two thirds of all compromised personal data. The most notorious incidents of 2015 were associated with illegal actions of hackers, intrusion into companies' infrastructure, and stealing aggregated data about employees and clients. Internal violators are more skillful now and thus cease to use emails, instant messengers, or removable media. Technically savvy intruders know that the cutting-edge control tools can intercept the transfer of confidential information through the above channels, and so they don't risk being caught. Such offenders prefer restricted, uncontrolled channels where data protection tools are poor or ineffective. Now, it is high time to ponder over new data protection approaches. The combination of behavioral analysis with strict control over the most critical communication channels (first of all, network) can produce extra synergistic effect and thus enable better data protection. The most appealing for offenders and thus the most vulnerable industries were high-tech, trading, and transportation. High-tech companies and educational organizations had the largest volume of compromised data (excluding mega leaks). As a rule, trading, transportation, and high-tech companies are usually attacked by external intruders, whereas banks, insurance, and healthcare organizations become victims of internal offenders. Mid-size businesses suffer from personal data leaks more than large-size corporations do. The subject of data leaks is becoming more and more transparent, which is a very good sign. Hopefully, in the near future we will not only discuss leaks, data types, channel specifics, but also evaluate protected assets compromised as a result of attacks, as well as actual financial losses suffered by companies due to leaks of specific data types. Unfortunately, such evaluations are now only performed in Anglo-Saxon countries.
17 Mega leaks mean data leakages compromising 10 million records or more.

InfoWatch Analytical Center Global Data Leakage Report, 2015
22
Leakage monitoring on InfoWatch's website On its website, InfoWatch Analytical Center regularly posts data leakage reports, as well as the most notorious incidents commented by InfoWatch experts. In addition, the website contains data leakage statistics for past years, available in the form of dynamic diagrams.
Follow the leakage news, new reports, analytical and popular articles via our channels:
• Email subscription • Facebook • Twitter • RSS
InfoWatch Analytical Center www.infowatch.com/analytics

InfoWatch Analytical Center Global Data Leakage Report, 2015
23
Glossary Information security incidents in this research mean compromising confidential information as a result of data leaks and/or destructive actions of company employees.
Data leak means an act or omission by a person who has authorized access to confidential information, when such act (omission) results in the loss of control over information or a breach of confidentiality.
Destructive actions by employees mean actions by employees that result in compromising confidential information, including use of confidential information for personal needs associated with fraud; illegal access to information (abuse of access rights).
Confidential information in this context means information which can be accessed by a limited number of clearly identified persons subject to its non-disclosure to third parties without consent of the information owner. In this report, Confidential information also includes personal data.
Intentional / accidental Leaks. Intentional leaks mean information leakages where a user, who operates information, can foresee negative implications of his or her actions, knows about their illegal nature, is warned about liability, and acts from mercenary motives and for personal benefit. This results in a risk of losing control over information and/or committing a confidentiality breach. In this case, it does not matter whether user's actions actually led to negative consequences or corporate losses.
Accidental leaks mean information leakages when a user neither foresees negative implications of his/her actions, nor acts for personal benefit. In this case, it does not matter whether user's actions actually led to negative consequences or corporate losses. The terms "intentional" and "malicious" ("unintentional" and "accidental") are equal and used as synonyms herein.
Attack vector means a classification criterion of intruder's actions behind data leakage, including intruders who attack company's web resources and information infrastructure from the outside to compromise data and insiders who obtain unauthorized access to classified resources and misuse confidential information, etc.
Data channel means a scenario which results in the loss of control over information and a breach of its confidentiality. Currently, we identify eight separate leak channels:
Theft/loss of equipment (server, data storage system, laptop, PC), with the information being compromised during the equipment maintenance or due to its loss
Mobile devices where data leakage occurs because of unauthorized use or theft of a mobile device (smartphone, tablet), with the use of such devices being considered in BYOD paradigm
Removable media loss/theft (CDs, flash drives) Network where data is leaked via a browser (sending data to personal email, filling in browser forms); unauthorized use of
intranet resources, FTPs, and cloud services; and unauthorized information posting on a website Email, with data being leaked via corporate email Paper documents which can cause a data leakage in the case of improper storage or utilization (printing, stealing or taking
confidential information out) Instant messengers (data leakage via voice, chat, and video communication) 'Non-defined' is a category used when an incident information appearing in mass media does not allow for the leak channel
identification.