Embed Size (px)
Citation preview

Global Economic Environment of the Firm
Professor John Coleman
Duke UniversityFuqua School of Business
Rethinking the Boundaries of Business School
October 2009
MGRECON301

Course Motivation
• Why are some countries poor and others rich?
• Why do countries undergo financial crises?
• Why should a business manager understand his/her global economic environment?

Sustained Growth and Country-Level Income Inequality is a Modern Phenomenon
World-Wide Per-Capita GDP
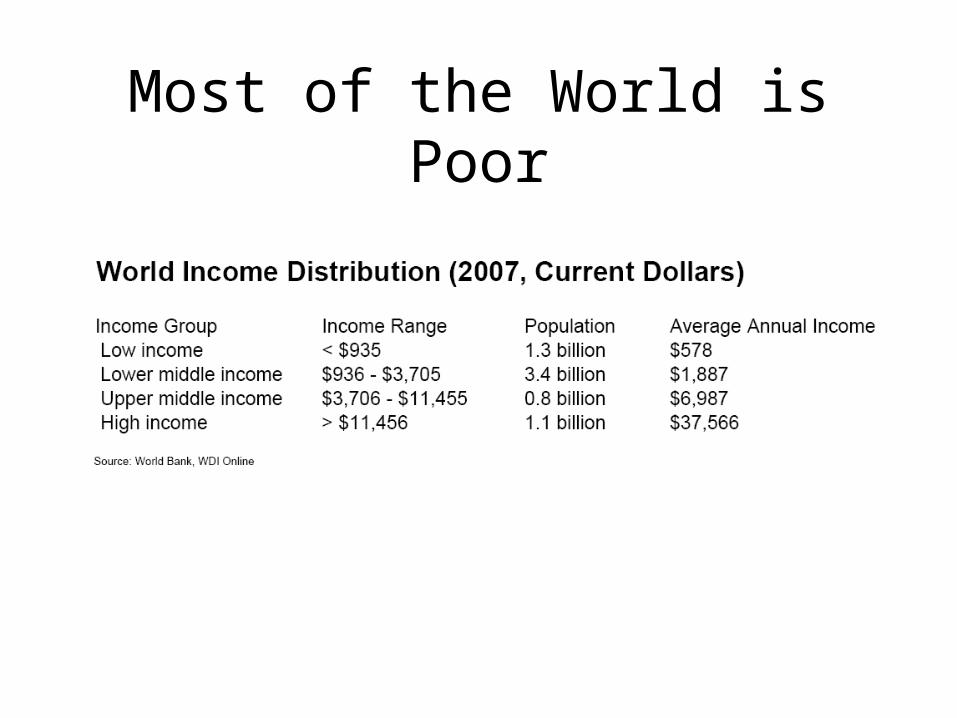
Most of the World is Poor

The 21st Century may be the Century of Convergence
2007 population
• 6.7 billion - World
• 1.3 billion - China
• 1.1 billion - India
China and India represent 36 percent of the world’s population

Many Poor Countries are Still Being Left Behind

Financial Crises in the 90’s
exc
ha
ng
e r
ate
sn
atio
na
l cu
rre
ncy
pe
r d
olla
r
Time series of recent collapsemonths
Jan90Dec90Dec91Dec92Dec93Dec94Dec95Dec96Dec97Dec98Dec99Dec00Dec01Dec02
Mexico
Thailand
Russia
Argentina

Dow Jones Industrial Average
U.S. Financial Crisis in 2008
The Treasury secretary, Henry M. Paulson Jr., and the Federal Reserve chairman, Ben S. Bernanke, testifying on Capitol Hill regarding the $700 billion bailout of financial firms.
Year
The U.S. financial crises has spread around the world: contagion.

Macroeconomics and the Firm
Financial Crises

Corporate Profits are Very Pro-Cyclical
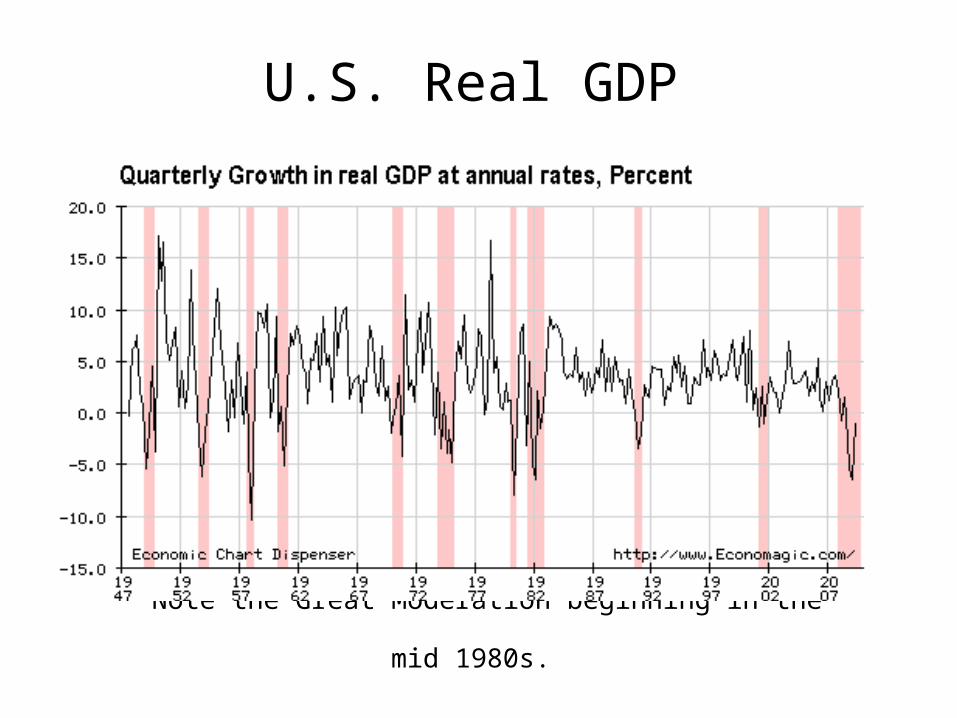
U.S. Real GDP
Note the Great Moderation beginning in the mid 1980s.

Oil Price
Real
Nominal

Outsourcing and Wages Around the World
0.0 5.0 10.0 15.0 20.0 25.0
Germany
Holland
Japan
United States
France
Italy
Australia
Britain
Spain
Taiw an
Singapore
South Korea
Hong Kong
Brasil
Mexico
Hungary
Malaysia
Poland
Thailand
China
India
Russia
Indonesia
Labor costs in the manufacturing sector, $/hour (1993)


Monetary PolicyThe Federal Funds Rate and the Taylor Rule

Monetary PolicyDuring the 2008/09 Financial Crises

Inflation around the World
Developed Countries: Inflation(year-over-year) (1/01/1990 - 09/24/2008) Frequency: Quarterly Magnitude: Percent
World: Inflation(year-over-year) (1/01/1990 - 09/24/2008) Frequency: Quarterly Magnitude: Percent
World
Developed Countries
Source: Cleveland Federal Reserve Bank


Yen has moved from 350 to about 100, why?
Exchange Rates

The slope of the yield curve predicts recessions(5-year Treasury bond - 3-month Treasury bill)
-7
-5
-3
-1
1
3
5
7
9
1969
1971
1973
1975
1977
1979
1981
1983
1985
1987
1989
1991
1993
1995
1997
1999
2001
2003
Annual GDP Growth or Yield Curve
% Real annual GDP growth
Yield spread
RecessionCorrect
RecessionCorrect
2 RecessionsCorrect
RecessionCorrect
Yield curve accurate in recent forecast
The Yield Spread and Economic Growth

U.S.Treasury Yield CurveOctober 13, 2009
National Income and Product Accounts (NIPA)
Accounting system by which we organize our thinking to measure economic activity for a country.

Gross Domestic Product (GDP)
• Market value of final goods and services newly produced within a nation during a fixed period of time– Market value– Newly produced final goods and services
• Per capita GDP is an economy’s GDP divided by its population

The Income Expenditure Identity
Y=C+I+G+NX– Y=GDP (Income)– C=consumption– I=investment – G=government purchases– NX=net exports
• What is produced is spent somewhere.

The Income Expenditure Identity
Expenditures in 1996 Billions of dollars Percent of GDP
Personal Consumption Expenditures (C) 5151 68.0
Gross private domestic investment (I) 1117 14.7
Government purchases of goods and services (G) 1406 18.6
Net exports (NX) -99 -1.3
Exports 855 11.3
Imports 954 12.6
Total (equals GDP) (Y) 7576 100.0

GDP is same as National Income
GDP = National Income + Indirect taxes +Depreciation - NFP
• The income approach says that what is produced is income to someone

National Income
Income in 1996 Billions of dollars Percent of GDP
Compensation of employees 4449 58.7
Proprietors' income 518 6.8
Rental income of persons 127 1.7
Corporate profits 654 8.6
Net interest 403 5.3
Total (equals National Income) 6151 81.2

National Saving
S=Y+NFP-(C+G)

Current Account
• This implies
S=(C+I+G+NX)+NFP- C - G
S=I+(NX+NFP)
• CA = current account balance
S=I+CA
• CA=0 if closed economy (Cuba)

Budget Deficit
Sg = (T-TR-INT)-G
• T = Tax Receipts
• TR = Transfers to private sector
• INT = interest on national debt
• G = Government purchases
• Sg=Budget surplus if positive. If negative, then a budget deficit

Some Fundamental Prices
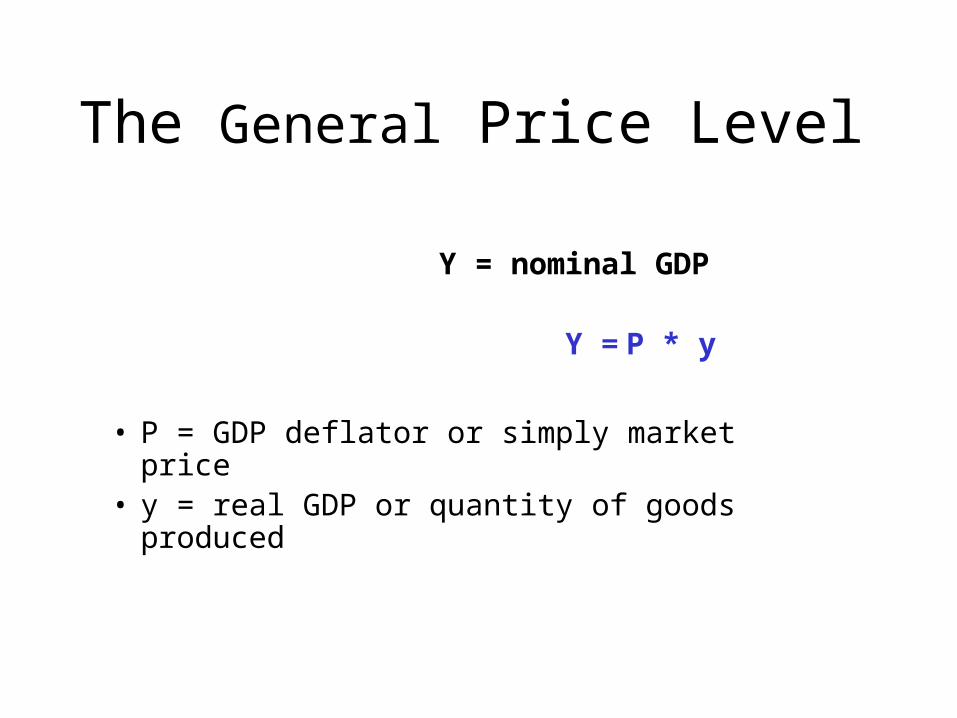
The General Price Level
Y = nominal GDP
Y = P * y
• P = GDP deflator or simply market price• y = real GDP or quantity of goods produced

The General Price Level
• Price growth = inflation:
• Real GDP growth:
100111
t
tt P
P
100111
t
tt y
yg

Consumer Price Inflation

Interest Rates
• The (short-term) interest rate is the risk-free rate of return that can be earned in the market.
• R ≡ Dollar interest rate
• Invest $1 today at the rate R
• Receive $(1+R) in one year. How much would you pay to receive $1 in one year?

Real and Nominal Interest Rates
• The real interest rate, r, is the rate of return in units of goods.
r = R -
• (Ex post) real interest rate is nominal interest rate minus inflation.

Expected Inflation and Interest Rates
• The inflation rate is typically not known
• Expected (ex ante) real interest rate = nominal interest rate - expected inflation
re = R - e
• The expected real interest rate is the nominal interest rate less expected inflation – the Fisher equation

Inflation and Nominal Interest Rate in the United States
R
Inflation
Nominal Interest Rate

Bond Price and Interest Rate
• How much would you pay to receive $1 in one year?
• If you paid Q, then your return would be(1-Q)/Q
• The return on the bond and the interest rate must be the same:
Q = 1/(1+R)
• Bond prices and interest rates move in opposite directions

Glossary of TermsGDP Gross Domestic Product (also Y)NFP Net Factor PaymentsGNP Gross National Product = GDP + NFPC National ConsumptionI National InvestmentG Government ExpenditureX ExportsM ImportsNX Net exports = X - MS National Saving = Spvt + Sgovt
T Total taxesTR Transfer paymentsINT Interest payments InflationPt General price level at time tR Nominal interest rater Real interest rate