Embed Size (px)
Citation preview

Global Economics Paper No: 188
Goldman Sachs Global Economics,
Commodities and Strategy Researchat https://360.gs.com
Many thanks to Jim O’Neill, Dominic Wilson and Michael Buchanan for advice and comments, and to Keun Myung Kim for research assistance
Goohoon KwonSeptember 21, 2009
A United Korea? Reassessing North Korea Risks (Part I)
North Korea risks, ranging from war to huge unification costs, warrant are-evaluation, given the prospect of a power succession in North Korea andthe changing economic landscape in the region.
The North Korean economy is at a crossroads: growth has stagnated andthe planned system is near collapse, but it has large untapped potential,including rich human capital, abundant mineral resources (valued at around140 times 2008 GDP) and significant room for productivity gains.
We project that the GDP of a united Korea in USD terms could exceed thatof France, Germany and possibly Japan in 30-40 years, should the growthpotential of North Korea, notably its rich mineral wealth, be realised.
We expect a gradual integration between the North and South, similar tothe pattern followed in China-Hong Kong, rather than an instant German-style unification.
The costs of the integration of South and North Korea could be reduced toan affordable level, if backed by appropriate policies.
Important disclosures appear at the back of this document.

Goldman Sachs Global Economics, Commodities and Strategy Research Global Economics Paper
Issue No: 188 2 September 21, 2009
Contents
I. North Korea: Risks and opportunities Page 3
II. North Korea’s economy: Implications for a united Korea Page 5
Korea at a glance Page 8
III. North Korea’s long-term growth potential Page 9
Abundant and competitive labour force Page 9
Strong synergies between South and North Korea Page 10
Productivity gains and currency appreciation Page 13
IV. A united Korea—the potential size of the economy Page 16
Long-term projection for a united Korean economy Page 16
Growth potential of the mineral sector Page17
V. Integration costs and policy options Page 19
References Page 21
Box 1: The Gaesung Industrial Complex Page 12

Goldman Sachs Global Economics, Commodities and Strategy Research Global Economics Paper
Issue No: 188 3 September 21, 2009
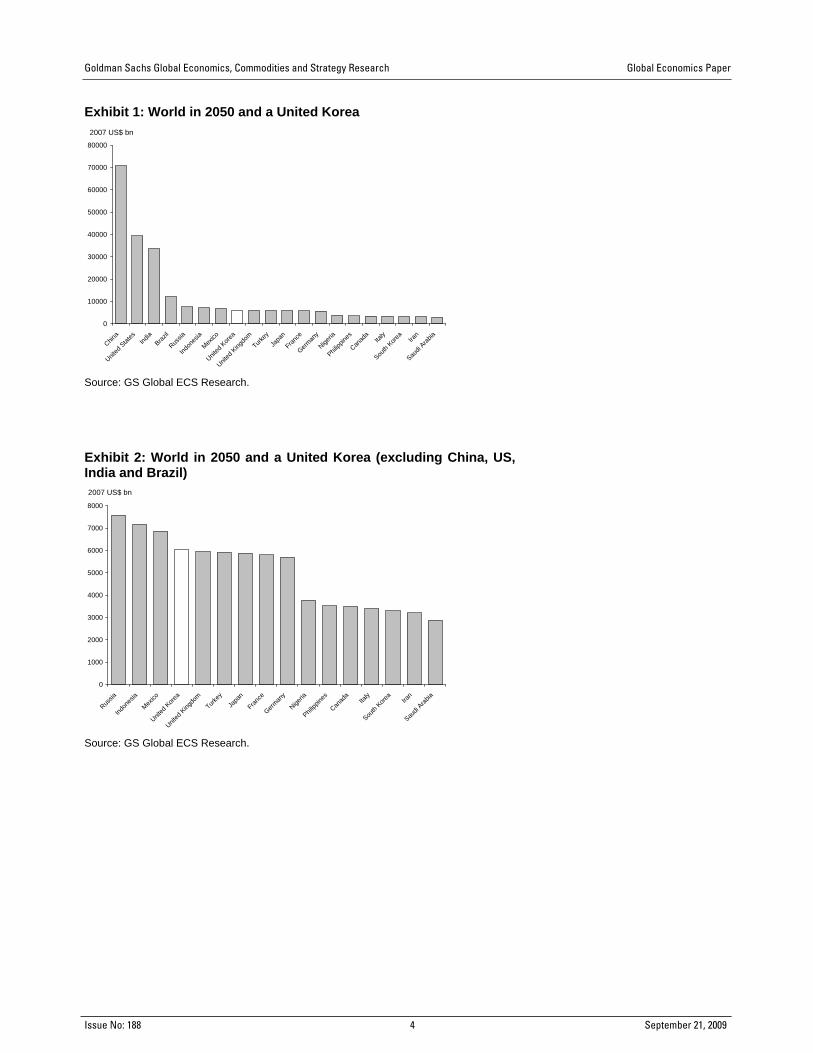
I. North Korea: Risks and opportunities Investors have long considered North Korea to be a key risk factor when investing in South Korea. The risks relating to North Korea range from the potential for war to huge unification costs (see Fitch’s Ratings report of 2003, for example). Hence, tensions in the Korean peninsula or signs of unrest in North Korea have typically led to market sell-offs, although this has been less evident recently (see “Cross-border tensions are rising”, Korea Views, June 1, 2009). In this paper, we take a fresh look at the risks relating to North Korea, given the prospect of a succession of power in North Korea and the changing economic landscape in the region. The health of current leader Kim Jong-il, in power since 1994, is widely believed to be poor, prompting press speculation that a transition may already be in progress. More fundamentally, North Korea’s economy is increasingly lagging behind its former planned-economy peers—not to mention South Korea; living standards in China and Russia, and more recently in Vietnam and Mongolia, have improved rapidly along with market reforms. These developments, in our view, could eventually spark powerful political and economic changes in North Korea, which, together with the recent political changes in the US and Japan, could transform the nature and magnitude of North Korea risks. We assume a peaceful and gradual economic integration between North and South Korea in our analysis. Economic integration could take various shapes or forms—from instant unification to a gradual integration—with diametrically different implications for the economy and markets. Experience from Germany’s unification suggests that the choice of integration modality may be dictated by the process itself rather than left to the discretion of policymakers. Nonetheless, we believe that our assumption of a peaceful and gradual integration is a reasonable starting point for analysis, given the policy stance of the South Korean government and the international community, and the apparent lack of alternatives for the North Korean leadership other than economic reform and cooperation with neighbouring countries (see “North Korea: Tensions and implications”, Korea Views, July 17, 2009). One of the most striking findings of our study is the potential size of a united Korea in the long term. We project that a united Korea could overtake France, Germany and possibly Japan in 30-40 years in terms of GDP in USD terms, should the growth potential of North Korea be realised. This projection would put the size of a united Korea in 2050 firmly on a par with, or in excess of, that of most G-7 countries, except for the US (see Exhibits 1 and 2). We also believe that the cost of the integration of South and North Korea could be reduced to an affordable level, if backed by appropriate policies. This would hold even under the unlikely scenario of a sudden collapse of the North Korea economy.
______________________
Recent developments could set in motion powerful political and economic changes in North Korea, potentially transforming the nature of North Korea risks
We assume a peaceful and gradual economic integration between North and South Korea
USD GDP of a united Korea in 2050 could potentially be on a par with, or in excess of, that of most G-7 countries
Goldman Sachs Global Economics, Commodities and Strategy Research Global Economics Paper
Issue No: 188 4 September 21, 2009
Exhibit 1: World in 2050 and a United Korea
0
10000
20000
30000
40000
50000
60000
70000
80000
China
United
States
India
Brazil
Russia
Indon
esia
Mexico
United
Korea
United
King
dom
Turkey
Japa
n
France
German
y
Nigeria
Philipp
ines
Canad
aIta
ly
South
Korea
Iran
Saudi
Arabia
2007 US$ bn
Source: GS Global ECS Research. Exhibit 2: World in 2050 and a United Korea (excluding China, US, India and Brazil)
0
1000
2000
3000
4000
5000
6000
7000
8000
Russia
Indon
esia
Mexico
United
Korea
United
King
dom
Turkey
Japa
n
France
German
y
Nigeria
Philipp
ines
Canad
aIta
ly
South
Korea
Iran
Saudi
Arabia
2007 US$ bn
Source: GS Global ECS Research.

Goldman Sachs Global Economics, Commodities and Strategy Research Global Economics Paper
Issue No: 188 5 September 21, 2009
II. North Korea’s economy: Implications for a united Korea The North Korean economy is at a crossroads. The economy has already suffered from output contraction following the collapse of the former Soviet Union, which sharply reduced energy supply to North Korea. Output in North Korea fell by 20% from 1992 to the trough in 1998, which was almost as severe as in the transition economies that undertook bold economic reforms (see Exhibit 3). Its output has started to recover since 1998 but the recovery momentum has weakened recently (see Exhibit 4), limiting its per capita income in 2008 at a level 23% lower than in 1990. The stagnation in recent years, together with the strong performance of other former planned economies that embraced market reforms, has left North Korea far behind its former socialist peers, including Mongolia and China (see Exhibit 5). Similarly, its per capita income has declined from 12% of South Korea’s in 1993 to 5.5% in 2008, according to Bank of Korea estimates. Exhibit 3: North Korea’s real GDP is still lower than its 1992 level Output contraction and recovery in formerly planned economies (real GDP, 1992=100)
60
80
100
120
140
160
180
1992 1993 1994 1995 1996 1997 1998 1999 2000 2001 2002 2003 2004 2005 2006 2007 2008
Transitional economies (median)
North Korea
Russia
Kazakhstan
Index
Source: Bank of Korea, IMF, GS Global ECS Research. Exhibit 4: North Korea’s economy rebounded in 2008
-3.7
-6
-2.1
-4.1-3.6
-6.3
-1.1
6.2
3.7
1.2
2.2
3.8
-1.1
-2.3
3.7
1.3
-3.5-4.2
1.8
-8
-6
-4
-2
0
2
4
6
8
1990 1991 1992 1993 1994 1995 1996 1997 1998 1999 2000 2001 2002 2003 2004 2005 2006 2007 2008
3-year moving average
% chg yoy
Source: Bank of Korea, GS Global ECS Research.
The stagnation of recent years has left North Korea lagging far behind its former socialist peers

Goldman Sachs Global Economics, Commodities and Strategy Research Global Economics Paper
Issue No: 188 6 September 21, 2009
Exhibit 5: Per capita income of North Korea in USD is similar to that of Vietnam and India
North Korea* Vietnam Mongolia India China Cambodia Philippines Laos1995 1033 288 631 384 603 297 1055 382
1996 989 338 598 410 701 295 1152 388
1997 812 361 528 426 772 281 1122 357
1998 572 357 480 423 819 253 867 255
1999 714 374 441 449 865 281 992 286
2000 757 402 455 451 949 288 989 329
2001 706 413 482 459 1042 309 906 327
2002 762 440 518 480 1135 327 958 331
2003 818 492 582 559 1274 349 973 380
2004 913 553 720 645 1490 394 1040 433
2005 1056 639 905 734 1715 455 1159 485
2006 1108 723 1224 816 2028 513 1352 582
2007 1151 834 1503 1035 2567 649 1624 675
2008 1067 1034 1981 1005 3267 818 1845 841
*Bank of Korea's estimates in KRW, which we have converted to USD at market exchange Note: Caution is needed in its direct comparison with those of other countries as the estimates are based on South Korean price and cost structures. Source: CEIC, IMF, Bank of Korea, GS Global ECS Research. The planned economy system in North Korea appears to be on the verge of collapse. The unofficial USD exchange rate has surged after a brief period of stability following the 2002 devaluation (from NKW2.2 to NKW153.5), reaching 20 times the official rate in 2007 and about 30 times the official rate in early 2009 (see Exhibit 6) (IMF and SNU, 2009, and Congressional Research Service, 2009). Official wages do not carry much weight either. On paper, official living expenses (akin to wages) of NKW2000-6000 per month would buy 43kg-130kg of rice, but in reality this would only buy up to 3kg of rice in the markets given acute shortages in state rice supplies, implying severely repressed inflation in consumer goods. According to anecdotal evidence from refugees, households use state-owned shops for just 1% of their purchases, and official compensation represents less than 10% of their income, with the remainder coming from private activities (mostly retail trading) (Bank of Korea, 2007). The military establishment is probably the only sector still benefiting from the planned system; it absorbs at least 20%-30% of GDP compared with around 3% of GDP in South Korea (Rand, 2005, and US State Department). Exhibit 6: North Korea has large pent-up devaluation pressure (USD/NKW)
1
10
100
1000
10000
1985 1988 1990 1992 1994 1996 1998 2000 2002 2004 2006 20070
20
40
60
80
100
120
Black market premium (x) (RHS)
Official NKW/USD rate (in log)
Unofficial rate (in log)
Source: Bank of Korea, IMF and SNU (2009), GS Global ECS Research.
The current economic system looks unsustainable

Goldman Sachs Global Economics, Commodities and Strategy Research Global Economics Paper
Issue No: 188 7 September 21, 2009
Closer economic ties with South Korea. Thanks to a decade of concerted efforts on the part of the South to improve economic links with the North, South Korea is already North Korea’s largest export market, replacing China for the first time in 2007 (see Exhibit 7). The fact that the Gaesung Industrial Complex (GIC) in North Korea, which accounts for about half of inter-Korean trade, continued to operate even amid escalating tensions early this year, testifies to the importance of intra-Korean economic cooperation as perceived by the North Korean leadership and by South Korea (see Box 1 on the GIC on page 12). Ongoing UN sanctions are likely to help maintain or bolster intra-Korean economic cooperation, possibly including the expansion of the GIC, given that the sanctions are not applied to most intra-Korean trade. North Korea has implemented a host of conciliatory measures recently, including the release of detained South Korean fishermen, the lifting of movement restrictions into and out of the GIC, and an amicable resolution of a wage dispute in the GIC. Exhibit 7: South Korea is North Korea’s largest export market Exports of North Korea in US$ bn including exports to South Korea
0.0
0.5
1.0
1.5
2.0
2.5
2000 2001 2002 2003 2004 2005 2006 2007 2008
South KoreaJapanChinaOthers
US$ bn
Source: Korea Development Institute, Korea Trade-Investment Promotion Agency, GS Global ECS Research.
South Korea is already North Korea’s largest export market

Goldman Sachs Global Economics, Commodities and Strategy Research Global Economics Paper
Issue No: 188 8 September 21, 2009
Korea at a glance
Population Real GDP yoy growth rate
45%
46%
47%
48%
49%
50%
19
90
19
91
19
92
19
93
19
94
19
95
19
96
19
97
19
98
19
99
20
00
20
01
20
02
20
03
20
04
20
05
20
06
20
07
20
08
-
5,000
10,000
15,000
20,000
25,000
30,000
35,000
40,000
45,000
50,000S Korea (RHS) N Korea (RHS) N Korea to S Korea (000)
-8
-6
-4
-2
0
2
4
6
8
10
12
199
0
199
1
199
2
199
3
199
4
199
5
199
6
199
7
199
8
199
9
200
0
200
1
200
2
200
3
200
4
200
5
200
6
200
7
200
8
S Korea
N Korea
Source: Bank of Korea. Source: Bank of Korea.
Gross National Income per capita North Korea’s GDP yoy growth (% chg by industry)
0%
4%
8%
12%
16%
20%
19
90
19
91
19
92
19
93
19
94
19
95
19
96
19
97
19
98
19
99
20
00
20
01
20
02
20
03
20
04
20
05
20
06
20
07
20
08
-
400
800
1,200
1,600
2,000
2,400
S Korea (RHS) N Korea (RHS) N Korea to S Korea
(W 10K)
-20
-15
-10
-5
0
5
10
15
199
0
199
1
199
2
199
3
199
4
199
5
199
6
199
7
199
8
199
9
200
0
200
1
200
2
200
3
200
4
200
5
200
6
200
7
200
8
Agriculture, Foresty, Fishery Mining & Manufacturing GDP
Source: Bank of Korea. Source: Bank of Korea.
North Korea’s industrial structure South Korea’s industrial structure
0%
20%
40%
60%
80%
100%
20
00
20
01
20
02
20
03
20
04
20
05
20
06
20
07
20
08
Services
Construction
Electricity,Gas &water
Mining &
Manufacturing
Agriculture,
Foresty, Fishery
0%
20%
40%
60%
80%
100%
20
00
20
01
20
02
20
03
20
04
20
05
20
06
20
07
20
08
Services
Construction
Electricity,Gas &water
Mining &
Manufacturing
Agriculture,
Foresty, Fishery
Source: Bank of Korea. Source: Bank of Korea.

Goldman Sachs Global Economics, Commodities and Strategy Research Global Economics Paper
Issue No: 188 9 September 21, 2009
III. North Korea’s long-term growth potential Assessing the growth potential of North Korea is a huge challenge. The lack of data on North Korea poses fundamental problems when estimating input prospects and productivity potential. Output data are sketchy and difficult to verify, probably in part due to the large military sector (some 25% of GDP). More importantly, the timing and pace at which North Korea will realise its growth potential is likely to hinge on when and whether it embarks on meaningful economic reforms, and the extent of economic integration between South and North Korea—both of which are difficult to predict as of now. That said, we believe that North Korea has strong untapped potential, which could be unleashed once meaningful economic reforms start and investment flows in. We would highlight three main factors: 1) an abundant and competitive labour force; 2) ample room for synergies between South Korean capital and technology, and North Korean natural resources and labour; and 3) the potentially large gains from productivity and currency appreciation typical in transition economies. Abundant and competitive labour force An abundant and competitive labour force provides a favourable economic backdrop that could trigger a growth spurt, once economic reforms are undertaken. Per capita income stood at around US$1,100 in 2008 at market prices (Bank of Korea estimates) or around US$1,700-2,248 in purchasing-power-parity values (Congressional Research Service 2009). The per capita income at market prices is similar to that of Vietnam and India, and about one-third of China’s, all of which benefit from competitive wages and a large domestic demand pool. Living standards could be much lower than implied by per capita GDP, given the large military sector, repressed inflation and shortage of consumer goods. In addition, more than a third of the population (37%) lives in rural areas, as was the case in South Korea in the late 1970s, providing an ample pool for the industrial workforce (see Exhibit 8). Mirroring the population structure, the primary sector represents about 22% of GDP, also similar to that of South Korea in the late 1970s (see Exhibit 9). Exhibit 8: Rural population in North Korea is at the level of South Korea in the late 1970s
0%
10%
20%
30%
40%
50%
60%
70%
80%
90%
1975 1977 1979 1981 1983 1985 1987 1989 1991 1993 1995 1997 1999 2001 2003 2005 2007
Vietnam
China
South Korea
North Korea
Source: CEIC, National Statistical Office, GS Global ECS Research.
Meaningful economic reforms and closer South-North economic ties will influence how quickly North Korea can realise its growth potential
Per capita income similar to that of Vietnam and India, and about one third of China’s

Goldman Sachs Global Economics, Commodities and Strategy Research Global Economics Paper
Issue No: 188 1 0 September 21, 2009
Exhibit 9: The North’s industrial structure is also similar to that of South Korea in the late 1970s
North Korea ('08)
South Korea ('08)
South Korea ('79)
Agriculture and fishing 21.6 2.5 21.3
Mining 12.1 0.2 1.1
Manufacturing 22.5 28.1 24.7
Light 6.7 4.6 ...
Heavy and petrochem 15.8 23.5 ...
Electricity, gas and wate 3.4 1.8 2.2
Construction 8.3 7.0 7.9
Services 32.2 60.3 42.7
Government 22.8 10.7 ...
Others 9.4 49.6 ...
Total 100.0 100.0 100.0 Source: Bank of Korea, GS Global ECS Research. Strong synergies between South and North Korea North Korea is rich in minerals, unlike South Korea. It has large potential deposits of minerals, including magnesite, coal, uranium and iron ore, valued at around 140 times North Korea’s 2008 GDP at current market prices (see Exhibit 10). We estimate its implied net present value (NPV) at around 18 times GDP, assuming a reserve life of 40 years, a discount rate of 18% and wage costs of 15% of sales. In contrast, South Korea has virtually no mineral resources: it imports 97% of the energy and mineral resources Korea uses. Most of the six strategic minerals for South Korea (bituminous coal, uranium, iron, copper, steel and nickel) are abundant in North Korea. The following section examines the implications of these large mineral resources for North Korea’s long-term growth potential. Exhibit 10: North Korea is rich (and South Korea is poor) in mineral resources
North Korea South KoreaUnit ReservesValue (KRW trn) Reserves Import %
Magnesite bn ton 6.0 1,376 - 100
Limestone bn ton 100 996 10 1
Uranium ore 000 ton 4,000 628 - 100
Lignite bn ton 16 343 - 100
Anthracite coal bn ton 4.5 257 1.4 65
Iron bn ton 5.0 214 0.02 99
Gold 000 ton 2 45.3 0.04 93
Zinc 000 ton 21,000 12.6 588 100
Lead 000 ton 10,600 9.12 404 100
Copper 000 ton 2,900 5.41 56 100
Silver 000 ton 3-5 1.86 1.58 95
Molybdenum 000 ton 54 1.13 22 99
Rosette graphite 000 ton 2,000 0.75 121 100
Tungsten trioxide000 ton 246 0.39 127 89
Barite 000 ton 2,100 0.22 842 100
Fluorspar 000 ton 500 0.08 477 100
Talcum 000 ton 700 0.06 8,152 92
Kaolinite 000 ton 2,000 0.03 106,335 11
Manganese 000 ton 100-300 0.01 176 100
Nickel 000 ton 10-20 0.00 - 100
Asbestos 000 ton 13 0.00 511 -
Total (times 2008 GDP) 142Note: Reserves for South Korea are the sum of confirmed and estimated reserves as of 2007. North Korean data are potential reserves, based on latest North Korea data. Source: Korea Resources Corporation, Korea Institute for National Unification, Hyundai Research Institute, IAEA, EIA, GS Global ECS Research.
North Korea’s mineral wealth valued at 140 times 2008 GDP

Goldman Sachs Global Economics, Commodities and Strategy Research Global Economics Paper
Issue No: 188 1 1 September 21, 2009
North Korea also has favourable demographics and a well-educated labour force. We estimate that, in all, the labour force in North Korea could increase by as much as 1.4% per year over a decade under an integration scenario. First, its demographics are relatively young and the population is growing roughly twice as fast as in South Korea (see Exhibit 11). The working age population, according to 2008 UN projections, will grow at 0.7% a year over the next 10 years, compared with zero growth in South Korea. The combined population of North and South Korea could reach 76 million at the peak under a status quo scenario, according to UN projections, and possibly more under an integration scenario, in which life expectancy would be expected to rise in North Korea (see Exhibit 10). Second, with closer inter-Korean integration, the labour force could increase substantially given the current large military population (nearly 1.3 million or 16% of males between the ages of 15 and 64). As for the quality of human capital, pre-college education is compulsory (up to the age of 16) and is provided by the state. In fact, experience from the Gaesung Industrial Complex suggests that North Korean workers have a strong work ethic and a good potential for productivity enhancement (see Box 1 on page 12). Exhibit 11: North Korea has more favourable demographics than the South (2007)
South Korea
North Korea
United Korea
Demographic composition (in % of total)
0-14 years 18 23 20
15-64 years 72 68 71
65 or over 10 9 9
Birth rate per 1000 9.9 15.1 11.6
Death rate per 1000 6.0 7.2 6.4
Annual population growth 0.4 0.8 0.5 Source: UN, CIA, GS Global ECS Research. Exhibit 12: Population of a united Korea could near 80 million at its peak in 2030
48.1 48.9 49.3 49.3 49.1 48.6 47.7 46.342.3
23 24 25 26 27 27 27
2825
0
10
20
30
40
50
60
70
80
2005 2010 2015 2020 2025 2030 2035 2040 20500.0
0.5
1.0
1.5
2.0
2.5
South Korea North Korea South/North ratio (RHS) Source: UN, National Statistical Office, GS Global ECS Research.
Working age population predicted to grow at 0.7% a year over the next decade vs zero growth in South Korea

Goldman Sachs Global Economics, Commodities and Strategy Research Global Economics Paper
Issue No: 188 1 2 September 21, 2009
Box 1: The Gaesung Industrial Complex The Gaesung Industrial Complex (GIC) is the first industrial park to exist in North Korea, and is operated jointly by North and South Korean entities. It came into being in 2004, following approval by the South Korean government and the enactment of a special law by the North in late 2002. Since it opened in 2004, the number of companies operating in the GIC has increased to 109 (as of July 2009), with 24 factory sites under construction. Production in the GIC has correspondingly increased sharply from $15 million in 2005 to $251 million in 2008 (see Exhibit B1), with production reaching 22% of total exports of North Korea in 2008. South Korea has so far invested W790 billion, about 55% of which by private companies and the remainder by the government and state-owned companies (see Exhibit B2). Given the political and operational risks involved, the Korean government provides special insurance to these companies, which could be compensated for up to 90% of investments. One of the primary incentives for Korean companies to operate in the GIC is the competitive labour force: GIC workers earn $73 per month (around $40 net of taxes and social contributions), compared with $2,400 in South Korea in 2008. The GIC compensation, paid in USD, may seem low relative to a per capita GDP of about $1,100, but the hard currency payments would still be attractive to GIC workers, given repressed inflation and a shortage of consumer goods. North Korea demanded a drastic increase of the minimum wage in April this year to $300 per month from $55, but eventually settled for a 5% increase. The GIC is more than symbolic to North Korea, given that it provides incomes to some 160,000 people, including 40,000 employees. Interviews with South Korean companies suggest that North Korean workers possess a sound work ethic and Confucian values, are well-educated and have significant potential for productivity enhancement. Exhibit B1: The GIC’s output is growing rapidly Exhibit B2: Investment in the GIC (In US$ million and in % of North Korea exports) (Investment in KRW billion)
0
50
100
150
200
250
300
2005 2006 2007 20080%
5%
10%
15%
20%
25%
In US$ million
In percent of total exports (RHS)
0
50
100
150
200
250
300
350
400
450
500
Private companies Government Land corporation KEPCO Korea Telecom
In KRW bn
Source: Ministry of Strategy and Finance, GS Global ECS Research.

Goldman Sachs Global Economics, Commodities and Strategy Research Global Economics Paper
Issue No: 188 1 3 September 21, 2009
Productivity gains and currency appreciation The experience of transition economies suggests that the North Korean economy could benefit substantially from productivity gains and currency appreciation once economic reforms take hold. The output of the Eastern European and CIS transition economies grew 6.2% per annum from trough levels, following large initial output losses following the collapse of the planned economy (see Exhibit 13). Asian transition economies performed considerably better, with average annual growth of 8.4% over 1992-2008, and without much of the initial output contraction. Productivity growth, not explained by investment and employment growth, accounted for nearly 40% of total growth over 1996-2006 in transition economies (IMF WP/07/164), indicating that a sizeable part of GDP growth in transition economies has come from better allocation of resources and a more efficient use of existing resources. To the extent that North Korea has already experienced output shocks following the dismantling of the Soviet Union, as we noted before, its growth performance under market economy reforms could resemble that of China, Vietnam and Mongolia, rather than the Eastern European and CIS countries. This puts North Korea’s growth potential conservatively at around 7%-8% per annum should North Korea pursue economic reforms and economic integration with South Korea. Exhibit 13: Output decline and recovery in transition economies
Trough year in
real GDP
Total declines since 1992
before recovery
Avg growth from the
trough year or 1992 to 2008
Real GDP in 2008
(1992=100)
Armenia 1993 -14.1% 8.8% 305
Azerbaijan 1995 -46.3% 12.1% 236
Belarus 1995 -27.6% 7.5% 185
Albania 1992 NM 6.4% 269
Georgia 1994 NM 6.5% 242
Kazakhstan 1995 -27.2% 6.6% 168
Kyrgyz Republic 1995 -34.2% 5.1% 125
Bulgaria 1997 -27.5% 5.2% 126
Moldova 1999 -41.9% 5.9% 98
Russia 1998 -29.2% 6.8% 137
Tajikistan 1996 -41.5% 7.3% 137
Turkmenistan 1997 -42.8% 14.1% 243
Ukraine 1999 -50.4% 6.8% 90
Uzbekistan 1995 -8.3% 5.3% 180
Czech Republic 1992 NM 3.2% 167
Slovak Republic 1993 NM 5.2% 229
Estonia 1994 -1.6% 6.2% 201
Latvia 1993 -11.4% 5.6% 201
Hungary 1993 -0.6% 3.6% 168
Lithuania 1994 -24.4% 5.9% 170
Croatia 1993 -8.0% 4.3% 172
Slovenia 1992 NM 4.3% 195
Macedonia, Former Yugo 1995 -10.2% 2.8% 129
Poland 1991 NM 4.5% 211
Romania 1992 NM 3.5% 173
Europan average -24.8% 6.1%China na NM 10.2% 470
Mongolia 1993 -3.0% 5.5% 217
Vietnam na NM 7.6% 323
Asian average -3.0% 7.8%Asian and European average -13.9% 6.9%
Memorandum item:
United States na NM 2.9% 159
North Korea 1988 NM 2.0% 98
South Korea na NM 5.0% 219 Source: IMF, GS Global ECS Research.
We estimate North Korea’s growth potential conservatively at around 7%-8% pa should it pursue integration with the South

Goldman Sachs Global Economics, Commodities and Strategy Research Global Economics Paper
Issue No: 188 1 4 September 21, 2009
The significant room for productivity gains is supported by our Growth Environment Scores (GES). Our analysis of GES for transition economies shows that the combination of high human capital and yet poor macro and political infrastructure elevates the growth potential for transition economies. In other words, they have a lot of latent potential that has yet to be unlocked if macro and political stability and investment follow through with reforms and integration with South Korea. In addition, we find that even allowing for improvements in the GES scores as transition occurs, transition economies seem to manage a reasonably lengthy spurt of additional growth over and above what their growth conditions alone would predict in our models (in China, Vietnam and, to a certain extent, in Russia). Presumably, this is because the organisation of resources is so poor that there is scope for relatively easy gains early, since income levels are much lower than the economy’s underlying human capital would normally suggest they should be. Furthermore, North Korea’s very low indicative GES score, together with a very high GES for South Korea (see Exhibit 14) point to a large upside potential as growth gains from improving GES tends to be higher for countries with lower incomes and lower GES (see “You reap what you sow”, Global Economics Paper, No: 148, our 2006 Growth Environment Scores). Exhibit 14: Growth Environment Scores for BRICs and N-11 (2008)*
0
1
2
3
4
5
6
7
8
9
South K
orea
China
Mexico
Brazil
Turkey
Vietnam
Russia
Phillphines Ira
nIndia
Indonesia
Egypt
Banglades
h
Pakistan
Nigeria
North K
orea
*The North Korea score is a tentative one, based on our estimates of the 13 GES indicators. Source: GS Global ECS Research. The experience of transition economies suggests also that the purchasing power of North Koreans, as measured by USD GDP, could grow much faster than real GDP. GDP in USD terms in transition economies increased, on average, tenfold over 15 years (see Exhibit 15), with 80% of the growth coming from real exchange rate appreciation (see Exhibit 16). The appreciation was particularly rapid for resource-rich countries: Kazakhstan, Azerbaijan, Russia and Mongolia took only 3-4 years to double their USD GDP. This largely reflects the fact that non-tradable goods prices in planned economies used to be heavily discounted as part of social policy, although the improvement in productivity in the tradable sector has also played a role in the real appreciation. In fact, data for North Korea point to significant room for relative price adjustment and real appreciation—relative prices for housing and transportation in North Korea compared with in South Korea are over 100 times cheaper than relative prices of rice and energy (see Exhibit 16).
Transition economies tend to have substantial growth potential
Past experience suggests that purchasing power could grow much faster than real GDP

Goldman Sachs Global Economics, Commodities and Strategy Research Global Economics Paper
Issue No: 188 1 5 September 21, 2009
Exhibit 15: Currencies in most transition economies strengthened more rapidly than output growth
Real Appreciation and Real GDP Growth: Transitional Economies (average per annum,1993-2006)
2523
19 18 18 1816
15 14 14 1312 12 11 11
9 9 9 8 8 7 6 6 5 43 2 2
7
3
5
43
1
1 5
-1
36
6
1
-1
3
1
53 3
03
1
8
54
10
35
-5
0
5
10
15
20
25
30
35
Armen
ia
Kazak
hstan
Turkmen
istan
Azerba
ijan
Lithu
ania
Russia
Tajikis
tanLa
tvia
Ukraine
Belarus
Georgi
a
Albania
Estonia
Moldov
a
Roman
ia
Bulgari
a
Slovak
Rep
Uzbek
istan
Czech
Kyrgyz
stan
Croatia
Maced
onia
Vietna
mPola
nd
Hunga
ryChin
aUSA
Korea
Real GDP
Real appreciation
%
Source: IMF, GS Global ECS Research. Exhibit 16: Real appreciation accounted for 80% of USD GDP growth in transition economies over 1993-2007
USD GDP Growth in Transition Economies
-18-11
-1 2 3 3 3 6 6 6 8 9 8 10 10
97
4640
14
-9-3
4 6
16 1611 11
20
21
-20
0
20
40
60
80
100
1993 1994 1995 1996 1997 1998 1999 2000 2001 2002 2003 2004 2005 2006 2007
Real Exchange Rate
Real GDP
Source: IMF, GS Global ECS Research. Exhibit 17: Price structures of North and South Korea differ widely
Item UnitSouth Korea (KRW;2008)
North Korea (NKW;2002)
PPP rates (KRW/NKW)
Electricity kwh 55 2.1 26
Diesel kl 1,465 38 39
Rice kg 2,705 43 63
Bus Fare 1 use 1,000 2.0 500
Subway fare 1 use 1,000 2.0 500
House rent 1/ m^2 19,697 2.0 9,848
House rent 2/ m^2 179,341 2.0 89,670
1/ Pyongyang for North Korea, and minimum nation- wide Apt prices for South K
2/ Pyongyang for North Korea, and average Seoul Apt prices for South Korea. Source: IMF and SNU (2009), GS Global ECS Research.

Goldman Sachs Global Economics, Commodities and Strategy Research Global Economics Paper
Issue No: 188 1 6 September 21, 2009
IV. A united Korea—the potential size of the economy Long-term projection for a united Korean economy We undertake a long-term projection to assess the potential upside of a united Korean economy. For the projection, we divide the integration process into three phases: the first as a transition period of 15 years (2013-2027) once the integration process has commenced, the second as a consolidation phase of 10 years (2028-2037), when growth in North Korea is likely to slow, and the third as a maturing phase (2038-2050) when the growth rates for the two should converge. It should be noted that the projection is highly indicative, given the lack of reliable economic data on North Korea, and the sensitivity of the outcomes to the modality and pace of inter-Korean integration. The following summarises our key assumptions and main findings: • Our projection assumes that North Korea’s real GDP could grow at 7% on
average during the first phase, towards the lower end of Asian transition economies’ performance, before slowing gradually thereafter to 2% by 2050. Over the whole projection period, this translates into an average growth rate of 5.5%—a conservative assumption, compared with the 7% growth rate used in a recent study by the Korea Tax Institute.
• We also assume that North Korea’s currency appreciates at the average pace
of other transition economies, that is, 11% per annum over 15 years. The real appreciation assumption differentiates our projection from those of other studies on inter-Korean integration, which do not explicitly factor in the scope for real appreciation.
• For South Korea, we assume a 0.3% increase in the trend growth, supported
by higher investment and economies of scale during integration. • Under these assumptions, the GDP of a united Korea in USD terms could
exceed those of France, Germany and Japan in 30-40 years (see Exhibit 18). Per capita income in North Korea could reach half of the South Korean level in 20 years after the start of integration (see Exhibit 19). The baseline long-term growth rates for South Korea and other countries used for comparison are from “The Expanding Middle: The exploding world middle class and falling global inequality”, Global Economics Paper No. 170, July 7, 2008.
Exhibit 18: The GDP (in USD terms) of a united Korea could exceed that of France, Japan and Germany in 30-40 years
1000
2000
3000
4000
5000
6000
7000
2012
2014
2016
2018
2020
2022
2024
2026
2028
2030
2032
2034
2036
2038
2040
2042
2044
2046
2048
2050
United Korea
Japan
Germany
France
Transition phase Consolidation phase Maturing phase
US$ bn (2007)
Source: GS Global ECS Research.
We project an average growth rate of 7% for North Korea…
…and an 11% pa currency appreciation over 15 years
USD GDP of a united Korea could exceed that of France, Germany and Japan in 30-40 years

Goldman Sachs Global Economics, Commodities and Strategy Research Global Economics Paper
Issue No: 188 1 7 September 21, 2009
Exhibit 19: United Korea—indicative long-term projections Real GDP Index (2008 trn KRW) yoy% (average per annum)
United Korea
South Korea
North Korea
United Korea
South Korea
North Korea
2010 1090 1062 28 2% 2% 1%
2015 1353 1317 35 4% 4% 5%
2020 1609 1559 49 4% 3% 7%
2025 1855 1786 69 3% 3% 7%
2030 2097 2001 96 2% 2% 7%
2035 2324 2197 128 2% 2% 6%
2040 2570 2405 165 2% 2% 5%
2045 2793 2600 193 2% 2% 3%
2050 3027 2812 215 2% 2% 2%
USDGDP (2007 USD bn) yoy% (average per annum)
United Korea
South Korea
North Korea
United Korea
South Korea
North Korea
2010 $943 $917 $26 -1% -1% 2%
2015 $1,643 $1,596 $47 12% 12% 12%
2020 $2,077 $1,964 $113 5% 4% 19%
2025 $2,574 $2,299 $274 4% 3% 19%
2030 $3,280 $2,645 $635 5% 3% 18%
2035 $4,176 $3,051 $1,125 5% 3% 12%
2040 $4,956 $3,448 $1,508 3% 2% 6%
2045 $5,519 $3,747 $1,772 2% 2% 3%
2050 $6,056 $4,073 $1,982 2% 2% 2%
Per capita income (2007 USD1000) Real appreciation yoy%United Korea
South Korea
North Korea
United Korea
South Korea
North Korea
2010 $13 $19 $1 -2% -3% 1%
2015 $22 $32 $2 7% 7% 7%
2020 $28 $40 $4 1% 1% 12%
2025 $34 $47 $10 1% 0% 12%
2030 $43 $54 $23 1% 1% 11%
2035 $55 $64 $40 1% 1% 6%
2040 $66 $74 $53 1% 1% 1%
2045 $76 $84 $62 0% 0% 0%
2050 $86 $96 $70 0% 0% 0%
Total population (mn) North/South ratio
United Korea
South Korea
(mn)
North Korea
(mn)
Population
per capita
income
USD GDP
2010 73 49 24 49% 6% 3%
2015 74 49 25 51% 6% 3%
2020 75 49 26 52% 11% 6%
2025 76 49 27 54% 22% 12%
2030 76 49 27 56% 43% 24%
2035 76 48 28 58% 63% 37%
2040 75 46 28 61% 72% 44%
2045 73 45 29 64% 74% 47%
2050 71 42 28 67% 72% 49% Source: Bank of Korea, UN, GS Global ECS Research. Growth potential of the mineral sector In order to check the validity of our baseline projections, we estimate growth potentials for North Korea’s mineral sector. The conceptual framework is to convert the mineral wealth to financial wealth and estimate three sources of income: the converted financial assets, their investment returns, and wage income from mineral extraction. This approach helps us overcome the inherent difficulties with a direct estimation of North Korea’s growth potential we highlighted earlier—notably the lack of basic data and high sensitivity of our projections to the timing and evolution of reforms and integration.

Goldman Sachs Global Economics, Commodities and Strategy Research Global Economics Paper
Issue No: 188 1 8 September 21, 2009
The estimation results support our baseline growth projections. Below is a summary of our key assumptions and main findings: • We break down the North Korean economy into a mineral sector and a non-
mineral sector, drawing on the 2008 GDP estimates by the Bank of Korea. We then take the net present value (NPV) of the known mineral wealth of North Korea (see Exhibit 10), equivalent to about 140 times 2008 GDP.
• We convert the mineral wealth to financial assets equivalent to its NPV.
This effectively means that North Korea sells the mineral wealth to strategic investors at the NPV price and invests the proceeds in long-term bonds.
• We assume 3% inflation-adjusted annual returns from the bonds through to
2050. We also assume that North Korea earns 15% of mined minerals as wages paid by strategic investors.
• We assume that the non-mineral sector will grow at 5% per annum and that
part of the financial assets, together with 3% coupons, are consumed each year, with the balance used up by 2050.
• We estimate North Korea’s income at 90% of our benchmark GDP
projection in 2050, should the assets be evenly used up, and at 96% if they are consumed incrementally at a constant pace (see Exhibit 20). These results indicate that our benchmark GDP projections are within a reasonable range.
Exhibit 20: North Korea’s mineral wealth could provide sizeable income in the long run
0
50
100
150
200
250
2012
2014
2016
2018
2020
2022
2024
2026
2028
2030
2032
2034
2036
2038
2040
2042
2044
2046
2048
2050
0
50
100
150
200
250
Mineral sector income under even use of mineral wealth
Non-mineral sector income
Total Incomes under incremental use of mineral wealth
Benchmark GDP projections
W trillion (2008) W trillion (2008)
Source: Korea Resources Corporation, GS Global ECS Research.

Goldman Sachs Global Economics, Commodities and Strategy Research Global Economics Paper
Issue No: 188 1 9 September 21, 2009
V. Integration costs and policy options Cost estimates for inter-Korean integration vary widely from 2% to 25% of GDP per annum, depending on the speed of integration and policy assumptions. The most expensive option for South Korea would be the German-style of unification, where South Korea would need to provide large income subsidies to North Korea. Fiscal transfers in the case of Germany were 3.6%-4.6% of GDP a year over 1991-1999 (Swiss Institute for Business Cycle Research 2004). This option would be prohibitively expensive in the case of Korea, given the relatively large difference in incomes (North Korea’s per capita income is 6% of South Korea’s as opposed to 33% in the German case) and small population gap (North at 48% of South Korea’s population versus 27% in the German case) between North and South Korea (IMF 1997) (see Exhibit 21). The least expensive option would be a China/Hong Kong-style integration, which allows two economic and political systems to coexist in a country with limited inter-Korean migration. The post-integration growth performance of China-Hong Kong was better than Germany’s, further bolstering the case for gradual integration (see Exhibit 22). Exhibit 23 shows a survey of the literature on inter-Korean integration costs.
Exhibit 22: Economic growth of two integration economies
Before Integration After(-5 to -1 year) (1 to 5 years) (6 to 10 years)
East Germany 2.7 1.4 1.9
West Germany 2.3 -0.5 1.8
Hong Kong 4.9 1.4 6.4
China 12.4 8.2 10.6 Source: Bank of Korea (2009). Exhibit 23: Inter-Korean integration costs—survey of literature
SourcesResearch
yearIntegration
period Costs Note
Korea Development Institute 1993 2000-2010 $286bn German style unification
Korea Development Institute 1994 2000 $1000bn German style unification
Korea Development Bank 1994 1994-2004 $805bn
German style unification
(60% income differential)
Korea Development Institute 1997 1995-2005
9-11% of GDP for the first
5 years;7.5% of GDP for
the second 5 years 50% income differential
FitchRatings 2003
Over 10-15
years $15-20bn per year
Rand Institute 2005 Over 5 years $50bn-$670bn
To double North Korea
GDP within 4-5 years
Samsung Economics Research 2005 2015 $546bn
safety net and
industrialization
Bank of Korea 2007
Over 13-39
years
German style: $500-900bn
over 22-39 years;
Economic zone style: $300-
500bn over 13-22 years
To reach North Korea's
per-capita income of
$10,000
Source: Korea Tax Institute (2008), GS Global ECS Research.
Exhibit 21: Selected indicators of North and South Korea 1994 2008 1989
North South N/S North South N/SEast Ger
West Ger
E/W
Population (million) 23.0 44.5 51.7% 23.3 48.5 48.0% 16.7 61.4 27.2%
Per capital income (US$) 923 10076 9.2% 1064 19231 5.5% 12700 38500 33.0%
Gross National Income (US$b 21.2 448.4 4.7% 24.9 928.7 2.7% 212 2364 9.0%
External trade (% of GNI) 9.9 52.5 18.9% 15.4 92.3 16.6% 50 80.9 61.8%
Exports ($ bn) 0.9 96 0.9% 1.1 422 0.3% n.a. n.a. n.a.
Exchange rate against USD 2.16 802 0.3% 130 1100 11.8% n.a. n.a. n.a.
Government budget (US$ bn) n.a. 88.3 n.a. 3.5 212.6 1.6% 46.5 78.7 59.1%
Source: Bank of Korea, IMF, OECD.
A China/Hong Kong-style integration, where two economic and political systems coexist, would be the least expensive option

Goldman Sachs Global Economics, Commodities and Strategy Research Global Economics Paper
Issue No: 188 2 0 September 21, 2009
A decade of inter-Korean dialogue suggests that gradual integration similar to the pattern followed in China-Hong Kong, rather than an instant German-style unification, is the most likely integration scenario. After South Korea’s engagement policy towards North Korea over the past decade, the two sides have recognised the commonality between South Korea’s proposals for a confederation and the North’s proposal for a low-level federation, which in turn has led to an agreement to pursue national unification along these lines (Joint Declaration of June 15, 2000). This has, in our view, laid the foundations for a peaceful and gradual integration of the two sides, although follow-through has been bumpy, in part due to the North’s nuclear tests in violation of a joint declaration on denuclearisation (1991). Notwithstanding the change in leadership in South Korea in late 2007 and a hardening of North Korea’s stance thereafter, we believe that there persists a spirit of reconciliation, cooperation and unification based on mutual respect and trust. The political backdrop in the region is also supportive of peaceful and gradual integration, in our view. A strong, united stance of neighbouring countries on the nuclear issue is likely to lead to a lasting and comprehensive solution of North Korea risks. A recent change in the political leadership in Japan could support a negotiated solution by providing the prospects of improved Japan-North Korea relations and international financial assistance. We believe that the integration costs of South and North Korea could be reduced to an affordable level, if backed by appropriate polices. Our projections above show that North Korea’s per capita income could reach half that of South Korea about 20 years after the onset of integration, through sizeable currency appreciation as well as rapid GDP growth in North Korea. The maintenance of a flexible exchange regime in North Korea would help achieve this without inducing inflation-driven appreciation, as would typically be the case under an exchange rate peg. We estimate that output growth and currency appreciation under the flexible rate regime, together with annual transfers of 1% of GDP from the South, could shorten the time needed to reach half the income level of South Korea to 13 years (see Exhibit 24). Other important economic policies in North Korea would include: a monetary policy that promotes price stability, fiscal policy focusing on infrastructure development and a social safety net, and structural reforms to help free up resources for lasting growth and foster sound and efficient financial intermediation. Given the importance of the mining sector for investment and job growth in North Korea, the introduction of transparent and sustainable investment schemes for mineral resources would be one of most critical factors for success. Exhibit 24: Illustrative scenario of a North-South income convergence (Number of years for North Korea’s per-capita income to reach half of the South Korea level)
41
21
13
0
5
10
15
20
25
30
35
40
45
Case I Case II Case III
Case I: North Korea's output is growing 6% points faster thanSouth
Case II: Case I and the North Korean currency is appreciating6% faster than the South currency
Case III: North is growing 3% points faster than South, and theNorth currency appreciating 5% faster than the South currencyplus annual transfers of 1% of South Korean GDP to NorthKorea
Source: Bank of Korea, GS Global ECS Research.
A decade of inter-Korean dialogue suggests that gradual integration is the most likely scenario
We believe that the integration costs are affordable if backed by appropriate polices

Goldman Sachs Global Economics, Commodities and Strategy Research Global Economics Paper
Issue No: 188 2 1 September 21, 2009
References Bank of Korea, Study of Inter-Korea Integration after unification: case studies (in Korean), by Sungmin Moon and Woosik Moon, 2009. Bank of Korea, Study of Changes in the North Korea economy through North Korean refugees (in Korean), by Young Hoon Lee, 2007. Congressional Research Service, North Korea: Economic Leverage and Policy Analysis, by Dick K Nanto and Emma Chanlett-Avery, August 2009. Fitch Ratings, South Korea: A Risk Update, May 2003. Goldman Sachs, North Korea: Tensions and implications, Korea Views, July 17, 2009. Goldman Sachs, Our 2008 GES Scores: More Progress, But Challenges Lie Ahead, Global Viewpoint, No 08/31, December 19, 2008. Goldman Sachs, The Expanding Middle: The Exploding World Middle Class and Falling Global Inequality, Global Economics Paper No.170, July 7, 2008. Goldman Sachs, The N-11: More Than an Acronym, Global Economics Paper No. 153, March 28, 2007. Goldman Sachs, You Reap What You Sow: Our 2006 Growth Environment Scores (GES), Global Economics Paper No. 148, November 8, 2006. Hyundai Research Institute, Recent Trend in Development of North Korea’s Mineral Resources and the Implications (in Korean), by Haejung Lee, 2009. IMF, Rapid Growth in Transition Economies: Growth Accounting Approach, by Garbis Iradian, IMF working paper/07/164, 2007. IMF, Experiences with monetary integration and lessons for Korean unification, Goohoon Kwon, IMF WP/1997/65. IMF and Seoul National University (SNU), Financial Sector Reform in Transition Economies: Implications for North Korea, edited by Byung-Yeon Kim and Cheng Hoon Lim, “Currency conversion during the period of transition: The Case of North Korea”, by Youngseop Rhee, 2009. Korea Tax Institute, South-North Korea economic integration and fiscal policy (in Korean), by Joon ook Choi, 2008. North Korean Economy Forum, A Study on the Modern North Korea Economy (in Korean), 2005. Rand, National Defense Research Institute, North Korean Paradoxes—Circumstance, Costs and Consequences of Korean Unification, by Charles Wolf, 2005. Swiss Institute for Business Cycle Research, Despite or Because?—Some Lessons of German Unification for EU Enlargement, by Ulrich Busch and Christian Muller, April 2004. United Nations, World Population Prospects, The 2008 Revision.
Goldman Sachs Global Economics, Commodities and Strategy Research Global Economics Paper
Issue No: 188 2 2 September 21, 2009
Recent Global Economic Papers Paper No. Title Date Author
187 India CAN Afford Its Massive Infrastructure Needs 16-Sep-2009 Tushar Poddar
186 The way forward for Europe post-crisis 28-Jul-2009 Erik F. Nielsen
185 The Savings Glut, the Return on Capital and the Rise in Risk Aversion
27-May-2009 Kevin Daly Ben Broadbent
184 Italy: The reality is better than you think 2-Apr-2009 Natacha Valla
183 Forecasting Gold as a Commodity 25-Mar-2009 David Greely Jeffrey Currie
182 Finding ‘Fair Value’ in Global Equities: Part II—Forecasting Returns
23-Mar-2009 Peter Oppenheimer Anders Nielsen Kevin Daly
181 Some Advice for the G20 20-Mar-2009 Jim O’Neill
180 The Outlook for the Dollar in the Next Decade 17-Feb-2009 Jim O’Neill
179 Finding ‘Fair Value’ in Global Equities: Part I 6-Feb-2009 Jim O’Neill Peter Oppenheimer Kathy Matsui Tim Moe, David Kostin Dominic Wilson
178 Help Wanted! A Spender of Last Resort 22-Jan-2009 Edward F. McKelvey Jan Hatzius Alec Phillips
177 Home Prices and Credit Losses: Projections and Policy Options
13-Jan-2009 Jan Hatzius Michael A. Marschoun
176 Time to Formalise the ECB’s Financial Stability Mandate 23-Oct-2008 Natacha Valla Javier Pérez de Azpillaga
175 With or without EU: Turkey’s Long-term Growth Potential 17-Oct-2008 Ahmet Akarli Pragyan Deb
174 A Small Price to Pay: Financing Africa’s Infrastructure Bill 14-Oct-2008 Dambisa Moyo
173 New EU Member States—A Fifth BRIC? 26-Sep-2008 István Zsoldos Anna Zadornova
172 In Urgent Need of a Comprehensive EU Energy Policy 12-Sep-2008 Erik F. Nielsen
171 Who Needs a Fixed Exchange Rate These Days? 10-Jul-2008 Jens Nordvig Raluca Dragusanu
170 The Expanding Middle: The Exploding World Middle Class and Falling Global Inequality
7-Jul-2008 Dominic Wilson Raluca Dragusanu

Goldman Sachs Global Economics, Commodities and Strategy Research Global Economics Paper
Issue No: 188 2 3 September 21, 2009
Asia cont'd Global Markets Research Jan Hatzius~ 1(212)902-0394 Asia-Pacific Portfolio Strategy Research Dominic Wilson~ 1(212)902-5924Dominic Wilson~ 1(212)902-5924 Timothy Moe~ 852()2978-1328 Francesco Garzarelli~ 44(20)7774-5078
Thomas Deng~ 852()2978-1062Kinger Lau# 852()2978-1224 Global Macro Research
Edward McKelvey* 1(212)902-3393 Stephanie Leung# 852()2978-0106 Peter Berezin* 1(212)902-8763Alec Phillips* 1(202)637-3746 Richard Tang^ 852()2978-0722 Anna Stupnytska# 44(20)7774-5061Andrew Tilton* 1(212)357-2619 Alex Kelston^ 1(212)855-0684David Kelley^ 1(212)902-3053 Japan Portfolio Strategy Research
Hiromi Suzuki* 81(3)6437-9955 FX ResearchLatin America Economics Research Themistoklis Fiotakis* 44(20)7552-2901Paulo Leme~ 1(305)755-1038 Pan-Asia Strategy Derivatives Research Fiona Lake* 852()2978-6088Luis Cezario* 55(11)3371-0778 Christopher Eoyang~ 852()2978-0800 Thomas Stolper* 44(20)7774-5183Alberto Ramos* 1(212)357-5768 Kenneth Kok* 852()2978-0960 Mark Tan# 1(212)357-7621Malachy Meechan# 1(212)357-5772 Sam Gellman# 852()2978-1631
Jason Lui 852()2978-6613 Fixed Income ResearchUS Portfolio Strategy Research Michael Vaknin* 44(20)7774-1386David Kostin~ 1(212)902-6781 Swarnali Ahmed^ 44(20)7051-4009Nicole Fox# 1(212)357-1744 Europe, Middle East and AfricaCaesar Maasry# 1(212)902-9693 Peter Oppenheimer~ 44(20)7552-5782 Macro Equity ResearchAmanda Sneider# 1(212)357-9860 Erik F. Nielsen~ 44(20)7774-1749 Noah Weisberger~ 1(212)357-6261
Roman Maranets* 1(212)357-6107US Credit Strategy Research Economics Research Aleksandar Timcenko* 1(212)357-7628Charles Himmelberg~ 1(917)343-3218 Ben Broadbent~ 44(20)7552-1347 Kamakshya Trivedi* 44(20)7051-4005Alberto Gallo* 1(917)343-3214 Rory MacFarquhar~ 7(495)645-4010Lotfi Karoui# 1(917)343-1548 Ahmet Akarli* 44(20)7051-1875Annie Chu^ 1(212)357-5522 Kevin Daly* 44(20)7774-5908 Commodities Research
Javier Perez de Azpillaga* 44(20)7774-5205 Jeffrey Currie~ 44(20)7774-6112Asia Dirk Schumacher* 49(69)7532-1210Kathy Matsui~ 81(3)6437-9950 Natacha Valla* 33(1)4212-1343 Energy
Anna Zadornova# 44(20)7774-1163 Samantha Dart* 44(20)7552-9350Asia-Pacific Economics Research Nick Kojucharov^ 44(20)7774-1169Michael Buchanan~ 852()2978-1802 Adrian Paul 44(20)7552-5748 Non-EnergyEnoch Fung* 852()2978-0784 Jonathan Pinder 44(20)7774-1137 Janet Kong~ 852()2978-6128Goohoon Kwon* 82(2)3788-1775 John Baumgartner# 1(212)902-3307Tushar Poddar* 91(22)6616-9042Helen (Hong) Qiao* 852()2978-1630 Portfolio Strategy Research Commodity StrategyPranjul Bhandari# 852()2978-2676 Sharon Bell* 44(20)7552-1341 Allison Nathan~ 1(212)357-7504Keun Myung Kim# 82(2)3788-1726 Jessica Binder* 44(20)7051-0460 David Greely* 1(212)902-2850Yu Song# 852()2978-1260 Gerald Moser# 44(20)7774-5725 Damien Courvalin# 44(20)7051-4092Shirla Sum^ 852()2978-6634 Stefan Wieler# 44(20)7051-5119Professor Song Guoqing 86(10)6627-3021 44(20)7774-1714
Anders Nielsen# 44(20)7552-3000 AdministrationJapan Economics Research Matthieu Walterspiler^ 44(20)7552-1904 Lewis Segal~ 1(212)357-4322Tetsufumi Yamakawa~ 81(3)6437-9960 Linda Britten* 44(20)7774-1165Chiwoong Lee* 81(3)6437-9984 Paul O'Connell* 44(20)7774-1107Yuriko Tanaka* 81(3)6437-9964 Loretta Sunnucks* 44(20)7774-3223
AdvisorsWillem Buiter 44(20)7774-2731
~MD * VP/ED #Associate ^Research Assistant/Analyst Email: [email protected]
Christian Mueller-Glissmann#
Goldman Sachs Global Economics, Commodities and Strategy ResearchJim O'Neill~ - Global Head 44(20)7774-2699
Americas
US Economics Research

Goldman Sachs Research personnel may be contacted by electronic mail through the Internet at [email protected]
Copyright 2009 The Goldman Sachs Group, Inc. All rights reserved. This material should not be construed as an offer to sell or the solicitation of an offer to buy any security in any jurisdiction where such an offer or solicitation would be illegal. We are not soliciting any action based on this material. It is for the general information of clients of The Goldman Sachs Group, Inc. It does not constitute a personal recommendation or take into account the particular investment objectives, financial situations, or needs of individual clients. Before acting on any advice or recommendation in this material, clients should consider whether it is suitable for their particular circumstances and, if necessary, seek professional advice. The price and value of the investments referred to in this material and the income from them may go down as well as up, and investors may realize losses on any investments. Past performance is not a guide to future performance. Future returns are not guaranteed, and a loss of original capital may occur. The Goldman Sachs Group, Inc. does not provide tax advice to its clients, and all investors are strongly advised to consult with their tax advisers regarding any potential investment. Certain transactions - including those involving futures, options, and other derivatives as well as non-investment-grade securities - give rise to substantial risk and are not suitable for all investors. The material is based on information that we consider reliable, but we do not represent that it is accurate or complete, and it should not be relied on as such. Opinions expressed are our current opinions as of the date appearing on this material only. We endeavor to update on a reasonable basis the information discussed in this material, but regulatory, compliance, or other reasons may prevent us from doing so. We and our affiliates, officers, directors, and employees, including persons involved in the preparation or issuance of this material, may from time to time have “long” or “short” positions in, act as principal in, and buy or sell the securities or derivatives (including options) thereof of companies mentioned herein. For purposes of calculating whether The Goldman Sachs Group, Inc. beneficially owns or controls, including having the right to vote for directors, 1% of more of a class of the common equity security of the subject issuer of a research report, The Goldman Sachs Group, Inc. includes all derivatives that, by their terms, give a right to acquire the common equity security within 60 days through the conversion or exercise of a warrant, option, or other right but does not aggregate accounts managed by Goldman Sachs Asset Management. No part of this material may be (i) copied, photocopied, or duplicated in any form by any means or (ii) redistributed without The Goldman Sachs Group, Inc.’s prior written consent. The Global Investment Research Division of Goldman Sachs produces and distributes research products for clients of Goldman Sachs, and pursuant to certain contractual arrangements, on a global basis. Analysts based in Goldman Sachs offices around the world produce equity research on industries and companies, and research on macroeconomics, currencies, commodities and portfolio strategy. This research is disseminated in Australia by Goldman Sachs JBWere Pty Ltd (ABN 21 006 797 897) on behalf of Goldman Sachs; in Canada by Goldman Sachs Canada Inc. regarding Canadian equities and by Goldman Sachs & Co. (all other research); in Germany by Goldman Sachs & Co. oHG; in Hong Kong by Goldman Sachs (Asia) L.L.C.; in India by Goldman Sachs (India) Securities Private Ltd.; in Japan by Goldman Sachs Japan Co., Ltd, in the Republic of Korea by Goldman Sachs (Asia) L.L.C., Seoul Branch; in New Zealand by Goldman Sachs JBWere (NZ) Limited on behalf of Goldman Sachs; in Singapore by Goldman Sachs (Singapore) Pte. (Company Number: 198602165W); and in the United States of America by Goldman, Sachs & Co. Goldman Sachs International has approved this research in connection with its distribution in the United Kingdom and European Union.This material has been issued by The Goldman Sachs Group, Inc. and/or one of its affiliates and has been approved for the purposes of section 21 of the Financial Services and Markets Act 2000 by Goldman Sachs International, which is regulated by the Financial Services Authority, in connection with its distribution in the United Kingdom, and by Goldman Sachs Canada, in connection with its distribution in Canada. Goldman Sachs International and its non-US affiliates may, to the extent permitted under applicable law, have acted on or used this research, to the extent that it relates to non-US issuers, prior to or immediately following its publication. Foreign-currency-denominated securities are subject to fluctuations in exchange rates that could have an adverse effect on the value or price of, or income derived from, the investment. In addition, investors in securities such as ADRs, the values of which are influenced by foreign currencies, effectively assume currency risk. In addition, options involve risk and are not suitable for all investors. Please ensure that you have read and understood the current options disclosure document before entering into any options transactions. Further information on any of the securities mentioned in this material may be obtained on request, and for this purpose, persons in Hong Kong should contact Goldman Sachs (Asia) L.L.C. at 2 Queen’s Road Central; persons in Australia should contact Goldman Sachs JBWere Pty Ltd. (ABN 21 006 797 897), and persons in New Zealand should contact Goldman Sachs JBWere (NZ) Ltd. Persons who would be categorized as retail clients in the United Kingdom, as such term is defined in the rules of the Financial Services Authority, should read this material in conjunction with the last published reports on the companies mentioned herein and should refer to the risk warnings that have been sent to them by Goldman Sachs International. A copy of these risk warnings is available from the offices of Goldman Sachs International on request. A glossary of certain of the financial terms used in this material is also available on request. Derivatives research is not suitable for retail clients. Unless governing law permits otherwise, you must contact a Goldman Sachs entity in your home jurisdiction if you want to use our services in effecting a transaction in the securities mentioned in this material.
GOLDMAN SACHS GLOBAL RESEARCH CENTRES
New York Goldman Sachs & Co. New York Plaza, 45th Floor New York, New York 10004, USA Tel: +1 212 902 1000 Washington Goldman Sachs & Co. 101 Constitution Ave, NW Suite 1000 East Washington, DC 20001 Tel: +1 202 637 3700 London Goldman Sachs International Peterborough Court 133 Fleet Street London, EC4A 2BB, England Tel: +44 (0)20 7774 1000 Frankfurt Goldman Sachs & Co. oHG MesseTurm D-60308 Frankfurt am Main, Germany Tel: +49 (0)69 7532 1000 Moscow Goldman Sachs OOO 14th floor, Ducat III 6, Gasheka Street Moscow 125047 Russian Federation Tel: +7-495-645-4000 Paris Goldman Sachs Inc et Cie 2, rue de Thann 75017 Paris, France Tel: +33 (0)1 4212 1341 Hong Kong Goldman Sachs (Asia) L.L.C. Cheung Kong Center, 68th Floor 2 Queen’s Road Central Hong Kong Tel: +852 2978 1000 Tokyo Goldman Sachs Japan Co, Ltd. Roppongi Hills Mori Tower 47th Floor, 10-1, Roppongi 6-chome Minato-ku, Tokyo 106-6147, Japan Tel: +81 (0)3 6437 9960 Singapore Goldman Sachs (Singapore) Pte. 1 Raffles Link, #07-01 South Lobby, Singapore 039393 Tel: +65 6889 1000 South Africa Goldman Sachs International 13th Floor, The Forum 2 Maude Street Sandton 2196 South Africa Tel: 27-11-303-2700