Embed Size (px)
Citation preview

Putnam Focused International Equity Fund*
FUND SYMBOL CLASS A
PEQUX
Annual report 10 | 31 | 21
Blend funds invest opportunistically in a variety of stocks, such as growth stocks and value stocks.
* Prior to April 1, 2021, the fund was known as Putnam Global Equity Fund.
Putnam Focused International Equity FundAnnual report 10 | 31 | 21
Message from the Trustees 1
Interview with your fund’s portfolio manager 4
Your fund’s performance 9
Your fund’s expenses 12
Consider these risks before investing 14
Terms and definitions 15
Other information for shareholders 17
Important notice regarding Putnam’s privacy policy 18
Trustee approval of management contract 19
Audited financial statements 24
Report of Independent Registered Public Accounting Firm 25
Federal tax information 49
Shareholder meeting results 49
About the Trustees 50
Officers 52

December 8, 2021
Dear Fellow Shareholder:
In 2021, the stock market had another above-average year. Corporate earnings rose as the economy reopened and stimulus policies helped increase demand. Bonds, on the other hand, had a subpar year amid higher inflation. To respond to inflation risk, in part, the U.S. Federal Reserve has begun to reduce its monthly asset purchases, a program put in place during the Covid-19 pandemic.
Changes and opportunities lie ahead. In November, Congress passed the bipartisan Infrastructure Investment and Jobs Act. It will increase funding for roads, ports, rail, and other projects in the coming decade.
As companies continue to adapt to the pandemic, many of them face new challenges, like rebuilding supply chains, hiring workers, and addressing climate risk. Amid all of it, Putnam’s researchers will be actively looking for potential investments to meet the goals of your fund.
Thank you for investing with Putnam.
Respectfully yours,
Robert L. ReynoldsPresident and Chief Executive OfficerPutnam Investments
Kenneth R. LeiblerChair, Board of Trustees
Message from the Trustees
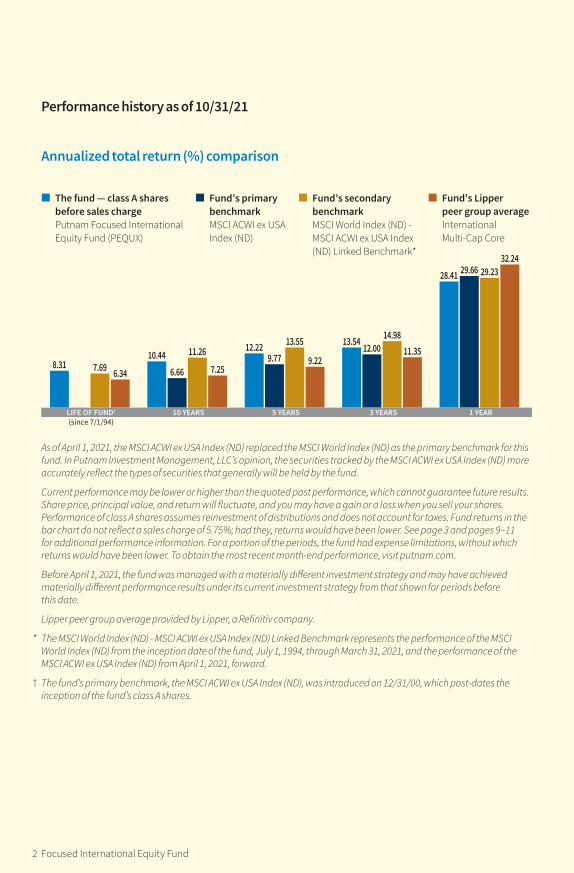
Performance history as of 10/31/21
Annualized total return (%) comparison
LIFE OF FUND†
(since 7/1/94)10 YEARS 5 YEARS 3 YEARS 1 YEAR
8.31 7.69 6.34
10.446.66
11.26
7.25
12.229.77
13.55
9.22
13.54 12.0014.98
11.35
28.41 29.66 29.2332.24
The fund — class A sharesbefore sales chargePutnam Focused International Equity Fund (PEQUX)
Fund’s primary benchmarkMSCI ACWI ex USA Index (ND)
Fund’s secondary benchmarkMSCI World Index (ND) -MSCI ACWI ex USA Index (ND) Linked Benchmark*
Fund’s Lipper peer group averageInternational Multi-Cap Core
As of April 1, 2021, the MSCI ACWI ex USA Index (ND) replaced the MSCI World Index (ND) as the primary benchmark for this fund. In Putnam Investment Management, LLC’s opinion, the securities tracked by the MSCI ACWI ex USA Index (ND) more accurately reflect the types of securities that generally will be held by the fund.
Current performance may be lower or higher than the quoted past performance, which cannot guarantee future results. Share price, principal value, and return will fluctuate, and you may have a gain or a loss when you sell your shares. Performance of class A shares assumes reinvestment of distributions and does not account for taxes. Fund returns in the bar chart do not reflect a sales charge of 5.75%; had they, returns would have been lower. See page 3 and pages 9–11 for additional performance information. For a portion of the periods, the fund had expense limitations, without which returns would have been lower. To obtain the most recent month-end performance, visit putnam.com.
Before April 1, 2021, the fund was managed with a materially different investment strategy and may have achieved materially different performance results under its current investment strategy from that shown for periods before this date.
Lipper peer group average provided by Lipper, a Refinitiv company.
* The MSCI World Index (ND) - MSCI ACWI ex USA Index (ND) Linked Benchmark represents the performance of the MSCI World Index (ND) from the inception date of the fund, July 1, 1994, through March 31, 2021, and the performance of the MSCI ACWI ex USA Index (ND) from April 1, 2021, forward.
† The fund’s primary benchmark, the MSCI ACWI ex USA Index (ND), was introduced on 12/31/00, which post-dates the inception of the fund’s class A shares.
2 Focused International Equity Fund

Performance history as of 10/31/21
Annualized total return (%) comparison
LIFE OF FUND†
(since 7/1/94)10 YEARS 5 YEARS 3 YEARS 1 YEAR
8.31 7.69 6.34
10.446.66
11.26
7.25
12.229.77
13.55
9.22
13.54 12.0014.98
11.35
28.41 29.66 29.2332.24
The fund — class A sharesbefore sales chargePutnam Focused International Equity Fund (PEQUX)
Fund’s primary benchmarkMSCI ACWI ex USA Index (ND)
Fund’s secondary benchmarkMSCI World Index (ND) -MSCI ACWI ex USA Index (ND) Linked Benchmark*
Fund’s Lipper peer group averageInternational Multi-Cap Core
As of April 1, 2021, the MSCI ACWI ex USA Index (ND) replaced the MSCI World Index (ND) as the primary benchmark for this fund. In Putnam Investment Management, LLC’s opinion, the securities tracked by the MSCI ACWI ex USA Index (ND) more accurately reflect the types of securities that generally will be held by the fund.
Current performance may be lower or higher than the quoted past performance, which cannot guarantee future results. Share price, principal value, and return will fluctuate, and you may have a gain or a loss when you sell your shares. Performance of class A shares assumes reinvestment of distributions and does not account for taxes. Fund returns in the bar chart do not reflect a sales charge of 5.75%; had they, returns would have been lower. See page 3 and pages 9–11 for additional performance information. For a portion of the periods, the fund had expense limitations, without which returns would have been lower. To obtain the most recent month-end performance, visit putnam.com.
Before April 1, 2021, the fund was managed with a materially different investment strategy and may have achieved materially different performance results under its current investment strategy from that shown for periods before this date.
Lipper peer group average provided by Lipper, a Refinitiv company.
* The MSCI World Index (ND) - MSCI ACWI ex USA Index (ND) Linked Benchmark represents the performance of the MSCI World Index (ND) from the inception date of the fund, July 1, 1994, through March 31, 2021, and the performance of the MSCI ACWI ex USA Index (ND) from April 1, 2021, forward.
† The fund’s primary benchmark, the MSCI ACWI ex USA Index (ND), was introduced on 12/31/00, which post-dates the inception of the fund’s class A shares.
Recent broad market index and fund performance
42.91%
29.66%
29.23%
28.41%
0.06%
–0.48%
U.S. stocks (S&P 500 Index)
Fund’s primary benchmark (MSCI ACWI ex USA Index (ND))
Fund’s secondary benchmark (MSCI World Index (ND) - MSCI ACWI ex USA Index (ND) Linked Benchmark)
Putnam Focused International Equity Fund (class A shares before sales charge)
Cash (ICE BofA U.S. 3-Month Treasury Bill Index)
U.S. bonds (Bloomberg U.S. Aggregate Bond Index)
This comparison shows your fund’s performance in the context of broad market indexes for the 12 months ended 10/31/21. See page 2 and pages 9–11 for additional fund performance information. Index descriptions can be found on pages 15–16.
All Bloomberg indices provided by Bloomberg Index Services Limited.
Focused International Equity Fund 3
Interview with your fund’s portfolio manager
Spencer Morgan, CFAPortfolio Manager
Spencer has a B.S. in Business Administration from Boston University. He joined Putnam in 2010 and has been in the investment industry since 2009.
Karan S. Sodhi, CFAPortfolio Manager
Karan has an M.B.A. from Indiana University and a B.A. from Hendrix College. He first served at Putnam from 2000 to 2007 and rejoined the firm in 2010. Karan has been in the investment industry since 1998.
Spencer, can you describe the investing environment for the reporting period?Record monetary and fiscal stimulus, distribution of the world’s first Covid-19 vaccines, and pent-up consumer demand helped fuel a global economic recovery during the period. Stocks advanced despite periodic headwinds, including concerns over a resur-gence in Covid-19 cases from the Delta variant, a regulatory crackdown in China, and rising inflation. The fund’s primary benchmark, the MSCI ACWI ex USA Index [ND], which represents stocks in non-U.S. developed and emerging markets, posted a return of 29.66% for the 12-month reporting period.
During the reporting period, the fund’s name changed. Can you describe any other material changes?As of April 1, 2021, Putnam Focused International Equity Fund, formerly known as Putnam Global Equity Fund, shifted its focus to investments outside the United States. At the same time, Karan Sodhi and I were named Portfolio Managers of the fund. Our goal is to find excellent companies at attractive prices and own them for the long term. Through intensive fundamental research, we look
Spencer Morgan discusses the investing environment and fund performance for the 12 months ended October 31, 2021, and offers his outlook for the fund.
Interview with your fund’s portfolio manager
4 Focused International Equity Fund
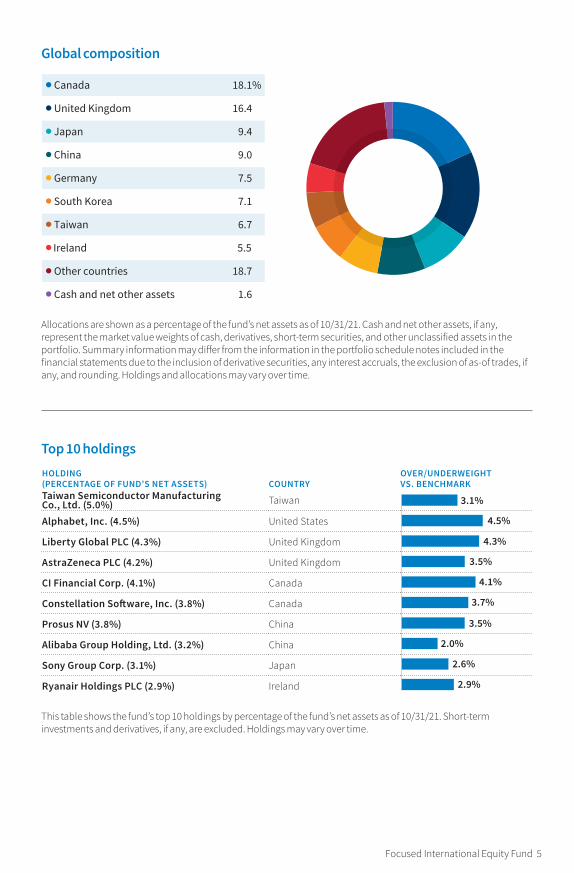
Top 10 holdingsHOLDING (PERCENTAGE OF FUND’S NET ASSETS)
COUNTRY
OVER/UNDERWEIGHT VS. BENCHMARK
Taiwan Semiconductor Manufacturing Co., Ltd. (5.0%) Taiwan
Alphabet, Inc. (4.5%) United States
Liberty Global PLC (4.3%) United Kingdom
AstraZeneca PLC (4.2%) United Kingdom
CI Financial Corp. (4.1%) Canada
Constellation Software, Inc. (3.8%) Canada
Prosus NV (3.8%) China
Alibaba Group Holding, Ltd. (3.2%) China
Sony Group Corp. (3.1%) Japan
Ryanair Holdings PLC (2.9%) Ireland 2.9%
3.1%
4.5%
4.3%
3.5%
3.7%
3.5%
2.0%
2.6%
4.1%
This table shows the fund’s top 10 holdings by percentage of the fund’s net assets as of 10/31/21. Short-term investments and derivatives, if any, are excluded. Holdings may vary over time.
Global composition
Canada 18.1%
United Kingdom 16.4
Japan 9.4
China 9.0
Germany 7.5
South Korea 7.1
Taiwan 6.7
Ireland 5.5
Other countries 18.7
Cash and net other assets 1.6
Allocations are shown as a percentage of the fund’s net assets as of 10/31/21. Cash and net other assets, if any, represent the market value weights of cash, derivatives, short-term securities, and other unclassified assets in the portfolio. Summary information may differ from the information in the portfolio schedule notes included in the financial statements due to the inclusion of derivative securities, any interest accruals, the exclusion of as-of trades, if any, and rounding. Holdings and allocations may vary over time.
Focused International Equity Fund 5

for companies with wide moats, high and sustainable returns on capital, low debt, strong management teams, and a low price-to-intrinsic value. While our stock universe is broad, the fund’s focused portfolio has less than 40 holdings, representing our strongest convictions.
How did the fund perform for the reporting period?The fund’s class A shares returned 28.41%, underperforming its primary benchmark, the MSCI ACWI ex USA Index [ND]. From the time the fund was repositioned on April 1, 2021, through October 31, 2021, the fund returned 5.41%, outperforming its primary benchmark, which returned 3.87%.
What were some top contributors to fund performance for the reporting period?Kakao, a South Korean internet company, was the fund’s top performer. When we purchased the stock, we believed the company would achieve significant upside from monetizing its mobile messaging application Kakao Talk. After Kakao’s stock appreciated by more than 50%, we felt the gap between its price and intrinsic value had converged. We sold our position before period-end.
CI Financial, a Canadian asset manager, also performed well. The company’s assets under management grew 18% and its wealth manage-ment assets nearly tripled to $159 billion year-over-year in the second quarter of 2021. Per share growth rates rose even higher, as CI Financial’s management team repurchased 7% of its shares outstanding over the previous four quarters. We continue to believe the stock is undervalued, and it remains in our portfolio.
Alphabet, the global technology company, was another highlight. The company has nine products with over one billion users, including Google Search, YouTube, Gmail, Android, Chrome, and Google Maps. As the economy rebounded over the period, businesses increased their advertising expenditures, which
accelerated the company’s revenues and net income growth. Alphabet also invests heavily in so-called moonshots like artificial intelli-gence and quantum computing. While these moonshots reduce the company’s near-term profitability, we believe they have the potential to add significant long-term value. Considering these and other factors, Alphabet trades at a discount to the market and an even steeper discount to intrinsic value, in our view. We continue to own the stock.
What were some of the fund’s top detractors from performance for the reporting period?Alibaba, China’s leading e-commerce and cloud service provider, was a top detractor from performance. In late 2020, the Chinese govern-ment terminated a highly anticipated initial public offering of Alibaba’s financial arm, Ant Group. A broad regulatory crackdown, including a $2.8 billion anti-trust fine, triggered a sell-off in Chinese equities, particularly in the tech-nology sector. While regulatory risks remain elevated and earnings power has been partially impaired, Alibaba continues to trade below its intrinsic value, in our view. The company has grown revenue 54% on an annualized basis since 2010, and yet is valued at a discount to the market. We believe the stock is an exceptional bargain, and we continue to own the stock.
Naspers, a South African investment company whose largest asset is a stake in Chinese company Tencent, also dampened results. The regulatory crackdown that impacted Alibaba had a similar effect on Tencent’s share price, which caused Naspers’s stock to decline. Earlier this year, Naspers’s management team proposed a share swap that gave investors
As active managers, we continue to find plenty of compelling investment opportunities for our focused portfolio. Spencer Morgan
6 Focused International Equity Fund
an opportunity to shift their holdings out of South Africa and into European-listed Prosus at a small premium. We opted to tender our shares, which triggered short-term losses for the portfolio. This reduced the fund’s capital gains tax distribution while maintaining our economic interest in Tencent. We believe Tencent has a similar growth outlook as Alibaba. We continue to hold our position in Prosus, which is valued at a 40% discount to its stake in Tencent and other smaller holdings.
Koninklijke Philips, a health technology company, also detracted from results. The company faced setbacks largely from a recall of its DreamStation CPAP machines, which are used to treat sleep apnea. While this was an unfortunate misstep, we believe the company will recover and that the market has over-reacted to the news. In our view, Koninklijke’s business mix has materially improved over the past decade and the company is well posi-tioned for future growth. We continue to own the stock.
What is your outlook for the economy and the fund?After 18 months of unprecedented stimulus worldwide, rising inflation has caused many central banks to raise interest rates and begin tapering their crisis-driven monetary policies. In addition to inflation risk, cases of Covid-19 have continued to spread. Global manufacturers are facing rising prices and supply chain bottle-necks. Consumer spending has cooled, and global economic growth has slowed. Against this macroeconomic backdrop, we continue to focus all our efforts on identifying and investing in quality companies at bargain prices. We do not factor macroeconomic forecasts into our investment decisions.
The stock market’s cyclically adjusted price-to-earnings ratio is at a level not seen since the late 1990s dot-com bubble. As a result, prospective returns for passive investors are likely to be muted, in our view. While there are fewer bargains available in the current market environment, as active managers, we continue to find plenty of compelling investment opportunities for our focused portfolio. We
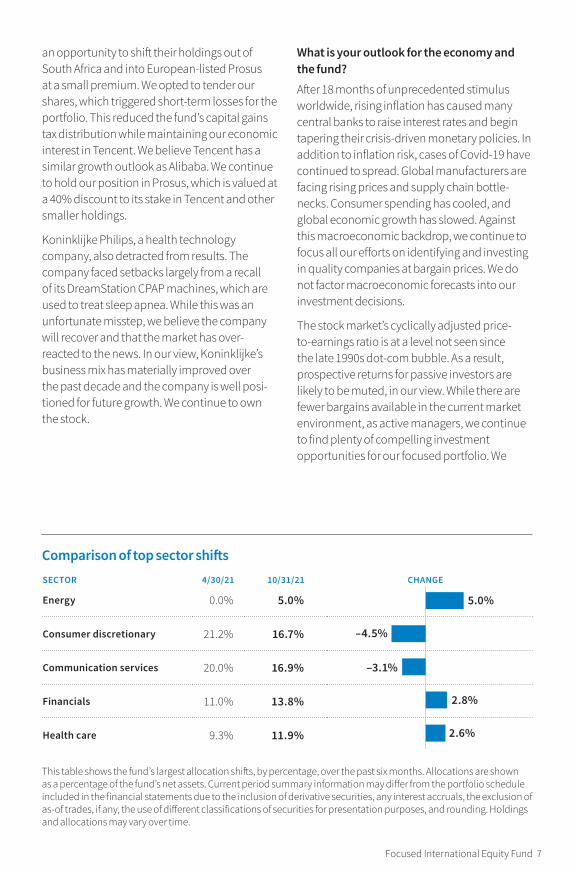
Comparison of top sector shiftsSECTOR 4/30/21 10/31/21 CHANGE
Energy 0.0% 5.0%
Consumer discretionary 21.2% 16.7%
Communication services 20.0% 16.9%
Financials 11.0% 13.8%
Health care 9.3% 11.9%
-7.0 -3.5 0.0 3.5 7.0
bar height 1p1.5
space between bars 0p11.5
max. width of chart: 11p
2.8%
2.6%
–3.1%
–4.5%
5.0%
Rule: 30% black. 4 pts above top bar / 4 pts below bottom bar.
This table shows the fund’s largest allocation shifts, by percentage, over the past six months. Allocations are shown as a percentage of the fund’s net assets. Current period summary information may differ from the portfolio schedule included in the financial statements due to the inclusion of derivative securities, any interest accruals, the exclusion of as-of trades, if any, the use of different classifications of securities for presentation purposes, and rounding. Holdings and allocations may vary over time.
Focused International Equity Fund 7

believe our emphasis on companies with high returns on capital, a low price-to-intrinsic value, and minimal debt will provide investors with significant downside protection in volatile markets and solid returns over time.
Thank you, Spencer, for your time and insights today.
The views expressed in this report are exclusively those of Putnam Management and are subject to change. They are not meant as investment advice.
Please note that the holdings discussed in this report may not have been held by the fund for the entire period. Portfolio composition is subject to review in accordance with the fund’s investment strategy and may vary in the future. Current and future portfolio holdings are subject to risk.
8 Focused International Equity Fund
Your fund’s performanceThis section shows your fund’s performance, price, and distribution information for periods ended October 31, 2021, the end of its most recent fiscal year. In accordance with regulatory requirements for mutual funds, we also include performance information as of the most recent calendar quarter-end and expense information taken from the fund’s current prospectus. Performance should always be considered in light of a fund’s investment strategy. Before April 1, 2021, the fund was managed with a materially different investment strategy and may have achieved materially different performance results under its current investment strategy from that shown for periods before this date. Data represent past performance. Past performance does not guarantee future results. More recent returns may be less or more than those shown. Investment return and principal value will fluctuate, and you may have a gain or a loss when you sell your shares. Performance information does not reflect any deduction for taxes a shareholder may owe on fund distributions or on the redemption of fund shares. For the most recent month-end performance, please visit the Individual Investors section at putnam.com or call Putnam at 1-800-225-1581. Class R, R6, and Y shares are not available to all investors. See the Terms and definitions section in this report for definitions of the share classes offered by your fund.
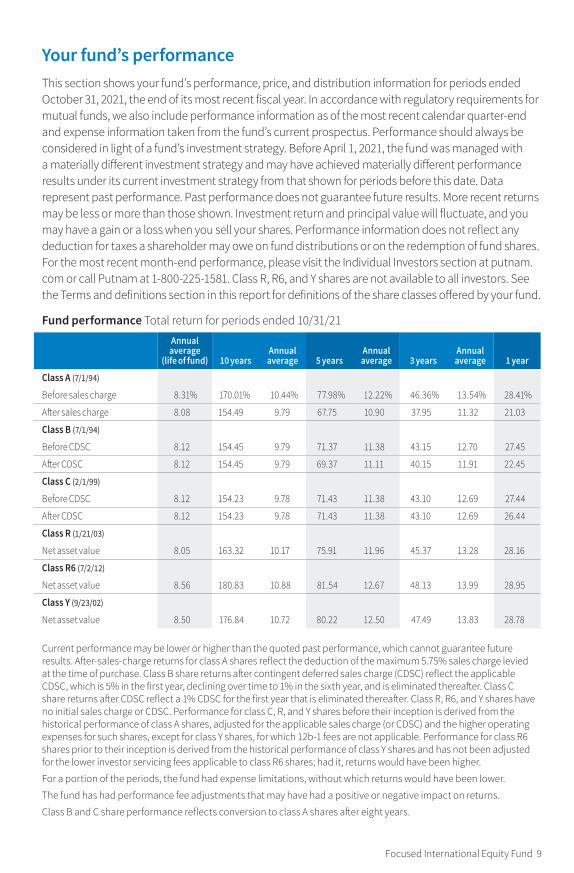
Fund performance Total return for periods ended 10/31/21
Annual average
(life of fund) 10 yearsAnnual average 5 years
Annual average 3 years
Annual average 1 year
Class A (7/1/94)
Before sales charge 8.31% 170.01% 10.44% 77.98% 12.22% 46.36% 13.54% 28.41%
After sales charge 8.08 154.49 9.79 67.75 10.90 37.95 11.32 21.03
Class B (7/1/94)
Before CDSC 8.12 154.45 9.79 71.37 11.38 43.15 12.70 27.45
After CDSC 8.12 154.45 9.79 69.37 11.11 40.15 11.91 22.45
Class C (2/1/99)
Before CDSC 8.12 154.23 9.78 71.43 11.38 43.10 12.69 27.44
After CDSC 8.12 154.23 9.78 71.43 11.38 43.10 12.69 26.44
Class R (1/21/03)
Net asset value 8.05 163.32 10.17 75.91 11.96 45.37 13.28 28.16
Class R6 (7/2/12)
Net asset value 8.56 180.83 10.88 81.54 12.67 48.13 13.99 28.95
Class Y (9/23/02)
Net asset value 8.50 176.84 10.72 80.22 12.50 47.49 13.83 28.78
Current performance may be lower or higher than the quoted past performance, which cannot guarantee future results. After-sales-charge returns for class A shares reflect the deduction of the maximum 5.75% sales charge levied at the time of purchase. Class B share returns after contingent deferred sales charge (CDSC) reflect the applicable CDSC, which is 5% in the first year, declining over time to 1% in the sixth year, and is eliminated thereafter. Class C share returns after CDSC reflect a 1% CDSC for the first year that is eliminated thereafter. Class R, R6, and Y shares have no initial sales charge or CDSC. Performance for class C, R, and Y shares before their inception is derived from the historical performance of class A shares, adjusted for the applicable sales charge (or CDSC) and the higher operating expenses for such shares, except for class Y shares, for which 12b-1 fees are not applicable. Performance for class R6 shares prior to their inception is derived from the historical performance of class Y shares and has not been adjusted for the lower investor servicing fees applicable to class R6 shares; had it, returns would have been higher.
For a portion of the periods, the fund had expense limitations, without which returns would have been lower.
The fund has had performance fee adjustments that may have had a positive or negative impact on returns.
Class B and C share performance reflects conversion to class A shares after eight years.
Focused International Equity Fund 9
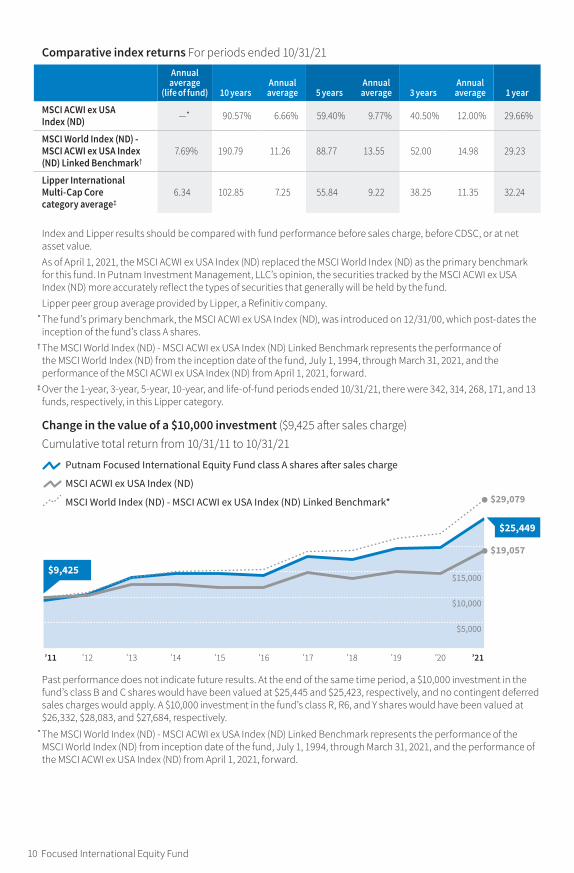
Comparative index returns For periods ended 10/31/21
Annual average
(life of fund) 10 yearsAnnual average 5 years
Annual average 3 years
Annual average 1 year
MSCI ACWI ex USA Index (ND) —* 90.57% 6.66% 59.40% 9.77% 40.50% 12.00% 29.66%
MSCI World Index (ND) - MSCI ACWI ex USA Index (ND) Linked Benchmark†
7.69% 190.79 11.26 88.77 13.55 52.00 14.98 29.23
Lipper International Multi-Cap Core category average‡
6.34 102.85 7.25 55.84 9.22 38.25 11.35 32.24
Index and Lipper results should be compared with fund performance before sales charge, before CDSC, or at net asset value.
As of April 1, 2021, the MSCI ACWI ex USA Index (ND) replaced the MSCI World Index (ND) as the primary benchmark for this fund. In Putnam Investment Management, LLC’s opinion, the securities tracked by the MSCI ACWI ex USA Index (ND) more accurately reflect the types of securities that generally will be held by the fund.
Lipper peer group average provided by Lipper, a Refinitiv company. * The fund’s primary benchmark, the MSCI ACWI ex USA Index (ND), was introduced on 12/31/00, which post-dates the
inception of the fund’s class A shares. † The MSCI World Index (ND) - MSCI ACWI ex USA Index (ND) Linked Benchmark represents the performance of
the MSCI World Index (ND) from the inception date of the fund, July 1, 1994, through March 31, 2021, and the performance of the MSCI ACWI ex USA Index (ND) from April 1, 2021, forward.
‡ Over the 1-year, 3-year, 5-year, 10-year, and life-of-fund periods ended 10/31/21, there were 342, 314, 268, 171, and 13 funds, respectively, in this Lipper category.
Change in the value of a $10,000 investment ($9,425 after sales charge)Cumulative total return from 10/31/11 to 10/31/21
Past performance does not indicate future results. At the end of the same time period, a $10,000 investment in the fund’s class B and C shares would have been valued at $25,445 and $25,423, respectively, and no contingent deferred sales charges would apply. A $10,000 investment in the fund’s class R, R6, and Y shares would have been valued at $26,332, $28,083, and $27,684, respectively.
* The MSCI World Index (ND) - MSCI ACWI ex USA Index (ND) Linked Benchmark represents the performance of the MSCI World Index (ND) from inception date of the fund, July 1, 1994, through March 31, 2021, and the performance of the MSCI ACWI ex USA Index (ND) from April 1, 2021, forward.
$5,000
$10,000
$15,000
’11 ’12 ’13 ’14 ’15 ’16 ’17 ’18 ’19 ’20 ’21
$19,057
$29,079
Putnam Focused International Equity Fund class A shares a�er sales charge
MSCI ACWI ex USA Index (ND)
MSCI World Index (ND) - MSCI ACWI ex USA Index (ND) Linked Benchmark*
$9,425
$25,449
10 Focused International Equity Fund

Fund price and distribution information For the 12-month period ended 10/31/21
Distributions Class A Class B Class C Class R Class R 6 Class Y
Number 2 — — — 2 2
Income $0.130 — — — $0.258 $0.215
Capital gains — — — — — —
Total $0.130 — — — $0.258 $0.215
Share value
Before sales
charge
After sales
charge
Net asset value
Net asset value
Net asset value
Net asset value
Net asset value
10/31/20 $16.77 $17.79 $14.68 $15.45 $16.55 $17.49 $17.40
10/31/21 21.39 22.69 18.71 19.69 21.21 22.27 22.17
The classification of distributions, if any, is an estimate. Before-sales-charge share value and current dividend rate for class A shares, if applicable, do not take into account any sales charge levied at the time of purchase. After-sales-charge share value, current dividend rate, and current 30-day SEC yield, if applicable, are calculated assuming that the maximum sales charge (5.75% for class A shares) was levied at the time of purchase. Final distribution information will appear on your year-end tax forms.
Fund performance as of most recent calendar quarter Total return for periods ended 9/30/21
Annual average
(life of fund) 10 yearsAnnual average 5 years
Annual average 3 years
Annual average 1 year
Class A (7/1/94)
Before sales charge 8.20% 193.03% 11.35% 67.04% 10.81% 27.83% 8.53% 19.89%
After sales charge 7.97 176.18 10.69 57.44 9.50 20.48 6.41 13.00
Class B (7/1/94)
Before CDSC 8.00 175.88 10.68 61.02 10.00 25.02 7.73 19.01
After CDSC 8.00 175.88 10.68 59.02 9.72 22.02 6.86 14.01
Class C (2/1/99)
Before CDSC 8.00 175.90 10.68 60.96 9.99 24.95 7.71 19.01
After CDSC 8.00 175.90 10.68 60.96 9.99 24.95 7.71 18.01
Class R (1/21/03)
Net asset value 7.94 185.70 11.07 64.99 10.53 26.81 8.24 19.63
Class R6 (7/2/12)
Net asset value 8.45 204.60 11.78 70.35 11.24 29.30 8.94 20.37
Class Y (9/23/02)
Net asset value 8.39 200.36 11.63 69.27 11.10 28.82 8.81 20.22
See the discussion following the fund performance table on page 9 for information about the calculation of fund performance.
Focused International Equity Fund 11
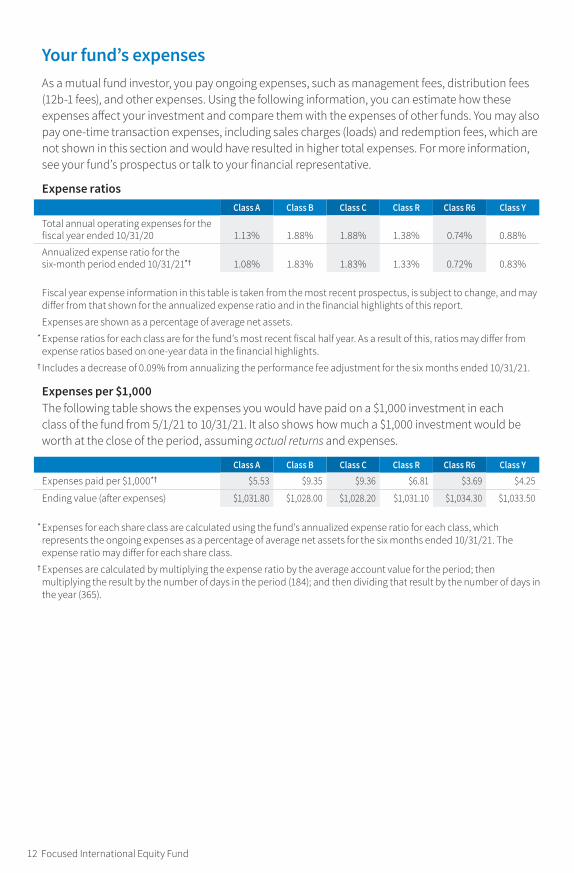
Your fund’s expensesAs a mutual fund investor, you pay ongoing expenses, such as management fees, distribution fees (12b-1 fees), and other expenses. Using the following information, you can estimate how these expenses affect your investment and compare them with the expenses of other funds. You may also pay one-time transaction expenses, including sales charges (loads) and redemption fees, which are not shown in this section and would have resulted in higher total expenses. For more information, see your fund’s prospectus or talk to your financial representative.
Expense ratiosClass A Class B Class C Class R Class R6 Class Y
Total annual operating expenses for the fiscal year ended 10/31/20 1.13% 1.88% 1.88% 1.38% 0.74% 0.88%
Annualized expense ratio for the six-month period ended 10/31/21*† 1.08% 1.83% 1.83% 1.33% 0.72% 0.83%
Fiscal year expense information in this table is taken from the most recent prospectus, is subject to change, and may differ from that shown for the annualized expense ratio and in the financial highlights of this report.
Expenses are shown as a percentage of average net assets. * Expense ratios for each class are for the fund’s most recent fiscal half year. As a result of this, ratios may differ from
expense ratios based on one-year data in the financial highlights. † Includes a decrease of 0.09% from annualizing the performance fee adjustment for the six months ended 10/31/21.
Expenses per $1,000The following table shows the expenses you would have paid on a $1,000 investment in each class of the fund from 5/1/21 to 10/31/21. It also shows how much a $1,000 investment would be worth at the close of the period, assuming actual returns and expenses.
Class A Class B Class C Class R Class R6 Class YExpenses paid per $1,000*† $5.53 $9.35 $9.36 $6.81 $3.69 $4.25
Ending value (after expenses) $1,031.80 $1,028.00 $1,028.20 $1,031.10 $1,034.30 $1,033.50
* Expenses for each share class are calculated using the fund’s annualized expense ratio for each class, which represents the ongoing expenses as a percentage of average net assets for the six months ended 10/31/21. The expense ratio may differ for each share class.
† Expenses are calculated by multiplying the expense ratio by the average account value for the period; then multiplying the result by the number of days in the period (184); and then dividing that result by the number of days in the year (365).
12 Focused International Equity Fund
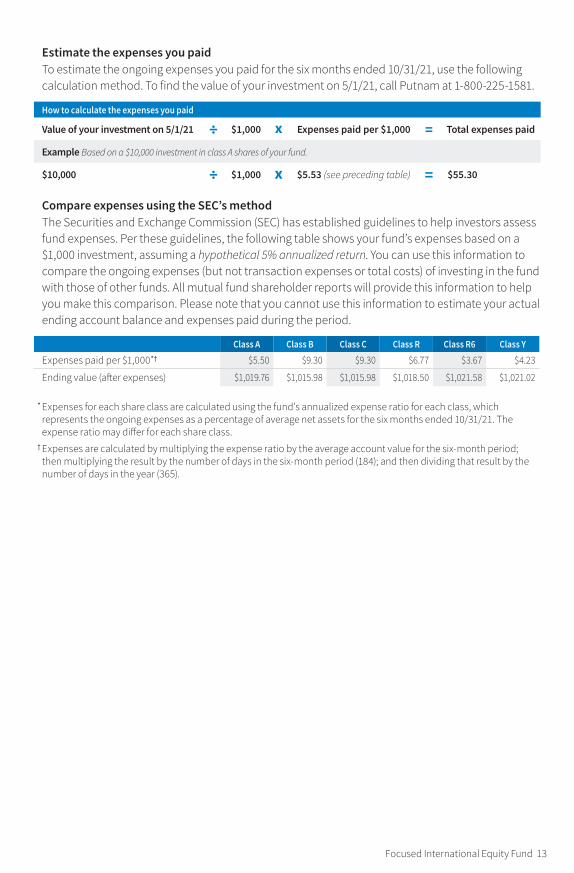
Estimate the expenses you paidTo estimate the ongoing expenses you paid for the six months ended 10/31/21, use the following calculation method. To find the value of your investment on 5/1/21, call Putnam at 1-800-225-1581.
How to calculate the expenses you paid
Value of your investment on 5/1/21 ÷ $1,000 x Expenses paid per $1,000 = Total expenses paid
Example Based on a $10,000 investment in class A shares of your fund.
$10,000 ÷ $1,000 x $5.53 (see preceding table) = $55.30
Compare expenses using the SEC’s methodThe Securities and Exchange Commission (SEC) has established guidelines to help investors assess fund expenses. Per these guidelines, the following table shows your fund’s expenses based on a $1,000 investment, assuming a hypothetical 5% annualized return. You can use this information to compare the ongoing expenses (but not transaction expenses or total costs) of investing in the fund with those of other funds. All mutual fund shareholder reports will provide this information to help you make this comparison. Please note that you cannot use this information to estimate your actual ending account balance and expenses paid during the period.
Class A Class B Class C Class R Class R6 Class YExpenses paid per $1,000*† $5.50 $9.30 $9.30 $6.77 $3.67 $4.23
Ending value (after expenses) $1,019.76 $1,015.98 $1,015.98 $1,018.50 $1,021.58 $1,021.02
* Expenses for each share class are calculated using the fund’s annualized expense ratio for each class, which represents the ongoing expenses as a percentage of average net assets for the six months ended 10/31/21. The expense ratio may differ for each share class.
† Expenses are calculated by multiplying the expense ratio by the average account value for the six-month period; then multiplying the result by the number of days in the six-month period (184); and then dividing that result by the number of days in the year (365).
Focused International Equity Fund 13

Consider these risks before investingInternational investing involves currency, economic, and political risks. Emerging market securities carry illiquidity and volatility risks. Investments in small and/or midsize companies increase the risk of greater price fluctuations. Growth stocks may be more susceptible to earnings disappointments, and value stocks may fail to rebound. As a non-diversified fund, the fund invests in fewer issuers and is more vulnerable than a more broadly diversified fund to fluctuations in the values of the securities it holds.
If the fund invests a substantial percentage of its assets in issuers located in a single country, a small number of countries, or a particular geographic region, the fund’s performance will likely be closely tied to the conditions in such countries or region. Risks associated with derivatives include increased investment exposure (which may be considered leverage) and, in the case of over-the-counter instruments, the potential inability to terminate or sell derivatives positions and the potential failure of the other party to the instrument to meet its obligations. The value of investments in the fund’s portfolio may fall or fail to rise over extended periods of time for a variety of reasons, including general economic, political, or financial market conditions; investor sentiment and market perceptions; government actions; geopolitical events or changes; and factors related to a specific issuer, geography, industry, or sector. These and other factors may lead to increased volatility and reduced liquidity in the fund’s portfolio holdings. The fund will be more susceptible to these risks than other funds because it invests in a limited number of issuers or sectors, and the fund may perform poorly as a result of adverse developments affecting those issuers or sectors.
Our investment techniques, analyses, and judgments may not produce the outcome we intend. The investments we select for the fund may not perform as well as other securities that we do not select for the fund. We, or the fund’s other service providers, may experience disruptions or operating errors that could have a negative effect on the fund. You can lose money by investing in the fund.
14 Focused International Equity Fund
Terms and definitions
Important termsTotal return shows how the value of the fund’s shares changed over time, assuming you held the shares through the entire period and reinvested all distributions in the fund.
Before sales charge, or net asset value, is the price, or value, of one share of a mutual fund, without a sales charge. Before-sales-charge figures fluctuate with market conditions. They and are calculated by dividing the net assets of each class of shares by the number of outstanding shares in the class.
After sales charge is the price of a mutual fund share plus the maximum sales charge levied at the time of purchase. After-sales-charge perfor-mance figures shown here assume the 5.75% maximum sales charge for class A shares.
Contingent deferred sales charge (CDSC) is generally a charge applied at the time of the redemption of class B or C shares and assumes redemption at the end of the period. Your fund’s class B CDSC declines over time from a 5% maximum during the first year to 1% during the sixth year. After the sixth year, the CDSC no longer applies. The CDSC for class C shares is 1% for one year after purchase.
Share classesClass A shares are generally subject to an initial sales charge and no CDSC (except on certain redemptions of shares bought without an initial sales charge).
Class B shares are closed to new investments and are only available by exchange from another Putnam fund or through dividend and/or capital gains reinvestment. They are not subject to an initial sales charge and may be subject to a CDSC.
Class C shares are not subject to an initial sales charge and are subject to a CDSC only if the shares are redeemed during the first year.
Class R shares are not subject to an initial sales charge or CDSC and are only available to employer-sponsored retirement plans.
Class R6 shares are not subject to an initial sales charge or CDSC and carry no 12b-1 fee. They are generally only available to employer-sponsored retirement plans, corporate and institutional clients, and clients in other approved programs.
Class Y shares are not subject to an initial sales charge or CDSC and carry no 12b-1 fee. They are generally only available to corporate and institutional clients and clients in other approved programs.
Comparative indexesBloomberg U.S. Aggregate Bond Index is an unmanaged index of U.S. investment-grade fixed-income securities.
ICE BofA (Intercontinental Exchange Bank of America) U.S. 3-Month Treasury Bill Index is an unmanaged index that seeks to measure the performance of U.S. Treasury bills available in the marketplace.
MSCI ACWI ex USA Index (ND) is a free float-adjusted market capitalization index that is designed to measure non-U.S.-developed and emerging markets equity market perfor-mance. Calculated with net dividends (ND), this total return index reflects the reinvest-ment of dividends after the deduction of withholding taxes, using a tax rate applicable to non-resident institutional investors who do not benefit from double taxation treaties.
MSCI World Index (ND) is an unmanaged index of equity securities from developed countries. Calculated with net dividends (ND), this total return index reflects the reinvest-ment of dividends after the deduction of withholding taxes, using a tax rate applicable to non-resident institutional investors who do not benefit from double taxation treaties.
Focused International Equity Fund 15
MSCI World Index (ND) - MSCI ACWI ex USA Index (ND) Linked Benchmark represents the performance of the MSCI World Index (ND) from the inception date of the fund, July 1, 1994, through March 31, 2021, and the performance of the MSCI ACWI ex USA Index (ND) from April 1, 2021, forward. Calculated with net dividends (ND), this total return index reflects the reinvestment of dividends after the deduction of withholding taxes, using a tax rate applicable to non-resident institutional investors who do not benefit from double taxation treaties.
S&P 500® Index is an unmanaged index of common stock performance.Indexes assume reinvestment of all distributions and do not account for fees. Securities and performance of a fund and an index will differ. You cannot invest directly in an index.
BLOOMBERG® is a trademark and service mark of Bloomberg Finance L.P. and its affiliates (collectively “Bloomberg”). Bloomberg or Bloomberg’s licensors own all proprietary rights in the Bloomberg Indices. Neither Bloomberg nor Bloomberg’s licensors approve or endorse this material, or guarantee the accuracy or
completeness of any information herein, or make any warranty, express or implied, as to the results to be obtained therefrom, and to the maximum extent allowed by law, neither shall have any liability or responsibility for injury or damages arising in connection therewith.
ICE Data Indices, LLC (“ICE BofA”), used with permis-sion. ICE BofA permits use of the ICE BofA indices and related data on an “as is” basis; makes no warranties regarding same; does not guarantee the suitability, quality, accuracy, timeliness, and/or completeness of the ICE BofA indices or any data included in, related to, or derived therefrom; assumes no liability in connection with the use of the foregoing; and does not sponsor, endorse, or recommend Putnam Investments, or any of its products or services.
Lipper, a Refinitiv company, is a third-party industry-ranking entity that ranks mutual funds. Its rankings do not reflect sales charges. Lipper rankings are based on total return at net asset value relative to other funds that have similar current investment styles or objectives as determined by Lipper. Lipper may change a fund’s category assignment at its discretion. Lipper category averages reflect performance trends for funds within a category.
16 Focused International Equity Fund

Other information for shareholders
Proxy votingPutnam is committed to managing our mutual funds in the best interests of our shareholders. The Putnam funds’ proxy voting guidelines and procedures, as well as information regarding how your fund voted proxies relating to portfolio securities during the 12-month period ended June 30, 2021, are available in the Individual Investors section of putnam.com and on the Securities and Exchange Commis-sion (SEC) website, www.sec.gov. If you have questions about finding forms on the SEC’s website, you may call the SEC at 1-800-SEC-0330. You may also obtain the Putnam funds’ proxy voting guidelines and procedures at no charge by calling Putnam’s Shareholder Services at 1-800-225-1581.
Fund portfolio holdingsThe fund will file a complete schedule of its portfolio holdings with the SEC for the first and third quarters of each fiscal year on Form N-PORT within 60 days of the end of such fiscal quarter. Shareholders may obtain the fund’s Form N-PORT on the SEC’s website at www.sec.gov.
Prior to its use of Form N-PORT, the fund filed its complete schedule of its portfolio holdings with the SEC on Form N-Q, which is available online at www.sec.gov.
Trustee and employee fund ownershipPutnam employees and members of the Board of Trustees place their faith, confidence, and, most importantly, investment dollars in Putnam mutual funds. As of October 31,
2021, Putnam employees had approximately $584,000,000 and the Trustees had approxi-mately $82,000,000 invested in Putnam mutual funds. These amounts include investments by the Trustees’ and employees’ immediate family members as well as investments through retirement and deferred compensation plans.
Liquidity risk management programPutnam, as the administrator of the fund’s liquidity risk management program (appointed by the Board of Trustees), presented the most recent annual report on the program to the Trustees in April 2021. The report covered the structure of the program, including the program documents and related policies and procedures adopted to comply with Rule 22e-4 under the Investment Company Act of 1940, and reviewed the operation of the program from January 2020 through December 2020. The report included a description of the annual liquidity assessment of the fund that Putnam performed in November 2020. The report noted that there were no material compliance exceptions identified under Rule 22e-4 during the period. The report included a review of the governance of the program and the methodology for classification of the fund’s investments. The report also included a discussion of liquidity monitoring during the period, including during the market liquidity challenges caused by the Covid-19 pandemic, and the impact those challenges had on the liquidity of the fund’s investments. Putnam concluded that the program has been operating effectively and adequately to ensure compliance with Rule 22e-4.
Focused International Equity Fund 17

Important notice regarding Putnam’s privacy policy
In order to conduct business with our shareholders, we must obtain certain personal information such as account holders’ names, addresses, Social Security numbers, and dates of birth. Using this information, we are able to maintain accurate records of accounts and transactions.
It is our policy to protect the confidentiality of our shareholder information, whether or not a shareholder currently owns shares of our funds. In particular, it is our policy not to sell information about you or your accounts to outside marketing firms. We have safeguards in place designed to prevent unauthorized access
to our computer systems and procedures to protect personal information from unauthorized use.
Under certain circumstances, we must share account information with outside vendors who provide services to us, such as mailings and proxy solicitations. In these cases, the service providers enter into confidentiality agreements with us, and we provide only the information necessary to process transactions and perform other services related to your account. Finally, it is our policy to share account information with your financial representative, if you’ve listed one on your Putnam account.
18 Focused International Equity Fund
Trustee approval of management contract
Trustee approval of management contract
General conclusionsThe Board of Trustees of The Putnam Funds oversees the management of each fund and, as required by law, determines annually whether to approve the continuance of your fund’s management contract with Putnam Investment Management, LLC (“Putnam Management”), the sub-management contract with respect to your fund between Putnam Management and its affiliate, Putnam Investments Limited (“PIL”), and the sub-advisory contract among Putnam Management, PIL, and another affiliate, The Putnam Advisory Company (“PAC”). The Board, with the assistance of its Contract Committee, requests and evaluates all information it deems reasonably necessary under the circumstances in connection with its annual contract review. The Contract Committee consists solely of Trustees who are not “interested persons” (as this term is defined in the Investment Company Act of 1940, as amended (the “1940 Act”)) of The Putnam Funds (“Independent Trustees”).
At the outset of the review process, members of the Board’s independent staff and independent legal counsel considered any possible changes to the annual contract review materials furnished to the Contract Committee during the course of the previous year’s review and, as applicable, identified those changes to Putnam Management. Following these discussions and in consultation with the Contract Committee, the Independent Trustees’ independent legal counsel requested that Putnam Management and its affiliates furnish specified information, together with any additional information that Putnam Management considered relevant, to the Contract Commit-tee. Over the course of several months ending in June 2021, the Contract Committee met on a number of occasions with representatives of Putnam Management, and separately in executive session, to consider the information that Putnam Management provided. Throughout this process, the Contract Committee was assisted by the members of the Board’s independent staff and by independent legal counsel for The Putnam Funds and the Independent Trustees.
In May 2021, the Contract Committee met in executive session to discuss and consider its recommendations with respect to the contin-uance of the contracts. At the Trustees’ June 2021 meeting, the Contract Committee met in
executive session with the other Independent Trustees to review a summary of the key financial, performance and other data that the Contract Committee considered in the course of its review. The Contract Committee then presented its written report, which summarized the key factors that the Committee had considered and set forth its recommendations. The Contract Committee recommended, and the Independent Trust-ees approved, the continuance of your fund’s management, sub-management and sub-advisory contracts, effective July 1, 2021. (Because PIL and PAC are affiliates of Putnam Management and Putnam Management remains fully responsible for all services provided by PIL and PAC, the Trust-ees have not attempted to evaluate PIL or PAC as separate entities, and all subsequent references to Putnam Management below should be deemed to include reference to PIL and PAC as necessary or appropriate in the context.)
The Trustees also considered that, at their meeting on November 20, 2020, they had approved a new management contract for your fund with Putnam Management, effective April 1, 2021. The Trust-ees noted that the new management contract differed in substance from the existing manage-ment contract only in that the new management contract provided for a new performance index for use, prospectively, in calculating performance adjustments to the fund’s base management fee, in connection with the repositioning of the fund as Putnam Focused International Equity Fund with investments mainly in companies of any size outside the United States, including in emerg-ing markets. Until then, your fund was named Putnam Global Equity Fund and invested mainly in common stocks of large and midsize companies in developed countries worldwide.
The Independent Trustees’ approval was based on the following conclusions:
• That the fee schedule in effect for your fund repre-sented reasonable compensation in light of the nature and quality of the services being provided to the fund, the fees paid by competitive funds, the costs incurred by Putnam Management in providing services to the fund and the applica-tion of certain reductions and waivers noted below; and
• That the fee schedule in effect for your fund represented an appropriate sharing between
Focused International Equity Fund 19
fund shareholders and Putnam Management of any economies of scale as may exist in the management of the fund at current asset levels.
These conclusions were based on a comprehen-sive consideration of all information provided to the Trustees and were not the result of any single factor. Some of the factors that figured particularly in the Trustees’ deliberations and how the Trust-ees considered these factors are described below, although individual Trustees may have evaluated the information presented differently, giving differ-ent weights to various factors. It is also important to recognize that the management arrangements for your fund and the other Putnam funds are the result of many years of review and discussion between the Independent Trustees and Putnam Management, that some aspects of the arrange-ments may receive greater scrutiny in some years than others and that the Trustees’ conclusions may be based, in part, on their consideration of fee arrangements in previous years. For example, with certain exceptions primarily involving newly launched or repositioned funds, the current fee arrangements under the vast majority of the funds’ management contracts were first implemented at the beginning of 2010 following extensive review by the Contract Committee and discussions with representatives of Putnam Management, as well as approval by shareholders.
Management fee schedules and total expensesThe Trustees reviewed the management fee sched-ules in effect for all Putnam funds, including fee levels and breakpoints. Under its management contract, your fund has the benefit of breakpoints in its management fee schedule that provide shareholders with reduced fee levels as assets under management in the Putnam family of funds increase. The Trustees also reviewed the total expenses of each Putnam fund, recognizing that in most cases management fees represented the major, but not the sole, determinant of total costs to fund shareholders. (Two funds have implemented so-called “all-in” management fees covering substantially all routine fund operating costs.)
In reviewing fees and expenses, the Trustees generally focus their attention on material changes in circumstances — for example, changes in assets under management, changes in a fund’s investment strategy, changes in Putnam Management’s operating costs or profitability, or changes in competitive practices in the mutual fund industry — that suggest that consideration
of fee changes might be warranted. The Trustees concluded that the circumstances did not indicate that changes to the management fee schedule for your fund would be appropriate at this time.
Your fund’s management contract provides that its management fees will be adjusted up or down depending upon whether your fund’s performance is better or worse than the perfor-mance of an appropriate index of securities prices specified in the management contract. In the course of reviewing investment performance, the Trustees examined the operation of your fund’s performance fees and concluded that these fees were operating effectively to align further Putnam Management’s economic interests with those of the fund’s shareholders. In addition, the Trustees previously approved, at their meeting on January 25, 2019, an amended and restated management contract in connection with the proposed mergers (which subsequently closed on June 17, 2019) of Putnam Global Utilities Fund, Putnam Global Consumer Fund, Putnam Global Financials Fund and Putnam Global Sector Fund, other mutual funds managed by Putnam Manage-ment, with and into your fund. The amended and restated management contract provided that, effective upon the closing of the mergers, the performance adjustment calculation for your fund would take into account the net assets of the acquired funds in the proposed mergers for periods before the consummation of the mergers, except that if the use of combined assets would result in a higher management fee, only the assets of your fund would be used.
As in the past, the Trustees also focused on the competitiveness of each fund’s total expense ratio. The Trustees and Putnam Management and the funds’ investor servicing agent, Putnam Investor Services, Inc. (“PSERV”), have imple-mented expense limitations that were in effect during your fund’s fiscal year ending in 2020. These expense limitations were: (i) a contrac-tual expense limitation applicable to specified open-end funds, including your fund, of 25 basis points on investor servicing fees and expenses and (ii) a contractual expense limitation appli-cable to specified open-end funds, including your fund, of 20 basis points on so-called “other expenses” (i.e., all expenses exclusive of manage-ment fees, distribution fees, investor servicing fees, investment-related expenses, interest, taxes, brokerage commissions, acquired fund fees and expenses and extraordinary expenses). These expense limitations attempt to maintain
20 Focused International Equity Fund
competitive expense levels for the funds. Most funds, including your fund, had sufficiently low expenses that these expense limitations were not operative during their fiscal years ending in 2020. Putnam Management and PSERV have agreed to maintain these expense limitations until at least February 28, 2023. Putnam Management and PSERV’s commitment to these expense limitation arrangements, which were intended to support an effort to have fund expenses meet compet-itive standards, was an important factor in the Trustees’ decision to approve the continuance of your fund’s management, sub-management and sub-advisory contracts.
The Trustees reviewed comparative fee and expense information for a custom group of competitive funds selected by Broadridge Financial Solutions, Inc. (“Broadridge”). This comparative information included your fund’s percentile ranking for effective management fees and total expenses (excluding any applicable 12b-1 fees), which provides a general indication of your fund’s relative standing. In the custom peer group, your fund ranked in the second quintile in effective management fees (determined for your fund and the other funds in the custom peer group based on fund asset size and the applicable contractual management fee schedule) and in the second quintile in total expenses (excluding any applicable 12b-1 fees) as of December 31, 2020. The first quintile represents the least expensive funds and the fifth quintile the most expensive funds. The fee and expense data reported by Broadridge as of December 31, 2020 reflected the most recent fiscal year-end data available in Broadridge’s database at that time.
In connection with their review of fund manage-ment fees and total expenses, the Trustees also reviewed the costs of the services provided and the profits realized by Putnam Management and its affiliates from their contractual relationships with the funds. This information included trends in revenues, expenses and profitability of Putnam Management and its affiliates relating to the investment management, investor servicing and distribution services provided to the funds. In this regard, the Trustees also reviewed an analy-sis of the revenues, expenses and profitability of Putnam Management and its affiliates, allocated on a fund-by-fund basis, with respect to the funds’ management, distribution and investor servicing contracts. For each fund, the analysis presented information about revenues, expenses and profitability for each of the agreements separately
and for the agreements taken together on a combined basis. The Trustees concluded that, at current asset levels, the fee schedules in place for the Putnam funds, including the fee schedule for your fund, represented reasonable compensation for the services being provided and represented an appropriate sharing between fund sharehold-ers and Putnam Management of any economies of scale as may exist in the management of the Putnam funds at that time.
The information examined by the Trustees in connection with their annual contract review for the Putnam funds included information regarding services provided and fees charged by Putnam Management and its affiliates to other clients, including defined benefit pension and profit-sharing plans, sub-advised mutual funds, private funds sponsored by affiliates of Putnam Management, model-only separately managed accounts and Putnam Management’s newly launched exchange-traded funds. This information included, in cases where a product’s investment strategy corresponds with a fund’s strategy, comparisons of those fees with fees charged to the Putnam funds, as well as an assess-ment of the differences in the services provided to these clients as compared to the services provided to the Putnam funds. The Trustees observed that the differences in fee rates between these clients and the Putnam funds are by no means uniform when examined by individual asset sectors, suggesting that differences in the pricing of investment management services to these types of clients may reflect, among other things, historical competitive forces operating in separate marketplaces. The Trustees consid-ered the fact that in many cases fee rates across different asset classes are higher on average for mutual funds than for other clients, and the Trust-ees also considered the differences between the services that Putnam Management provides to the Putnam funds and those that it provides to its other clients. The Trustees did not rely on these comparisons to any significant extent in conclud-ing that the management fees paid by your fund are reasonable.
Investment performanceThe quality of the investment process provided by Putnam Management represented a major factor in the Trustees’ evaluation of the quality of services provided by Putnam Management under your fund’s management contract. The Trustees were assisted in their review of Putnam
Focused International Equity Fund 21
Management’s investment process and perfor-mance by the work of the investment oversight committees of the Trustees and the full Board of Trustees, which meet on a regular basis with individual portfolio managers and with senior management of Putnam Management’s Investment Division throughout the year. The Trustees concluded that Putnam Management generally provides a high-quality investment process — based on the experience and skills of the individuals assigned to the management of fund portfolios, the resources made available to them and in general Putnam Management’s ability to attract and retain high-quality personnel — but also recognized that this does not guarantee favorable investment results for every fund in every time period.
The Trustees considered that, in the aggregate, The Putnam Funds generally performed well in 2020, which Putnam Management characterized as a challenging year with significant volatility and varied market dynamics. On an asset-weighted basis, the Putnam funds ranked in the second quartile of their peers as determined by Lipper Inc. (“Lipper”) for the year ended December 31, 2020 and, on an asset-weighted-basis, delivered a gross return that was 2.3% ahead of their benchmarks in 2020. In addition to the performance of the individual Putnam funds, the Trustees considered, as they had in prior years, the performance of The Putnam Fund complex versus competitor fund complexes. In this regard, the Trustees observed that The Putnam Funds’ relative performance, as reported in the Barron’s/Lipper Fund Families survey, continued to be exceptionally strong over the long term, with The Putnam Funds ranking as the 3rd best performing mutual fund complex out of 44 complexes for the ten-year period, with 2020 marking the fourth consecutive year that The Putnam Funds have ranked in the top ten fund complexes for the ten-year period. The Trustees noted that The Putnam Funds’ performance was solid over the one- and five-year periods, with The Putnam Funds ranking 22nd out of 53 complexes and 14th out of 50 complexes, respectively. In addition to the Barron’s/Lipper Fund Families Survey, the Trustees also considered the funds’ ratings assigned by Morningstar Inc., noting that 26 of the funds were four- or five-star rated at the end of 2020 (representing an increase of four funds year-over-year) and that this included seven funds that had achieved a five-star rating (representing an increase of two funds year-over-year). They also noted, however, the disappointing investment
performance of some funds for periods ended December 31, 2020 and considered information provided by Putnam Management regarding the factors contributing to the underperformance and actions being taken to improve the performance of these particular funds. The Trustees indicated their intention to continue to monitor closely the performance of those funds and evaluate whether additional actions to address areas of underperformance may be warranted.
For purposes of the Trustees’ evaluation of the Putnam funds’ investment performance, the Trustees generally focus on a competitive indus-try ranking of each fund’s total net return over a one-year, three-year and five-year period. For a number of Putnam funds with relatively unique investment mandates for which Putnam Manage-ment informed the Trustees that meaningful competitive performance rankings are not considered to be available, the Trustees evalu-ated performance based on their total gross and net returns and comparisons of those returns to the returns of selected investment benchmarks. In the case of your fund, the Trustees considered information about your fund’s total return and its performance relative to its benchmark over the one-year, three-year and five-year periods ended December 31, 2020. Your fund’s class A shares’ return, net of fees and expenses, was positive but trailed the return of its benchmark over the one-year, three-year and five-year periods ended December 31, 2020. (When considering perfor-mance information, shareholders should be mindful that past performance is not a guarantee of future results.)
The Trustees expressed concern about your fund’s significant underperformance relative to its benchmark over the one-year period ended December 31, 2020 and considered the circumstances that may have contributed to this disappointing performance. The Trustees consid-ered Putnam Management’s observation that the fund’s underperformance was driven by challeng-ing stock selection and noted the extent to which the fund’s top twenty active positions had weighed on the fund’s performance. The Trustees also considered that the fund’s holdings in the energy sector had detracted significantly from the fund’s benchmark-relative performance.
The Trustees considered that the fund was reposi-tioned as Putnam Focused International Equity Fund (formerly, Putnam Global Equity Fund) in April 2021, noting the fund’s new portfolio
22 Focused International Equity Fund
managers and the change in its benchmark from the MSCI World Index (ND) to the MSCI ACWI ex USA Index (ND). The Trustees also noted Putnam Management’s observation that the fund had outperformed its former benchmark, the MSCI World Index (ND), gross of fees, in the first quarter of 2021 and since its inception in September 2011. In addition, the Trustees considered that Putnam Management was confident in the reposi-tioned fund’s investment approach and portfolio managers. The Trustees also considered Putnam Management’s continued efforts to support fund performance through certain initiatives, including structuring compensation for portfo-lio managers to enhance accountability for fund performance, emphasizing accountability in the portfolio management process and affirming its commitment to a fundamental-driven approach to investing. The Trustees noted further that Putnam Management had made selective hires and internal promotions in 2020 to strengthen its investment team.
As a general matter, the Trustees believe that cooperative efforts between the Trustees and Putnam Management represent the most effec-tive way to address investment performance concerns that may arise from time to time. The Trustees noted that investors in the Putnam funds have, in effect, placed their trust in the Putnam organization, under the oversight of the funds’ Trustees, to make appropriate decisions regard-ing the management of the funds. The Trustees also considered that Putnam Management has made changes in light of subpar investment performance when warranted. Based on Putnam Management’s willingness to take appropriate measures to address fund performance issues, the Trustees concluded that it continued to be advisable to seek change within Putnam Manage-ment to address performance shortcomings. In the Trustees’ view, the alternative of engaging a new investment adviser for an underperforming fund, with all the attendant risks and disruptions, would not likely provide any greater assurance of improved investment performance.
Brokerage and soft-dollar allocations; investor servicingThe Trustees considered various potential benefits that Putnam Management may receive in connection with the services it provides under
the management contract with your fund. These include benefits related to brokerage allocation and the use of soft dollars, whereby a portion of the commissions paid by a fund for brokerage may be used to acquire research services that are expected to be useful to Putnam Management in managing the assets of the fund and of other clients. Subject to policies established by the Trustees, soft dollars generated by these means are used predominantly to acquire brokerage and research services (including third-party research and market data) that enhance Putnam Manage-ment’s investment capabilities and supplement Putnam Management’s internal research efforts. The Trustees indicated their continued intent to monitor regulatory and industry developments in this area with the assistance of their Broker-age Committee. In addition, with the assistance of their Brokerage Committee, the Trustees indicated their continued intent to monitor the allocation of the Putnam funds’ brokerage in order to ensure that the principle of seeking best price and execution remains paramount in the portfolio trading process.
Putnam Management may also receive benefits from payments that the funds make to Putnam Management’s affiliates for investor or distribution services. In conjunction with the annual review of your fund’s management, sub-management and sub-advisory contracts, the Trustees reviewed your fund’s investor servicing agreement with PSERV and its distributor’s contract and distri-bution plans with Putnam Retail Management Limited Partnership (“PRM”), both of which are affiliates of Putnam Management. The Trustees concluded that the fees payable by the funds to PSERV and PRM, as applicable, for such services are fair and reasonable in relation to the nature and quality of such services, the fees paid by competitive funds and the costs incurred by PSERV and PRM, as applicable, in providing such services. Furthermore, the Trustees were of the view that the investor services provided by PSERV were required for the operation of the funds, and that they were of a quality at least equal to those provided by other providers.
Focused International Equity Fund 23
Audited financial statements
24 Focused International Equity Fund
Audited financial statements
These sections of the report, as well as the accompanying Notes, preceded by the Report of Independent Registered Public Accounting Firm, constitute the fund’s audited financial statements.
The fund’s portfolio lists all the fund’s invest-ments and their values as of the last day of the reporting period. Holdings are organized by asset type and industry sector, country, or state to show areas of concentration and diversification.
Statement of assets and liabilities shows how the fund’s net assets and share price are determined. All investment and non-investment assets are added together. Any unpaid expenses and other liabilities are subtracted from this total. The result is divided by the number of shares to determine the net asset value per share, which is calculated separately for each class of shares. (For funds with preferred shares, the amount subtracted from total assets includes the liquidation preference of preferred shares.)
Statement of operations shows the fund’s net investment gain or loss. This is done by first adding up all the fund’s earnings — from dividends and interest income — and subtracting its operating expenses to determine net investment income
(or loss). Then, any net gain or loss the fund realized on the sales of its holdings — as well as any unrealized gains or losses over the period — is added to or subtracted from the net investment result to determine the fund’s net gain or loss for the fiscal period.
Statement of changes in net assets shows how the fund’s net assets were affected by the fund’s net investment gain or loss, by distributions to shareholders, and by changes in the number of the fund’s shares. It lists distributions and their sources (net investment income or realized capital gains) over the current reporting period and the most recent fiscal year-end. The distributions listed here may not match the sources listed in the Statement of operations because the distributions are deter-mined on a tax basis and may be paid in a different period from the one in which they were earned.
Financial highlights provide an overview of the fund’s investment results, per-share distributions, expense ratios, net investment income ratios, and portfolio turnover in one summary table, reflecting the five most recent reporting periods. In a semiannual report, the highlights table also includes the current reporting period.
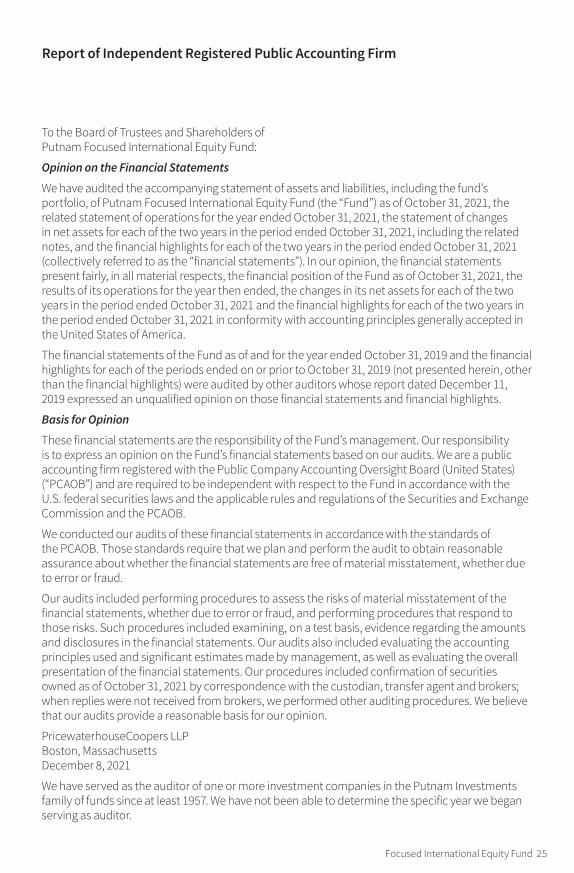
Report of Independent Registered Public Accounting Firm
To the Board of Trustees and Shareholders of Putnam Focused International Equity Fund:
Opinion on the Financial Statements
We have audited the accompanying statement of assets and liabilities, including the fund’s portfolio, of Putnam Focused International Equity Fund (the “Fund”) as of October 31, 2021, the related statement of operations for the year ended October 31, 2021, the statement of changes in net assets for each of the two years in the period ended October 31, 2021, including the related notes, and the financial highlights for each of the two years in the period ended October 31, 2021 (collectively referred to as the “financial statements”). In our opinion, the financial statements present fairly, in all material respects, the financial position of the Fund as of October 31, 2021, the results of its operations for the year then ended, the changes in its net assets for each of the two years in the period ended October 31, 2021 and the financial highlights for each of the two years in the period ended October 31, 2021 in conformity with accounting principles generally accepted in the United States of America.
The financial statements of the Fund as of and for the year ended October 31, 2019 and the financial highlights for each of the periods ended on or prior to October 31, 2019 (not presented herein, other than the financial highlights) were audited by other auditors whose report dated December 11, 2019 expressed an unqualified opinion on those financial statements and financial highlights.
Basis for Opinion
These financial statements are the responsibility of the Fund’s management. Our responsibility is to express an opinion on the Fund’s financial statements based on our audits. We are a public accounting firm registered with the Public Company Accounting Oversight Board (United States) (“PCAOB”) and are required to be independent with respect to the Fund in accordance with the U.S. federal securities laws and the applicable rules and regulations of the Securities and Exchange Commission and the PCAOB.
We conducted our audits of these financial statements in accordance with the standards of the PCAOB. Those standards require that we plan and perform the audit to obtain reasonable assurance about whether the financial statements are free of material misstatement, whether due to error or fraud.
Our audits included performing procedures to assess the risks of material misstatement of the financial statements, whether due to error or fraud, and performing procedures that respond to those risks. Such procedures included examining, on a test basis, evidence regarding the amounts and disclosures in the financial statements. Our audits also included evaluating the accounting principles used and significant estimates made by management, as well as evaluating the overall presentation of the financial statements. Our procedures included confirmation of securities owned as of October 31, 2021 by correspondence with the custodian, transfer agent and brokers; when replies were not received from brokers, we performed other auditing procedures. We believe that our audits provide a reasonable basis for our opinion.
PricewaterhouseCoopers LLP Boston, Massachusetts December 8, 2021
We have served as the auditor of one or more investment companies in the Putnam Investments family of funds since at least 1957. We have not been able to determine the specific year we began serving as auditor.
Focused International Equity Fund 25

26 Focused International Equity Fund
COMMON STOCKS (98.4%)* Shares ValueAerospace and defense (2.4%)Thales SA (France) 270,205 $24,924,530
24,924,530Airlines (2.9%)Ryanair Holdings PLC ADR (Ireland) † 270,380 30,690,834
30,690,834Automobiles (2.0%)Bayerische Motoren Werke (BMW) AG (Germany) 202,085 20,384,273
20,384,273Banks (5.1%)Hana Financial Group, Inc. (South Korea) 611,474 23,474,205HDFC Bank, Ltd. (India) 1,403,242 29,771,520
53,245,725Capital markets (6.5%)BGP Holdings PLC (Malta) 82,319 —CI Financial Corp. (Canada) 1,881,313 42,898,071London Stock Exchange Group PLC (United Kingdom) 254,701 24,760,486
67,658,557Construction and engineering (1.2%)Kyudenko Corp. (Japan) 404,100 12,827,849
12,827,849Diversified telecommunication services (4.3%)Liberty Global PLC Class C (United Kingdom) † 1,556,403 44,886,663
44,886,663Entertainment (2.8%)CTS Eventim AG & Co. KGaA (Germany) † 394,192 28,647,595
28,647,595Food and staples retail (1.5%)Jeronimo Martins SGPS SA (Portugal) 702,960 15,932,847
15,932,847Health-care equipment and supplies (2.5%)Koninklijke Philips NV (Netherlands) 545,959 25,724,968
25,724,968Household durables (5.7%)Berkeley Group Holdings PLC (The) (United Kingdom) 458,188 27,336,280HC Brillant Services GmbH (acquired 8/2/13, cost $17) (Private) (Germany) † ∆∆ F 26 —Sony Group Corp. (Japan) 278,700 32,212,886
59,549,166Interactive media and services (4.5%)Alphabet, Inc. Class C † 15,706 46,574,729
46,574,729Internet and direct marketing retail (9.0%)Alibaba Group Holding, Ltd. (China) † 1,591,500 32,926,987JD.com, Inc. Class A (China) † 558,550 21,937,522Prosus NV (China) 442,434 39,197,523
94,062,032
The fund’s portfolio 10/31/21
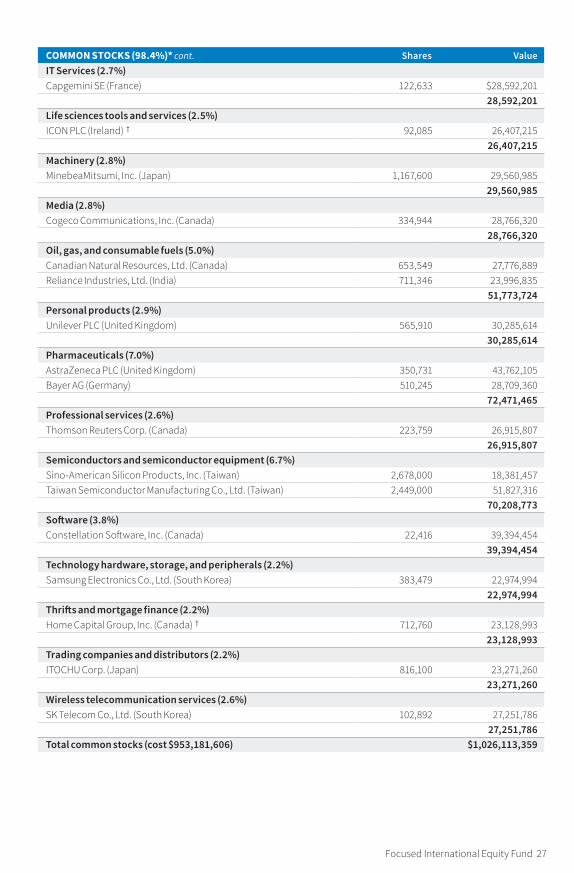
Focused International Equity Fund 27
COMMON STOCKS (98.4%)* cont. Shares ValueIT Services (2.7%)Capgemini SE (France) 122,633 $28,592,201
28,592,201Life sciences tools and services (2.5%)ICON PLC (Ireland) † 92,085 26,407,215
26,407,215Machinery (2.8%)MinebeaMitsumi, Inc. (Japan) 1,167,600 29,560,985
29,560,985Media (2.8%)Cogeco Communications, Inc. (Canada) 334,944 28,766,320
28,766,320Oil, gas, and consumable fuels (5.0%)Canadian Natural Resources, Ltd. (Canada) 653,549 27,776,889Reliance Industries, Ltd. (India) 711,346 23,996,835
51,773,724Personal products (2.9%)Unilever PLC (United Kingdom) 565,910 30,285,614
30,285,614Pharmaceuticals (7.0%)AstraZeneca PLC (United Kingdom) 350,731 43,762,105Bayer AG (Germany) 510,245 28,709,360
72,471,465Professional services (2.6%)Thomson Reuters Corp. (Canada) 223,759 26,915,807
26,915,807Semiconductors and semiconductor equipment (6.7%)Sino-American Silicon Products, Inc. (Taiwan) 2,678,000 18,381,457Taiwan Semiconductor Manufacturing Co., Ltd. (Taiwan) 2,449,000 51,827,316
70,208,773Software (3.8%)Constellation Software, Inc. (Canada) 22,416 39,394,454
39,394,454Technology hardware, storage, and peripherals (2.2%)Samsung Electronics Co., Ltd. (South Korea) 383,479 22,974,994
22,974,994Thrifts and mortgage finance (2.2%)Home Capital Group, Inc. (Canada) † 712,760 23,128,993
23,128,993Trading companies and distributors (2.2%)ITOCHU Corp. (Japan) 816,100 23,271,260
23,271,260Wireless telecommunication services (2.6%)SK Telecom Co., Ltd. (South Korea) 102,892 27,251,786
27,251,786Total common stocks (cost $953,181,606) $1,026,113,359
28 Focused International Equity Fund
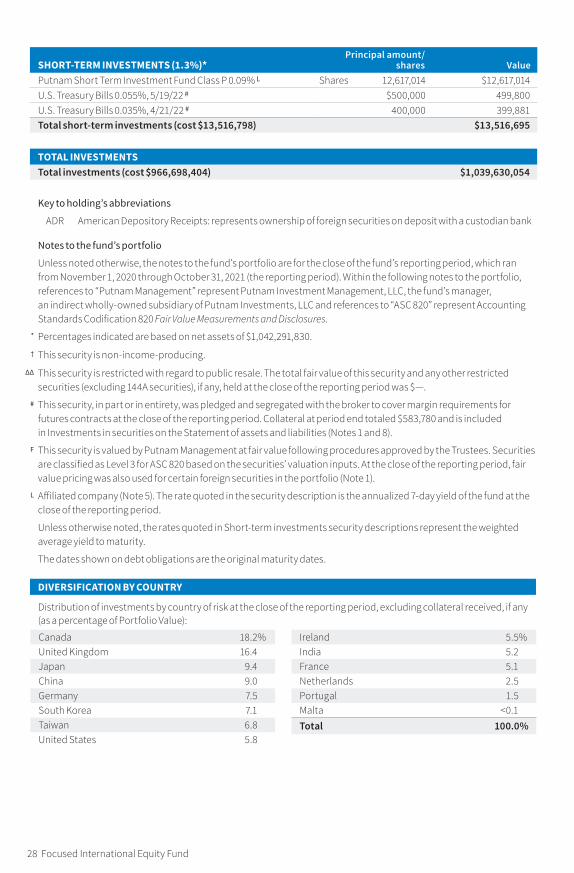
SHORT-TERM INVESTMENTS (1.3%)*Principal amount/
shares ValuePutnam Short Term Investment Fund Class P 0.09% L Shares 12,617,014 $12,617,014U.S. Treasury Bills 0.055%, 5/19/22 # $500,000 499,800U.S. Treasury Bills 0.035%, 4/21/22 # 400,000 399,881Total short-term investments (cost $13,516,798) $13,516,695
TOTAL INVESTMENTSTotal investments (cost $966,698,404) $1,039,630,054
Key to holding’s abbreviations
ADR American Depository Receipts: represents ownership of foreign securities on deposit with a custodian bank
Notes to the fund’s portfolio
Unless noted otherwise, the notes to the fund’s portfolio are for the close of the fund’s reporting period, which ran from November 1, 2020 through October 31, 2021 (the reporting period). Within the following notes to the portfolio, references to “Putnam Management” represent Putnam Investment Management, LLC, the fund’s manager, an indirect wholly-owned subsidiary of Putnam Investments, LLC and references to “ASC 820” represent Accounting Standards Codification 820 Fair Value Measurements and Disclosures.
* Percentages indicated are based on net assets of $1,042,291,830.
† This security is non-income-producing.
∆∆ This security is restricted with regard to public resale. The total fair value of this security and any other restricted securities (excluding 144A securities), if any, held at the close of the reporting period was $—.
# This security, in part or in entirety, was pledged and segregated with the broker to cover margin requirements for futures contracts at the close of the reporting period. Collateral at period end totaled $583,780 and is included in Investments in securities on the Statement of assets and liabilities (Notes 1 and 8).
F This security is valued by Putnam Management at fair value following procedures approved by the Trustees. Securities are classified as Level 3 for ASC 820 based on the securities’ valuation inputs. At the close of the reporting period, fair value pricing was also used for certain foreign securities in the portfolio (Note 1).
L Affiliated company (Note 5). The rate quoted in the security description is the annualized 7-day yield of the fund at the close of the reporting period.
Unless otherwise noted, the rates quoted in Short-term investments security descriptions represent the weighted average yield to maturity.
The dates shown on debt obligations are the original maturity dates.
DIVERSIFICATION BY COUNTRY
Distribution of investments by country of risk at the close of the reporting period, excluding collateral received, if any (as a percentage of Portfolio Value):
Canada 18.2%United Kingdom 16.4Japan 9.4China 9.0Germany 7.5South Korea 7.1Taiwan 6.8United States 5.8
Ireland 5.5%India 5.2France 5.1Netherlands 2.5Portugal 1.5Malta <0.1Total 100.0%
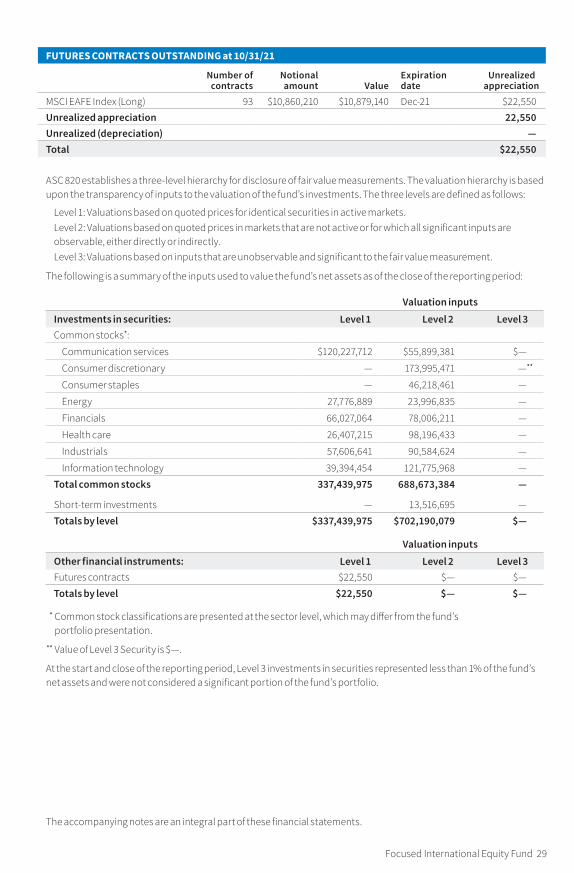
Focused International Equity Fund 29
The accompanying notes are an integral part of these financial statements.
FUTURES CONTRACTS OUTSTANDING at 10/31/21
Number of contracts
Notional amount Value
Expiration date
Unrealized appreciation
MSCI EAFE Index (Long) 93 $10,860,210 $10,879,140 Dec-21 $22,550Unrealized appreciation 22,550Unrealized (depreciation) —Total $22,550
ASC 820 establishes a three-level hierarchy for disclosure of fair value measurements. The valuation hierarchy is based upon the transparency of inputs to the valuation of the fund’s investments. The three levels are defined as follows:
Level 1: Valuations based on quoted prices for identical securities in active markets.Level 2: Valuations based on quoted prices in markets that are not active or for which all significant inputs are observable, either directly or indirectly.Level 3: Valuations based on inputs that are unobservable and significant to the fair value measurement.
The following is a summary of the inputs used to value the fund’s net assets as of the close of the reporting period:
Valuation inputsInvestments in securities: Level 1 Level 2 Level 3Common stocks*:
Communication services $120,227,712 $55,899,381 $—
Consumer discretionary — 173,995,471 — **
Consumer staples — 46,218,461 —
Energy 27,776,889 23,996,835 —
Financials 66,027,064 78,006,211 —
Health care 26,407,215 98,196,433 —
Industrials 57,606,641 90,584,624 —
Information technology 39,394,454 121,775,968 — Total common stocks 337,439,975 688,673,384 —
Short-term investments — 13,516,695 — Totals by level $337,439,975 $702,190,079 $—
Valuation inputsOther financial instruments: Level 1 Level 2 Level 3Futures contracts $22,550 $— $— Totals by level $22,550 $— $—
* Common stock classifications are presented at the sector level, which may differ from the fund’s portfolio presentation.
** Value of Level 3 Security is $— .
At the start and close of the reporting period, Level 3 investments in securities represented less than 1% of the fund’s net assets and were not considered a significant portion of the fund’s portfolio.
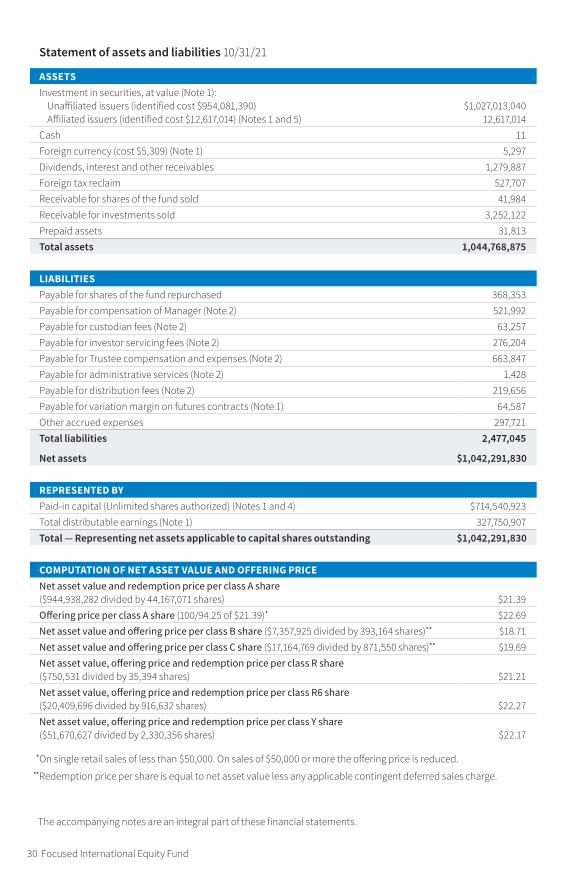
The accompanying notes are an integral part of these financial statements.
Statement of assets and liabilities 10/31/21
ASSETSInvestment in securities, at value (Note 1):
Unaffiliated issuers (identified cost $954,081,390) $1,027,013,040 Affiliated issuers (identified cost $12,617,014) (Notes 1 and 5) 12,617,014
Cash 11 Foreign currency (cost $5,309) (Note 1) 5,297 Dividends, interest and other receivables 1,279,887 Foreign tax reclaim 527,707 Receivable for shares of the fund sold 41,984 Receivable for investments sold 3,252,122 Prepaid assets 31,813 Total assets 1,044,768,875
LIABILITIESPayable for shares of the fund repurchased 368,353 Payable for compensation of Manager (Note 2) 521,992 Payable for custodian fees (Note 2) 63,257 Payable for investor servicing fees (Note 2) 276,204 Payable for Trustee compensation and expenses (Note 2) 663,847 Payable for administrative services (Note 2) 1,428 Payable for distribution fees (Note 2) 219,656 Payable for variation margin on futures contracts (Note 1) 64,587 Other accrued expenses 297,721 Total liabilities 2,477,045
Net assets $1,042,291,830
REPRESENTED BYPaid-in capital (Unlimited shares authorized) (Notes 1 and 4) $714,540,923Total distributable earnings (Note 1) 327,750,907Total — Representing net assets applicable to capital shares outstanding $1,042,291,830
COMPUTATION OF NET ASSET VALUE AND OFFERING PRICENet asset value and redemption price per class A share ($944,938,282 divided by 44,167,071 shares) $21.39 Offering price per class A share (100/94.25 of $21.39)* $22.69 Net asset value and offering price per class B share ($7,357,925 divided by 393,164 shares)** $18.71 Net asset value and offering price per class C share ($17,164,769 divided by 871,550 shares)** $19.69 Net asset value, offering price and redemption price per class R share ($750,531 divided by 35,394 shares) $21.21 Net asset value, offering price and redemption price per class R6 share ($20,409,696 divided by 916,632 shares) $22.27 Net asset value, offering price and redemption price per class Y share ($51,670,627 divided by 2,330,356 shares) $22.17
*On single retail sales of less than $50,000. On sales of $50,000 or more the offering price is reduced.**Redemption price per share is equal to net asset value less any applicable contingent deferred sales charge.
30 Focused International Equity Fund

The accompanying notes are an integral part of these financial statements.
Statement of operations Year ended 10/31/21
INVESTMENT INCOMEDividends (net of foreign tax of $1,333,363) $14,374,292Interest (including interest income of $14,862 from investments in affiliated issuers) (Note 5) 14,862 Securities lending (net of expenses) (Notes 1 and 5) 4,327Total investment income 14,393,481
EXPENSESCompensation of Manager (Note 2) 5,961,485 Investor servicing fees (Note 2) 1,674,132 Custodian fees (Note 2) 169,556 Trustee compensation and expenses (Note 2) 42,654 Distribution fees (Note 2) 2,594,156 Administrative services (Note 2) 25,852 Other 794,266 Total expenses 11,262,101
Expense reduction (Note 2) (1,031)Net expenses 11,261,070
Net investment income 3,132,411
REALIZED AND UNREALIZED GAIN (LOSS)Net realized gain (loss) on:
Securities from unaffiliated issuers (Notes 1 and 3) 294,207,731 Foreign currency transactions (Note 1) (928,367)Forward currency contracts (Note 1) (4,907,512)Futures contracts (Note 1) (1,900,747)
Total net realized gain 286,471,105 Change in net unrealized appreciation (depreciation) on:
Securities from unaffiliated issuers (net of foreign tax of $141,680) (43,372,541)Assets and liabilities in foreign currencies (24,616)Forward currency contracts 887,851 Futures contracts 22,550
Total change in net unrealized depreciation (42,486,756)
Net gain on investments 243,984,349
Net increase in net assets resulting from operations $247,116,760
Focused International Equity Fund 31

The accompanying notes are an integral part of these financial statements.
Statement of changes in net assets
INCREASE (DECREASE) IN NET ASSETS Year ended 10/31/21 Year ended 10/31/20OperationsNet investment income $3,132,411 $3,514,461 Net realized gain on investments and foreign currency transactions 286,471,105 2,841,301 Change in net unrealized appreciation (depreciation) of investments and assets and liabilities in foreign currencies (42,486,756) 4,213,613 Net increase in net assets resulting from operations 247,116,760 10,569,375 Distributions to shareholders (Note 1):
From ordinary incomeNet investment income
Class A (6,037,318) (420,954)Class R6 (269,213) (80,244)Class Y (517,962) (123,109)
Decrease from capital share transactions (Note 4) (87,399,012) (108,156,694)Total increase (decrease) in net assets 152,893,255 (98,211,626)
NET ASSETSBeginning of year 889,398,575 987,610,201
End of year $1,042,291,830 $889,398,575
32 Focused International Equity Fund

Focused International Equity Fund 33
This page left blank intentionally.
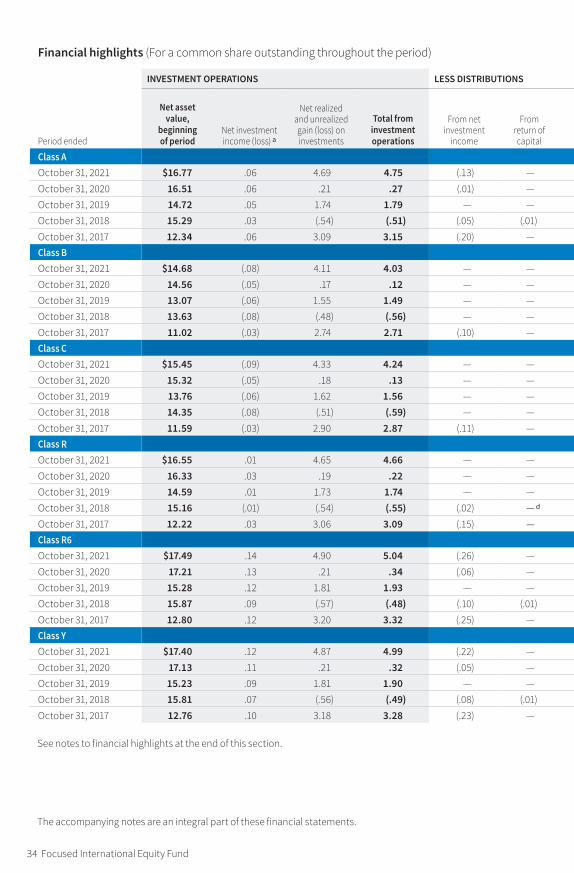
Fund _FundCode, — NumbCols Columns — This section modified: 11/18/21 3:45:21 PM Fund _FundCode, — NumbCols Columns — This section modified: 11/18/21 3:45:21 PM
34 Focused International Equity Fund
The accompanying notes are an integral part of these financial statements.
See notes to financial highlights at the end of this section.
Financial highlights (For a common share outstanding throughout the period)
INVESTMENT OPERATIONS LESS DISTRIBUTIONS RATIOS AND SUPPLEMENTAL DATA
Period ended
Net asset value,
beginning of period
Net investment income (loss ) a
Net realized and unrealized gain (loss) on investments
Total from investment operations
From net investment
income
From return of capital
Total dis tri bu tions
Non-recurring re im burse-
ments
Net asset value, end of period
Total return at net asset value (% ) b
Net assets, end of period
(in thousands )
Ratio of expenses
to average net assets
(% ) c
Ratio of net investment
income (loss) to average
net assets (% )
Portfolio turnover
(% )
Class AOctober 31, 2021 $16.77 .06 4.69 4.75 (.13 ) — (.13 ) — $21.39 28.41 $944,938 1.10 .31 125 October 31, 2020 16.51 .06 .21 .27 (.01 ) — (.01 ) — 16.77 1.62 799,870 1.13 .39 62 October 31, 2019 14.72 .05 1.74 1.79 — — — — d,e 16.51 12.16 871,070 1.15 .34 35 October 31, 2018 15.29 .03 (.54 ) (.51 ) (.05 ) (.01 ) (.06 ) — 14.72 (3.39 ) 685,082 1.15 .19 60 October 31, 2017 12.34 .06 3.09 3.15 (.20 ) — (.20 ) — d,f 15.29 25.87 744,923 1.12 .48 220 Class BOctober 31, 2021 $14.68 (.08 ) 4.11 4.03 — — — — $18.71 27.45 $7,358 1.85 (.46 ) 125 October 31, 2020 14.56 (.05 ) .17 .12 — — — — 14.68 .82 8,168 1.88 (.36 ) 62 October 31, 2019 13.07 (.06 ) 1.55 1.49 — — — — d,e 14.56 11.40 12,250 1.90 (.44 ) 35 October 31, 2018 13.63 (.08 ) (.48 ) (.56 ) — — — — 13.07 (4.11 ) 7,103 1.90 (.55 ) 60 October 31, 2017 11.02 (.03 ) 2.74 2.71 (.10 ) — (.10 ) — d,f 13.63 24.84 9,541 1.87 (.26 ) 220 Class COctober 31, 2021 $15.45 (.09 ) 4.33 4.24 — — — — $19.69 27.44 $17,165 1.85 (.46 ) 125 October 31, 2020 15.32 (.05 ) .18 .13 — — — — 15.45 .85 18,122 1.88 (.36 ) 62 October 31, 2019 13.76 (.06 ) 1.62 1.56 — — — — d,e 15.32 11.34 22,912 1.90 (.45 ) 35 October 31, 2018 14.35 (.08 ) (.51 ) (.59 ) — — — — 13.76 (4.11 ) 10,942 1.90 (.54 ) 60 October 31, 2017 11.59 (.03 ) 2.90 2.87 (.11 ) — (.11 ) — d,f 14.35 24.94 19,322 1.87 (.27 ) 220 Class ROctober 31, 2021 $16.55 .01 4.65 4.66 — — — — $21.21 28.16 $751 1.35 .06 125 October 31, 2020 16.33 .03 .19 .22 — — — — 16.55 1.35 752 1.38 .18 62 October 31, 2019 14.59 .01 1.73 1.74 — — — — d,e 16.33 11.93 1,304 1.40 — g 35 October 31, 2018 15.16 (.01 ) (.54 ) (.55 ) (.02 ) — d (.02 ) — 14.59 (3.62 ) 282 1.40 (.08 ) 60 October 31, 2017 12.22 .03 3.06 3.09 (.15 ) — (.15 ) — d,f 15.16 25.55 571 1.37 .22 220 Class R6October 31, 2021 $17.49 .14 4.90 5.04 (.26 ) — (.26 ) — $22.27 28.95 $20,410 .73 .65 125 October 31, 2020 17.21 .13 .21 .34 (.06 ) — (.06 ) — 17.49 1.99 19,620 .74 .78 62 October 31, 2019 15.28 .12 1.81 1.93 — — — — d,e 17.21 12.63 21,642 .77 .73 35 October 31, 2018 15.87 .09 (.57 ) (.48 ) (.10 ) (.01 ) (.11 ) — 15.28 (3.04 ) 17,636 .76 .57 60 October 31, 2017 12.80 .12 3.20 3.32 (.25 ) — (.25 ) — d,f 15.87 26.40 16,773 .72 .88 220 Class YOctober 31, 2021 $17.40 .12 4.87 4.99 (.22 ) — (.22 ) — $22.17 28.78 $51,671 .85 .56 125 October 31, 2020 17.13 .11 .21 .32 (.05 ) — (.05 ) — 17.40 1.83 42,867 .88 .64 62 October 31, 2019 15.23 .09 1.81 1.90 — — — — d,e 17.13 12.48 47,215 .90 .58 35 October 31, 2018 15.81 .07 (.56 ) (.49 ) (.08 ) (.01 ) (.09 ) — 15.23 (3.12 ) 33,325 .90 .44 60 October 31, 2017 12.76 .10 3.18 3.28 (.23 ) — (.23 ) — d,f 15.81 26.13 34,179 .87 .72 220
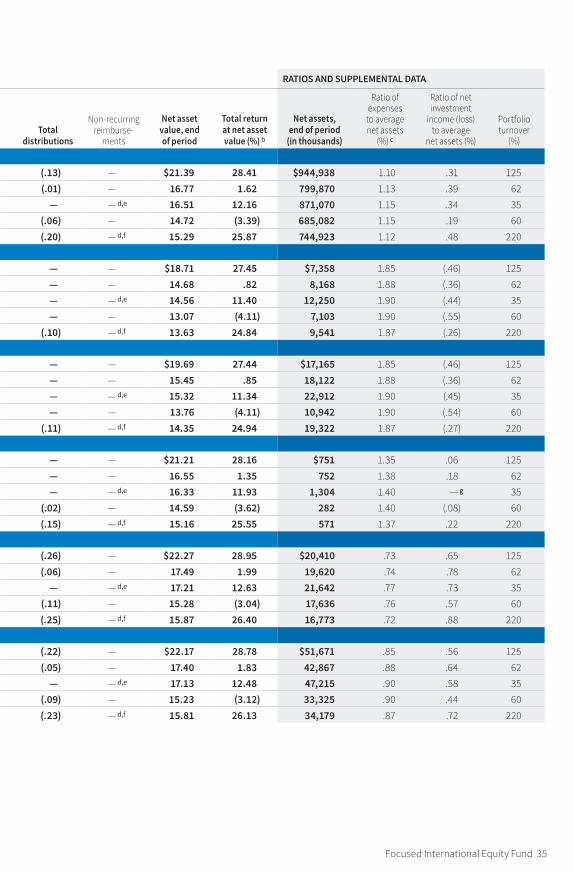
Fund _FundCode, — NumbCols Columns — This section modified: 11/18/21 3:45:21 PM Fund _FundCode, — NumbCols Columns — This section modified: 11/18/21 3:45:21 PM
Focused International Equity Fund 35
Financial highlights (For a common share outstanding throughout the period)
INVESTMENT OPERATIONS LESS DISTRIBUTIONS RATIOS AND SUPPLEMENTAL DATA
Period ended
Net asset value,
beginning of period
Net investment income (loss ) a
Net realized and unrealized gain (loss) on investments
Total from investment operations
From net investment
income
From return of capital
Total dis tri bu tions
Non-recurring re im burse-
ments
Net asset value, end of period
Total return at net asset value (% ) b
Net assets, end of period
(in thousands )
Ratio of expenses
to average net assets
(% ) c
Ratio of net investment
income (loss) to average
net assets (% )
Portfolio turnover
(% )
Class AOctober 31, 2021 $16.77 .06 4.69 4.75 (.13 ) — (.13 ) — $21.39 28.41 $944,938 1.10 .31 125 October 31, 2020 16.51 .06 .21 .27 (.01 ) — (.01 ) — 16.77 1.62 799,870 1.13 .39 62 October 31, 2019 14.72 .05 1.74 1.79 — — — — d,e 16.51 12.16 871,070 1.15 .34 35 October 31, 2018 15.29 .03 (.54 ) (.51 ) (.05 ) (.01 ) (.06 ) — 14.72 (3.39 ) 685,082 1.15 .19 60 October 31, 2017 12.34 .06 3.09 3.15 (.20 ) — (.20 ) — d,f 15.29 25.87 744,923 1.12 .48 220 Class BOctober 31, 2021 $14.68 (.08 ) 4.11 4.03 — — — — $18.71 27.45 $7,358 1.85 (.46 ) 125 October 31, 2020 14.56 (.05 ) .17 .12 — — — — 14.68 .82 8,168 1.88 (.36 ) 62 October 31, 2019 13.07 (.06 ) 1.55 1.49 — — — — d,e 14.56 11.40 12,250 1.90 (.44 ) 35 October 31, 2018 13.63 (.08 ) (.48 ) (.56 ) — — — — 13.07 (4.11 ) 7,103 1.90 (.55 ) 60 October 31, 2017 11.02 (.03 ) 2.74 2.71 (.10 ) — (.10 ) — d,f 13.63 24.84 9,541 1.87 (.26 ) 220 Class COctober 31, 2021 $15.45 (.09 ) 4.33 4.24 — — — — $19.69 27.44 $17,165 1.85 (.46 ) 125 October 31, 2020 15.32 (.05 ) .18 .13 — — — — 15.45 .85 18,122 1.88 (.36 ) 62 October 31, 2019 13.76 (.06 ) 1.62 1.56 — — — — d,e 15.32 11.34 22,912 1.90 (.45 ) 35 October 31, 2018 14.35 (.08 ) (.51 ) (.59 ) — — — — 13.76 (4.11 ) 10,942 1.90 (.54 ) 60 October 31, 2017 11.59 (.03 ) 2.90 2.87 (.11 ) — (.11 ) — d,f 14.35 24.94 19,322 1.87 (.27 ) 220 Class ROctober 31, 2021 $16.55 .01 4.65 4.66 — — — — $21.21 28.16 $751 1.35 .06 125 October 31, 2020 16.33 .03 .19 .22 — — — — 16.55 1.35 752 1.38 .18 62 October 31, 2019 14.59 .01 1.73 1.74 — — — — d,e 16.33 11.93 1,304 1.40 — g 35 October 31, 2018 15.16 (.01 ) (.54 ) (.55 ) (.02 ) — d (.02 ) — 14.59 (3.62 ) 282 1.40 (.08 ) 60 October 31, 2017 12.22 .03 3.06 3.09 (.15 ) — (.15 ) — d,f 15.16 25.55 571 1.37 .22 220 Class R6October 31, 2021 $17.49 .14 4.90 5.04 (.26 ) — (.26 ) — $22.27 28.95 $20,410 .73 .65 125 October 31, 2020 17.21 .13 .21 .34 (.06 ) — (.06 ) — 17.49 1.99 19,620 .74 .78 62 October 31, 2019 15.28 .12 1.81 1.93 — — — — d,e 17.21 12.63 21,642 .77 .73 35 October 31, 2018 15.87 .09 (.57 ) (.48 ) (.10 ) (.01 ) (.11 ) — 15.28 (3.04 ) 17,636 .76 .57 60 October 31, 2017 12.80 .12 3.20 3.32 (.25 ) — (.25 ) — d,f 15.87 26.40 16,773 .72 .88 220 Class YOctober 31, 2021 $17.40 .12 4.87 4.99 (.22 ) — (.22 ) — $22.17 28.78 $51,671 .85 .56 125 October 31, 2020 17.13 .11 .21 .32 (.05 ) — (.05 ) — 17.40 1.83 42,867 .88 .64 62 October 31, 2019 15.23 .09 1.81 1.90 — — — — d,e 17.13 12.48 47,215 .90 .58 35 October 31, 2018 15.81 .07 (.56 ) (.49 ) (.08 ) (.01 ) (.09 ) — 15.23 (3.12 ) 33,325 .90 .44 60 October 31, 2017 12.76 .10 3.18 3.28 (.23 ) — (.23 ) — d,f 15.81 26.13 34,179 .87 .72 220
Fund _FundCode, — NumbCols Columns — This section modified: 11/18/21 3:45:21 PM Fund _FundCode, — NumbCols Columns — This section modified: 11/18/21 3:45:21 PM
36 Focused International Equity Fund
Financial highlights cont.
The accompanying notes are an integral part of these financial statements.
Before April 1, 2021, the fund was managed with a materially different investment strategy and may have achieved materially different performance results under its current investment strategy from that shown for periods before this date.
a Per share net investment income (loss) has been determined on the basis of the weighted average number of shares outstanding during the period.
b Total return assumes dividend reinvestment and does not reflect the effect of sales charges. c Includes amounts paid through expense offset and brokerage/service arrangements, if any (Note 2). Also excludes
acquired fund fees, if any. d Amount represents less than $0.01 per share. e Reflects a non-recurring reimbursement pursuant to a settlement between the Securities and Exchange Commission
(the SEC) and Canadian Imperial Holdings, Inc. and CIBC World Markets Corp., which amounted to less than $0.01 per share outstanding on March 6, 2019.
f Reflects a non-recurring reimbursement pursuant to a settlement between the SEC and Haidar Capital Management/Haidar Capital Advisors, which amounted to less than $0.01 per share outstanding on February 15, 2017.
g Amount represents less than 0.01%.

Focused International Equity Fund 37
Notes to financial statements 10/31/21
Within the following Notes to financial statements, references to “State Street” represent State Street Bank and Trust Company, references to “the SEC” represent the Securities and Exchange Commission, references to “Putnam Management” represent Putnam Investment Management, LLC, the fund’s manager, an indirect wholly-owned subsidiary of Putnam Investments, LLC and references to “OTC”, if any, represent over-the-counter. Unless otherwise noted, the “reporting period” represents the period from November 1, 2020 through October 31, 2021.
Putnam Focused International Equity Fund (the fund) is a Massachusetts business trust, which is registered under the Investment Company Act of 1940, as amended, as a non-diversified open-end management investment company. Prior to April 1, 2021, the name of the fund was Putnam Global Equity Fund. The goal of the fund is to seek capital appreciation. The fund invests mainly in common stocks (growth or value stocks or both) of compa-nies of any size outside the United States that Putnam Management believes have favorable investment potential. Under normal circumstances, Putnam Management invests at least 80% of the fund’s net assets in equity invest-ments. This policy may be changed only after 60 days’ notice to shareholders. The fund’s equity investments may include common stocks, preferred stocks, convertible securities, warrants, American Depositary Receipts (ADRs) and Global Depositary Receipts (GDRs). The fund invests in both developed countries and in emerging markets. Putnam Management may consider, among other factors, a company’s valuation, financial strength, growth potential, competitive position in its industry, projected future earnings, cash flows and dividends when deciding whether to buy or sell investments. Putnam Management may also consider other factors that it believes will cause the stock price to rise. The fund may also use derivatives, such as futures, options, certain foreign currency transactions, warrants and swap contracts, for both hedging and non-hedging purposes. The fund is “non-diversified,” which means it may invest a greater percentage of its assets in fewer issuers than a “diversified” fund. The fund expects to invest in a limited number of issuers.
The fund offers class A, class B, class C, class R, class R6 and class Y shares. Purchases of class B shares are closed to new and existing investors except by exchange from class B shares of another Putnam fund or through dividend and/or capital gains reinvestment. Class A shares are sold with a maximum front-end sales charge of 5.75%. Class A shares generally are not subject to a contingent deferred sales charge, and class R, class R6 and class Y shares are not subject to a contingent deferred sales charge. Class B shares, which convert to class A shares after approximately eight years, are not subject to a front-end sales charge and are subject to a contingent deferred sales charge if those shares are redeemed within six years of purchase. Class C shares are subject to a one-year 1.00% contingent deferred sales charge and generally convert to class A shares after approximately eight years. Prior to March 1, 2021, class C shares generally converted to class A shares after approximately ten years. Class R shares, which are not available to all investors, are sold at net asset value. The expenses for class A, class B, class C and class R shares may differ based on the distribution fee of each class, which is identified in Note 2. Class R6 and class Y shares, which are sold at net asset value, are generally subject to the same expenses as class A, class B, class C and class R shares, but do not bear a distribution fee, and in the case of class R6 shares, bear a lower investor servicing fee, which is identified in Note 2. Class R6 and class Y shares are not available to all investors.
In the normal course of business, the fund enters into contracts that may include agreements to indemnify another party under given circumstances. The fund’s maximum exposure under these arrangements is unknown as this would involve future claims that may be, but have not yet been, made against the fund. However, the fund’s management team expects the risk of material loss to be remote.
The fund has entered into contractual arrangements with an investment adviser, administrator, distributor, share-holder servicing agent and custodian, who each provide services to the fund. Unless expressly stated otherwise, shareholders are not parties to, or intended beneficiaries of these contractual arrangements, and these contrac-tual arrangements are not intended to create any shareholder right to enforce them against the service providers or to seek any remedy under them against the service providers, either directly or on behalf of the fund.
Under the fund’s Amended and Restated Agreement and Declaration of Trust, any claims asserted against or on behalf of the Putnam Funds, including claims against Trustees and Officers, must be brought in state and federal courts located within the Commonwealth of Massachusetts.
Note 1: Significant accounting policiesThe following is a summary of significant accounting policies consistently followed by the fund in the preparation of its financial statements. The preparation of financial statements is in conformity with accounting principles generally accepted in the United States of America and requires management to make estimates and assump-tions that affect the reported amounts of assets and liabilities in the financial statements and the reported amounts of increases and decreases in net assets from operations. Actual results could differ from those
38 Focused International Equity Fund
estimates. Subsequent events after the Statement of assets and liabilities date through the date that the financial statements were issued have been evaluated in the preparation of the financial statements.
Investment income, realized and unrealized gains and losses and expenses of the fund are borne pro-rata based on the relative net assets of each class to the total net assets of the fund, except that each class bears expenses unique to that class (including the distribution fees applicable to such classes). Each class votes as a class only with respect to its own distribution plan or other matters on which a class vote is required by law or determined by the Trustees. If the fund were liquidated, shares of each class would receive their pro-rata share of the net assets of the fund. In addition, the Trustees declare separate dividends on each class of shares.
Security valuation Portfolio securities and other investments are valued using policies and procedures adopted by the Board of Trustees. The Trustees have formed a Pricing Committee to oversee the implementation of these procedures and have delegated responsibility for valuing the fund’s assets in accordance with these procedures to Putnam Management. Putnam Management has established an internal Valuation Committee that is respon-sible for making fair value determinations, evaluating the effectiveness of the pricing policies of the fund and reporting to the Pricing Committee.
Investments for which market quotations are readily available are valued at the last reported sales price on their principal exchange, or official closing price for certain markets, and are classified as Level 1 securities under Accounting Standards Codification 820 Fair Value Measurements and Disclosures (ASC 820). If no sales are reported, as in the case of some securities that are traded OTC, a security is valued at its last reported bid price and is generally categorized as a Level 2 security.
Investments in open-end investment companies (excluding exchange-traded funds), if any, which can be classi-fied as Level 1 or Level 2 securities, are valued based on their net asset value. The net asset value of such invest-ment companies equals the total value of their assets less their liabilities and divided by the number of their outstanding shares.
Market quotations are not considered to be readily available for certain debt obligations (including short-term investments with remaining maturities of 60 days or less) and other investments; such investments are valued on the basis of valuations furnished by an independent pricing service approved by the Trustees or dealers selected by Putnam Management. Such services or dealers determine valuations for normal institutional-size trading units of such securities using methods based on market transactions for comparable securities and various relation-ships, generally recognized by institutional traders, between securities (which consider such factors as security prices, yields, maturities and ratings). These securities will generally be categorized as Level 2.
Many securities markets and exchanges outside the U.S. close prior to the scheduled close of the New York Stock Exchange and therefore the closing prices for securities in such markets or on such exchanges may not fully reflect events that occur after such close but before the scheduled close of the New York Stock Exchange. Accord-ingly, on certain days, the fund will fair value certain foreign equity securities taking into account multiple factors including movements in the U.S. securities markets, currency valuations and comparisons to the valuation of American Depository Receipts, exchange-traded funds and futures contracts. The foreign equity securities, which would generally be classified as Level 1 securities, will be transferred to Level 2 of the fair value hierarchy when they are valued at fair value. The number of days on which fair value prices will be used will depend on market activity and it is possible that fair value prices will be used by the fund to a significant extent. At the close of the reporting period, fair value pricing was used for certain foreign securities in the portfolio. Securities quoted in foreign currencies, if any, are translated into U.S. dollars at the current exchange rate.
To the extent a pricing service or dealer is unable to value a security or provides a valuation that Putnam Manage-ment does not believe accurately reflects the security’s fair value, the security will be valued at fair value by Putnam Management in accordance with policies and procedures approved by the Trustees. Certain invest-ments, including certain restricted and illiquid securities and derivatives, are also valued at fair value following procedures approved by the Trustees. These valuations consider such factors as significant market or specific security events such as interest rate or credit quality changes, various relationships with other securities, discount rates, U.S. Treasury, U.S. swap and credit yields, index levels, convexity exposures, recovery rates, sales and other multiples and resale restrictions. These securities are classified as Level 2 or as Level 3 depending on the priority of the significant inputs.
To assess the continuing appropriateness of fair valuations, the Valuation Committee reviews and affirms the reasonableness of such valuations on a regular basis after considering all relevant information that is reasonably available. Such valuations and procedures are reviewed periodically by the Trustees. The fair value of securities is generally determined as the amount that the fund could reasonably expect to realize from an orderly disposition of such securities over a reasonable period of time. By its nature, a fair value price is a good faith estimate of

Focused International Equity Fund 39
the value of a security in a current sale and does not reflect an actual market price, which may be different by a material amount.
Joint trading account Pursuant to an exemptive order from the SEC, the fund may transfer uninvested cash balances into a joint trading account along with the cash of other registered investment companies and certain other accounts managed by Putnam Management. These balances may be invested in issues of short-term investments having maturities of up to 90 days.
Repurchase agreements The fund, or any joint trading account, through its custodian, receives delivery of the underlying securities, the fair value of which at the time of purchase is required to be in an amount at least equal to the resale price, including accrued interest. Collateral for certain tri-party repurchase agreements, is held at the counterparty’s custodian in a segregated account for the benefit of the fund and the counterparty. Putnam Management is responsible for determining that the value of these underlying securities is at all times at least equal to the resale price, including accrued interest. In the event of default or bankruptcy by the other party to the agreement, retention of the collateral may be subject to legal proceedings.
Security transactions and related investment income Security transactions are recorded on the trade date (the date the order to buy or sell is executed). Gains or losses on securities sold are determined on the identified cost basis.
Interest income, net of any applicable withholding taxes, if any, and including amortization and accretion of premiums and discounts on debt securities, is recorded on the accrual basis. Dividend income, net of any appli-cable withholding taxes, is recognized on the ex-dividend date except that certain dividends from foreign securi-ties, if any, are recognized as soon as the fund is informed of the ex-dividend date. Non-cash dividends, if any, are recorded at the fair value of the securities received. Dividends representing a return of capital or capital gains, if any, are reflected as a reduction of cost and/or as a realized gain.
Foreign currency translation The accounting records of the fund are maintained in U.S. dollars. The fair value of foreign securities, currency holdings, and other assets and liabilities is recorded in the books and records of the fund after translation to U.S. dollars based on the exchange rates on that day. The cost of each security is determined using historical exchange rates. Income and withholding taxes are translated at prevailing exchange rates when earned or incurred. The fund does not isolate that portion of realized or unrealized gains or losses resulting from changes in the foreign exchange rate on investments from fluctuations arising from changes in the market prices of the securities. Such gains and losses are included with the net realized and unrealized gain or loss on investments. Net realized gains and losses on foreign currency transactions represent net realized exchange gains or losses on disposition of foreign currencies, currency gains and losses realized between the trade and settlement dates on securities transactions and the difference between the amount of investment income and foreign withholding taxes recorded on the fund’s books and the U.S. dollar equivalent amounts actually received or paid. Net unrealized appreciation and depreciation of assets and liabilities in foreign currencies arise from changes in the value of assets and liabilities other than investments at the period end, resulting from changes in the exchange rate.
Futures contracts The fund uses futures contracts to equitize cash.
The potential risk to the fund is that the change in value of futures contracts may not correspond to the change in value of the hedged instruments. In addition, losses may arise from changes in the value of the underlying instru-ments, if there is an illiquid secondary market for the contracts, if interest or exchange rates move unexpectedly or if the counterparty to the contract is unable to perform. With futures, there is minimal counterparty credit risk to the fund since futures are exchange traded and the exchange’s clearinghouse, as counterparty to all exchange traded futures, guarantees the futures against default. Risks may exceed amounts recognized on the State-ment of assets and liabilities. When the contract is closed, the fund records a realized gain or loss equal to the difference between the value of the contract at the time it was opened and the value at the time it was closed.
Futures contracts are valued at the quoted daily settlement prices established by the exchange on which they trade. The fund and the broker agree to exchange an amount of cash equal to the daily fluctuation in the value of the futures contract. Such receipts or payments are known as “variation margin.”
Futures contracts outstanding at period end, if any, are listed after the fund’s portfolio.
Forward currency contracts The fund buys and sells forward currency contracts, which are agreements between two parties to buy and sell currencies at a set price on a future date. These contracts are used to hedge foreign exchange risk.
The U.S. dollar value of forward currency contracts is determined using current forward currency exchange rates supplied by a quotation service. The fair value of the contract will fluctuate with changes in currency exchange
40 Focused International Equity Fund
rates. The contract is marked to market daily and the change in fair value is recorded as an unrealized gain or loss. The fund records a realized gain or loss equal to the difference between the value of the contract at the time it was opened and the value at the time it was closed when the contract matures or by delivery of the currency. The fund could be exposed to risk if the value of the currency changes unfavorably, if the counterparties to the contracts are unable to meet the terms of their contracts or if the fund is unable to enter into a closing position. Risks may exceed amounts recognized on the Statement of assets and liabilities.
Forward currency contracts outstanding at period end, if any, are listed after the fund’s portfolio.
Master agreements The fund is a party to ISDA (International Swaps and Derivatives Association, Inc.) Master Agreements (Master Agreements) with certain counterparties that govern OTC derivative and foreign exchange contracts entered into from time to time. The Master Agreements may contain provisions regarding, among other things, the parties’ general obligations, representations, agreements, collateral requirements, events of default and early termination. With respect to certain counterparties, in accordance with the terms of the Master Agree-ments, collateral pledged to the fund is held in a segregated account by the fund’s custodian and, with respect to those amounts which can be sold or repledged, is presented in the fund’s portfolio.
Collateral pledged by the fund is segregated by the fund’s custodian and identified in the fund’s portfolio. Collat-eral can be in the form of cash or debt securities issued by the U.S. Government or related agencies or other secu-rities as agreed to by the fund and the applicable counterparty. Collateral requirements are determined based on the fund’s net position with each counterparty.
Termination events applicable to the fund may occur upon a decline in the fund’s net assets below a speci-fied threshold over a certain period of time. Termination events applicable to counterparties may occur upon a decline in the counterparty’s long-term and short-term credit ratings below a specified level. In each case, upon occurrence, the other party may elect to terminate early and cause settlement of all derivative and foreign exchange contracts outstanding, including the payment of any losses and costs resulting from such early termination, as reasonably determined by the terminating party. Any decision by one or more of the fund’s counterparties to elect early termination could impact the fund’s future derivative activity.
At the close of the reporting period, the fund did not have a net liability position on open derivative contracts subject to the Master Agreements.
Securities lending The fund may lend securities, through its agent, to qualified borrowers in order to earn addi-tional income. The loans are collateralized by cash in an amount at least equal to the fair value of the securities loaned. The fair value of securities loaned is determined daily and any additional required collateral is allocated to the fund on the next business day. The remaining maturities of the securities lending transactions are consid-ered overnight and continuous. The risk of borrower default will be borne by the fund’s agent; the fund will bear the risk of loss with respect to the investment of the cash collateral. Income from securities lending, net of expenses, is included in investment income on the Statement of operations. Cash collateral is invested in Putnam Cash Collateral Pool, LLC, a limited liability company managed by an affiliate of Putnam Management. Invest-ments in Putnam Cash Collateral Pool, LLC are valued at its closing net asset value each business day. There are no management fees charged to Putnam Cash Collateral Pool, LLC. At the close of the reporting period, the fund had no securities out on loan.
Interfund lending The fund, along with other Putnam funds, may participate in an interfund lending program pursuant to an exemptive order issued by the SEC. This program allows the fund to borrow from or lend to other Putnam funds that permit such transactions. Interfund lending transactions are subject to each fund’s investment policies and borrowing and lending limits. Interest earned or paid on the interfund lending transac-tion will be based on the average of certain current market rates. During the reporting period, the fund did not utilize the program.
Lines of credit The fund participates, along with other Putnam funds, in a $317.5 million unsecured committed line of credit and a $235.5 million unsecured uncommitted line of credit, both provided by State Street. Borrow-ings may be made for temporary or emergency purposes, including the funding of shareholder redemption requests and trade settlements. Interest is charged to the fund based on the fund’s borrowing at a rate equal to 1.25% plus the higher of (1) the Federal Funds rate and (2) the Overnight Bank Funding Rate for the committed line of credit and 1.30% plus the higher of (1) the Federal Funds rate and (2) the Overnight Bank Funding Rate for the uncommitted line of credit. A closing fee equal to 0.04% of the committed line of credit and 0.04% of the uncommitted line of credit has been paid by the participating funds. In addition, a commitment fee of 0.21% per annum on any unutilized portion of the committed line of credit is allocated to the participating funds based on their relative net assets and paid quarterly. During the reporting period, the fund had no borrowings against these arrangements.
Focused International Equity Fund 41
Federal taxes It is the policy of the fund to distribute all of its taxable income within the prescribed time period and otherwise comply with the provisions of the Internal Revenue Code of 1986, as amended (the Code), appli-cable to regulated investment companies. It is also the intention of the fund to distribute an amount sufficient to avoid imposition of any excise tax under Section 4982 of the Code.
The fund is subject to the provisions of Accounting Standards Codification 740 Income Taxes (ASC 740). ASC 740 sets forth a minimum threshold for financial statement recognition of the benefit of a tax position taken or expected to be taken in a tax return. The fund did not have a liability to record for any unrecognized tax benefits in the accompanying financial statements. No provision has been made for federal taxes on income, capital gains or unrealized appreciation on securities held nor for excise tax on income and capital gains. Each of the fund’s federal tax returns for the prior three fiscal years remains subject to examination by the Internal Revenue Service.
The fund may also be subject to taxes imposed by governments of countries in which it invests. Such taxes are generally based on either income or gains earned or repatriated. The fund accrues and applies such taxes to net investment income, net realized gains and net unrealized gains as income and/or capital gains are earned. In some cases, the fund may be entitled to reclaim all or a portion of such taxes, and such reclaim amounts, if any, are reflected as an asset on the fund’s books. In many cases, however, the fund may not receive such amounts for an extended period of time, depending on the country of investment.
Distributions to shareholders Distributions to shareholders from net investment income are recorded by the fund on the ex-dividend date. Distributions from capital gains, if any, are recorded on the ex-dividend date and paid at least annually. The amount and character of income and gains to be distributed are determined in accordance with income tax regulations, which may differ from generally accepted accounting principles. These differences include temporary and/or permanent differences from losses on wash sale transactions, from foreign currency gains and losses, from realized gains and losses on passive foreign investment companies and from partnership income. Reclassifications are made to the fund’s capital accounts to reflect income and gains available for distribution (or available capital loss carryovers) under income tax regulations. At the close of the reporting period, the fund reclassified $2,161,487 to decrease undistributed net investment income, $1,738 to decrease paid-in capital and $2,163,225 to increase accumulated net realized gain.
Tax cost of investments includes adjustments to net unrealized appreciation (depreciation) which may not neces-sarily be final tax cost basis adjustments, but closely approximate the tax basis unrealized gains and losses that may be realized and distributed to shareholders. The tax basis components of distributable earnings and the federal tax cost as of the close of the reporting period were as follows:
Unrealized appreciation $117,995,233
Unrealized depreciation (45,331,732 )
Net unrealized appreciation 72,663,501
Undistributed short-term gains 57,314,884
Undistributed long-term gains 197,921,434
Cost for federal income tax purposes $966,989,103
Note 2: Management fee, administrative services and other transactionsThe fund pays Putnam Management a management fee (base fee) (based on the fund’s average net assets and computed and paid monthly) at annual rates that may vary based on the average of the aggregate net assets of all open-end mutual funds sponsored by Putnam Management (excluding net assets of funds that are invested in, or that are invested in by, other Putnam funds to the extent necessary to avoid “double counting” of those assets). Such annual rates may vary as follows:
0.850 % of the first $5 billion,
0.800 % of the next $5 billion,
0.750 % of the next $10 billion,
0.700 % of the next $10 billion,
0.650 % of the next $50 billion,
0.630 % of the next $50 billion,
0.620 % of the next $100 billion and
0.615 % of any excess thereafter.
In addition, the monthly management fee consists of the monthly base fee plus or minus a performance adjust-ment for the month. The performance adjustment is determined based on performance over the thirty-six month period then ended. Each month, the performance adjustment is calculated by multiplying the performance adjustment rate and the fund’s average net assets over the performance period and dividing the result by twelve.

42 Focused International Equity Fund
The resulting dollar amount is added to, or subtracted from the base fee for that month. The performance adjust-ment rate is equal to 0.03 multiplied by the difference between the fund’s annualized performance (measured by the fund’s class A shares) and the annualized performance of the MSCI ACWI ex USA Index (Net Dividends) (MSCI World Index (Net Dividends) prior to April 1, 2021) measured over the performance period. Because the performance adjustment is based on a rolling thirty-six-month performance period, there will be a transition period during which the fund’s performance will be compared to a composite index that reflects the performance of the MSCI World Index (Net Dividends) for the portion of the performance period before April 1, 2021, and the performance of the MSCI ACWI ex USA Index (Net Dividends) for the remainder of the period. The maximum annualized performance adjustment rate is +/–0.15%. The monthly base fee is determined based on the fund’s average net assets for the month, while the performance adjustment is determined based on the fund’s average net assets over the thirty-six month performance period. This means it is possible that, if the fund underperforms significantly over the performance period, and the fund’s assets have declined significantly over that period, the negative performance adjustment may exceed the base fee. In this event, Putnam Management would make a payment to the fund.
In connection with the mergers of Putnam Global Consumer Fund, Putnam Global Financials Fund, Putnam Global Utilities Fund and Putnam Global Sector Fund (“acquired funds”) into the fund on June 17, 2019, the management contract was amended such that, after completion of the mergers, the combined fund’s perfor-mance adjustment will be calculated based on the combined assets of the fund and all acquired funds for any portion of a performance period that is prior to the mergers, unless the use of the combined assets results in a fee payable by the fund under the amended management contract that is higher than the management fee that would have been paid under the fund’s current management contract. Under those circumstances, Putnam Management has agreed to reduce its management fee to reflect the lower amount that would have been payable under the fund’s current fee schedule, which would only take into account the assets of the fund for the period prior to the closing of the mergers. As a result of these management contract changes, the fund’s share-holders may pay a lower management fee, but would never pay a higher management fee, under the amended management contract than they would have paid under the fund’s current management contract.
Because the performance adjustment is based on the fund’s performance relative to its applicable benchmark index, and not its absolute performance, the performance adjustment could increase Putnam Management’s fee even if the fund’s shares lose value during the performance period provided that the fund outperformed its benchmark index, and could decrease Putnam Management’s fee even if the fund’s shares increase in value during the performance period provided that the fund underperformed its benchmark index.
For the reporting period, the management fee represented an effective rate (excluding the impact of any expense waiver in effect) of 0.580% of the fund’s average net assets, which included an effective base fee of 0.681% and a decrease of 0.101% ($1,045,286) based on performance.
Putnam Management has contractually agreed, through February 28, 2023, to waive fees and/or reimburse the fund’s expenses to the extent necessary to limit the cumulative expenses of the fund, exclusive of brokerage, interest, taxes, investment-related expenses, extraordinary expenses, acquired fund fees and expenses and payments under the fund’s investor servicing contract, investment management contract and distribution plans, on a fiscal year-to-date basis to an annual rate of 0.20% of the fund’s average net assets over such fiscal year-to-date period. During the reporting period, the fund’s expenses were not reduced as a result of this limit.
Putnam Investments Limited (PIL), an affiliate of Putnam Management, is authorized by the Trustees to manage a separate portion of the assets of the fund as determined by Putnam Management from time to time. PIL did not manage any portion of the assets of the fund during the reporting period. If Putnam Management were to engage the services of PIL, Putnam Management would pay a quarterly sub-management fee to PIL for its services at an annual rate of 0.35% of the average net assets of the portion of the fund managed by PIL.
The Putnam Advisory Company, LLC (PAC), an affiliate of Putnam Management, is authorized by the Trustees to manage a separate portion of the assets of the fund, as designated from time to time by Putnam Management or PIL. PAC did not manage any portion of the assets of the fund during the reporting period. If Putnam Management or PIL were to engage the services of PAC, Putnam Management or PIL, as applicable, would pay a quarterly sub-advisory fee to PAC for its services at the annual rate of 0.35% of the average net assets of the portion of the fund’s assets for which PAC is engaged as sub-adviser.
The fund reimburses Putnam Management an allocated amount for the compensation and related expenses of certain officers of the fund and their staff who provide administrative services to the fund. The aggregate amount of all such reimbursements is determined annually by the Trustees.

Focused International Equity Fund 43
Custodial functions for the fund’s assets are provided by State Street. Custody fees are based on the fund’s asset level, the number of its security holdings and transaction volumes.
Putnam Investor Services, Inc., an affiliate of Putnam Management, provides investor servicing agent functions to the fund. Putnam Investor Services, Inc. received fees for investor servicing for class A, class B, class C, class R and class Y shares that included (1) a per account fee for each direct and underlying non-defined contribution account (retail account) of the fund; (2) a specified rate of the fund’s assets attributable to defined contribu-tion plan accounts; and (3) a specified rate based on the average net assets in retail accounts. Putnam Investor Services, Inc. has agreed that the aggregate investor servicing fees for each fund’s retail and defined contribution accounts for these share classes will not exceed an annual rate of 0.25% of the fund’s average assets attributable to such accounts.
Class R6 shares paid a monthly fee based on the average net assets of class R6 shares at an annual rate of 0.05%.
During the reporting period, the expenses for each class of shares related to investor servicing fees were as follows:
Class A $1,533,674
Class B 13,788
Class C 30,912
Class R 1,172
Class R6 10,486
Class Y 84,100
Total $1,674,132
The fund has entered into expense offset arrangements with Putnam Investor Services, Inc. and State Street whereby Putnam Investor Services, Inc.’s and State Street’s fees are reduced by credits allowed on cash balances. For the reporting period, the fund’s expenses were reduced by $1,031 under the expense offset arrangements.
Each Independent Trustee of the fund receives an annual Trustee fee, of which $669, as a quarterly retainer, has been allocated to the fund, and an additional fee for each Trustees meeting attended. Trustees also are reimbursed for expenses they incur relating to their services as Trustees.
The fund has adopted a Trustee Fee Deferral Plan (the Deferral Plan) which allows the Trustees to defer the receipt of all or a portion of Trustees fees payable on or after July 1, 1995. The deferred fees remain invested in certain Putnam funds until distribution in accordance with the Deferral Plan.
The fund has adopted an unfunded noncontributory defined benefit pension plan (the Pension Plan) covering all Trustees of the fund who have served as a Trustee for at least five years and were first elected prior to 2004. Benefits under the Pension Plan are equal to 50% of the Trustee’s average annual attendance and retainer fees for the three years ended December 31, 2005. The retirement benefit is payable during a Trustee’s lifetime, beginning the year following retirement, for the number of years of service through December 31, 2006. Pension expense for the fund is included in Trustee compensation and expenses in the Statement of operations. Accrued pension liability is included in Payable for Trustee compensation and expenses in the Statement of assets and liabilities. The Trustees have terminated the Pension Plan with respect to any Trustee first elected after 2003.
The fund has adopted distribution plans (the Plans) with respect to the following share classes pursuant to Rule 12b–1 under the Investment Company Act of 1940. The purpose of the Plans is to compensate Putnam Retail Management Limited Partnership, an indirect wholly-owned subsidiary of Putnam Investments, LLC, for services provided and expenses incurred in distributing shares of the fund. The Plans provide payments by the fund to Putnam Retail Management Limited Partnership at an annual rate of up to the following amounts (Maximum %) of the average net assets attributable to each class. The Trustees have approved payment by the fund at the following annual rate (Approved %) of the average net assets attributable to each class. During the reporting period, the class-specific expenses related to distribution fees were as follows:
Maximum % Approved % Amount
Class A 0.35 % 0.25 % $2,320,733
Class B 1.00 % 1.00 % 83,253
Class C 1.00 % 1.00 % 186,626
Class R 1.00 % 0.50 % 3,544
Total $2,594,156
44 Focused International Equity Fund
For the reporting period, Putnam Retail Management Limited Partnership, acting as underwriter, received net commissions of $40,938 from the sale of class A shares and received $636 and $175 in contingent deferred sales charges from redemptions of class B and class C shares, respectively.
A deferred sales charge of up to 1.00% is assessed on certain redemptions of class A shares. For the reporting period, Putnam Retail Management Limited Partnership, acting as underwriter, received $176 on class A redemptions.
Note 3: Purchases and sales of securitiesDuring the reporting period, the cost of purchases and the proceeds from sales, excluding short-term investments, were as follows:
Cost of purchases Proceeds from sales
Investments in securities (Long-term ) $1,202,524,923 $1,304,233,311
U.S. government securities (Long-term ) — —
Total $1,202,524,923 $1,304,233,311
The fund may purchase or sell investments from or to other Putnam funds in the ordinary course of business, which can reduce the fund’s transaction costs, at prices determined in accordance with SEC requirements and policies approved by the Trustees. During the reporting period, purchases or sales of long-term securities from or to other Putnam funds, if any, did not represent more than 5% of the fund’s total cost of purchases and/or total proceeds from sales.
Note 4: Capital sharesAt the close of the reporting period, there were an unlimited number of shares of beneficial interest authorized. Transactions, including, if applicable, direct exchanges pursuant to share conversions, in capital shares were as follows:
YEAR ENDED 10/31/21 YEAR ENDED 10/31/20
Class A Shares Amount Shares Amount
Shares sold 945,441 $19,007,572 1,507,619 $25,035,956
Shares issued in connection with reinvestment of distributions 294,211 5,659,088 22,761 395,354
1,239,652 24,666,660 1,530,380 25,431,310
Shares repurchased (4,768,176 ) (96,077,012 ) (6,584,403 ) (106,270,256 )
Net decrease (3,528,524 ) $(71,410,352 ) (5,054,023 ) $(80,838,946 )
YEAR ENDED 10/31/21 YEAR ENDED 10/31/20
Class B Shares Amount Shares Amount
Shares sold 6,207 $103,263 7,058 $104,655
Shares issued in connection with reinvestment of distributions — — — —
6,207 103,263 7,058 104,655
Shares repurchased (169,365 ) (2,996,561 ) (292,139 ) (4,168,346 )
Net decrease (163,158 ) $(2,893,298 ) (285,081 ) $(4,063,691 )
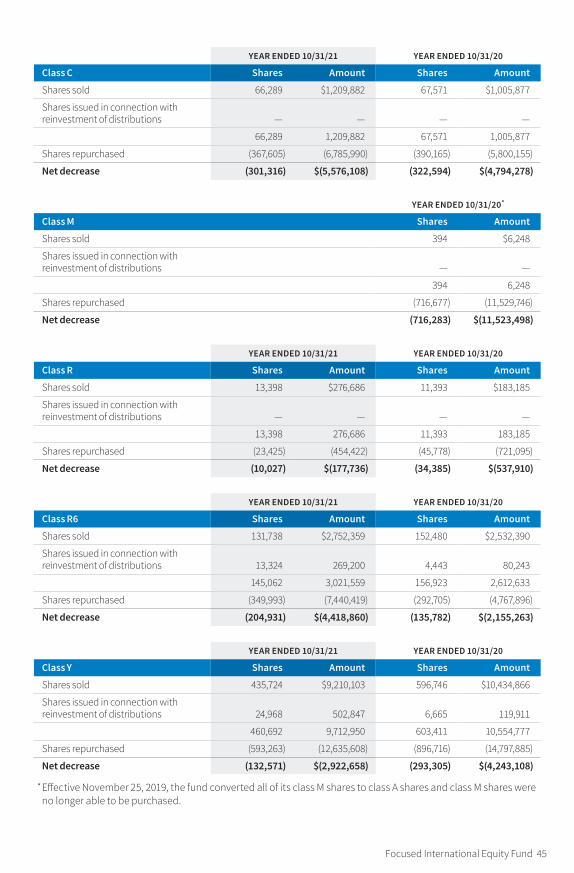
Focused International Equity Fund 45
YEAR ENDED 10/31/21 YEAR ENDED 10/31/20
Class C Shares Amount Shares Amount
Shares sold 66,289 $1,209,882 67,571 $1,005,877
Shares issued in connection with reinvestment of distributions — — — —
66,289 1,209,882 67,571 1,005,877
Shares repurchased (367,605 ) (6,785,990 ) (390,165 ) (5,800,155 )
Net decrease (301,316 ) $(5,576,108 ) (322,594 ) $(4,794,278 )
YEAR ENDED 10/31/20 *
Class M Shares Amount
Shares sold 394 $6,248
Shares issued in connection with reinvestment of distributions — —
394 6,248
Shares repurchased (716,677 ) (11,529,746 )
Net decrease (716,283 ) $(11,523,498 )
YEAR ENDED 10/31/21 YEAR ENDED 10/31/20
Class R Shares Amount Shares Amount
Shares sold 13,398 $276,686 11,393 $183,185
Shares issued in connection with reinvestment of distributions — — — —
13,398 276,686 11,393 183,185
Shares repurchased (23,425 ) (454,422 ) (45,778 ) (721,095 )
Net decrease (10,027 ) $(177,736 ) (34,385 ) $(537,910 )
YEAR ENDED 10/31/21 YEAR ENDED 10/31/20
Class R6 Shares Amount Shares Amount
Shares sold 131,738 $2,752,359 152,480 $2,532,390
Shares issued in connection with reinvestment of distributions 13,324 269,200 4,443 80,243
145,062 3,021,559 156,923 2,612,633
Shares repurchased (349,993 ) (7,440,419 ) (292,705 ) (4,767,896 )
Net decrease (204,931 ) $(4,418,860 ) (135,782 ) $(2,155,263 )
YEAR ENDED 10/31/21 YEAR ENDED 10/31/20
Class Y Shares Amount Shares Amount
Shares sold 435,724 $9,210,103 596,746 $10,434,866
Shares issued in connection with reinvestment of distributions 24,968 502,847 6,665 119,911
460,692 9,712,950 603,411 10,554,777
Shares repurchased (593,263 ) (12,635,608 ) (896,716 ) (14,797,885 )
Net decrease (132,571 ) $(2,922,658 ) (293,305 ) $(4,243,108 )
* Effective November 25, 2019, the fund converted all of its class M shares to class A shares and class M shares were no longer able to be purchased.
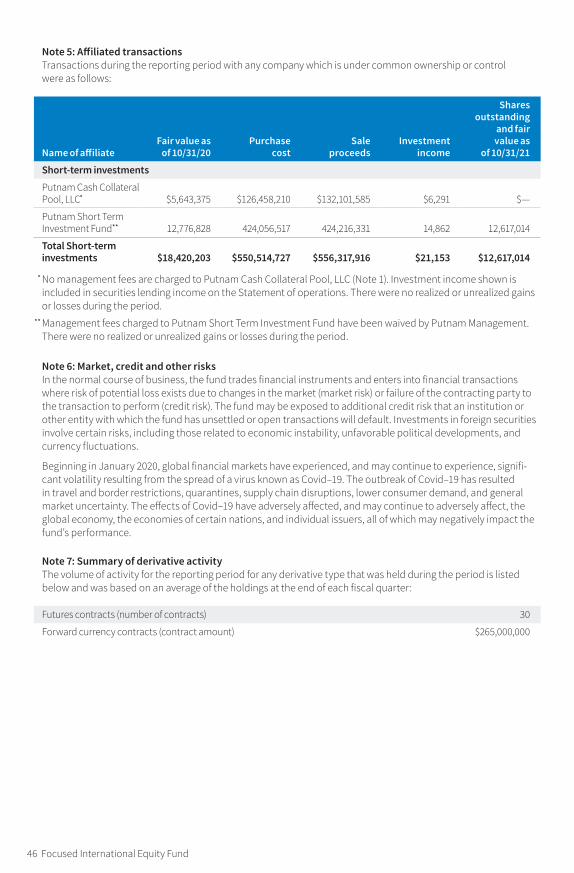
46 Focused International Equity Fund
Note 5: Affiliated transactionsTransactions during the reporting period with any company which is under common ownership or control were as follows:
Name of affiliateFair value as
of 10/31/20Purchase
costSale
proceedsInvestment
income
Shares outstanding
and fair value as
of 10/31/21
Short-term investments
Putnam Cash Collateral Pool, LLC * $5,643,375 $126,458,210 $132,101,585 $6,291 $—
Putnam Short Term Investment Fund * * 12,776,828 424,056,517 424,216,331 14,862 12,617,014
Total Short-term investments $18,420,203 $550,514,727 $556,317,916 $21,153 $12,617,014
* No management fees are charged to Putnam Cash Collateral Pool, LLC (Note 1). Investment income shown is included in securities lending income on the Statement of operations. There were no realized or unrealized gains or losses during the period.
** Management fees charged to Putnam Short Term Investment Fund have been waived by Putnam Management. There were no realized or unrealized gains or losses during the period.
Note 6: Market, credit and other risksIn the normal course of business, the fund trades financial instruments and enters into financial transactions where risk of potential loss exists due to changes in the market (market risk) or failure of the contracting party to the transaction to perform (credit risk). The fund may be exposed to additional credit risk that an institution or other entity with which the fund has unsettled or open transactions will default. Investments in foreign securities involve certain risks, including those related to economic instability, unfavorable political developments, and currency fluctuations.
Beginning in January 2020, global financial markets have experienced, and may continue to experience, signifi-cant volatility resulting from the spread of a virus known as Covid–19. The outbreak of Covid–19 has resulted in travel and border restrictions, quarantines, supply chain disruptions, lower consumer demand, and general market uncertainty. The effects of Covid–19 have adversely affected, and may continue to adversely affect, the global economy, the economies of certain nations, and individual issuers, all of which may negatively impact the fund’s performance.
Note 7: Summary of derivative activityThe volume of activity for the reporting period for any derivative type that was held during the period is listed below and was based on an average of the holdings at the end of each fiscal quarter:
Futures contracts (number of contracts ) 30
Forward currency contracts (contract amount ) $265,000,000
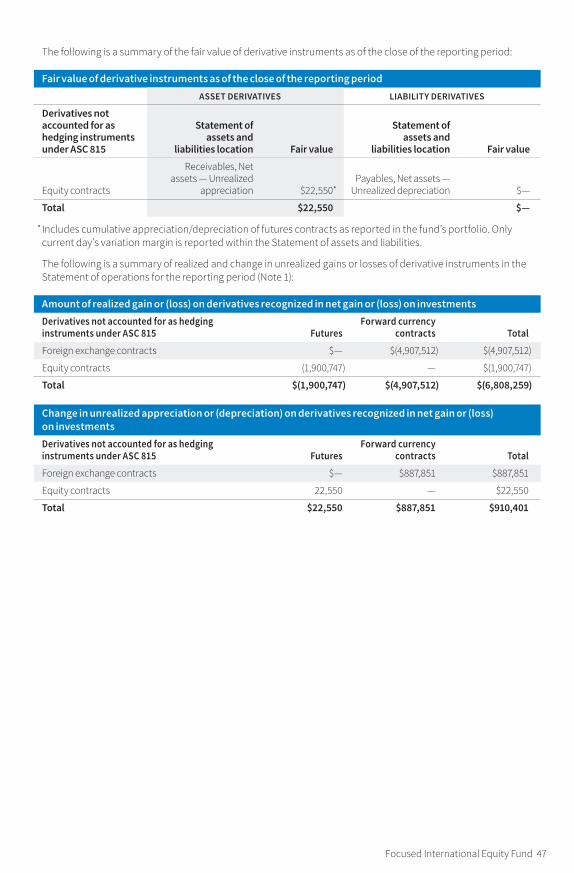
Focused International Equity Fund 47
The following is a summary of the fair value of derivative instruments as of the close of the reporting period:
Fair value of derivative instruments as of the close of the reporting periodASSET DERIVATIVES LIABILITY DERIVATIVES
Derivatives not accounted for as hedging instruments under ASC 815
Statement of assets and
liabilities location Fair value
Statement of assets and
liabilities location Fair value
Equity contracts
Receivables, Net assets — Unrealized
appreciation $22,550 *Payables, Net assets —
Unrealized depreciation $—
Total $22,550 $—
* Includes cumulative appreciation/depreciation of futures contracts as reported in the fund’s portfolio. Only current day’s variation margin is reported within the Statement of assets and liabilities.
The following is a summary of realized and change in unrealized gains or losses of derivative instruments in the Statement of operations for the reporting period (Note 1):
Amount of realized gain or (loss ) on derivatives recognized in net gain or (loss ) on investmentsDerivatives not accounted for as hedging instruments under ASC 815 Futures
Forward currency contracts Total
Foreign exchange contracts $— $(4,907,512 ) $(4,907,512 )
Equity contracts (1,900,747 ) — $(1,900,747 )
Total $(1,900,747 ) $(4,907,512 ) $(6,808,259 )
Change in unrealized appreciation or (depreciation ) on derivatives recognized in net gain or (loss ) on investmentsDerivatives not accounted for as hedging instruments under ASC 815 Futures
Forward currency contracts Total
Foreign exchange contracts $— $887,851 $887,851
Equity contracts 22,550 — $22,550
Total $22,550 $887,851 $910,401
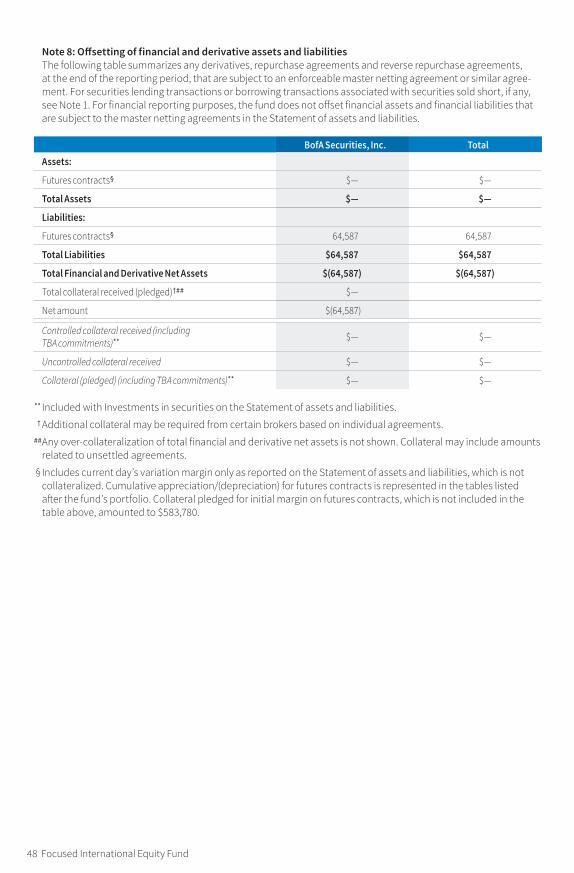
48 Focused International Equity Fund
Note 8: Offsetting of financial and derivative assets and liabilitiesThe following table summarizes any derivatives, repurchase agreements and reverse repurchase agreements, at the end of the reporting period, that are subject to an enforceable master netting agreement or similar agree-ment. For securities lending transactions or borrowing transactions associated with securities sold short, if any, see Note 1. For financial reporting purposes, the fund does not offset financial assets and financial liabilities that are subject to the master netting agreements in the Statement of assets and liabilities.
BofA Securities, Inc. TotalAssets:
Futures contracts§ $— $—
Total Assets $— $—
Liabilities:
Futures contracts§ 64,587 64,587
Total Liabilities $64,587 $64,587
Total Financial and Derivative Net Assets $(64,587) $(64,587)
Total collateral received (pledged)†## $—
Net amount $(64,587)
Controlled collateral received (including TBA commitments)** $— $—
Uncontrolled collateral received $— $—
Collateral (pledged) (including TBA commitments)** $— $—
** Included with Investments in securities on the Statement of assets and liabilities. † Additional collateral may be required from certain brokers based on individual agreements. ## Any over-collateralization of total financial and derivative net assets is not shown. Collateral may include amounts
related to unsettled agreements. § Includes current day’s variation margin only as reported on the Statement of assets and liabilities, which is not
collateralized. Cumulative appreciation/(depreciation) for futures contracts is represented in the tables listed after the fund’s portfolio. Collateral pledged for initial margin on futures contracts, which is not included in the table above, amounted to $583,780.
Focused International Equity Fund 49
Federal tax information (Unaudited)
Pursuant to §852 of the Internal Revenue Code, as amended, the fund hereby designates $217,713,577 as a capital gain dividend with respect to the taxable year ended October 31, 2021, or, if subsequently determined to be different, the net capital gain of such year.
For the reporting period, total interest and dividend income from foreign countries were $13,529,447, or $0.28 per share (for all classes of shares). Taxes paid to foreign countries were $1,333,363, or $0.03 per share (for all classes of shares).
The fund designated 3.98% of ordinary income distributions as qualifying for the dividends received deduction for corporations.
For the reporting period, the fund hereby designates 24.62%, or the maximum amount allowable, of its taxable ordinary income distributions as qualified dividends taxed at the individual net capital gain rates.
For the reporting period, pursuant to §871(k) of the Internal Revenue Code, the fund hereby desig-nates $187,674 of distributions paid as qualifying to be taxed as interest-related dividends, and no monies to be taxed as short-term capital gain dividends for nonresident alien shareholders.
The Form 1099 that will be mailed to you in January 2022 will show the tax status of all distributions paid to your account in calendar 2021.
Shareholder meeting results (Unaudited)
March 18, 2021 annual meeting
A proposal to approve a change to your fund’s sub classification under the Investment Company Act of 1940 from “diversified” to “non-diversified” was approved as follows:
Votes for Votes against Abstentions non-votes
21,644,452 3,554,177 2,661,256
A proposal to approve a new management contract that will change your fund’s performance index was approved as follows:
Votes for Votes against Abstentions non-votes
21,714,698 3,398,443 2,746,745
All tabulations are rounded to the nearest whole number.

About the TrusteesINDEPENDENT TRUSTEES
Liaquat Ahamed Born 1952, Trustee since 2012Principal occupations during past five years: Author; won Pulitzer Prize for Lords of Finance: The Bankers Who Broke
the World.
Other directorships: Chairman of the Sun Valley Writers Conference, a literary not-for-profit organization, and a Trustee of the Journal of Philosophy.
Ravi AkhouryBorn 1947, Trustee since 2009Principal occupations during past five years: Private investor
Other directorships: Director of English Helper, Inc., a private software company; Trustee of the Rubin Museum, serving on the Investment Committee; and previously a Director of RAGE Frameworks, Inc.
Barbara M. Baumann Born 1955, Trustee since 2010Principal occupations during past five years: President of Cross Creek Energy Corporation, a strategic
consultant to domestic energy firms and direct investor in energy projects.
Other directorships: Director of Devon Energy Corporation, a publicly traded independent natural gas and oil exploration and production company; Director of National Fuel Gas Company, a publicly traded energy company that engages in the production, gathering, transportation, distribution, and marketing of natural gas; Senior Advisor to the energy private equity firm First Reserve; Director of Ascent Resources, LLC, a private independent exploration and production company; Director of Texas American Resources Company II, a private, independent oil and gas exploration and production company; member of the Finance Committee of the Children’s Hospital of Colorado; member of the Investment Committee of the Board of The Denver Foundation; and previously a Director of publicly traded companies Buckeye Partners LP, UNS Energy Corporation, CVR Energy Company, and SM Energy Corporation.
Katinka DomotorffyBorn 1975, Trustee since 2012Principal occupations during past five years: Voting member of the Investment Committees of the Anne Ray Foundation
and Margaret A. Cargill Foundation, part of the Margaret A. Cargill Philanthropies.
Other directorships: Director of the Great Lakes Science Center and of College Now Greater Cleveland.
Catharine Bond HillBorn 1954, Trustee since 2017Principal occupations during past five years: Managing Director of Ithaka S+R, a not-for-profit service that
helps the academic community navigate economic and technological change. From 2006 to 2016, the 10th president of Vassar College.
Other directorships: Director of Yale-NUS College and Trustee of Yale University.
Paul L. JoskowBorn 1947, Trustee since 1997Principal occupations during past five years: The Elizabeth and James Killian Professor of Economics, Emeritus at the
Massachusetts Institute of Technology (MIT). From 2008 to 2017, the President of the Alfred P. Sloan Foundation, a philanthropic institution focused primarily on research and education on issues related to science, technology, and economic performance.
Other directorships: Vice Chair of the Board of Directors of the Whitehead Institute for Biomedical Research, a non-profit biomedical research institute; a Director of Exelon Corporation, an energy company focused on power services; and a member Emeritus of the Board of Advisors of the Boston Symphony Orchestra.
Kenneth R. LeiblerBorn 1949, Trustee since 2006 Vice Chair from 2016 to 2018, and Chair since 2018Principal occupations during past
five years: Vice Chairman Emeritus of the Board of Trustees of Beth Israel Deaconess Hospital in Boston. Member of the Investment Committee of the Boston Arts Academy Foundation.
Other directorships: Director of Eversource Corporation, which operates New England’s largest energy delivery system; previously the Chairman of the Boston Options Exchange, an electronic market place for the trading of listed derivatives securities; previously the Chairman and Chief Executive Officer of the Boston Stock Exchange; and previously the President and Chief Operating Officer of the American Stock Exchange.
50 Focused International Equity Fund

George Putnam, IIIBorn 1951, Trustee since 1984Principal occupations during past five years: Chairman of New Generation Research, Inc., a publisher of financial
advisory and other research services, and President of New Generation Advisors, LLC, a registered investment adviser to private funds.
Other directorships: Director of The Boston Family Office, LLC, a registered investment advisor; a Trustee of the Gloucester Marine Genomics Institute; previously a Trustee of the Marine Biological Laboratory; and previously a Trustee of Epiphany School.
Manoj P. SinghBorn 1952, Trustee since 2017Principal occupations during past five years: Until 2015, Chief Operating Officer and Global Managing Director at
Deloitte Touche Tohmatsu, Ltd., a global professional services organization, serving on the Deloitte U.S. Board of Directors and the boards of Deloitte member firms in China, Mexico, and Southeast Asia.
Other directorships: Director of Abt Associates, a global research firm working in the fields of health, social and environmental policy, and international development; Trustee of Carnegie Mellon University; Director of Pratham USA, an organization dedicated to children’s education in India; member of the advisory board of Altimetrik, a business transformation and technology solutions firm; and Director of DXC Technology, a global IT services and consulting company.
Mona K. SutphenBorn 1967, Trustee since 2020Principal occupations during past five years: Senior Advisor at The Vistria Group, a private investment firm focused
on middle-market companies in the healthcare, education, and financial services industries. From 2014 to 2018, Partner at Macro Advisory Partners, a global consulting firm.
Other directorships: Director of Unitek Learning, a private nursing and medical services education provider in the United States; Director of Pattern Energy Group LP, a private renewable energy company; previous Director of Pattern Energy, a publicly traded renewable energy company; Board Member, International Rescue Committee; Co-Chair of the Board of Human Rights First; Trustee of Mount Holyoke College; and member of the Advisory Board for the Center on Global Energy Policy at Columbia University’s School of International and Public Affairs.
INTERESTED TRUSTEE
Robert L. Reynolds*
Trustee since 2008 and President and Chief Executive Officer of Putnam Investments since 2008
Principal occupations during past five years: President and Chief Executive Officer of Putnam Investments; President and Chief Executive Officer of Great-West Financial, a financial services company that provides retirement savings plans, life insurance, and annuity and executive benefits products; President and Chief Executive Officer of Great-West Lifeco U.S. Inc., a holding company that owns Putnam Investments and Great-West Financial; and member of Putnam Investments’ and Great-West Financial’s Board of Directors.
Other directorships: Director of West Virginia University Foundation; director of the Concord Museum; director of Dana-Farber Cancer Institute; Chairman of Massachusetts Competitive Partnership; director of Boston Chamber of Commerce; member of the Chief Executives Club of Boston; member of the National Innovation Initiative; member of the Massachusetts General Hospital President’s Council; member of the Council on Competitiveness; and previously the President of the Commercial Club of Boston.
* Mr. Reynolds is an “interested person” (as defined in the Investment Company Act of 1940) of the fund and Putnam Investments. He is President and Chief Executive Officer of Putnam Investments, as well as the President of your fund and each of the other Putnam funds.
The address of each Trustee is 100 Federal Street, Boston, MA 02110.
As of October 31, 2021, there were 100 Putnam funds. All Trustees serve as Trustees of all Putnam funds.
Each Trustee serves for an indefinite term, until his or her resignation, retirement at age 75, removal, or death.
Focused International Equity Fund 51
The principal occupations of the officers for the past five years have been with the employers as shown above, although in some cases they have held different positions with such employers. The address of each officer is 100 Federal Street, Boston, MA 02110.
OfficersIn addition to Robert L. Reynolds, the other officers of the fund are shown below:
James F. Clark (Born 1974)Vice President and Chief Compliance OfficerSince 2016Chief Compliance Officer and Chief Risk Officer, Putnam Investments, and Chief Compliance Officer, Putnam Management
Nancy E. Florek (Born 1957)Vice President, Director of Proxy Voting and Corporate Governance, Assistant Clerk, and Assistant TreasurerSince 2000
Michael J. Higgins (Born 1976)Vice President, Treasurer, and ClerkSince 2010
Jonathan S. Horwitz (Born 1955)Executive Vice President, Principal Executive Officer, and Compliance LiaisonSince 2004
Richard T. Kircher (Born 1962)Vice President and BSA Compliance OfficerSince 2019Assistant Director, Operational Compliance, Putnam Investments and Putnam Retail Management
Susan G. Malloy (Born 1957)Vice President and Assistant TreasurerSince 2007Head of Accounting and Middle Office Services, Putnam Investments and Putnam Management
Denere P. Poulack (Born 1968)Assistant Vice President, Assistant Clerk, and Assistant TreasurerSince 2004
Janet C. Smith (Born 1965)Vice President, Principal Financial Officer, Principal Accounting Officer, and Assistant TreasurerSince 2007Head of Fund Administration Services, Putnam Investments and Putnam Management
Stephen J. Tate (Born 1974)Vice President and Chief Legal OfficerSince 2021General Counsel, Putnam Investments, Putnam Management, and Putnam Retail Management
Mark C. Trenchard (Born 1962)Vice PresidentSince 2002Director of Operational Compliance, Putnam Investments and Putnam Retail Management
52 Focused International Equity Fund
Fund informationFounded over 80 years ago, Putnam Investments was built around the concept that a balance between risk and reward is the hallmark of a well-rounded financial program. We manage funds across income, value, blend, growth, sustainable, asset allocation, absolute return, and global sector categories.
Investment ManagerPutnam Investment Management, LLC 100 Federal Street Boston, MA 02110
Investment Sub-AdvisorsPutnam Investments Limited 16 St James’s Street London, England SW1A 1ER
The Putnam Advisory Company, LLC 100 Federal Street Boston, MA 02110
Marketing ServicesPutnam Retail Management Limited Partnership 100 Federal Street Boston, MA 02110
CustodianState Street Bank and Trust Company
Legal CounselRopes & Gray LLP
Independent Registered Public Accounting FirmPricewaterhouseCoopers LLP
TrusteesKenneth R. Leibler, Chair Liaquat Ahamed Ravi Akhoury Barbara M. Baumann Katinka Domotorffy Catharine Bond Hill Paul L. Joskow George Putnam, III Robert L. Reynolds Manoj P. Singh Mona K. Sutphen
OfficersRobert L. Reynolds President
James F. Clark Vice President, Chief Compliance Officer, and Chief Risk Officer
Nancy E. Florek Vice President, Director of Proxy Voting and Corporate Governance, Assistant Clerk, and Assistant Treasurer
Michael J. Higgins Vice President, Treasurer, and Clerk
Jonathan S. Horwitz Executive Vice President, Principal Executive Officer, and Compliance Liaison
Richard T. Kircher Vice President and BSA Compliance Officer
Susan G. Malloy Vice President and Assistant Treasurer
Denere P. Poulack Assistant Vice President, Assistant Clerk, and Assistant Treasurer
Janet C. Smith Vice President, Principal Financial Officer, Principal Accounting Officer, and Assistant Treasurer
Stephen J. Tate Vice President and Chief Legal Officer
Mark C. Trenchard Vice President
This report is for the information of shareholders of Putnam Focused International Equity Fund. It may also be used as sales literature when preceded or accompanied by the current prospectus, the most recent copy of Putnam’s Quarterly Performance Summary, and Putnam’s Quarterly Ranking Summary. For more recent performance, please visit putnam.com. Investors should carefully consider the invest-ment objectives, risks, charges, and expenses of a fund, which are described in its prospectus. For this and other information or to request a prospectus or summary prospectus, call 1-800-225-1581 toll free. Please read the prospectus carefully before investing. The fund’s Statement of Additional Information contains additional information about the fund’s Trustees and is available without charge upon request by calling 1-800-225-1581.

AN00
6 32
7745
12
/21