Embed Size (px)
Citation preview

global equity uNit tRuSt
FOR THE YEAR ENDED 30 SEPTEMBER 2016

I. S. Gascoigne D. J. Lamb
Tweedy, Browne Company LLC*One Station PlaceStamford, CT 06902United States of America
BlackRock Investment Management (UK)Limited **12 Throgmorton AvenueLondon EC2N 2DLUnited Kingdom
PricewaterhouseCoopers LLPAtria One144 Morrison StreetEdinburgh, EH3 8EXUnited Kingdom
Freephone: 0800 027 1031
PO Box 9034, Chelmsford, CM99 2XA
St. James's Place Global Equity Unit Trust
ManagerSt. James's Place Unit Trust Group Limited
United Kingdom
(Authorised and regulated by the Financial Conduct Authority)
Investment Adviser Sands Capital Management, LLC*
Directors of the ManagerD. C. BellamyA. M. Croft
1101 Wilson Blvd, Suite 2300
Canada
Arlington, VA 22209
160 Queen Victoria Street
***(Authorised and regulated by the Ontario Securities Commission)
TrusteeBNY Mellon Trust & Depositary (UK) Limited
United States of America
EdgePoint Investment Group Inc***150 Bloor Street WestSuite 500TorontoOntario, M5S 2X9
*(Authorised and regulated by the Securities and Exchange Commission)**(Authorised and regulated by the Financial Conduct Authority)
(Authorised and regulated by the Financial Conduct Authority)
Independent Auditors
Prospectus and Manager's Reports
Copies of the up to date Prospectus (Scheme Particulars) and latest Manager's Report andFinancial Statements for the range of St. James's Place Unit Trusts can be requested from amember of the St. James's Place Partnership or, at any time during normal business hours, fromthe Administration Centre at PO Box 9034, Chelmsford CM99 2XA.Freephone: 0800 027 1031
United Kingdom
London, EC4V 4LAUnited Kingdom
RegistrarInternational Financial Data Services (UK) Limited
St. Nicholas LaneBasildon, SS15 5FS
IFDS House
(Authorised and regulated by the Financial Conduct Authority)
1
12/09/11 to 30/09/16
30/09/11 to 30/09/16
30/09/15 to 30/09/16
% change % change % change
+72.0 +71.8 +31.0+75.8 +75.6 +31.6
+113.8 +113.9 +30.6+71.5 +77.5 +32.3
St. James's Place Global Equity Unit Trust
Report of the Manager
The Report of the Manager consists of The Trust, Investment Objectives & Policy, The Trust'sPerformance, Risk and Reward Profile, Investment Adviser's Comments and Portfolio Statement.
Investment Objectives & Policy
It is the Manager's intention that the assets of the Unit Trust will be invested so that the UnitTrust will be eligible for inclusion in an ISA.
The Trust's Performance
The performance of the Trust since its launch in September 2011, over the five year period sinceSeptember 2011 and over the year under review is shown below, together with figures for themost commonly quoted indices in comparable markets where the major proportion of the Trusthas been invested.
The investment objective of the Scheme is to achieve long-term capital appreciation by investingworldwide in equities.
The Scheme will invest primarily in a diversified international equity portfolio, cash and nearcash.
The Scheme is also permitted to invest in other types of transferable securities, units and/orshares in collective investment schemes, money market instruments and deposits.
The Scheme is permitted to invest in derivatives and forward transactions for the purposes ofefficient portfolio management (including hedging).
The Scheme is permitted to invest in derivatives and forward transactions for the purposesof efficient portfolio management (including hedging).
Indices - actualMSCI World (Total Return)
Source: Financial Express for Fund returns
REMEMBER THAT THE PRICE OF UNITS AND REVENUE FROM THEM MAY GO DOWN ASWELL AS UP. PLEASE BE AWARE THAT PAST PERFORMANCE IS NOT INDICATIVE OF FUTUREPERFORMANCE.
MSCI Equally Weighted AC World (Total Return)
The Trust
St. James's Place Global Equity Unit Trust is an authorised Unit Trust scheme under section 243of the Financial Services and Markets Act (2000) and is constituted by a Trust Deed dated 29 July2011.
The Unit Trust is subject to the rules of the Financial Conduct Authority's Collective InvestmentScheme Sourcebook and is classified as a UCITS retail scheme.
St. James's Place Global Equity Unit Trust Income units (offer to offer)Accumulation units (offer to offer)
Please note that in order to add greater clarification, with effect from 10 October 2016 theinvestment objectives of the Scheme were amended to the following:
The investment objective of the Scheme is to achieve long-term capital appreciation byinvesting worldwide in equities.
The Scheme will invest mainly into a portfolio of equities designed to track the performanceof the MSCI AC World Equally Weighted Index. The remainder of the Scheme will beinvested into an actively managed international equity portfolio.
The Scheme is also permitted to invest in other types of transferable securities, units and/orshares in collective investment schemes, money market instruments and deposits.
2
(continued)
St. James's Place Global Equity Unit Trust
Report of the Manager
The biggest news of Q4 2015 was the Federal Reserve’s decision to raise interest rates for thefirst time since 2006, emphasising the divergence in monetary policy between the United Statesand the rest of the world. The European Central Bank announced it was not going to increasethe value of bonds purchased each month under its asset purchase program. Global markets soldoff on the news because it was widely anticipated that monthly purchases would be increased. Following this, 2016 had its worst start since 2008 as the markets struggled with weakness inChina and plunging oil prices. While concerns about the slowing global economy rattled markets,they had recovered by the end of the first quarter. Performance of equity indexes was mixed inthe second quarter amid recovering oil prices, uncertainty about a potential Federal Reserve ratehike and the United Kingdom’s referendum on European Union (EU) membership.
The third quarter of 2016 was generally positive for global equity markets, which rallied stronglyfrom the stock market falls triggered by the UK’s vote to leave the EU. US stock markets touchedrecord highs, while US government bond yields hit record lows. Chinese equities gained notablyand the Japanese government unveiled further monetary stimulus.
Risk and Reward ProfileThe synthetic risk and reward indicator for the St. James’s Place Global Equity Unit Trust, asdisclosed in its most recent Key Investor Information Document (KIID), is a 5. It was calculatedusing performance data up to 31 May 2016.
The risk category is recalculated weekly and during the year under review, the risk category didnot change.
BlackRock Investment Management (UK) Limited 14 October 2016
The investing landscape today is characterised by an unusual situation where many investors arebuying fixed income investments for capital gains, and equities for their yield potential. Thisresults in a very polarised market. While we resist the temptation to make market calls, wewould note there are few historical precedents for the current investment backdrop.One of the tangible results of the imbalances we’re witnessing is the popularity of financialproducts dedicated to low-volatility areas of the market. Today many low-volatility investmentsamount to a factor-bet on interest-sensitive sectors such as utilities, telecommunications andconsumer staples. Valuations of companies in these sectors have reached a point that we haverarely seen in history. Further, because low-volatility products are all buying similar securities,valuations are being pushed even higher resulting in a crowded trade. At a certain point, so-called low-volatility products may cease to represent the safety many investors crave. In contrast,the portfolio isn’t constructed based on factor-bets and is instead diversified by business idea. The portfolio outperformed the MSCI World Index over the one-year period. Industrial holdingssuch as WESCO International Inc., Generac Holdings Inc., and Union Pacific Corp., were strongabsolute contributors to the portfolio as well as technology holding Ubiquiti Networks Inc. Thelargest detractor from the portfolio was Realogy Holdings Corp., although it didn’t weigh heavilyon financial holdings overall.
Over the last year we have continued to execute on our sell discipline by exiting long-termholdings such as Microsoft Corp. and Ryanair Holdings PLC, as we felt our proprietary insightshad become recognised and the intrinsic values of these businesses were achieved. We alsoupgraded the quality of the portfolio by exiting positions such as Merit Medical Systems Inc. andJacobs Engineering Group Inc. in favour of other businesses with better long-term potential. Weremain close to fully invested and believe the current setting presents exciting opportunities foractive investment management.
Investment Adviser's Comments
EdgePoint Investment Group Inc 14 October 2016
3

(continued)
St. James's Place Global Equity Unit Trust
Report of the Manager
Though global equities generally faced a volatile twelve months driven by macroeconomicconcerns and central bank speculation, the Global Growth strategy outperformed the widerequity market as the market rewarded strong company fundamentals with share priceappreciation. On a regional level, our overweight to developing Asia and our underweight toWestern Europe contributed to our relative results, and our investments in businesses within fast-growing sectors such as information technology and consumer discretionary contributed as well.
Visa was among our top performers for the period. Importantly, we believe there are many moretransactions that can be converted to Visa’s network; despite the seeming ubiquity of creditcards, transactions made with paper still total over $11 trillion. Recently, Visa reached anagreement with PayPal that should incrementally drive more transactions over its network.PayPal has agreed to cease steering customers to pay with their bank accounts (rather than creditcards). Agreements such as this, combined with the secular shift from paper to electronicpayments should drive Visa’s growth for years to come.
Fast Retailing was the largest individual detractor from relative results. Fast is a leading globalcasual apparel company with nearly 3,000 stores concentrated in Japan, China, and SoutheastAsia. The majority of the company’s revenue and earnings come from its UNIQLO brand. Its sisterbrand, GU, offers similar products, but at lower price points. Fast experienced a few challengingquarters during the period as weather and foreign exchange-related headwinds dragged onprofits. We view these influences as short-term in nature, and continue to believe in Fast’s long-term growth potential, especially in light of the CEO’s recent announcement to grow the numberof GU store locations outside of Japan from 10 to 1,000 over the next decade.
During the period, we purchased Amazon, Chipotle Mexican Grill, Edwards Lifesciences, MarutiSuzuki, and Whole Foods Market, and sold ARM Holdings, Cielo, FMC Technologies, ITC,LinkedIn, MercadoLibre, and Royal Vopak.
It was somewhat of a roller coaster ride in global equity markets over the last year, with bouts ofvolatility followed by fairly strong recoveries in equity valuations. Overall, despite the enhancedvolatility, the portfolio produced strong positive returns while carrying cash reserves thataveraged approximately 13% during the year. A little over half of this return was due tofavourable currency translations back into a weakening British pound.
While most equities in the portfolio finished up for the year, returns in local currency were led bythe portfolio’s consumer staples and industrial holdings. Food, beverage, and tobacco companiessuch as Diageo, Unilever, British American Tobacco, and Philip Morris produced strong double-digit returns for the year. Similar returns were achieved by a number of the portfolio’s industrialcompanies including Siemens, Illinois Tool Works, and ABB among others. In addition,pharmaceutical companies such as GlaxoSmithKline and Johnson & Johnson, and our twotechnology holdings, Cisco and IBM, performed solidly. In contrast, a handful of holdingsproduced disappointing returns, including a couple of media holdings and banks: Pearson, AxelSpringer, Standard Chartered and Wells Fargo.
In terms of portfolio activity, new buys and additions to existing positions significantlyoutnumbered sales and trims. With the heightened volatility, we were able to add two newpositions, Linde, the German industrial gas company, and Provident Financial, the UK-basedconsumer finance company. At purchase, both were trading at attractive discounts from ourestimates of intrinsic value and had above-average dividend yields. We also added to a numberof existing positions including ABB, BAE, G4S, Glaxo, HSBC, Safran, and Zurich Insurance,among others. We sold our remaining shares in Bangkok Bank, BBA Aviation, Cenovus, andStandard Chartered, and trimmed our positions in Akzo, Illinois Tool Works, and LockheedMartin.
Sands Capital Management, LLC 14 October 2016
4

(continued)
St. James's Place Global Equity Unit Trust
Report of the Manager
With negative interest rates abounding and valuations appearing high, we expect continuedvolatility in global equity markets, which we believe should translate into buying opportunitiesfor value investors such as ourselves.
Our approach seeks to blend the best of quality investing with the best of value investing. Westrive to achieve above-average risk-adjusted equity returns over the medium to long term byinvesting in a concentrated, unconstrained portfolio of attractively valued compound growthcompanies. We prioritise companies capable of reliably generating cash flows and reinvestingthese cash flows at high marginal returns in order to grow their intrinsic value, making thesecompanies steadily more valuable over the course of time. Looking ahead, with uncertainty about the future direction of financial markets currently atextremely high levels and the range of potential outcomes for investors very wide, balance is ourcurrent watchword. Our enduring mantra as investors is one of 'heads we win, tails we don’tlose too much', thus we need to make sure we are positioned to survive in all scenarios andthrive in a few.
Tweedy, Browne Company LLC 14 October 2016
J O Hambro Capital Management Limited 14 October 2016
From 10 October 2016, J O Hambro Capital Management Limited replaced Tweedy, BrowneCompany LLC as Investment Adviser to the Trust.
5

St. James's Place Global Equity Unit Trust
Comparative Table
as at 30 September 2016
30/09/16 30/09/15 30/09/14
Income
Change in net assets per unit (p) (p) (p)
Opening net asset value per unit 124.35 130.98 122.91Return before operating charges* 41.43 (4.04) 10.39Operating charges (2.20) (2.16) (1.92)
Return after operating charges* 39.23 (6.20) 8.47Distributions on income units (0.77) (0.43) (0.40)
Closing net asset value per unit 162.81 124.35 130.98
*after direct transaction costs of: 0.04 0.06 0.05
Performance
Return after charges† 31.55% (4.73%) 6.89%
Other informationClosing net asset value (£’000) 115,994 92,956 100,871Closing number of units 71,247,150 74,756,015 77,011,454Operating charges** 1.57% 1.57% 1.59%Direct transaction costs 0.03% 0.04% 0.04%
PricesHighest unit price (p) 177.90 163.00 146.30Lowest unit price (p) 122.50 125.90 121.90
30/09/16 30/09/15 30/09/14
Accumulation
Change in net assets per unit (p) (p) (p)
Opening net asset value per unit 127.03 133.34 124.75Return before operating charges* 42.32 (4.11) 10.63Operating charges (2.26) (2.20) (2.04)
Return after operating charges* 40.06 (6.31) 8.59Distributions on accumulation units (0.79) (0.44) (0.41)Retained distributions on accumulation units 0.79 0.44 0.41
Closing net asset value per unit 167.09 127.03 133.34
*after direct transaction costs of: 0.05 0.06 0.06
PerformanceReturn after charges† 31.54% (4.73%) 6.89%
Other informationClosing net asset value (£’000) 7,475,873 5,512,167 5,579,232Closing number of units 4,474,143,738 4,339,239,711 4,184,224,244Operating charges** 1.57% 1.57% 1.59%Direct transaction costs 0.03% 0.04% 0.04%
PricesHighest unit price (p) 174.30 160.10 144.10Lowest unit price (p) 119.90 123.70 120.10
**Operating charges are prepared using the same methodology as the ongoing chargesappearing in the KIID, based on the information in this report.†This figure may differ from the performance figure quoted in the Investment Report. TheInvestment Report performance figure is calculated using the last available published price for agiven unit class in the period compared to the equivalent for the prior year. The price per thefinancial statements values the fund on a bid-price basis. The financial statements unit classvaluation is based on market prices on the last day of the year, which can differ from the intradaypricing point of the Trust.
Net Asset Value and Ongoing Charges Figure
6

Security Holdings
MarketValue£000
% ofNet
Assets
AUSTRALIA (1.63%) 132,683 1.73AGL Energy 164,537 1,838 0.02Alumina 2,174,894 1,858 0.02Amcor 189,353 1,682 0.02AMP 686,763 2,129 0.03APA 361,453 1,806 0.02Aristocrat Leisure 248,459 2,307 0.03ASX 77,422 2,189 0.03Aurizon 687,829 1,894 0.02AusNet Services 2,001,685 1,928 0.03Australia & New Zealand Banking 139,675 2,265 0.03Bank of Queensland 256,451 1,711 0.02Bendigo and Adelaide Bank 301,892 1,907 0.03BHP Billiton 156,915 2,059 0.03Boral 452,837 1,795 0.02Brambles 261,632 1,839 0.02Caltex Australia 88,964 1,786 0.02Challenger 332,796 1,987 0.03CIMIC 79,067 1,334 0.02Coca-Cola Amatil 347,006 2,084 0.03Cochlear 29,299 2,425 0.03Commonwealth Bank of Australia 40,796 1,734 0.02Computershare 291,354 1,764 0.02Crown Resorts 245,368 1,889 0.02CSL 32,065 2,014 0.03Dexus Property# 356,622 1,916 0.03Domino's Pizza Enterprises 52,957 2,186 0.03DUET 1,300,000 1,908 0.03Flight Centre Travel 94,157 2,009 0.03Fortescue Metals 905,059 2,631 0.03Goodman# 433,149 1,852 0.02GPT# 576,185 1,712 0.02Harvey Norman 671,380 2,046 0.03Healthscope 1,043,362 1,875 0.02Incitec Pivot 995,563 1,643 0.02Insurance Australia 538,506 1,726 0.02LendLease 244,184 2,012 0.03Macquarie 44,497 2,141 0.03Medibank Private 999,466 1,450 0.02Mirvac# 1,564,153 2,057 0.03National Australia Bank 127,012 2,077 0.03Newcrest Mining 162,374 2,115 0.03Orica 224,607 2,001 0.03Origin Energy 568,529 1,806 0.02Platinum Asset Management 487,121 1,439 0.02Qantas Airways 977,326 1,790 0.02QBE Insurance 291,166 1,587 0.02Ramsay Health Care 46,106 2,142 0.03REA 61,732 2,046 0.03Rio Tinto 65,492 1,984 0.03Santos 767,443 1,622 0.02Scentre# 665,593 1,837 0.02SEEK 192,421 1,757 0.02Sonic Healthcare 141,149 1,823 0.02South32 1,942,359 2,749 0.04Stockland# 683,263 1,906 0.03
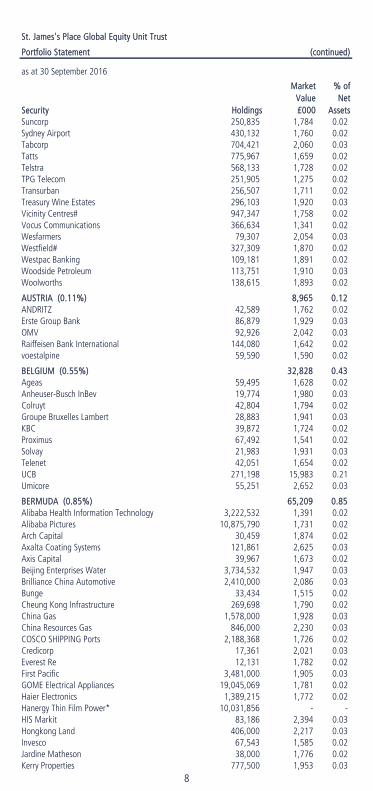
St. James's Place Global Equity Unit Trust
Portfolio Statement
as at 30 September 2016
7
Security Holdings
MarketValue£000
% ofNet
Assets
St. James's Place Global Equity Unit Trust
Portfolio Statement (continued)
as at 30 September 2016
Suncorp 250,835 1,784 0.02Sydney Airport 430,132 1,760 0.02Tabcorp 704,421 2,060 0.03Tatts 775,967 1,659 0.02Telstra 568,133 1,728 0.02TPG Telecom 251,905 1,275 0.02Transurban 256,507 1,711 0.02Treasury Wine Estates 296,103 1,920 0.03Vicinity Centres# 947,347 1,758 0.02Vocus Communications 366,634 1,341 0.02Wesfarmers 79,307 2,054 0.03Westfield# 327,309 1,870 0.02Westpac Banking 109,181 1,891 0.02Woodside Petroleum 113,751 1,910 0.03Woolworths 138,615 1,893 0.02
AUSTRIA (0.11%) 8,965 0.12ANDRITZ 42,589 1,762 0.02Erste Group Bank 86,879 1,929 0.03OMV 92,926 2,042 0.03Raiffeisen Bank International 144,080 1,642 0.02voestalpine 59,590 1,590 0.02
BELGIUM (0.55%) 32,828 0.43Ageas 59,495 1,628 0.02Anheuser-Busch InBev 19,774 1,980 0.03Colruyt 42,804 1,794 0.02Groupe Bruxelles Lambert 28,883 1,941 0.03KBC 39,872 1,724 0.02Proximus 67,492 1,541 0.02Solvay 21,983 1,931 0.03Telenet 42,051 1,654 0.02UCB 271,198 15,983 0.21Umicore 55,251 2,652 0.03
BERMUDA (0.85%) 65,209 0.85Alibaba Health Information Technology 3,222,532 1,391 0.02Alibaba Pictures 10,875,790 1,731 0.02Arch Capital 30,459 1,874 0.02Axalta Coating Systems 121,861 2,625 0.03Axis Capital 39,967 1,673 0.02Beijing Enterprises Water 3,734,532 1,947 0.03Brilliance China Automotive 2,410,000 2,086 0.03Bunge 33,434 1,515 0.02Cheung Kong Infrastructure 269,698 1,790 0.02China Gas 1,578,000 1,928 0.03China Resources Gas 846,000 2,230 0.03COSCO SHIPPING Ports 2,188,368 1,726 0.02Credicorp 17,361 2,021 0.03Everest Re 12,131 1,782 0.02First Pacific 3,481,000 1,905 0.03GOME Electrical Appliances 19,045,069 1,781 0.02Haier Electronics 1,389,215 1,772 0.02Hanergy Thin Film Power* 10,031,856 - -HIS Markit 83,186 2,394 0.03Hongkong Land 406,000 2,217 0.03Invesco 67,543 1,585 0.02Jardine Matheson 38,000 1,776 0.02Kerry Properties 777,500 1,953 0.03
8

Security Holdings
MarketValue£000
% ofNet
Assets
St. James's Place Global Equity Unit Trust
Portfolio Statement (continued)
as at 30 September 2016
Kunlun Energy 2,774,325 1,640 0.02Li & Fung 4,352,000 1,710 0.02Luye Pharma 3,710,010 1,868 0.02Marvell Technology 220,977 2,255 0.03Nine Dragons Paper 3,704,385 2,672 0.04Noble 15,692,626 1,348 0.02Norwegian Cruise Line 47,735 1,368 0.02NWS 1,603,582 2,064 0.03RenaissanceRe 20,260 1,878 0.02Shangri-La Asia 1,996,000 1,682 0.02Signet Jewelers 20,513 1,157 0.02XL 64,529 1,674 0.02Yue Yuen Industrial 690,500 2,191 0.03
BRAZIL (1.28%) 128,434 1.76AES Tiete Energia 583,630 2,256 0.03AmBev 439,132 2,049 0.03Banco Bradesco 131,285 880 0.01Banco Bradesco Preference Shares 247,055 1,732 0.02Banco do Brasil 523,515 2,805 0.04Banco Santander Brasil 444,250 2,311 0.03BB Seguridade Participacoes 287,069 2,061 0.03BM&FBovespa 494,200 1,944 0.03BR Malls Participacoes 663,708 1,918 0.03Braskem Preference Shares 427,357 2,584 0.03BRF 172,829 2,234 0.03CCR 518,649 2,060 0.03Centrais Eletricas Brasileiras Preference Shares 658,804 3,749 0.05CETIP 187,560 1,903 0.03Cia Brasileira de Distribuicao Preference Shares 194,168 2,433 0.03Cia de Saneamento Basico do Estado de Sao Paulo 305,200 2,202 0.03Cia Energetica de Minas Gerais Preference Shares 1,486,222 3,089 0.04Cia Energetica de Sao Paulo Preference Shares 666,535 2,313 0.03Cia Paranaense de Energia Preference Shares 332,464 2,707 0.04Cia Siderurgica Nacional 1,177,949 2,526 0.03Cielo 261,498 2,006 0.03Cosan Industria e Comercio 236,728 2,100 0.03CPFL Energia 438,147 2,509 0.03Duratex 1,075,945 2,257 0.03EDP - Energias do Brasil 656,040 2,275 0.03Embraer 417,385 1,406 0.02ENGIE 222,900 2,073 0.03Equatorial Energia 175,500 2,123 0.03Fibria Celulose 252,000 1,361 0.02Gerdau Preference Shares 1,380,025 2,947 0.04Hypermarcas 277,800 1,825 0.02Itau Unibanco Preference Shares 281,396 2,371 0.03Itausa Preference Shares 1,170,732 2,317 0.03JBS 747,328 2,084 0.03Klabin 439,324 1,782 0.02Kroton Educacional 779,885 2,780 0.04Localiza Rent a Car 236,696 2,221 0.03Lojas Americanas 198,647 671 0.01Lojas Americanas Preference Shares 423,594 2,002 0.03Lojas Renner 384,100 2,245 0.03M Dias Branco 86,931 2,736 0.04Multiplan Empreendimentos Imobiliarios 143,907 2,170 0.03
9

Security Holdings
MarketValue£000
% ofNet
Assets
St. James's Place Global Equity Unit Trust
Portfolio Statement (continued)
as at 30 September 2016
Natura Cosmeticos 375,390 2,712 0.04Odontoprev 719,599 2,230 0.03Petroleo Brasileiro 418,232 1,492 0.02Petroleo Brasileiro Preference Shares 465,079 1,479 0.02Porto Seguro 308,576 2,175 0.03Qualicorp 484,398 2,129 0.03Raia Drogasil 141,900 2,226 0.03Rumo Logistica Operadora Multimodal 1,819,600 2,675 0.04Sul America 535,136 2,046 0.03Suzano Papel e Celulose Preference Shares 552,964 1,386 0.02Telefonica Brasil Preference Shares 209,740 2,351 0.03Tim Participacoes 1,113,861 2,096 0.03TOTVS 269,669 1,955 0.03Transmissora Alianca de Energia Eletrica 440,244 2,224 0.03Ultrapar Participacoes 121,670 2,036 0.03Vale 302,602 1,288 0.02Vale Preference Shares 447,241 1,646 0.02WEG 546,591 2,271 0.03
BRITISH VIRGIN ISLANDS (0.02%) 1,894 0.02Michael Kors 52,377 1,894 0.02
CANADA (2.76%) 231,572 2.96Agnico Eagle Mines 49,601 2,107 0.03Agrium 26,482 1,847 0.02Alimentation Couche-Tard 48,443 1,800 0.02AltaGas 93,963 1,836 0.02ARC Resources 134,497 1,846 0.02Atco 68,619 1,882 0.02Bank of Montreal 39,266 1,978 0.03Bank of Nova Scotia 49,061 2,030 0.03Barrick Gold 128,699 1,777 0.02BCE 52,416 1,872 0.02BlackBerry 311,033 1,901 0.03Bombardier 1,447,859 1,425 0.02Brookfield Asset Management 63,060 1,716 0.02CAE 180,982 1,978 0.03Cameco 216,241 1,447 0.02Canadian Imperial Bank of Commerce 29,651 1,755 0.02Canadian National Railway 37,905 1,883 0.02Canadian Natural Resources 74,421 1,837 0.02Canadian Pacific Railway 17,199 1,995 0.03Canadian Tire 23,924 1,827 0.02Canadian Utilities 80,661 1,758 0.02CCL Industries 14,000 2,113 0.03Cenovus Energy 150,179 1,654 0.02CGI 51,783 1,903 0.03CI Financial 103,938 1,523 0.02Constellation Software 5,957 2,069 0.03Crescent Point Energy 150,065 1,533 0.02Dollarama 37,212 2,275 0.03Eldorado Gold 498,402 1,542 0.02Element Financial 205,981 1,988 0.03Empire 130,320 1,519 0.02Enbridge 54,359 1,836 0.02Encana 340,192 2,647 0.03Fairfax Financial 4,362 1,930 0.03Finning International 136,013 1,961 0.03
10

Security Holdings
MarketValue£000
% ofNet
Assets
St. James's Place Global Equity Unit Trust
Portfolio Statement (continued)
as at 30 September 2016
First Capital Realty 138,089 1,795 0.02First Quantum Minerals 336,320 2,128 0.03Fortis 70,783 1,754 0.02Franco-Nevada 34,855 1,900 0.03George Weston 26,899 1,726 0.02Gildan Activewear 77,086 1,650 0.02Goldcorp 132,345 1,696 0.02Great-West Lifeco 84,891 1,602 0.02H&R Real Estate Investment Trust# 142,175 1,874 0.02Husky Energy 192,663 1,814 0.02Hydro One 136,899 2,083 0.03IGM Financial 77,743 1,625 0.02Imperial Oil 68,240 1,659 0.02Industrial Alliance Insurance & Financial Services 68,263 1,893 0.02Intact Financial 33,421 1,865 0.02Inter Pipeline 107,011 1,741 0.02Jean Coutu 149,590 1,770 0.02Keyera 76,934 1,923 0.03Kinross Gold 551,054 1,805 0.02Linamar 54,126 1,689 0.02Loblaw 42,525 1,686 0.02Magna International 55,220 1,780 0.02Manulife Financial 159,212 1,711 0.02Methanex 67,815 1,862 0.02Metro 65,573 1,666 0.02National Bank of Canada 898,044 24,526 0.32Onex 36,503 1,789 0.02Open Text 46,560 2,324 0.03Pembina Pipeline 85,168 2,013 0.03Peyto Exploration & Development 85,243 1,859 0.02Potash Corp of Saskatchewan 144,057 1,800 0.02Power Corp of Canada 97,590 1,594 0.02Power Financial 94,524 1,684 0.02PrairieSky Royalty 2,235,708 35,043 0.46Restaurant Brands International 53,074 1,802 0.02RioCan Real Estate Investment Trust# 127,685 2,026 0.03Rogers Communications 57,544 1,889 0.02Royal Bank of Canada 36,539 1,739 0.02Saputo 72,629 1,940 0.03Seven Generations Energy 112,411 2,070 0.03Shaw Communications 131,173 2,061 0.03Silver Wheaton 118,434 2,523 0.03Smart Real Estate Investment Trust# 83,354 1,688 0.02SNC-Lavalin 55,923 1,674 0.02Sun Life Financial 67,647 1,679 0.02Suncor Energy 88,308 1,883 0.02Teck Resources 192,945 2,777 0.04TELUS 71,592 1,813 0.02Thomson Reuters 55,913 1,762 0.02Toronto-Dominion Bank 50,466 1,723 0.02Tourmaline Oil 92,279 1,929 0.03TransCanada 53,784 1,972 0.03Turquoise Hill Resources 778,419 1,802 0.02Valeant Pharmaceuticals International 82,664 1,594 0.02Veresen 279,934 2,137 0.03Vermilion Energy 65,677 1,948 0.03Waste Connections (CAD) 37,557 2,166 0.03
11

Security Holdings
MarketValue£000
% ofNet
Assets
St. James's Place Global Equity Unit Trust
Portfolio Statement (continued)
as at 30 September 2016
Waste Connections (USD) 21,626 1,249 0.02West Fraser Timber 71,535 1,669 0.02Yamana Gold 508,913 1,738 0.02
CAYMAN ISLANDS (1.78%) 179,971 2.363SBio 2,638,000 2,304 0.0358.com ADR 47,038 1,724 0.02AAC Technologies 312,227 2,421 0.03Alibaba ADR 604,000 49,169 0.65ANTA Sports Products 999,209 2,093 0.03ASM Pacific Technology 315,300 1,995 0.03Baidu ADR 216,178 30,375 0.40Belle International 3,624,099 1,900 0.03Casetek 611,910 1,717 0.02Chailease 1,441,085 1,972 0.03Cheung Kong Property 331,991 1,868 0.02China Conch Venture 1,144,368 1,717 0.02China Evergrande 3,347,493 1,745 0.02China Huishan Dairy 5,620,473 1,616 0.02China Medical System 1,647,000 2,137 0.03China Mengniu Dairy 1,308,735 1,875 0.02China Resources Land 949,355 2,035 0.03China State Construction International 1,748,000 1,774 0.02CK Hutchison 197,148 1,933 0.03Country Garden 5,954,258 2,423 0.03Ctrip.com International ADR 49,171 1,774 0.02ENN Energy 486,000 1,825 0.02Fang ADR 399,144 1,386 0.02GCL-Poly Energy 15,304,000 1,553 0.02Geely Automobile 4,678,023 3,221 0.04Haitian International 1,410,056 2,124 0.03Hengan International 255,000 1,631 0.02JD.com ADR 96,052 1,924 0.03Kingsoft 1,187,000 2,166 0.03Longfor Properties 1,722,500 2,039 0.03Melco Crown Entertainment ADR 150,000 1,854 0.02MGM China 1,697,200 2,273 0.03NetEase ADR 14,000 2,613 0.03New Oriental Education & Technology ADR 54,053 1,954 0.03Qunar Cayman Islands ADR 65,459 1,465 0.02Sands China 711,600 2,382 0.03Semiconductor Manufacturing International 26,783,114 2,292 0.03Shenzhou International 435,484 2,324 0.03Shimao Property 1,781,639 1,861 0.02Shui On Land 8,835,500 1,855 0.02Sino Biopharmaceutical 3,455,430 1,791 0.02SOHO China 5,314,497 2,215 0.03Sunac China 3,726,774 2,069 0.03TAL Education ADR 44,000 2,387 0.03Tencent 112,010 2,374 0.03Tingyi Cayman Islands 2,198,517 1,964 0.03Vipshop ADR 198,495 2,272 0.03Want Want China 3,133,548 1,496 0.02WH 2,876,000 1,783 0.02Wynn Macau 1,746,400 2,227 0.03YY ADR 50,964 2,053 0.03Zhen Ding Technology 1,201,482 2,031 0.03
12

Security Holdings
MarketValue£000
% ofNet
Assets
St. James's Place Global Equity Unit Trust
Portfolio Statement (continued)
as at 30 September 2016
CHILE (0.47%) 37,499 0.50AES Gener 5,021,374 1,295 0.02Aguas Andinas 4,075,802 2,018 0.03Banco de Chile 24,824,372 2,157 0.03Banco de Credito e Inversiones 55,627 1,912 0.03Banco Santander Chile ADR 148,271 2,353 0.03Cencosud 921,599 2,145 0.03Cia Cervecerias Unidas 40,526 318 -Cia Cervecerias Unidas ADR 97,612 1,524 0.02Colbun 8,828,882 1,400 0.02Embotelladora Andina ADR 132,387 2,255 0.03Empresa Nacional de Electricidad 133,089 70 -Empresa Nacional de Electricidad ADR 75,406 1,186 0.02Empresa Nacional de Telecomunicaciones 312,285 2,366 0.03Empresas CMPC 898,297 1,393 0.02Empresas COPEC 205,256 1,469 0.02Endesa Americas 133,089 47 -Endesa Americas ADR 173,503 1,811 0.02Enersis Americas ADR 292,085 1,859 0.02Enersis Chile ADR 387,085 1,400 0.02Itau Corpbanca 210,505,438 1,401 0.02Itau CorpBanca ADR 45,000 452 0.01Latam Airlines ADR 418,358 2,611 0.03SACI Falabella 310,163 1,768 0.02Sociedad Quimica y Minera de Chile ADR 102,318 2,082 0.03Sociedad Quimica y Minera de Chile Preference Shares
10,159 207 -
CHINA (1.56%) 141,297 1.89Agricultural Bank of China 6,144,000 2,029 0.03Air China 3,215,350 1,667 0.02Aluminum Corp of China 7,165,859 2,003 0.03Anhui Conch Cement 911,569 1,923 0.03AviChina Industry & Technology 3,157,066 1,640 0.02Bank of China 5,476,395 1,923 0.03Bank of Communications 3,663,082 2,150 0.03Beijing Capital International Airport 2,178,537 1,905 0.03BYD 393,828 1,994 0.03CGN Power 7,172,000 1,634 0.02China Cinda Asset Management 6,968,175 1,893 0.02China CITIC Bank 3,718,507 1,902 0.03China Coal Energy 5,219,312 2,176 0.03China Communications Construction 1,995,917 1,618 0.02China Communications Services 5,604,069 2,704 0.04China Construction Bank 3,526,638 2,017 0.03China COSCO 6,643,909 1,738 0.02China Everbright Bank 5,273,721 1,894 0.02China Galaxy Securities 2,703,387 1,902 0.03China Life Insurance 1,020,231 2,030 0.03China Longyuan Power 3,116,350 1,953 0.03China Merchants Bank 1,098,776 2,134 0.03China Minsheng Banking 2,230,191 1,984 0.03China National Building Material 4,748,774 1,620 0.02China Oilfield Services 2,875,065 1,922 0.03China Pacific Insurance 656,647 1,872 0.02China Petroleum & Chemical 3,518,047 1,974 0.03China Railway 2,919,656 1,624 0.02
13

Security Holdings
MarketValue£000
% ofNet
Assets
St. James's Place Global Equity Unit Trust
Portfolio Statement (continued)
as at 30 September 2016
China Railway Construction 1,808,035 1,581 0.02China Shenhua Energy 1,385,475 2,090 0.03China Shipping Container Lines 10,917,399 1,803 0.02China Southern Airlines 3,586,000 1,552 0.02China Telecom 4,404,205 1,709 0.02China Vanke 905,461 1,811 0.02Chongqing Changan Automobile 1,794,946 2,250 0.03Chongqing Rural Commercial Bank 4,475,754 2,120 0.03CITIC Securities 1,093,162 1,790 0.02CRRC 2,377,554 1,656 0.02Dongfeng Motor 2,186,000 1,683 0.02GF Securities 950,800 1,551 0.02Great Wall Motor 3,007,302 2,256 0.03Guangzhou Automobile 1,988,000 1,970 0.03Guangzhou R&F Properties 1,954,000 2,372 0.03Haitong Securities 1,524,641 1,990 0.03Huadian Power International 4,474,507 1,545 0.02Huaneng Power International 3,408,111 1,644 0.02Huaneng Renewables 7,315,772 1,965 0.03Huatai Securities 1,252,800 1,957 0.03Industrial & Commercial Bank of China 4,264,250 2,058 0.03Jiangsu Expressway 1,662,043 1,773 0.02Jiangxi Copper 2,031,156 1,790 0.02New China Life Insurance 678,839 2,313 0.03People's Insurance 5,656,858 1,773 0.02PetroChina 3,470,118 1,754 0.02PICC Property & Casualty 1,361,889 1,740 0.02Ping An Insurance 510,000 2,037 0.03Shandong Weigao Medical Polymer 4,330,636 2,236 0.03Shanghai Electric 5,115,971 1,863 0.02Shanghai Fosun Pharmaceutical 893,000 2,141 0.03Shanghai Lujiazui Finance & Trade Zone 1,357,920 1,758 0.02Shanghai Pharmaceuticals 1,111,309 2,294 0.03Sinopec Engineering 2,844,500 1,882 0.02Sinopec Shanghai Petrochemical 5,770,527 2,245 0.03Sinopharm 530,620 1,966 0.03Sinotrans 5,178,080 1,932 0.03TravelSky Technology 1,300,000 2,356 0.03Tsingtao Brewery 612,647 1,841 0.02Weichai Power 2,091,471 2,164 0.03Yanzhou Coal Mining 4,751,276 2,467 0.03Zhejiang Expressway 2,403,096 1,948 0.03Zhuzhou CRRC Times Electric 407,832 1,631 0.02Zijin Mining 9,059,428 2,244 0.03ZTE 1,756,227 1,971 0.03
COLOMBIA (0.21%) 16,148 0.22Bancolombia Preference Shares 272,547 2,028 0.03Cementos Argos 643,679 1,994 0.03Corp Financiera Colombiana Voting Rights 186,966 1,887 0.02Ecopetrol 5,161,356 1,714 0.02Grupo Argos 446,784 2,252 0.03Grupo Aval Acciones y Valores Preference Shares 6,230,826 2,069 0.03Grupo de Inversiones Suramericana 150,355 1,530 0.02Grupo de Inversiones Suramericana Preference 49,735 498 0.01Interconexion Electrica 843,170 2,176 0.03
14

Security Holdings
MarketValue£000
% ofNet
Assets
St. James's Place Global Equity Unit Trust
Portfolio Statement (continued)
as at 30 September 2016
CURACAO (0.15%) 1,703 0.02Schlumberger 28,533 1,703 0.02
CZECH REPUBLIC (0.05%) 5,043 0.06CEZ 126,673 1,739 0.02Komercni banka 59,240 1,561 0.02O2 Czech Republic 233,836 1,743 0.02
DENMARK (0.36%) 25,529 0.34AP Moeller - Maersk 'A' Shares 483 511 0.01AP Moeller - Maersk 'B' Shares 1,285 1,421 0.02Carlsberg 26,311 1,908 0.03Chr Hansen 36,000 1,639 0.02Coloplast 30,615 1,801 0.02Danske Bank 81,654 1,798 0.02DSV 51,422 1,934 0.03Genmab 12,331 1,598 0.02ISS 56,077 1,758 0.02Novo Nordisk 39,933 1,274 0.02Novozymes 47,736 1,607 0.02Pandora 15,404 1,419 0.02TDC 329,990 1,490 0.02Tryg 111,520 1,718 0.02Vestas Wind Systems 32,261 2,027 0.03William Demant 104,150 1,626 0.02
EGYPT (0.07%) 5,896 0.08Commercial International Bank 403,176 1,666 0.02Commercial International Bank GDR 175,752 534 0.01Global Telecom GDR 1,814,994 2,765 0.04Talaat Moustafa 2,000,000 931 0.01
FINLAND (0.31%) 22,921 0.30Elisa 60,668 1,693 0.02Fortum 154,608 1,904 0.03Kone 53,494 2,059 0.03Metso 93,995 2,077 0.03Neste Oyj 73,493 2,394 0.03Nokia 420,027 1,832 0.02Nokian Renkaat 67,995 1,889 0.02Orion 'B' Shares 64,216 1,913 0.03Sampo 48,874 1,637 0.02Stora Enso 266,627 1,796 0.02UPM-Kymmene 121,214 1,940 0.03Wartsila 52,703 1,787 0.02
FRANCE (3.04%) 218,826 2.83Accor 49,969 1,492 0.02Aeroports de Paris 18,328 1,372 0.02Air Liquide 22,287 1,809 0.02Alstom 89,293 1,784 0.02Arkema 27,362 1,934 0.03Atos 24,458 2,002 0.03AXA 93,358 1,466 0.02BNP Paribas 40,327 1,528 0.02Bollore 610,565 1,600 0.02Bollore New 4,111 10 -Bouygues 68,064 1,704 0.02Bureau Veritas 103,667 1,696 0.02Capgemini 23,423 1,746 0.02
15

Security Holdings
MarketValue£000
% ofNet
Assets
St. James's Place Global Equity Unit Trust
Portfolio Statement (continued)
as at 30 September 2016
Carrefour 90,327 1,770 0.02Casino Guichard Perrachon 38,076 1,386 0.02Christian Dior 13,552 1,839 0.02Cie de St-Gobain 51,548 1,680 0.02Cie Generale des Etablissements Michelin 206,560 17,237 0.23CNP Assurances 935,587 11,934 0.16Credit Agricole 223,247 1,634 0.02Danone 34,307 1,923 0.03Dassault Systemes 28,649 1,894 0.02Edenred 123,521 2,203 0.03Eiffage 34,000 2,002 0.03Electricite de France 172,615 1,577 0.02Engie 144,179 1,692 0.02Essilor International 17,216 1,683 0.02Eurazeo 34,149 1,504 0.02Eutelsat Communications 108,419 1,691 0.02Fonciere Des Regions# 24,816 1,760 0.02Gecina# 15,675 1,886 0.02Groupe Eurotunnel 171,213 1,399 0.02Hermes International 6,276 1,945 0.03ICADE# 28,936 1,712 0.02Iliad 10,701 1,703 0.02Imerys 31,526 1,719 0.02Ingenico 19,685 1,301 0.02JCDecaux 55,188 1,345 0.02Kering 13,328 2,028 0.03Klepierre# 51,162 1,783 0.02Lagardere 91,662 1,773 0.02Legrand 40,300 1,806 0.02L'Oreal 15,019 2,156 0.03LVMH Moet Hennessy Louis Vuitton 13,881 1,788 0.02Natixis 418,269 1,448 0.02Orange 130,075 1,547 0.02Pernod Richard 21,502 1,937 0.03Peugeot 143,657 1,626 0.02Publicis 31,600 1,801 0.02Remy Cointreau 27,168 1,774 0.02Renault 23,900 1,458 0.02Rexel 139,835 1,602 0.02Safran 410,833 22,274 0.29Sanofi 26,987 1,562 0.02Schneider Electric 34,243 1,801 0.02SCOR 1,016,739 23,713 0.31SFR 70,944 1,611 0.02Societe BIC 15,223 1,704 0.02Societe Generale 54,121 1,388 0.02Sodexo 21,096 1,901 0.03Suez 128,652 1,629 0.02Technip 43,897 2,071 0.03Thales 25,662 1,803 0.02Total 869,951 31,491 0.41Unibail-Rodamco# 9,795 2,007 0.03Valeo 46,566 2,039 0.03Veolia Environnement 106,367 1,868 0.02Vinci 29,473 1,705 0.02Vivendi 112,629 1,715 0.02
16

Security Holdings
MarketValue£000
% ofNet
Assets
St. James's Place Global Equity Unit Trust
Portfolio Statement (continued)
as at 30 September 2016
Wendel 19,686 1,737 0.02Zodiac Aerospace 93,298 1,718 0.02
GERMANY (2.14%) 167,329 2.16adidas 17,990 2,360 0.03Allianz 13,484 1,498 0.02Axel Springer 632,303 24,561 0.32BASF 27,814 1,783 0.02Bayer 22,792 1,706 0.02Bayerische Motoren Werke 27,081 1,691 0.02Beiersdorf 24,944 1,781 0.02Brenntag 41,859 1,727 0.02Commerzbank 255,506 1,200 0.02Continental 11,742 1,854 0.02Covestro 62,191 2,730 0.04Daimler 33,045 1,740 0.02Delticom 153,860 2,200 0.03Deutsche Bank 123,411 1,108 0.01Deutsche Boerse 26,762 1,629 0.02Deutsche Lufthansa 167,460 1,395 0.02Deutsche Post 76,509 1,806 0.02Deutsche Telekom 129,357 1,645 0.02Deutsche Wohnen 70,374 1,953 0.03E.ON 240,334 1,292 0.02Evonik Industries 73,006 1,868 0.02Fraport Frankfurt Airport Services Worldwide 39,325 1,633 0.02Fresenius 29,505 1,771 0.02Fresenius Medical Care 25,699 1,697 0.02FUCHS PETROLUB Preference Shares 53,655 1,858 0.02GEA 47,973 2,033 0.03Hannover Rueck 19,351 1,551 0.02HeidelbergCement 26,081 1,865 0.02Henkel 7,399 656 0.01Henkel Preference Shares 13,982 1,440 0.02HOCHTIEF 20,000 2,146 0.03Hugo Boss 35,350 1,464 0.02Infineon Technologies 151,511 2,053 0.03K+S 89,232 1,263 0.02LANXESS 50,070 2,367 0.03Linde 104,661 13,354 0.18MAN 20,799 1,666 0.02Merck 23,245 1,891 0.02METRO 68,024 1,535 0.02Muenchener Rueckversicherungs-Gesellschaft 121,808 17,069 0.22OSRAM Licht 42,661 1,894 0.02Porsche Automobil Preference Shares 40,364 1,531 0.02ProSiebenSat.1 Media 50,889 1,651 0.02RWE 170,206 2,222 0.03SAP 27,549 1,900 0.03Schaeffler Preference Shares 157,624 1,869 0.02Siemens 260,752 22,985 0.30Symrise 35,161 1,962 0.03Telefonica Deutschland 475,307 1,448 0.02thyssenkrupp 110,141 1,986 0.03TUI 148,169 1,602 0.02United Internet 44,153 1,478 0.02Volkswagen 2,482 267 -
17

Security Holdings
MarketValue£000
% ofNet
Assets
St. James's Place Global Equity Unit Trust
Portfolio Statement (continued)
as at 30 September 2016
Volkswagen Preference Shares 14,852 1,454 0.02Vonovia 64,785 1,870 0.02Zalando 75,000 2,371 0.03
GREECE (0.16%) 12,373 0.15Alpha Bank 804,495 1,025 0.01Eurobank Ergasias 1,839,911 783 0.01FF 105,753 2,008 0.03Hellenic Telecommunications Organization 209,831 1,426 0.02JUMBO 176,162 1,675 0.02National Bank of Greece 6,601,674 1,023 0.01OPAP 287,986 1,895 0.02Piraeus Bank 6,852,082 773 0.01Titan Cement 97,742 1,765 0.02
HONG KONG (1.17%) 94,840 1.25AIA 395,400 2,028 0.03Bank of East Asia 611,885 1,915 0.03Beijing Enterprises 442,889 1,732 0.02BOC Hong Kong 706,014 1,833 0.02Cathay Pacific Airways 1,169,549 1,252 0.02China Everbright 1,182,037 1,865 0.02China Everbright International 2,118,367 1,943 0.03China Jinmao 8,048,000 1,914 0.03China Merchants Port 820,276 1,685 0.02China Mobile 213,320 1,991 0.03China Overseas Land & Investment 746,000 1,948 0.03China Power International Development 5,583,000 1,655 0.02China Resources Beer 1,545,950 2,532 0.03China Resources Power 1,421,811 1,890 0.02China Taiping Insurance 1,197,017 1,820 0.02China Unicom Hong Kong 2,043,024 1,892 0.02CITIC 1,530,084 1,684 0.02CLP 240,500 1,917 0.03CNOOC 2,049,788 1,962 0.03CSPC Pharmaceutical 2,510,461 1,938 0.03Far East Horizon 3,044,428 2,217 0.03Fosun International 1,614,196 1,869 0.02Galaxy Entertainment 741,000 2,153 0.03Guangdong Investment 1,749,382 2,144 0.03Hang Lung Properties 1,201,000 2,081 0.03Hang Seng Bank 122,800 1,692 0.02Henderson Land Development 392,926 1,798 0.02HK Electric Investments 2,499,000 1,887 0.02HKT Trust & HKT 1,534,870 1,667 0.02Hong Kong & China Gas 1,277,227 1,858 0.02Hong Kong Exchanges & Clearing 93,665 1,899 0.03Hysan Development 535,000 1,932 0.03Lenovo 3,427,283 1,749 0.02Link REIT# 410,000 2,321 0.03MTR 536,000 2,272 0.03New World Development 2,213,831 2,216 0.03PCCW 3,966,663 1,878 0.02Power Assets 252,809 1,901 0.03Shanghai Industrial 1,008,592 2,233 0.03Sino Land 1,560,997 2,125 0.03Sino-Ocean 5,619,863 1,990 0.03SJM 3,399,000 1,924 0.03
18

Security Holdings
MarketValue£000
% ofNet
Assets
St. James's Place Global Equity Unit Trust
Portfolio Statement (continued)
as at 30 September 2016
Sun Art Retail 3,401,000 1,803 0.02Sun Hung Kai Properties 176,000 2,047 0.03Swire Pacific 'A' Shares 212,000 1,761 0.02Swire Properties 794,600 1,783 0.02Techtronic Industries 551,737 1,658 0.02Wharf 413,000 2,309 0.03Wheelock 503,000 2,277 0.03
HUNGARY (0.08%) 6,177 0.09MOL Hungarian Oil & Gas 44,681 2,102 0.03OTP Bank 103,494 2,079 0.03Richter Gedeon 128,202 1,996 0.03
INDIA (0.42%) 31,050 0.40Axis Bank GDR 120,000 3,730 0.05Dr Reddy's Laboratories ADR 53,893 1,921 0.03GAIL India GDR 90,000 2,301 0.03Hindalco Industries GDR 1,520,000 2,632 0.03ICICI Bank ADR 273,705 1,560 0.02Infosys ADR 74,240 909 0.01Larsen & Toubro GDR 139,933 2,310 0.03LIC Housing Finance GDR 248,383 3,237 0.04Reliance Industries GDR 66,125 1,673 0.02State Bank of India GDR 65,346 1,875 0.02Tata Motors ADR 79,445 2,409 0.03Tata Steel GDR 500,000 2,129 0.03Vedanta Limited ADR 220,000 1,687 0.02Wipro ADR 355,229 2,677 0.04
INDONESIA (0.59%) 62,415 0.81Adaro Energy 36,869,002 2,626 0.03AKR Corporindo 5,200,000 1,982 0.03Astra International 4,579,800 2,233 0.03Bank Central Asia 2,472,500 2,287 0.03Bank Danamon Indonesia 10,857,905 2,580 0.03Bank Mandiri 3,538,179 2,342 0.03Bank Negara Indonesia 6,676,719 2,190 0.03Bank Rakyat Indonesia 3,034,000 2,188 0.03Bumi Serpong Damai 16,590,700 2,148 0.03Charoen Pokphand Indonesia 8,856,500 1,832 0.02Global Mediacom 28,011,323 1,465 0.02Gudang Garam 424,121 1,554 0.02Hanjaya Mandala Sampoerna 7,760,000 1,812 0.02Indocement Tunggal Prakarsa 1,822,200 1,869 0.02Indofood CBP Sukses Makmur 3,787,600 2,121 0.03Indofood Sukses Makmur 4,286,475 2,204 0.03Jasa Marga 5,681,490 1,545 0.02Kalbe Farma 21,585,719 2,182 0.03Lippo Karawaci 31,864,700 1,865 0.02Matahari Department Store 1,814,952 1,982 0.03Media Nusantara Citra 14,203,797 1,696 0.02Perusahaan Gas Negara 12,443,032 2,103 0.03Semen Indonesia 3,412,100 2,037 0.03Summarecon Agung 20,327,500 2,097 0.03Surya Citra Media 10,610,292 1,756 0.02Telekomunikasi Indonesia 7,966,200 2,025 0.03Tower Bersama Infrastructure 4,528,092 1,633 0.02Unilever Indonesia 689,100 1,815 0.02United Tractors 2,243,015 2,347 0.03
19

Security Holdings
MarketValue£000
% ofNet
Assets
St. James's Place Global Equity Unit Trust
Portfolio Statement (continued)
as at 30 September 2016
Waskita Karya 14,318,900 2,217 0.03XL Axiata 10,540,350 1,682 0.02
IRELAND (2.00%) 127,330 1.67Accenture 18,752 1,760 0.02Alkermes 51,010 1,838 0.02Allergan 9,757 1,737 0.02Bank of Ireland 9,039,486 1,362 0.02BlackRock Institutional US Dollar Liquidity Fund Inc 101,992,438 78,677 1.04CRH 72,421 1,840 0.02DCC 27,673 1,926 0.03Eaton 38,859 1,923 0.03Endo International 145,201 2,343 0.03Grafton 1,560,861 7,623 0.10Ingersoll-Rand 33,535 1,736 0.02James Hardie Industries 149,557 1,784 0.02Jazz Pharmaceuticals 15,270 1,449 0.02Johnson Controls International 92,005 3,259 0.04Kerry 24,398 1,510 0.02Mallinckrodt 36,678 1,951 0.03Medtronic 29,281 1,929 0.03Paddy Power Betfair 17,635 1,521 0.02Pentair 36,235 1,760 0.02Perrigo 23,056 1,658 0.02Ryanair 153,465 1,600 0.02Seagate Technology 85,200 2,483 0.03Weatherford International 434,608 1,901 0.03Willis Towers Watson 17,579 1,760 0.02
ISLE OF MAN (0.02%) 3,548 0.04Genting Singapore 3,973,700 1,674 0.02New Europe Property Investments 217,132 1,874 0.02
ISRAEL (0.26%) 17,986 0.24Azrieli 60,019 2,021 0.03Bank Hapoalim 479,038 2,088 0.03Bank Leumi Le-Israel 628,437 1,834 0.02Bezeq The Israeli Telecommunication 1,086,145 1,576 0.02Check Point Software Technologies 27,000 1,598 0.02Israel Chemicals 500,654 1,497 0.02Mizrahi Tefahot Bank 217,246 2,123 0.03NICE Systems 38,917 2,001 0.03Taro Pharmaceutical Industries 18,526 1,621 0.02Teva Pharmaceutical Industries 44,121 1,627 0.02
ITALY (0.61%) 27,624 0.35Assicurazioni Generali 151,922 1,394 0.02Atlantia 86,749 1,656 0.02Enel 552,636 1,877 0.02Eni 143,231 1,574 0.02EXOR 54,615 1,652 0.02Intesa Sanpaolo 920,039 1,504 0.02Leonardo-Finmeccanica 200,827 1,711 0.02Luxottica 40,277 1,465 0.02Mediobanca 277,034 1,339 0.02Poste Italiane 346,651 1,787 0.02Prysmian 89,992 1,790 0.02Saipem 5,205,326 1,622 0.02Snam 388,610 1,650 0.02
20

Security Holdings
MarketValue£000
% ofNet
Assets
St. James's Place Global Equity Unit Trust
Portfolio Statement (continued)
as at 30 September 2016
Telecom Italia 1,957,261 1,231 0.02Telecom Italia Savings Shares 1,006,426 518 0.01Terna Rete Elettrica Nazionale 397,513 1,561 0.02UniCredit 631,956 1,059 0.01Unione di Banche Italiane 532,873 898 0.01UnipolSai 1,105,041 1,336 0.02
JAPAN (9.06%) 716,253 9.32ABC-Mart 34,700 1,815 0.02Acom 427,904 1,543 0.02Aeon 141,969 1,611 0.02AEON Financial Service 113,300 1,514 0.02Aeon Mall 166,800 2,018 0.03Air Water 137,000 1,980 0.03Aisin Seiki 63,800 2,231 0.03Ajinomoto 96,855 1,655 0.02Alfresa 105,900 1,717 0.02Alps Electric 117,352 2,148 0.03Amada 228,600 1,818 0.02ANA 757,143 1,577 0.02Aozora Bank 673,000 1,776 0.02Asahi 70,783 1,978 0.03Asahi Glass 372,000 1,844 0.02Asahi Kasei 354,186 2,163 0.03Asics 102,434 1,578 0.02Astellas Pharma 166,400 1,993 0.03Bandai Namco 97,389 2,280 0.03Bank of Kyoto 347,000 1,942 0.03Benesse 102,684 2,011 0.03Bridgestone 73,400 2,072 0.03Brother Industries 190,563 2,559 0.03Calbee 61,645 1,793 0.02Canon 85,000 1,893 0.02Casio Computer 141,809 1,514 0.02Central Japan Railway 13,135 1,724 0.02Chiba Bank 438,000 1,900 0.03Chubu Electric Power 159,731 1,784 0.02Chugai Pharmaceutical 62,382 1,727 0.02Chugoku Bank 197,900 1,846 0.02Chugoku Electric Power 187,800 1,814 0.02Concordia Financial 537,000 1,789 0.02Credit Saison 126,363 1,607 0.02CYBERDYNE 132,000 1,585 0.02Dai Nippon Printing 219,056 1,645 0.02Daicel 184,820 1,781 0.02Dai-ichi Life Insurance 201,696 2,109 0.03Daiichi Sankyo 106,726 1,962 0.03Daikin Industries 26,600 1,896 0.02Daito Trust Construction 15,300 1,886 0.02Daiwa House Industry 77,580 1,629 0.02Daiwa House REIT Investment# 787 1,780 0.02Daiwa Securities 383,000 1,647 0.02Denso 57,600 1,755 0.02Dentsu 45,026 1,751 0.02Don Quijote 69,654 1,957 0.03East Japan Railway 24,994 1,730 0.02Eisai 38,244 1,830 0.02
21

Security Holdings
MarketValue£000
% ofNet
Assets
St. James's Place Global Equity Unit Trust
Portfolio Statement (continued)
as at 30 September 2016
Electric Power Development 87,687 1,617 0.02FamilyMart UNY 57,174 2,925 0.04FANUC 14,900 1,929 0.03Fast Retailing 72,485 17,814 0.23Fuji Electric 543,000 1,900 0.03Fuji Heavy Industries 62,735 1,796 0.02FUJIFILM 59,394 1,683 0.02Fujitsu 587,000 2,415 0.03Fukuoka Financial 634,941 2,019 0.03GungHo Online Entertainment 934,150 1,752 0.02Hachijuni Bank 496,600 1,969 0.03Hakuhodo DY 178,900 1,606 0.02Hamamatsu Photonics 88,400 2,076 0.03Hankyu Hanshin 68,800 1,818 0.02Hikari Tsushin 27,227 1,941 0.03Hino Motors 223,300 1,822 0.02Hirose Electric 18,500 1,859 0.02Hiroshima Bank 617,000 1,952 0.03Hisamitsu Pharmaceutical 43,269 1,788 0.02Hitachi 499,000 1,783 0.02Hitachi Chemical 136,241 2,396 0.03Hitachi Construction Machinery 144,902 2,202 0.03Hitachi High-Technologies 84,338 2,582 0.03Hitachi Metals 212,948 1,999 0.03Hokuriku Electric Power 182,400 1,705 0.02Honda Motor 81,519 1,791 0.02Hoshizaki Electric 24,100 1,687 0.02Hoya 64,135 1,971 0.03Hulic 250,900 1,959 0.03Idemitsu Kosan 106,800 1,691 0.02IHI 923,794 2,043 0.03Iida 102,989 1,587 0.02Inpex 293,200 2,031 0.03Isetan Mitsukoshi 236,700 1,780 0.02Isuzu Motors 192,319 1,725 0.02ITOCHU 171,500 1,648 0.02Iyo Bank 334,000 1,548 0.02J Front Retailing 196,500 1,969 0.03Japan Airlines 71,699 1,617 0.02Japan Airport Terminal 65,700 1,919 0.03Japan Exchange 163,741 1,949 0.03Japan Post 178,537 1,718 0.02Japan Post Bank 191,739 1,744 0.02Japan Prime Realty Investment# 524 1,820 0.02Japan Real Estate Investment# 469 2,153 0.03Japan Retail Fund Investment# 954 1,814 0.02Japan Tobacco 61,500 1,931 0.03JFE 166,360 1,852 0.02JGC 134,000 1,778 0.02Joyo Bank 687,000 2,273 0.03JSR 162,200 1,949 0.03JTEKT 166,400 1,902 0.03JX 564,900 1,751 0.02Kajima 380,888 2,039 0.03Kakaku.com 114,777 1,594 0.02Kamigumi 261,565 1,747 0.02Kaneka 279,715 1,696 0.02
22

Security Holdings
MarketValue£000
% ofNet
Assets
St. James's Place Global Equity Unit Trust
Portfolio Statement (continued)
as at 30 September 2016
Kansai Electric Power 246,066 1,717 0.02Kansai Paint 117,200 1,968 0.03Kao 42,492 1,843 0.02Kawasaki Heavy Industries 732,000 1,725 0.02KDDI 75,842 1,801 0.02Keihan Electric Railway 324,862 1,744 0.02Keikyu 269,546 2,160 0.03Keio 267,701 1,794 0.02Keisei Electric Railway 88,973 1,699 0.02Keyence 4,119 2,307 0.03Kikkoman 67,703 1,657 0.02Kintetsu 561,186 1,806 0.02Kirin 133,290 1,698 0.02Kobe Steel 246,300 1,700 0.02Koito Manufacturing 54,937 2,042 0.03Komatsu 135,020 2,361 0.03Konami 62,571 1,851 0.02Konica Minolta 265,071 1,714 0.02Kose 25,647 2,006 0.03Kubota 2,292,942 26,436 0.35Kuraray 175,200 1,988 0.03Kurita Water Industries 106,700 1,944 0.03Kyocera 46,700 1,714 0.02Kyowa Hakko Kirin 124,481 1,502 0.02Kyushu Electric Power 225,600 1,626 0.02Kyushu Financial 440,084 2,295 0.03Lawson 28,409 1,726 0.02LIXIL 129,651 2,131 0.03M3 77,342 2,026 0.03Mabuchi Motor 48,600 2,049 0.03Makita 38,517 2,103 0.03Marubeni 473,820 1,862 0.02Marui 145,283 1,471 0.02Maruichi Steel Tube 68,547 1,816 0.02Mazda Motor 137,400 1,602 0.02McDonald's Holdings Company Japan 89,496 2,033 0.03Medipal 136,489 1,813 0.02MEIJI 26,666 2,027 0.03Minebea 290,600 2,090 0.03Miraca 56,700 2,162 0.03Mitsubishi 130,658 2,273 0.03Mitsubishi Chemical 440,262 2,107 0.03Mitsubishi Electric 196,000 1,916 0.03Mitsubishi Estate 115,646 1,663 0.02Mitsubishi Gas Chemical 207,468 2,278 0.03Mitsubishi Heavy Industries 572,000 1,827 0.02Mitsubishi Logistics 159,128 1,757 0.02Mitsubishi Materials 77,700 1,623 0.02Mitsubishi Motors 445,800 1,591 0.02Mitsubishi Tanabe Pharma 123,638 2,031 0.03Mitsubishi UFJ Financial 454,800 1,751 0.02Mitsubishi UFJ Lease & Finance 525,516 1,843 0.02Mitsui 188,600 1,999 0.03Mitsui Chemicals 620,837 2,249 0.03Mitsui Fudosan 95,191 1,547 0.02Mitsui OSK Lines 968,000 1,720 0.02Mixi 58,300 1,609 0.02
23

Security Holdings
MarketValue£000
% ofNet
Assets
St. James's Place Global Equity Unit Trust
Portfolio Statement (continued)
as at 30 September 2016
Mizuho Financial 1,435,924 1,845 0.02MS&AD Insurance 83,200 1,768 0.02Murata Manufacturing 19,980 1,984 0.03Nabtesco 90,290 1,958 0.03Nagoya Railroad 451,815 1,888 0.02NEC 971,096 1,910 0.03Nexon 140,153 1,682 0.02NGK Insulators 101,000 1,599 0.02NGK Spark Plug 122,149 1,646 0.02NH Foods 99,030 1,839 0.02NHK Spring 256,700 1,901 0.03Nidec 27,763 1,958 0.03Nikon 165,874 1,900 0.03Nintendo 15,300 3,104 0.04Nippon Building Fund# 370 1,806 0.02Nippon Electric Glass 464,260 1,834 0.02Nippon Express 485,000 1,734 0.02Nippon Paint 91,480 2,330 0.03Nippon Prologis REIT# 1,338 2,604 0.03Nippon Steel & Sumitomo Metal 111,576 1,750 0.02Nippon Telegraph & Telephone 53,167 1,871 0.02Nippon Yusen 1,178,000 1,689 0.02Nissan Motor 239,501 1,794 0.02Nisshin Seifun 140,440 1,640 0.02Nissin Foods 41,810 1,951 0.03Nitori 22,350 2,050 0.03Nitto Denko 35,141 1,739 0.02NOK 130,577 2,179 0.03Nomura 510,300 1,735 0.02Nomura Real Estate 128,050 1,656 0.02Nomura Real Estate Master Fund# 1,685 2,159 0.03Nomura Research Institute 56,176 1,484 0.02NSK 259,400 2,027 0.03NTT Data 44,530 1,705 0.02NTT DOCOMO 88,142 1,721 0.02NTT Urban Development 220,536 1,635 0.02Obayashi 235,274 1,785 0.02Obic 41,900 1,703 0.02Odakyu Electric Railway 111,054 1,895 0.02Oji 550,625 1,667 0.02Olympus 55,549 1,480 0.02Omron 72,089 1,982 0.03Ono Pharmaceutical 1,154,267 24,701 0.33Oracle Japan 46,654 2,021 0.03Oriental Land 37,600 1,757 0.02ORIX 148,200 1,669 0.02Osaka Gas 618,000 1,984 0.03Otsuka 49,778 1,811 0.02Otsuka Holdings 53,851 1,884 0.02Panasonic 250,400 1,912 0.03Park24 78,488 1,960 0.03Pola Orbis 29,900 2,054 0.03Rakuten 231,600 2,313 0.03Recruit 88,220 2,765 0.04Resona 577,400 1,858 0.02Ricoh 259,353 1,794 0.02Rinnai 24,365 1,735 0.02
24

Security Holdings
MarketValue£000
% ofNet
Assets
St. James's Place Global Equity Unit Trust
Portfolio Statement (continued)
as at 30 September 2016
Rohm 54,127 2,171 0.03Ryohin Keikaku 10,257 1,590 0.02Sankyo 64,850 1,699 0.02Santen Pharmaceutical 160,517 1,811 0.02SBI 192,710 1,753 0.02Secom 32,664 1,870 0.02Sega Sammy 205,800 2,252 0.03Seibu 117,753 1,492 0.02Seiko Epson 128,400 1,891 0.02Sekisui Chemical 184,264 2,030 0.03Sekisui House 129,148 1,684 0.02Seven & i 52,474 1,903 0.03Seven Bank 609,605 1,492 0.02Sharp 386,000 397 0.01Shikoku Electric Power 195,995 1,486 0.02Shimadzu 143,909 1,680 0.02Shimamura 18,630 1,739 0.02Shimano 14,629 1,663 0.02Shimizu 254,752 1,748 0.02Shin-Etsu Chemical 38,908 2,074 0.03Shinsei Bank 1,443,000 1,661 0.02Shionogi 41,065 1,610 0.02Shiseido 2,086,190 42,354 0.56Shizuoka Bank 308,000 1,886 0.02Showa Shell Sekiyu 245,613 1,745 0.02SMC 9,243 2,036 0.03Softbank 43,700 2,169 0.03Sohgo Security Services 51,000 2,092 0.03Sompo 79,450 1,796 0.02Sony 87,545 2,198 0.03Sony Financial 182,738 1,923 0.03Stanley Electric 118,800 2,451 0.03Start Today 167,400 2,206 0.03Sumitomo 212,400 1,819 0.02Sumitomo Chemical 500,260 1,694 0.02Sumitomo Dainippon Pharma 156,628 2,323 0.03Sumitomo Electric Industries 164,173 1,770 0.02Sumitomo Heavy Industries 479,126 1,797 0.02Sumitomo Metal Mining 232,000 2,450 0.03Sumitomo Mitsui Financial 70,312 1,812 0.02Sumitomo Mitsui Trust 66,600 1,660 0.02Sumitomo Realty & Development 79,905 1,580 0.02Sumitomo Rubber Industries 164,100 1,899 0.03Sundrug 30,800 1,980 0.03Suntory Beverage & Food 48,962 1,622 0.02Suruga Bank 114,540 2,104 0.03Suzuken 78,692 1,992 0.03Suzuki Motor 89,204 2,283 0.03Sysmex 34,886 1,979 0.03T&D 231,750 1,996 0.03Taiheiyo Cement 882,939 1,939 0.03Taisei 348,421 2,003 0.03Taisho Pharmaceutical 24,818 1,951 0.03Taiyo Nippon Sanso 258,210 2,059 0.03Takashimaya 322,000 2,028 0.03Takeda Pharmaceutical 51,836 1,906 0.03TDK 39,306 2,005 0.03
25

Security Holdings
MarketValue£000
% ofNet
Assets
St. James's Place Global Equity Unit Trust
Portfolio Statement (continued)
as at 30 September 2016
Teijin 128,033 1,899 0.03Terumo 55,839 1,641 0.02THK 116,700 1,751 0.02Tobu Railway 457,958 1,788 0.02Toho 81,994 2,088 0.03Toho Gas 289,661 2,081 0.03Tohoku Electric Power 193,204 1,936 0.03Tokio Marine 64,100 1,874 0.02Tokyo Electric Power 473,461 1,567 0.02Tokyo Electron 28,289 1,915 0.03Tokyo Gas 554,000 1,891 0.02Tokyo Ohka Kogyo 556,059 12,996 0.17Tokyo Tatemono 181,300 1,667 0.02Tokyu 278,312 1,630 0.02Tokyu Fudosan 389,700 1,617 0.02TonenGeneral Sekiyu 251,854 1,949 0.03Toppan Printing 244,517 1,691 0.02Toray Industries 275,460 2,055 0.03Toshiba 1,061,557 2,712 0.04TOTO 62,099 1,792 0.02Toyo Seikan 111,962 1,511 0.02Toyo Suisan Kaisha 59,470 1,936 0.03Toyoda Gosei 116,614 2,072 0.03Toyota Industries 53,800 1,906 0.03Toyota Motor 48,100 2,119 0.03Toyota Tsusho 103,200 1,831 0.02Trend Micro 60,888 1,625 0.02Tsuruha 24,800 2,201 0.03Unicharm 106,407 2,115 0.03United Urban Investment# 1,356 1,906 0.03USS 134,900 1,746 0.02West Japan Railway 37,787 1,796 0.02Yahoo Japan 525,640 1,607 0.02Yakult Honsha 45,197 1,561 0.02Yamada Denki 477,938 1,822 0.02Yamaguchi Financial 219,000 1,792 0.02Yamaha 84,135 2,082 0.03Yamaha Motor 167,883 2,583 0.03Yamato 111,500 1,991 0.03Yamazaki Baking 93,825 1,769 0.02Yaskawa Electric 182,478 2,083 0.03Yokogawa Electric 181,966 1,847 0.02Yokohama Rubber 150,100 1,830 0.02
JERSEY (0.17%) 16,786 0.20Delphi Automotive 32,692 1,757 0.02Experian 118,839 1,825 0.02Glencore 1,132,269 2,403 0.03Petrofac 194,882 1,739 0.02Randgold Resources 32,394 2,601 0.03Shire 58,745 2,941 0.04Wolseley 39,420 1,703 0.02WPP 100,446 1,817 0.02
LIBERIA (0.03%) 1,642 0.02Royal Caribbean Cruises 28,684 1,642 0.02
26

Security Holdings
MarketValue£000
% ofNet
Assets
St. James's Place Global Equity Unit Trust
Portfolio Statement (continued)
as at 30 September 2016
LUXEMBOURG (0.15%) 9,194 0.12ArcelorMittal 491,048 2,261 0.03Millicom International Cellular SDR 38,770 1,547 0.02RTL 24,568 1,556 0.02SES 103,259 1,933 0.03Tenaris 174,109 1,897 0.02
MALAYSIA (0.87%) 77,754 0.96AirAsia 4,030,012 2,090 0.03Alliance Financial 2,294,207 1,592 0.02AMMB 2,083,000 1,589 0.02Astro Malaysia 3,230,900 1,645 0.02Axiata 1,685,201 1,641 0.02Berjaya Sports Toto 2,895,839 1,783 0.02British American Tobacco Malaysia 181,900 1,667 0.02CIMB 2,253,800 1,980 0.03Dialog 6,263,800 1,706 0.02DiGi.Com 2,060,603 1,914 0.03Felda Global Ventures 6,796,980 2,967 0.04Gamuda 1,913,474 1,745 0.02Genting 1,090,745 1,613 0.02Genting Malaysia 2,191,000 1,860 0.02Genting Plantations 855,200 1,745 0.02HAP Seng Consolidated 1,164,700 1,664 0.02Hartalega 2,128,000 1,842 0.02Hong Leong Bank 679,716 1,663 0.02Hong Leong Financial 607,150 1,746 0.02IHH Healthcare 1,390,500 1,637 0.02IJM 2,860,500 1,713 0.02IOI 2,240,600 1,860 0.02IOI Properties 4,066,016 1,881 0.02Kuala Lumpur Kepong 424,500 1,897 0.02Lafarge Malaysia 1,146,589 1,694 0.02Malayan Banking 1,138,907 1,593 0.02Malaysia Airports 1,423,125 1,720 0.02Maxis 1,638,100 1,882 0.02MISC 1,209,600 1,703 0.02Petronas Chemicals 1,468,600 1,822 0.02Petronas Dagangan 456,500 2,001 0.03Petronas Gas 448,500 1,827 0.02PPB 608,600 1,837 0.02Public Bank 522,490 1,932 0.03RHB Capital 2,204,300 1,912 0.03Sapurakencana Petroleum 5,457,381 1,598 0.02Sime Darby 1,194,300 1,704 0.02Telekom Malaysia 1,439,164 1,820 0.02Tenaga Nasional 682,000 1,819 0.02UMW 1,768,490 1,923 0.03Westports 2,108,300 1,722 0.02YTL 5,692,413 1,890 0.02YTL Power International 6,417,893 1,915 0.03
MALTA (0.03%) 1,768 0.02Brait 284,955 1,768 0.02
MAURITIUS (0.02%) 1,761 0.02Golden Agri-Resources 8,775,200 1,761 0.02
27

Security Holdings
MarketValue£000
% ofNet
Assets
St. James's Place Global Equity Unit Trust
Portfolio Statement (continued)
as at 30 September 2016
MEXICO (0.71%) 46,264 0.56Alfa 1,244,542 1,484 0.02America Movil 3,586,516 1,574 0.02Arca Continental 385,800 1,761 0.02Cemex 3,817,172 2,389 0.03Coca-Cola Femsa 281,400 1,622 0.02El Puerto de Liverpool 202,449 1,622 0.02Fibra Uno Administracion# 1,006,615 1,413 0.02Fomento Economico Mexicano 245,667 1,724 0.02Gentera 1,267,690 1,740 0.02Gruma 170,734 1,731 0.02Grupo Aeroportuario del Pacifico 236,631 1,694 0.02Grupo Aeroportuario del Sureste 163,268 1,807 0.02Grupo Bimbo 782,639 1,629 0.02Grupo Carso 528,148 1,634 0.02Grupo Comercial Chedraui 869,000 1,502 0.02Grupo Financiero Banorte 420,941 1,696 0.02Grupo Financiero Inbursa 1,300,200 1,604 0.02Grupo Financiero Santander Mexico 1,209,800 1,631 0.02Grupo Lala 1,028,748 1,533 0.02Grupo Mexico 1,005,795 1,859 0.02Grupo Televisa 444,032 1,752 0.02Industrias Penoles 127,853 2,421 0.03Kimberly-Clark de Mexico 909,947 1,588 0.02Mexichem 1,025,018 1,778 0.02OHL Mexico 1,902,870 1,865 0.02Promotora y Operadora de Infraestructura 192,192 1,603 0.02Wal-Mart de Mexico 936,798 1,608 0.02
NETHERLANDS (3.07%) 265,361 3.46ABN Amro 125,228 1,933 0.03Aegon 466,138 1,336 0.02AerCap 59,788 1,742 0.02Airbus 36,483 1,655 0.02Akzo Nobel 371,811 19,153 0.25Altice 'A' Shares 102,035 1,409 0.02Altice 'B' Shares 30,160 419 0.01Asian Paints Warrants 15/01/2020 1,478,000 19,793 0.26ASML 22,539 1,885 0.02ASML (New York) 435,000 36,482 0.48Boskalis Westminster 61,196 1,615 0.02CNH Industrial 312,237 1,673 0.02Core Laboratories 19,192 1,635 0.02Eicher Motors Warrants 14/05/2020 72,000 20,691 0.27Ferrari 52,260 2,038 0.03Fiat Chrysler Automobiles 309,066 1,439 0.02Gemalto 37,108 1,819 0.02Heineken 25,411 1,698 0.02Heineken Holding 28,903 1,760 0.02Housing Development Finance Warrants 30/09/2019 2,544,000 40,917 0.54ING 202,384 1,841 0.02Koninklijke Ahold Delhaize 208,773 3,593 0.05Koninklijke DSM 37,538 1,911 0.03Koninklijke KPN 569,479 1,446 0.02Koninklijke Philips 92,421 2,065 0.03Koninklijke Vopak 41,699 1,681 0.02LyondellBasell Industries 26,877 1,668 0.02
28

Security Holdings
MarketValue£000
% ofNet
Assets
St. James's Place Global Equity Unit Trust
Portfolio Statement (continued)
as at 30 September 2016
Maruti Suzuki India Warrants 04/03/2020 446,000 27,974 0.37Mobileye 51,000 1,640 0.02Motherson Sumi Systems Warrants 05/11/2018 2,900,000 10,201 0.13Mylan 57,834 1,716 0.02NN 69,601 1,614 0.02NXP Semiconductors 24,130 1,790 0.02OCI 156,026 1,733 0.02QIAGEN 102,837 2,103 0.03Randstad 41,412 1,418 0.02RELX 134,242 1,848 0.02Sensata Technologies 60,277 1,760 0.02Steinhoff International 518,608 2,285 0.03STMicroelectronics 371,014 2,282 0.03Titan Warrants 30/09/2019 3,075,000 13,876 0.18Unilever 455,211 16,000 0.21Wolters Kluwer 55,987 1,824 0.02
NEW ZEALAND (0.18%) 14,117 0.19Auckland International Airport 516,307 2,117 0.03Contact Energy 690,009 1,924 0.03Fletcher Building 415,541 2,478 0.03Meridian Energy 1,416,049 2,054 0.03Mighty River Power 1,134,813 1,913 0.03Ryman Healthcare 345,291 1,837 0.02Spark New Zealand 887,491 1,794 0.02
NORWAY (0.15%) 16,575 0.19DNB 175,660 1,750 0.02Gjensidige Forsikring 130,989 1,864 0.02Marine Harvest 135,011 1,845 0.02Norsk Hydro 554,638 1,829 0.02Orkla 243,821 1,921 0.03Schibsted 'A' Shares 43,424 970 0.01Schibsted 'B' Shares 39,247 804 0.01Statoil 148,464 1,891 0.02Telenor 145,331 1,897 0.02Yara International 71,064 1,804 0.02
PANAMA (0.03%) 1,656 0.02Carnival 44,488 1,656 0.02
PAPUA NEW GUINEA (0.00%) 1,580 0.02Oil Search 380,000 1,580 0.02
PERU (0.01%) 2,407 0.03Cia de Minas Buenaventura ADR 225,283 2,407 0.03
PHILIPPINES (0.54%) 39,357 0.47Aboitiz Equity Ventures 1,386,400 1,662 0.02Aboitiz Power 2,499,797 1,813 0.02Alliance Global 7,026,200 1,773 0.02Ayala 139,832 1,906 0.03Ayala Land 2,787,792 1,736 0.02Bank of the Philippine Islands 1,103,254 1,843 0.02BDO Unibank 998,134 1,739 0.02DMCI 7,729,100 1,483 0.02Energy Development 19,532,111 1,833 0.02Globe Telecom 52,660 1,709 0.02GT Capital 72,675 1,665 0.02International Container Terminal Services 1,697,320 2,079 0.03JG Summit 1,333,339 1,577 0.02
29

Security Holdings
MarketValue£000
% ofNet
Assets
St. James's Place Global Equity Unit Trust
Portfolio Statement (continued)
as at 30 September 2016
Jollibee Foods 439,430 1,725 0.02Megaworld 24,435,000 1,831 0.02Metro Pacific Investments 16,780,964 1,893 0.02Metropolitan Bank & Trust 1,246,784 1,692 0.02PLDT 62,664 1,704 0.02Robinsons Land 3,840,800 1,885 0.02Security Bank 195,930 752 0.01SM Investments 159,064 1,704 0.02SM Prime 4,215,684 1,884 0.02Universal Robina 518,837 1,469 0.02
POLAND (0.57%) 39,117 0.52Alior Bank 172,304 1,599 0.02Bank Handlowy w Warszawie 131,309 2,037 0.03Bank Millennium 1,737,806 1,921 0.03Bank Pekao 74,403 1,865 0.02Bank Zachodni WBK 34,710 2,165 0.03CCC 55,000 1,979 0.03Cyfrowy Polsat 354,441 1,769 0.02Enea 767,729 1,351 0.02Energa 864,458 1,314 0.02Eurocash 167,609 1,424 0.02Grupa Azoty 109,515 1,345 0.02Grupa Lotos 301,670 1,749 0.02KGHM Polska Miedz 122,101 1,803 0.02LPP 1,700 1,350 0.02mBank 29,223 2,029 0.03Orange Polska 1,440,976 1,696 0.02PGE Polska Grupa Energetyczna 682,946 1,409 0.02Polski Koncern Naftowy Orlen 136,666 1,775 0.02Polskie Gornictwo Naftowe i Gazownictwo 1,658,670 1,691 0.02Powszechna Kasa Oszczednosci Bank Polski 320,024 1,672 0.02Powszechny Zaklad Ubezpieczen 294,168 1,431 0.02Synthos 2,384,861 2,089 0.03Tauron Polska Energia 3,225,567 1,654 0.02
PORTUGAL (0.09%) 5,484 0.08EDP - Energias de Portugal 604,318 1,535 0.02Galp Energia 193,852 2,032 0.03Jeronimo Martins 145,755 1,917 0.03
QATAR (0.37%) 24,933 0.36Barwa Real Estate 261,129 1,872 0.03Commercial Bank 226,120 1,849 0.03Doha Bank 182,040 1,434 0.02Ezdan 525,000 1,868 0.03Industries Qatar 84,912 1,939 0.03Masraf Al Rayan 246,000 1,850 0.03Ooredoo Telecom 114,000 2,318 0.03Qatar Electricity & Water 44,000 1,990 0.03Qatar Gas Transport 335,000 1,675 0.02Qatar Insurance 121,440 2,266 0.03Qatar Islamic Bank 84,326 1,867 0.03Qatar National Bank 67,448 2,229 0.03Vodafone Qatar 769,021 1,776 0.02
RUSSIA (0.44%) 34,973 0.47Gazprom ADR 683,870 2,221 0.03Lukoil ADR 57,386 2,151 0.03
30

Security Holdings
MarketValue£000
% ofNet
Assets
St. James's Place Global Equity Unit Trust
Portfolio Statement (continued)
as at 30 September 2016
Magnit GDR 56,977 1,846 0.02MegaFon GDR 191,843 1,416 0.02MMC Norilsk Nickel ADR 160,679 2,019 0.03Mobile Telesystems ADR 399,343 2,381 0.03NOVATEK GDR 29,326 2,473 0.03PhosAgro GDR 148,000 1,478 0.02Rosneft GDR 418,757 1,762 0.02Rostelecom ADR 267,644 1,542 0.02RusHydro ADR 3,281,276 2,999 0.04Sberbank of Russia ADR 310,456 2,243 0.03Severstal GDR 303,503 2,852 0.04Sistema GDR 403,951 2,312 0.03Surgutneftegas ADR 371,945 1,377 0.02Tatneft ADR 86,352 2,050 0.03VTB Bank GDR 1,074,862 1,851 0.03
SINGAPORE (1.03%) 82,389 1.11Ascendas Real Estate Investment Trust# 1,483,900 2,106 0.03Broadcom 14,476 1,926 0.03CapitaLand 1,009,300 1,820 0.03CapitaLand Commercial Trust# 2,411,500 2,168 0.03CapitaLand Mall Trust# 1,675,900 2,046 0.03City Developments 422,500 2,164 0.03ComfortDelGro 1,122,000 1,776 0.02DBS 2,328,869 20,249 0.27Flex 194,842 2,011 0.03Global Logistic Properties 1,491,900 1,577 0.02Hutchison Port Holdings Trust 5,158,000 1,751 0.02Jardine Cycle & Carriage 97,333 2,357 0.03Keppel 580,500 1,769 0.02Oversea-Chinese Banking 364,490 1,780 0.02Sembcorp Industries 1,203,400 1,762 0.02SembCorp Marine 1,986,600 1,466 0.02Singapore Airlines 314,700 1,870 0.03Singapore Exchange 442,000 1,849 0.03Singapore Press 581,000 1,248 0.02Singapore Technologies Engineering 1,066,500 1,941 0.03Singapore Telecommunications 816,300 1,832 0.02StarHub 923,900 1,792 0.02Suntec Real Estate Investment Trust# 2,163,700 2,092 0.03United Overseas Bank 1,498,718 15,946 0.21UOL 512,500 1,625 0.02Wilmar International 1,074,500 1,950 0.03Yangzijiang Shipbuilding 3,598,700 1,516 0.02
SOUTH AFRICA (1.50%) 133,518 1.86African Bank Investments 2,589,783 1 -Anglo American Platinum 117,525 2,586 0.04AngloGold Ashanti 149,215 1,899 0.03Aspen Pharmacare 110,662 1,906 0.03Barclays Africa 245,644 2,080 0.03Bid 159,646 2,322 0.03Bidvest 232,191 2,089 0.03Capitec Bank 60,562 2,161 0.03Coronation Fund Managers 483,860 1,893 0.03Discovery 285,032 1,818 0.02Exxaro Resources 524,601 2,442 0.03FirstRand 798,377 2,099 0.03
31

Security Holdings
MarketValue£000
% ofNet
Assets
St. James's Place Global Equity Unit Trust
Portfolio Statement (continued)
as at 30 September 2016
Fortress Income Fund 1,673,000 1,515 0.02Foschini 246,302 1,932 0.03Gold Fields 725,807 2,789 0.04Growthpoint Properties# 1,500,804 2,098 0.03Hyprop Investments# 288,973 1,940 0.03Impala Platinum 742,146 2,923 0.04Imperial 250,341 2,314 0.03Investec 372,791 1,746 0.02Liberty 280,903 1,834 0.03Life Healthcare 895,457 1,914 0.03Massmart 292,778 1,962 0.03MMI 1,555,483 1,924 0.03Mondi 113,653 1,845 0.02Mr Price 190,738 1,653 0.02MTN 269,537 1,765 0.02Naspers 247,830 32,949 0.44Nedbank 193,755 2,407 0.03Netcare 1,077,316 1,995 0.03Pick n Pay Stores 649,776 2,507 0.03Pioneer Foods 219,294 2,122 0.03PSG 181,731 2,000 0.03Rand Merchant Investment 838,056 1,961 0.03Redefine Properties# 3,203,920 2,050 0.03Remgro Ltd 140,463 1,823 0.03Resilient REIT# 287,451 1,824 0.03RMB 641,873 2,083 0.03Sanlam 549,253 1,941 0.03Sappi 499,343 1,987 0.03Sasol 96,784 2,018 0.03Shoprite 218,244 2,344 0.03Sibanye Gold 845,171 2,331 0.03SPAR 173,657 1,854 0.03Standard Bank 283,896 2,246 0.03Telkom 611,725 2,061 0.03Tiger Brands 102,995 2,230 0.03Truworths International 364,772 1,458 0.02Tsogo Sun 1,306,907 2,294 0.03Vodacom 213,152 1,826 0.03Woolworths South Africa 402,364 1,757 0.02
SOUTH KOREA (2.50%) 191,735 2.61AMOREPACIFIC 15,828 1,835 0.02Amorepacific 5,376 1,465 0.02Amorepacific Preference Shares 2,440 362 0.01BGF retail 16,826 2,269 0.03BNK Financial 320,836 1,928 0.03Celltrion 29,602 2,204 0.03Cheil Worldwide 163,302 1,830 0.03CJ 11,167 1,455 0.02CJ CheilJedang 7,371 1,874 0.03CJ E&M 34,000 1,807 0.02CJ Korea Express 14,000 2,113 0.03Coway 31,341 2,094 0.03Daelim Industrial 35,253 2,044 0.03Daewoo Engineering & Construction 480,021 2,138 0.03DGB Financial 300,000 1,895 0.02Dongbu Insurance 41,771 1,987 0.03
32

Security Holdings
MarketValue£000
% ofNet
Assets
St. James's Place Global Equity Unit Trust
Portfolio Statement (continued)
as at 30 September 2016
Dongsuh 76,777 1,570 0.02Doosan Heavy Industries & Construction 108,020 1,944 0.03E-Mart 14,474 1,592 0.02GS 50,889 1,907 0.03GS Engineering & Construction 89,869 1,847 0.03GS Retail 52,000 1,790 0.02Hana Financial 102,008 1,990 0.03Hankook Tire 53,077 2,208 0.03Hanmi Pharm 4,272 1,520 0.02Hanmi Science 19,264 1,531 0.02Hanon Systems 222,387 1,931 0.03Hanssem 15,650 1,924 0.03Hanwha 71,279 1,745 0.02Hanwha Chemical 99,545 1,687 0.02Hanwha Life Insurance 404,629 1,630 0.02Hanwha Rights 16/09/2027 18,422 - -Hotel Shilla 39,532 1,672 0.02Hyosung 20,436 1,861 0.03Hyundai Department Store 21,038 1,746 0.02Hyundai Development 58,848 2,114 0.03Hyundai Engineering & Construction 75,858 2,085 0.03Hyundai Glovis 12,946 1,637 0.02Hyundai Heavy Industries 28,488 2,754 0.04Hyundai Marine & Fire Insurance 73,187 1,856 0.03Hyundai Mobis 10,519 2,022 0.03Hyundai Motor 18,743 1,779 0.02Hyundai Motor Preference Shares 1,934 136 -Hyundai Motor Preference Shares 2nd 3,050 225 -Hyundai Steel 51,144 1,816 0.02Hyundai Wia 20,702 1,256 0.02Industrial Bank of Korea 227,013 1,900 0.03Kakao 23,033 1,320 0.02Kangwon Land 70,762 1,948 0.03KB Financial 66,080 1,750 0.02KCC 5,580 1,536 0.02KEPCO Plant Service & Engineering 35,419 1,434 0.02Kia Motors 56,266 1,659 0.02Korea Aerospace Industries 42,036 2,244 0.03Korea Electric Power 54,619 2,066 0.03Korea Gas 68,193 2,111 0.03Korea Investment 60,322 1,720 0.02Korea Zinc 5,708 1,923 0.03Korean Air Lines 92,625 2,264 0.03KT 81,750 1,827 0.03KT&G 23,513 2,059 0.03Kumho Petrochemical 41,838 2,045 0.03LG 34,921 1,578 0.02LG Chem 10,243 1,729 0.02LG Chem Preference Shares 1,432 165 -LG Display 110,324 2,167 0.03LG Electronics 45,612 1,530 0.02LG Household & Health Care 2,537 1,697 0.02LG Household & Health Care Preference Shares 600 216 -LG Innotek 26,210 1,437 0.02LG Uplus 237,273 1,944 0.03Lotte Chemical 11,347 2,368 0.03Lotte Chilsung Beverage 1,200 1,336 0.02
33

Security Holdings
MarketValue£000
% ofNet
Assets
St. James's Place Global Equity Unit Trust
Portfolio Statement (continued)
as at 30 September 2016
Lotte Confectionery 13,080 1,612 0.02Lotte Shopping 10,453 1,512 0.02Mirae Asset Daewoo 326,809 1,788 0.02Mirae Asset Securities 122,843 1,957 0.03NAVER 4,139 2,557 0.03NCSoft 12,815 2,652 0.04NH Investment & Securities 287,185 2,005 0.03OCI 29,224 1,914 0.03Orion 2,749 1,590 0.02Ottogi 2,700 1,416 0.02Paradise 164,843 1,836 0.02POSCO 15,465 2,459 0.03Posco Daewoo 113,355 1,945 0.03S-1 27,493 1,945 0.03Samsung C&T 22,212 2,318 0.03Samsung Card 67,896 2,383 0.03Samsung Electro-Mechanics 49,829 1,705 0.02Samsung Electronics 1,876 2,100 0.03Samsung Electronics Preference Shares 577 520 0.01Samsung Fire & Marine Insurance 9,026 1,767 0.02Samsung Heavy Industries 307,665 2,019 0.03Samsung Heavy Industries Rights 08/11/2016 191,027 294 -Samsung Life Insurance 23,606 1,744 0.02Samsung SDI 21,273 1,430 0.02Samsung SDS 14,322 1,540 0.02Samsung Securities 74,249 1,799 0.02Shinhan Financial 64,110 1,803 0.02Shinsegae 12,944 1,645 0.02SK 10,070 1,492 0.02SK Hynix 86,031 2,422 0.03SK Innovation 19,986 2,261 0.03SK Networks 434,471 2,036 0.03SK Telecom 15,410 2,439 0.03S-Oil 34,096 1,939 0.03Woori Bank 253,691 2,017 0.03Yuhan 9,397 1,826 0.03
SPAIN (0.67%) 73,975 0.98Abertis Infraestructuras 183,683 2,165 0.03ACS Actividades de Construccion y Servicios 78,367 1,787 0.02Aena 306,844 34,541 0.45Amadeus IT 49,377 1,882 0.03Banco Bilbao Vizcaya Argentaria 326,994 1,458 0.02Banco de Sabadell 1,129,093 1,060 0.02Banco Popular Espanol 1,235,855 1,112 0.02Banco Santander 448,733 1,474 0.02Bankia 2,534,694 1,528 0.02Bankinter 343,762 1,820 0.03CaixaBank 587,951 1,103 0.01Distribuidora Internacional de Alimentacion 393,376 1,831 0.02Enagas 73,351 1,684 0.02Endesa 135,000 2,196 0.03Ferrovial 120,083 1,930 0.03Gas Natural SDG 97,133 1,517 0.02Grifols 97,054 1,599 0.02Iberdrola 333,756 1,730 0.02Industria de Diseno Textil 78,885 2,230 0.03
34

Security Holdings
MarketValue£000
% ofNet
Assets
St. James's Place Global Equity Unit Trust
Portfolio Statement (continued)
as at 30 September 2016
International Consolidated Airlines 291,584 1,137 0.01Mapfre 708,495 1,482 0.02Red Elevtrica 114,240 1,887 0.03Repsol 181,786 1,879 0.02Telefonica 180,684 1,397 0.02Zardoya Otis 211,469 1,546 0.02
SWEDEN (0.71%) 49,981 0.67Alfa Laval 130,314 1,560 0.02Assa Abloy 138,366 2,146 0.03Atlas Copco 'A' Shares 53,607 1,225 0.02Atlas Copco 'B' Shares 35,442 734 0.01Boliden 110,271 1,981 0.03Electrolux 77,188 1,469 0.02Getinge 111,827 1,642 0.02Hennes & Mauritz 74,443 1,668 0.02Hexagon 58,417 1,936 0.03Husqvarna 320,731 2,112 0.03ICA 71,835 1,808 0.02Industrivarden 120,872 1,680 0.02Investor 60,606 1,679 0.02Kinnevik 96,544 1,861 0.03Lundin Petroleum 149,381 2,083 0.03Nordea Bank 237,970 1,767 0.02Sandvik 193,859 1,626 0.02Securitas 153,996 1,968 0.03Skandinaviska Enskilda Banken 206,477 1,559 0.02Skanska 114,036 2,028 0.03SKF 127,672 1,679 0.02Svenska Cellulosa 77,029 1,754 0.02Svenska Handelsbanken 166,454 1,723 0.02Swedbank 109,517 1,938 0.03Swedish Match 78,722 2,213 0.03Tele2 221,589 1,457 0.02Telefonaktiebolaget LM Ericsson 299,589 1,643 0.02Telia 415,717 1,418 0.02Volvo 187,853 1,624 0.02
SWITZERLAND (4.06%) 276,421 3.69ABB 1,457,495 24,959 0.33Actelion 13,749 1,823 0.03Adecco 36,415 1,547 0.02Aryzta 54,487 1,837 0.03Baloise 18,203 1,672 0.02Barry Callebaut 1,854 1,879 0.03Chocoladefabriken Lindt & Spruengli 17 880 0.01Chocoladefabriken Lindt & Spruengli PC 165 723 0.01Chubb 17,481 1,677 0.02Cie Financiere Richemont 38,085 1,770 0.02Clariant 2,012,893 26,311 0.35Coca-Cola HBC 113,910 2,017 0.03Credit Suisse 161,141 1,558 0.02Dufry 16,462 1,568 0.02EMS-Chemie 4,589 1,886 0.03Galenica 1,650 1,353 0.02Garmin 54,577 2,027 0.03Geberit 5,828 1,952 0.03Givaudan 1,371 2,132 0.03
35

Security Holdings
MarketValue£000
% ofNet
Assets
St. James's Place Global Equity Unit Trust
Portfolio Statement (continued)
as at 30 September 2016
Julius Baer 50,850 1,561 0.02Kuehne + Nagel International 15,984 1,775 0.02LafargeHolcim 49,081 2,015 0.03Lonza 12,987 1,889 0.02Nestle 357,141 21,687 0.29Novartis 559,361 33,701 0.45Pargesa 35,978 1,881 0.03Partners 5,269 2,026 0.03Roche 181,463 34,365 0.45Schindler 3,812 551 0.01Schindler Part Cert 8,259 1,184 0.02SGS 1,031 1,761 0.02Sika 534 1,973 0.03Sonova 17,011 1,834 0.02Swatch 6,999 298 -Swatch BR 5,730 1,236 0.02Swiss Life 8,709 1,699 0.02Swiss Prime Site 27,638 1,860 0.02Swiss Re 23,875 1,630 0.02Swisscom 4,363 1,585 0.02Syngenta 5,919 1,993 0.03TE Connectivity 956,793 46,742 0.62UBS 144,252 1,453 0.02Zurich Insurance 154,248 30,151 0.40
TAIWAN (2.06%) 171,036 2.37Acer 6,101,663 2,185 0.03Advanced Semiconductor Engineering 2,053,940 1,901 0.03Advantech 306,216 2,027 0.03Asia Cement 3,000,766 2,023 0.03Asia Pacific Telecom 7,661,779 1,961 0.03Asustek Computer 276,000 1,898 0.03AU Optronics 8,183,487 2,306 0.03Catcher Technology 301,000 1,885 0.03Cathay Financial 1,948,062 1,920 0.03Chang Hwa Commercial Bank 4,918,838 1,943 0.03Cheng Shin Rubber Industry 1,049,051 1,701 0.02Chicony Electronics 992,188 1,934 0.03China Airlines 7,665,438 1,764 0.02China Development Financial 9,081,000 1,788 0.02China Life Insurance 3,166,742 2,233 0.03China Steel 3,596,026 1,956 0.03Chunghwa Telecom 656,000 1,784 0.02Compal Electronics 3,962,765 1,887 0.03CTBC Financial 4,154,694 1,856 0.03Delta Electronics 510,630 2,099 0.03E.Sun Financial 4,478,261 1,967 0.03Eclat Textile 234,056 2,154 0.03Eva Airways 5,321,119 1,873 0.03Evergreen Marine Corporation Taiwan 6,441,492 1,918 0.03Far Eastern New Century 3,144,010 1,814 0.02Far EasTone Telecommunications 969,000 1,765 0.02Feng TAY Enterprise 592,630 2,027 0.03First Financial 4,999,339 2,048 0.03Formosa Chemicals & Fibre 891,770 1,850 0.02Formosa Petrochemical 801,000 1,857 0.02Formosa Plastics 917,160 1,756 0.02
36

Security Holdings
MarketValue£000
% ofNet
Assets
St. James's Place Global Equity Unit Trust
Portfolio Statement (continued)
as at 30 September 2016
Formosa Taffeta 2,576,000 1,883 0.03Foxconn Technology 987,185 2,230 0.03Fubon Financial 1,921,895 2,187 0.03Giant Manufacturing 390,214 2,122 0.03Hermes Microvision 65,088 2,162 0.03Highwealth Construction 1,503,360 1,793 0.02Hiwin Technologies 555,931 2,237 0.03Hon Hai Precision Industry 1,078,046 2,093 0.03Hotai Motor 238,890 2,152 0.03HTC 978,898 2,098 0.03Hua Nan Financial 4,849,967 1,916 0.03Innolux 7,291,487 1,893 0.03Inotera Memories 2,464,879 1,674 0.02Inventec 3,346,765 2,108 0.03Largan Precision 29,580 2,752 0.04Lite-On Technology 1,721,732 1,911 0.03MediaTek 343,070 2,022 0.03Mega Financial 3,089,636 1,677 0.02Merida Industry 547,015 1,992 0.03Nan Ya Plastics 1,211,211 1,848 0.02Nanya Technology 2,110,000 2,038 0.03Nien Made Enterprise 286,000 2,840 0.04Novatek Microelectronics 662,223 1,801 0.02OBI Pharma 163,000 1,566 0.02Pegatron 1,071,822 2,123 0.03Phison Electronics 287,633 1,685 0.02Pou Chen 1,868,000 2,027 0.03Powertech Technology 1,140,504 2,282 0.03President Chain Store 351,000 2,151 0.03Quanta Computer 1,273,214 2,049 0.03Realtek Semiconductor 847,328 2,148 0.03Ruentex Development 2,024,132 1,900 0.03Ruentex Industries 1,578,248 1,958 0.03Shin Kong Financial 11,013,045 1,867 0.02Siliconware Precision Industries 1,435,000 1,658 0.02Simplo Technology 670,500 1,700 0.02SinoPac Financial 8,120,192 1,848 0.03Standard Foods 1,041,640 2,058 0.03Synnex Technology International 2,469,697 2,109 0.03TaiMed Biologics 350,000 1,878 0.02Taishin Financial 7,041,361 2,019 0.03Taiwan Business Bank 9,426,666 1,849 0.03Taiwan Cement 2,329,549 2,044 0.03Taiwan Cooperative Financial 5,412,363 1,845 0.03Taiwan Fertilizer 1,761,229 1,820 0.03Taiwan Mobile 650,000 1,800 0.02Taiwan Semiconductor Manufacturing 540,000 2,425 0.03Teco Electric and Machinery 2,778,000 1,846 0.02Transcend Information 795,145 1,790 0.02Uni-President Enterprises 1,191,796 1,725 0.02United Microelectronics 6,101,663 1,727 0.02Vanguard International Semiconductor 1,339,000 1,931 0.03Wistron 3,713,002 2,129 0.03WPG 2,063,991 1,884 0.03Yuanta Financial 6,868,474 1,893 0.03Yulon Motor 2,644,491 1,793 0.02
37

Security Holdings
MarketValue£000
% ofNet
Assets
St. James's Place Global Equity Unit Trust
Portfolio Statement (continued)
as at 30 September 2016
THAILAND (1.35%) 107,921 1.42Advanced Info Service 490,900 1,749 0.02Airports of Thailand 1,983,829 17,578 0.23Bangkok Bank 222,400 805 0.01Bangkok Bank NVDR 280,000 1,013 0.01Bangkok Dusit Medical Services 3,423,048 1,684 0.02Bangkok Expressway & Metro 14,379,201 2,209 0.03Banpu 8,193,200 2,827 0.04Banpu Public Rights 13/10/2016 353,574 - -BEC World 3,465,500 1,690 0.02BTS 8,537,601 1,540 0.02Bumrungrad Hospital 441,200 1,714 0.02Central Pattana 1,536,000 1,975 0.03Charoen Pokphand Foods 2,778,800 1,887 0.03CP ALL 25,239,000 34,415 0.45Delta Electronics Thailand 884,700 1,561 0.02Electricity Generating 400,000 1,768 0.02Energy Absolute 3,449,800 1,958 0.03Glow Energy 925,958 1,644 0.02Home Product Center 10,106,229 2,227 0.03Indorama Ventures 2,817,200 1,756 0.02IRPC 17,100,500 1,858 0.03Kasikornbank 'A' Shares 546,300 2,280 0.03Krung Thai Bank 4,653,405 1,823 0.02Minor International 2,141,955 1,800 0.02PTT 235,914 1,723 0.02PTT Exploration & Production 1,160,370 2,092 0.03PTT Global Chemical 1,274,296 1,567 0.02Robinson Department Store 1,350,000 1,796 0.02Siam Cement 228,711 2,637 0.04Siam Commercial Bank 549,600 1,792 0.02Thai Oil 1,286,000 1,961 0.03Thai Union 4,009,000 1,910 0.03TMB Bank 32,016,010 1,511 0.02True 7,565,622 1,171 0.02
TURKEY (0.55%) 39,261 0.50Akbank 844,589 1,733 0.02Anadolu Efes Biracilik Ve Malt Sanayii 336,184 1,572 0.02Arcelik 348,106 1,892 0.02BIM Birlesik Magazalar 110,842 1,428 0.02Coca-Cola Icecek 184,946 1,745 0.02Emlak Konut Gayrimenkul Yatirim Ortakligi# 2,391,423 1,842 0.03Eregli Demir ve Celik Fabrikalari 1,573,153 1,681 0.02Ford Otomotiv Sanayi 188,511 1,526 0.02Haci Omer Sabanci 754,838 1,793 0.02KOC 512,576 1,695 0.02Petkim Petrokimya 1,634,396 1,868 0.03TAV Havalimanlari 421,471 1,333 0.02Tofas Turk Otomobil Fabrikasi 287,856 1,598 0.02Tupras Turkiye Petrol Rafinerileri 100,625 1,474 0.02Turk Hava Yollari 1,047,927 1,381 0.02Turk Sise ve Cam Fabrikalari 1,924,588 1,572 0.02Turk Telekomunikasyon 1,077,719 1,572 0.02Turkcell Iletisim Hizmetleri 595,674 1,488 0.02Turkiye Garanti Bankasi 862,429 1,756 0.02Turkiye Halk Bankasi 702,754 1,630 0.02
38

Security Holdings
MarketValue£000
% ofNet
Assets
St. James's Place Global Equity Unit Trust
Portfolio Statement (continued)
as at 30 September 2016
Turkiye Is Bankasi 1,460,533 1,782 0.02Ulker Biskuvi Sanayi 301,691 1,647 0.02VakıfBank 1,369,694 1,604 0.02Yapi ve Kredi Bankasi 1,764,067 1,649 0.02
UNITED ARAB EMIRATES (0.27%) 20,777 0.28Abu Dhabi Commercial Bank 1,386,732 1,858 0.02Aldar Properties 3,423,650 1,920 0.03Arabtec 6,138,867 1,895 0.02DP World 116,262 1,691 0.02Dubai Financial Market 6,634,869 1,825 0.02Dubai Islamic Bank 1,660,976 1,887 0.03Emaar Malls 3,268,131 1,867 0.03Emaar Properties 1,353,524 2,018 0.03Emirates Telecommunications 486,178 2,037 0.03First Gulf Bank 734,648 1,813 0.02National Bank of Abu Dhabi 1,019,505 1,966 0.03
UNITED KINGDOM (9.26%) 635,907 8.393i 274,487 1,758 0.02Aberdeen Asset Management 517,631 1,664 0.02Admiral 78,751 1,622 0.02Aggreko 131,802 1,257 0.02Anglo American 243,542 2,367 0.03Antofagasta 341,344 1,775 0.02Aon 20,824 1,782 0.02Ashtead 154,838 1,918 0.03ASOS 566,000 27,174 0.36Associated British Foods 51,115 1,309 0.02AstraZeneca 39,627 1,969 0.03Auto Trader 374,522 1,506 0.02Aviva 318,732 1,377 0.02Babcock International 138,444 1,412 0.02BAE Systems 3,764,994 19,540 0.26Barclays 818,167 1,325 0.02Barratt Developments 267,098 1,260 0.02Berkeley 48,000 1,187 0.02BHP Billiton 192,422 2,236 0.03BP 404,467 1,816 0.02British American Tobacco 233,215 11,524 0.15British Land# 192,559 1,203 0.02BT 337,756 1,292 0.02Bunzl 77,458 1,752 0.02Burberry 139,083 1,912 0.03Capita 138,066 915 0.01Carnival 44,044 1,637 0.02Centrica 789,858 1,802 0.02Cobham 1,377,307 2,296 0.03Coca-Cola European Partners 44,112 1,328 0.02Compass 117,089 1,738 0.02Croda International 52,277 1,801 0.02Daily Mail & General Trust 1,285,096 9,510 0.13Diageo 1,005,598 22,259 0.29Direct Line Insurance 408,119 1,484 0.02Dixons Carphone 340,317 1,235 0.02easyJet 94,005 949 0.01Fresnillo 123,417 2,273 0.03G4S 10,076,215 22,833 0.30
39

Security Holdings
MarketValue£000
% ofNet
Assets
St. James's Place Global Equity Unit Trust
Portfolio Statement (continued)
as at 30 September 2016
GKN 552,064 1,757 0.02GlaxoSmithKline 2,310,480 37,788 0.50Hammerson# 285,275 1,645 0.02Hargreaves Lansdown 112,552 1,407 0.02Hikma Pharmaceuticals 79,002 1,591 0.02HSBC 6,506,000 37,136 0.49ICAP 355,734 1,643 0.02IMI 159,616 1,686 0.02Imperial Tobacco 533,335 21,109 0.28Inmarsat 203,290 1,404 0.02InterContinental Hotels 57,322 1,802 0.02Intertek 48,536 1,680 0.02Intu Properties# 499,640 1,456 0.02Investec 305,758 1,426 0.02ITV 694,139 1,278 0.02J Sainsbury 711,887 1,714 0.02Johnson Matthey 53,166 1,729 0.02Kingfisher 420,294 1,567 0.02Land Securities# 121,135 1,257 0.02Legal & General 630,667 1,360 0.02Liberty Global 'A' Shares 19,444 492 0.01Liberty Global 'C' Shares 42,459 1,043 0.01Liberty Global Lilac 'A' Shares 2,426 52 -Liberty Global Lilac 'C' Shares 5,297 115 -Lloyds Banking 2,087,166 1,128 0.02London Stock Exchange 58,013 1,609 0.02Marks & Spencer 378,179 1,199 0.02Mediclinic International 186,299 1,720 0.02Meggitt 389,677 1,739 0.02Merlin Entertainments 370,000 1,600 0.02Mondi 105,144 1,701 0.02National Grid 158,895 1,743 0.02Next 27,791 1,314 0.02Nielsen 41,983 1,732 0.02Old Mutual 850,477 1,694 0.02Pearson 990,503 7,379 0.10Persimmon 71,484 1,244 0.02Provident Financial 109,138 3,240 0.04Prudential 101,770 1,381 0.02Reckitt Benckiser 24,180 1,748 0.02RELX 129,274 1,886 0.03Rio Tinto 76,189 1,972 0.03Rolls-Royce 3,208,151 22,858 0.30Royal Bank of Scotland 590,018 1,026 0.01Royal Dutch Shell 'A' Shares (GBP) 52,539 1,004 0.01Royal Dutch Shell 'A' Shares (EUR) 1,473,965 28,214 0.37Royal Dutch Shell 'B' Shares 42,070 844 0.01Royal Mail 306,609 1,482 0.02RSA Insurance 312,981 1,709 0.02SABMiller 37,174 1,671 0.02Sage 267,576 1,955 0.03Schroders 55,613 1,475 0.02Segro# 392,307 1,738 0.02Severn Trent 69,026 1,724 0.02Sky 157,667 1,409 0.02Smith & Nephew 128,004 1,586 0.02Smiths 135,954 1,975 0.03
40
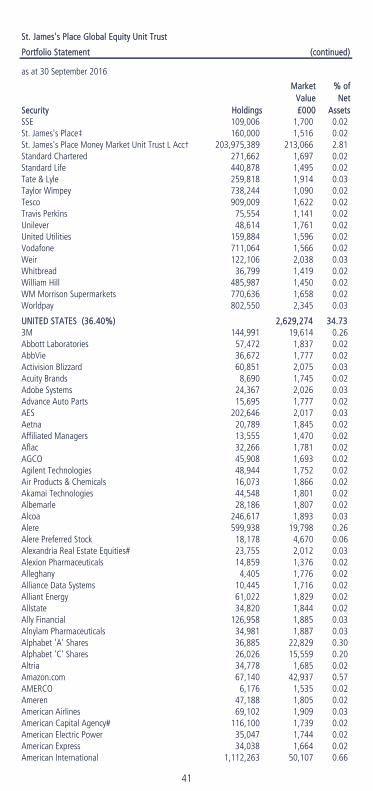
Security Holdings
MarketValue£000
% ofNet
Assets
St. James's Place Global Equity Unit Trust
Portfolio Statement (continued)
as at 30 September 2016
SSE 109,006 1,700 0.02St. James's Place‡ 160,000 1,516 0.02St. James's Place Money Market Unit Trust L Acc† 203,975,389 213,066 2.81Standard Chartered 271,662 1,697 0.02Standard Life 440,878 1,495 0.02Tate & Lyle 259,818 1,914 0.03Taylor Wimpey 738,244 1,090 0.02Tesco 909,009 1,622 0.02Travis Perkins 75,554 1,141 0.02Unilever 48,614 1,761 0.02United Utilities 159,884 1,596 0.02Vodafone 711,064 1,566 0.02Weir 122,106 2,038 0.03Whitbread 36,799 1,419 0.02William Hill 485,987 1,450 0.02WM Morrison Supermarkets 770,636 1,658 0.02Worldpay 802,550 2,345 0.03
UNITED STATES (36.40%) 2,629,274 34.733M 144,991 19,614 0.26Abbott Laboratories 57,472 1,837 0.02AbbVie 36,672 1,777 0.02Activision Blizzard 60,851 2,075 0.03Acuity Brands 8,690 1,745 0.02Adobe Systems 24,367 2,026 0.03Advance Auto Parts 15,695 1,777 0.02AES 202,646 2,017 0.03Aetna 20,789 1,845 0.02Affiliated Managers 13,555 1,470 0.02Aflac 32,266 1,781 0.02AGCO 45,908 1,693 0.02Agilent Technologies 48,944 1,752 0.02Air Products & Chemicals 16,073 1,866 0.02Akamai Technologies 44,548 1,801 0.02Albemarle 28,186 1,807 0.02Alcoa 246,617 1,893 0.03Alere 599,938 19,798 0.26Alere Preferred Stock 18,178 4,670 0.06Alexandria Real Estate Equities# 23,755 2,012 0.03Alexion Pharmaceuticals 14,859 1,376 0.02Alleghany 4,405 1,776 0.02Alliance Data Systems 10,445 1,716 0.02Alliant Energy 61,022 1,829 0.02Allstate 34,820 1,844 0.02Ally Financial 126,958 1,885 0.03Alnylam Pharmaceuticals 34,981 1,887 0.03Alphabet 'A' Shares 36,885 22,829 0.30Alphabet 'C' Shares 26,026 15,559 0.20Altria 34,778 1,685 0.02Amazon.com 67,140 42,937 0.57AMERCO 6,176 1,535 0.02Ameren 47,188 1,805 0.02American Airlines 69,102 1,909 0.03American Capital Agency# 116,100 1,739 0.02American Electric Power 35,047 1,744 0.02American Express 34,038 1,664 0.02American International 1,112,263 50,107 0.66
41

Security Holdings
MarketValue£000
% ofNet
Assets
St. James's Place Global Equity Unit Trust
Portfolio Statement (continued)
as at 30 September 2016
American Tower# 22,585 1,977 0.03American Water Works 30,336 1,755 0.02Ameriprise Financial 22,924 1,722 0.02AmerisourceBergen 28,314 1,775 0.02AMETEK 46,381 1,689 0.02Amgen 15,469 1,974 0.03Amphenol 38,554 1,923 0.03Anadarko Petroleum 47,496 2,293 0.03Analog Devices 38,664 1,901 0.03Annaly Capital Management# 208,148 1,678 0.02ANSYS 24,227 1,700 0.02Antero Resources 79,621 1,605 0.02Anthem 363,083 34,993 0.46AO Smith 26,817 2,025 0.03Apache 38,388 1,887 0.03Apple 22,315 1,931 0.03Applied Materials 93,957 2,143 0.03Aramark 67,932 1,986 0.03Archer-Daniels-Midland 52,331 1,676 0.02Arista Networks 223,465 14,685 0.19Arrow Electronics 35,191 1,721 0.02Arthur J Gallagher 49,422 1,919 0.03Ashland Global 19,564 1,763 0.02Assurant 26,186 1,847 0.03AT&T 57,562 1,809 0.02Atmos Energy 31,000 1,791 0.02Autodesk 36,375 2,009 0.03Autoliv 17,933 1,441 0.02Automatic Data Processing 25,299 1,702 0.02AutoNation 44,891 1,636 0.02AutoZone 2,875 1,698 0.02AvalonBay Communities# 14,027 1,942 0.03Avery Dennison 29,676 1,764 0.02Avnet 55,423 1,735 0.02B/E Aerospace 48,387 1,902 0.03Baker Hughes 48,804 1,889 0.03Ball 45,408 2,833 0.04Bank of America 151,267 1,768 0.02Bank of New York Mellon 58,796 1,771 0.02Baxter International 51,568 1,866 0.03BB&T 64,242 1,847 0.02Becton Dickinson 13,312 1,812 0.02Bed Bath & Beyond 49,900 1,624 0.02Berkshire Hathaway 'A' Shares 132 21,923 0.29Berkshire Hathaway 'B' Shares 115,267 12,761 0.17Best Buy 69,199 1,997 0.03Biogen 113,948 26,876 0.35BioMarin Pharmaceutical 346,031 24,763 0.33BlackRock 6,283 1,731 0.02Boeing 17,251 1,744 0.02BorgWarner 66,004 1,746 0.02Boston Properties# 19,087 2,007 0.03Boston Scientific 99,287 1,784 0.02Bristol-Myers Squibb 33,054 1,373 0.02Brixmor Property# 99,982 2,171 0.03Broadridge Financial Solutions 40,794 2,120 0.03Brown-Forman 46,050 1,673 0.02
42

Security Holdings
MarketValue£000
% ofNet
Assets
St. James's Place Global Equity Unit Trust
Portfolio Statement (continued)
as at 30 September 2016
CA 69,950 1,771 0.02Cabot Oil & Gas 92,665 1,820 0.02Cadence Design Systems 100,857 1,962 0.03Calpine 148,657 1,463 0.02Camden Property Trust# 26,255 1,718 0.02Campbell Soup 36,653 1,538 0.02Capital One Financial 30,340 1,647 0.02Cardinal Health 28,972 1,719 0.02CarMax 41,036 1,651 0.02Carpenter Technology 797,398 25,133 0.33Caterpillar 32,398 2,186 0.03CBRE 84,558 1,803 0.02CBS 44,356 1,867 0.03CDK Global 40,426 1,778 0.02CDW 52,967 1,850 0.03Celanese 31,410 1,590 0.02Celgene 20,794 1,648 0.02Centene 36,946 1,928 0.03CenterPoint Energy 100,498 1,827 0.02CenturyLink 82,326 1,747 0.02Cerner 351,510 16,684 0.22CF Industries 75,306 1,405 0.02CH Robinson Worldwide 29,716 1,612 0.02Charles Schwab 1,406,553 33,288 0.44Charter Communications 11,064 2,319 0.03Cheniere Energy 66,063 2,209 0.03Chevron 21,844 1,706 0.02Chipotle Mexican Grill 51,853 16,830 0.22Church & Dwight 45,670 1,676 0.02Cigna 17,524 1,768 0.02Cimarex Energy 20,142 2,031 0.03Cincinnati Financial 32,358 1,861 0.03Cintas 24,455 2,101 0.03Cisco Systems 1,507,882 36,512 0.48CIT 65,576 1,808 0.02Citigroup 47,359 1,673 0.02Citizens Financial 93,838 1,742 0.02Citrix Systems 29,159 1,911 0.03Clorox 17,964 1,728 0.02CME 23,313 1,883 0.03CMS Energy 54,313 1,773 0.02Coach 56,265 1,571 0.02Coca-Cola 51,701 1,676 0.02Cognizant Technology Solutions 34,713 1,473 0.02Colgate-Palmolive 33,549 1,897 0.02Comcast 'A' Shares 36,571 1,869 0.03Comerica 48,917 1,760 0.02ConAgra Foods 53,953 1,925 0.03Concho Resources 20,449 2,108 0.03ConocoPhillips 285,392 9,607 0.13Consolidated Edison 30,966 1,828 0.03Constellation Brands 14,168 1,789 0.02Continental Resources 53,412 2,101 0.03Cooper 13,504 1,834 0.02Corning 110,568 2,006 0.03Costco Wholesale 15,380 1,750 0.02Coty 17,182 328 -
43

Security Holdings
MarketValue£000
% ofNet
Assets
St. James's Place Global Equity Unit Trust
Portfolio Statement (continued)
as at 30 September 2016
CR Bard 10,097 1,742 0.02Crown 43,127 1,885 0.03Crown Castle International# 25,847 1,874 0.03CSX 87,081 2,015 0.03Cummins 19,643 1,883 0.02CVS Health 24,830 1,715 0.02Danaher 23,228 1,382 0.02Darden Restaurants 33,555 1,569 0.02DaVita 29,613 1,495 0.02Deere 29,365 1,899 0.03Dell Technologies 'V' Shares 8,906 327 -Delta Air Lines 51,104 1,538 0.02DENTSPLY SIRONA 35,989 1,641 0.02Devon Energy 61,005 2,025 0.03Dick's Sporting Goods 51,352 2,240 0.03Digi International 305,572 2,725 0.04Digital Realty Trust# 26,483 2,002 0.03Discover Financial Services 39,460 1,705 0.02Discovery Communications 'A' Shares 32,474 671 0.01Discovery Communications 'C' Shares 53,445 1,076 0.01DISH Network 46,497 1,974 0.03Dollar General 26,424 1,413 0.02Dollar Tree 30,229 1,804 0.02Dominion Resources 33,221 1,915 0.03Domino's Pizza 18,728 2,192 0.03Dover 35,399 1,962 0.03Dow Chemical 41,996 1,676 0.02DR Horton 77,989 1,813 0.02Dr Pepper Snapple 25,064 1,754 0.02DTE Energy 25,065 1,799 0.02Duke Energy 28,889 1,789 0.02Duke Realty# 95,409 2,025 0.03Dun & Bradstreet 17,657 1,835 0.03E*TRADE Financial 80,574 1,766 0.02Eastman Chemical 700,624 35,876 0.47Eaton Vance 62,033 1,831 0.02eBay 92,491 2,304 0.03Ecolab 18,725 1,744 0.02Edgewell Personal Care 27,439 1,651 0.02Edison International 31,862 1,787 0.02Edwards Lifesciences 359,250 33,050 0.44EI du Pont de Nemours 33,250 1,703 0.02Electronic Arts 29,664 1,928 0.03Eli Lilly 29,823 1,834 0.03Emerson Electric 544,459 22,264 0.29Entergy 29,863 1,781 0.02Envision Healthcare 90,810 1,533 0.02EOG Resources 26,330 1,930 0.03EQT 31,087 1,667 0.02Equifax 17,800 1,830 0.03Equinix# 6,214 1,725 0.02Equity Residential# 32,293 1,605 0.02Essex Property Trust# 9,839 1,713 0.02Estee Lauder 26,198 1,755 0.02Eversource Energy 44,260 1,867 0.03Exelon 65,615 1,685 0.02Expedia 19,671 1,796 0.02
44

Security Holdings
MarketValue£000
% ofNet
Assets
St. James's Place Global Equity Unit Trust
Portfolio Statement (continued)
as at 30 September 2016
Expeditors International of Washington 45,536 1,803 0.02Express Scripts 31,598 1,702 0.02Extra Space Storage# 24,095 1,504 0.02Exxon Mobil 24,629 1,643 0.02F5 Networks 21,803 2,075 0.03Facebook 574,857 56,792 0.75Fastenal 48,390 1,524 0.02Federal Realty Investment Trust# 15,374 1,842 0.02FedEx 13,871 1,874 0.03Fidelity National Information Services 30,171 1,788 0.02Fifth Third Bancorp 118,120 1,844 0.03First Republic Bank 32,636 1,934 0.03FirstEnergy 72,047 1,843 0.03Fiserv 21,377 1,644 0.02FleetCor Technologies 14,489 1,930 0.03FLIR Systems 74,304 1,795 0.02Flowserve 963,560 35,172 0.46Fluor 42,119 1,647 0.02FMC 45,949 1,710 0.02FMC Technologies 81,459 1,854 0.02FNF 62,636 1,780 0.02Foot Locker 40,537 2,089 0.03Ford Motor 160,160 1,479 0.02Fortinet 67,000 1,856 0.03Fortive 11,614 454 0.01Fortune Brands Home & Security 40,545 1,811 0.02Franklin Resources 59,297 1,589 0.02Freeport-McMoRan 244,851 2,019 0.03Frontier Communications 457,500 1,496 0.02Gap 121,610 2,036 0.03Gartner 21,897 1,488 0.02Generac 1,382,017 37,835 0.50General Dynamics 15,404 1,849 0.03General Electric 561,516 12,791 0.17General Growth Properties# 83,291 1,771 0.02General Mills 35,648 1,751 0.02General Motors 73,238 1,778 0.02Genuine Parts 23,087 1,773 0.02Gilead Sciences 25,697 1,543 0.02Global Payments 29,151 1,711 0.02Goldman Sachs 13,812 1,694 0.02Goldman Sachs Deposit 6,147,000 4,742 0.06Goodyear Tire & Rubber 80,574 1,972 0.03H&R Block 108,282 1,893 0.03Halliburton 56,492 1,925 0.03Hanesbrands 82,152 1,594 0.02Harley-Davidson 49,149 1,990 0.03Harman International Industries 28,829 1,849 0.03Harris 27,189 1,900 0.03Hartford Financial Services 49,054 1,602 0.02Hasbro 25,623 1,569 0.02HCA 28,599 1,660 0.02HCP# 65,749 1,954 0.03Helmerich & Payne 38,320 1,929 0.03Henry Schein 12,960 1,611 0.02Hershey 24,569 1,794 0.02Hess 37,592 1,512 0.02
45

Security Holdings
MarketValue£000
% ofNet
Assets
St. James's Place Global Equity Unit Trust
Portfolio Statement (continued)
as at 30 September 2016
Hewlett Packard Enterprise 128,128 2,262 0.03Hilton Worldwide 106,060 1,865 0.03HollyFrontier 81,489 1,484 0.02Hologic 66,142 1,947 0.03Home Depot 16,780 1,656 0.02Honeywell International 19,378 1,737 0.02Hormel Foods 62,864 1,837 0.03Host Hotels & Resorts# 142,438 1,718 0.02HP 182,215 2,162 0.03Humana 13,311 1,805 0.02Huntington Bancshares 289,937 2,172 0.03IDEXX Laboratories 24,854 2,144 0.03Illinois Tool Works 247,143 22,694 0.30Illumina 218,486 29,756 0.39IMS Health 92,907 2,176 0.03Incyte 26,732 1,903 0.03Ingredion 21,248 2,158 0.03Intel 70,820 2,039 0.03Intercontinental Exchange 8,757 1,812 0.02International Business Machines 193,055 23,549 0.31International Flavors & Fragrances 17,042 1,866 0.03International Paper 53,592 1,956 0.03Interpublic 97,595 1,663 0.02Intuitive Surgical 3,457 1,919 0.03inVentiv Health 21,857 1,843 0.03Iron Mountain# 60,822 1,771 0.02Jacobs Engineering 44,443 1,781 0.02JB Hunt Transport Services 28,857 1,789 0.02JM Smucker 18,354 1,908 0.03Johnson & Johnson 401,635 36,336 0.48Jones Lang LaSalle 20,560 1,771 0.02JPMorgan Chase 858,461 43,468 0.57Juniper Networks 96,402 1,763 0.02Kansas City Southern 299,524 21,405 0.28Kellogg 29,739 1,772 0.02KeyCorp 222,140 2,063 0.03Kimberly-Clark 18,510 1,788 0.02Kimco Realty# 85,957 1,943 0.03Kinder Morgan 124,609 2,188 0.03KLA-Tencor 33,731 1,789 0.02Kohl's 61,940 2,045 0.03Kraft Heinz 26,380 1,802 0.02Kroger 60,392 1,374 0.02L Brands 33,606 1,810 0.02L-3 Communications 16,131 1,876 0.03Laboratory Corp of America 17,421 1,820 0.02Lam Research 29,004 2,086 0.03Las Vegas Sands 589,829 25,907 0.34Lear 17,901 1,640 0.02Leggett & Platt 47,942 1,690 0.02Lennar 48,697 1,585 0.02Leucadia National 124,472 1,799 0.02Liberty Braves 2,838 37 -Liberty Broadband 34,405 1,906 0.03Liberty Interactive 83,117 1,272 0.02Liberty Mutual 45,315 1,623 0.02Liberty Property Trust# 60,507 1,894 0.02
46

Security Holdings
MarketValue£000
% ofNet
Assets
St. James's Place Global Equity Unit Trust
Portfolio Statement (continued)
as at 30 September 2016
Liberty SiriusXM 'A' Shares 23,558 610 0.01Liberty SiriusXM 'C' Shares 48,046 1,219 0.02Lincoln National 49,347 1,746 0.02Linear Technology 49,410 2,253 0.03LinkedIn 14,120 2,078 0.03Live Nation Entertainment 1,722,120 36,532 0.48LKQ 67,508 1,835 0.03Lockheed Martin 88,631 16,569 0.22Loews 58,496 1,840 0.03Lowe's 28,967 1,609 0.02Lululemon Athletica 35,202 1,656 0.02M&T Bank 20,334 1,796 0.02Macerich# 29,049 1,804 0.02Macy's 69,885 1,943 0.03Manpower 28,026 1,523 0.02Marathon Oil 164,182 2,012 0.03Marathon Petroleum 62,305 1,909 0.03Markel 2,302 1,628 0.02Marriott International 56,758 2,938 0.04Marsh & McLennan 33,867 1,735 0.02Martin Marietta Materials 11,509 1,620 0.02Masco 74,255 1,960 0.03Mastercard 22,759 1,766 0.02Mattel 70,349 1,669 0.02Maxim Integrated Products 57,896 1,763 0.02McCormick 22,984 1,727 0.02McDonald's 19,616 1,737 0.02McKesson 12,314 1,562 0.02Mead Johnson Nutrition 27,621 1,667 0.02Medidata Solutions 369,000 15,593 0.21MEDNAX 33,000 1,678 0.02Merck (US Listing) 39,297 1,877 0.03MetLife 48,559 1,635 0.02Mettler-Toledo International 6,100 1,917 0.03MGM Resorts International 97,637 1,946 0.03Microchip Technology 47,464 2,268 0.03Micron Technology 191,640 2,591 0.03Microsoft 41,323 1,829 0.03Mid-America Apartment Communities# 21,967 1,629 0.02Mohawk Industries 11,642 1,785 0.02Molson Coors Brewing 24,210 2,025 0.03Mondelez International 50,972 1,696 0.02Monsanto 377,905 29,673 0.39Monster Beverage 14,723 1,651 0.02Moody's 22,686 1,885 0.03Morgan Stanley 80,546 1,928 0.03Mosaic 83,919 1,570 0.02Motorola Solutions 32,508 1,936 0.03MSCI 30,000 1,932 0.03Murphy Oil 75,812 1,774 0.02NASDAQ OMX 33,939 1,767 0.02National Oilwell Varco 68,045 1,934 0.03Navient 166,769 1,841 0.03NetApp 87,109 2,334 0.03Netflix 22,186 1,654 0.02NetSuite 24,324 2,061 0.03New York Community Bancorp 145,641 1,584 0.02
47

Security Holdings
MarketValue£000
% ofNet
Assets
St. James's Place Global Equity Unit Trust
Portfolio Statement (continued)
as at 30 September 2016
Newell Rubbermaid 50,162 2,012 0.03Newfield Exploration 64,277 2,121 0.03Newmont Mining 68,654 2,068 0.03News 'A' Shares 184,790 1,979 0.03NextEra Energy 18,665 1,781 0.02NIKE 608,930 24,506 0.32NiSource 104,978 1,961 0.03Noble Energy 64,607 1,771 0.02Nordstrom 58,194 2,311 0.03Norfolk Southern 26,684 1,959 0.03Northern Trust 29,850 1,536 0.02Northrop Grumman 10,372 1,709 0.02NRG Energy 140,254 1,201 0.02Nuance Communications 133,515 1,480 0.02Nucor 45,940 1,731 0.02NVIDIA 49,215 2,559 0.03Occidental Petroleum 30,916 1,720 0.02OGE Energy 73,343 1,817 0.02Omnicom 30,484 1,976 0.03ONEOK 51,614 2,028 0.03Oracle 52,940 1,598 0.02O'Reilly Automotive 8,382 1,803 0.02PACCAR 40,621 1,814 0.02Packaging Corp of America 34,430 2,117 0.03Palo Alto Networks 15,259 1,837 0.02Parker Hannifin 20,814 1,991 0.03Patterson 53,517 1,876 0.03Paychex 41,376 1,824 0.02PayPal 57,354 1,786 0.02Pegasystems 331,938 7,551 0.10People's United Financial 153,606 1,851 0.02PepsiCo 22,277 1,852 0.03Pfizer 70,120 1,802 0.02PG&E 38,033 1,812 0.02Philip Morris International 133,751 10,085 0.13Phillips 66 27,743 1,696 0.02Pinnacle West Capital 30,888 1,829 0.02Pioneer Natural Resources 13,682 1,956 0.03Plains GP 240,327 2,391 0.03PNC Financial Services 24,923 1,711 0.02Polaris Industries 25,804 1,502 0.02PPG Industries 22,166 1,745 0.02PPL 58,501 1,571 0.02Praxair 19,522 1,789 0.02Priceline 41,208 46,823 0.62Principal Financial 50,057 1,950 0.03Procter & Gamble 24,921 1,696 0.02Progressive 70,200 1,692 0.02ProLogis# 47,208 1,959 0.03Prudential Financial 29,980 1,849 0.03Public Service Enterprise 50,766 1,649 0.02Public Storage# 9,426 1,636 0.02Pulte 120,486 1,841 0.02PVH 24,209 1,992 0.03Qorvo 41,344 1,712 0.02QUALCOMM 39,711 2,067 0.03Quest Diagnostics 28,732 1,851 0.03
48

Security Holdings
MarketValue£000
% ofNet
Assets
St. James's Place Global Equity Unit Trust
Portfolio Statement (continued)
as at 30 September 2016
Quintiles Transnational 32,414 1,977 0.03Ralph Lauren 23,667 1,819 0.02Range Resources 59,520 1,725 0.02Raymond James Financial 44,222 1,933 0.03Raytheon 17,741 1,869 0.03Realogy 1,808,368 35,795 0.47Realty Income# 37,437 1,952 0.03Red Hat 31,139 1,925 0.03Regency Centers# 29,124 1,749 0.02Regeneron Pharmaceuticals 93,635 29,351 0.39Regions Financial 221,298 1,651 0.02Republic Services 46,458 1,794 0.02ResMed 38,016 1,883 0.03Rexnord 1,967,145 31,988 0.42Reynolds American 48,013 1,745 0.02Rite Aid 284,486 1,661 0.02Robert Half International 54,606 1,559 0.02Rockwell Automation 19,556 1,767 0.02Rockwell Collins 23,846 1,549 0.02Roper Industries 12,770 1,786 0.02Ross Stores 42,765 2,090 0.03S&P Global 19,982 1,927 0.03Sabre 79,083 1,719 0.02Salesforce.com 27,886 1,531 0.02SBA Communications 23,940 2,061 0.03SCANA 32,448 1,820 0.02Scripps Networks Interactive 39,794 1,963 0.03Sealed Air 51,457 1,815 0.02SEI Investments 47,071 1,638 0.02Sempra Energy 22,453 1,852 0.03Service Corp International 1,451,192 29,441 0.39ServiceNow 31,416 1,902 0.03Sherwin-Williams 8,113 1,735 0.02Signature Bank/New York 17,215 1,557 0.02Simon Property# 11,973 1,917 0.03Sirius XM 555,756 1,775 0.02Skyworks Solutions 33,545 1,896 0.02SL Green Realty# 22,144 1,843 0.03Snap-on 13,248 1,525 0.02Southern 46,306 1,859 0.02Southern Copper 82,186 1,676 0.02Southwest Airlines 52,270 1,538 0.02Southwestern Energy 209,309 2,130 0.03Spectra Energy 70,260 2,292 0.03Splunk 44,057 1,962 0.03Sprint 647,966 3,324 0.04St Jude Medical 28,706 1,749 0.02Stanley Black & Decker 19,423 1,824 0.03Staples 259,699 1,671 0.02Starbucks 40,309 1,662 0.02State Street 35,023 1,853 0.03Stericycle 22,807 1,416 0.02Stryker 19,872 1,774 0.02SunTrust Banks 51,641 1,718 0.02Symantec 128,871 2,486 0.03Synchrony Financial 78,633 1,660 0.02Synopsys 45,270 2,063 0.03
49

Security Holdings
MarketValue£000
% ofNet
Assets
St. James's Place Global Equity Unit Trust
Portfolio Statement (continued)
as at 30 September 2016
Sysco 45,751 1,730 0.02T Rowe Price 29,697 1,501 0.02Target 30,683 1,603 0.02TD Ameritrade 73,881 1,965 0.03Team 389,743 9,756 0.13TEGNA 98,713 1,640 0.02Tesla Motors 12,161 1,883 0.03Tesoro 28,232 1,689 0.02Texas Instruments 38,751 2,087 0.03Textron 57,801 1,761 0.02Thermo Fisher Scientific 14,873 1,791 0.02Tiffany 34,795 1,915 0.03Time Warner 30,303 1,838 0.03TJX 31,784 1,811 0.02T-Mobile US 52,778 1,891 0.03Toll Brothers 76,419 1,743 0.02Torchmark 36,834 1,797 0.02Total System Services 40,501 1,460 0.02Tractor Supply 24,635 1,297 0.02TransDigm 8,793 1,946 0.03Travelers 19,185 1,685 0.02Trimble Navigation 98,177 2,129 0.03TripAdvisor 35,344 1,717 0.02Twenty-First Century Fox 'A' Shares 57,604 1,068 0.02Twenty-First Century Fox 'B' Shares 27,229 517 0.01Twitter 154,270 2,737 0.04Tyson Foods 34,317 1,981 0.03Ubiquiti Networks 1,005,761 41,764 0.55UDR# 61,435 1,726 0.02UGI 58,209 2,057 0.03Ulta Salon Cosmetics & Fragrance 10,512 1,923 0.03Under Armour 'A' Shares 211,874 6,309 0.08Under Armour 'C' Shares 213,905 5,559 0.07Union Pacific 572,949 42,407 0.56United Continental 49,258 1,943 0.03United Parcel Service 21,680 1,810 0.02United Rentals 32,648 1,922 0.03United Technologies 23,025 1,795 0.02United Therapeutics 18,876 1,675 0.02UnitedHealth 16,662 1,778 0.02Universal Health Services 16,371 1,543 0.02Unum 61,100 1,635 0.02US Bankcorp 58,031 1,902 0.03Valero Energy 40,700 1,623 0.02Valspar 21,004 1,720 0.02Vantiv 40,932 1,768 0.02Varian Medical Systems 27,662 2,103 0.03Ventas# 33,677 1,868 0.03Vereit# 268,490 2,121 0.03VeriSign 28,525 1,721 0.02Verisk Analytics 30,434 1,903 0.03Verizon Communications 992,894 39,920 0.53Vertex Pharmaceuticals 24,822 1,627 0.02VF 35,769 1,528 0.02Viacom 52,942 1,543 0.02Visa 821,096 51,894 0.68VMware 37,146 2,093 0.03
50

Security Holdings
MarketValue£000
% ofNet
Assets
St. James's Place Global Equity Unit Trust
Portfolio Statement (continued)
as at 30 September 2016
Vornado Realty Trust# 23,626 1,851 0.03Voya Financial 76,017 1,660 0.02Vulcan Materials 18,514 1,641 0.02WABCO 587,498 50,382 0.66Wabtec 419,716 25,555 0.34Walgreens Boots Alliance 30,629 1,871 0.03Wal-Mart Stores 31,541 1,721 0.02Walt Disney 25,088 1,777 0.02Waste Management 36,659 1,788 0.02Waters 16,877 2,035 0.03WEC Energy 37,839 1,762 0.02Wells Fargo 2,099,165 71,848 0.95Welltower# 32,401 1,895 0.02WESCO International 1,192,070 55,946 0.74Westar Energy 42,579 1,863 0.03Western Digital 50,352 2,263 0.03Western Union 119,115 1,882 0.03WestRock 56,422 2,058 0.03Weyerhaeuser# 79,986 1,966 0.03Whirlpool 13,542 1,675 0.02WhiteWave Foods 49,877 2,091 0.03Whole Foods Market 1,220,340 26,368 0.35Williams 104,613 2,452 0.03Workday 563,707 39,292 0.52WR Berkley 40,232 1,785 0.02WR Grace 28,398 1,607 0.02WW Grainger 9,933 1,688 0.02Wyndham Worldwide 32,924 1,703 0.02Wynn Resorts 23,001 1,785 0.02Xcel Energy 55,066 1,776 0.02Xerox 233,511 1,834 0.03Xilinx 45,536 1,879 0.03Xylem 49,710 1,987 0.03Yahoo! 68,014 2,233 0.03Yum! Brands 26,913 1,865 0.03Zillow 'C' Shares 77,674 2,155 0.03Zimmer Biomet 20,530 2,023 0.03Zoetis 49,720 1,957 0.03
51

Security Holdings
MarketValue£000
% ofNet
Assets
St. James's Place Global Equity Unit Trust
Portfolio Statement (continued)
as at 30 September 2016
DERIVATIVES (0.01%) (2,246) (0.03)FuturesSGX CNX NIFTY Index Futures October 2016 9,313 (2,246) (0.03)
Investment Assets^ 7,534,021 99.24
Total other assets (net) 57,846 0.76
Net assets 7,591,867 100.00
Comparative figures shown in brackets relate to 30 September 2015.
All investments held are listed, unless otherwise stated.
Derivative contracts were traded on an eligible derivatives exchange.
Stocks shown as ADRs, GDRs, NVDRs & SDRs represent American Depositary Receipts, GlobalDepositary Receipts, Non Voting Depositary Receipts and Swedish Depositary Receiptsrespectively.
† During the year under review the Manager decided to place some of the sterling cash held ondeposit into the St. James’s Place Money Market Unit Trust in order to spread risk across anumber of institutions. The St. James’s Place Money Market Unit Trust is highly liquid and is ratedAAA by Standard & Poors. This investment is a related party.
‡ This investment is a related party.
# Real Estate Investment Trust (REIT).
^ Including investment liabilities of (£2,245,560).
* Valuation based on Investment Manager information.
52

Material Portfolio Changes
PurchasesCost
£000St. James's Place Money Market Unit Trust L Acc† 555,534SGX NIFTY 50 Index Futures October 2016 126,730SGX NIFTY 50 Index Futures September 2016 123,116SGX NIFTY 50 Index Futures August 2016 115,204SGX NIFTY 50 Index Futures July 2016 106,845SGX NIFTY 50 Index Futures May 2016 91,762SGX NIFTY 50 Index Futures June 2016 89,371SGX NIFTY 50 Index Futures January 2016 87,952SGX NIFTY 50 Index Futures April 2016 87,589SGX NIFTY 50 Index Futures February 2016 86,339
SalesProceeds
£000St. James's Place Money Market Unit Trust L Acc† 487,027SGX NIFTY 50 Index Futures September 2016 126,055SGX NIFTY 50 Index Futures July 2016 114,594SGX NIFTY 50 Index Futures August 2016 114,532SGX NIFTY 50 Index Futures June 2016 102,225SGX NIFTY 50 Index Futures May 2016 89,310SGX NIFTY 50 Index Futures April 2016 87,635SGX NIFTY 50 Index Futures March 2016 86,617SGX NIFTY 50 Index Futures January 2016 86,258SGX CNX NIFTY Index Futures October 2015 86,185
† This investment is a related party.
St. James's Place Global Equity Unit Trust
53

●
●
●
●
●
London
The Manager is responsible for keeping proper accounting records and for the management ofthe Trust in accordance with its Trust Deed, Prospectus and the Rules. The Manager has ageneral responsibility for taking such steps as are reasonably open to it to prevent and detectfraud and other irregularities.
St. James's Place Global Equity Unit Trust Statement of the Manager's Responsibilities in relation to the Financial Statements of the Trust
The rules in the Financial Conduct Authority's Collective Investment Schemes Sourcebook ("theRules") require the Manager to prepare Financial Statements for each annual accounting periodwhich give a true and fair view of the financial position of the Trust as at the end of the year andof the net revenue and the net capital gains on the property of the Trust for the year thenended.
In preparing the Financial Statements the Manager is required to:
select suitable accounting policies and then apply them consistently;
make judgements and estimates that are reasonable and prudent;
comply with the requirements of the Statement of Recommended Practice relating toAuthorised Funds and the Trust Deed;
follow applicable UK Accounting Standards (UK Generally Accepted Accounting Practice);and
prepare Financial Statements on the going concern basis unless it is inappropriate topresume that the Trust will continue in operation.
Directors of the Managers' Certificate
This report is certified in accordance with the requirements of the rules in the Financial ConductAuthority's Collective Investment Schemes Sourcebook.
A. M. Croft D. J. Lamb
25 November 2016
54

• the Trust’s income is applied in accordance with the Regulations; and
• the sale, issue, repurchase and cancellation of units are carried out in accordance with theRegulations;
• the value of units of the Trust are calculated in accordance with the Regulations;
• the instructions of the Authorised Fund Manager (“the AFM”), which is the UCITSManagement Company, are carried out (unless they conflict with the Regulations).
(ii) has observed the investment and borrowing powers and restrictions applicable to the Trust inaccordance with the Regulations and the Scheme documents of the Trust.
For and on behalf ofBNY Mellon Trust & Depositary (UK) Limited160 Queen Victoria StreetLondon EC4V 4LA
Director
Date 25 November 2016
The Depositary also has a duty to take reasonable care to ensure that the Trust is managed inaccordance with the Regulations and the Scheme documents of the Trust in relation to theinvestment and borrowing powers applicable to the Trust.
Having carried out such procedures as we considered necessary to discharge our responsibilitiesas Depositary of the Trust, it is our opinion, based on the information available to us and theexplanations provided, that, in all material respects the Trust, acting through the AFM:
(i) has carried out the issue, sale, redemption and cancellation, and calculation of the price ofthe Trust’s units and the application of the Trust’s income in accordance with the Regulationsand the Scheme documents of the Trust; and
• the Trust’s cash flows are properly monitored and that cash of the Trust is booked in cashaccounts in accordance with the Regulations;
The Depositary must in the context of its role act honestly, fairly, professionally, independentlyand in the interests of the Trust and its investors.
The Depositary is responsible for the safekeeping all of custodial assets and maintaining a recordof all other assets of the Trust in accordance with the Regulations.
• any consideration relating to transactions in the Trust’s assets is remitted to the Trust withinthe usual time limits;
Statement of the Depositary's Responsibilities in Respect of the Scheme and Report of theDepositary to the Unitholders of the St. James's Place Global Equity Unit Trust for the yearended 30 September 2016
The Depositary in its capacity as Trustee of St. James's Place Global Equity Unit Trust mustensure that the Trust is managed in accordance with the Financial Conduct Authority’s CollectiveInvestment Schemes Sourcebook, and, from 22 July 2014 the Investment Funds Sourcebook, theFinancial Services and Markets Act 2000, as amended, (together “the Regulations”), the TrustDeed and Prospectus (together “the Scheme documents”) as detailed below.
55

●
●
●
●
●
●
●
●
●
●
●
Responsibilities for the financial statements and the audit
Our responsibilities and those of the Authorised Fund Manager
Independent Auditors' Report to the Unitholders of
St. James's Place Global Equity Unit Trust
Our opinion
In our opinion, St. James's Place Global Equity Unit Trust financial statements, (the "financialstatements"):
give a true and fair view of the financial position of the Trust as at 30 September 2016 andof the net revenue and the net capital gains of the scheme property of the Trust for the yearthen ended; and
have been properly prepared in accordance with United Kingdom Generally AcceptedAccounting Practice, the Statement of Recommended Practice for UK Authorised Funds, theCollective Investment Schemes sourcebook and the Trust Deed.
What we have audited
The financial statements, which are prepared by St. James’s Place Unit Trust Group Limited (the“Authorised Fund Manager”), comprise:
the balance sheet of the Trust as at 30 September 2016 ;
the statement of total return of the Trust for the year then ended;
the statement of change in net assets attributable to unitholders of the Trust for the yearthen ended;
the notes to the Trust’s financial statements, which include a summary of significantaccounting policies and other explanatory information; and
the distribution tables.
The financial reporting framework that has been applied in their preparation is applicable law andUnited Kingdom Accounting Standards (United Kingdom Generally Accepted AccountingPractice), the Statement of Recommended Practice ‘Financial Statements of UK Authorised Funds’issued by the Investment Management Association (the “Statement of Recommended Practice forUK Authorised Funds”), the Collective Investment Schemes sourcebook and the Trust Deed.
In applying the financial reporting framework, the Authorised Fund Manager has made a numberof subjective judgements, for example in respect of significant accounting estimates. In makingsuch estimates, they have made assumptions and considered future events.
Opinions on matters prescribed by the Collective Investment Schemes sourcebookIn our opinion:
we have obtained all the information and explanations we consider necessary for thepurposes of the audit; and
the information given in the Authorised Fund Manager’s Report for the financial year forwhich the financial statements are prepared is consistent with the financial statements.
Other matters on which we are required to report by exception
Propriety of accounting records and information and explanations received
Under the Collective Investment Schemes sourcebook we are required to report to you if, in ouropinion:
proper accounting records have not been kept; or
the financial statements are not in agreement with the accounting records and returns.
We have no exceptions to report arising from this responsibility.
As explained more fully in the Statement of the Manager's Responsibilities set out on page 54,the Authorised Fund Manager is responsible for the preparation of the financial statements andfor being satisfied that they give a true and fair view.
Our responsibility is to audit and express an opinion on the financial statements in accordancewith applicable law and ISAs (UK & Ireland). Those standards require us to comply with theAuditing Practices Board’s Ethical Standards for Auditors.
This report, including the opinions, has been prepared for and only for the Trust’s unitholders as abody in accordance with paragraph 4.5.12 of the Collective Investment Schemes sourcebook andfor no other purpose.
56

(continued)
Independent Auditors' Report to the Unitholders of
St. James's Place Global Equity Unit Trust
●
●
●
●
●
What an audit of financial statements involves
We conducted our audit in accordance with International Standards on Auditing (UK and Ireland)(“ISAs (UK & Ireland)”). An audit involves obtaining evidence about the amounts and disclosuresin the financial statements sufficient to give reasonable assurance that the financial statementsare free from material misstatement, whether caused by fraud or error. This includes anassessment of:
whether the accounting policies are appropriate to the Trust’s circumstances and have beenconsistently applied and adequately disclosed;
the reasonableness of significant accounting estimates made by the Authorised FundManager; and
the overall presentation of the financial statements.
In addition, we read all the financial and non-financial information in the Long Report (“the Annual Report”) to identify material inconsistencies with the audited financial statements and toidentify any information that is apparently materially incorrect based on, or materially inconsistentwith, the knowledge acquired by us in the course of performing the audit. If we become aware ofany apparent material misstatements or inconsistencies we consider the implications for ourreport.
we primarily focus our work in these areas by assessing the directors' judgements againstavailable evidence, forming our own judgements, and evaluating the disclosures in thefinancial statements.
we test and examine information, using sampling and other auditing techniques, to theextent we consider necessary to provide a reasonable basis for us to draw conclusions. Weobtain audit evidence through testing the effectiveness of controls, substantive procedures ora combination of both.
We do not, in giving these opinions, accept or assume responsibility for any other purpose or toany other person to whom this report is shown or into whose hands it may come save whereexpressly agreed by our prior consent in writing.
Chartered Accountants and Statutory AuditorsEdinburgh25 November 2016The maintenance and integrity of the St. James’s Place website is the responsibility of the Authorised Fund Manager; the work carried outby the auditors does not involve consideration of these matters and, accordingly, the auditors accept no responsibility for any changesthat may have occurred to the financial statements since they were initially presented on the website.Legislation in the United Kingdom governing the preparation and dissemination of financial statements may differ from legislation in other jurisdictions.
PricewaterhouseCoopers LLP
57

Note £000 £000 £000 £000
2 1,756,919 (305,486)3 151,337 126,7204 (101,346) (95,801)
(31) (13)
49,960 30,906
5 (14,335) (12,030)
35,625 18,876
1,792,544 (286,610)6 (35,625) (18,919)
1,756,919 (305,529)
£000 £000 £000 £0005,605,123 5,680,104
296,860 275,035
(102,455) (63,463)
194,405 211,572- 3
1,756,919 (305,529)35,393 18,937
27 36
7,591,867 5,605,123
Net capital gains/(losses)
01/10/15 to 30/09/16 01/10/14 to 30/09/15
Amounts receivable oncreation of units*
Retained distribution on accumulation units
Opening net assets attributable to unitholdersMovement due to creation and cancellation of units:
Stamp duty reserve tax
Statement of Total Return
St. James's Place Global Equity Unit Trust
Income
for the year ended 30 September 2016
01/10/15 to 30/09/16 01/10/14 to 30/09/15
for the year ended 30 September 2016
Revenue
Distribution
Expenses
Net revenue before taxation
Total return before distribution
Interest payable and similar charges
Taxation
Net revenue after taxation
Change in net assets attributable to unitholders from investment activities
Statement of Change in Net Assets Attributable to Unitholders
Unclaimed distributions
Amounts payable on cancellation of units*
Closing net assets attributable to unitholders
Change in net assets attributable to unitholders from investment activities (see above)
* Prior year creations and cancellations have been reclassified due to reallocations from income toaccumulation units to make these comparable to current year. Prior year figures in relation toDilution Levy have also been reclassified and included within creations and cancellation of unitsas this was income and expenses arising from creations and cancellations respectively.
58

St. James's Place Global Equity Unit Trust
30/09/16 30/09/15
Note £000 £000
7,536,267 5,577,895
8 35,555 48,391
9 62,678 25,097
7,634,500 5,651,383
Liabilities
(2,246) -
Creditors
(550) (320)
(39,837) (45,940)
(42,633) (46,260)7,591,867 5,605,123
Other creditors 10
Total liabilitiesNet assets attributable to unitholders
Balance Sheet
Assets
Investments
Current assets
Distribution payable
as at 30 September 2016
Cash and bank balances
Investment liabilities
Total assets
Debtors
59

1.
(a)
(b)
(c)
(d)
(e)
(f)
The Manager, on advice from the Investment Adviser, values unquoted, illiquid andsuspended investments based on the best information available: The information willinclude Annual Reports (audited), trading statements and market intelligence. The reviewstake place not less than quarterly but more frequently if it is deemed necessary.
Expenses
Taxation
Foreign exchange
Assets and liabilities have been translated into sterling at the exchange rates prevailing atthe Balance Sheet date.
UK dividend revenue is disclosed net of any related tax credit. Overseas dividends continueto be disclosed gross of any foreign tax suffered, the tax element being separately disclosedin the tax note.
Revenue
Provision is made for corporation tax at the current rate on the excess of taxable revenueover allowable expenses.
Transactions involving foreign currencies are converted at the rate ruling on the date of thetransaction.
Deferred tax is provided for on the liability method on all timing differences. A deferred taxasset is only recognised to the extent that a timing difference will be of future benefit.
Valuation of investments
St. James's Place Global Equity Unit Trust
Accounting and Distribution policies
Basis of accounting
Dividends receivable from equity investments are credited to the income account when theinvestments are first quoted ex-dividend. Interest on deposits is accounted for on anaccruals basis. Revenue from other authorised collective investment schemes is recognisedwhen the investments are quoted ex-dividend. Distributions from Brazilian corporations maytake the form of interest on capital as an alternative to making dividend distributions.Interest on capital distributions are recognised on an accruals basis. Management feerebates from underlying funds will be taken to revenue or capital depending on thetreatment adopted in the underlying funds. Management fee rebates received from the St.James's Place Money Market Unit Trust are recognised as revenue on an accruals basis andform part of the distribution.
Notes to the Financial Statements
for the year ended 30 September 2016
Listed investments have been valued at bid market value at 12.00 midday on 30 September2016 (30/09/15: bid market value at 12.00 midday), net of any accrued interest which isincluded in the Balance Sheet as a revenue related item.
All expenses of the Trust are recognised on an accruals basis and are deducted fromrevenue with the exception of handling charges which are deducted from capital.
The Financial Statements have been prepared under the historical cost basis, as modified bythe revaluation of investments, in compliance with the Financial Conduct Authority'sCollective Investment Schemes Sourcebook. They have been prepared in accordance withUnited Kingdom Generally Accepted Accounting Practice, including Financial ReportingStandard 102 (The Financial Reporting Standard applicable in the UK and Republic ofIreland FRS 102) and in accordance with the Statement of Recommended Practice (SORP)for Financial Statements of Authorised Funds issued by the Investment ManagementAssociation May 2014 (IMA SORP 2014). Both FRS 102 and SORP 2014 have been adoptedin the current year. The changes in the SORP 2014 are presentational only and there havebeen no changes to any figures detailed within the financial statements. The financialstatements are prepared on the going concern basis.
60

St. James's Place Global Equity Unit Trust
(continued)Notes to the Financial Statements
for the year ended 30 September 2016
(g)
(h)
(i)
(j)
(k)
2.01/10/15 to
30/09/1601/10/14 to
30/09/15£000 £000
1,752,408 (298,579)76 -
3,522 (6,137)961 (580)(48) (190)
1,756,919 (305,486)
3.01/10/15 to
30/09/1601/10/14 to
30/09/15£000 £000
8,069 9,020Overseas dividends 127,216 105,266Distributions from Regulated Collective Investment Schemes Interest distributions 227 216Revenue from UK REITs 255 150Bank interest 12 49Revenue from Overseas REITs 5,308 4,357Interest on capital 1,146 997Management charge rebate on underlying holdings 592 742Scrip dividends 8,512 5,923
151,337 126,720
Net capital gains/(losses)
Equalisation applies only to units purchased during the distribution period. It is the accruedrevenue element of the purchase price of all such units and is refunded to holders of theseunits as a return of capital. Being capital it is not liable to income tax, but must bededucted from the cost of units for capital gains tax purposes.
The Trust may enter into permitted transactions such as derivative contracts or forwardforeign currency transactions. Where these transactions are used to protect or enhancerevenue, and the circumstances support this, the returns are included within net revenue inthe Statement of Total Return.Where the transactions are used to protect or enhance investments, and the circumstancessupport this, the returns are treated as capital and included within gains/losses oninvestments in the Statement of Total Return. Any open positions in these type oftransactions at the year end are included in the Balance Sheet at their mark to marketvalue.
The manager has chosen to pay all revenue less revenue expenses and taxation as a finaldistribution at the end of the accounting period. In the case of income unitholders this willbe paid as a distribution. In the case of accumulation unitholders the distribution will bereinvested. Equalisation on distributions received is deducted from the cost of theinvestment.
Equalisation
Revenue
Forward currency contractsFutures contracts
Handling chargesCurrency gains/(losses)
Total revenue
UK dividends
Distribution policy
Non-derivative securities
Net capital gains/(losses)
Special dividends
Special dividends are treated as revenue or a repayment of capital reflecting the facts ofeach particular case.
The ordinary element of stocks received in lieu of cash dividends is recognised as revenueand where applicable, is included in the distribution. In the case of enhanced scripdividends, the value of the enhancement is treated as capital.
Scrip dividends
Derivatives
61

St. James's Place Global Equity Unit Trust
(continued)Notes to the Financial Statements
for the year ended 30 September 2016
4.01/10/15 to
30/09/1601/10/14 to
30/09/15£000 £000
85,524 92,288
- 386
Audit fee - 11Investment administration fee - 286
- 10- 1,794- 999- 3- 24
Investment adviser's fees 15,822 -
15,822 3,127
101,346 95,801
5.01/10/15 to
30/09/1601/10/14 to
30/09/15£000 £000
(a)14,335 12,030
(b)
49,960 30,906
9,992 6,181
(1,624) (1,813)(1,683) (560)
(25,406) (21,639)- (27)
18,958 18,05614,335 12,030
(237) (198)
14,335 12,030
(c)
With effect from 26 October 2015 all expenses are now paid by the Manager out of theAnnual Management Charge with exception of the Investment Adviser fees. This includescurrent year Audit Fee of £11k. For presentation purposes in the table above, all expensesother than Investment Adviser fees have been shown as part of the Annual ManagementCharges for the full year from 1 October 2015.
Total expenses
Irrecoverable overseas taxAnalysis of charge in year:
Professional fee
Payable to the Trustee
Taxation
Other expenses
Tax & compliance fee
Management charge
Expenses
Safe custody fee
ADR Issuance fee
Trustee's fee
Registrar's fee
Non taxable foreign dividends
Factors affecting total tax charge for the year:
Net revenue before taxation
Expenses include irrecoverable VAT where applicable.
The tax assessed for the year is higher than the standard rate of corporation tax in the UKfor an authorised unit trust of 20% (2015: 20%). The differences are explained below:
Payable to the Manager
Authorised Unit Trusts are exempt from tax on capital gains, therefore any capital return isnot included in the above reconciliation.
Deferred taxation:
Revenue taxable in different periods
Corporation Tax at 20% (2015: 20%)
There is no provision required for deferred taxation at the balance sheet date.
Movement in excess management expensesIrrecoverable overseas taxForeign tax expensed
Effects of:
Non taxable scrip dividendsUK dividends not subject to corporation tax
Total tax charge for year (note 5a)
62

St. James's Place Global Equity Unit Trust
(continued)Notes to the Financial Statements
for the year ended 30 September 2016
(d)
6.
01/10/15 to 30/09/16
01/10/14 to 30/09/15
£000 £000Final distribution 35,943 19,257
147 33(465) (371)
35,625 18,919
7.01/10/15 to
30/09/1601/10/14 to
30/09/15£000 £000
35,625 18,876- 43
35,625 18,919
8.30/09/16 30/09/15
£000 £00015,173 30,500
3,211 5,13412,549 9,784
58 -137 92
4,427 2,881
35,555 48,391
9.30/09/16 30/09/15
£000 £00025,405 16,47237,226 7,749
47 876
62,678 25,097
10.30/09/16 30/09/15
£000 £00027,726 43,597
65 -12,046 2,343
39,837 45,940
Sales awaiting settlement
Total debtors
Purchases awaiting settlement
Cash and bank balances: Sterling
Amounts held at futures clearing houses and brokers
Net revenue after taxation
Overseas tax recoverable
Add: brought forward from previous year
Net distribution for the year
Debtors
Net distribution for the year
The distribution takes account of revenue received on the creation of units and revenuededucted on the cancellation of units and comprises:
Deduct: Revenue received on creation of units
Accrued revenue
Income tax recoverable
Add: Revenue deducted on cancellation of units
Amounts receivable for creation of units
Cash and bank balances: Overseas
At the year end, after offset against revenue taxable on receipt, there is a potential deferredtax asset of £77,703,618 (30/09/15: £58,744,732) relating to surplus managementexpenses. No deferred tax asset was recognised in the current or prior year as it wasconsidered unlikely the Trust would generate sufficient taxable profits in the future to utilisethese amounts.
Amounts payable for cancellation of unitsAccrued expenses
Factors that may affect future tax charges
Rebate receivable on underlying holdings
Movement between net revenue and net distribution
Total cash and bank balances
Distributions
Cash and bank balances
Other creditors
Total other creditors
63

St. James's Place Global Equity Unit Trust
(continued)Notes to the Financial Statements
for the year ended 30 September 2016
11.
Opening units in issue
Units converted Creations Cancellations
Closing units in issue
74,756,015 - 1,593,009 (5,101,874) 71,247,1504,339,239,711 - 204,164,304 (69,260,277) 4,474,143,738
12.
13.
14.
●
●
●
15.
Included in the investment portfolio is a holding of 203,975,389 units (30/09/15:138,380,796) in St. James's Place Money Market Unit Trust (St. James's Place Unit TrustGroup Limited fund) with a market value of £213,066,368 (30/09/15: £144,365,627).Revenue and management charge rebates from this holding are shown in note 3 as interestdistributions and management charge rebates on the underlying holdings. As at 30/09/16total revenue earned amounts to £818,668 (30/09/15: £215,591).
The Manager’s objectives in managing investment risk are to ensure that the investmentprofile of the Trust is consistent with its stated investment objectives and risk profile, and toensure appropriate liquidity. Day to day responsibility for managing investment risk isdelegated to the Investment Adviser, who is required to manage the Trust in accordancewith FCA regulations, the Prospectus and the terms of their Investment ManagementAgreement with the Manager. The Manager monitors the activities of the InvestmentAdvisers, through a variety of mechanisms including the following:
Equity shares; interest bearing assets and units in collective investment schemes.
Derivatives which the Trust may enter into (principally futures contracts, options andcontracts for difference) for the purpose of which is to manage the market risk arising fromthe Trust's investment activities (and related financing).
Related party transactions
The rules in the Scheme Documents set out the financial instruments in which the Trust mayinvest. The Trust's use of financial instruments during the year satisfies these requirements.
Cash (including overdrafts) and short-term debtors and creditors that arise directly from itsoperations; and
Derivatives and other financial instruments
In accordance with the investment objectives, as stated on page 2, the Trust held certainfinancial instruments. These comprise:
Capital commitments and contingent liabilities
On 30 September 2016, the Trust had no capital commitments (30/09/15: £nil) and nocontingent liabilities (30/09/15: £nil).
Units in issue
Included in the investment portfolio is a holding of 160,000 shares (30/09/15: 160,000) inSt. James's Place (a parent company of St. James's Place Unit Trust Group Limited) with amarket value of £1,516,000 (30/09/15: £1,360,800).
The Manager, St. James's Place Unit Trust Group Limited, is a subsidiary of St. James's PlaceWealth Management Group plc ('SJPWMG'). Two fellow subsidiaries of SJPWMG, St.James's Place International plc and St. James's Place UK plc, invest some of their life andpension policyholders' funds into the St. James's Place Global Equity Unit Trust . The valueof these investments at the year end was £6,248,465,580 (30/09/15: £4,678,196,219).
Risk management
Reconciliation of the unit movement in the year:
IncomeAccumulation
St. James's Place Unit Trust Group Limited together with the subsidiaries includingassociates are related parties and regarded as controlling parties by virtue of having theability to act in respect of operations of the Trust.
The Manager's service charge paid to St. James's Place Unit Trust Group Limited is shown innote 4 and details of the value of units created and cancelled by St. James's Place Unit TrustGroup Limited are shown in the Statement of Change in Net Assets Attributable toUnitholders. The net balances due to St. James's Place Unit Trust Group Limited at the yearend in respect of these transactions was £5,028,050 (30/09/15: due from £5,129,993).
64

St. James's Place Global Equity Unit Trust
(continued)Notes to the Financial Statements
for the year ended 30 September 2016●
●
●
(a)
01/10/15 to 30/09/16
01/10/14 to 30/09/15
% %13.18% 13.01%13.18% 13.18%13.18% 13.04%
(b)
●
●
●
The main risks arising from the Trust's financial instruments are market price risk, foreigncurrency risk, interest rate risk, credit risk and liquidity risk. The Manager's policies formanaging these risks are summarised below. These policies have remained unchangedsince the beginning of the year to which these financial statements relate (same for 2015).
Lowest monthly VaRHighest monthly VaR
The Trust receives revenue in currencies other than sterling and movements in exchangerates can affect the sterling values of this revenue. The Trust converts all receipts of revenueinto sterling on or near the date of receipt, it does not however hedge or otherwise seek toavoid exchange rate risk on revenue accrued but not received.
Movements in exchange rates affect revenue received.
Average monthly VaR
Movements in exchange rates affect short term timing differences; and
The sensitivity of the fund to market risk is calculated using the Value-at-Risk (VaR)approach. VaR is a mathematical-statistical concept and is commonly used as a standardmeasure of risk in the financial sector. The maximum potential loss that a fund could sufferunder normal market conditions within a given time horizon and a certain degree ofconfidence is estimated. An absolute VaR is calculated using the historic return series ofeach fund. Using the Historical VaR approach, a 1% 20-day VaR using 10 years of historicaldaily data is calculated. An annualised VaR limit of 20% is considered for the fund.
The Trust may be subject to short term exposure to exchange rate movements, for instancewhere there is a difference between the date an investment purchase or sale is entered intoand the date when settlement of the proceeds occurs. When the Trust enters into such atransaction which will involve the buying or selling of foreign currency in order to complete,a foreign exchange contract is entered into as soon as possible after the initial transaction inorder to minimise the exchange rate risk.
Ongoing review of the investment performance of the Trust against appropriatebenchmarks.
The actual VaR is summarised in the table below:
Market price risk represents the potential loss the Trust might suffer through holding marketpositions in the face of price movements.
Market price risk
The Manager has delegated the investment management of the portfolio to an externalInvestment Adviser who determines the asset allocation and minimises the risk associatedwith particular countries or industry sectors, whilst continuing to follow the Trust’sinvestment objectives. The Manager has the responsibility for monitoring the portfolio toensure compliance with the investment objectives and that an acceptable risk and rewardprofile is maintained.
Movements in exchange rates affect the value of investments;
The Manager has identified three principal areas where foreign currency risk could impactthe Trust:
Initial and ongoing due diligence of Investment Adviser investment and risk managementprocedures – including on site reviews;
Periodic reviews of the investments held by the Trust and their compliance with investmentobjectives and liquidity requirements; and
The revenue and capital value of the Trust’s investments can be significantly affected bycurrency translation movements as a proportion of the Trust’s assets and revenue aredenominated in currencies other than sterling, which is the Trust’s functional currency. Theoverall currency exposure for this fund is reduced by the open forwards exposure.
Foreign currency risk
65

St. James's Place Global Equity Unit Trust
(continued)Notes to the Financial Statements
for the year ended 30 September 2016
30/09/16 30/09/15Total Total£000 £000
644,136 535,63818,637 12,885
136,823 94,519127,962 71,671231,056 155,924226,373 183,047
19,967 15,86546 28
16,181 12,3134,977 4,387
25,469 20,0452,644 2,577
696,293 546,934345,670 225,788
6,208 4,86861,741 32,29114,825 14,221
27 -719,259 501,614190,697 140,468
- 7246,273 41,02077,722 50,58916,212 10,83314,504 10,69539,805 29,67839,179 31,93324,706 21,19051,528 40,79781,620 56,795
108,104 75,34439,306 31,377
181,103 119,0753,244,137 2,422,688
138,677 87,954
7,591,867 5,605,123
(c)
(d)
MADMXNMYR
CHFCLPCNY
GBPAEDAUDBRLCAD
NOK
COPCZKDKKEGPEURHKD
Total
Currency
HUFIDRILSINRJPYKRW
An analysis for all currencies at the year end is shown below:
Net foreign currency assets
Interest rate risk
NZDPHPPLNQARSEK
Interest receivable on bank deposits or payable on bank overdraft positions will be affectedby fluctuations in interest rates.
USD
SGDTHBTRYTWD
The Trust’s investments and cash are held on its behalf by State Street Bank and TrustCompany (acting as agent), the custodian to the Trust, and its appointed sub custodians.Bankruptcy or insolvency of the custodian or its sub custodians may cause the Trust’s rightswith respect to securities to be delayed. This risk is managed through ongoing monitoringof the custodian and periodic reviews of its procedures for selecting and monitoring subcustodians, together with ad hoc reviews of custodian and sub custodian credit ratings.
Credit riskCredit risk occurs where there is a risk associated with the uncertainty of a counterparty’sability to meet its obligations. This risk is managed by reviewing the counterparty’s creditrating, at the time of purchase and on an ongoing basis, and ensuring that the portfolio issufficiently diversified. The impact of movements in credit rating and spread, and theireffect on market prices, is considered to be part of market price risk, which is discussedabove.
ZAR
66

St. James's Place Global Equity Unit Trust
(continued)Notes to the Financial Statements
for the year ended 30 September 2016
(e)
(f)
(g)
(h)
Maturity profile of financial liabilities
Fair value of financial assets and liabilities
There is no material difference between the value of the financial assets and liabilities, asshown in the Balance Sheet, and their fair values.
All financial liabilities of the Trust at the year end are due to settle in one year or less, or ondemand.
Liquidity risk
The Manager may use derivative instruments to hedge the value of the investment portfolioagainst market, currency and stock specific risk through investment in warrants, options,forwards and futures. The purpose of the financial instruments is efficient portfoliomanagement. In particular futures may be used to implement the investment policy in atimely manner and to manage market risk arising from the time lag between funds beingreceivable or payable by the Trust and investment and disinvestment in underlyingsecurities. Forwards have been used to manage currency risk. As the trust is not considereda sophisticated fund, the manager uses the commitment approach to measure the globalexposure to derivatives.
The external Investment Adviser selects acceptable counterparties through whichinvestments are bought and sold. The Manager has responsibility for monitoring theprocess by which these counterparties are selected to minimise risk.
Derivative risk
Certain transactions in securities that the Trust enters into expose it to the risk that thecounterparty will not deliver the investment (purchase) or cash (sale) after the fund hasfulfilled its responsibilities.
Liquidity risk arises where liabilities cannot be met when they fall due or can only be met atan uneconomic price. For instance, this could arise if the Trust faces significant redemptionsin a short period of time. In order to manage this risk the manager monitors the Trust withthe aim of ensuring that it contains diversified liquid assets, that the Trust possessessufficient liquidity for the purpose of meeting the redemption of units, and that the Trusthas sources of borrowing available to it.
Exposure (£)Counterparty
GOLDMAN SACHS INTERNATIONAL 124,297,918
Efficient Portfolio Management
The efficient portfolio management techniques permitted in the fund as at 30 September2016 comprise of:
TechniqueExchange Traded Futures
The efficient portfolio management techniques permitted in the fund as at 30 September2015 comprise of:
TechniqueExchange Traded Futures
Exposure (£)
82,252,661
Counterparty
GOLDMAN SACHS INTERNATIONAL
The revenues in the year were nil with no collateral placed or received.
67

St. James's Place Global Equity Unit Trust
(continued)Notes to the Financial Statements
for the year ended 30 September 2016
16.
01/10/15 to 30/09/16
01/10/14 to 30/09/15
01/10/15 to 30/09/16
01/10/14 to 30/09/15
£000 £000 £000 £000632,809 519,810 561,613 587,471
1,421,601 1,524,753 1,277,003 1,204,434- - - -
2,054,410 2,044,563 1,838,616 1,791,905
- - - -498 470 (353) (430)181 144 (180) (144)
679 614 (533) (574)
- - - -609 710 (226) (387)
- - - -
609 710 (226) (387)
1,288 1,324 (759) (961)
2,055,697 2,046,032 1,837,857 1,790,944
01/10/15 to 30/09/16
01/10/14 to 30/09/15
01/10/15 to 30/09/16
01/10/14 to 30/09/15
% % % %
- - - -0.04 0.03 0.03 0.04
- - - -
- - - -0.04 0.05 0.02 0.03
- - - -
Collective Investment SchemesEquitiesFutures
Total taxes
Total transaction cost expressed as a percentage of asset type cost.
The average portfolio dealing spread at the balance sheet date was 0.18%. (30/09/15:0.19%).
0.03
0.020.02
0.04
Average portfolio dealing spread
TaxesCollective Investment SchemesEquitiesFutures
Total transaction cost expressed as a percentage of net asset value.
01/10/15 to 30/09/16 01/10/14 to 30/09/15
Taxes
Total costs
%%Commissions 0.02
0.01
Total commissions
Collective Investment SchemesEquitiesFutures
Collective Investment SchemesEquities
Portfolio transaction costs
Analysis of total trade costs.
Futures
Purchases Sales
Total costs
Trades in the year before transaction costs
Commissions
TaxesCollective Investment SchemesEquitiesFutures
Commissions
Trades in the year after transaction costs
Purchases Sales
68

St. James's Place Global Equity Unit Trust
(continued)Notes to the Financial Statements
for the year ended 30 September 201617.
Assets Liabilities Assets Liabilities£000 £000 £000 £000
Level 1 7,098,711 (2,246) 5,552,057 -Level 2 430,181 - 25,124 -Level 3 2,633 - 714 -
Total fair value 7,531,525 (2,246) 5,577,895 -
The intention of a fair value measurement is to estimate the price at which an asset or aliability could be exchanged in the market conditions prevailing at the measurement date.The measurement assumes the exchange is an orderly transaction (that is, it is not a forcedtransaction, involuntary liquidation or distress sale) between knowledgeable, willingparticipants on an independent basis.
The purpose of the fair value hierarchy is to prioritise the inputs that should be used tomeasure the fair value of assets and liabilities.
The highest priority is given to quoted prices at which a transaction can be entered into andthe lowest priority to unobservable inputs.
The fund has early adopted the March 2016 amendment to section 34 of FRS102 (FairValue Hierarchy disclosures that simplify preparation of financial instrument disclosure),which is applicable to accounting periods beginning on or after 1 January 2017 with earlierapplication permitted.
Level 1: The unadjusted quoted price in an active market for identical assets or liabilitiesthat the entity can access at the measurement date.
Level 2: Inputs other than quoted prices included within Level 1 that are observable (i.e.developed using market data) for the asset or liability, either directly or indirectly.
Level 3: Inputs are unobservable (i.e. for which market data is unavailable) for the asset orliability.
Fair value
Valuation technique
30/09/16 30/09/15
69

Group 1
Group 2
Netrevenue Equalisation
Distribution payable
30/11/16
Distribution paid
30/11/15
Group 1 (p) (p) (p) (p)Final 0.772 - 0.772 0.428
Group 2 (p) (p) (p) (p)Final 0.558 0.214 0.772 0.428
Netrevenue Equalisation
Distribution payable
30/11/16
Distribution paid
30/11/15
Group 1 (p) (p) (p) (p)Final 0.791 - 0.791 0.436
Group 2 (p) (p) (p) (p)Final 0.570 0.221 0.791 0.436
Income
Accumulation
St. James's Place Global Equity Unit Trust
Distribution Tables
Distribution in pence per unit
Final Units purchased prior to 1 October 2015
Final Units purchased on or after 1 October 2015 to 30 September 2016
70

(a)
(b)
Renaming of Unit Classes
On 10 October 2016 the Manager denominated the existing unit class in the fund as ‘Class L’units. This change will have no impact on the way in which the fund is managed or how dailyunit prices are calculated.
H & Y Unit Classes
On 10 October 2016 the Manager launched Class H and Class Y accumulation unit classes.Restrictions apply to all Class H and Class Y units, please see the Prospectus for details.
A Preliminary Charge of 5 per cent which is included in the offer price of the Units.
Income Distributions
With effect from 26 October 2015 the Manager changed the charging structure of the Scheme.The annual management charge has been increased to include many of the predictable costs,such as trustee fees and administration fees, which were previously charged directly to theScheme. These changes were presentational only and there has been no overall increase in thetotal charges met by the Scheme. In addition, the way the annual management charge iscalculated has been changed. The charge was previously calculated monthly, based on theScheme value on the first business day of the month; with effect from 26 October 2015 it iscalculated daily, based on the Scheme value every day.
The Trust Deed permits the following management charges which are receivable by theManager:
An Annual Management Charge at a rate of 1.33 per cent (1.27 per cent prior to 26October 2015) of the value of the Trust.
The minimum lump sum investment is £1,500, thereafter the minimum additional investment is£1,000. The minimum monthly investment is £150 and the minimum monthly increment is £50.The minimum annual investment is £1,500 and the minimum annual increment is £500.
Minimum Investment
A contract note confirming the subscription or redemption price and the number of unitsinvolved will be forwarded, together with a cancellation notice, where appropriate, on the nextbusiness day.
The most recent issue and redemption prices will be published on the Manager's website:www.sjp.co.uk and are available by calling the Administration Centre on 0800 027 1031.
Income distributions are made annually on or before the 30 November.
Accumulation Distributions
Revenue due to accumulation unitholders is reflected in the price of their units.
Management Charges
St. James's Place Global Equity Unit Trust
General Information
Unit Dealings
Dealings on the Trust take place on a daily basis. Purchase or sale instructions can be made bytelephone or in writing to St. James's Place Unit Trust Group Limited, PO Box 9034, Chelmsford,CM99 2XA, United Kingdom, freephone: 0800 027 1031.
The Manager adopts a policy of forward pricing, i.e. the order will be transacted on the dealingday following receipt of the client's instructions, or if received before noon, on that dealing day.
In the case of telephone purchases of units from the Manager, settlement must be by return ofpost after receipt of the contract note. In the case of telephone redemptions, the proceeds willnot become payable until the receipt at the Administration Centre of a written request.
71

St. James's Place Global Equity Unit Trust
General Information (continued)
Capital Gains Tax
Tax Vouchers
Income unitholders that receive income distributions by direct credit and accumulationunitholders (where the distribution income is reinvested) receive an annual consolidated taxvoucher in May with all the relevant payment and tax information required to complete a taxreturn.
Tax vouchers will be enclosed if income unitholders receive payment by cheque.
To calculate capital gains on accumulation units, the total amount of reinvested net revenue(shown on the annual tax credit vouchers) should be added to the base cost of the unitspurchased. Unitholders should consult their professional advisers for any advice regarding theirtax position.
The Trust is not liable to tax on capital gains and any individual holding units will not be liable tocapital gains tax unless the total chargeable gains for the tax year 2016/2017 exceed £11,100(2015/2016 £11,100).
Remuneration
St. James’s Place PLC (“SJP PLC”) personnel providing services to St. James’s Place Unit TrustGroup Limited (“the Manager ”) are subject to the SJP PLC Remuneration Policy (the“Remuneration Policy ”). The Remuneration Policy reflects the remuneration requirements ofthe UCITS V Directive (2014/91/EU). Details of the Remuneration Policy are available throughwww1.sjp.co.uk/about-st-james-place/our-responsibilities/corporate-governance which isupdated periodically to reflect changes to the policy.
Following the implementation of UCITS V in the UK on 18 March 2016, all authorised UCITSManagers are required to comply with the UCITS V Remuneration Code from the start of theirnext accounting year. Under the UCITS V Directive, the Manager is required to discloseinformation relating to the remuneration paid to its staff for the financial year, split into fixedand variable remuneration. The Manager’s Financial Year end is 31 December, it is thereforeanticipated that the Manager’s Remuneration Policy and associated financial disclosures will bemade within the Annual Reports starting from 31 December 2017, following its first fullperformance period. Prior to this date, and in line with the FCA's guidance on the UCITS Vremuneration disclosures, the Manager would be part way through its first performance periodand the information available would not be relevant or provide a proper basis for comparison.
72

Perivan Financial Print 243234 Global Equity (11/16)
St. James’s Place Unit Trust Group Ltd is authorised and regulated by the Financial Conduct Authority. St. James’s Place Unit Trust Group Ltd Registered Office:
St. James’s Place House, 1 Tetbury Road, Cirencester, Gloucestershire, GL7 1FP, United Kingdom. Registered in England Number 947644.