Embed Size (px)
Citation preview
Global Financial Stability OutlookCEPS, Brussels, October 25, 2017
Tobias AdrianFinancial Counsellor and Director, Monetary and Capital Markets Department
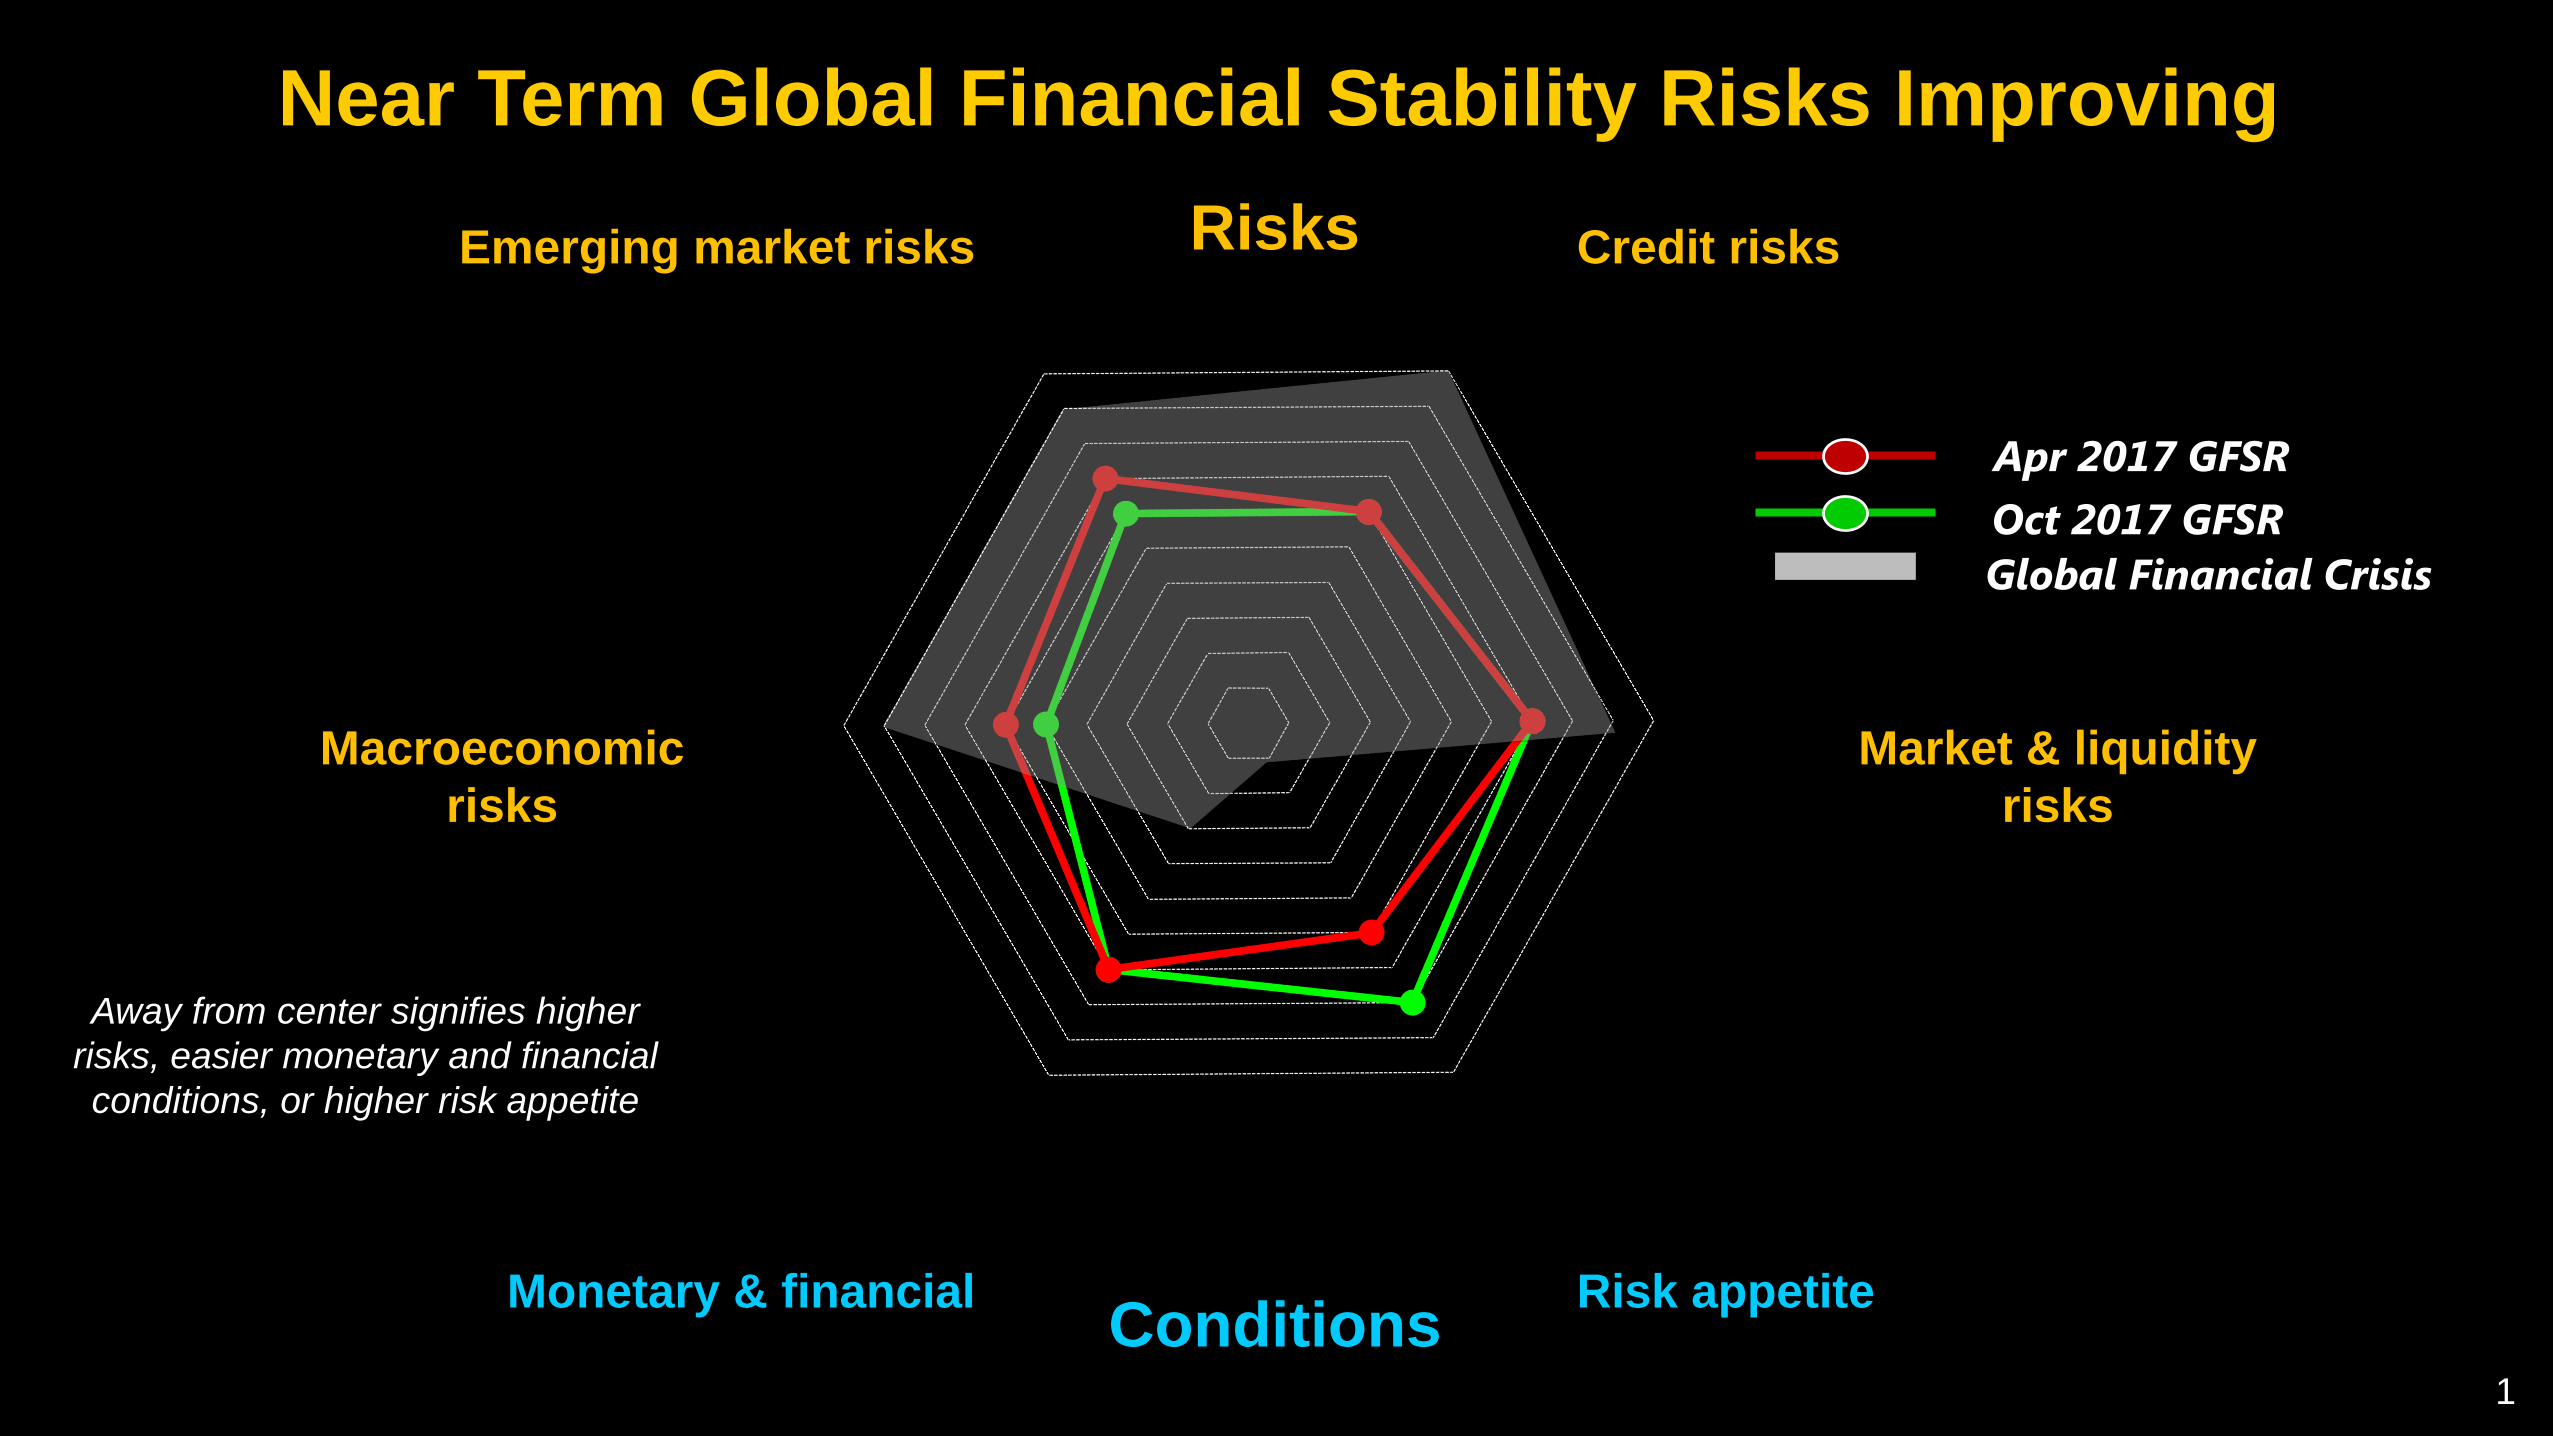
Near Term Global Financial Stability Risks Improving
Away from center signifies higher risks, easier monetary and financial conditions, or higher risk appetite
Emerging market risks
Risk appetiteMonetary & financial
Market & liquidity risks
Credit risks
Macroeconomicrisks
Risks
Conditions1
Apr 2017 GFSROct 2017 GFSRGlobal Financial Crisis

Core Banking System More Resilient

2
Improving Capital and Liquidity(Percent)
Improving Resilience but Profitability Challenges Remain
4.0
4.5
5.0
5.5
6.0
6.5
7.0
7.5
110
115
120
125
130
135
2005
2006
2007
2008
2009
2010
2011
2012
2013
2014
2015
2016
Deposits to Loans Ratio
Adjusted Capital / Assets
Profitability Challenges Remain(Percent of Assets)
48 49
36 29
15
52 51
64 71
85
0
10
20
30
40
50
60
70
80
90
2016 2017E 2018E 2019E TargetBanks’ Target

Market Risks Are Rising
3
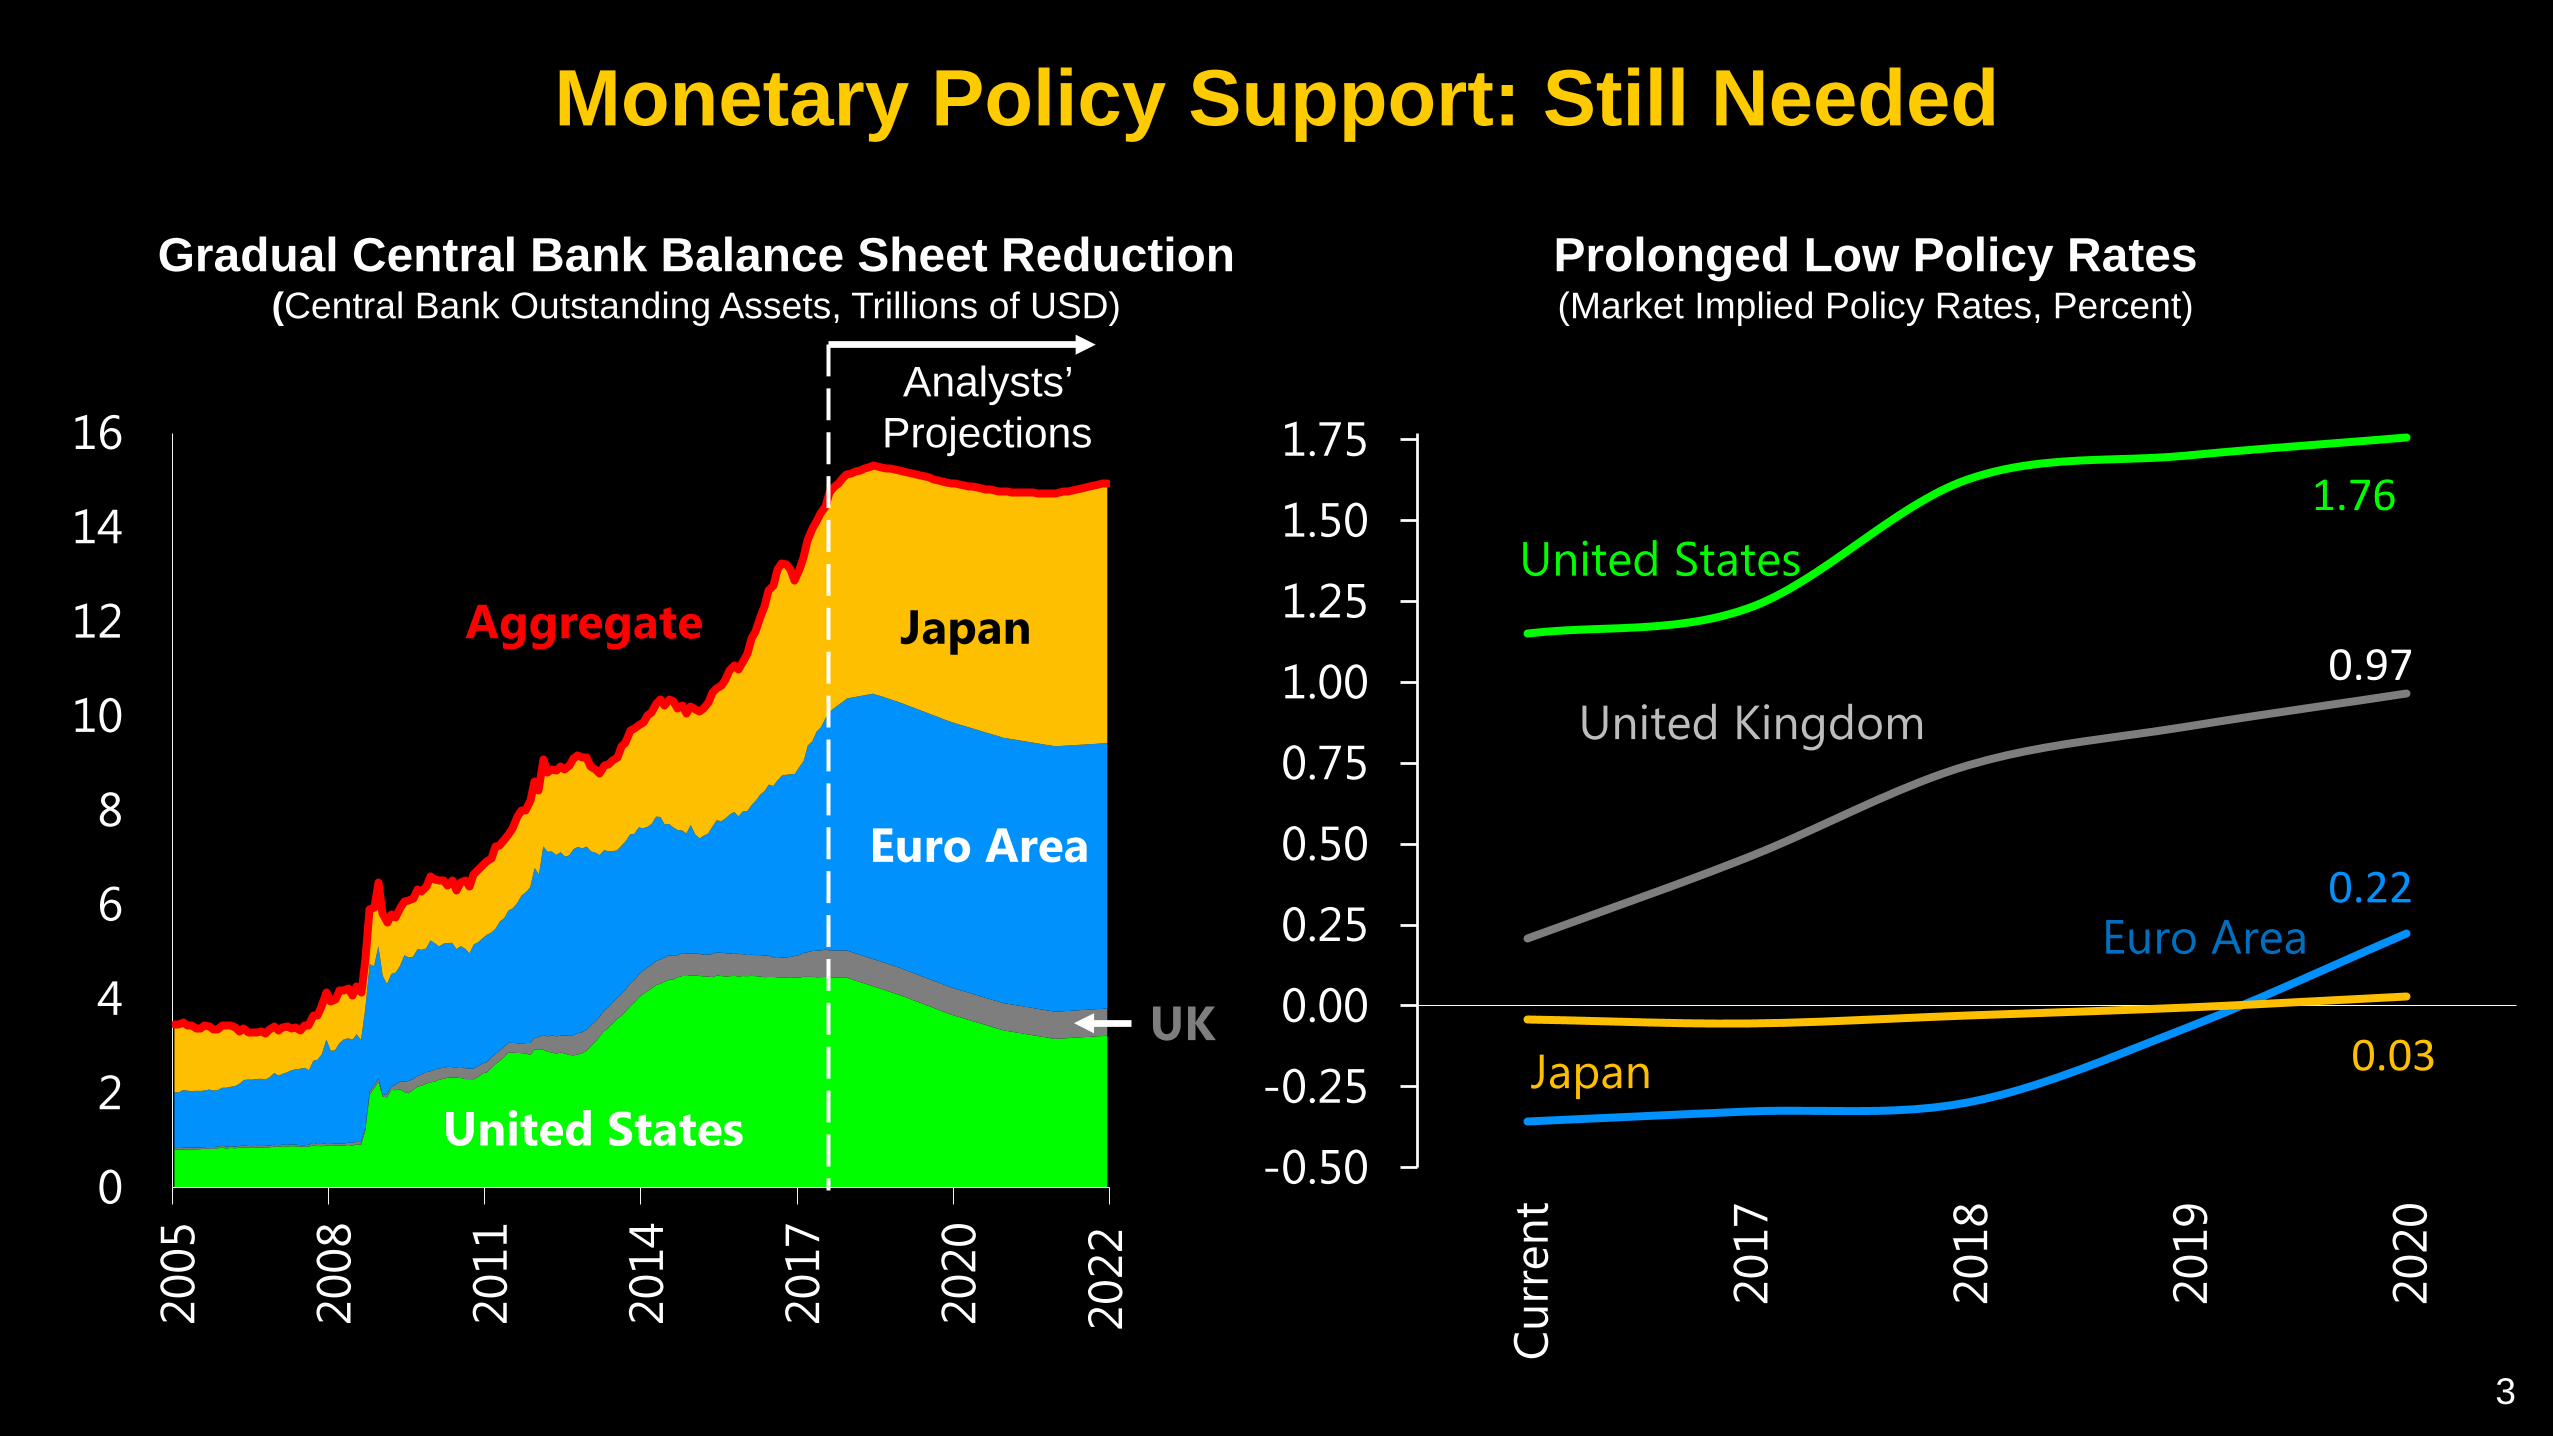
Gradual Central Bank Balance Sheet Reduction(Central Bank Outstanding Assets, Trillions of USD)
Monetary Policy Support: Still Needed
Prolonged Low Policy Rates(Market Implied Policy Rates, Percent)
1.76
0.22
0.03
0.97
-0.50
-0.25
0.00
0.25
0.50
0.75
1.00
1.25
1.50
1.75
Curr
ent
2017
2018
2019
2020
United States
United Kingdom
Japan
Euro Area
2022
UK
Analysts’ Projections
0
2
4
6
8
10
12
14
16
2005
2008
2011
2014
2017
2020
Aggregate Japan
Euro Area
United States

0
2
4
6
8
10
12
14
-1 to
0
0 to
1
1 to
2
2 to
3
3 to
4
4 to
5
5 to
6
6 to
7
7 to
8 >8
Yield (Percent)
4
Fewer Yielding Assets…(Global Investment-Grade Fixed Income Instruments)
But The Search For Yield Is Going Too Far… Compressing Premiums As Credit Quality Worsens
(Market Risk Premium, Share of IG BBB Bonds)
$16tn
$2tn
2007
2017
0
100
200
300
400
500
600
20
25
30
35
40
45
50
2006
2007
2009
2010
2012
2013
2015
2016
Basi
s Po
ints
Perc
ent
Market Risk Premium
Credit Quality
2017
US $tn
5
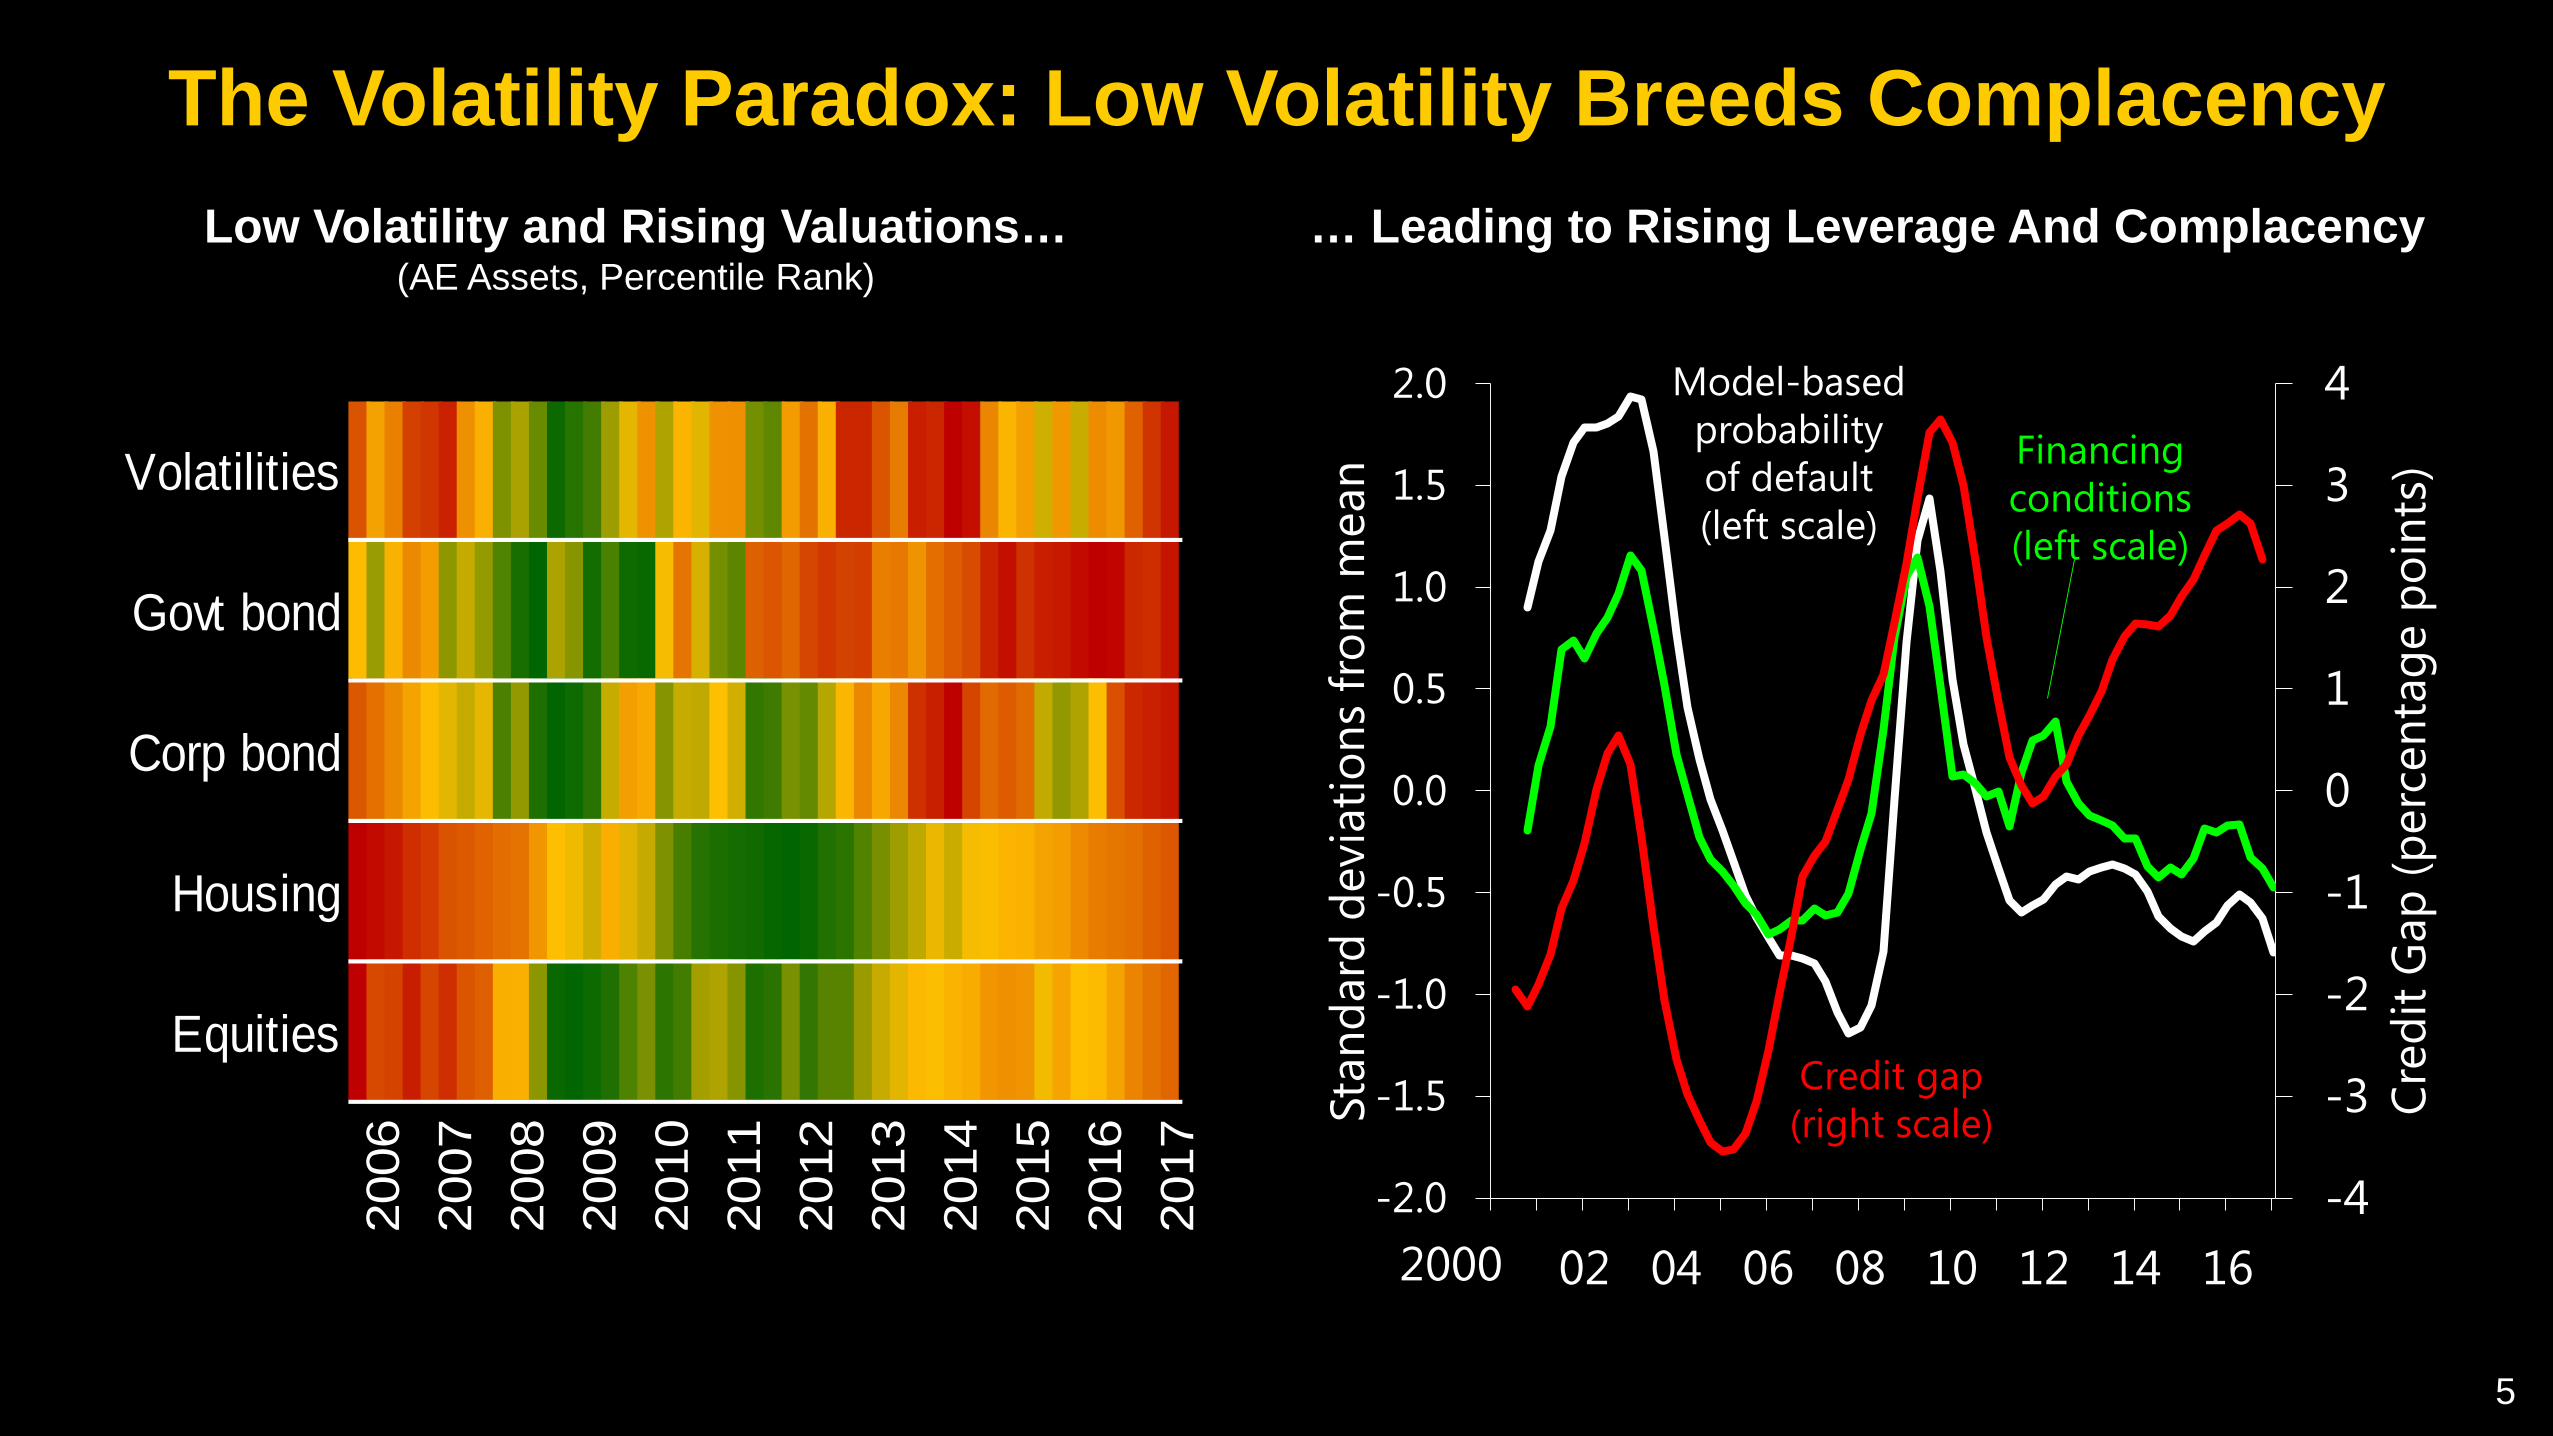
Low Volatility and Rising Valuations…(AE Assets, Percentile Rank)
The Volatility Paradox: Low Volatility Breeds Complacency… Leading to Rising Leverage And Complacency
-4
-3
-2
-1
0
1
2
3
4
-2.0
-1.5
-1.0
-0.5
0.0
0.5
1.0
1.5
2.0
00 02 04 06 08 10 12 14 16
Cred
it G
ap (p
erce
ntag
e po
ints
)
Stan
dard
dev
iatio
ns fr
om m
ean
2000
Credit gap(right scale)
Model-basedprobabilityof default(left scale)
Financingconditions(left scale)
Volatilities
Govt bond
Corp bond
Housing
Equities
2017
2006
2007
2008
2009
2010
2011
2012
2013
2014
2015
2016
6
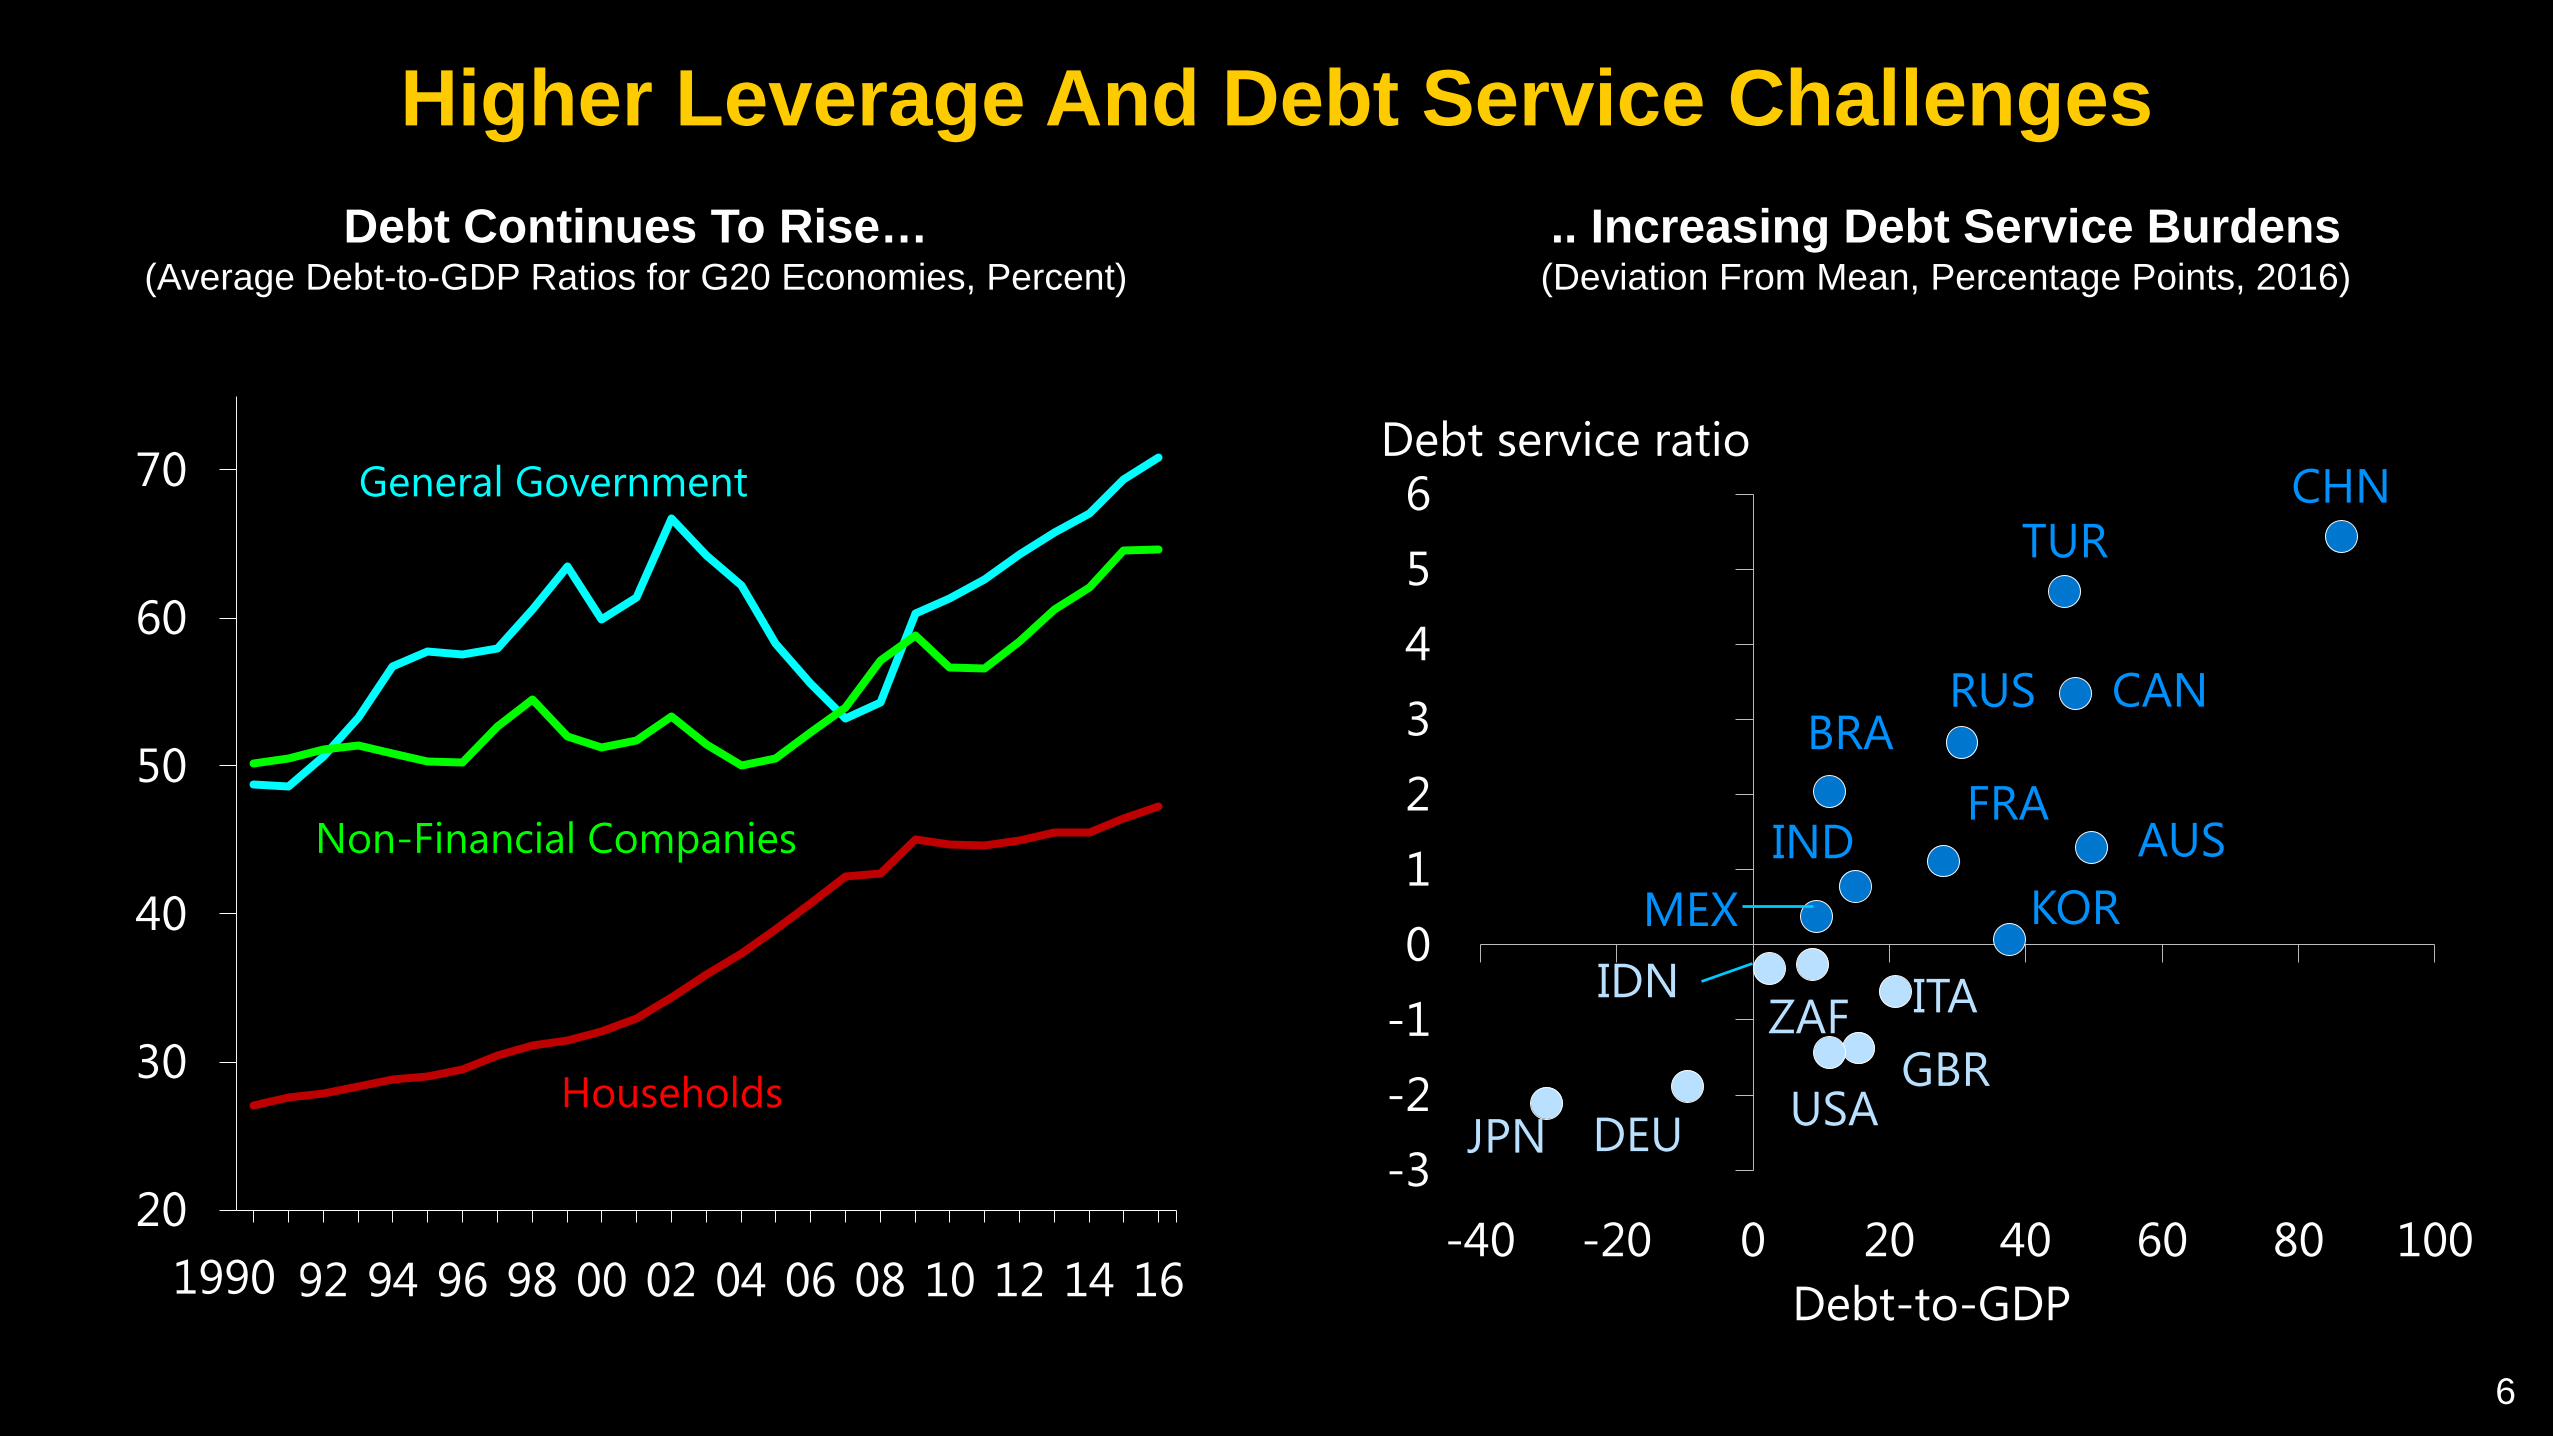
Debt Continues To Rise…(Average Debt-to-GDP Ratios for G20 Economies, Percent)
Higher Leverage And Debt Service Challenges.. Increasing Debt Service Burdens(Deviation From Mean, Percentage Points, 2016)
20
30
40
50
60
70
90 92 94 96 98 00 02 04 06 08 10 12 14 16
General Government
Non-Financial Companies
Households
1990
AUS
CAN
FRA
DEU
ITA
JPN
KOR
GBRUSA
BRA
CHN
IND
IDNMEX
RUS
ZAF
TUR
-3-2-10123456
-40 -20 0 20 40 60 80 100
Debt service ratio
Debt-to-GDP
7
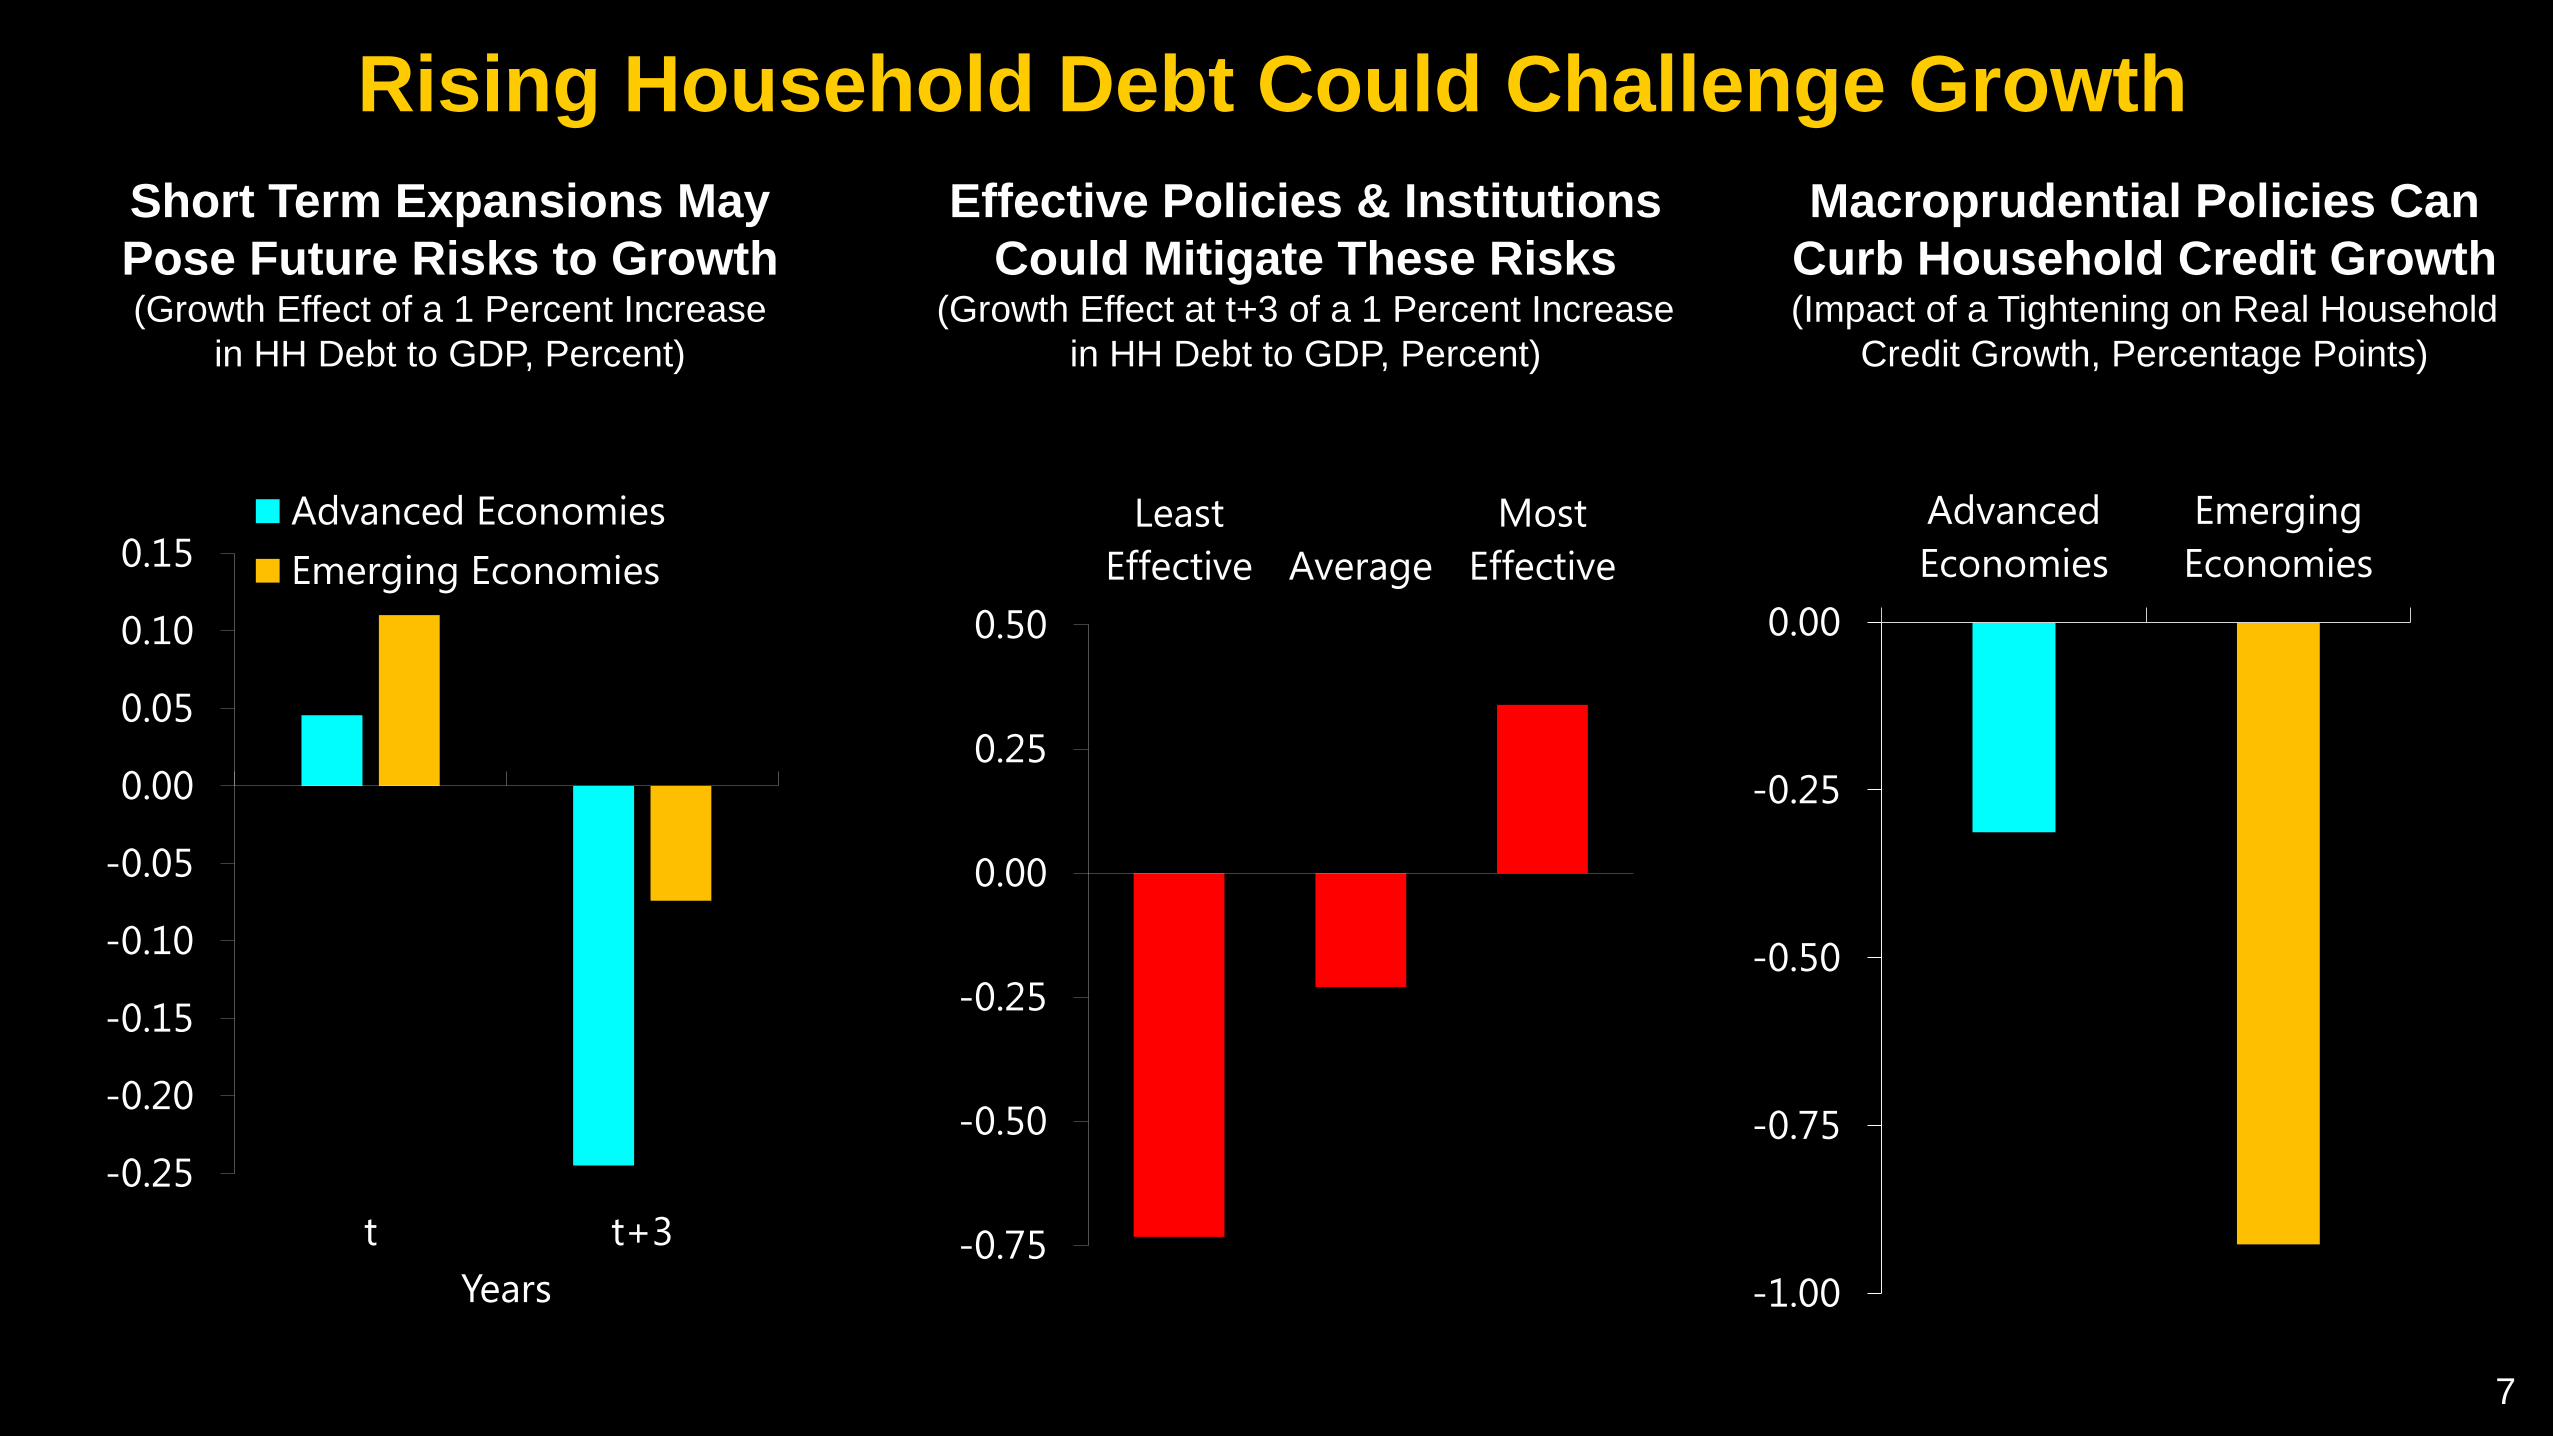
Short Term Expansions May Pose Future Risks to Growth(Growth Effect of a 1 Percent Increase
in HH Debt to GDP, Percent)
Rising Household Debt Could Challenge GrowthMacroprudential Policies Can
Curb Household Credit Growth(Impact of a Tightening on Real Household
Credit Growth, Percentage Points)
Effective Policies & Institutions Could Mitigate These Risks
(Growth Effect at t+3 of a 1 Percent Increase in HH Debt to GDP, Percent)
-1.00
-0.75
-0.50
-0.25
0.00
AdvancedEconomies
EmergingEconomies
-0.25
-0.20
-0.15
-0.10
-0.05
0.00
0.05
0.10
0.15
t t+3Years
Advanced EconomiesEmerging Economies
-0.75
-0.50
-0.25
0.00
0.25
0.50
LeastEffective Average
MostEffective
Emerging Markets: Still Waters?

8
Regulatory Tightening of Small and Medium Sized Banks…(Monthly Change, Three Month Average, Billions of RMB)
China: A Delicate Balancing Act… Could Impact Credit Growth
(Credit Growth Under Shadow Credit Growth Assumption; Percent)
-400
-200
0
200
400
600
800
1,000
1,200
Dec
-15
Mar
-16
Jun-
16
Sep-
16
Dec
-16
Mar
-17
Jun-
17
On-balance sheetshadow credit
Unsecuredinterbank borrowing 6
8
10
12
14
16
18
20
22
2014 2015 2016 2017
Zero shadow credit growth
2017E

Portfolio Flows Have Rebounded(Billions of USD, Four-quarter Rolling Sum)
Benign External Conditions, but EM Vulnerabilities Remain
50
150
250
350
450
550
650
750
2002
2005
2008
2011
2014
2017
Risk Premiums Have Compressed(Market Risk + Term Premium, Basis Points)
-100
0
100
200
300
400
2000
2002
2004
2006
2008
2010
2012
2014
2016
1.0
1.5
2.0
2.5
3.0
3.5
4.0
4.5
2003
2005
2007
2009
2011
2013
2015
75th percentile
25th percentile
Mean
Corporate Leverage Remains High(Total Debt to EBITDA, Multiple)
9
2016

10
Bond Issuance Has Risen Sharply…
Low Income Countries: Benefits and Challenges… Pushing Up Debt Burdens
(Change From 2012 to 2018)
0
2
4
6
8
10
12
0
1
2
3
4
5
6
7
8
9
2009
2010
2011
2012
2013
2014
2015
2016
2017
YTD
AfricaAsiaLatin America
Number of issuers (RHS)
0
20
40
60
80
100
0 5 10 15 20 25 30 35
Publ
ic g
ross
deb
t (pe
rcen
t of G
DP)
VNM
RWA
CIVHND
TZA
CMR
ZMBETH
MOZ
GHA
NGA
Public interest expenses to revenues (percent)
KEN
US $bn Number

Is Growth At Risk?
11
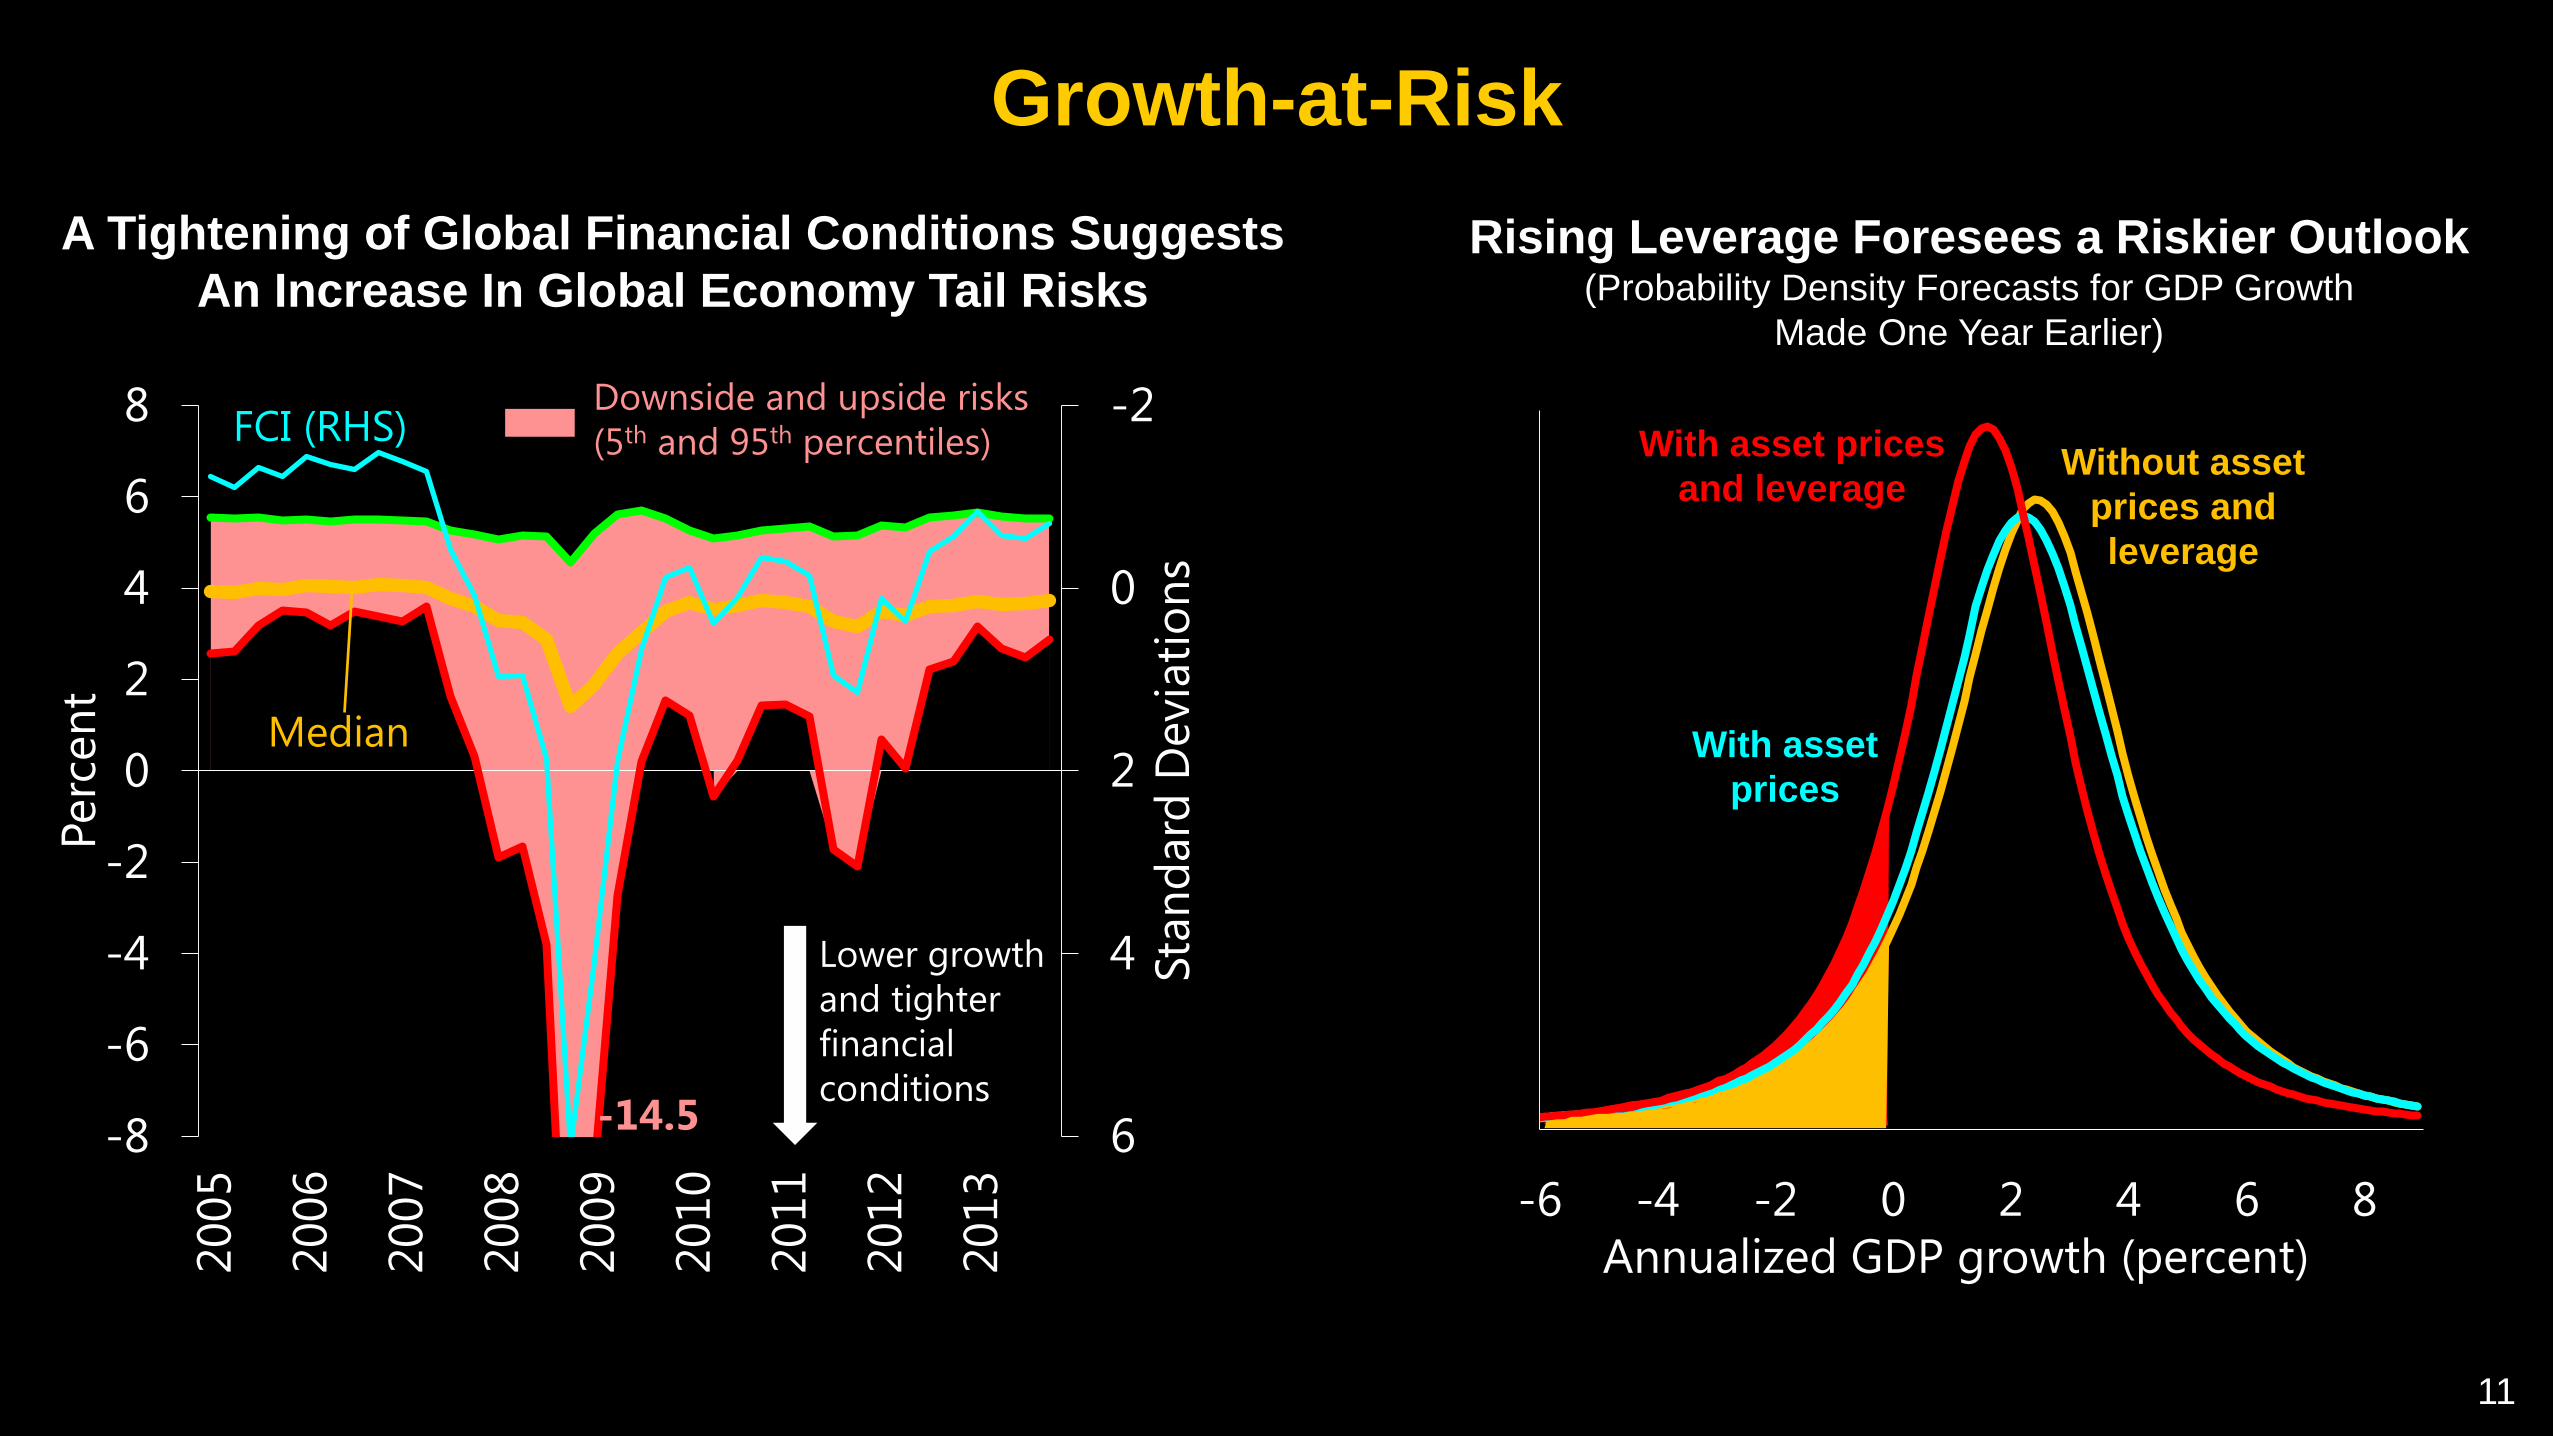
Growth-at-RiskRising Leverage Foresees a Riskier Outlook
(Probability Density Forecasts for GDP Growth Made One Year Earlier)
Annualized GDP growth (percent)
Prob
abili
ty
-2
0
2
4
6-8
-6
-4
-2
0
2
4
6
8
2005
2006
2007
2008
2009
2010
2011
2012
2013
Stan
dard
Dev
iatio
ns
Perc
ent
Median
Downside and upside risks (5th and 95th percentiles)
-14.5
Lower growth and tighter financial conditions
FCI (RHS)
A Tightening of Global Financial Conditions Suggests An Increase In Global Economy Tail Risks
0.00
0.05
0.10
0.15
0.20
0.25
-6 -4 -2 0 2 4 6 8
With asset prices
With asset prices and leverage
Without asset prices and leverage

12
Downside Scenario
Could The Global Recovery Be Derailed?Output Losses Are Substantial and Broad-Based
(Percent of Countries; Output Loss Relative to the Baseline)
2017-2019 2020-2022
Continued search for yield
Spreads compressed
Low volatility
Increasing leverage
Increased risk aversion
Credit spreads decompress
Volatility shifts higher
Debt service pressures mount
High Impact Medium Impact Low Impact
18
30
52 1.7%
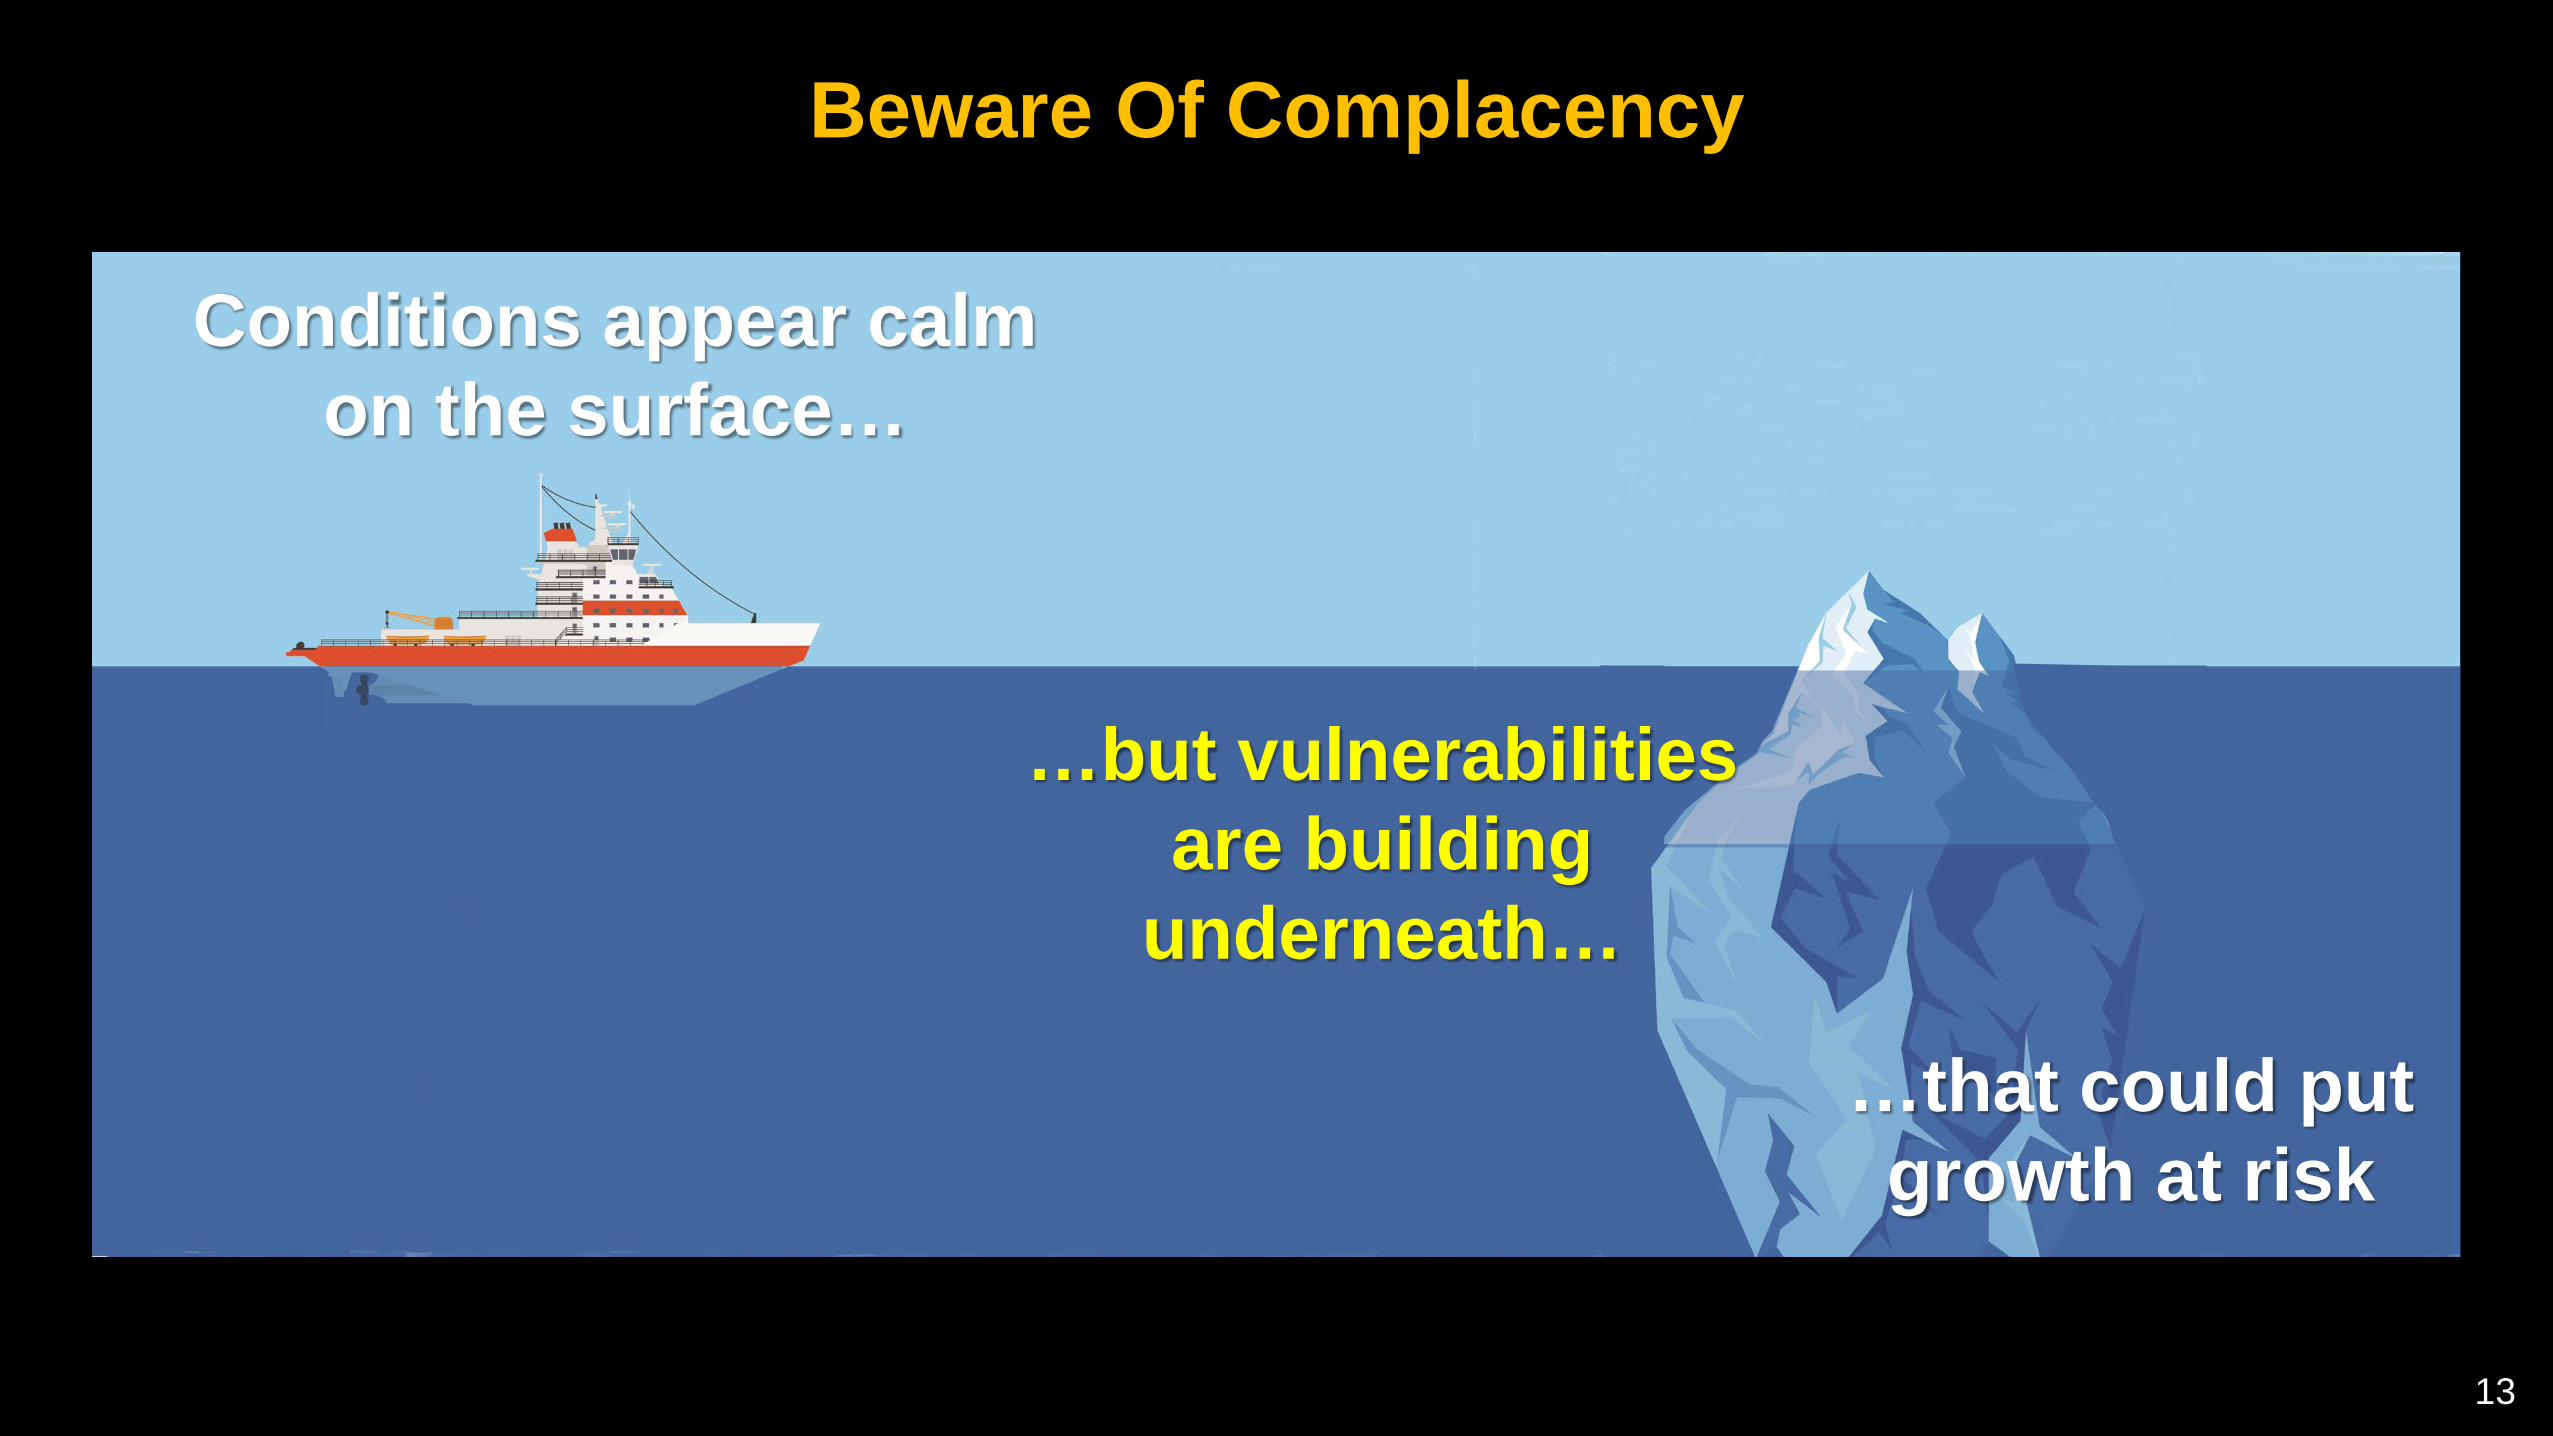
Beware Of Complacency
…but vulnerabilitiesare building
underneath…
Conditions appear calmon the surface…
…that could putgrowth at risk
13
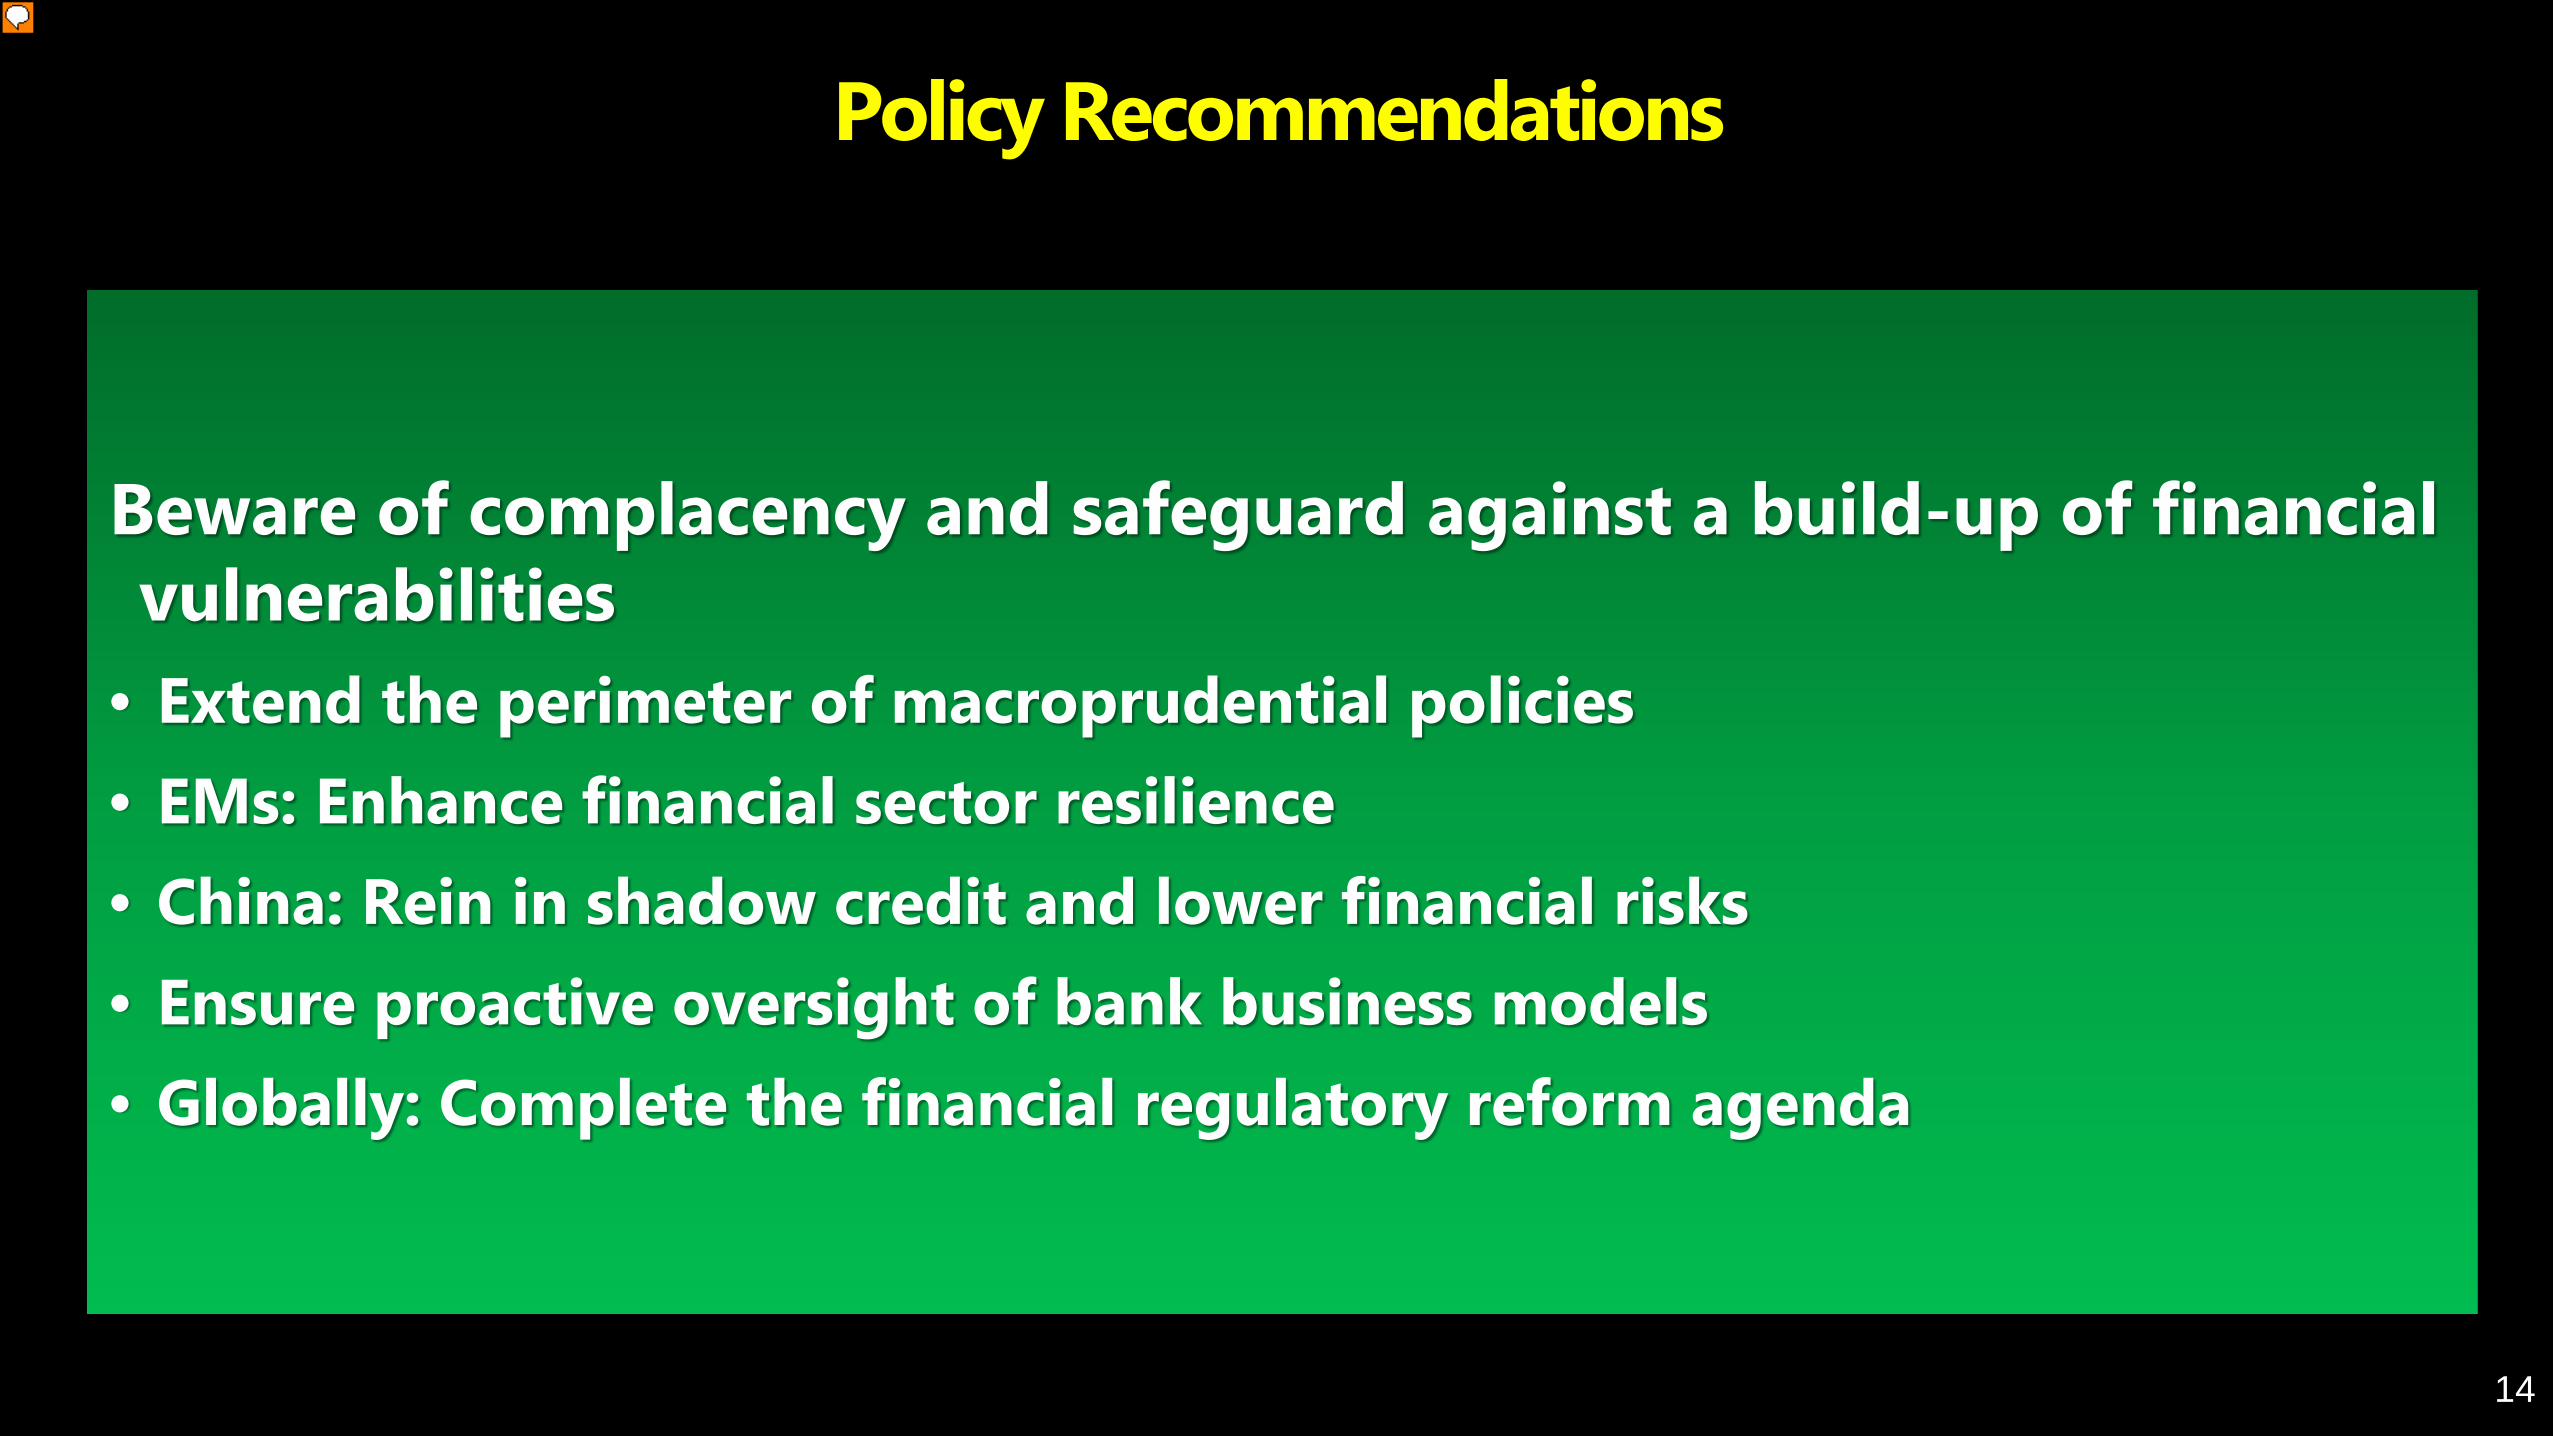
Policy Recommendations
Beware of complacency and safeguard against a build-up of financial vulnerabilities
• Extend the perimeter of macroprudential policies• EMs: Enhance financial sector resilience• China: Rein in shadow credit and lower financial risks• Ensure proactive oversight of bank business models• Globally: Complete the financial regulatory reform agenda
14