Embed Size (px)
Citation preview

© 2016 IHS
Presentation
ihs.com
IHS
Shifting tides: Global fixed investment outlook
World Industry Service
Mike Ryan, Principal Economist, +1 202 481 9449, [email protected]
Q2-2016
ECONOMICS AND COUNTRY RISK
© 2016 IHS
Industry intelligence
2
Investment Outlook / Q2-2016
A global set of comparable
sector forecasts, analysis,
sector expertise, and ranking
capabilities to assess market
risks and opportunities
• Harmonized views and metrics of
industries and countries for accuracy,
consistency and global comparison
• Includes 95 industries for each
of the 75 largest economies
(96% of world GDP)
• Data sourced from national income
accounts and multilateral agencies
• Industry metrics include:
• Production
• Investment
• Profitability
• Trade patterns
• Country/industry-specific prices
© 2016 IHS 3
Investment Outlook / Q2-2016
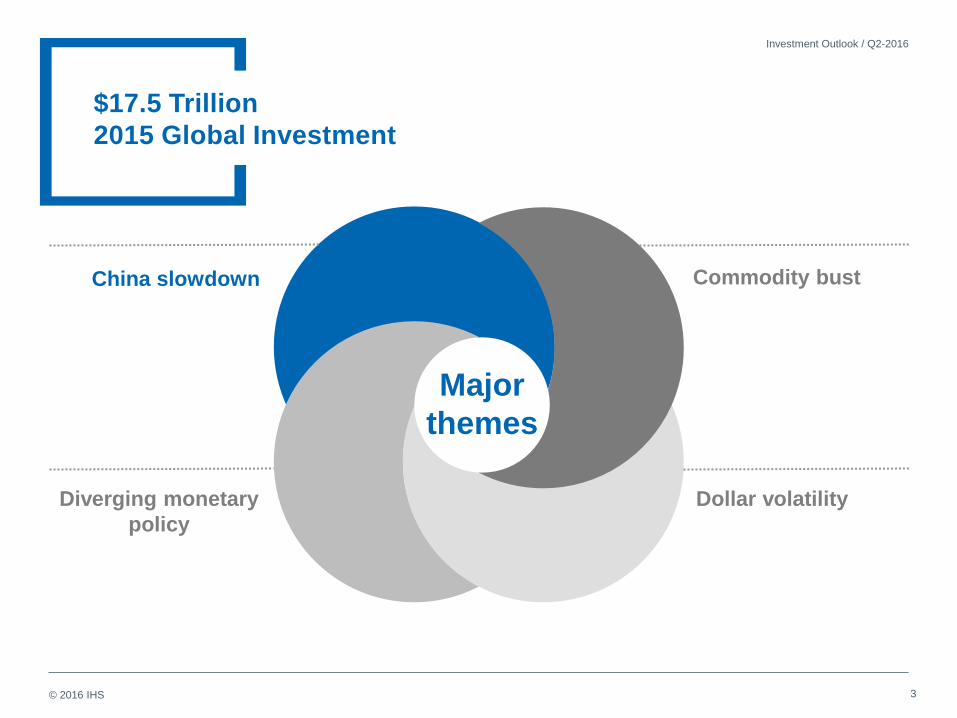
Commodity bust
Dollar volatility
China slowdown
Diverging monetary
policy
$17.5 Trillion
2015 Global Investment
Major
themes
© 2016 IHS
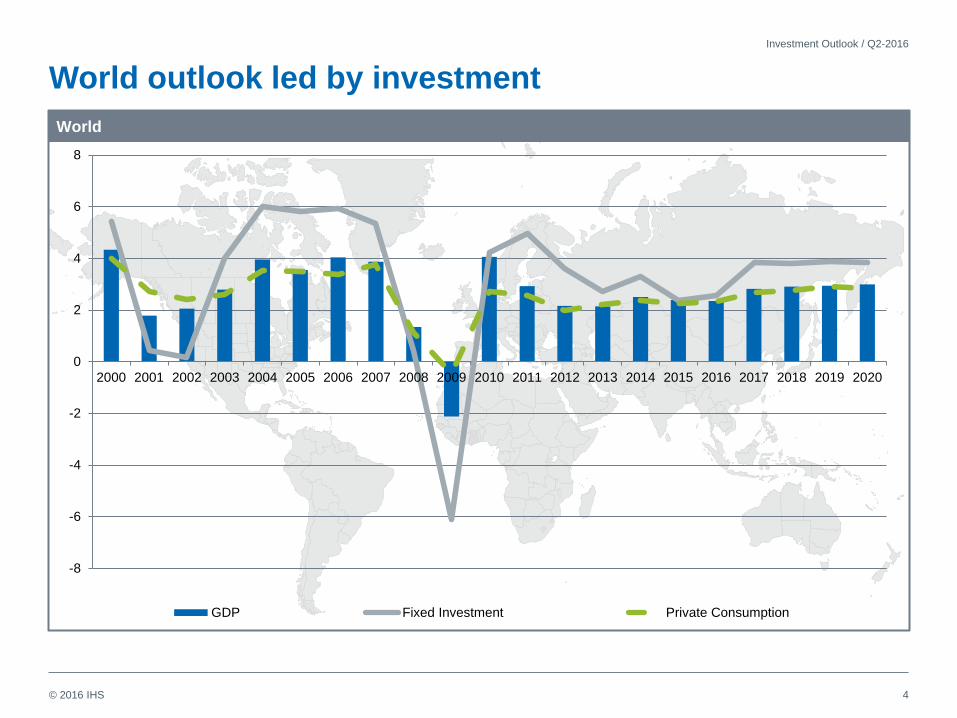
World outlook led by investment
4
Investment Outlook / Q2-2016
-8
-6
-4
-2
0
2
4
6
8
2000 2001 2002 2003 2004 2005 2006 2007 2008 2009 2010 2011 2012 2013 2014 2015 2016 2017 2018 2019 2020
GDP Fixed Investment Private Consumption
World

© 2016 IHS 5
US and China outlook Real growth, annual percent change
Investment Outlook / Q2-2016
Inflection Point
-15
-10
-5
0
5
10
20
00
20
01
20
02
20
03
20
04
20
05
20
06
20
07
20
08
20
09
20
10
20
11
20
12
20
13
20
14
20
15
20
16
20
17
20
18
20
19
20
20
GDP Fixed Investment Private Consumption
United States
0
5
10
15
20
25
20
00
20
01
20
02
20
03
20
04
20
05
20
06
20
07
20
08
20
09
20
10
20
11
20
12
20
13
20
14
20
15
20
16
20
17
20
18
20
19
20
20
GDP Fixed Investment Private Consumption
China

© 2016 IHS
Reversal in fortunes – Global ‘decoupling’
6
Investment Outlook / Q2-2016
World
Benchmark
Bubble size = 2015 CapEx spend
India
Assoc. S.E. Asian Nations
Persian Gulf States
China
Pak., Bang., SL
United States
Sub-Saharan Africa
Japan
Mexico
S. Korea
Western Europe
Canada
Australia/NZ
Russia
Brazil
-10
-8
-6
-4
-2
0
2
4
6
-4 -2 0 2 4 6 8 10 12 14
2000-15 Real CapEx CAGR
De
lta:
20
16
-20
min
us
20
00
-15
Re
al C
apEx
CA
GR
Global CapEx outlook
$600
billion
$4.9
trillion
$3.3
trillion
$3.5
trillion

© 2016 IHS
Services will lead while materials and machinery slow
7
Investment Outlook / Q2-2016
Bubble size = 2015 CapEx spend
Tech Services
Healthcare
Business Services
Communications
Transport, Log, Wholesale
Public
Real Estate
Media
Construction, Materials
Consumer Industries
Chemicals, Plastics, Rubber
Oil and Gas Complex
Industrial Machinery
Financial Services
Motor Vehicles, Parts
Metals and Metal Mining
-6
-5
-4
-3
-2
-1
0
1
2
3
4
5
0 1 2 3 4 5 6 7 8
Sector Rotation Sector Rotation Sector Rotation Sector Rotation
2000-15 Real CapEx CAGR
Delt
a:
2016-2
0 m
inu
s 2
000
-15 C
AG
R
Sector Rotation Sector Rotation Sector Rotation Global CapEx outlook
Computers and Electronics
Water Utilities All Sectors
Benchmark
$4.1
trillion
$750
billion

© 2016 IHS
Risks to forecast
China Hard landing / Domestic imbalances
Pace of financial liberalization
RMB devaluation?
Other Emerging Markets Managing fall in commodity
export revenues, depreciating
curriencies, and high levels of
dollar-denominated debt
Political stability
United States Pace and magnitude of
interest rate hikes
Dollar appreciation
Trajectory of earnings
Europe Flagging recovery
Austerity fatigue
Migration crisis
BREXIT
Russian fiscal situation
Ukraine resolution
Middle East Enduring low oil prices
Conflict / unrest
Saudi to de-peg vs. USD?
Investment Outlook / Q2-2016
8

© 2016 IHS. ALL RIGHTS RESERVED.
Investment
recommendations
Favorable outlook:
Investment Outlook / Q2-2016
9

© 2016 IHS. ALL RIGHTS RESERVED.
Investment
recommendations
Negative outlook:
10
Investment Outlook / Q2-2016

© 2016 IHS
Definitions of regions used in this presentation
11
Investment Outlook / Q2-2016
World Total
(75 Countries) 20 Countries & Regions Countries Comprising the Regions
North America Canada, Mexico, United States
Europe France, Germany, United
Kingdom, Poland, Russia
Nordic Region Denmark, Finland, Norway, Sweden
Remaining Europe Austria, Belgium, Bulgaria, Czech Republic, Greece, Hungary,
Ireland, Italy, Netherlands, Portugal, Romania, Slovak Republic,
Spain, Switzerland, Turkey, Ukraine
Asia Pacific China, India, Japan, South Korea
Australia - New Zealand Australia, New Zealand
Remaining Asia Pacific Bangladesh, Hong Kong, Indonesia, Malaysia, Pakistan,
Philippines, Singapore, Sri Lanka, Taiwan, Thailand, Vietnam
Middle East Middle East Bahrain, Egypt, Iran, Israel, Jordan, Kuwait, Qatar, Saudi Arabia,
United Arab Emirates
Latin America Brazil
Remaining Latin America Argentina, Bolivia, Chile, Colombia, Ecuador, Honduras, Jamaica,
Panama, Peru, Uruguay, Venezuela
Africa Africa Cameroon Kenya, Morocco, Nigeria, Senegal, South Africa,
Tunisia, Zimbabwe

© 2016 IHS
Definitions of sectors used in this presentation
12
Investment Outlook / Q2-2016
19 Sector Composites 95 ISIC (International Standard Industry Classification) Revision 3
1 Agriculture, food, wood, paper
Agriculture (A_B), food and beverages (D15), tobacco (D16), wood products (D20), paper & [ulp (D21)
2 Business Services Business Services (K74)
3 Chemicals, Plastics & Rubber Chemicals excl. Pharma (D24 excl. D2423), Plastics & Rubber (D25)
4 Communication Services Post & Courier Services (I641), Communication Services (I642)
5 Computers & Electronics Computers & Office Machinery (D30), Communication Equipment (D32)
6 Construction, cement & glass Construction (F), glass & products (D261), cement, concrete, lime (D269C), other mineral products (D269O)
7 Consumer Oriented Sectors
Textiles (D17), Wearing Apparel (D18), Leather & Footwear (D19), Ceramic Products (D2691), Domestic
Appliances (D293), Optical & Photographic Equipment (D332), Watches & Clocks (D333), Furniture & Other
Manufacturing (D36), Retail Trade (G50, G52), Private Household
8 Energy Complex Coal Mining (C10), Oil & Gas Mining (C11), Uranium Mining (C12), Refined Petroleum & Nuclear Fuel (D23),
Electricity, Gas & Steam (E40), Pipeline Transport (I603)
9 Government, defense, education Public administration & defense (L), education (M), sanitation, trade organizations
10 IT services and R&D Computing services (K72), research & development (K73)
11 Machinery for Industry General and Special Industrial Machinery (D291, D292), Electrical Machinery (D31)
12 Media & Entertainment Hotels & Restaurants (H), Recreational, Cultural & Sporting (O92), Printing & Publishing (D22)
13 Medical & Healthcare Pharma: Drugs and Medicines (D2423), Medical & Measuring Equipment (D331), Healthcare Services (N)
14 Metals & Metal Mining Mining of Metals & Quarry (C13, C14), Basic Metals (D27), Fabricated Metal Products (D28)
15 Motor Vehicles, Parts, Motorcycles Motor Vehicles, Trailers and Parts (D34), Motorcycles, Bicycles, Transp. Equip. (D359)
16 Financial Intermediation Financial Intermediation (J), Leasing of Machinery & Equipment (K71)
17 Real Estate Real Estate (K70)
18 Transportation & logistics Transportation services (I60-I63, excl. I603) and transport equipment (D351-D353), wholesale (G51)
19 Water Utilities & Recycling Recycling (D37), Water Supply (E41)