Embed Size (px)
Citation preview

Report
India
Rome, 2020
FRA 2020 report, India
2
FAO has been monitoring the world's forests at 5 to 10 year intervals since 1946. The Global Forest Resources Assessments (FRA) are now produced every five years in an attempt to provide a consistent approach todescribing the world's forests and how they are changing. The FRA is a country-driven process and the assessments are based on reports prepared by officially nominated National Correspondents. If a report is notavailable, the FRA Secretariat prepares a desk study using earlier reports, existing information and/or remote sensing based analysis.
This document was generated automatically using the report made available as a contribution to the FAO Global Forest Resources Assessment 2020, and submitted to FAO as an official government document. Thecontent and the views expressed in this report are the responsibility of the entity submitting the report to FAO. FAO cannot be held responsible for any use made of the information contained in this document.

FRA 2020 report, India
3
TABLE OF CONTENTS
Introduction
1. Forest extent, characteristics and changes
2. Forest growing stock, biomass and carbon
3. Forest designation and management
4. Forest ownership and management rights
5. Forest disturbances
6. Forest policy and legislation
7. Employment, education and NWFP
8. Sustainable Development Goal 15
FRA 2020 report, India
4
IntroductionReport preparation and contact personsThe present report was prepared by the following person(s)
Name Role Email Tables
Introductory textForest Survey of India (FSI) is a national organisation under the Ministry of Environment, Forests and Climate Change, Government of India. The organisation has been mandated to assess the India’s forest resource periodically. Forest cover andits characteristics are assessed every two year using remote sensing technology with wall to wall approach. Growing stock and its distribution into diameter class and species, biomass stock and carbon stock are estimated through NationalForest Inventory ( NFI ) using sample based approach. During NFI the field parties also observe the incidence of forest fire ocularly within and around sample plot in two ha area. Detection of forest fire through remote sensing technology, webbased rapid response system, has also started sine November 2004. The results of FSI are published in its biennial report named as India State of Forest Report. The report contains information on forest cover at the national level and state leveland changes in forest cover as comapred to the previous assesment. The information on mangrove cover is separately presented. In addition, the information on tree cover, growing stock in forest and outside forest, carbon stock in country'sforest is also publised in the report. Since 1987, 15 such reports have been published which forms the most reliable basis of information about India’s forest resource. The most of the tables presented in this report are mainly based on the FSI’sstudies.
The Indian Council of Forestry Research and Education (ICFRE), an autonomus national organisation mandated for forestry research and education has been given the responsibility by the Ministry of Environment and Forests to produce reports onforestry statistics of India periodically. Such reports are compiled by collecting data from the state forest departments. Forestry Statistics India of ICFRE has formed the second important source of information for this report. In addition, ForestSector Report India, 2010 has also been consulted in preparation of the report.
The information on protetective network has been taken from Wildlife Institute of India who maintains the data related to wildlife.
Prakash Collaborator [email protected] All
Subhash Ashutosh National correspondent [email protected] All

FRA 2020 report, India
5
1 Forest extent, characteristics and changes1a Extent of forest and other wooded landNational data
Data sources
1990
References
Methods used
Additional comments
State of Forest Report 1993
Full-cover forest/vegetation maps
The State of Forest Report 1993 is the fourth assessment of the forest cover of India based on the visual and digital interpretation of the satellite data pertaining to the period 1989-91 on a scale of1:250,000. The Landsat TM with spatial resolution of 30 m was used for the interpretation.
2000
References
Methods used
Additional comments
State of Forest Report 2001 revised in SFR 2005.Further revised as per FRL.
Full-cover forest/vegetation maps
SFR 2001 is the 8th report in the sequence. This is the first time that forest cover of the whole country has been assess digitally at 1:50,000 scale.
2005
References
Methods used
Additional comments
State of Forest Report 2005. Further revised as per FRL/BUR-2.
Full-cover forest/vegetation maps
SFR 2005 is the 10th assessment of the Forest Cover. This assessment was carried out using Indian Remote Sensing Satellite Data IRS-1D LISS-III with spatial resolution of 23.5 meter. The modeof interpretation was digital and the scale of mapping was 1:50,000
2010
References
Methods used
Additional comments
National forest inventory data used for ISFR 2013 has been taken to derive the information under different categories. The proportion of VDF, MDF and Open Forest has been derived from NFI dataused for ISFR 2013
National Forest Inventory
ISFR 2013 is the 13th biennial report. The assessment was carried out using Indian Remote Sensing Satellite Data IRS P6 -LISS-III and IRS-Resourcesat2 -LISS-III with a spatial resolution of 23.5meter. The mode of interpretation was digital and scale of mapping was 1:50,000.
2015
References
Methods used
Additional comments
India State of Forest Report (ISFR) 2017
Full-cover forest/vegetation maps
ISFR 2017 is the 15th biennial report. The assessment was carried out using Indian Remote Sensing Satellite Data IRS P6 -LISS-III and IRS-Resourcesat2 -LISS-III with a spatial resolution of 23.5meter. The mode of interpretation was digital and scale of mapping was 1:50,000.

FRA 2020 report, India
6
Classifications and definitions
1990
National class Definition
Dense Forest All lands with tree cover of canopy density of 40 % and above
Open Forest All lands with tree cover of canopy density between 10 to 40 %
Mangrove Salt tolerance forest eco-system found mainly in tropical ans sub tropical inter tidal regions
Scrub All land with poor tree growth mainly of small or stunted trees having canopy density less then 10%
Non Forest Any area not included in the above classes
2000
National class Definition
Dense Forest All lands with tree cover of canopy density of 40 % and above
Open Forest All lands with tree cover of canopy density between 10 to 40 %
Scrub All land with poor tree growth mainly of small or stunted trees having canopy density less then 10%
Non Forest Any area not included in the above classes
2005
National class Definition
Very Dense Forest All lands, with a forest cover with canopy density of 70 percent and more.
Moderately Dense Forest All lands, with a forest cover with canopy density between 40-70 percent.
Open Forest All lands, with a forest cover with canopy density between 10-40 percent.
ScrubAll lands, generally in and around forest areas, having bushes and or poor tree growth chiefly small or stunted trees with canopy densityless than 10 percent.
Non forest area All lands excluding above categories including tree cover.
2010 National class Definition
Very Dense Forest All lands, with a forest cover with canopy density of 70 percent and more.
Moderately Dense Forest All lands, with a forest cover with canopy density between 40-70 percent.
Open Forest

FRA 2020 report, India
7
Original data and reclassification
All lands, with a forest cover with canopy density between 10-40 percent.
ScrubAll lands, generally in and around forest areas, having bushes and or poor tree growth chiefly small or stunted trees with canopy densityless than 10 percent.
Non forest area All lands excluding above categories including tree cover.
2015
National class Definition
Very Dense Forest All lands, with a forest cover with canopy density of 70 percent and more.
Moderately Dense Forest All lands, with a forest cover with canopy density between 40-70 percent.
Open Forest All lands, with a forest cover with canopy density between 10-40 percent.
ScrubAll lands, generally in and around forest areas, having bushes and or poor tree growth chiefly small or stunted trees with canopy densityless than 10 percent.
Non forest area All lands excluding above categories including tree cover.
1990
Classifications and definitions FRA classes
Class Area (1000 ha) Forest Other wooded land Other land
Dense Forest
Open Forest
Mangrove
Scrub
Non Forest
Total
38 514.00 100.00 % 0.00 % 0.00 %
24 999.00 100.00 % 0.00 % 0.00 %
425.00 100.00 % 0.00 % 0.00 %
5 894.00 0.00 % 100.00 % 0.00 %
258 821.00 0.00 % 0.00 % 100.00 %
328 653.00 63 938.00 5 894.00 258 821.00
2000 Classifications and definitions FRA classes
Class Area (1000 ha) Forest Other wooded land Other land
Dense Forest
Open Forest
40 847.00 100.00 % 0.00 % 0.00 %
26 744.00 100.00 % 0.00 % 0.00 %

FRA 2020 report, India
8
Scrub
Non Forest
Total
4 732.00 0.00 % 100.00 % 0.00 %
229 766.00 0.00 % 0.00 % 100.00 %
302 089.00 67 591.00 4 732.00 229 766.00
2005
Classifications and definitions FRA classes
Class Area (1000 ha) Forest Other wooded land Other land
Very Dense Forest
Moderately Dense Forest
Open Forest
Scrub
Non forest area
Total
5 568.00 100.00 % 0.00 % 0.00 %
33 940.00 100.00 % 0.00 % 0.00 %
29 575.00 100.00 % 0.00 % 0.00 %
3 848.00 0.00 % 100.00 % 0.00 %
225 763.00 0.00 % 0.00 % 100.00 %
298 694.00 69 083.00 3 848.00 225 763.00
2010
Classifications and definitions FRA classes
Class Area (1000 ha) Forest Other wooded land Other land
Very Dense Forest
Moderately Dense Forest
Open Forest
Scrub
Non forest area
Total
8 315.00 100.00 % 0.00 % 0.00 %
31 741.00 100.00 % 0.00 % 0.00 %
29 440.00 100.00 % 0.00 % 0.00 %
4 138.00 0.00 % 100.00 % 0.00 %
223 391.00 0.00 % 0.00 % 100.00 %
297 025.00 69 496.00 4 138.00 223 391.00
2015 Classifications and definitions FRA classes
Class Area (1000 ha) Forest Other wooded land Other land
Very Dense Forest
Moderately Dense Forest
Open Forest
9 816.00 100.00 % 0.00 % 0.00 %
30 832.00 100.00 % 0.00 % 0.00 %
30 180.00 100.00 % 0.00 % 0.00 %

FRA 2020 report, India
9
Scrub
Non forest area
Total
4 598.00 0.00 % 100.00 % 0.00 %
221 915.00 0.00 % 0.00 % 100.00 %
297 341.00 70 828.00 4 598.00 221 915.00

FRA 2020 report, India
10
Forest Other wooded land1000 ha
0
20 000
40 000
60 000
1990 1995 2000 2005 2010 2015 2020
FRA 2020 report, India
11
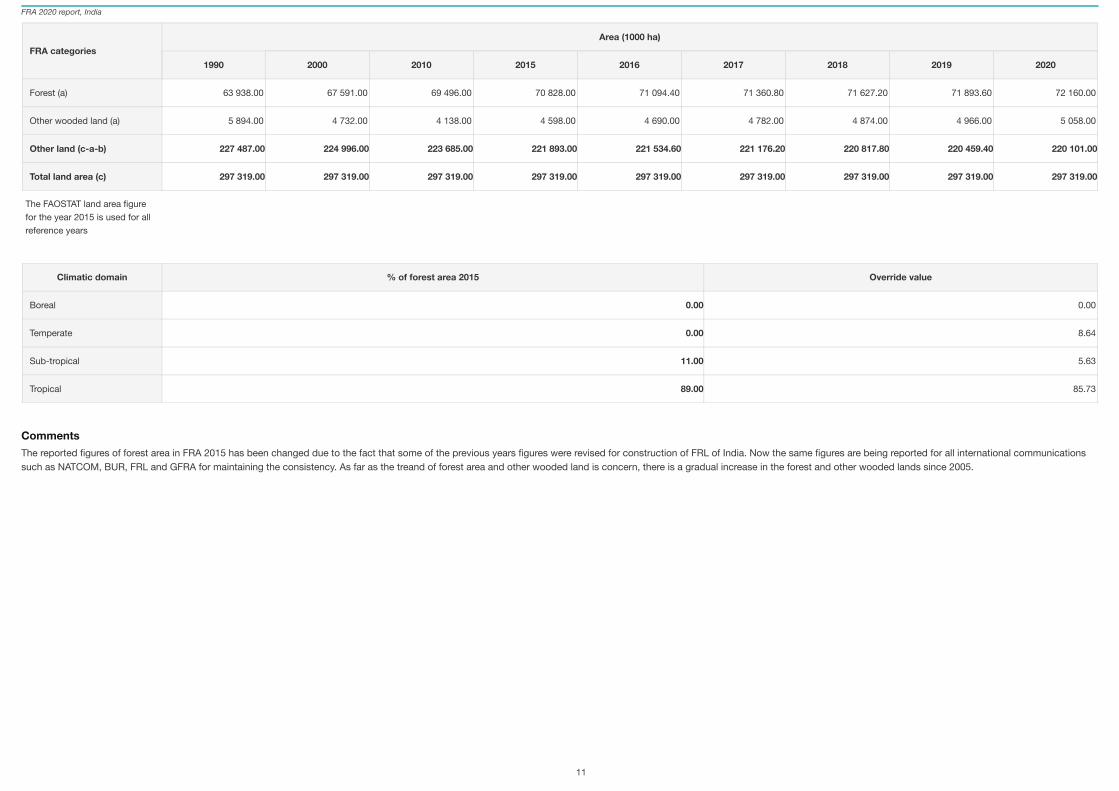
CommentsThe reported figures of forest area in FRA 2015 has been changed due to the fact that some of the previous years figures were revised for construction of FRL of India. Now the same figures are being reported for all international communicationssuch as NATCOM, BUR, FRL and GFRA for maintaining the consistency. As far as the treand of forest area and other wooded land is concern, there is a gradual increase in the forest and other wooded lands since 2005.
FRA categoriesArea (1000 ha)
1990 2000 2010 2015 2016 2017 2018 2019 2020
Forest (a)
Other wooded land (a)
Other land (c-a-b)
Total land area (c)
The FAOSTAT land area figurefor the year 2015 is used for allreference years
63 938.00 67 591.00 69 496.00 70 828.00 71 094.40 71 360.80 71 627.20 71 893.60 72 160.00
5 894.00 4 732.00 4 138.00 4 598.00 4 690.00 4 782.00 4 874.00 4 966.00 5 058.00
227 487.00 224 996.00 223 685.00 221 893.00 221 534.60 221 176.20 220 817.80 220 459.40 220 101.00
297 319.00 297 319.00 297 319.00 297 319.00 297 319.00 297 319.00 297 319.00 297 319.00 297 319.00
Climatic domain % of forest area 2015 Override value
Boreal
Temperate
Sub-tropical
Tropical
0.00 0.00
0.00 8.64
11.00 5.63
89.00 85.73

FRA 2020 report, India
12
1b Forest characteristicsNational Data
Data sources + type of data source eg NFI, etcThe data source for this table is NFI data. The area under three categoreis namely naturally regenerated, plantation forest and other planted forest has been taken from the NFI data base for the year 2010 and 2015. For previous years (1990 &2000), the figures already reported in earlier FRA has been taken. For the year 2016 to 2020, the proportions of these three categories as obatained for the year 2015 has been used.
National classification and definitionsThe definition and classification are same as is being used by FRA.
Original dataOriginal data has been taken from NFI database
Analysis and processing of national data
Estimation and forecastingFor the year 2016 to 2020, the proportions of three categories (naturally regenerated, plantation forest and planted forest as obatained for the year 2015 has been used. For year 1990, the area under planted forest as reported in the earlier FRAhas been taken. The estimates of other planted forest for 1990 has been assued to be same as taken for 2000. The area of introduced species in planted forest has been estimated from the plantation data as given in SFR 1999. The sameproportion has been applied to other years.
Reclassification into FRA 2020 categoriesReclassification is not required.
FRA 2020 report, India
13
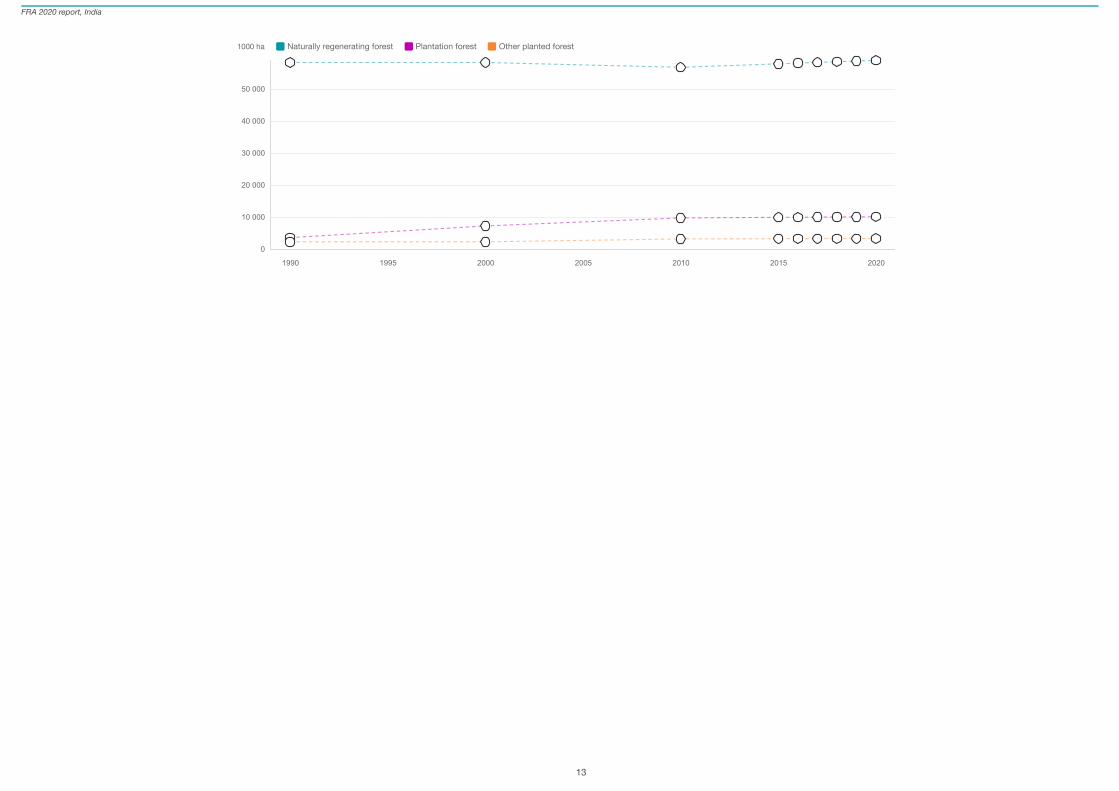
Naturally regenerating forest Plantation forest Other planted forest1000 ha
0
10 000
20 000
30 000
40 000
50 000
1990 1995 2000 2005 2010 2015 2020

FRA 2020 report, India
14
Comments
FRA categoriesForest area (1000 ha)
1990 2000 2010 2015 2016 2017 2018 2019 2020
Naturally regenerating forest(a)
Planted forest (b)
Plantation forest
…of which introduced species
Other planted forest
Total (a+b)
Total forest area
58 223.00 58 223.00 56 717.31 57 804.00 58 022.00 58 239.21 58 456.63 58 674.00 58 891.00
5 715.00 9 368.00 12 778.69 13 024.00 13 072.00 13 121.59 13 170.57 13 219.60 13 269.00
3 514.00 7 167.00 9 668.06 9 854.00 9 890.00 9 927.49 9 964.55 10 002.00 10 039.00
460.00 939.00 1 266.00 1 291.00 1 296.00 1 300.00 1 305.00 1 310.00 1 315.00
2 201.00 2 201.00 3 110.63 3 170.00 3 182.00 3 194.10 3 206.02 3 217.60 3 230.00
63 938.00 67 591.00 69 496.00 70 828.00 71 094.00 71 360.80 71 627.20 71 893.60 72 160.00
63 938.00 67 591.00 69 496.00 70 828.00 71 094.40 71 360.80 71 627.20 71 893.60 72 160.00

FRA 2020 report, India
15
1c Primary forest and special forest categoriesNational Data
Data sources + type of data source eg NFI, etcThe data source for Bamboo and temporarily unstocked/recently regenerated is availabe from NFI. The area under mangove has been obtained from remote sensing classification. The area under Rubber has been obtained from Rubber board.
National classification and definitionsNational definition and classificatiodn is same as FRA.
Original dataoriginal data has been taken from NFI (bamboo and recently regenerated stock), Forestt Cover mapping (Mangrove) and Rubber (Rubber board)
Analysis and processing of national data
Estimation and forecastingThe estimates for 1990 has been worked out with the growth of 2000 and 2005. For the year 2005 onwards till 2017, the inforamtion is available from rubber board of India. For forecasting for the year 2020, aveage increase for the last ten years(from 2007 to 2017 has been taken).
Reclassification into FRA 2020 categoriesSince national and FRA clasification are same, no reclassfication is required.

FRA 2020 report, India
16
Comments
FRA categoriesArea (1000 ha)
1990 2000 2010 2015 2020
Primary forest
Temporarily unstocked and/orrecently regenerated
Bamboos
Mangroves
Rubber wood
15 701.00 15 701.00 15 701.00 15 701.00 15 701.00
3 982.00 4 073.00 4 678.00 4 015.00 4 476.00
7 042.00 10 500.00 13 958.00 15 687.00 17 416.00
426.00 448.00 463.00 492.00 521.00
502.00 563.00 712.00 811.00 882.00

FRA 2020 report, India
17
1d Annual forest expansion, deforestation and net changeNational Data
Data sources + type of data source eg NFI, etcThe source of data for calculating the annual forest expansion and deforestation is forest cover assessment of the country based on wall to wall mapping using satellite data. The chnage matrix given in ISFR with respect to previous assessmenthas been used for calculating the annual forest expansion and deforestation.
National classification and definitionsnational classifications and definitions are same as used in table 1a Extentof forest and other
Original dataThe change matrix given in chapter 2 : Forest Cover in differnt SFRs/ISFRs has been taken as the original data. The differnt reports are given in FSI website (www.fsi.nic.in)
Analysis and processing of national data
Estimation and forecastingThe data beyond 2015 has been repeated.
Reclassification into FRA 2020 categoriesReclassification is not required.

FRA 2020 report, India
18
Comments
FRA categoriesArea (1000 ha/year)
1990-2000 2000-2010 2010-2015 2015-2020
Forest expansion (a)
…of which afforestation
…of which natural expansion
Deforestation (b)
Forest area net change (a-b)
749.30 820.00 934.80 934.80
384.00 629.50 668.40 668.40
365.30 190.50 266.40 266.40

FRA 2020 report, India
19
1e Annual reforestationNational Data
Data sources + type of data source eg NFI, etcSeperate inforamtion is not availabe on reforestation
National classification and definitions-
Original data-
Analysis and processing of national data
Estimation and forecasting-
Reclassification into FRA 2020 categories-

FRA 2020 report, India
20
Comments
FRA categoriesArea (1000 ha/year)
1990-2000 2000-2010 2010-2015 2015-2020
Reforestation

FRA 2020 report, India
21
1f Other land with tree coverNational Data
Data sources + type of data source eg NFI, etcThe area information under agroforstry and urban setting is available from NFI. This inforamtion is availabe for 2010 and 2015 from ISFR 2013 and 2017 respectively. For other categories, separate information is not available. For deriving theestimates for the year 1990, 2000 and 2020, the average of agroforestry and trees in urban setting with total other lands for the year 2010 and 2015 has been taken.
National classification and definitionsThe national classfication and definitions is the same as that of FRA.
Original dataThe original data has been taken from NFI database used for ISFR 2013 and 2017
Analysis and processing of national data
Estimation and forecastingFor estimation back and forth, the ratio of area under agro-forestry and urban with that of total land area for the year 2010 and 2015 has been taken.
Reclassification into FRA 2020 categoriesAs national classification is same as that of FRA, no reclassfication is required.
FRA 2020 report, India
22
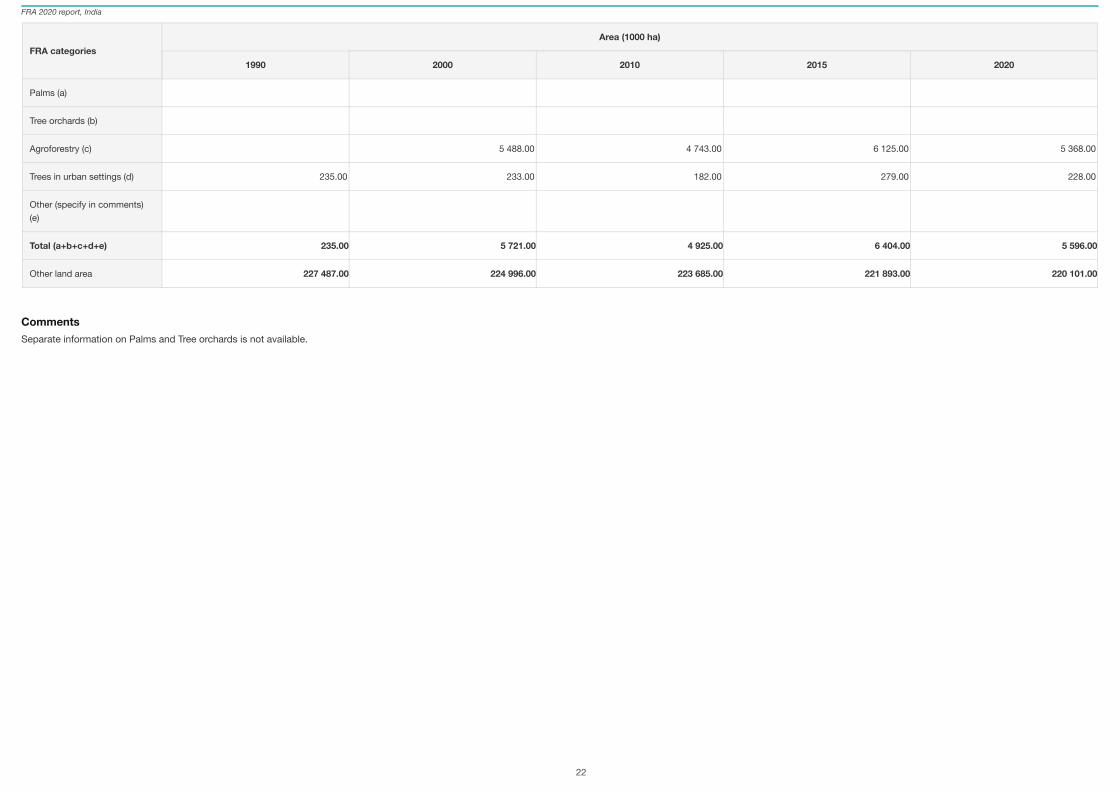
CommentsSeparate information on Palms and Tree orchards is not available.
FRA categoriesArea (1000 ha)
1990 2000 2010 2015 2020
Palms (a)
Tree orchards (b)
Agroforestry (c)
Trees in urban settings (d)
Other (specify in comments)(e)
Total (a+b+c+d+e)
Other land area
5 488.00 4 743.00 6 125.00 5 368.00
235.00 233.00 182.00 279.00 228.00
235.00 5 721.00 4 925.00 6 404.00 5 596.00
227 487.00 224 996.00 223 685.00 221 893.00 220 101.00

FRA 2020 report, India
23
2 Forest growing stock, biomass and carbon2a Growing stockNational Data
Data sources + type of data source eg NFI, etcThe data source is NFI. The information for the year 2010 and 2015 has been obtained from NFI.
National classification and definitionsThe national classification and definition is the same as is being used by FRA.;
Original dataThe original data has been taken from NFI database. NFI data base is a RDBMS which store all plot level inventory data in several tables. The data is processed using a data processing software developed by FSI for processing of data. The datarequired for reporting to FRA 2020 has been derived from the data base. it is not possible to reporoduce the data base here. However, if reviewers want any specific data or clarification, FSI will be happy to provide the same.
Analysis and processing of national data
Estimation and forecastingThe growing stock of naturally regenertaed forest, plantation forest and planted forest for the year 2010 and 2015 has been taken from NFI. For estiamtion of gorowing stock for the year 2016 to 2020, the annual average change between 2010 and2015 has been taken. The breakup of the total growing stock into difffernt categories has been taken in the same proportion as taken for 2015. The growing stock for the year 2000 has also been revised due to change in forest area. The proportionof the total growing stock has been taken in the same proportion as that of 2010.
Reclassification into FRA 2020 categoriesAs FRA and national classification are same, so reclassification is required.

FRA 2020 report, India
24
CommentsThe growing stock m3/ha for the plantation forest for the year 2000 is less than that of 1990, though the area of plantation foerst has increased almost double during the same period. The total growing stock of the plantation forest has increasedin 2000 as compared to 1990. However, the per hectare figure has decreased because the area has doubled and the younger plants has less volume.
FRA categoriesGrowing stock m³/ha (over bark)
1990 2000 2010 2015 2016 2017 2018 2019 2020
Naturally regenerating forest
Planted forest
…of which plantation forest
…of which other planted forest
Forest
Other wooded land
57.50 63.50 68.85 67.99 67.78 67.58 67.38 67.18 66.99
177.60 119.77 93.66 91.52 91.26 90.92 90.73 90.47 90.21
239.33 129.62 101.78 97.42 97.17 96.80 96.54 96.28 96.03
79.05 87.69 68.44 73.19 72.91 72.63 72.68 72.41 72.14
68.24 71.30 73.41 72.32 72.10 71.89 71.68 71.47 71.26
FRA categoriesTotal growing stock (million m³ over bark)
1990 2000 2010 2015 2016 2017 2018 2019 2020
Naturally regenerating forest
Planted forest
…of which plantation forest
…of which other planted forest
Forest
Other wooded land
3 348.00 3 697.00 3 905.11 3 930.00 3 933.00 3 936.00 3 939.00 3 942.00 3 945.00
1 015.00 1 122.00 1 196.89 1 192.00 1 193.00 1 193.00 1 195.00 1 196.00 1 197.00
841.00 929.00 984.00 960.00 961.00 961.00 962.00 963.00 964.00
174.00 193.00 212.89 232.00 232.00 232.00 233.00 233.00 233.00
4 363.00 4 819.00 5 102.00 5 122.00 5 126.00 5 130.00 5 134.00 5 138.00 5 142.00

FRA 2020 report, India
25
2b Growing stock compositionNational Data
Data sources + type of data source eg NFI, etcThe data soure is NFI. The species preference has been taken as per the year 2015.
National classification and definitionsThe national classification and definition is the same as is being used for FRA.
Original dataThe original data is taken from nFI data base for the year 2010 and 2015.
Analysis and processing of national data
Estimation and forecastingThe preference of the species has been taken as per the year 2015. Accoringly, the estimtes of the grwoing stock were worked out for the year 1990, 2000, 2010 and 2015. The estimation for the year 2020 has been done as per the estimtes of2015.
Reclassification into FRA 2020 categoriesAs there is no differnce between national classification and FRA classification, reclassification is not required.

FRA 2020 report, India
26
FRA categories Scientific name Common nameGrowing stock in forest (million m³ over bark)
1990 2000 2010 2015 2020
Native tree species
#1 Ranked in terms of volume
#2 Ranked in terms of volume
#3 Ranked in terms of volume
#4 Ranked in terms of volume
#5 Ranked in terms of volume
#6 Ranked in terms of volume
#7 Ranked in terms of volume
#8 Ranked in terms of volume
#9 Ranked in terms of volume
#10 Ranked in terms ofvolume
Remaining native tree species
Total volume of native tree species
Introduced tree species
#1 Ranked in terms of volume
#2 Ranked in terms of volume
#3 Ranked in terms of volume
#4 Ranked in terms of volume
Shorea robusta Sal 321.00 345.00 545.00 506.00 508.00
Tectona grandis Teak 162.00 173.00 224.00 222.00 223.00
Pinus roxburghii Chir pine 124.00 133.00 142.00 168.00 169.00
Terminalia crenulata Saja 108.00 114.00 140.00 168.00 169.00
Anogeissus latifolia Dhauda 94.00 102.00 130.00 131.00 132.00
Quercus semecarpifolia Kharsu dak 82.00 88.00 75.00 86.00 86.00
Lannea coromandelica Jhingan 54.00 60.00 77.00 84.00 84.00
Pinus excelsa Kail 51.00 57.00 78.00 81.00 81.00
Quercus leucotrichophora Bluejack oak 57.00 64.00 62.00 74.00 74.00
Boswelli serrata Salai 55.00 61.00 71.00 68.00 68.00
3 255.00 3 622.00 3 558.00 3 534.00 3 548.00
4 363.00 4 819.00 5 102.00 5 122.00 5 142.00

FRA 2020 report, India
27
CommentsSeparate information on growing stock of introduced speices is not available..
FRA categories Scientific name Common nameGrowing stock in forest (million m³ over bark)
1990 2000 2010 2015 2020
Native tree species
#5 Ranked in terms of volume
Remaining introduced tree species
Total volume of introduced tree species
Total growing stock
− − − − −
4 363.00 4 819.00 5 102.00 5 122.00 5 142.00

FRA 2020 report, India
28
2c Biomass stockNational Data
Data sources + type of data source eg NFI, etcThe data source for biomass estimation is NFI. The data collected from the NFI plots are converted to biomass using specifica gravity. Further biomass equations have been used for taking into considertion of biomass expansion factor
National classification and definitionsThe national classification and definition is the same as being used for FRA.
Original dataThe original data has been taken from NFI database. NFI data base is a RDBMS which store all plot level inventory data in several tables. The data is processed using a data processing software developed by FSI for processing of data. The datarequired for reporting to FRA 2020 has been derived from the data base. it is not possible to reporoduce the data base here. However, if reviewers want any specific data or clarification, FSI will be happy to provide the same.
Analysis and processing of national data
Estimation and forecastingThe estimation for the year 2016 to 2020 has been done on the basis of informaion ontained for the year 2010 and 2015. The proportion in diffent pools have been carried out as per the estimates of 2015.
Reclassification into FRA 2020 categoriesReclassification is not required as the national and FRA classificatiodn are same.
FRA 2020 report, India
29
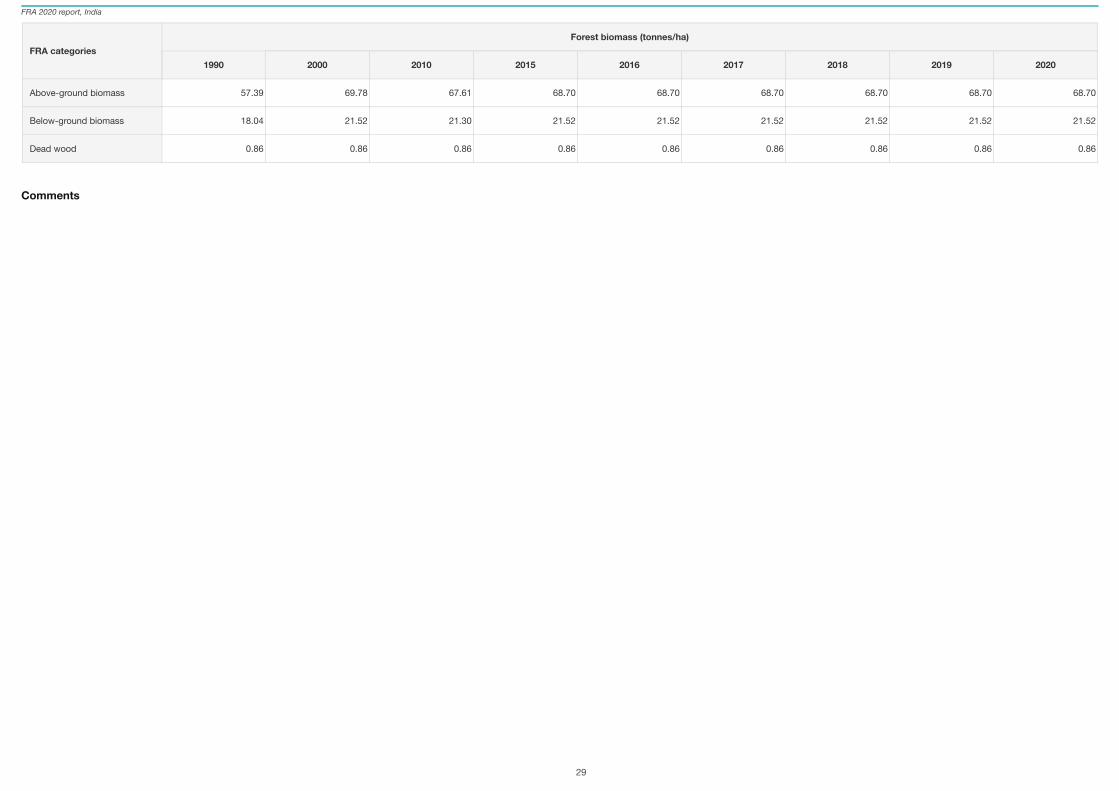
Comments
FRA categoriesForest biomass (tonnes/ha)
1990 2000 2010 2015 2016 2017 2018 2019 2020
Above-ground biomass
Below-ground biomass
Dead wood
57.39 69.78 67.61 68.70 68.70 68.70 68.70 68.70 68.70
18.04 21.52 21.30 21.52 21.52 21.52 21.52 21.52 21.52
0.86 0.86 0.86 0.86 0.86 0.86 0.86 0.86 0.86

FRA 2020 report, India
30
2d Carbon stockNational Data
Data sources + type of data source eg NFI, etcThe data source for carbon estiamtion is NFI data. The carbon estimates for the year 2000 has been reconciled with FRL estimates. The carbon estimates for the year 2010 has been taken as given in BUR-II and estimates of 2015 has been takenfrom ISFR 2017.
National classification and definitionsThe national classification and data is same as being used for FRA
Original dataThe original data is taken from NFI database. The original data has been taken from NFI database. NFI data base is a RDBMS which store all plot level inventory data in several tables. The data is processed using a data processing softwaredeveloped by FSI for processing of data. The data required for reporting to FRA 2020 has been derived from the data base. it is not possible to reporoduce the data base here. However, if reviewers want any specific data or clarification, FSI will behappy to provide the same.
Analysis and processing of national data
Estimation and forecastingThe forcasting for the year 2016 to 2020 has been done using the average annual change obtained from the data of 2010 and 2015. The poolwise estiamtion has also been obtained in the same proportion as of 2015.
Reclassification into FRA 2020 categoriesReclassification is not required as the FRA and national classification are same.

FRA 2020 report, India
31
Comments
FRA categoriesForest carbon (tonnes/ha)
1990 2000 2010 2015 2016 2017 2018 2019 2020
Carbon in above-groundbiomass
Carbon in below-groundbiomass
Carbon in dead wood
Carbon in litter
Soil carbon
26.40 32.10 31.10 31.60 31.60 31.60 31.60 31.60 31.60
8.30 9.90 9.80 9.90 9.90 9.90 9.90 9.90 9.90
0.40 0.40 0.40 0.40 0.40 0.40 0.40 0.40 0.40
1.20 1.80 1.90 1.90 1.90 1.90 1.90 1.90 1.90
58.70 56.90 56.90 56.20 56.20 56.20 56.20 56.20 56.20
Soil depth (cm) used for soilcarbon estimates 30.00

FRA 2020 report, India
32
3 Forest designation and management3a Designated management objectiveNational Data
Data sources + type of data source eg NFI, etcIn India the national forest statistics is not maintained by the designation of forests. However, NFAP, 1999 has provided following broad information on designation of forests for 1993. The NFAP does not provide similar information for scrub areas(other wooded lands) etc.
National data.
National Classification of ForestsArea in million hectares
1993 2000 2004 2011
Protection forests (for biological stabilities) 10
Production forests (for timber Requirements of the country) 15
Social Forests (for meeting daily needs of local communities) 25
Protected Area (National Parks and Sanctuaries etc,) 14 15.4 15.6 16.12
Total Forest 64
Scrub (Other Wooded Lands)
National classification and definitionsThe NFAP (1999) classifies and defines forests based on designation.
Nationalclass
Definition
Protectionforests
Forest managed for biological stabilities and defined as “An area wholly or partly covered with woody growth, managed primarily for its beneficial effects on water, climate or soil rather than for forest products or services, and involving fragile lands,critical soil, catchment areas, steep slopes, and land at high altitudes. Controlled sustainable extraction of non-wood forest products are often allowed in protection forests”
Productionforests
Forests managed for meeting timber requirements of the country and defined as “Forest designated for the sustained production of timber and other forest products, often with protection and/or nature conservation as recognised secondaryobjectives, chosen because of their potential ot provide a yield of high quality timber(or other products) in perpetuity. This category may also include degraded areas appropriate for reforestation. In general usage that term covers natural forests,forest plantations, woodlots, agroforestry plots, homestead forest etc.
SocialForests
Forests managed for meeting daily needs of local communities.
ProtectedArea
Forests managed as Protected Area (National Parks and Sanctuaries etc.) also termed as “Conservation area” in NFAP and defined as “Land such as national parks, reserves, protected areas, or other categories gazetted under the appropriatelegislation.”
Original data
National Classification of ForestsArea in million hectares
1993 2000 2004 2011
Protection forests (for biological stabilities) 10
Production forests (for timber Requirements of the country) 15
Social Forests (for meeting daily needs of local communities) 25

FRA 2020 report, India
33
Protected Area (National Parks and Sanctuaries etc,) 14 15.4 15.6 16.12
Total Forest 64
Scrub (Other Wooded Lands)
Analysis and processing of national data
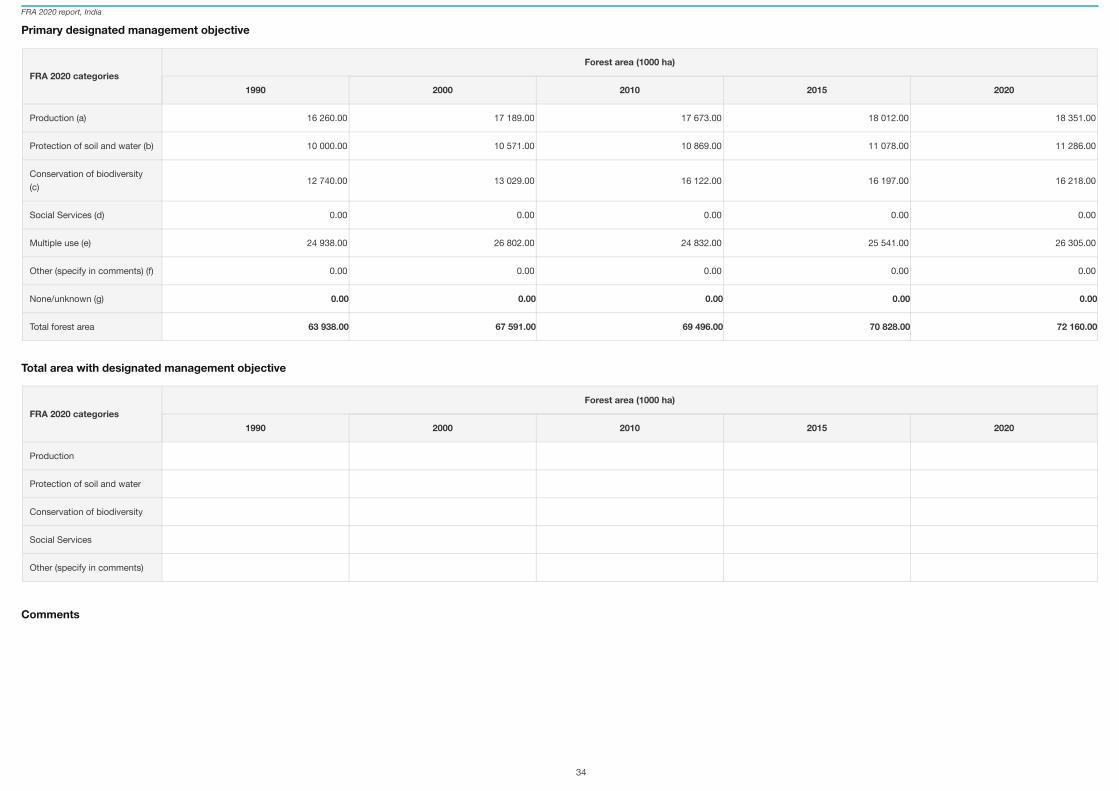
Estimation and forecastingFor different categories under primary designated function, the estimates for 1990, 2000 and 2005 were obtained by distributing total forest area in the same proportion as provided in the NFAP except ‘conservation of biodiversity’. Forconversation of biodiversity category, the actual figures of protected area of 1990, 2000, 2010 and 2015, have been taken and increase/decrease in protected area was compensated by decrease/increase in multiple-use category. For forcastingfor the year 2020, the forest area forcasted as given in table 1a has been used and area under protected networks has been forecasted on the basis of available data for the year 2015 to 2018.
Reclassification into FRA 2020 categoriesreclassfication is not required as the national classes matches with the FRA classes.
FRA 2020 report, India
34
Primary designated management objective
Total area with designated management objective
Comments
FRA 2020 categoriesForest area (1000 ha)
1990 2000 2010 2015 2020
Production (a)
Protection of soil and water (b)
Conservation of biodiversity(c)
Social Services (d)
Multiple use (e)
Other (specify in comments) (f)
None/unknown (g)
Total forest area
16 260.00 17 189.00 17 673.00 18 012.00 18 351.00
10 000.00 10 571.00 10 869.00 11 078.00 11 286.00
12 740.00 13 029.00 16 122.00 16 197.00 16 218.00
0.00 0.00 0.00 0.00 0.00
24 938.00 26 802.00 24 832.00 25 541.00 26 305.00
0.00 0.00 0.00 0.00 0.00
0.00 0.00 0.00 0.00 0.00
63 938.00 67 591.00 69 496.00 70 828.00 72 160.00
FRA 2020 categoriesForest area (1000 ha)
1990 2000 2010 2015 2020
Production
Protection of soil and water
Conservation of biodiversity
Social Services
Other (specify in comments)
FRA 2020 report, India
35
3b Forest area within protected areas and forest area with long-term management plansNational Data
Data sources + type of data source eg NFI, etcThe data source for protected area is Wildlife Institute of India (WII). The institute os maintaing the areas under protected area network. The forest area under long terem management plan has been estimated on the basis of the informtion given inForest Sector Report India 2010. In the report, it has been given that out of total 781 territorial division, 535 divisions have valid working plan. This implying that 69% divisions have management plan. The same ratio has been applied on therecorded forest area under management plan.
National classification and definitionsThe definition and classification is same as being used for FRA.
Original dataOriginal data of protected area is taken from WII. The total recorded forest area has been obtained from State Forest Departments.
Analysis and processing of national data
Estimation and forecastingThe area of protected network upto 2018 is availabe from WII. For 2019 and 2020, the same has been forecasted. The area under long term management plan has been estimated using ratio generated from forest sector report (69%). The entirearea under the PA have the mangement plan.
Reclassification into FRA 2020 categoriesRe-classification is not required as the national and FRA classification are same.

FRA 2020 report, India
36
Comments
FRA categoriesArea (1000 ha)
1990 2000 2010 2015 2016 2017 2018 2019 2020
Forest area within protectedareas
Forest area with long-termforest management plan
…of which in protected areas
10 999.00 11 248.00 13 918.00 13 983.00 13 989.00 13 993.00 13 994.00 13 998.00 14 001.00
53 135.00 53 022.00 53 098.00 52 755.00 52 755.00 52 952.00 52 952.00 52 952.00 52 952.00
10 999.00 11 248.00 13 918.00 13 983.00 13 989.00 13 993.00 13 994.00 13 998.00 14 001.00

FRA 2020 report, India
37
4 Forest ownership and management rights4a Forest ownershipNational Data
Data sources + type of data source eg NFI, etcThe data source is NFI. The area under public ownership has been estimated from NFi database.
National classification and definitionsThe national classification and definition are same as being used by FRA.
Original dataOrginal data is taken from NFI database.
Analysis and processing of national data
Estimation and forecastingThe information for 2010 and 2015 has been taken from NFI.
Reclassification into FRA 2020 categoriesNo reclassfication is required.

FRA 2020 report, India
38
Comments
FRA categoriesForest area (1000 ha)
1990 2000 2010 2015
Private ownership (a)
…of which owned byindividuals
…of which owned by privatebusiness entities andinstitutions
…of which owned by local,tribal and indigenouscommunities
Public ownership (b)
Unknown/other (specify incomments) (c)
Total forest area
9 161.00 11 571.00 12 011.00 13 081.00
54 777.00 56 020.00 57 485.00 57 747.00
0.00 0.00 0.00 0.00
63 938.00 67 591.00 69 496.00 70 828.00

FRA 2020 report, India
39
4b Holder of management rights of public forestsNational Data
Data sources + type of data source eg NFI, etcThe data has been taken from NFI and Forest Sector report India 2010.
National classification and definitionsThe national classfication and definitions are same as is being used by FRA.
Original dataOrginal data has been taken frofm NFI. The area under JFM for the year 2010 has been taken from Forest Sector Report India 2010.
Analysis and processing of national data
Estimation and forecastingThe area under JFMCs has been taken from Forest Sector Report India 2010 for the year 2010. The proportion of the area under JFMCs with total area under public ownership has been calculated for the year 2010 and same ratio has beenapplied for the year 2000 and 2015.
Reclassification into FRA 2020 categoriesReclassfication is not required.

FRA 2020 report, India
40
CommentsThe Joint Forest Management (JFM) is a participatory management regime involving the government and local communities for regeneration of degraded forest through effective protection, sharing of produce and improving the livelihoodopportunities of forest dependent communities. The JFM in india has started in 1990 and have shown very encouraging results. As JFM started in 1990, the area under JFM is not available for the year 1990.
FRA categoriesForest area (1000 ha)
1990 2000 2010 2015
Public Administration (a)
Individuals (b)
Private business entities andinstitutions (c)
Local, tribal and indigenouscommunities (d)
Unknown/other (specify incomments) (e)
Total public ownership
54 777.00 32 001.00 32 838.00 32 988.00
0.00 0.00 0.00 0.00
0.00 0.00 0.00 0.00
0.00 24 019.00 24 647.00 24 759.00
0.00 0.00 0.00 0.00
54 777.00 56 020.00 57 485.00 57 747.00

FRA 2020 report, India
41
5 Forest disturbances5a DisturbancesNational Data
Data sources + type of data source eg NFI, etcNational level data is not available on disturbances
National classification and definitions-
Original dataNational level data is not available on disturbances
Analysis and processing of national data
Estimation and forecastingNational level data is not available on disturbances
Reclassification into FRA 2020 categories-

FRA 2020 report, India
42
Comments
FRA categoriesArea (1000 ha)
2000 2001 2002 2003 2004 2005 2006 2007 2008 2009 2010 2011 2012 2013 2014 2015 2016 2017
Insects (a)
Diseases (b)
Severe weather events (c)
Other (specify in comments)(d)
Total (a+b+c+d)
Total forest area
− − − − − − − − − − − − − − − − − −
67 591.00 − − − − 69 083.00 − − − − 69 496.00 − − − − 70 828.00 71 094.40 71 360.80

FRA 2020 report, India
43
5b Area affected by fireNational Data
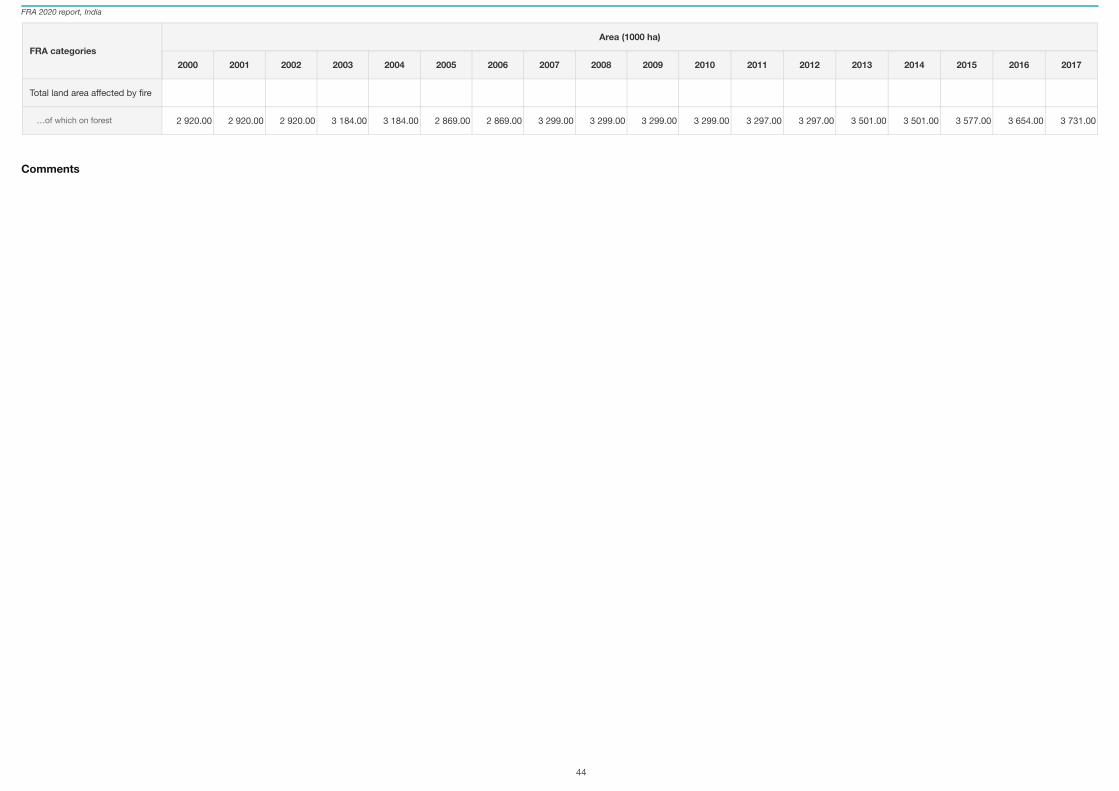
Data sources + type of data source eg NFI, etcThe data source is NFI.
National classification and definitionsThe national classfication and definitios are same as is being used by FRA.
Original dataThe original data has been taken from NFI database.
Analysis and processing of national data
Estimation and forecastingThe area figures of fire has been estimated using NFI database. The area has been estimated under 3 categories namely area affected by mild fire, modetate fire and heavy fire. As the data is taken from NFI, the estimates have been repeated forthe years whcih have been calculated using the NFI data of a particular cycle.
Reclassification into FRA 2020 categoriesReclassfication is not required.
FRA 2020 report, India
44
Comments
FRA categoriesArea (1000 ha)
2000 2001 2002 2003 2004 2005 2006 2007 2008 2009 2010 2011 2012 2013 2014 2015 2016 2017
Total land area affected by fire
…of which on forest 2 920.00 2 920.00 2 920.00 3 184.00 3 184.00 2 869.00 2 869.00 3 299.00 3 299.00 3 299.00 3 299.00 3 297.00 3 297.00 3 501.00 3 501.00 3 577.00 3 654.00 3 731.00

FRA 2020 report, India
45
5c Degraded forest
Comments
Does your country monitor area of degraded forest
If "yes"
What is the national definitionof "Degraded forest"?
Describe the monitoringprocess and results
Yes
The degraded forest is monitored partly based on canopy density. FSI carries out forest cover assessment of the country using remote sensing data on a biennial basis. The forest coverclassification is done in different density classes. The area having less than 10 percent canopy is treated as degraded forest and named as scrub forest..
The monitoring of forest cover is done using satellite data on a biennial basis. The forest cover is classified into different density classes. The change matrix is prepared between two successiveassessment to monitor changes in different canopy density.

FRA 2020 report, India
46
6 Forest policy and legislation6a Policies, Legislation and national platform for stakeholder participation in forest policyNational Data
Data sources + type of data source eg NFI, etcDifferent foresty related rules and regulations enacted time to time
National classification and definitionsThe forest area notified under some forest act are treated as forest area.
Original dataDiffernt notifications

FRA 2020 report, India
47
Comments
Indicate the existence ofBoolean (Yes/No)
National Sub-national
Policies supporting SFM
Legislations and regulationssupporting SFM
Platform that promotes orallows for stakeholderparticipation in forest policydevelopment
Traceability system(s) forwood products
Yes Yes
Yes Yes
Yes Yes
Yes Yes

FRA 2020 report, India
48
6b Area of permanent forest estateNational Data
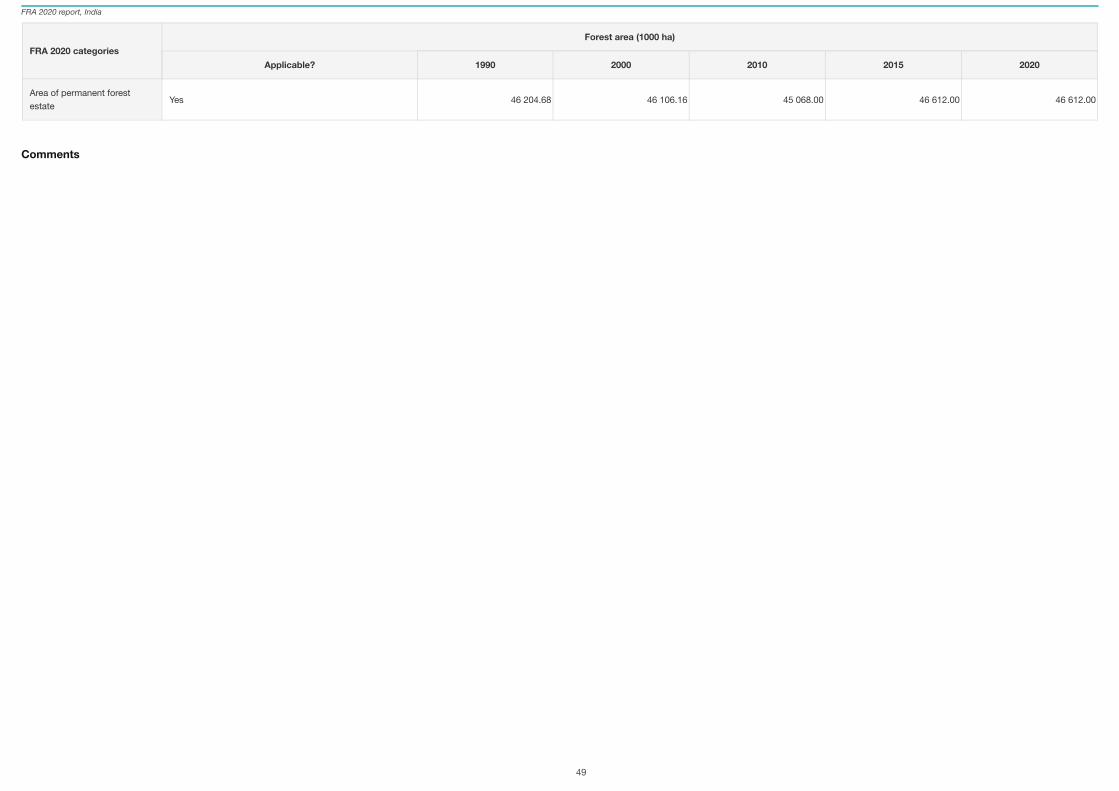
Data sources + type of data source eg NFI, etcData sources NFI Database. During NFI, plot wise information on different Land uses and Legal status (Government or Private) is collected. The same information has been used for calculating area under permanent forest estate
National classification and definitionsNational classification and definition is same as that of FRA.
Original dataNational Forest Inventory database 2002-2016. For the year 1999 & 2000, the propotion of area of permanent forest estate to Recored Forest Area has been taken.
FRA 2020 report, India
49
Comments
FRA 2020 categoriesForest area (1000 ha)
Applicable? 1990 2000 2010 2015 2020
Area of permanent forestestate Yes 46 204.68 46 106.16 45 068.00 46 612.00 46 612.00

FRA 2020 report, India
50
7 Employment, education and NWFP7a Employment in forestry and loggingNational Data
Data sources + type of data source eg NFI, etcThe employment by production and other activities in forest is not reported at the national level. A study done by World Bank (WB, 2000) to estimate the employment potential in forestry sector in India based on 1993 data has formed the mainsource of this reporting. To calculate the employment in 1990, 2000, 2010 and 2015, it has been assumed that the emplyment in the eight forest related emplyment groups of the World Bank Study (WB, 2000) will follow the same trend required forFRA. The national data is availabe only for the thre categories namely wood production, fuel wood and plantation, from which employment per unit of these categories was generated. these ratios have been applied on eight emplyment categoriesof the World Bank. The ratio of logging was applied on foresty & logging, forest services and conservation of forest, the ratio of plantatIon was applied on plantation and ratio of fuelwood was applied on fire wood, fodder, uncultivated materials andhunting etc.
National classification and definitions
National class Definition
Principal “Usual Status”or Principal Activity
The activity on which the person spent relatively more time preceding 365 days.
Employed in PrincipalActivity or Usual Status
A person is “working or employed” if he or she was engaged for a relatively longer time during the past year in one or more work activities (economic activities).
Unemployed in PrincipalActivity or Usual Status
A person is “seeking or available for work or unemployed” if he or she was not working but was seeking or was available for work for a relatively longer time during the past year.
Out of Labour Force (Primary Activities)
A person is “out of labour force” if he or she was engaged in non-economic activities for a relatively longer time of the reference year.
Principal Status“Worker” or “Employed
A person categorised as “worker” or “employed” on the basis of principal status is as principal status “worker” or “employed”.Explanation: Unpaid helpers, who assist in operation of an economic activity in household farm or non farm activities are also considered as workers. It does not include persons engaged in collection of firewood as a non-economicactivity.
Subsidiary Status“Worker” or “Employed”
A person categorised as non worker (unemployed or “out of labour force)”who pursued some economic activity in a subsidiary capacity.Explanation: Unpaid helpers, who assist in operation of an economic activity in household farm or non farm activities are also considered as workers. It does not include persons engaged in collection of firewood as a non-economicactivity.
Total Workers Sum of Principal Status Workers and Subsidiary Status workers under “Usual Status” Classification.
Economic ActivityIt includes (a) all market activities performed for pay or profit that result in production of goods and services for exchange, and(b) selected non market activities like agriculture sector activities that result in production (including gathering of uncultivated crops, forestry, collection of firewood, hunting, fishing etc.) of agriculture produce fro consumption; activitiesrelating to the production of fixed assets for personal use (including houses, roads, wells, machinery, tools etc. for household enterprise and construction of private or community facilities free of charge)
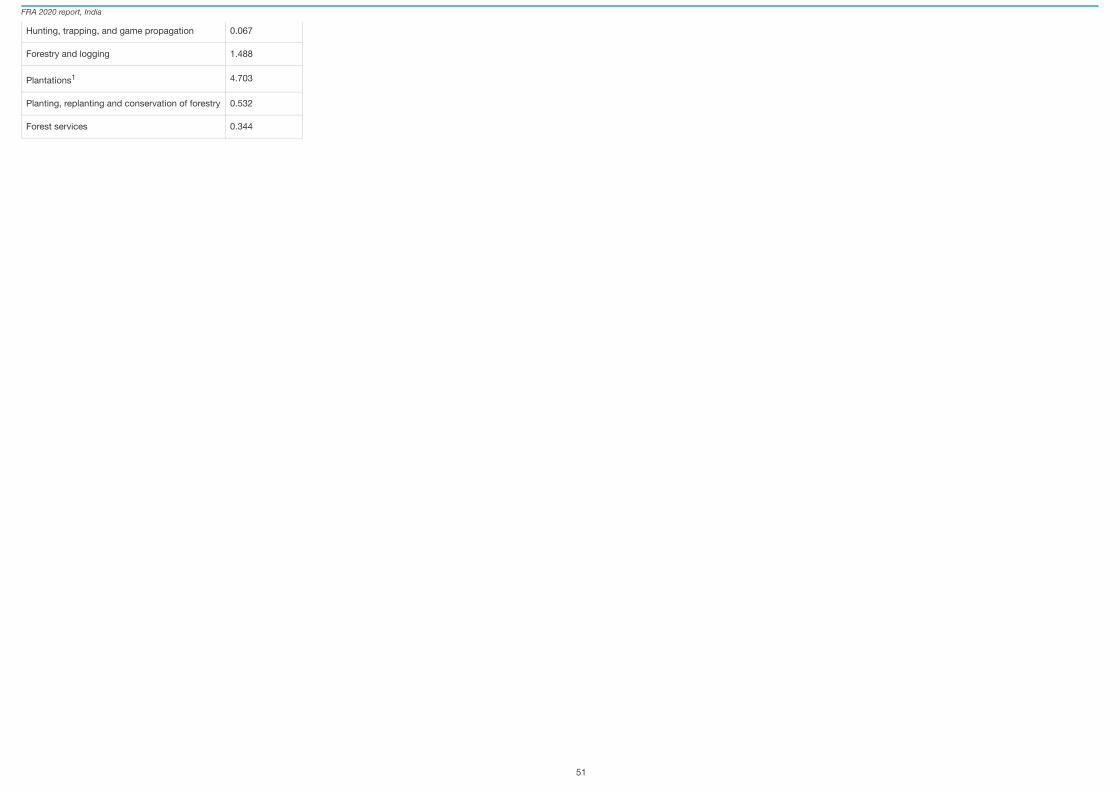
Original datathe original data has been taken from world bank report WB. 2000. India: Alleviating Poverty through Employment. The World Bank. 2000. The following table presents the number of principal and subsidiary forest workers in 1993 in the eight forestrelated categories mentioned in a World Bank Study (WB, 2000).
National ClassNumber in 1993(in millions)
Firewood/fuelwood by exploitation of forest 0.049
Gathering of fodder from forests 0.014
Uncultivated materials in forests 0.300
FRA 2020 report, India
51
Hunting, trapping, and game propagation 0.067
Forestry and logging 1.488
Plantations1 4.703
Planting, replanting and conservation of forestry 0.532
Forest services 0.344
FRA 2020 report, India
52
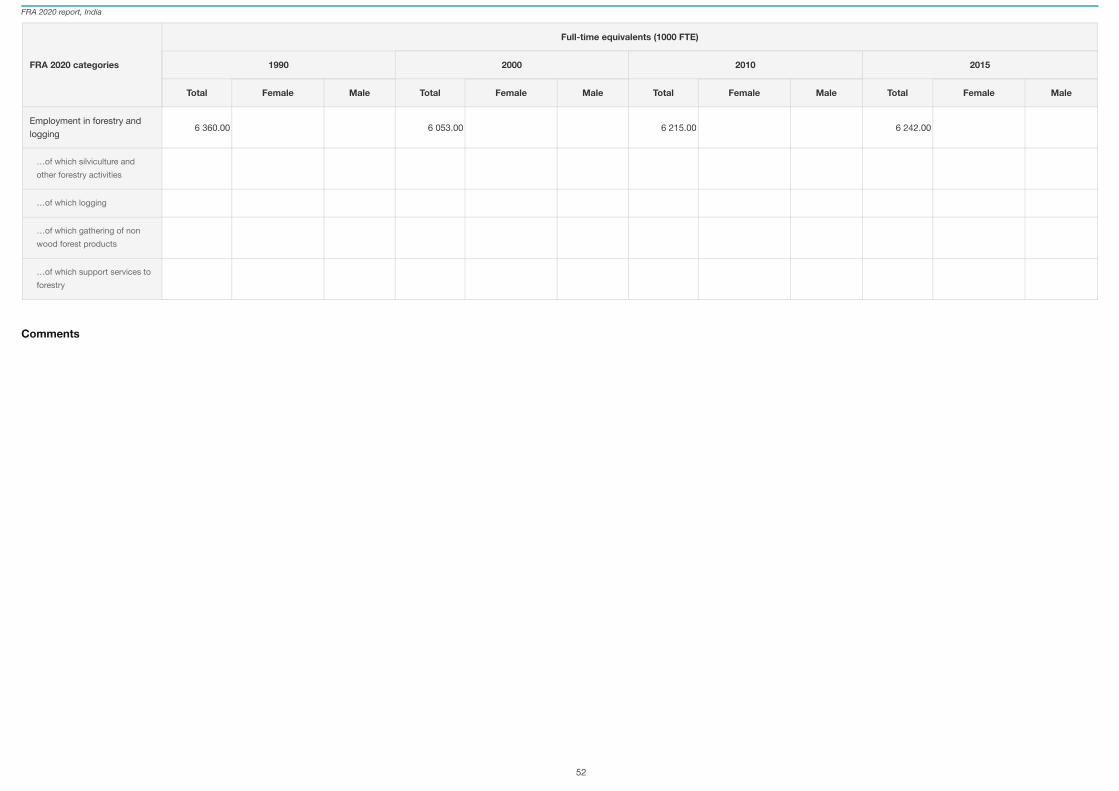
Comments
FRA 2020 categories
Full-time equivalents (1000 FTE)
1990 2000 2010 2015
Total Female Male Total Female Male Total Female Male Total Female Male
Employment in forestry andlogging
…of which silviculture andother forestry activities
…of which logging
…of which gathering of nonwood forest products
…of which support services toforestry
6 360.00 6 053.00 6 215.00 6 242.00

FRA 2020 report, India
53
7b Graduation of students in forest-related educationNational Data
Data sources + type of data source eg NFI, etcThe number of students in MSc and BSc for 2008 along with percentage of female has been compiled from ICFRE. The same figures has been taken for the year 2000 (as reported in FRA 2010) and 2010. The data for the year 1990 and 2015 is notavailabe.
National classification and definitionsSelf explaintery
Original dataThe orignal data has been compiled by ICFRE.

FRA 2020 report, India
54
CommentsThe data is not availabe for the year 1990 and 2015.
FRA 2020 categories
Number of graduated students
1990 2000 2010 2015
Total Female Male Total Female Male Total Female Male Total Female Male
Doctoral degree
Master’s degree
Bachelor’s degree
Technician certificate /diploma
Total
565.00 311.00 254.00 565.00 311.00 254.00
808.00 404.00 404.00 808.00 404.00 404.00
3 000.00 60.00 2 940.00 3 000.00 60.00 2 940.00
4 373.00 775.00 3 598.00 4 373.00 775.00 3 598.00
FRA 2020 report, India
55
7c Non wood forest products removals and value 2015National Data
Data sources + type of data source eg NFI, etcThe data has been compiled by ICFRE from differnt state forest departments. The data on NTFPs is not adequate and there is also issue of coverage. However, whatever data is availabel from the state forest department, the same has been given.
National classification and definitionssame as FRA classification
Original dataoriginal data has been taken from different forest departments.

FRA 2020 report, India
56
Comments
Name of NWFP product Key species Quantity Unit Value (1000 local currency) NWFP category
#1
#2
#3
#4
#5
#6
#7
#8
#9
#10
All other plant products
All other animal products
Total
Tendu Leaves Diospyros melanoxylon 652 677 MT 8 391 470 8 Other plant products
Resins Pinus spp 1 057 MT 893 645 3 Raw material for medicine and aromatic products
Honey 32 852 Qlt 354 507 11 Wild honey and bee wax
Sal Seed Shorea Robusta 128 998 Qlt 151 578 1 Food
Grass 4 196 MT 108 635 2 Fodder
Lac 3 849 Qlt 76 623 8 Other plant products
Gum 12 063 Qlt 72 389 8 Other plant products
Mahua Madhuca latifolia 20 942 Qlt 33 263 1 Food
Amla Embilca officinalis 784 Qlt 3 520 1 Food
Wax 11 Qlt 88 11 Wild honey and bee wax
10 085 718
Name of currency INR

FRA 2020 report, India
57
8 Sustainable Development Goal 158a Sustainable Development Goal 15SDG Indicator 15.1.1 Forest area as proportion of total land area 2015
SDG Indicator 15.2.1 Progress towards sustainable forest management
IndicatorPercent
2000 2010 2015 2016 2017 2018 2019 2020
Forest area as proportion oftotal land area 2015
22.73 23.37 23.82 23.91 24.00 24.09 24.18 24.27
Name of agency responsible Central Statistical Office, Ministry of Statistics & Programme Implementation, Govt of India
Sub-Indicator 1Percent
2000-2010 2010-2015 2015-2016 2016-2017 2017-2018 2018-2019 2019-2020
Forest area annual net changerate
0.28 0.38 0.37 0.37 0.37 0.37 0.37
Name of agency responsible Central Statistical Office, Ministry of Statistics & Programme Implementation, Govt of India
Sub-Indicator 2Forest biomass (tonnes/ha)
2000 2010 2015 2016 2017 2018 2019 2020
Above-ground biomass stockin forest
69.78 67.61 68.70 68.70 68.70 68.70 68.70 68.70
Name of agency responsible Central Statistical Office, Ministry of Statistics & Programme Implementation, Govt of India

FRA 2020 report, India
58
Sub-Indicator 3Percent (2015 forest area baseline)
2000 2010 2015 2016 2017 2018 2019 2020
Proportion of forest arealocated within legallyestablished protected areas
15.88 19.65 19.74 19.75 19.76 19.76 19.76 19.77
Name of agency responsible Central Statistical Office, Ministry of Statistics & Programme Implementation, Govt of India
Sub-Indicator 4Percent (2015 forest area baseline)
2000 2010 2015 2016 2017 2018 2019 2020
Proportion of forest area underlong-term forest managementplan
74.86 74.97 74.48 74.48 74.76 74.76 74.76 74.76
Name of agency responsible Central Statistical Office, Ministry of Statistics & Programme Implementation, Govt of India
Sub-Indicator 5Forest area (1000 ha)
2000 2010 2015 2016 2017 2018 2019 2020
Forest area underindependently verified forestmanagement certificationschemes
0.00 0.68 818.47 754.91 509.93 521.68 − −