Embed Size (px)
Citation preview
Gaikindo International ConferenceR. Choerniadi Tomo
24 July 2019
GLOBAL FUEL TECHNOLOGY
PT Pertamina (Persero)
Page 1
Agenda for Today
1 Depletion of Fossil Fuel for Automotive
2 Alternative Energy to Replace Fossil Fuel
3 Green Fuel as Local Endowment Renewable Energy
Page 2
Depletion of Fossil Fuel for
Automotive?
Page 3
Source:
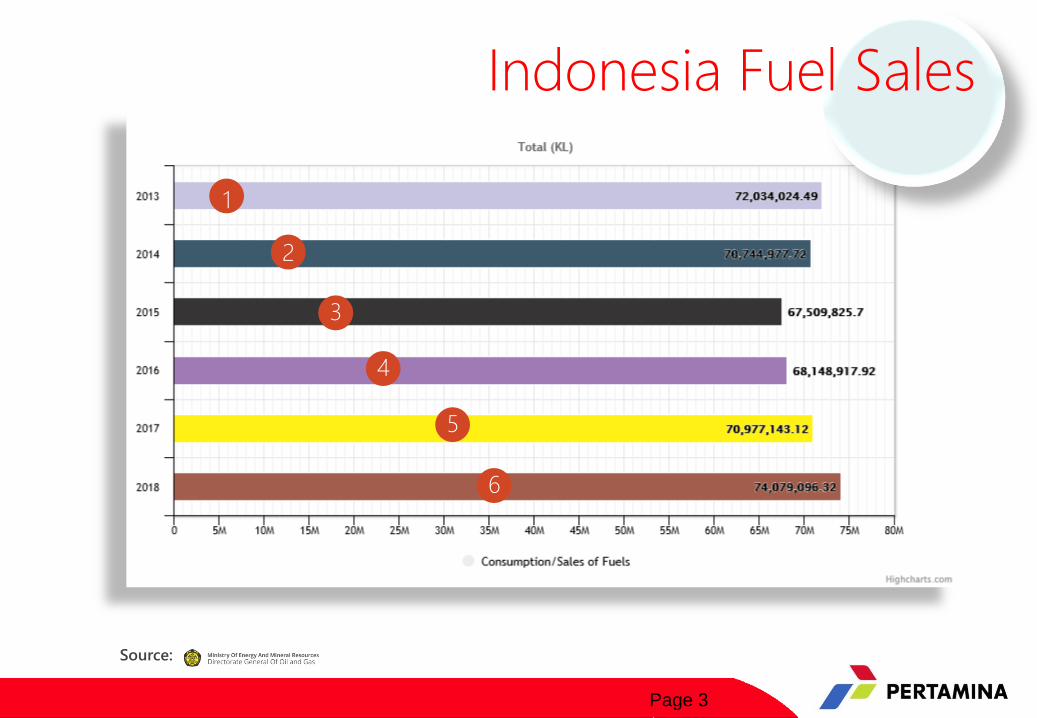
Indonesia Fuel Sales
1
2
3
4
5
6
Page 4
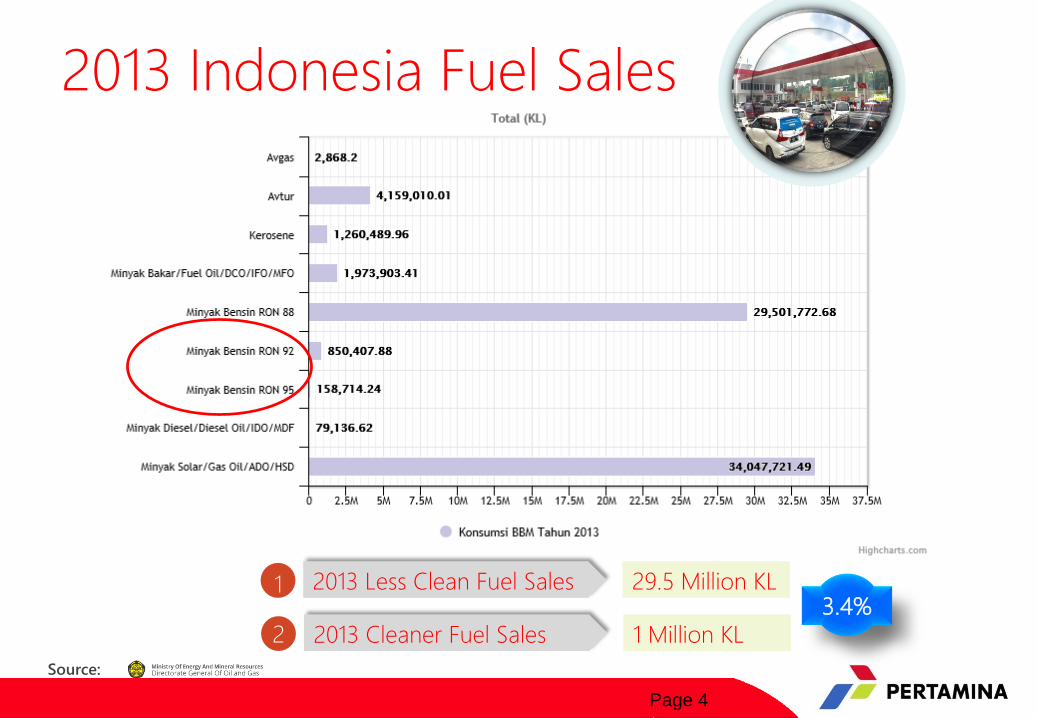
2013 Indonesia Fuel Sales
1
23.4%
Source:
2013 Less Clean Fuel Sales 29.5 Million KL
2013 Cleaner Fuel Sales 1 Million KL
Page 5
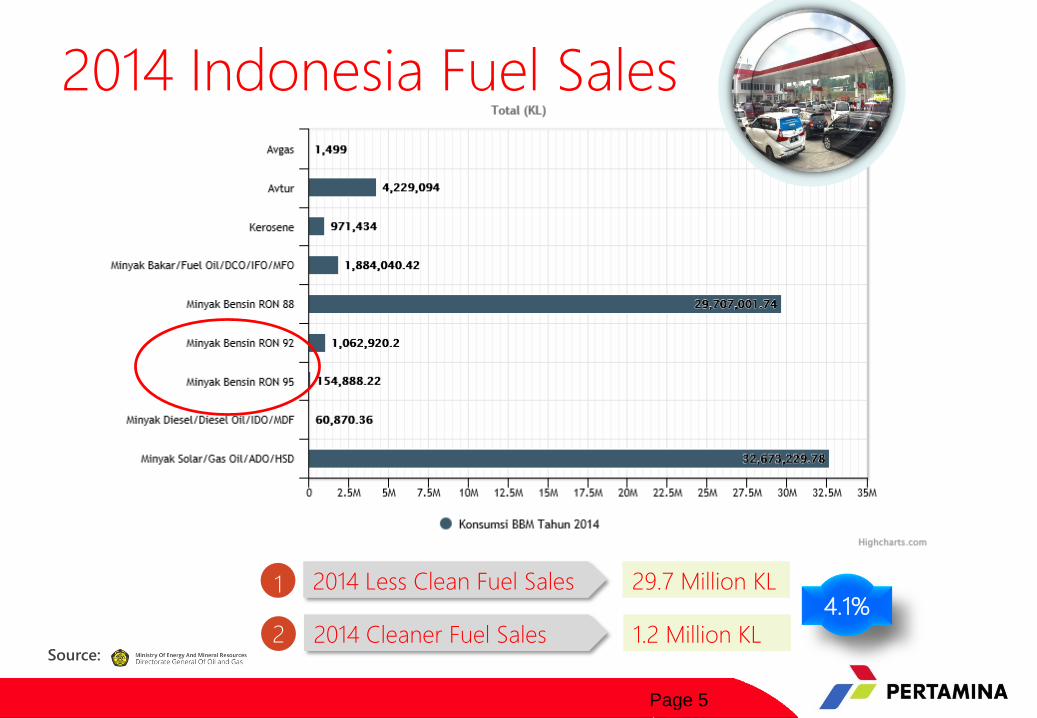
2014 Indonesia Fuel Sales
Source:
1
24.1%
2014 Less Clean Fuel Sales 29.7 Million KL
2014 Cleaner Fuel Sales 1.2 Million KL
Page 6
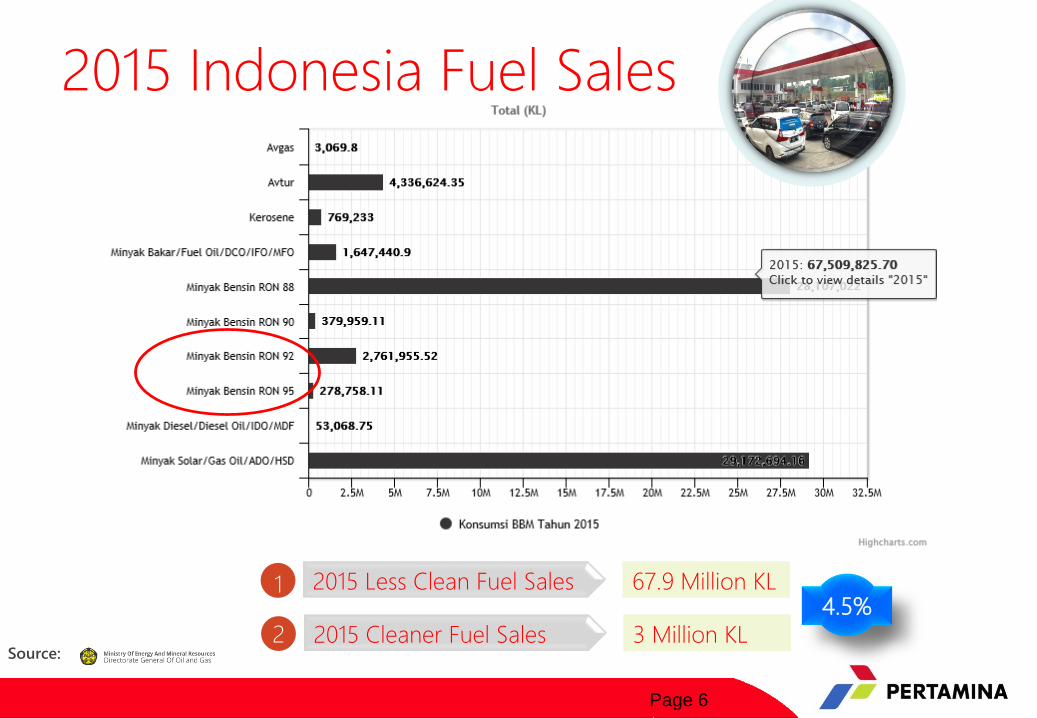
2015 Indonesia Fuel Sales
Source:
1
24.5%
2015 Less Clean Fuel Sales 67.9 Million KL
2015 Cleaner Fuel Sales 3 Million KL
Page 7
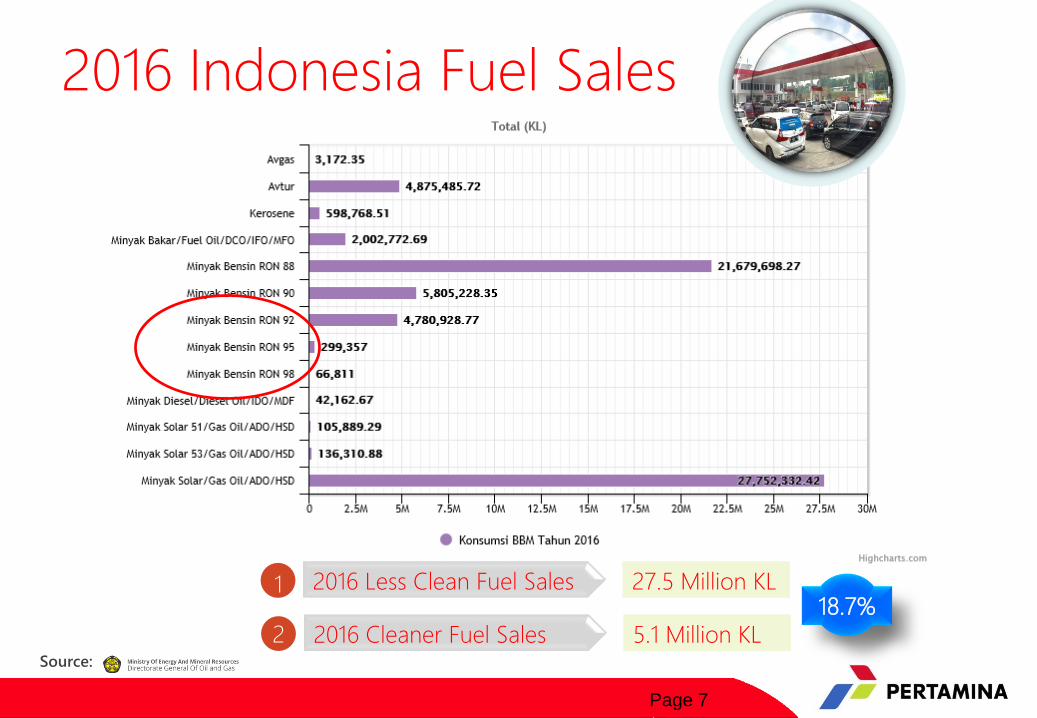
2016 Indonesia Fuel Sales
Source:
1
218.7%
2016 Less Clean Fuel Sales 27.5 Million KL
2016 Cleaner Fuel Sales 5.1 Million KL
Page 8
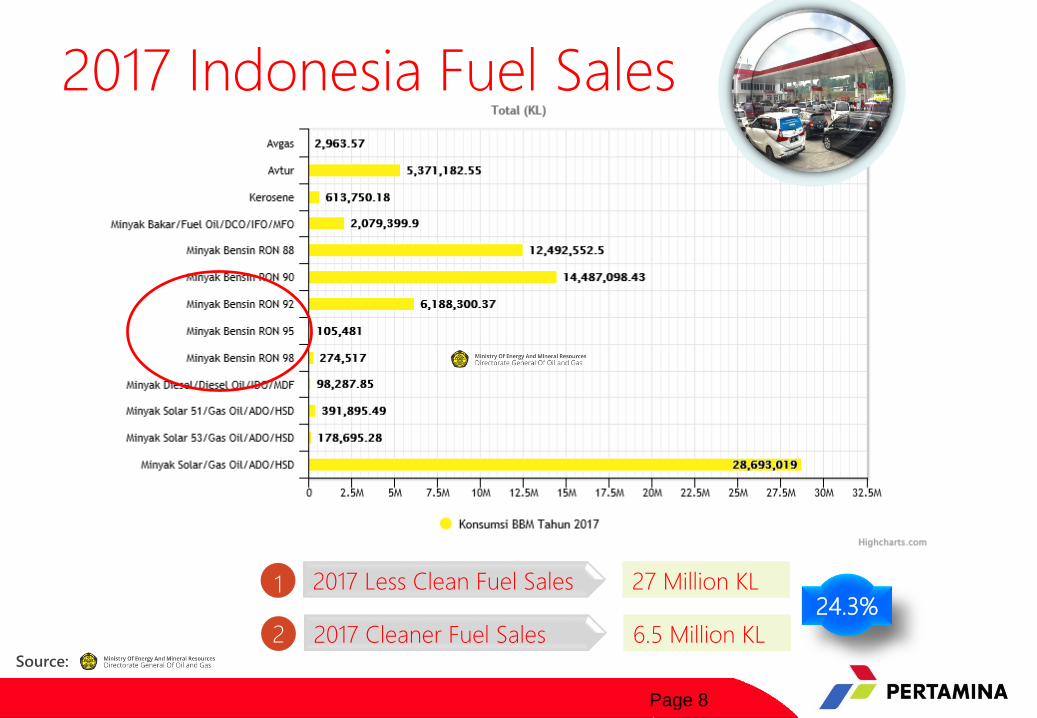
2017 Indonesia Fuel Sales
1
224.3%
2017 Less Clean Fuel Sales 27 Million KL
2017 Cleaner Fuel Sales 6.5 Million KLSource:
Page 9
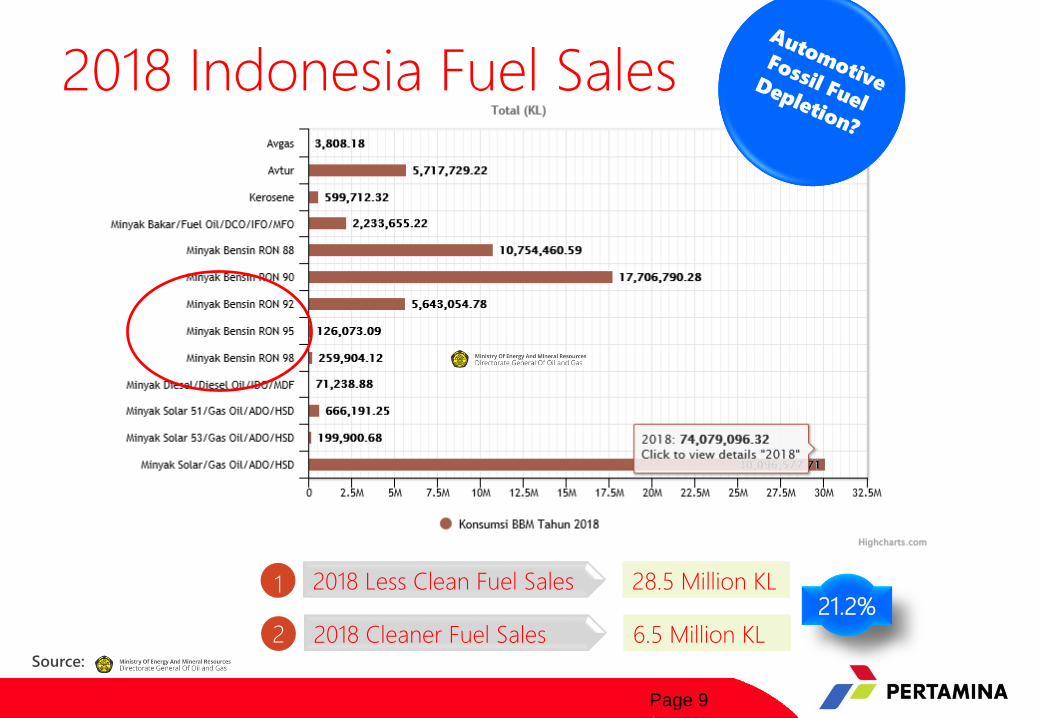
2018 Indonesia Fuel Sales
Source:
1
221.2%
2018 Less Clean Fuel Sales 28.5 Million KL
2018 Cleaner Fuel Sales 6.5 Million KL
Page 10
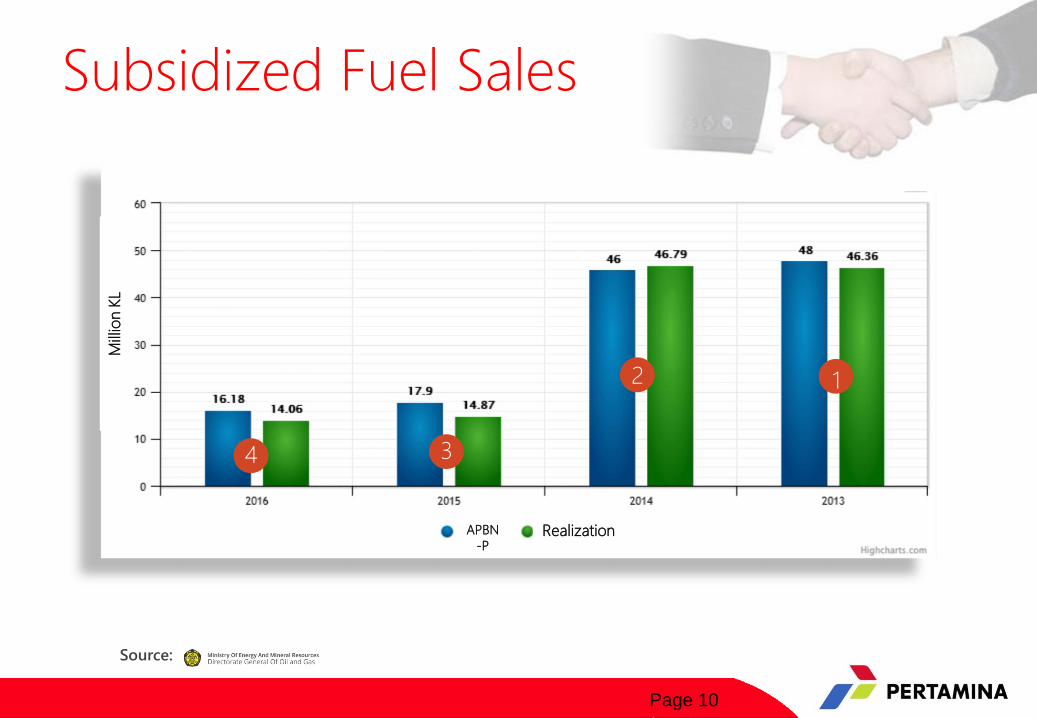
Subsidized Fuel Sales
Source:
12
34
Mill
ion K
L
APBN
-PRealization
Page 11
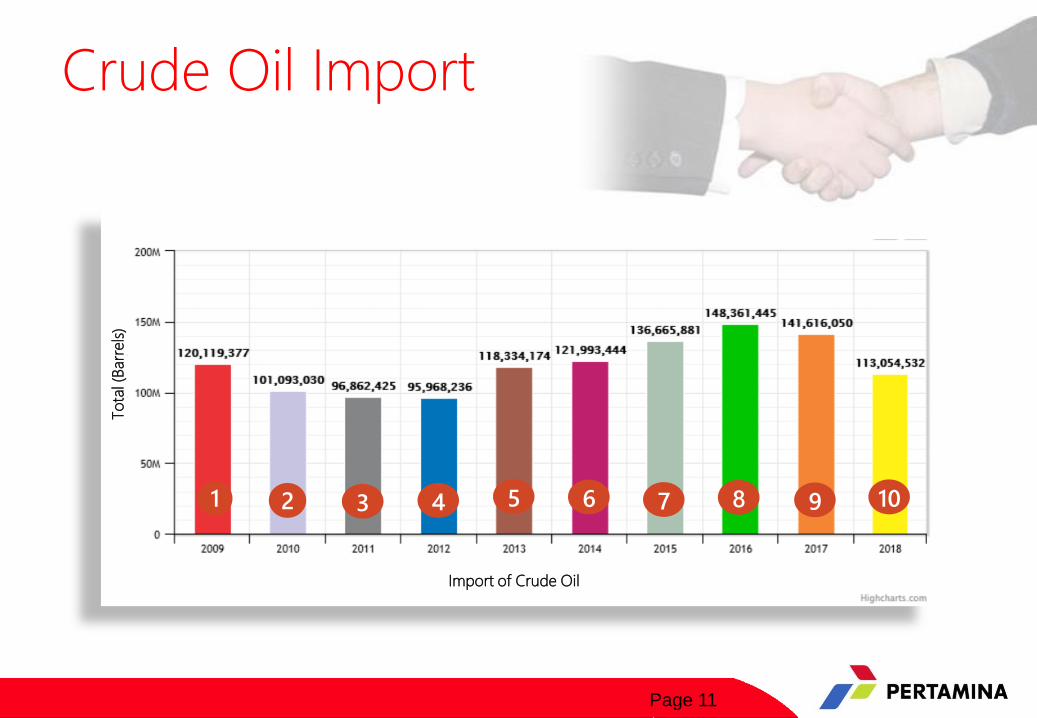
Crude Oil Import
1 2 3 4 5 6 7 8 9 10
To
tal (
Barr
els
)
Import of Crude Oil
Page 12
Fuels & Vehicles “EURO”Stages Parameters Evolution
Page 13
Parameter
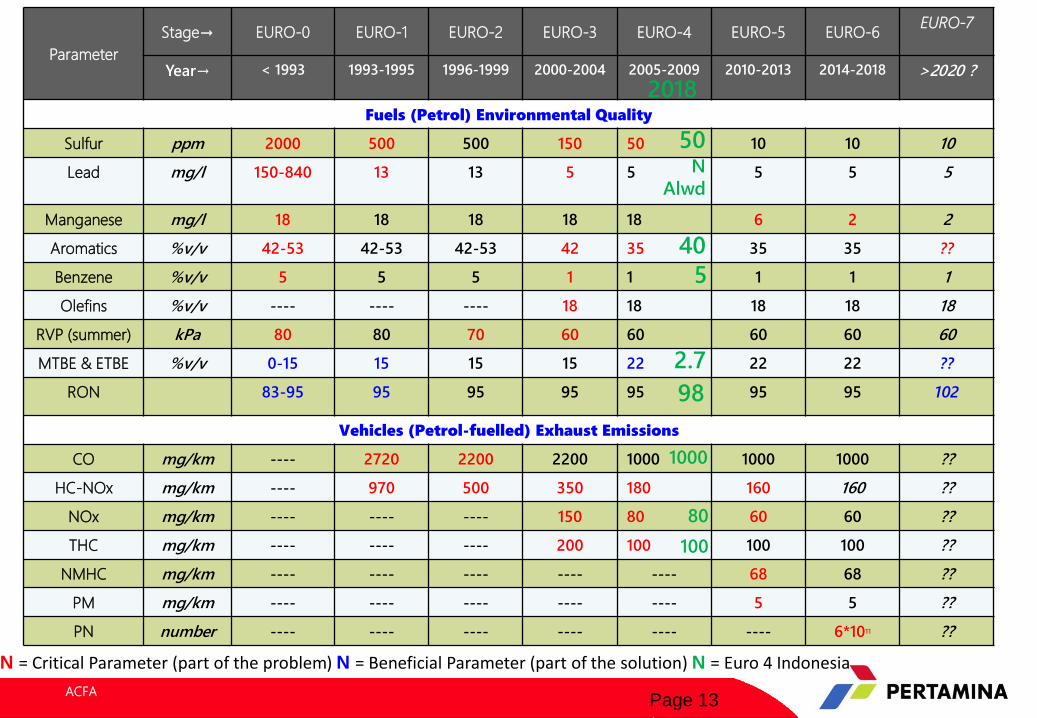
Stage→ EURO-0 EURO-1 EURO-2 EURO-3 EURO-4 EURO-5 EURO-6 EURO-7
Year→ < 1993 1993-1995 1996-1999 2000-2004 2005-2009 2010-2013 2014-2018 >2020 ?
Fuels (Petrol) Environmental Quality
Sulfur ppm 2000 500 500 150 50 10 10 10
Lead mg/l 150-840 13 13 5 5 5 5 5
Manganese mg/l 18 18 18 18 18 6 2 2
Aromatics %v/v 42-53 42-53 42-53 42 35 35 35 ??
Benzene %v/v 5 5 5 1 1 1 1 1
Olefins %v/v ---- ---- ---- 18 18 18 18 18
RVP (summer) kPa 80 80 70 60 60 60 60 60
MTBE & ETBE %v/v 0-15 15 15 15 22 22 22 ??
RON 83-95 95 95 95 95 95 95 102
Vehicles (Petrol-fuelled) Exhaust Emissions
CO mg/km ---- 2720 2200 2200 1000 1000 1000 ??
HC-NOx mg/km ---- 970 500 350 180 160 160 ??
NOx mg/km ---- ---- ---- 150 80 60 60 ??
THC mg/km ---- ---- ---- 200 100 100 100 ??
NMHC mg/km ---- ---- ---- ---- ---- 68 68 ??
PM mg/km ---- ---- ---- ---- ---- 5 5 ??
PN number ---- ---- ---- ---- ---- ---- 6*1011 ??
N = Critical Parameter (part of the problem) N = Beneficial Parameter (part of the solution) N = Euro 4 Indonesia
50N
Alwd
2.7
40
5
98
2018
1000
100
80
ACFA
Page 14
Indonesian Current Petrol
Grades Quality
Page 15
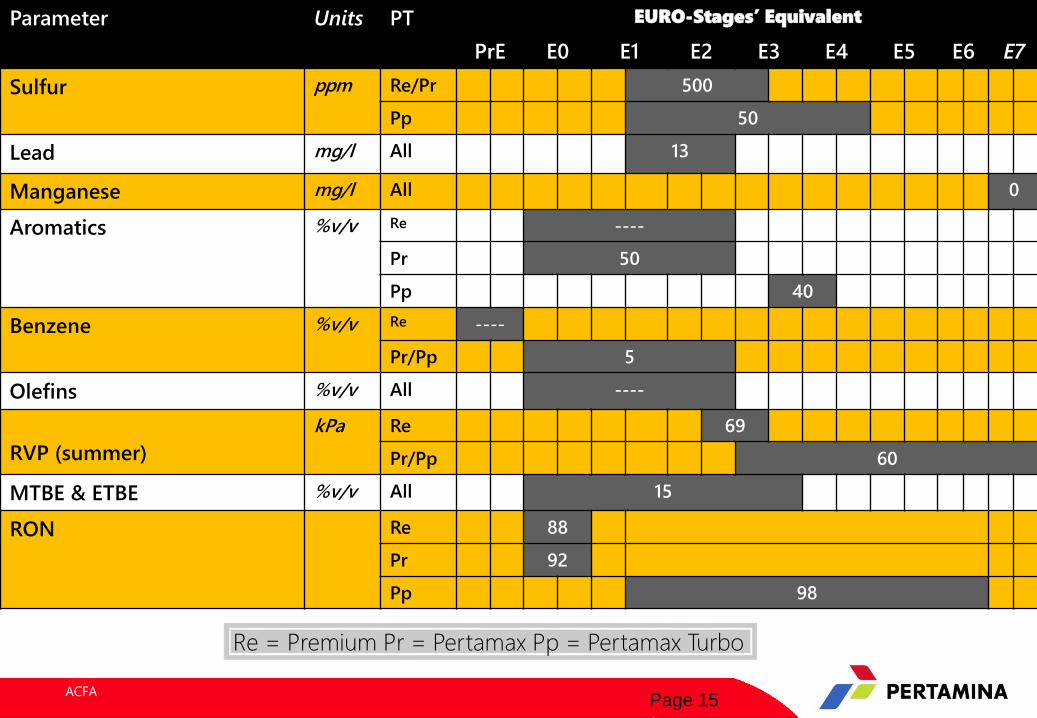
Parameter Units PT EURO-Stages’ Equivalent
PrE E0 E1 E2 E3 E4 E5 E6 E7
Sulfur ppm Re/Pr 500
Pp 50
Lead mg/l All 13
Manganese mg/l All 0
Aromatics %v/v Re ----
Pr 50
Pp 40
Benzene %v/v Re ----
Pr/Pp 5
Olefins %v/v All ----
RVP (summer)
kPa Re 69
Pr/Pp 60
MTBE & ETBE %v/v All 15
RON Re 88
Pr 92
Pp 98
Re = Premium Pr = Pertamax Pp = Pertamax Turbo
ACFA
Page 16
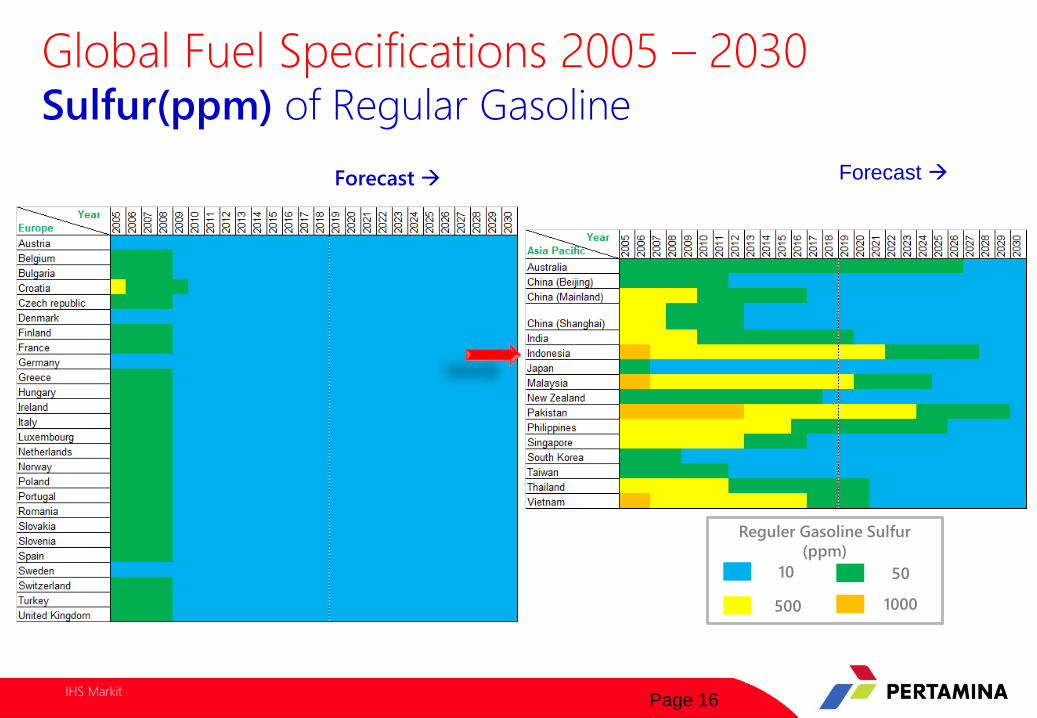
10
500
50
1000
Reguler Gasoline Sulfur
(ppm)
Forecast Forecast
Global Fuel Specifications 2005 – 2030Sulfur(ppm) of Regular Gasoline
IHS Markit
Page 17
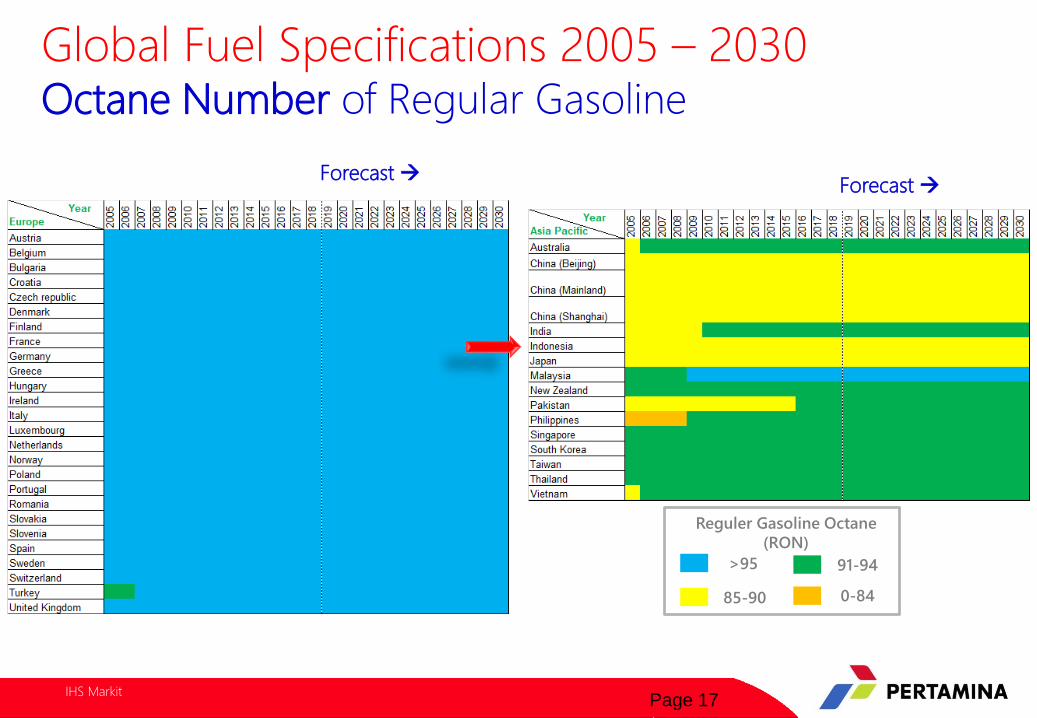
>95
85-90
91-94
0-84
Reguler Gasoline Octane
(RON)
Forecast Forecast
Global Fuel Specifications 2005 – 2030Octane Number of Regular Gasoline
IHS Markit
Page 18
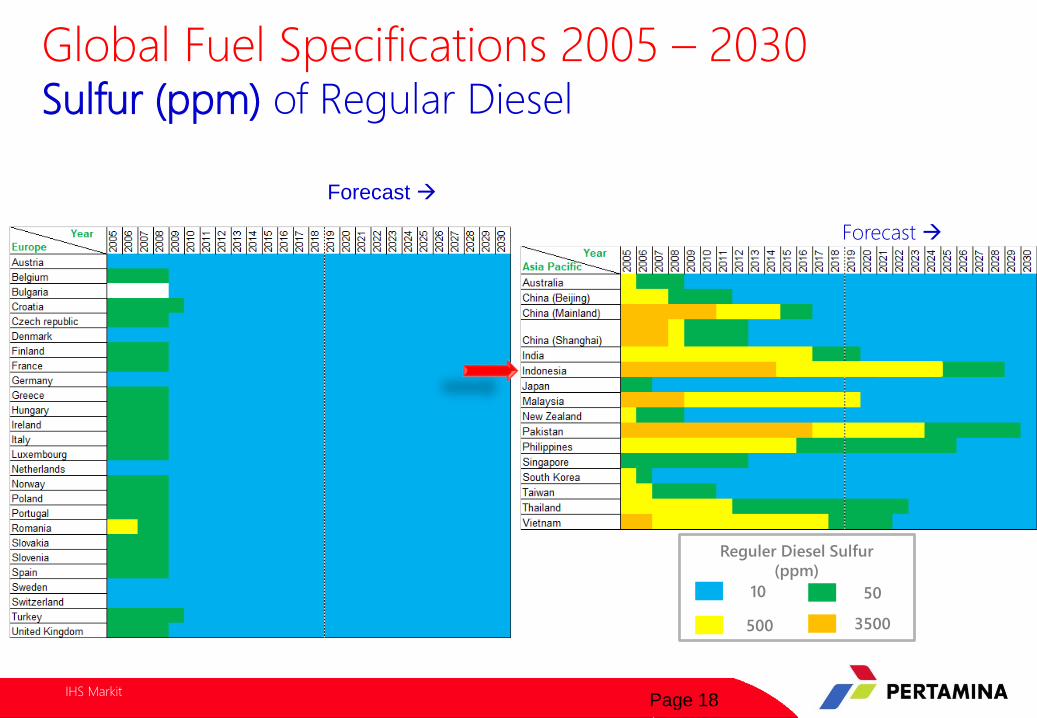
Forecast
Forecast
10
500
50
3500
Reguler Diesel Sulfur
(ppm)
Global Fuel Specifications 2005 – 2030Sulfur (ppm) of Regular Diesel
IHS Markit
Page 19
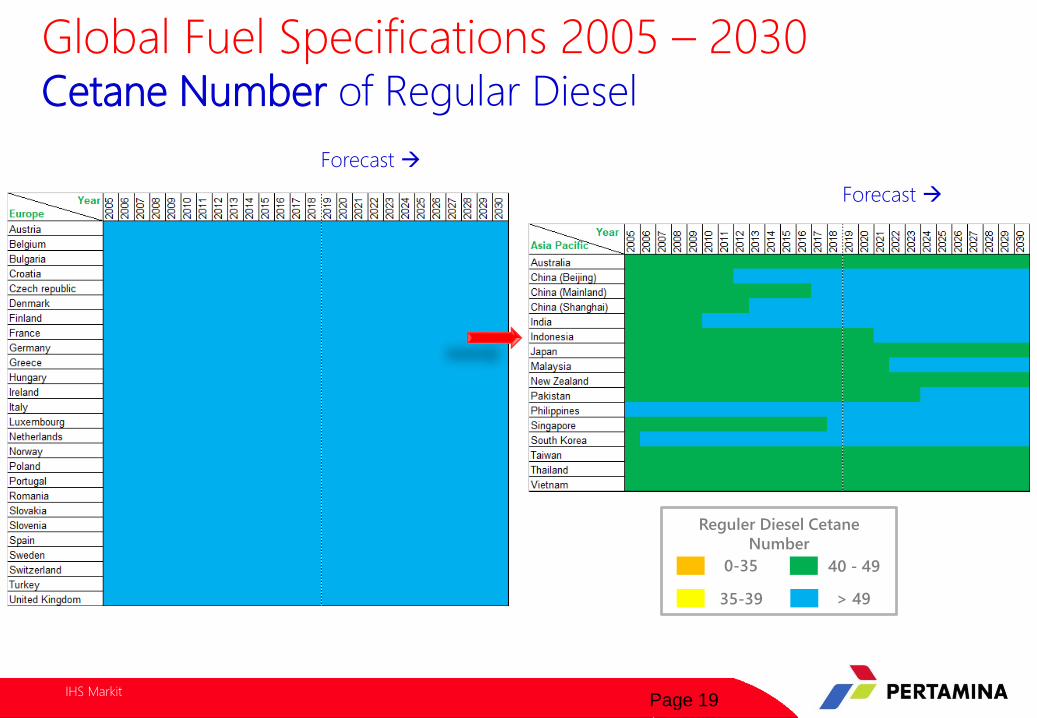
> 4935-39
40 - 490-35
Reguler Diesel Cetane
Number
Forecast
Forecast
Global Fuel Specifications 2005 – 2030Cetane Number of Regular Diesel
IHS Markit
Page 20
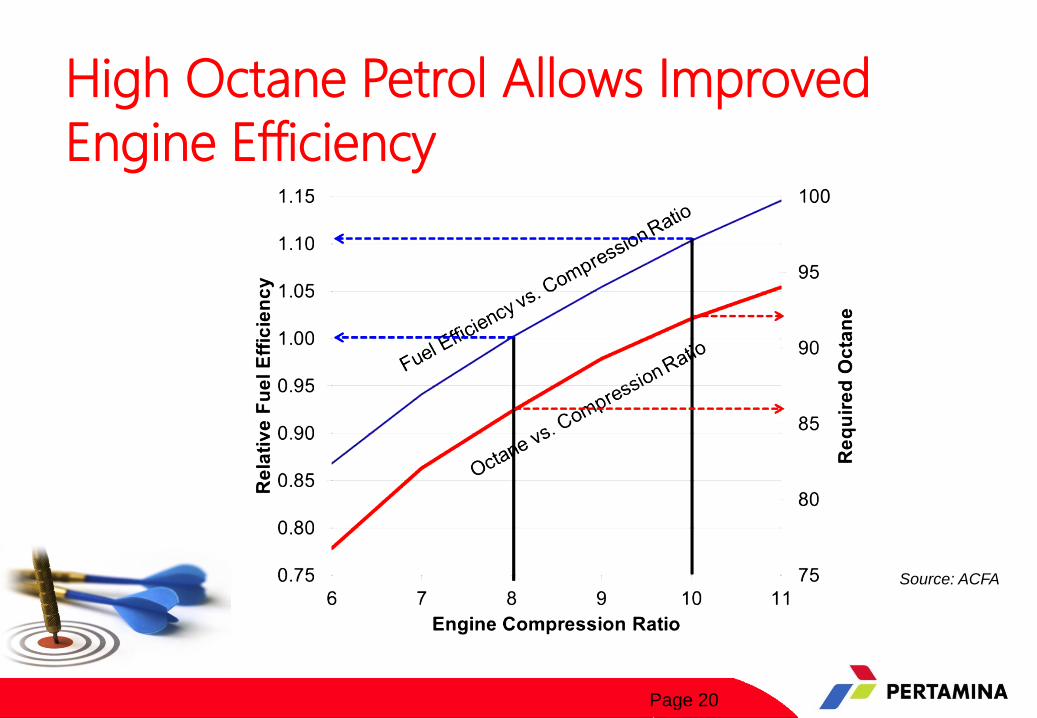
High Octane Petrol Allows Improved
Engine Efficiency
Source: ACFA
Page 21
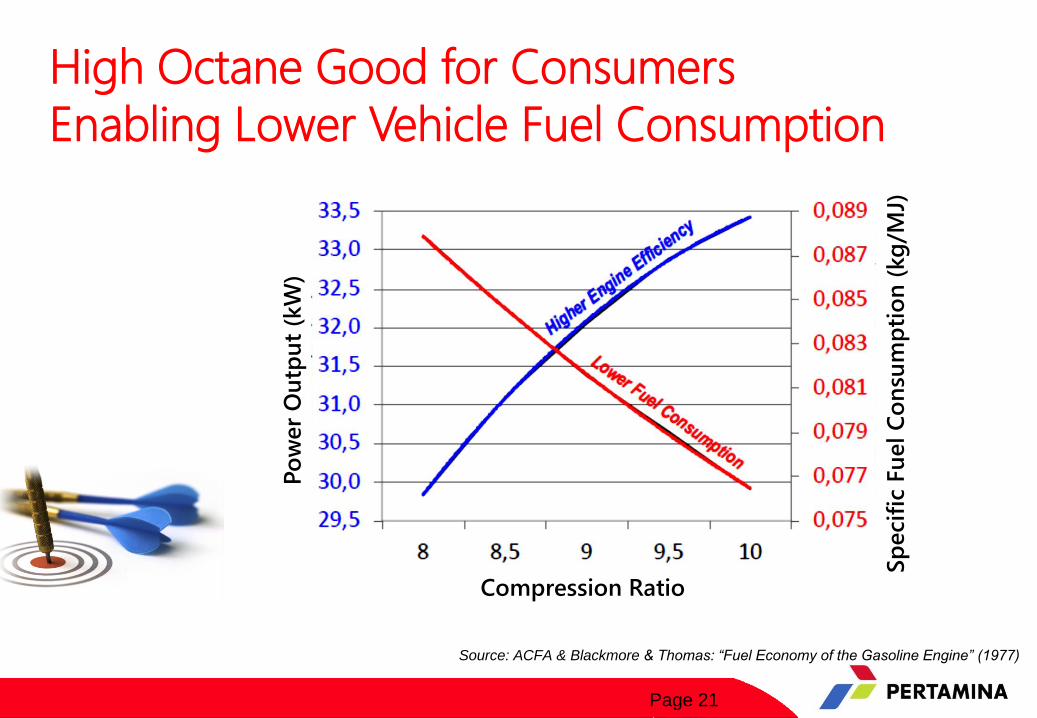
High Octane Good for Consumers
Enabling Lower Vehicle Fuel Consumption
Source: ACFA & Blackmore & Thomas: “Fuel Economy of the Gasoline Engine” (1977)
Po
wer
Ou
tpu
t (k
W)
Sp
ecif
ic F
uel C
on
sum
pti
on
(kg
/MJ)
Compression Ratio
Page 22
Alternative Energy to Replace
Fossil Fuel
Page 23
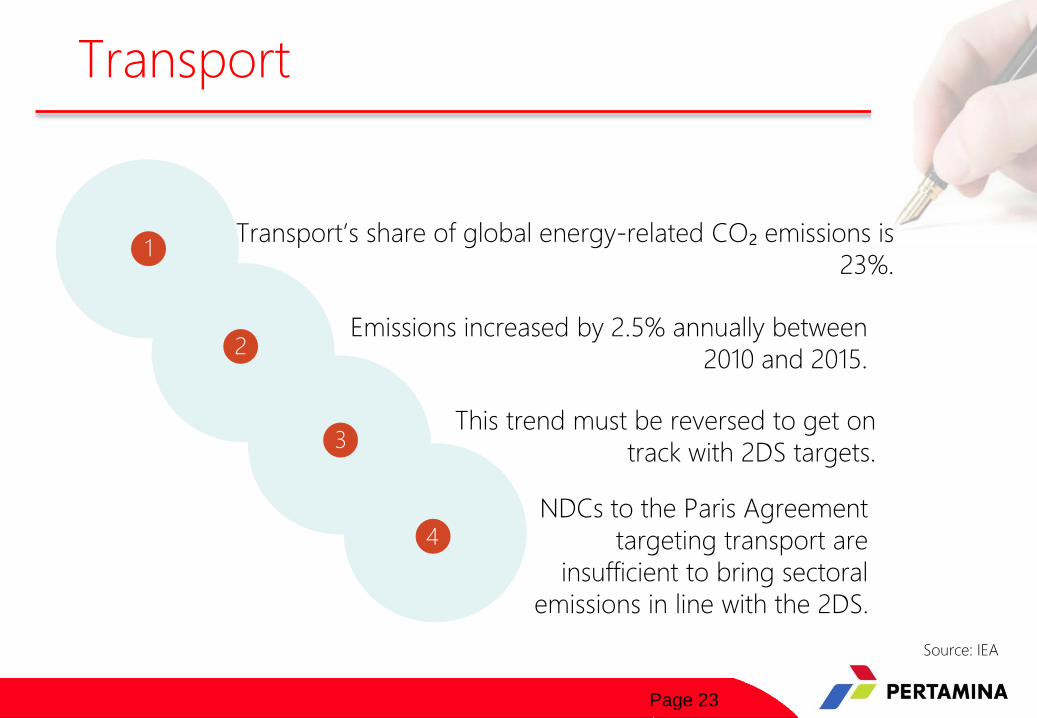
Transport
This trend must be reversed to get on
track with 2DS targets.
Emissions increased by 2.5% annually between
2010 and 2015.
NDCs to the Paris Agreement
targeting transport are
insufficient to bring sectoral
emissions in line with the 2DS.
1
2
3
4
Source: IEA
Transport’s share of global energy-related CO₂ emissions is
23%.
Page 24
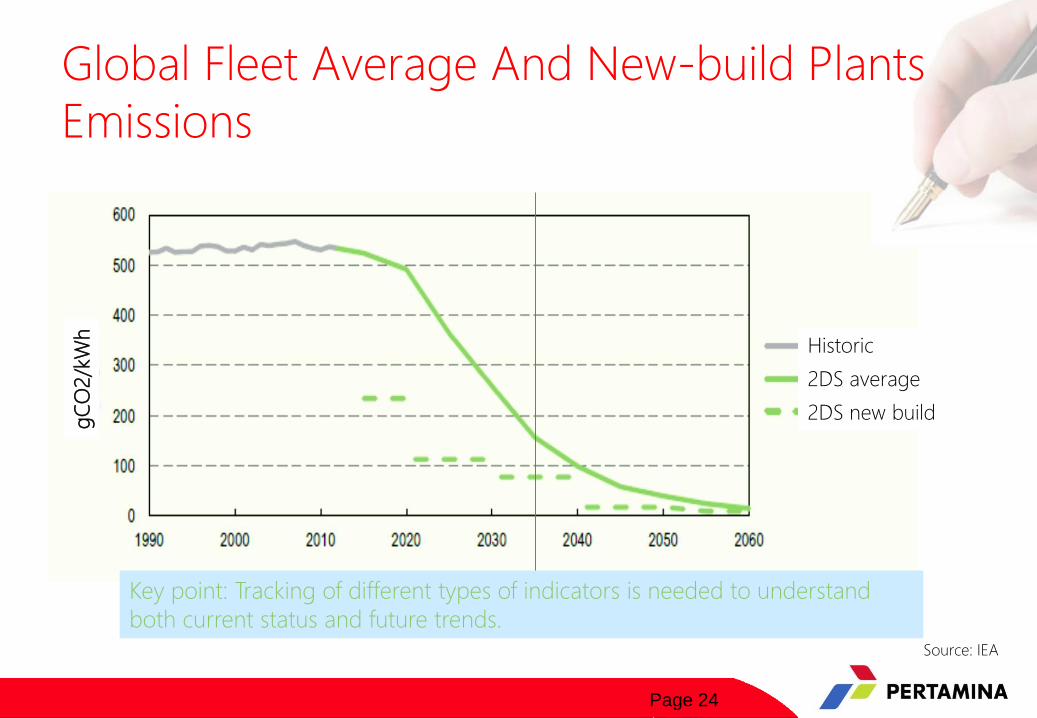
Global Fleet Average And New-build Plants
Emissions
Historic
2DS average
2DS new build
Key point: Tracking of different types of indicators is needed to understand
both current status and future trends.Source: IEA
gC
O2/k
Wh
Page 25
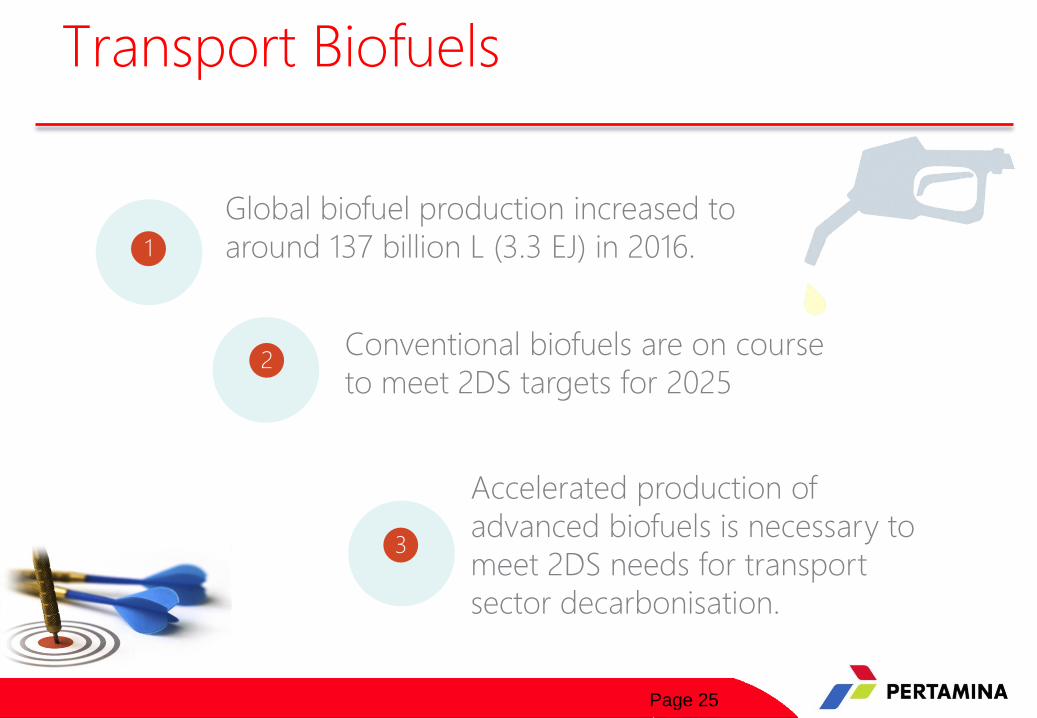
Transport Biofuels
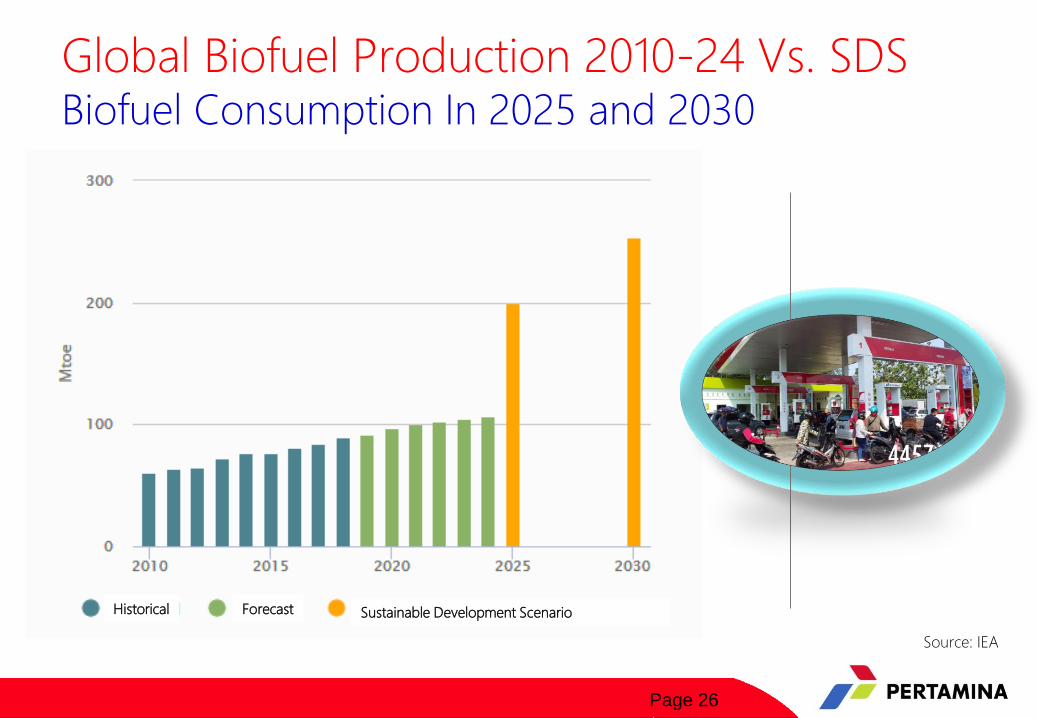
Global biofuel production increased to
around 137 billion L (3.3 EJ) in 2016.1
2
3
Conventional biofuels are on course
to meet 2DS targets for 2025
Accelerated production of
advanced biofuels is necessary to
meet 2DS needs for transport
sector decarbonisation.
Page 26
Global Biofuel Production 2010-24 Vs. SDS Biofuel Consumption In 2025 and 2030
Source: IEA
Historical Forecast Sustainable Development Scenario
Page 27
in Asia many petroleum product-importing countries have enhanced
policy support for domestically produced biofuels, boosting markets
for ethanol (e.g. India and Thailand) and biodiesel (e.g. Indonesia and
Malaysia).
Transport Biofuels
In 2016, conventional biofuels accounted for around 4% of world road
transport fuel. Doubledigit global production growth pre-2010 slowed
to a modest 2%2 y-o-y
1
2
3
In the United States, ethanol output is anticipated to stabilise due to lower
investment in new capacity. Meeting Brazil’s 2030 commitment to reach
an 18% share of sustainable biofuels in its energy mix would equate to
over 50 billion L of fuel ethanol demand
Recent trends
Proposals for the revised Renewable Energy Directive (RED) covering
2020-30 include a scale-down of the cap on food crop-based biofuels
from 7% to 3.8% (by energy) of the 2030 renewable energy target.
4
Page 28
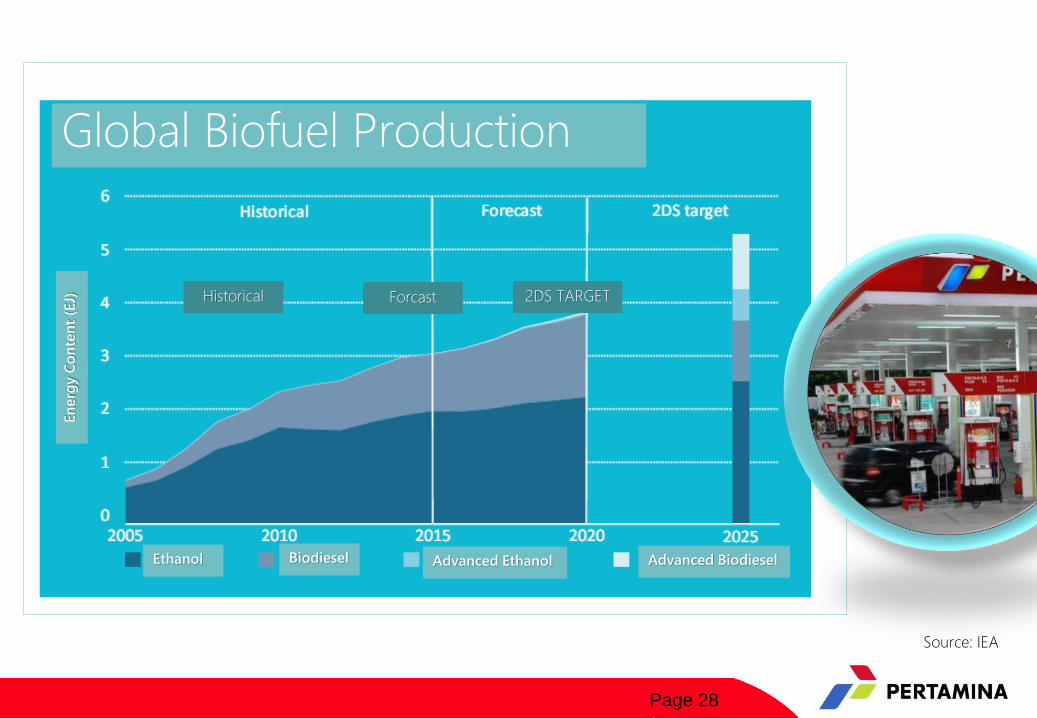
Source: IEA
Historical Forcast 2DS TARGET
Ethanol Biodiesel Advanced Ethanol Advanced Biodiesel
En
erg
y C
on
ten
t (E
J)
Global Biofuel Production
Page 29
Electric VehiclesTracking Progress
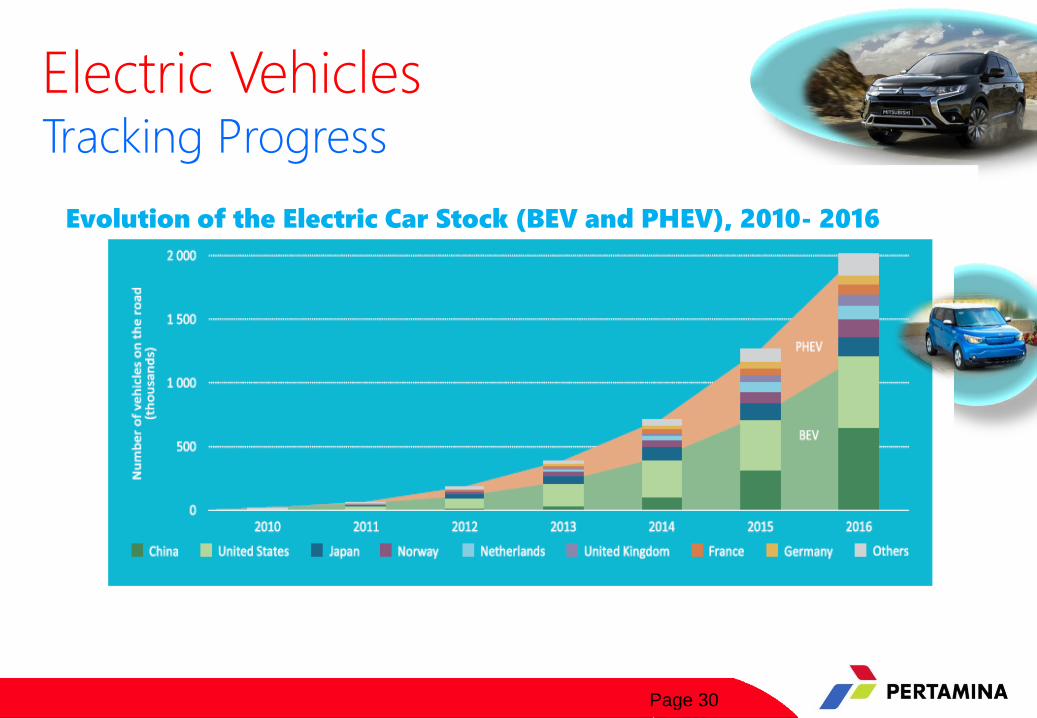
2018 was another record-breaking year for global electric car sales
(1.98 million), raising total global stock to 5.12 million. 1
2
3
4
Sales increased 68% in 2018, more than twice the average year-
on-year sales growth required to meet the SDS level by 2030.
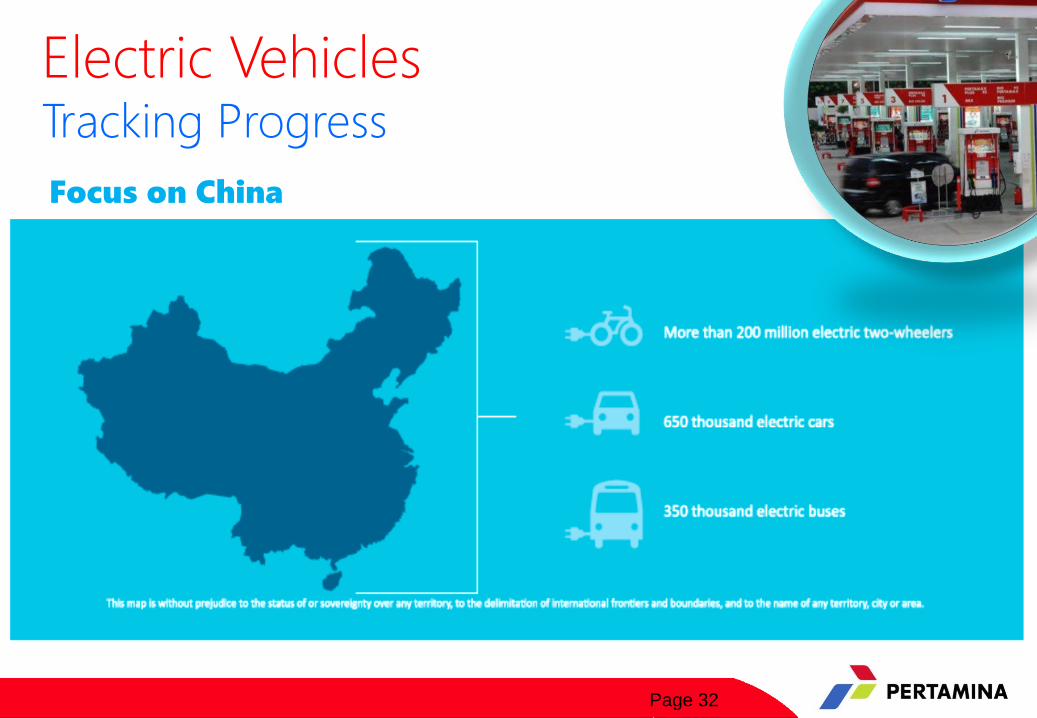
China was the world's largest market (just over 1 million electric
cars sold in 2018), followed by Europe (385 000) and the United
States (361 000); the three regions made up over 90% of all sales in
2018.
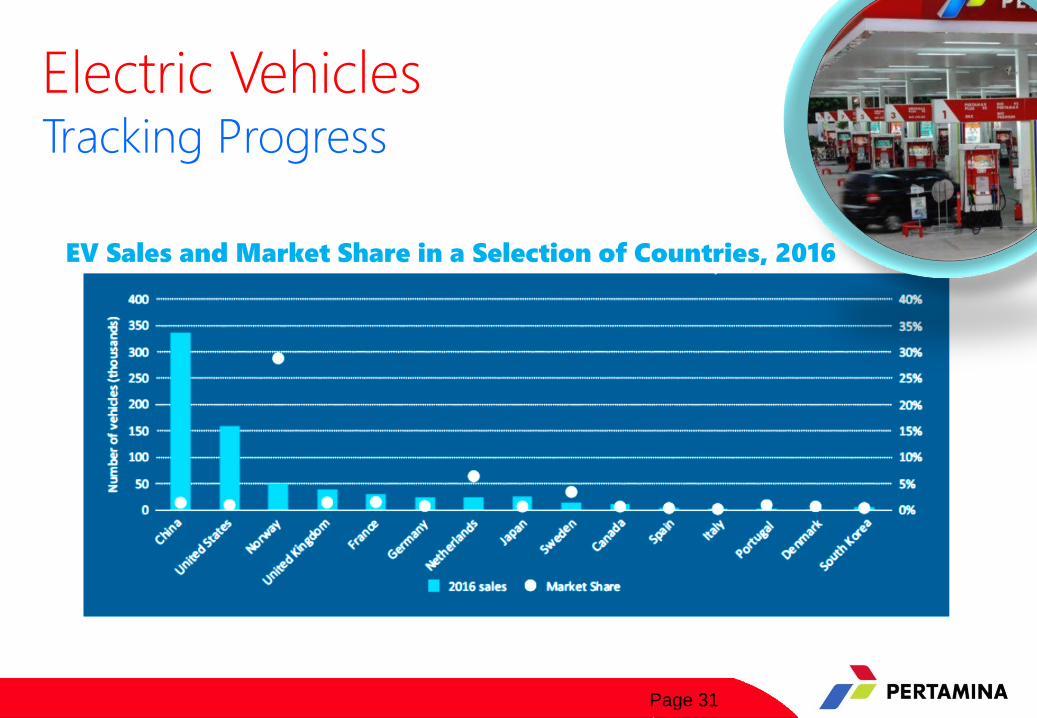
Norway continues to have the highest market share for sales
(46% in 2018), followed by Iceland (17%) and Sweden (8%).
Progress in decarbonising the power sector will accelerate
the CO2 emission reduction benefits of electric vehicles.
Page 30
Electric VehiclesTracking Progress
Evolution of the Electric Car Stock (BEV and PHEV), 2010- 2016
Page 31
Electric VehiclesTracking Progress
EV Sales and Market Share in a Selection of Countries, 2016
Page 32
Electric VehiclesTracking Progress
Focus on China
Page 33
Green Fuel as Local Endowment
Renewable Energy
Page 34
Indonesia Renewable Energy
in General
Indonesia Renewable Energy
1Indonesia has not committed to reach 100% renewable energy by 2050. By 2025, Indonesia plans to raise renewable energies from the current 7% to 23% share in the national energy mix.
2 By 2050, Indonesia seeks to raise renewables to 31% of the mix.
Endowments of renewable energy
resources: solar, wind, marine and an
estimated 40% of global geothermal
reserves.
Indonesia’s extensive coastline allows it to have a
75 GW hydro and marine potential capacity.
Indonesia’s coast also opens up opportunities for
offshore wind energy development
3
4
Page 35
1 Of the 80.5 GW of RUPTL new capacity to be installed in the next decade, 22 GW will be in renewable energy
2 6,150 MW of geothermal, 13,100 MW of large hydropower, 1,365 MW of small hydropower, 444 MW of solar, 640 MW of wind, and 488 of biomass
3 Although hydro has the greatest potential, the focus of PLN remains on thermally generated sources (coal at 20 GW and gas at 13 GW).
To reduce GHG emissions, PLN should
concentrate the unallocated energy sources
in renewables, such as hydro and offshore
wind.
4
Indonesia Renewable Energy
in General
Page 36
1 Biodiesel blend B 30 will be implemented next year
Full scale road test is in progress
2 Going discussion on Ethanol Fuel
Indonesia Renewable Energy in Automotive Industry
Pertamina Fuel Ethanol supply point have
been well prepared in Surabaya, Jakarta,
Bandung, Semarang, Balongan and Banten.
Initial plan: Ethanol Fuel E2 for RON 92 in East Java on 2019
Ethanol price disparity will be passed
through customer
Page 37
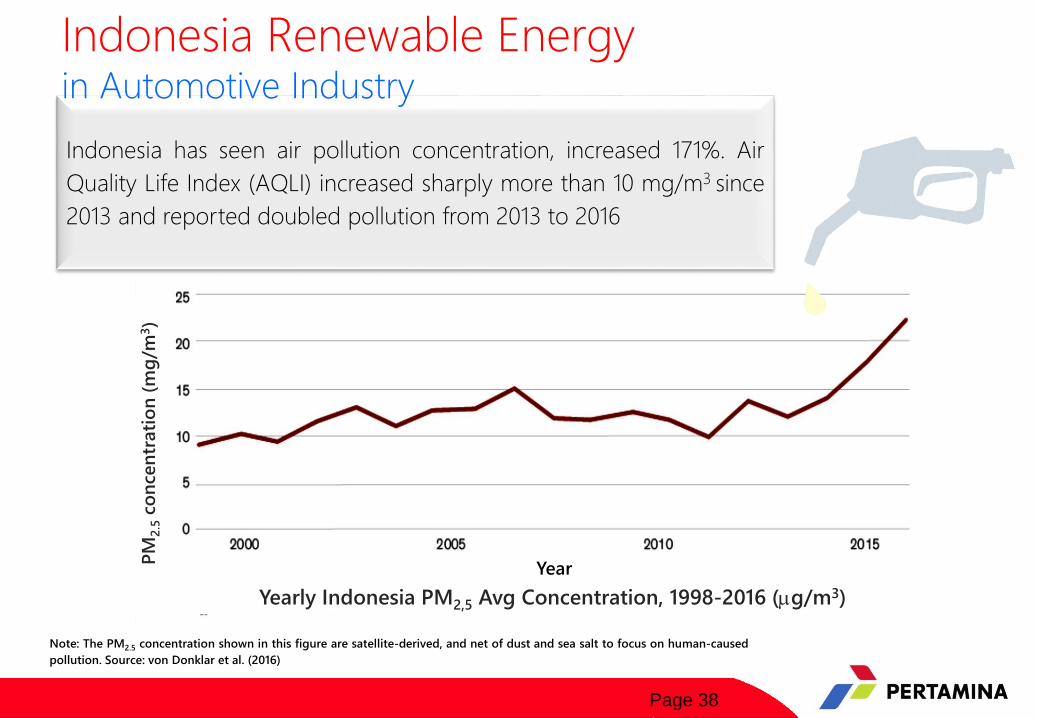
On March 10, 2017, Minister of Environment and
Forestry (MLHK) has a new exhaust gas emission
standard of Ministerial Regulation LHK NO. P.20/
MENLHK/SETJEN/KUM.1/3/2017.
From 1998 to 2016, Indonesia changed from being one of the
cleaner countries to one of the twenty most polluted country.
Indonesia Renewable Energy in Automotive Industry
Page 38
Indonesia has seen air pollution concentration, increased 171%. Air
Quality Life Index (AQLI) increased sharply more than 10 mg/m3 since
2013 and reported doubled pollution from 2013 to 2016
PM
2.5
co
ncen
trati
on
(mg
/m3)
Note: The PM2.5 concentration shown in this figure are satellite-derived, and net of dust and sea salt to focus on human-caused
pollution. Source: von Donklar et al. (2016)
Year
Indonesia Renewable Energy in Automotive Industry
Yearly Indonesia PM2,5 Avg Concentration, 1998-2016 (mg/m3)
Page 39
0
20
40
60
80
100
120
140
160
180
9/22/2017 0:00 12/31/2017 0:00 4/10/2018 0:00 7/19/2018 0:00 10/27/2018 0:00 2/4/2019 0:00 5/15/2019 0:00 8/23/2019 0:00
Air
Qu
ality
In
dex (
AQ
I)
Date
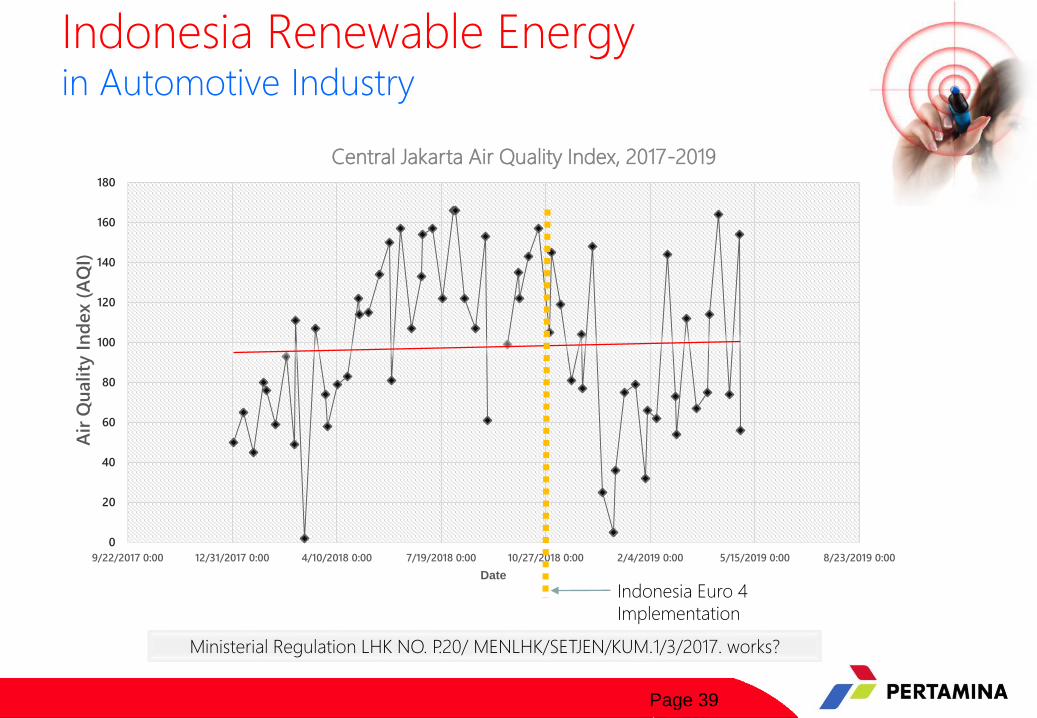
Central Jakarta Air Quality Index, 2017-2019
Indonesia Euro 4
Implementation
Indonesia Renewable Energy in Automotive Industry
Ministerial Regulation LHK NO. P.20/ MENLHK/SETJEN/KUM.1/3/2017. works?
Page 40
Indonesia Renewable Energy in Automotive Industry
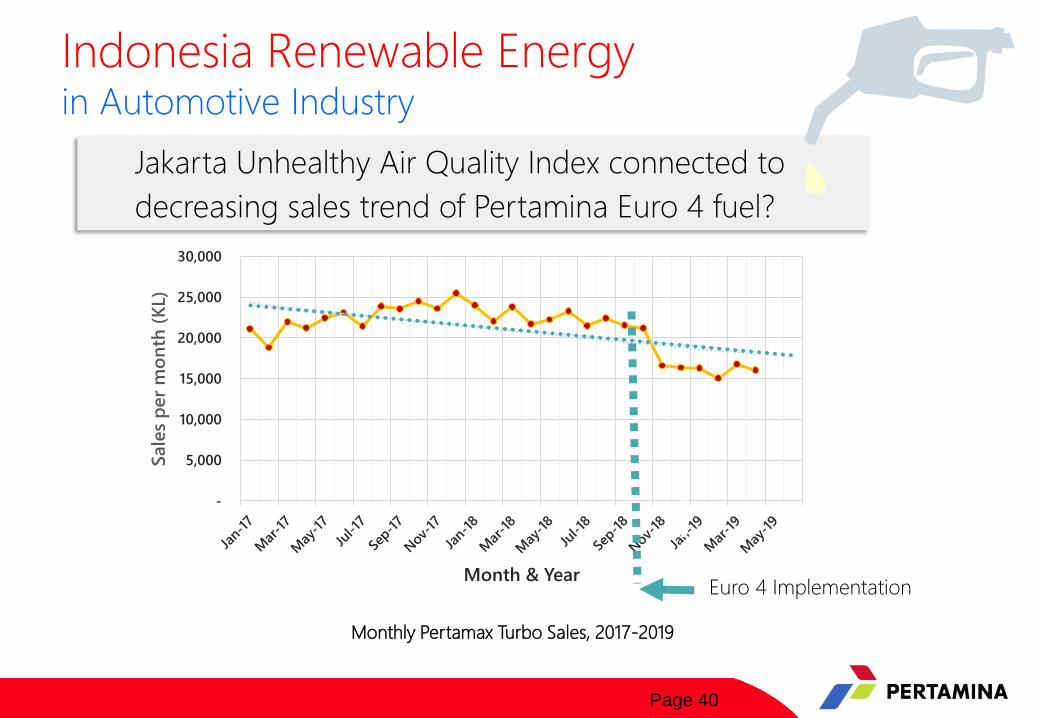
Jakarta Unhealthy Air Quality Index connected to
decreasing sales trend of Pertamina Euro 4 fuel?
-
5,000
10,000
15,000
20,000
25,000
30,000
Sale
s p
er
mo
nth
(K
L)
Month & YearEuro 4 Implementation
Monthly Pertamax Turbo Sales, 2017-2019
Page 41
Indonesia Renewable Energy in Automotive Industry
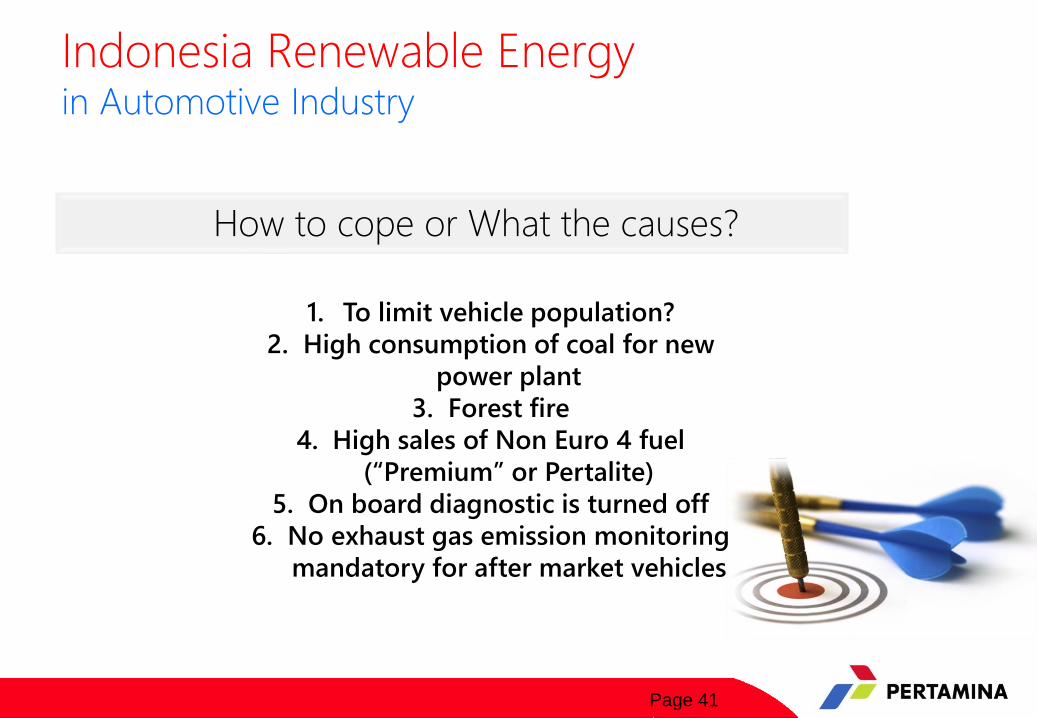
How to cope or What the causes?
1. To limit vehicle population?
2. High consumption of coal for new
power plant
3. Forest fire
4. High sales of Non Euro 4 fuel
(“Premium” or Pertalite)
5. On board diagnostic is turned off
6. No exhaust gas emission monitoring
mandatory for after market vehicles

Page 42
Many Thanks