Embed Size (px)
Citation preview
Global Group
Safe harbor
• Neither the information nor any opinion expressed in this presentation constitutes an offer, or invitation to make an offer, or to buy any security issued by the company. This presentation contains predictions, estimates orother information regarding the Company's operations which are forward looking in nature. While these forward looking statements represent our best current judgment on what the future holds, they are subject to risks anduncertainties that could cause actual results to differ materially and may involve risk and uncertainty. This presentation is prepared for general purposes only and does not have any regard to the specific investmentobjectives, financial situation and particular needs of any specific person. No liability for any loss will arise with the company as a result of the action taken on the basis of information contained herein.
•For a discussion of the risks and uncertainties that may cause results to differ, you should review GTL’s filings with stock exchanges, including the annual report and quarterly disclosures.
An Introduction
Group Vision
“Provide affordable universal connectivity by offering quality & green network solutions to telecom carriers across the telecom carriers across the
world”
2
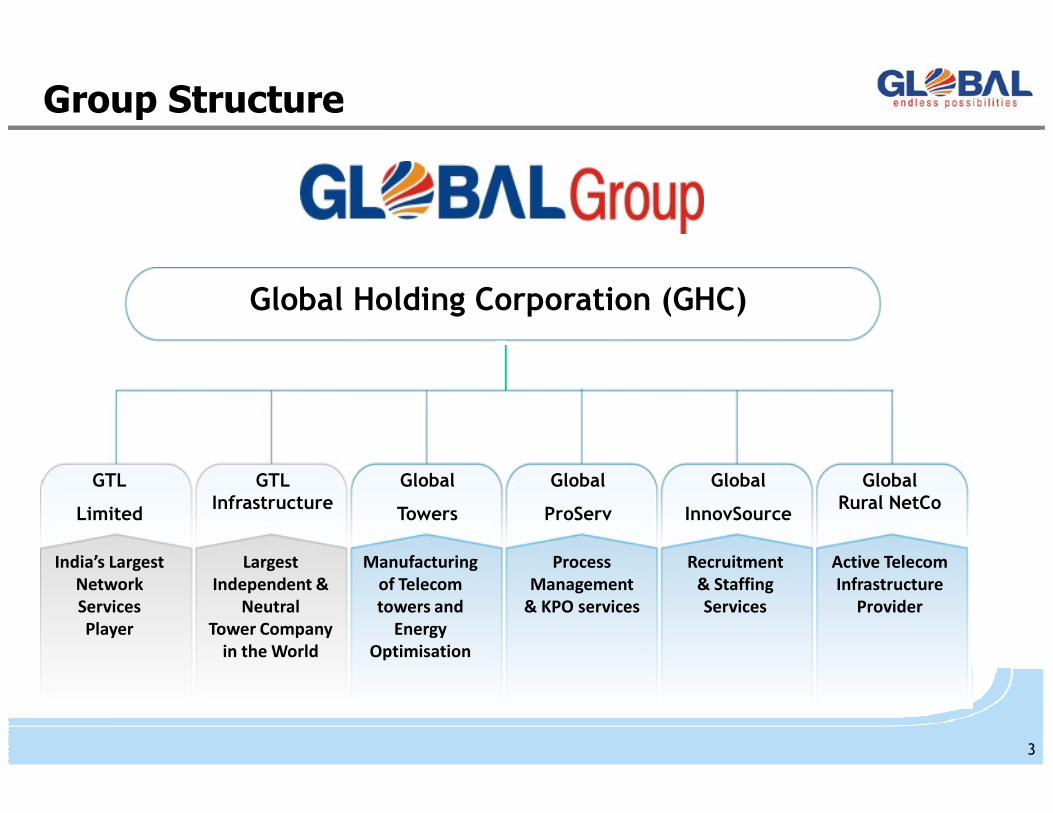
Global Holding Corporation (GHC)
Group Structure
GTL
Limited
GTL Infrastructure
Global
Towers
Global
ProServ
Global
InnovSource
India’s Largest
Network
Services
Player
Largest
Independent &
Neutral
Tower Company
in the World
Manufacturing
of Telecom
towers and
Energy
Optimisation
Process
Management
& KPO services
Recruitment
& Staffing
Services
GlobalRural NetCo
Active Telecom
Infrastructure
Provider
3
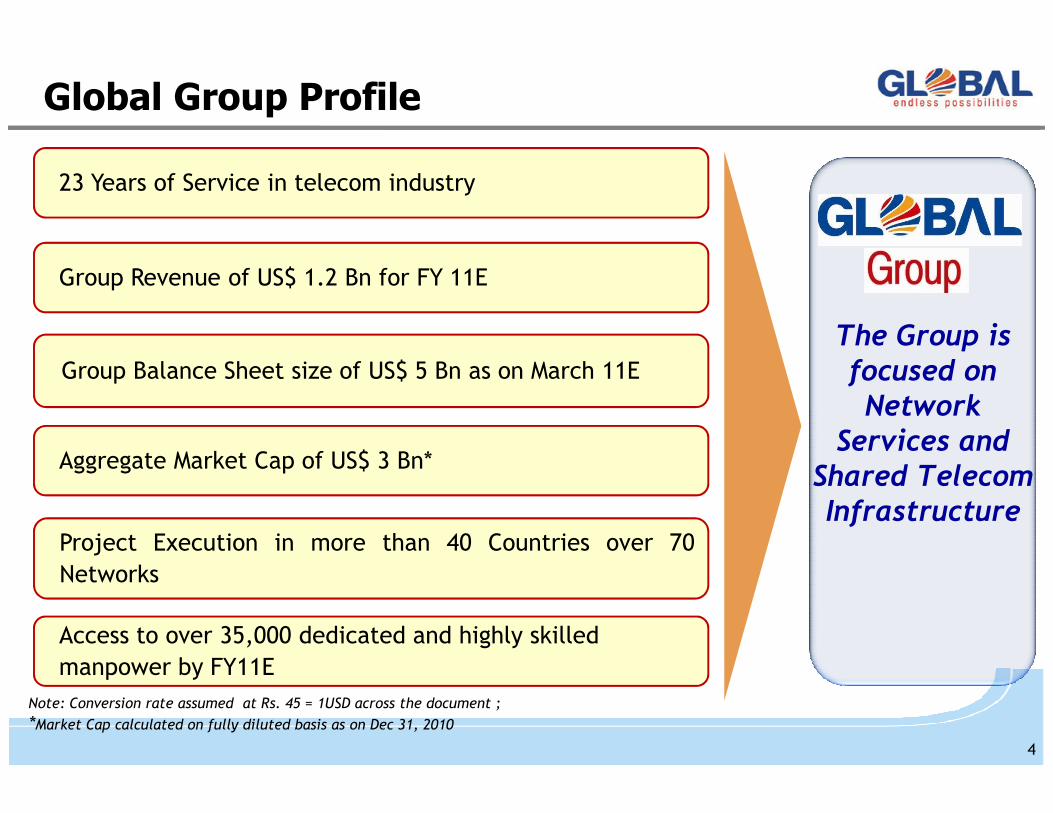
The Group is focused on Network
23 Years of Service in telecom industry
Group Revenue of US$ 1.2 Bn for FY 11E
Group Balance Sheet size of US$ 5 Bn as on March 11E
Global Group Profile
Network Services and
Shared Telecom Infrastructure
Aggregate Market Cap of US$ 3 Bn*
Project Execution in more than 40 Countries over 70
Networks
Access to over 35,000 dedicated and highly skilled
manpower by FY11E
Note: Conversion rate assumed at Rs. 45 = 1USD across the document ;
*Market Cap calculated on fully diluted basis as on Dec 31, 2010
4
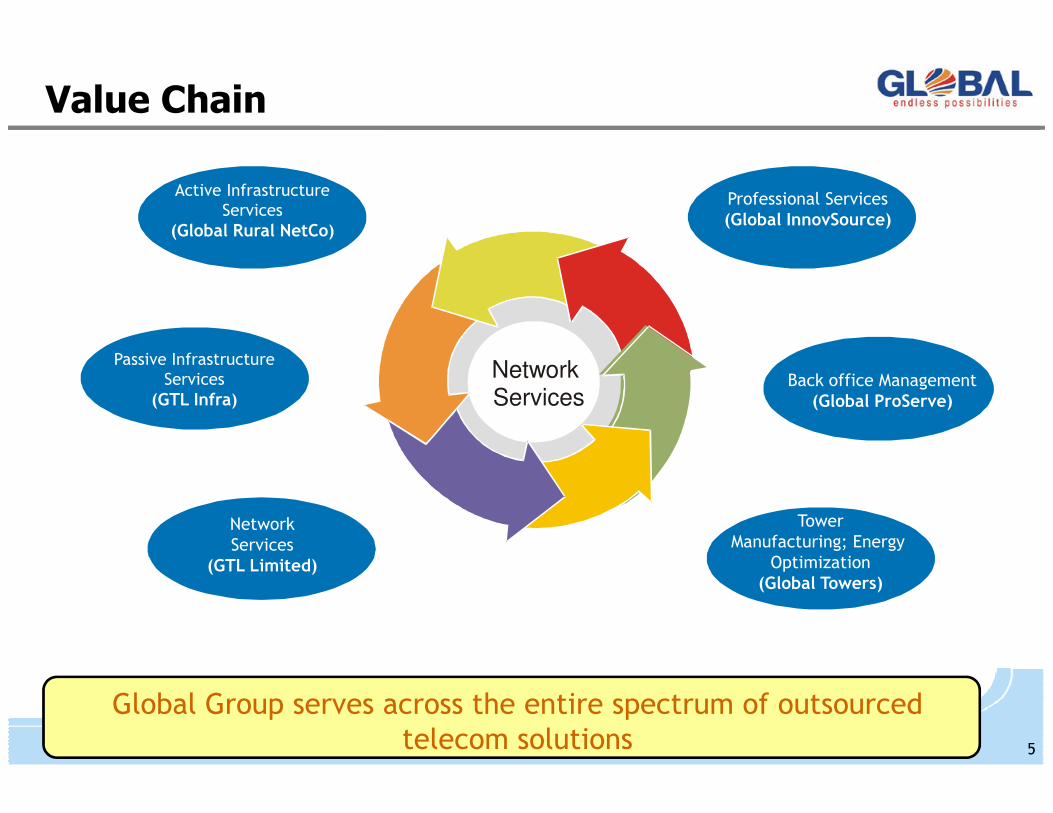
Value Chain
NetworkServices
Back office Management(Global ProServe)
Professional Services(Global InnovSource)
Active InfrastructureServices
(Global Rural NetCo)
Passive InfrastructureServices(GTL Infra) Services
NetworkServices
(GTL Limited)
TowerManufacturing; Energy
Optimization(Global Towers)
(Global ProServe)
Global Group serves across the entire spectrum of outsourced telecom solutions 5
(GTL Infra)
6 6
GTL Infrastructure Ltdwww.gtlinfra.com
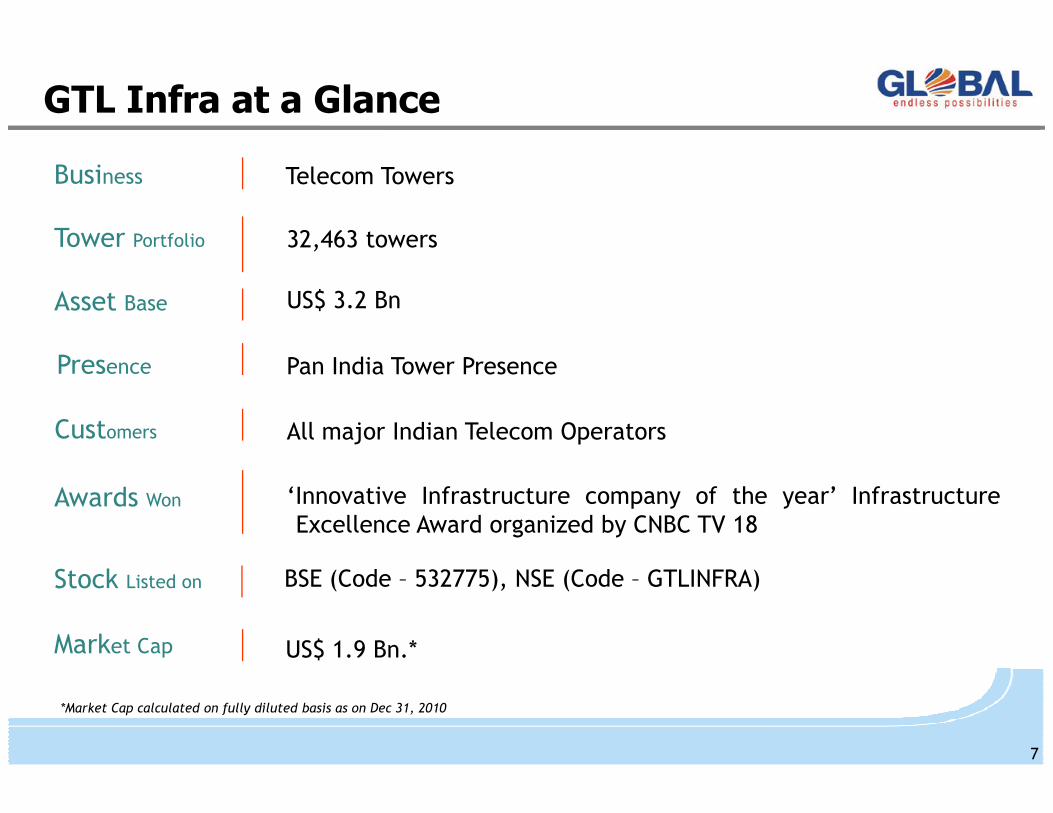
GTL Infra at a Glance
Business Telecom Towers
Presence Pan India Tower Presence
Tower Portfolio 32,463 towers
Asset Base US$ 3.2 Bn
US$ 1.9 Bn.*Market Cap
Stock Listed on BSE (Code – 532775), NSE (Code – GTLINFRA)
Customers All major Indian Telecom Operators
Awards Won ‘Innovative Infrastructure company of the year’ InfrastructureExcellence Award organized by CNBC TV 18
*Market Cap calculated on fully diluted basis as on Dec 31, 2010
7
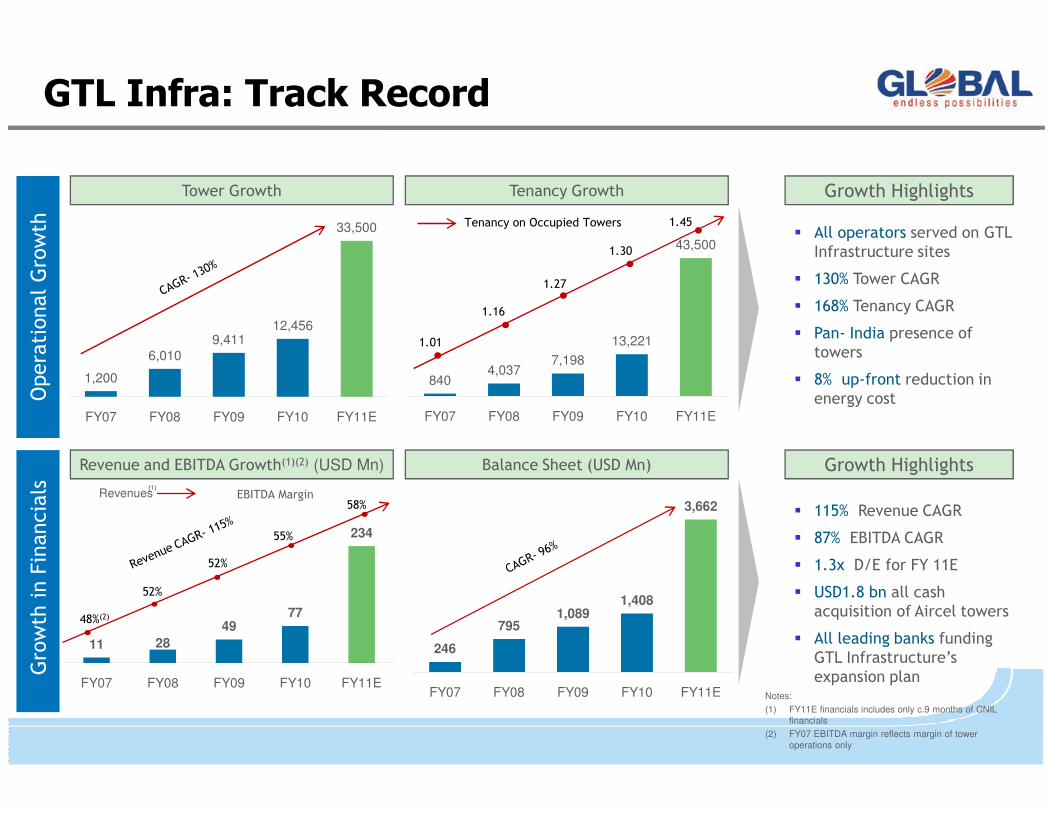
Operational Growth
Tower Growth Tenancy Growth
1,200
6,010
9,41112,456
33,500
8404,037
7,198
13,221
43,500
1.01
1.16
1.27
1.30
1.45Tenancy on Occupied Towers
Growth Highlights
� All operators served on GTL Infrastructure sites
� 130% Tower CAGR
� 168% Tenancy CAGR
� Pan- India presence of towers
� 8% up-front reduction in energy cost
GTL Infra: Track Record
Growth in Financials
246
7951,089
1,408
3,662
FY07 FY08 FY09 FY10 FY11E
Revenue and EBITDA Growth(1)(2) (USD Mn) Balance Sheet (USD Mn)
FY07 FY08 FY09 FY10 FY11E FY07 FY08 FY09 FY10 FY11E
11 28
4977
234
FY07 FY08 FY09 FY10 FY11E
Revenues(1)
Notes:
(1) FY11E financials includes only c.9 months of CNIL
financials
(2) FY07 EBITDA margin reflects margin of tower
operations only
48%(2)
52%
52%
55%
58%EBITDA Margin
� 115% Revenue CAGR
� 87% EBITDA CAGR
� 1.3x D/E for FY 11E
� USD1.8 bn all cash acquisition of Aircel towers
� All leading banks funding GTL Infrastructure’s expansion plan
Growth Highlights
energy cost
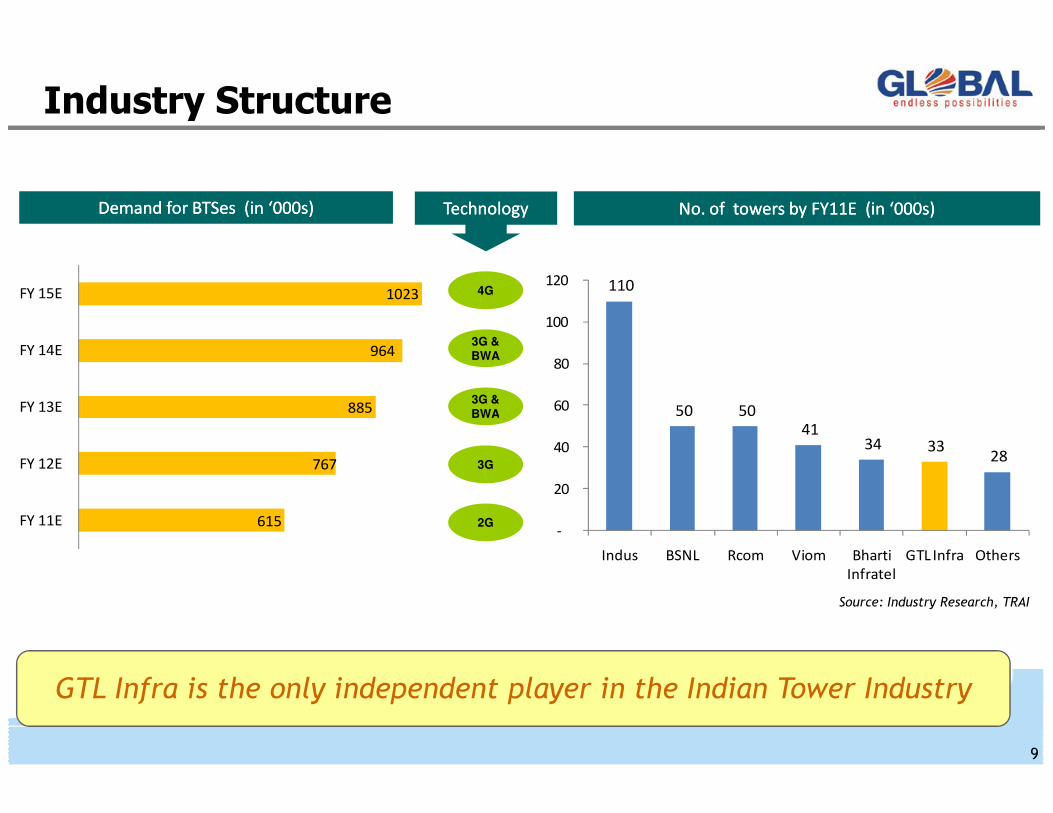
Industry Structure
TechnologyTechnologyDemand for Demand for BTSesBTSes (in ‘000s)(in ‘000s)Demand for Demand for BTSesBTSes (in ‘000s)(in ‘000s) No. of towers by FY11E (in ‘000s)No. of towers by FY11E (in ‘000s)No. of towers by FY11E (in ‘000s)No. of towers by FY11E (in ‘000s)
4G
3G &BWA
3G &
BWA
110
50 50 60
80
100
120
885
964
1023
FY 13E
FY 14E
FY 15E
BWA
3G
2G
50 50 41
34 33 28
-
20
40
60
Indus BSNL Rcom Viom Bharti
Infratel
GTL Infra Others
Source: Industry Research, TRAI
GTL Infra is the only independent player in the Indian Tower Industry
615
767
885
FY 11E
FY 12E
FY 13E
9
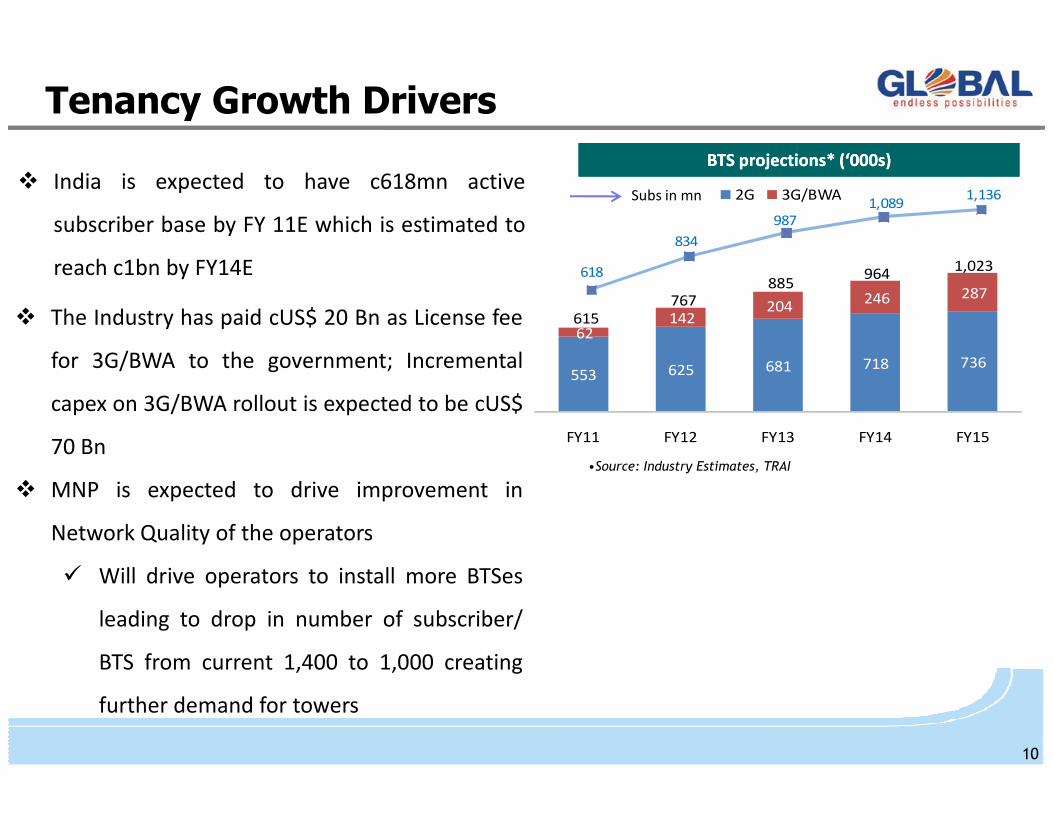
Tenancy Growth Drivers
� The Industry has paid cUS$ 20 Bn as License fee
for 3G/BWA to the government; Incremental
capex on 3G/BWA rollout is expected to be cUS$
� India is expected to have c618mn active
subscriber base by FY 11E which is estimated to
reach c1bn by FY14E
BTS projectionsBTS projections* (‘000s)* (‘000s)BTS projectionsBTS projections* (‘000s)* (‘000s)
553 625 681 718 736
62 142
204 246 287
615 767
885 964
1,023
2G 3G/BWA
618
834
987 1,089
1,136 Subs in mn
capex on 3G/BWA rollout is expected to be cUS$
70 Bn
� MNP is expected to drive improvement in
Network Quality of the operators
� Will drive operators to install more BTSes
leading to drop in number of subscriber/
BTS from current 1,400 to 1,000 creating
further demand for towers
•Source: Industry Estimates, TRAI
FY11 FY12 FY13 FY14 FY15
10
11 11
GTL Limitedwww.gtllimited.com
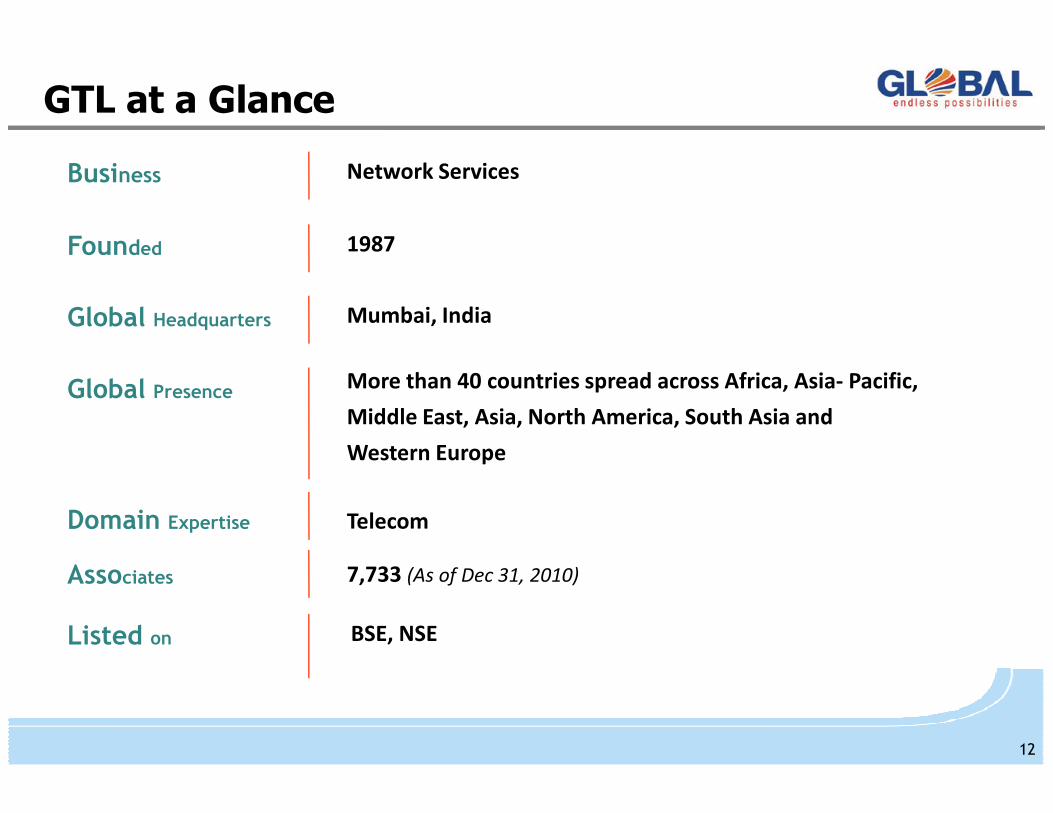
Business Network Services
Global Headquarters Mumbai, India
Founded 1987
Global Presence More than 40 countries spread across Africa, Asia- Pacific,
Middle East, Asia, North America, South Asia and
GTL at a Glance
TelecomDomain Expertise
Associates 7,733 (As of Dec 31, 2010)
Middle East, Asia, North America, South Asia and
Western Europe
Listed on BSE, NSE
12
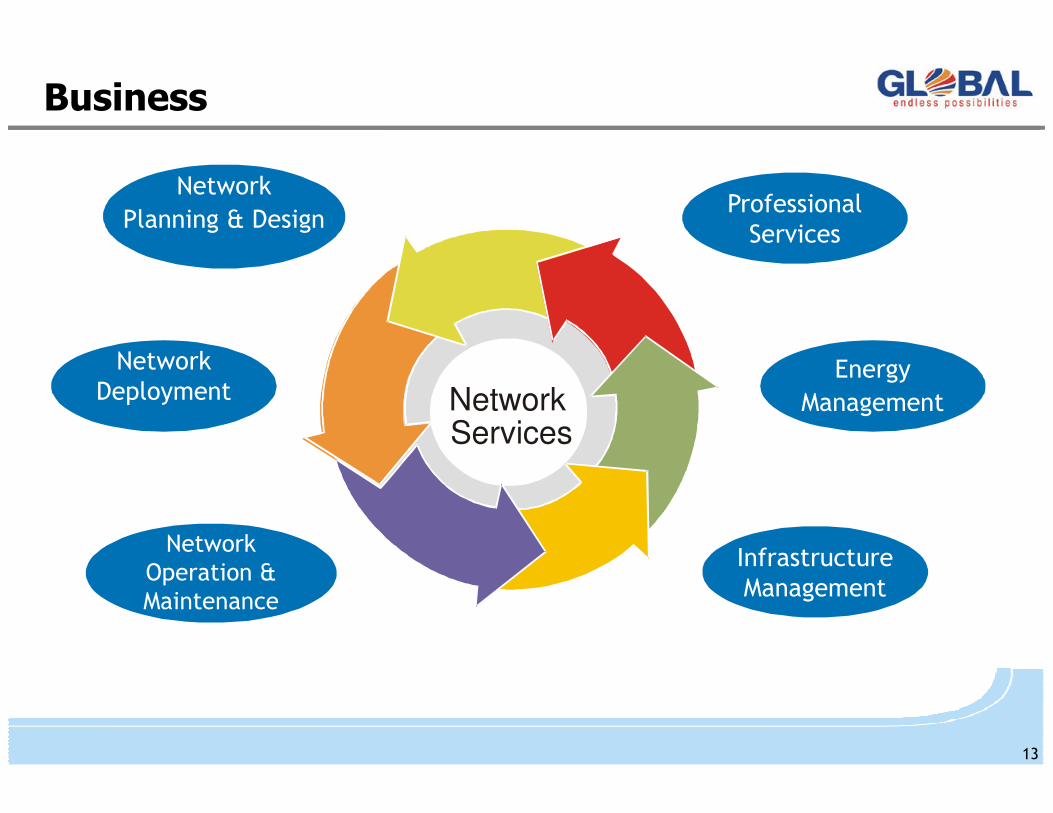
Business
Network
Network
Planning & Design
NetworkPlanning & Design
Professional Services
Network Deployment
Energy
ManagementNetworkServices
Planning & Design
Infrastructure Management
NetworkOperation & Maintenance
Management
13
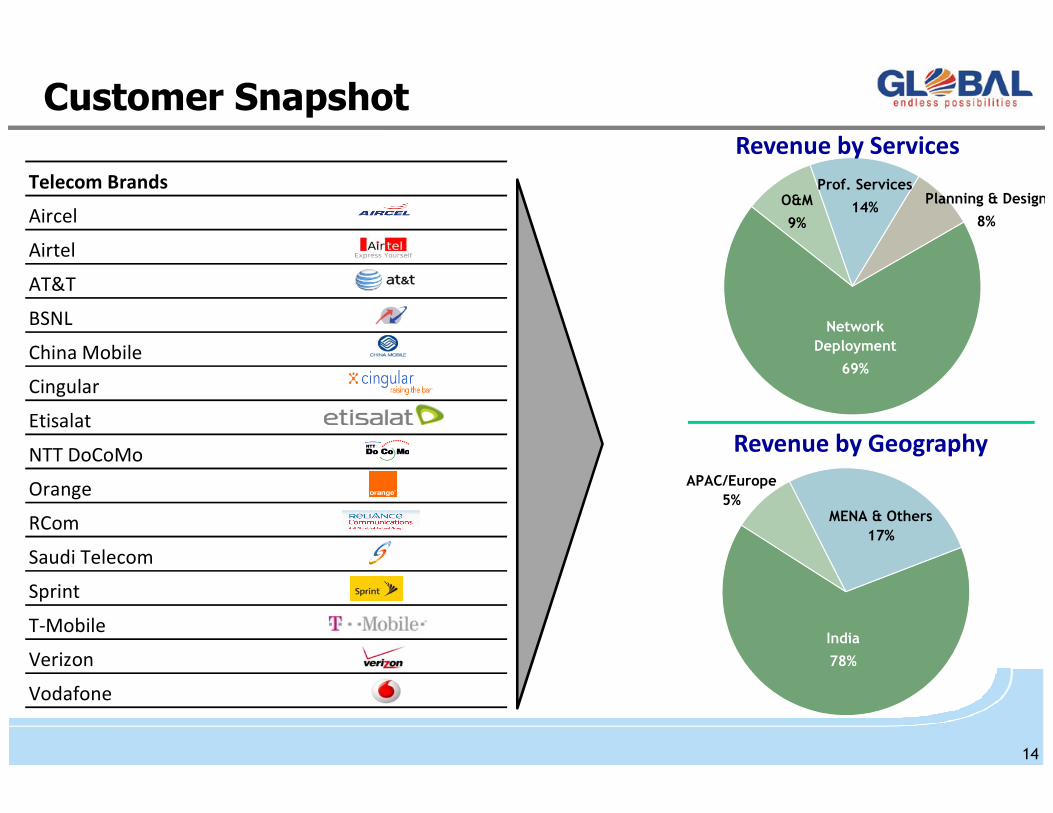
Customer SnapshotRevenue by Services
Planning & Design
8%
Prof. Services
14%O&M
9%
Network
Deployment
69%
Aircel
Airtel
AT&T
BSNL
China Mobile
Cingular
Telecom Brands
Revenue by Geography
14
APAC/Europe
5%MENA & Others
17%
Etisalat
NTT DoCoMo
Orange
RCom
Saudi Telecom
Sprint
T-Mobile
Verizon
Vodafone
India
78%
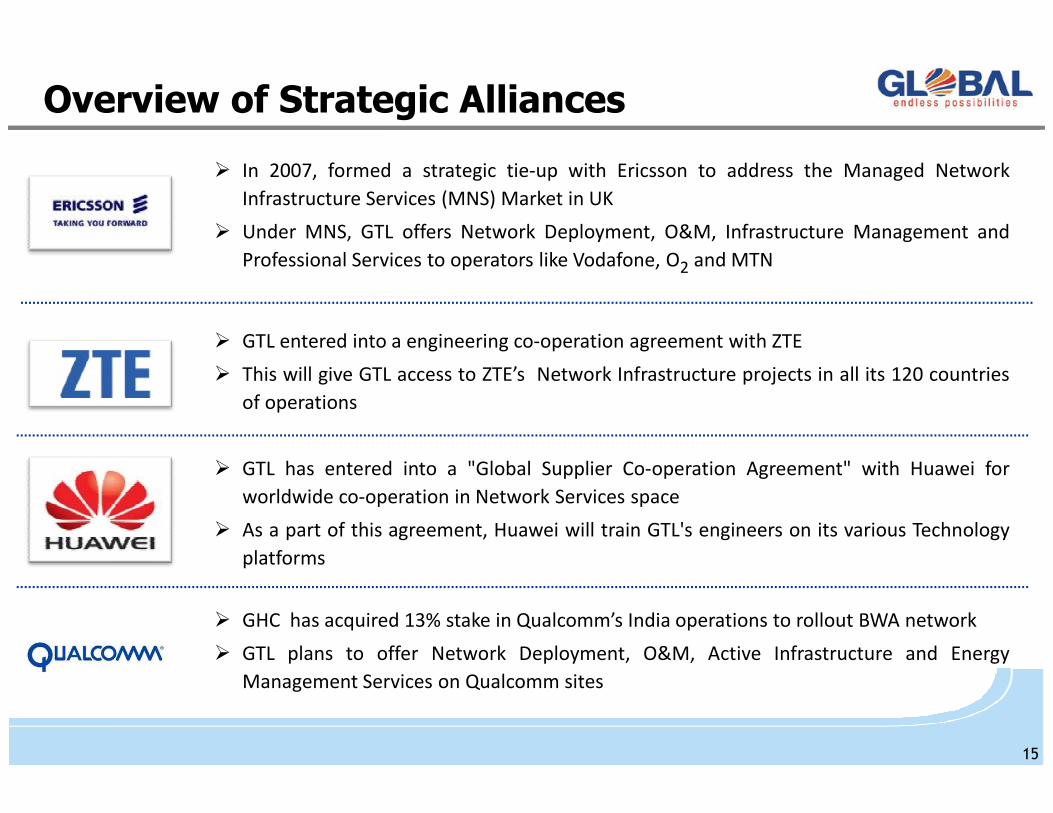
Overview of Strategic Alliances
� In 2007, formed a strategic tie-up with Ericsson to address the Managed Network
Infrastructure Services (MNS) Market in UK
� Under MNS, GTL offers Network Deployment, O&M, Infrastructure Management and
Professional Services to operators like Vodafone, O2 and MTN
� GTL entered into a engineering co-operation agreement with ZTE
� This will give GTL access to ZTE’s Network Infrastructure projects in all its 120 countries
of operationsof operations
� GTL has entered into a "Global Supplier Co-operation Agreement" with Huawei for
worldwide co-operation in Network Services space
� As a part of this agreement, Huawei will train GTL's engineers on its various Technology
platforms
15
� GHC has acquired 13% stake in Qualcomm’s India operations to rollout BWA network
� GTL plans to offer Network Deployment, O&M, Active Infrastructure and Energy
Management Services on Qualcomm sites
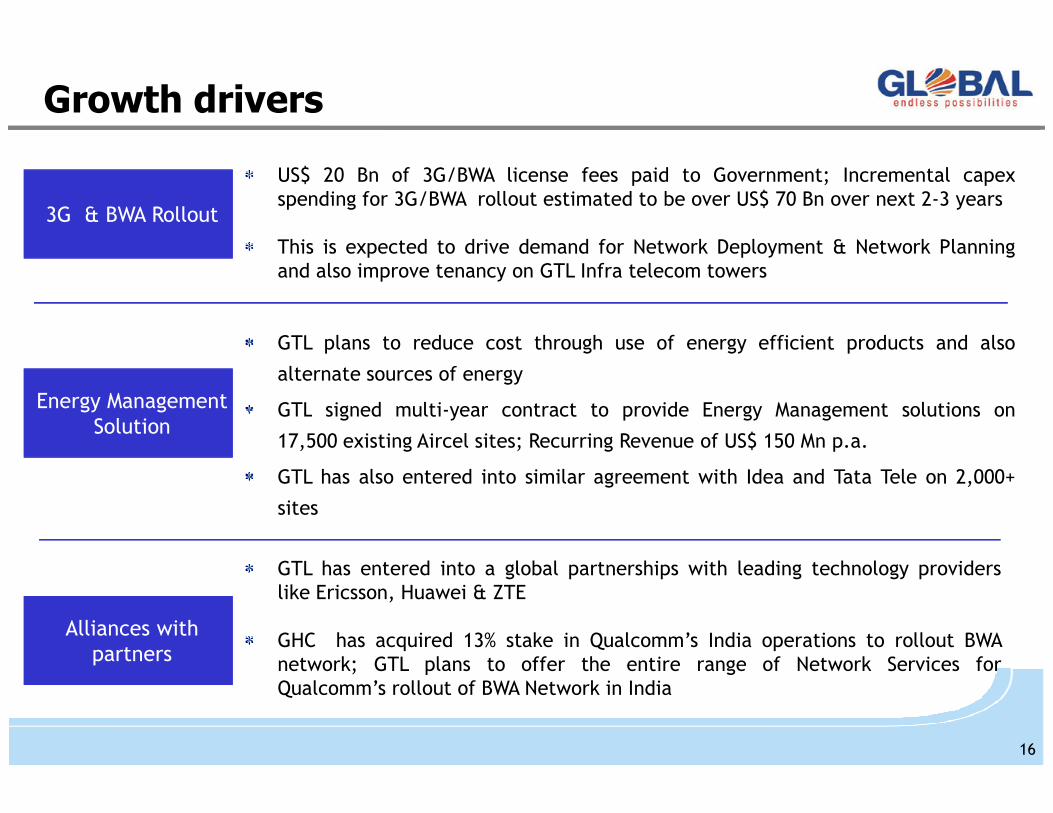
Growth drivers
3G & BWA Rollout
US$ 20 Bn of 3G/BWA license fees paid to Government; Incremental capexspending for 3G/BWA rollout estimated to be over US$ 70 Bn over next 2-3 years
This is expected to drive demand for Network Deployment & Network Planningand also improve tenancy on GTL Infra telecom towers
Energy Management Energy Management
GTL plans to reduce cost through use of energy efficient products and also
alternate sources of energy
GTL signed multi-year contract to provide Energy Management solutions on
Alliances with partners
GTL has entered into a global partnerships with leading technology providerslike Ericsson, Huawei & ZTE
GHC has acquired 13% stake in Qualcomm’s India operations to rollout BWAnetwork; GTL plans to offer the entire range of Network Services forQualcomm’s rollout of BWA Network in India
Energy Management Energy Management Solution
GTL signed multi-year contract to provide Energy Management solutions on
17,500 existing Aircel sites; Recurring Revenue of US$ 150 Mn p.a.
GTL has also entered into similar agreement with Idea and Tata Tele on 2,000+
sites
16
17 17
Energy Management Solutions
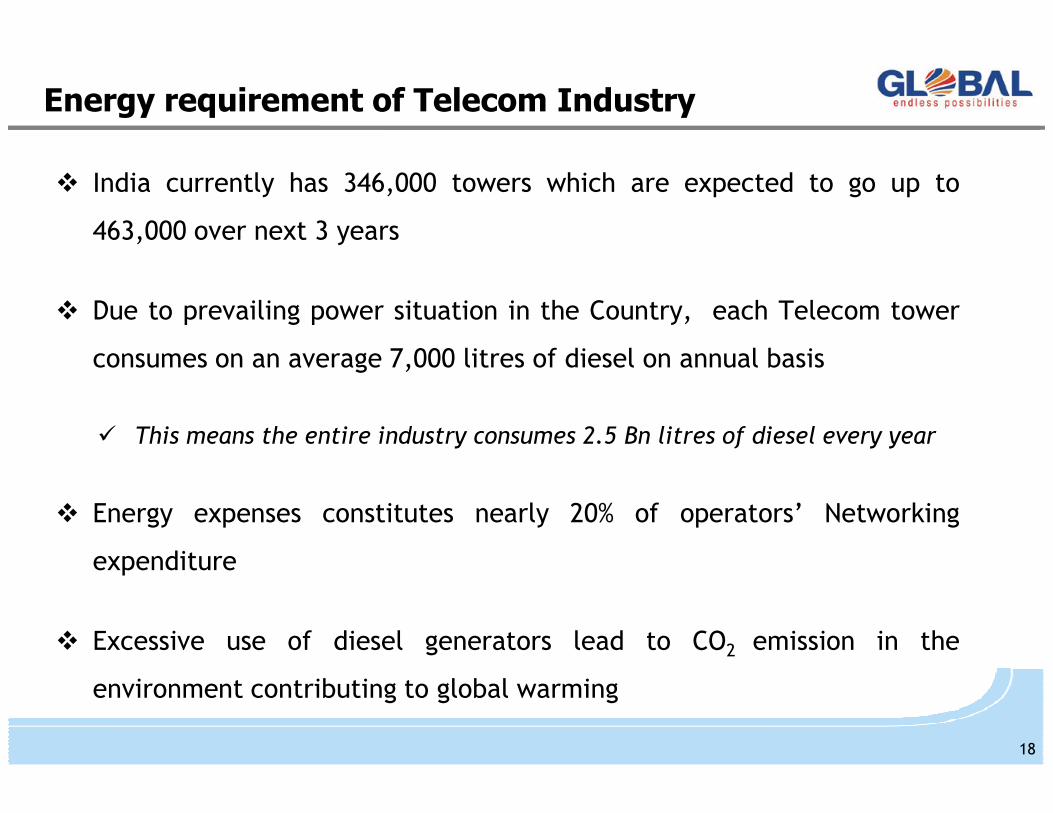
Energy requirement of Telecom Industry
� India currently has 346,000 towers which are expected to go up to
463,000 over next 3 years
� Due to prevailing power situation in the Country, each Telecom tower
consumes on an average 7,000 litres of diesel on annual basis
� This means the entire industry consumes 2.5 Bn litres of diesel every year
� Energy expenses constitutes nearly 20% of operators’ Networking
expenditure
� Excessive use of diesel generators lead to CO2 emission in the
environment contributing to global warming
18
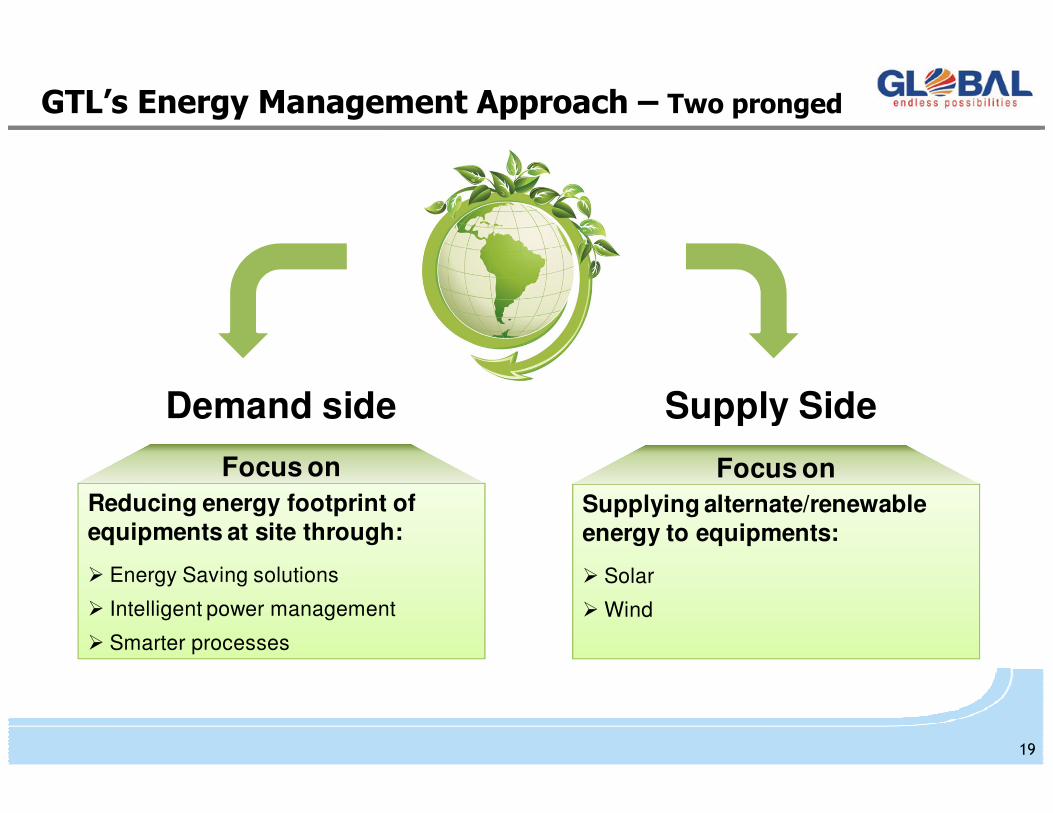
GTL’s Energy Management Approach – Two pronged
Demand side Supply Side
Reducing energy footprint of
equipments at site through:
� Energy Saving solutions
� Intelligent power management
� Smarter processes
Supplying alternate/renewable
energy to equipments:
� Solar
� Wind
Focus on
Demand side
Focus on
Supply Side
19
20 20
Awards & Recognitions
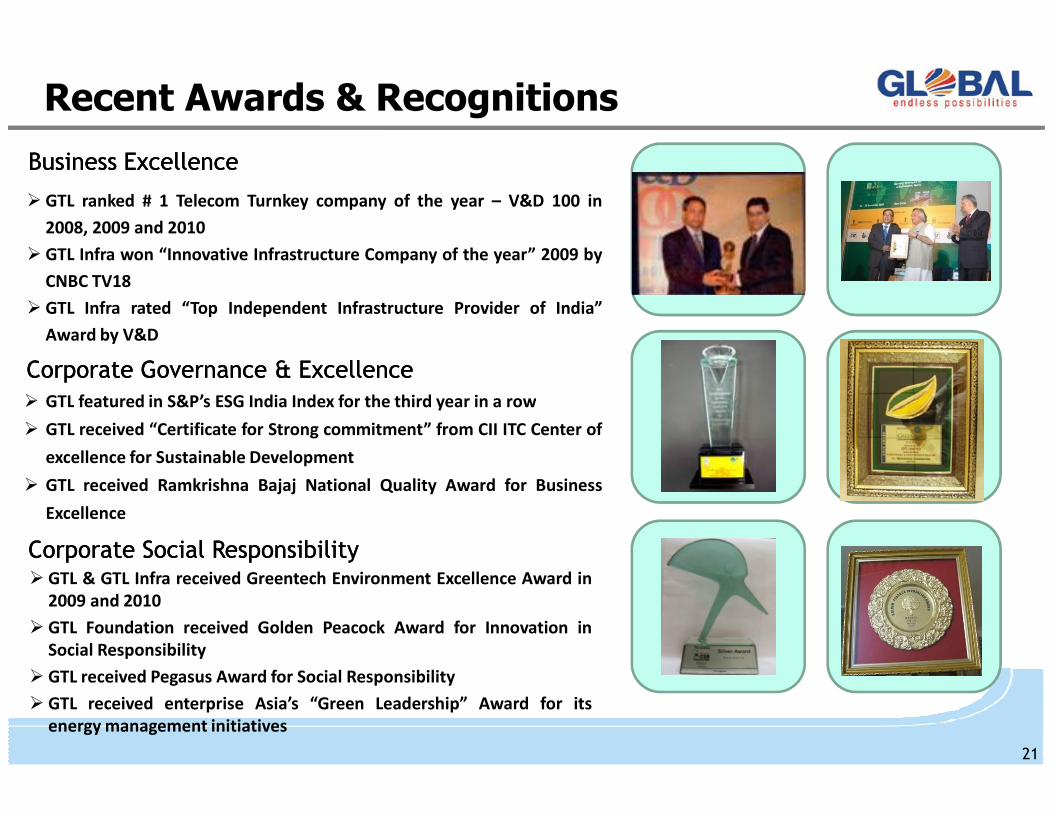
Recent Awards & Recognitions
� GTL ranked # 1 Telecom Turnkey company of the year – V&D 100 in
2008, 2009 and 2010
� GTL Infra won “Innovative Infrastructure Company of the year” 2009 by
CNBC TV18
� GTL Infra rated “Top Independent Infrastructure Provider of India”
Award by V&D
Business ExcellenceBusiness Excellence
� GTL featured in S&P’s ESG India Index for the third year in a row
Corporate Governance & ExcellenceCorporate Governance & Excellence
� GTL & GTL Infra received Greentech Environment Excellence Award in
2009 and 2010
� GTL Foundation received Golden Peacock Award for Innovation in
Social Responsibility
� GTL received Pegasus Award for Social Responsibility
� GTL received enterprise Asia’s “Green Leadership” Award for its
energy management initiatives
Corporate Social ResponsibilityCorporate Social Responsibility
� GTL featured in S&P’s ESG India Index for the third year in a row
� GTL received “Certificate for Strong commitment” from CII ITC Center of
excellence for Sustainable Development
� GTL received Ramkrishna Bajaj National Quality Award for Business
Excellence
21
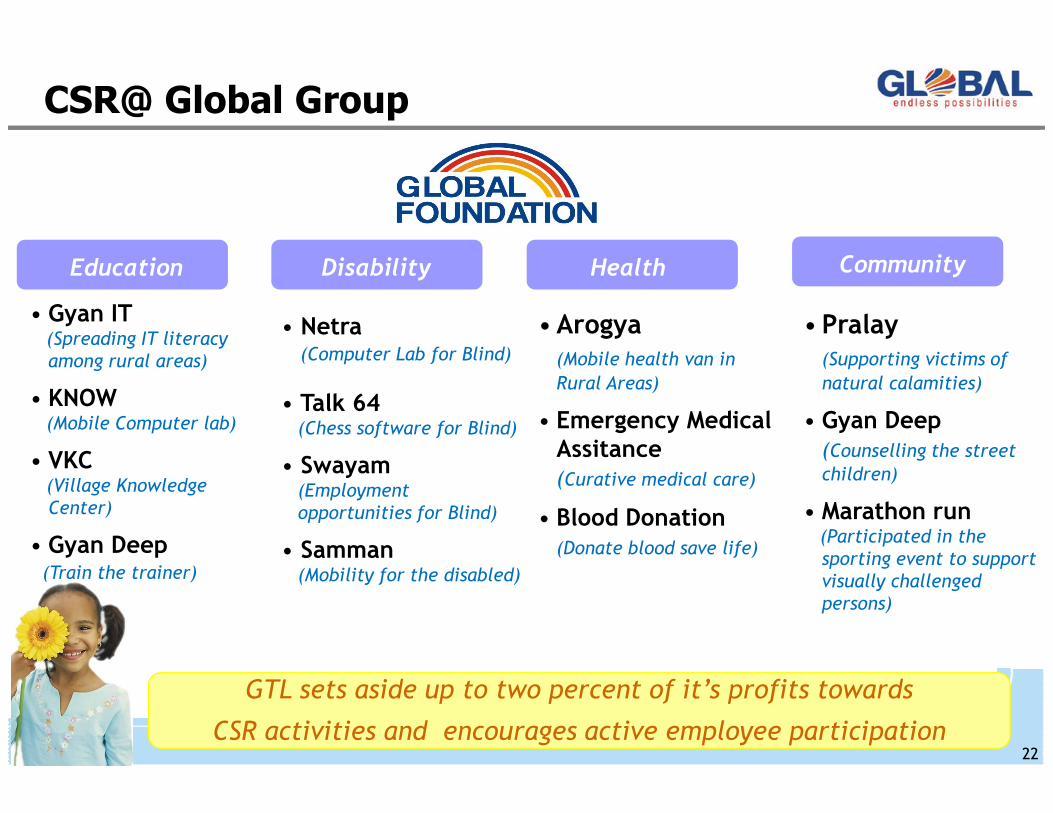
CSR@ Global Group
Education Disability
• Gyan IT (Spreading IT literacy
among rural areas)
• KNOW
• Netra(Computer Lab for Blind)
• Talk 64
Health
•Arogya (Mobile health van in
Rural Areas)
• Emergency Medical
Community
•Pralay(Supporting victims of
natural calamities)
• Gyan Deep• KNOW(Mobile Computer lab)
• VKC(Village Knowledge
Center)
• Gyan Deep(Train the trainer)
• Talk 64(Chess software for Blind)
• Swayam(Employment
opportunities for Blind)
• Samman(Mobility for the disabled)
• Emergency Medical Assitance(Curative medical care)
• Blood Donation(Donate blood save life)
22
• Gyan Deep(Counselling the street children)
• Marathon run(Participated in the
sporting event to support
visually challenged
persons)
GTL sets aside up to two percent of it’s profits towards
CSR activities and encourages active employee participation
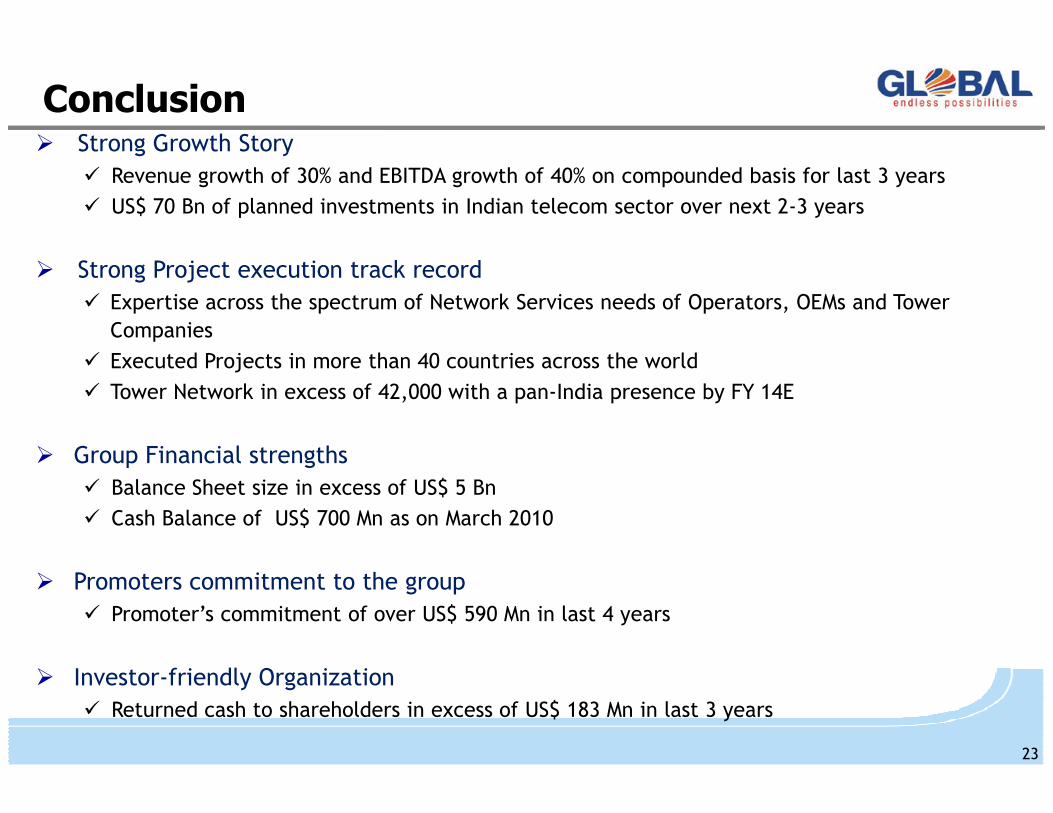
Conclusion� Strong Growth Story
� Revenue growth of 30% and EBITDA growth of 40% on compounded basis for last 3 years
� US$ 70 Bn of planned investments in Indian telecom sector over next 2-3 years
� Strong Project execution track record
� Expertise across the spectrum of Network Services needs of Operators, OEMs and Tower
Companies
� Executed Projects in more than 40 countries across the world
� Tower Network in excess of 42,000 with a pan-India presence by FY 14E
� Group Financial strengths
� Balance Sheet size in excess of US$ 5 Bn
� Cash Balance of US$ 700 Mn as on March 2010
� Promoters commitment to the group
� Promoter’s commitment of over US$ 590 Mn in last 4 years
� Investor-friendly Organization
� Returned cash to shareholders in excess of US$ 183 Mn in last 3 years
23
Thank you