Embed Size (px)
Citation preview

Putnam Global Health Care Fund
IMPORTANT NOTICE: Beginning on January 1, 2021, reports like this one will no longer automatically be sent by mail. See inside for more information.
FUND SYMBOL CLASS A
PHSTX
Annual report 8 | 31 | 19
This global sector fund invests in stocks of health-care companies worldwide.

Putnam Global Health Care FundAnnual report 8 | 31 | 19
Message from the Trustees 1
About the fund 2
Interview with your fund’s portfolio manager 5
Your fund’s performance 9
Your fund’s expenses 11
Consider these risks before investing 13
Terms and definitions 14
Other information for shareholders 15
Important notice regarding Putnam’s privacy policy 16
Trustee approval of management contract 17
Audited financial statements 22
Report of Independent Registered Public Accounting Firm 23
Federal tax information 46
About the Trustees 50
Officers 52
IMPORTANT NOTICE: Delivery of paper fund reports
In accordance with regulations adopted by the Securities and Exchange Commission, beginning on January 1, 2021, reports like this one will no longer be sent by mail unless you specifically request it. Instead, they will be on Putnam’s website, and you will be notified by mail whenever a new one is available, and provided with a website link to access the report.
If you wish to stop receiving paper reports sooner, or if you wish to continue to receive paper reports free of charge after January 1, 2021, please see the back cover or insert for instructions. If you invest through a bank or broker, your choice will apply to all funds held in your account. If you invest directly with Putnam, your choice will apply to all Putnam funds in your account.
If you already receive these reports electronically, no action is required.

October 8, 2019
Dear Fellow Shareholder:
We believe your mutual fund investment offers a number of advantages, such as investment diversification and daily liquidity. Putnam funds also include a commitment to active investing. Putnam’s portfolio managers and analysts take a research-intensive approach that incorporates risk management strategies designed to serve you through changing conditions.
To support your overall investment program, we believe that the counsel of a financial advisor is prudent. For over 80 years, Putnam has recognized the importance of professional investment advice. Your financial advisor can help in many ways, including defining and planning for goals, determining your appropriate level of risk, and reviewing your investments on a regular basis.
As always, your fund’s Board of Trustees remains committed to protecting the interests of Putnam shareholders like you. We thank you for investing with Putnam.
Respectfully yours,
Robert L. ReynoldsPresident and Chief Executive OfficerPutnam Investments
Kenneth R. LeiblerChair, Board of Trustees
Message from the Trustees

2 Global Health Care Fund Global Health Care Fund 3
About the fund
Seeking growth from health-care stocks in markets worldwideFor investors seeking growth potential, the health-care sector offers many opportunities. It spans a wide range of industries, each with a unique set of advantages. Health care is also a complex and rapidly changing sector, which means fundamental research and specialized expertise are critical for selecting stocks.
The fund is managed by an experienced health-care sector analyst
Michael J. Maguire, CFAPortfolio ManagerIndustry since 2001At Putnam since 2009
The fund’s manager and analysts conduct rigorous research to find promising stocks across an array of industries worldwide
BIOTECHNOLOGY AND PHARMACEUTICALS
There is an impressive level of innovation in this industry, where companies are developing, testing, and marketing groundbreaking treatments for health issues and diseases.
HEALTH-CARE PROVIDERS AND SERVICES
This subsector includes businesses that are seeking to deliver high-quality care at a reasonable cost, including hospitals and health insurers such as HMOs.
EQUIPMENT AND SUPPLIES
This industry includes medical technology companies that develop innovative products such as surgical equipment, coronary stents, artificial heart valves, and replacement hips and knees.
A time-tested track recordSince 1982, Putnam Global Health Care Fund has sought to capitalize on the growth potential of stocks in the health-care sector. The fund invests in businesses at different stages of growth, from small, rapidly growing companies to large, established global corporations.
We believe a number of
trends support continued
growth in the sector,
including an exceptional
level of innovation from
many companies.
About the fund

Performance history as of 8/31/19
Annualized total return (%) comparison
LIFE OF FUND*(since 5/28/82)
10 YEARS 5 YEARS 3 YEARS 1 YEAR
11.46 11.2611.93
5.496.49 6.59
8.00
1.150.27
The fund — class A shares before sales chargePutnam Global Health Care Fund (PHSTX)
Fund’s benchmarkMSCI World Health Care Index (ND)
Current performance may be lower or higher than the quoted past performance, which cannot guarantee future results. Share price, principal value, and return will fluctuate, and you may have a gain or a loss when you sell your shares. Performance of class A shares assumes reinvestment of distributions and does not account for taxes. Fund returns in the bar chart do not reflect a sales charge of 5.75%; had they, returns would have been lower. See below and pages 9–11 for additional performance information. For a portion of the periods, the fund had expense limitations, without which returns would have been lower. To obtain the most recent month-end performance, visit putnam.com.
* The fund’s benchmark, the MSCI World Health Care Index (ND), was introduced on 1/1/01, which post-dates the inception of the fund’s class A shares.
Recent broad market index and fund performance
10.17%
2.92%
2.36%
1.15%
0.27%
U.S. bonds (Bloomberg Barclays U.S. Aggregate Bond Index)
U.S. stocks (S&P 500 Index)
Cash (ICE BofAML U.S. 3-Month Treasury Bill Index)
Putnam Global Health Care Fund (class A shares before sales charge)
Fund’s benchmark (MSCI World Health Care Index (ND))
This comparison shows your fund’s performance in the context of broad market indexes for the 12 months ended 8/31/19. See above and pages 9–11 for additional fund performance information. Index descriptions can be found on pages 14–15.
4 Global Health Care Fund

Interview with your fund’s portfolio manager
Michael J. Maguire, CFAPortfolio Manager
Mike has an M.B.A. from Carnegie Mellon University and a B.S. in Accounting from Boston College. He joined Putnam in 2009 and has been in the investment industry since 2001.
Can you describe the investing environment for health‑care stocks during the period?The first three months of the period were marked by heightened volatility across nearly every sector and region worldwide. Weakening economies in Europe and China, higher U.S. interest rates, and the U.S.–China trade dispute contributed to a more risk adverse investing environment. The S&P 500 Index — a broad measure of U.S. stocks — dropped by more than 20% in December 2018. By the turn of the new year, the U.S. Federal Reserve decided to halt future interest-rate hikes and global trade tensions eased, which helped buoy stocks. By the end of February 2019, markets rebounded to recoup two-thirds of their cumulative losses.
Health-care stocks, however, continued to face a number of headwinds in 2019. The upcoming U.S. presidential election focused the media’s attention on health-care reform. Both Republicans and Democrats support platforms to reduce out-of-pocket medical expenses, especially for seniors covered by Medicare. In April 2019, Democratic candidate Bernie Sanders introduced a “Medicare for All” bill that would create a government-run system to provide health insurance for all Americans. In response, stocks of private insurers,
Mike Maguire discusses the investing environment and fund performance for the 12-month period ended August 31, 2019, as well as his outlook for health-care stocks.
Interview with your fund’s portfolio manager
Performance history as of 8/31/19
Annualized total return (%) comparison
LIFE OF FUND*(since 5/28/82)
10 YEARS 5 YEARS 3 YEARS 1 YEAR
11.46 11.2611.93
5.496.49 6.59
8.00
1.150.27
The fund — class A shares before sales chargePutnam Global Health Care Fund (PHSTX)
Fund’s benchmarkMSCI World Health Care Index (ND)
Current performance may be lower or higher than the quoted past performance, which cannot guarantee future results. Share price, principal value, and return will fluctuate, and you may have a gain or a loss when you sell your shares. Performance of class A shares assumes reinvestment of distributions and does not account for taxes. Fund returns in the bar chart do not reflect a sales charge of 5.75%; had they, returns would have been lower. See below and pages 9–11 for additional performance information. For a portion of the periods, the fund had expense limitations, without which returns would have been lower. To obtain the most recent month-end performance, visit putnam.com.
* The fund’s benchmark, the MSCI World Health Care Index (ND), was introduced on 1/1/01, which post-dates the inception of the fund’s class A shares.
Recent broad market index and fund performance
10.17%
2.92%
2.36%
1.15%
0.27%
U.S. bonds (Bloomberg Barclays U.S. Aggregate Bond Index)
U.S. stocks (S&P 500 Index)
Cash (ICE BofAML U.S. 3-Month Treasury Bill Index)
Putnam Global Health Care Fund (class A shares before sales charge)
Fund’s benchmark (MSCI World Health Care Index (ND))
This comparison shows your fund’s performance in the context of broad market indexes for the 12 months ended 8/31/19. See above and pages 9–11 for additional fund performance information. Index descriptions can be found on pages 14–15.
Global Health Care Fund 5

Top 10 holdingsHOLDING (PERCENTAGE OF FUND'S NET ASSETS) COUNTRY OVER/UNDERWEIGHT VS. BENCHMARK
Merck & Co., Inc. (7.4%) United States
UnitedHealth Group, Inc. (6.7%) United States
Novartis AG (6.1%) Switzerland
Johnson & Johnson (5.2%) United States
Danaher Corp. (4.8%) United States
AstraZeneca PLC (4.5%) United Kingdom
AbbVie, Inc. (4.5%) United States
Vertex Pharmaceuticals, Inc. (3.9%) United States
Roche Holding AG (3.8%) Switzerland
Medicines Co. (The) (3.6%) United States 3.6%
3.1%
2.4%
2.4%
–1.4%
2.2%
2.6%
3.0%
0.0%
3.0%
This table shows the fund’s top 10 holdings by percentage of the fund’s net assets as of 8/31/19. Short-term holdings and derivatives, if any, are excluded. Holdings may vary over time.
Global composition
United States 71.6%
Switzerland 11.4
United Kingdom 7.3
Denmark 2.9
Japan 2.3
Australia 1.4
France 1.2
Canada 0.2
Cash and net other assets 1.7
Allocations are shown as a percentage of the fund’s net assets as of 8/31/19. Cash and net other assets, if any, represent the market value weights of cash, derivatives, short-term securities, and other unclassified assets in the portfolio. Summary information may differ from the information in the portfolio schedule notes included in the financial statements due to the inclusion of derivative securities, any interest accruals, the exclusion of as-of trades, if any, and rounding. Holdings and allocations may vary over time.
6 Global Health Care Fund

including managed care companies, declined. Pharmaceutical and biotech stocks also faced increased volatility as investors feared the impact of lower drug prices on corporate profits. Life science and medical device companies, which are less exposed to payer and pricing changes, were a relative safe haven for investors during the reporting period.
Against this challenging backdrop, how did the fund perform?The fund’s class A shares gained 1.15% over the period, outperforming its benchmark, the MSCI World Health Care Index [ND], which rose 0.27% for the period.
Which stocks contributed the most to the fund’s relative outperformance?Danaher, a life-science technology company that sells diagnostic tools to pharmaceuticals and biomedical research firms, was the fund’s top contributor. The biggest boost to Danaher’s stock came after its February 2019 announce-ment that it would acquire the biopharma business of GE Life Sciences. Management indicated that the acquisition would add to revenues and earnings, as well as create a more diversified business for future growth.
Another top performer was Mirati Therapeutics, a biotechnology company specializing in targeted gene therapies for cancer. Mirati’s stock rallied as the company reported continued progress in its clinical trials with lung cancer patients. One of Mirati’s lead drug candidates has shown, in our view, promising pre-clinical data for patients affected by KRAS — a difficult-to-treat mutation in certain types of cancer.
AstraZeneca, the U.K.-based biopharma-ceutical giant, also aided results. During the period, we were impressed by a number of positive developments in its product pipeline. For the quarter ended June 30, 2019, six of AstraZeneca’s top-selling medicines reported double-digit sales growth. New regulatory approvals in the United States, the European
Union, and Japan also boded well for the stock’s performance.
Could you discuss some specific stocks that detracted from fund performance?Our investment in Jazz Pharmaceuticals, a biopharmaceutical company based in Ireland, was a top detractor. A few issues contributed to the stock’s weakness, including lower-than-expected financial results in the third quarter of fiscal 2018 and a delay in the U.S. Federal Drug Administration’s [FDA] review of one of the company’s key pipeline drugs. By period-end, we sold our position in Jazz.
Also dampening fund performance was Bayer, a diversified health-care company based in Germany. The stock declined as investors continued to be concerned about Bayer’s 2018 merger with Monsanto, a U.S. agrochemical company. Monsanto faces billions of dollars in lawsuits that claim its flagship weed killer caused cancer in humans. By period-end, we sold our position in Bayer.
Another disappointment was Biogen, the American multinational biotech firm. In March 2019, the stock tumbled following management’s decision to discontinue several late-stage trials of a promising Alzheimer drug. Given this setback, we reduced our position in the stock.
What is your outlook for the fund and health‑care stocks?Leading up to the U.S. election, we believe regulatory uncertainty is likely to remain an overhang for health-care stocks. Pharmaceuticals are under pressure to reduce drug prices, which could impact their earnings
We are focused on investing in large pharmaceuticals with diversified product lines, solid management, and durable cash flows. Mike Maguire
Global Health Care Fund 7

and the multiples investors are willing to pay. The fund has generally avoided companies that have concentrated drug portfolios with significant exposure to reimbursement issues. Instead, we are focused on investing in larger pharmaceuticals with diversified product lines, solid management, and durable cash flows.
For our managed care holdings, we believe “Medicare for all” will remain a headwind. However, we believe that this proposal is problematic and highly unlikely to pass. On the other hand, Medicare Advantage, the privatized version of Medicare coverage, has been a resounding success in the eyes of both Republicans and Democrats, in our view. We believe select managed care companies are attractively priced and will benefit from Medicare Advantage going forward. In addition, we believe managed care firms have long-term growth drivers, including a significant population of aging Americans.
We believe the pharmaceutical and biotech sectors’ appetite for innovation — and for
acquiring companies with groundbreaking products — has never been greater. In addition, the FDA has been quite accommodative, in our view, of companies developing breakthrough therapies that address unmet medical needs. We continue to see impressive examples of innovation in oncology, neurology, and orphan diseases — which are rare conditions that affect a relatively small number of people. In this respect, we remain quite optimistic about the prospects for health-care sector investing.
Thank you, Mike, for your time and insights today.
The views expressed in this report are exclusively those of Putnam Management and are subject to change. They are not meant as investment advice.
Please note that the holdings discussed in this report may not have been held by the fund for the entire period. Portfolio composition is subject to review in accordance with the fund’s investment strategy and may vary in the future. Current and future portfolio holdings are subject to risk.
Comparison of top industry weightings
45.1%42.3%
Pharmaceuticalsas of 2/28/19
as of 8/31/19
2.1%4.5%
Life sciences tools and services
13.0%10.8%
Health-care providers and services
22.7%18.5%
Health-care equipment and supplies
14.4%22.2%
Biotechnology
This chart shows how the fund’s top weightings have changed over the past six months. Allocations are shown as a percentage of the fund’s net assets. Current period summary information may differ from the portfolio schedule included in the financial statements due to the inclusion of derivative securities, any interest accruals, the exclusion of as-of trades, if any, the use of different classifications of securities for presentation purposes, and rounding. Holdings and allocations may vary over time.
8 Global Health Care Fund

Your fund’s performanceThis section shows your fund’s performance, price, and distribution information for periods ended August 31, 2019, the end of its most recent fiscal year. In accordance with regulatory requirements for mutual funds, we also include performance information as of the most recent calendar quarter-end and expense information taken from the fund’s current prospectus. Performance should always be considered in light of a fund’s investment strategy. Data represent past performance. Past performance does not guarantee future results. More recent returns may be less or more than those shown. Investment return and principal value will fluctuate, and you may have a gain or a loss when you sell your shares. Performance information does not reflect any deduction for taxes a shareholder may owe on fund distributions or on the redemption of fund shares. For the most recent month-end performance, please visit the Individual Investors section at putnam.com or call Putnam at 1-800-225-1581. Class R and Y shares are not available to all investors. See the Terms and definitions section in this report for definitions of the share classes offered by your fund.
Fund performance Total return for periods ended 8/31/19
Annual average
(life of fund) 10 yearsAnnual average 5 years
Annual average 3 years
Annual average 1 year
Class A (5/28/82)
Before sales charge 11.46% 190.70% 11.26% 30.66% 5.49% 21.12% 6.59% 1.15%
After sales charge 11.28 173.99 10.60 23.15 4.25 14.15 4.51 –4.66
Class B (3/1/93)
Before CDSC 11.22 173.79 10.60 25.81 4.70 18.39 5.79 0.39
After CDSC 11.22 173.79 10.60 24.68 4.51 16.26 5.15 –4.07
Class C (7/26/99)
Before CDSC 11.23 169.63 10.43 25.83 4.70 18.42 5.80 0.38
After CDSC 11.23 169.63 10.43 25.83 4.70 18.42 5.80 –0.53
Class M (7/3/95)
Before sales charge 10.84 176.53 10.71 27.44 4.97 19.31 6.06 0.67
After sales charge 10.74 166.86 10.31 22.98 4.22 15.14 4.81 –2.86
Class R (1/21/03)
Net asset value 11.18 183.54 10.98 29.04 5.23 20.21 6.33 0.91
Class Y (4/4/00)
Net asset value 11.60 197.99 11.54 32.29 5.76 22.00 6.85 1.41
Current performance may be lower or higher than the quoted past performance, which cannot guarantee future results. After-sales-charge returns for class A and M shares reflect the deduction of the maximum 5.75% and 3.50% sales charge, respectively, levied at the time of purchase. Class B share returns after contingent deferred sales charge (CDSC) reflect the applicable CDSC, which is 5% in the first year, declining over time to 1% in the sixth year, and is eliminated thereafter. Class C share returns after CDSC reflect a 1% CDSC for the first year that is eliminated thereafter. Class R and Y shares have no initial sales charge or CDSC. Performance for class B, C, M, R, and Y shares before their inception is derived from the historical performance of class A shares, adjusted for the applicable sales charge (or CDSC) and the higher operating expenses for such shares, except for class Y shares, for which 12b-1 fees are not applicable.
For a portion of the periods, the fund had expense limitations, without which returns would have been lower.
Class B share performance reflects conversion to class A shares after eight years.
Class C share performance reflects conversion to class A shares after 10 years.
Global Health Care Fund 9

Comparative index returns For periods ended 8/31/19
Annual average
(life of fund) 10 yearsAnnual average 5 years
Annual average 3 years
Annual average 1 year
MSCI World Health Care Index (ND) —* 208.60% 11.93% 36.97% 6.49% 25.96% 8.00% 0.27%
Index results should be compared with fund performance before sales charge, before CDSC, or at net asset value. * The fund’s benchmark, the MSCI World Health Care Index (ND), was introduced on 1/1/01, which post-dates the
inception of the fund’s class A shares.
Change in the value of a $10,000 investment ($9,425 after sales charge)Cumulative total return from 8/31/09 to 8/31/19
Past performance does not indicate future results. At the end of the same time period, a $10,000 investment in the fund’s class B and C shares would have been valued at $27,379 and $26,963, respectively, and no contingent deferred sales charges would apply. A $10,000 investment in the fund’s class M shares ($9,650 after sales charge) would have been valued at $26,686. A $10,000 investment in the fund’s class R and Y shares would have been valued at $28,354 and $29,799, respectively.
Fund price and distribution information For the 12-month period ended 8/31/19
Distributions Class A Class B Class C Class M Class R Class Y
Number 1 1 1 1 1 1
Income $0.034 — — — — $0.169
Capital gains
Long-term gains 2.602 $2.602 $2.602 $2.602 $2.602 2.602
Short-term gains 0.485 0.485 0.485 0.485 0.485 0.485
Total $3.121 $3.087 $3.087 $3.087 $3.087 $3.256
Share value
Before sales
charge
After sales
charge
Net asset value
Net asset value
Before sales
charge
After sales
charge
Net asset value
Net asset value
8/31/18 $54.00 $57.29 $31.90 $40.29 $42.00 $43.52 $50.40 $57.97
8/31/19 50.99 54.10 28.45 36.87 38.70 40.10 47.27 54.99
The classification of distributions, if any, is an estimate. Before-sales-charge share value and current dividend rate for class A and M shares, if applicable, do not take into account any sales charge levied at the time of purchase. After-sales-charge share value, current dividend rate, and current 30-day SEC yield, if applicable, are calculated assuming that the maximum sales charge (5.75% for class A shares and 3.50% for class M shares) was levied at the time of purchase. Final distribution information will appear on your year-end tax forms.
$5,000
$10,000
$15,000
$20,000
’09 ’10 ’11 ’12 ’13 ’14 ’15 ’16 ’17 ’18 ’19
Putnam Global Health Care Fund class A shares a�er sales charge
MSCI World Health Care Index (ND)
$9,425
$27,399
$30,860
10 Global Health Care Fund

Fund performance as of most recent calendar quarter Total return for periods ended 9/30/19
Annual average
(life of fund) 10 yearsAnnual average 5 years
Annual average 3 years
Annual average 1 year
Class A (5/28/82)
Before sales charge 11.42% 182.12% 10.93% 28.64% 5.17% 19.67% 6.17% –0.65%
After sales charge 11.24 165.90 10.27 21.24 3.93 12.78 4.09 –6.36
Class B (3/1/93)
Before CDSC 11.18 165.66 10.26 23.89 4.38 16.98 5.37 –1.41
After CDSC 11.18 165.66 10.26 22.78 4.19 14.88 4.73 –5.79
Class C (7/26/99)
Before CDSC 11.19 161.70 10.10 23.90 4.38 17.01 5.38 –1.39
After CDSC 11.19 161.70 10.10 23.90 4.38 17.01 5.38 –2.29
Class M (7/3/95)
Before sales charge 10.80 168.37 10.38 25.50 4.65 17.92 5.65 –1.12
After sales charge 10.70 158.97 9.98 21.11 3.90 13.79 4.40 –4.59
Class R (1/21/03)
Net asset value 11.14 175.11 10.65 27.06 4.91 18.78 5.90 –0.90
Class Y (4/4/00)
Net asset value 11.56 189.28 11.21 30.27 5.43 20.57 6.43 –0.41
See the discussion following the fund performance table on page 9 for information about the calculation of fund performance.
Your fund’s expensesAs a mutual fund investor, you pay ongoing expenses, such as management fees, distribution fees (12b-1 fees), and other expenses. Using the following information, you can estimate how these expenses affect your investment and compare them with the expenses of other funds. You may also pay one-time transaction expenses, including sales charges (loads) and redemption fees, which are not shown in this section and would have resulted in higher total expenses. For more information, see your fund’s prospectus or talk to your financial representative.
Expense ratiosClass A Class B Class C Class M Class R Class Y
Total annual operating expenses for the fiscal year ended 8/31/18 1.08% 1.83% 1.83% 1.58% 1.33% 0.83%
Annualized expense ratio for the six-month period ended 8/31/19* 1.08% 1.83% 1.83% 1.58% 1.33% 0.83%
Fiscal-year expense information in this table is taken from the most recent prospectus, is subject to change, and may differ from that shown for the annualized expense ratio and in the financial highlights of this report.
Expenses are shown as a percentage of average net assets. * Expense ratios for each class are for the fund’s most recent fiscal half year. As a result of this, ratios may differ from
expense ratios based on one-year data in the financial highlights.
Global Health Care Fund 11

Expenses per $1,000The following table shows the expenses you would have paid on a $1,000 investment in each class of the fund from 3/1/19 to 8/31/19. It also shows how much a $1,000 investment would be worth at the close of the period, assuming actual returns and expenses.
Class A Class B Class C Class M Class R Class Y
Expenses paid per $1,000*† $5.49 $9.28 $9.28 $8.02 $6.76 $4.22
Ending value (after expenses) $1,016.50 $1,012.50 $1,012.60 $1,014.20 $1,015.20 $1,017.80
* Expenses for each share class are calculated using the fund’s annualized expense ratio for each class, which represents the ongoing expenses as a percentage of average net assets for the six months ended 8/31/19. The expense ratio may differ for each share class.
† Expenses are calculated by multiplying the expense ratio by the average account value for the period; then multiplying the result by the number of days in the period; and then dividing that result by the number of days in the year.
Estimate the expenses you paidTo estimate the ongoing expenses you paid for the six months ended 8/31/19, use the following calculation method. To find the value of your investment on 3/1/19, call Putnam at 1-800-225-1581.
How to calculate the expenses you paid
Value of your investment on 3/1/19 ÷ $1,000 x Expenses paid per $1,000 = Total expenses paid
Example Based on a $10,000 investment in class A shares of your fund.
$10,000 ÷ $1,000 x $5.49 (see preceding table) = $54.90
Compare expenses using the SEC’s methodThe Securities and Exchange Commission (SEC) has established guidelines to help investors assess fund expenses. Per these guidelines, the following table shows your fund’s expenses based on a $1,000 investment, assuming a hypothetical 5% annualized return. You can use this information to compare the ongoing expenses (but not transaction expenses or total costs) of investing in the fund with those of other funds. All mutual fund shareholder reports will provide this information to help you make this comparison. Please note that you cannot use this information to estimate your actual ending account balance and expenses paid during the period.
Class A Class B Class C Class M Class R Class Y
Expenses paid per $1,000*† $5.50 $9.30 $9.30 $8.03 $6.77 $4.23
Ending value (after expenses) $1,019.76 $1,015.98 $1,015.98 $1,017.24 $1,018.50 $1,021.02
* Expenses for each share class are calculated using the fund’s annualized expense ratio for each class, which represents the ongoing expenses as a percentage of average net assets for the six months ended 8/31/19. The expense ratio may differ for each share class.
† Expenses are calculated by multiplying the expense ratio by the average account value for the six-month period; then multiplying the result by the number of days in the six-month period; and then dividing that result by the number of days in the year.
12 Global Health Care Fund

Consider these risks before investingInternational investing involves currency, economic, and political risks. Emerging-market securities carry illiquidity and volatility risks. Investments in small and/or midsize companies increase the risk of greater price fluctuations. The health care industries may be affected by technological obsolescence, changes in regulatory approval policies for drugs, medical devices, or procedures, and changes in governmental and private payment systems. The fund concentrates on a limited group of industries and is non-diversified. Because the fund may invest in fewer issuers than a diversified fund, it is vulnerable to common economic forces and may result in greater losses and volatility. Growth stocks may be more susceptible to earnings disappointments, and value stocks may fail to rebound. The use of short selling may result in losses if the securities appreciate in value. Risks associated with derivatives include increased investment exposure (which may be considered leverage) and, in the case of over-the-counter instruments, the potential inability to terminate or sell derivatives positions and the potential failure of the other party to the instrument to meet its obligations. The value of investments in the fund’s portfolio may fall or fail to rise over extended periods of time for a variety of reasons, including general economic, political, or financial market conditions; investor sentiment and market perceptions; government actions; geopolitical events or changes; and factors related to a specific issuer, geography, industry, or sector. These and other factors may lead to increased volatility and reduced liquidity in the fund’s portfolio holdings. You can lose money by investing in the fund.
Global Health Care Fund 13

Terms and definitions
Important termsTotal return shows how the value of the fund’s shares changed over time, assuming you held the shares through the entire period and reinvested all distributions in the fund.
Before sales charge, or net asset value, is the price, or value, of one share of a mutual fund, without a sales charge. Before-sales-charge figures fluctuate with market conditions, and are calculated by dividing the net assets of each class of shares by the number of outstanding shares in the class.
After sales charge is the price of a mutual fund share plus the maximum sales charge levied at the time of purchase. After-sales-charge perfor-mance figures shown here assume the 5.75% maximum sales charge for class A shares and 3.50% for class M shares.
Contingent deferred sales charge (CDSC) is generally a charge applied at the time of the redemption of class B or C shares and assumes redemption at the end of the period. Your fund’s class B CDSC declines over time from a 5% maximum during the first year to 1% during the sixth year. After the sixth year, the CDSC no longer applies. The CDSC for class C shares is 1% for one year after purchase.
Share classesClass A shares are generally subject to an initial sales charge and no CDSC (except on certain redemptions of shares bought without an initial sales charge).
Class B shares are closed to new investments and are only available by exchange from another Putnam fund or through dividend and/or capital gains reinvestment. They are not subject to an initial sales charge and may be subject to a CDSC.
Class C shares are not subject to an initial sales charge and are subject to a CDSC only if the shares are redeemed during the first year.
Class M shares have a lower initial sales charge and a higher 12b-1 fee than class A shares and no CDSC.
Class R shares are not subject to an initial sales charge or CDSC and are only available to employer-sponsored retirement plans.
Class Y shares are not subject to an initial sales charge or CDSC and carry no 12b-1 fee. They are generally only available to corporate and institutional clients and clients in other approved programs.
Comparative indexesBloomberg Barclays U.S. Aggregate Bond Index is an unmanaged index of U.S. investment-grade fixed-income securities.
ICE BofAML (Intercontinental Exchange Bank of America Merrill Lynch) U.S. 3-Month Treasury Bill Index is an unmanaged index that seeks to measure the performance of U.S. Treasury bills available in the marketplace.
MSCI World Health Care Index (ND) is a free float-adjusted market capitalization weighted index that is designed to measure the equity market performance of developed markets in the health-care sector. Calculated with net dividends (ND), this total return index reflects the reinvestment of dividends after the deduction of withholding taxes, using a tax rate applicable to non-resident institutional investors who do not benefit from double taxation treaties.
S&P 500 Index is an unmanaged index of common stock performance.Indexes assume reinvestment of all distributions and do not account for fees. Securities and performance of a fund and an index will differ. You cannot invest directly in an index.
ICE Data Indices, LLC (“ICE BofAML”), used with permis-sion. ICE BofAML permits use of the ICE BofAML indices and related data on an “as is” basis; makes no warran-ties regarding same; does not guarantee the suitability, quality, accuracy, timeliness, and/or completeness of the ICE BofAML indices or any data included in,
14 Global Health Care Fund

related to, or derived therefrom; assumes no liability in connection with the use of the foregoing; and does not
sponsor, endorse, or recommend Putnam Investments, or any of its products or services.
Other information for shareholders
Proxy votingPutnam is committed to managing our mutual funds in the best interests of our shareholders. The Putnam funds’ proxy voting guidelines and procedures, as well as information regarding how your fund voted proxies relating to portfolio securities during the 12-month period ended June 30, 2019, are available in the Individual Investors section of putnam.com and on the Securities and Exchange Commis-sion (SEC) website, www.sec.gov. If you have questions about finding forms on the SEC’s website, you may call the SEC at 1-800-SEC-0330. You may also obtain the Putnam funds’ proxy voting guidelines and procedures at no charge by calling Putnam’s Shareholder Services at 1-800-225-1581.
Fund portfolio holdingsThe fund will file a complete schedule of its portfolio holdings with the SEC for the first and third quarters of each fiscal year on
Form N-PORT within 60 days of the end of such fiscal quarter. Shareholders may obtain the fund’s Form N-PORT on the SEC’s website at www.sec.gov.
Prior to its use of Form N-PORT, the fund filed its complete schedule of its portfolio holdings with the SEC on Form N-Q, which is available online at www.sec.gov.
Trustee and employee fund ownershipPutnam employees and members of the Board of Trustees place their faith, confidence, and, most importantly, investment dollars in Putnam mutual funds. As of August 31, 2019, Putnam employees had approximately $470,000,000 and the Trustees had approxi-mately $72,000,000 invested in Putnam mutual funds. These amounts include investments by the Trustees’ and employees’ immediate family members as well as investments through retirement and deferred compensation plans.
Global Health Care Fund 15

Important notice regarding Putnam’s privacy policy
In order to conduct business with our shareholders, we must obtain certain personal information such as account holders’ names, addresses, Social Security numbers, and dates of birth. Using this information, we are able to maintain accurate records of accounts and transactions.
It is our policy to protect the confidentiality of our shareholder information, whether or not a shareholder currently owns shares of our funds. In particular, it is our policy not to sell information about you or your accounts to outside marketing firms. We have safeguards in place designed to prevent unauthorized access
to our computer systems and procedures to protect personal information from unauthorized use.
Under certain circumstances, we must share account information with outside vendors who provide services to us, such as mailings and proxy solicitations. In these cases, the service providers enter into confidentiality agreements with us, and we provide only the information necessary to process transactions and perform other services related to your account. Finally, it is our policy to share account information with your financial representative, if you’ve listed one on your Putnam account.
16 Global Health Care Fund

Trustee approval of management contract
Trustee approval of management contract
General conclusionsThe Board of Trustees of The Putnam Funds oversees the management of each fund and, as required by law, determines annually whether to approve the continuance of your fund’s management contract with Putnam Investment Management, LLC (“Putnam Management”), the sub-management contract with respect to your fund between Putnam Management and its affiliate, Putnam Investments Limited (“PIL”), and the sub-advisory contract among Putnam Management, PIL, and another affiliate, The Putnam Advisory Company (“PAC”). The Board, with the assistance of its Contract Committee, requests and evaluates all information it deems reasonably necessary under the circumstances in connection with its annual contract review. The Contract Committee consists solely of Trustees who are not “interested persons” (as this term is defined in the Investment Company Act of 1940, as amended (the “1940 Act”)) of The Putnam Funds (“Independent Trustees”).
At the outset of the review process, members of the Board’s independent staff and independent legal counsel discussed with representatives of Putnam Management the annual contract review materials furnished to the Contract Committee during the course of the previous year’s review, identifying possible changes in these materi-als that might be necessary or desirable for the coming year. Following these discussions and in consultation with the Contract Committee, the Independent Trustees’ independent legal counsel requested that Putnam Management and its affiliates furnish specified information, together with any additional information that Putnam Management considered relevant, to the Contract Committee. Over the course of several months ending in June 2019, the Contract Committee met on a number of occasions with representatives of Putnam Management, and separately in executive session, to consider the information that Putnam Management provided. Throughout this process, the Contract Committee was assisted by the members of the Board’s independent staff and by independent legal counsel for The Putnam Funds and the Independent Trustees.
In May 2019, the Contract Committee met in executive session to discuss and consider its recommendations with respect to the continuance of the contracts. At the Trustees’
June 2019 meeting, the Contract Committee met in executive session with the other Independent Trustees to review a summary of the key financial, performance and other data that the Contract Committee considered in the course of its review. The Contract Committee then presented its written report, which summarized the key factors that the Committee had considered and set forth its recommendations. The Contract Committee recommended, and the Independent Trust-ees approved, the continuance of your fund’s management, sub-management and sub-advisory contracts, effective July 1, 2019. (Because PIL and PAC are affiliates of Putnam Management and Putnam Management remains fully responsible for all services provided by PIL and PAC, the Trust-ees have not attempted to evaluate PIL or PAC as separate entities, and all subsequent references to Putnam Management below should be deemed to include reference to PIL and PAC as necessary or appropriate in the context.)
The Independent Trustees’ approval was based on the following conclusions:
• That the fee schedule in effect for your fund repre-sented reasonable compensation in light of the nature and quality of the services being provided to the fund, the fees paid by competitive funds, the costs incurred by Putnam Management in providing services to the fund, and the appli-cation of certain reductions and waivers noted below; and
• That the fee schedule in effect for your fund represented an appropriate sharing between fund shareholders and Putnam Management of such economies of scale as may exist in the management of the fund at current asset levels.
These conclusions were based on a comprehen-sive consideration of all information provided to the Trustees and were not the result of any single factor. Some of the factors that figured particu-larly in the Trustees’ deliberations and how the Trustees considered these factors are described below, although individual Trustees may have evaluated the information presented differently, giving different weights to various factors. It is also important to recognize that the management arrangements for your fund and the other Putnam funds are the result of many years of review and discussion between the Independent Trustees and Putnam Management, that some aspects of
Global Health Care Fund 17

the arrangements may receive greater scrutiny in some years than others, and that the Trust-ees’ conclusions may be based, in part, on their consideration of fee arrangements in previous years. For example, with some minor exceptions, the funds’ current fee arrangements under the management contracts were first implemented at the beginning of 2010 following extensive review by the Contract Committee and discussions with representatives of Putnam Management, as well as approval by shareholders.
Management fee schedules and total expensesThe Trustees reviewed the management fee schedules in effect for all Putnam funds, includ-ing fee levels and breakpoints. The Trustees also reviewed the total expenses of each Putnam fund, recognizing that in most cases manage-ment fees represented the major, but not the sole, determinant of total costs to fund shareholders. (Two funds have implemented so-called “all-in” management fees covering substantially all routine fund operating costs.)
In reviewing fees and expenses, the Trustees generally focus their attention on material changes in circumstances — for example, changes in assets under management, changes in a fund’s investment strategy, changes in Putnam Management’s operating costs or profitability, or changes in competitive practices in the mutual fund industry — that suggest that consideration of fee changes might be warranted. The Trustees concluded that the circumstances did not indicate that changes to the management fee structure for your fund would be appropriate at this time.
Under its management contract, your fund has the benefit of breakpoints in its management fee schedule that provide shareholders with econo-mies of scale in the form of reduced fee rates as assets under management in the Putnam family of funds increase. The Trustees concluded that the fee schedule in effect for your fund represented an appropriate sharing of econo-mies of scale between fund shareholders and Putnam Management.
As in the past, the Trustees also focused on the competitiveness of each fund’s total expense ratio. In order to support the effort to have fund expenses meet competitive standards, the Trustees and Putnam Management and the funds’ investor servicing agent, Putnam Investor Services, Inc. (“PSERV”), have implemented
expense limitations that were in effect during your fund’s fiscal year ending in 2018. These expense limitations were: (i) a contractual expense limita-tion applicable to all open-end funds of 25 basis points on investor servicing fees and expenses and (ii) a contractual expense limitation appli-cable to specified open-end funds, including your fund, of 20 basis points on so-called “other expenses” (i.e., all expenses exclusive of manage-ment fees, distribution fees, investor servicing fees, investment-related expenses, interest, taxes, brokerage commissions, acquired fund fees and expenses and extraordinary expenses). These expense limitations attempt to maintain competitive expense levels for the funds. Most funds, including your fund, had sufficiently low expenses that these expense limitations were not operative during their fiscal years ending in 2018. Putnam Management and PSERV have agreed to maintain these expense limitations until at least December 30, 2020. The support of Putnam Management and PSERV for these expense limita-tion arrangements was an important factor in the Trustees’ decision to approve the continuance of your fund’s management, sub-management and sub-advisory contracts.
The Trustees reviewed comparative fee and expense information for a custom group of competitive funds selected by Broadridge Financial Solutions, Inc. (“Broadridge”). This comparative information included your fund’s percentile ranking for effective management fees and total expenses (excluding any applicable 12b-1 fees), which provides a general indication of your fund’s relative standing. In the custom peer group, your fund ranked in the first quintile in effective management fees (determined for your fund and the other funds in the custom peer group based on fund asset size and the applicable contractual management fee schedule) and in the second quintile in total expenses (excluding any applicable 12b-1 fees) as of December 31, 2018. The first quintile represents the least expensive funds and the fifth quintile the most expensive funds. The fee and expense data reported by Broadridge as of December 31, 2018 reflected the most recent fiscal year-end data available in Broadridge’s database at that time.
In connection with their review of fund manage-ment fees and total expenses, the Trustees also reviewed the costs of the services provided and the profits realized by Putnam Management and its affiliates from their contractual relationships with the funds. This information included trends
18 Global Health Care Fund

in revenues, expenses and profitability of Putnam Management and its affiliates relating to the investment management, investor servicing and distribution services provided to the funds. In this regard, the Trustees also reviewed an analysis of Putnam Management’s revenues, expenses and profitability, allocated on a fund-by-fund basis, with respect to the funds’ management, distribu-tion, and investor servicing contracts. For each fund, the analysis presented information about revenues, expenses and profitability for each of the agreements separately and for the agree-ments taken together on a combined basis. The Trustees concluded that, at current asset levels, the fee schedules in place represented reasonable compensation for the services being provided and represented an appropriate sharing between fund shareholders and Putnam Management of such economies of scale as may exist in the management of the Putnam funds at that time.
The information examined by the Trustees in connection with their annual contract review for the Putnam funds included information regard-ing fees charged by Putnam Management and its affiliates to institutional clients, including defined benefit pension and profit-sharing plans and sub-advised mutual funds. This information included, in cases where an institutional product’s investment strategy corresponds with a fund’s strategy, comparisons of those fees with fees charged to the Putnam funds, as well as an assess-ment of the differences in the services provided to these different types of clients as compared to the services provided to the Putnam funds. The Trustees observed that the differences in fee rates between these clients and the Putnam funds are by no means uniform when examined by individ-ual asset sectors, suggesting that differences in the pricing of investment management services to these types of clients may reflect, among other things, historical competitive forces operating in separate markets. The Trustees considered the fact that in many cases fee rates across different asset classes are higher on average for mutual funds than for institutional clients, and the Trust-ees also considered the differences between the services that Putnam Management provides to the Putnam funds and those that it provides to its other clients. The Trustees did not rely on these comparisons to any significant extent in conclud-ing that the management fees paid by your fund are reasonable.
Investment performanceThe quality of the investment process provided by Putnam Management represented a major factor in the Trustees’ evaluation of the quality of services provided by Putnam Management under your fund’s management contract. The Trustees were assisted in their review of the Putnam funds’ investment process and performance by the work of the investment oversight committees of the Trustees and the full Board of Trustees, which meet on a regular basis with the funds’ portfolio teams and with the Chief Investment Officers and other senior members of Putnam Management’s Investment Division throughout the year. The Trustees concluded that Putnam Management generally provides a high-quality investment process — based on the experience and skills of the individuals assigned to the management of fund portfolios, the resources made available to them, and in general Putnam Manage-ment’s ability to attract and retain high-quality personnel — but also recognized that this does not guarantee favorable investment results for every fund in every time period.
The Trustees considered that, after a strong start to the year, 2018 was a mixed year for The Putnam Funds, with the Putnam open-end Funds’ perfor-mance, on an asset-weighted basis, ranking in the 54th percentile of their Lipper Inc. (“Lipper”) peers (excluding those Putnam funds that are evaluated based on their total returns versus selected investment benchmarks). The Trustees also noted that The Putnam Funds were ranked by the Barron’s/Lipper Fund Families survey as the 41st-best performing mutual fund complex out of 57 complexes for the one-year period ended December 31, 2018 and the 29th-best perform-ing mutual fund complex out of 55 complexes for the five-year period ended December 31, 2018. The Trustees observed that The Putnam Funds’ performance over the longer-term continued to be strong, ranking 6th out of 49 mutual fund complexes in the survey over the ten-year period ended 2018. In addition, the Trustees noted that 22 of the funds were four- or five-star rated by Morningstar Inc. at the end of 2018. They also noted, however, the disappointing investment performance of some funds for periods ended December 31, 2018 and considered information provided by Putnam Management regarding the factors contributing to the underperformance and actions being taken to improve the performance of these particular funds. The Trustees indicated their intention to continue to monitor closely the
Global Health Care Fund 19

performance of those funds, including the effec-tiveness of any efforts Putnam Management has undertaken to address underperformance and whether additional actions to address areas of underperformance are warranted.
For purposes of the Trustees’ evaluation of the Putnam Funds’ investment performance, the Trustees generally focus on a competitive indus-try ranking of each fund’s total net return over a one-year, three-year and five-year period. For a number of Putnam funds with relatively unique investment mandates for which Putnam Manage-ment informed the Trustees that meaningful competitive performance rankings are not consid-ered to be available, the Trustees evaluated performance based on their total gross and net returns and comparisons of those returns with the returns of selected investment benchmarks. In the case of your fund, the Trustees considered information about your fund’s total return and its performance relative to its benchmark over the one-year, three-year and five-year periods ended December 31, 2018. Your fund’s class A shares’ return, net of fees and expenses, was negative and trailed the return of its benchmark over the one-year period ended December 31, 2018, and was positive and trailed the return of its bench-mark over the three-year and five-year periods ended December 31, 2018. (When considering performance information, shareholders should be mindful that past performance is not a guarantee of future results.)
The Trustees expressed concern in particular about your fund’s underperformance relative to its benchmark over the one-year and three-year periods ended December 31, 2018 and considered the circumstances that may have contributed to this disappointing performance. The Trustees considered Putnam Management’s observation that the fund’s underperformance in 2018 resulted from security selection in the pharmaceutical and life sciences industries. The Trustees noted that the fund’s underperformance relative to its benchmark over the three-year period was also impacted by the fund’s weak performance in 2016 and 2017. The Trustees considered Putnam Management’s view that the fund’s underper-formance in 2017 was primarily due to security selection within the biotechnology industry and that the fund’s underweight (relative to its bench-mark) exposure to strong performing health care provider companies also detracted from perfor-mance. In addition, the Trustees noted Putnam Management’s observation that the fund’s
underperformance in 2016 resulted from industry allocation (particularly, an overweight allocation to the biotechnology industry and an underweight allocation to the healthcare equipment and supplies industry) and security selection (primarily within the pharmaceuticals industry).
The Trustees noted that the fund outperformed its benchmark over the five-year period gross of fees and expenses and that the fund’s perfor-mance in early 2019 had improved. The Trustees considered that, despite recent departures to the portfolio management team, Putnam Manage-ment remained confident in the fund’s portfolio manager. The Trustees also considered Putnam Management’s continued efforts to support fund performance through the expected appointment in 2019 of an experienced health care analyst to bolster research in the health care sector and through initiatives including structuring compen-sation for portfolio managers and research analysts to enhance accountability for fund performance, emphasizing accountability in the portfolio management process, and affirming its commitment to a fundamental-driven approach to investing. The Trustees noted further that Putnam Management had made selective hires in 2018 to strengthen its investment team.
As a general matter, the Trustees believe that cooperative efforts between the Trustees and Putnam Management represent the most effec-tive way to address investment performance concerns that may arise from time to time. The Trustees noted that investors in the Putnam funds have, in effect, placed their trust in the Putnam organization, under the oversight of the funds’ Trustees, to make appropriate decisions regarding the management of the funds. Based on Putnam Management’s willingness to take appropriate measures to address fund performance issues and Putnam Management’s responsiveness to Trustee concerns about investment performance, the Trustees concluded that it continued to be advisable to seek change within Putnam Manage-ment to address performance shortcomings. In the Trustees’ view, the alternative of engaging a new investment adviser for an underperforming fund, with all the attendant risks and disruptions, would not likely provide any greater assurance of improved investment performance.
Brokerage and soft-dollar allocations; investor servicingThe Trustees considered various potential benefits that Putnam Management may receive
20 Global Health Care Fund
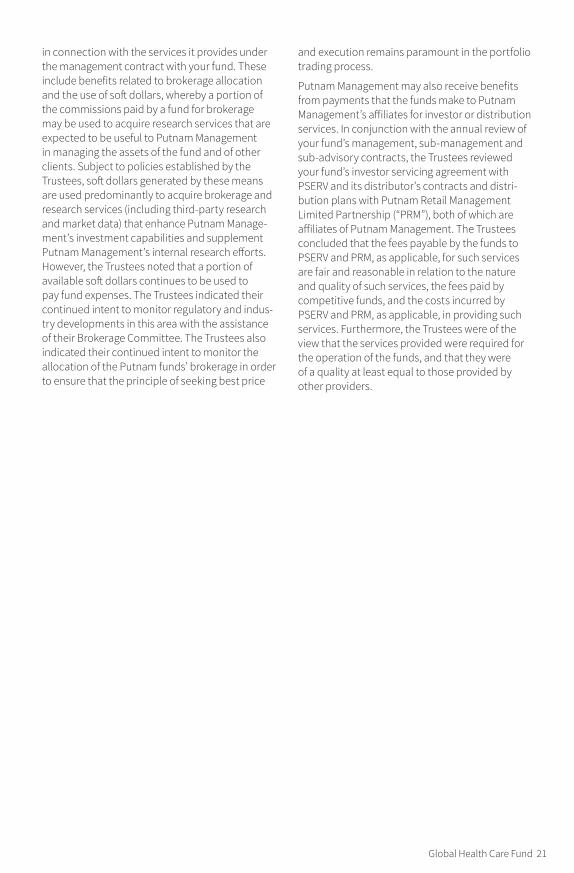
in connection with the services it provides under the management contract with your fund. These include benefits related to brokerage allocation and the use of soft dollars, whereby a portion of the commissions paid by a fund for brokerage may be used to acquire research services that are expected to be useful to Putnam Management in managing the assets of the fund and of other clients. Subject to policies established by the Trustees, soft dollars generated by these means are used predominantly to acquire brokerage and research services (including third-party research and market data) that enhance Putnam Manage-ment’s investment capabilities and supplement Putnam Management’s internal research efforts. However, the Trustees noted that a portion of available soft dollars continues to be used to pay fund expenses. The Trustees indicated their continued intent to monitor regulatory and indus-try developments in this area with the assistance of their Brokerage Committee. The Trustees also indicated their continued intent to monitor the allocation of the Putnam funds’ brokerage in order to ensure that the principle of seeking best price
and execution remains paramount in the portfolio trading process.
Putnam Management may also receive benefits from payments that the funds make to Putnam Management’s affiliates for investor or distribution services. In conjunction with the annual review of your fund’s management, sub-management and sub-advisory contracts, the Trustees reviewed your fund’s investor servicing agreement with PSERV and its distributor’s contracts and distri-bution plans with Putnam Retail Management Limited Partnership (“PRM”), both of which are affiliates of Putnam Management. The Trustees concluded that the fees payable by the funds to PSERV and PRM, as applicable, for such services are fair and reasonable in relation to the nature and quality of such services, the fees paid by competitive funds, and the costs incurred by PSERV and PRM, as applicable, in providing such services. Furthermore, the Trustees were of the view that the services provided were required for the operation of the funds, and that they were of a quality at least equal to those provided by other providers.
Global Health Care Fund 21

Audited financial statements
22 Global Health Care Fund
Audited financial statements
These sections of the report, as well as the accompanying Notes, preceded by the Report of Independent Registered Public Accounting Firm, constitute the fund’s audited financial statements.
The fund’s portfolio lists all the fund’s invest-ments and their values as of the last day of the reporting period. Holdings are organized by asset type and industry sector, country, or state to show areas of concentration and diversification.
Statement of assets and liabilities shows how the fund’s net assets and share price are determined. All investment and non-investment assets are added together. Any unpaid expenses and other liabilities are subtracted from this total. The result is divided by the number of shares to determine the net asset value per share, which is calculated separately for each class of shares. (For funds with preferred shares, the amount subtracted from total assets includes the liquidation preference of preferred shares.)
Statement of operations shows the fund’s net investment gain or loss. This is done by first adding up all the fund’s earnings — from dividends and interest income — and subtracting its operating
expenses to determine net investment income (or loss). Then, any net gain or loss the fund realized on the sales of its holdings — as well as any unreal-ized gains or losses over the period — is added to or subtracted from the net investment result to determine the fund’s net gain or loss for the fiscal year.
Statement of changes in net assets shows how the fund’s net assets were affected by the fund’s net investment gain or loss, by distributions to shareholders, and by changes in the number of the fund’s shares. It lists distributions and their sources (net investment income or realized capital gains) over the current reporting period and the most recent fiscal year-end. The distributions listed here may not match the sources listed in the Statement of operations because the distributions are deter-mined on a tax basis and may be paid in a different period from the one in which they were earned.
Financial highlights provide an overview of the fund’s investment results, per-share distributions, expense ratios, net investment income ratios, and portfolio turnover in one summary table, reflecting the five most recent reporting periods. In a semiannual report, the highlights table also includes the current reporting period.

Report of Independent Registered Public Accounting Firm
To the Trustees and Shareholders of Putnam Global Health Care Fund:
Opinion on the Financial Statements
We have audited the accompanying statement of assets and liabilities, including the fund’s portfolio, of Putnam Global Health Care Fund (the “Fund”) as of August 31, 2019, the related statement of operations for the year ended August 31, 2019, the statement of changes in net assets for each of the two years in the period ended August 31, 2019, including the related notes, and the financial highlights for each of the five years in the period ended August 31, 2019 (collectively referred to as the “financial statements”). In our opinion, the financial statements present fairly, in all material respects, the financial position of the Fund as of August 31, 2019, the results of its operations for the year then ended, the changes in its net assets for each of the two years in the period ended August 31, 2019 and the financial highlights for each of the five years in the period ended August 31, 2019 in conformity with accounting principles generally accepted in the United States of America.
Basis for Opinion
These financial statements are the responsibility of the Fund’s management. Our responsibility is to express an opinion on the Fund’s financial statements based on our audits. We are a public accounting firm registered with the Public Company Accounting Oversight Board (United States) (“PCAOB”) and are required to be independent with respect to the Fund in accordance with the U.S. federal securities laws and the applicable rules and regulations of the Securities and Exchange Commission and the PCAOB.
We conducted our audits of these financial statements in accordance with the standards of the PCAOB. Those standards require that we plan and perform the audit to obtain reasonable assurance about whether the financial statements are free of material misstatement, whether due to error or fraud.
Our audits included performing procedures to assess the risks of material misstatement of the financial statements, whether due to error or fraud, and performing procedures that respond to those risks. Such procedures included examining, on a test basis, evidence regarding the amounts and disclosures in the financial statements. Our audits also included evaluating the accounting principles used and significant estimates made by management, as well as evaluating the overall presentation of the financial statements. Our procedures included confirmation of securities owned as of August 31, 2019 by correspondence with the custodian, transfer agent and brokers; when replies were not received from brokers, we performed other auditing procedures. We believe that our audits provide a reasonable basis for our opinion.
PricewaterhouseCoopers LLP Boston, Massachusetts October 8, 2019
We have served as the auditor of one or more investment companies in the Putnam Investments family of mutual funds since at least 1957. We have not been able to determine the specific year we began serving as auditor.
Global Health Care Fund 23

24 Global Health Care Fund
COMMON STOCKS (98.2%)* Shares ValueBiotechnology (22.1%)AbbVie, Inc. 854,700 $56,187,978Alexion Pharmaceuticals, Inc. † 54,900 5,531,724Amgen, Inc. 214,735 44,798,016Ascendis Pharma A/S ADR (Denmark) † 162,800 18,238,484Biogen, Inc. † 48,500 10,657,875Blueprint Medicines Corp. † 37,000 2,836,790CSL, Ltd. (Australia) 112,025 18,143,067Ironwood Pharmaceuticals, Inc. † S 312,500 2,909,375Medicines Co. (The) † S 1,168,711 49,039,114Mirati Therapeutics, Inc. † 31,900 2,614,843Momenta Pharmaceuticals, Inc. † 470,007 5,936,188Orchard Therapeutics PLC ADR (United Kingdom) † S 841,353 12,452,024Vertex Pharmaceuticals, Inc. † 269,500 48,515,390
277,860,868Health-care equipment and supplies (18.5%)Abbott Laboratories 431,800 36,841,176Alcon, Inc. (Switzerland) † 156,436 9,530,781Baxter International, Inc. 192,300 16,912,785Becton Dickinson and Co. 40,300 10,232,976Boston Scientific Corp. † 861,500 36,811,895Danaher Corp. 425,800 60,501,922Edwards Lifesciences Corp. † 60,300 13,376,952IDEXX Laboratories, Inc. † 45,300 13,125,222Intuitive Surgical, Inc. † 40,400 20,658,136Medtronic PLC 139,200 15,018,288
233,010,133Health-care providers and services (10.8%)Anthem, Inc. 13,300 3,478,216Cigna Corp. 93,200 14,350,004Humana, Inc. 118,500 33,560,385UnitedHealth Group, Inc. 362,600 84,848,400
136,237,005Life sciences tools and services (4.5%)Adaptive Biotechnologies Corp. † S 23,800 1,210,230IQVIA Holdings, Inc. † 62,800 9,743,420Lonza Group AG (Switzerland) 28,677 10,135,099Thermo Fisher Scientific, Inc. 122,000 35,021,320
56,110,069Pharmaceuticals (42.3%)Allergan PLC 3,100 495,132AstraZeneca PLC (United Kingdom) 637,038 56,725,300Bristol-Myers Squibb Co. S 403,900 19,415,473Correvio Pharma Corp. (Canada) † 1,205,958 2,472,214Daiichi Sankyo Co., Ltd. (Japan) 239,600 15,806,220Eli Lilly & Co. 395,900 44,724,823GlaxoSmithKline PLC (United Kingdom) 1,064,111 22,161,966Johnson & Johnson 505,500 64,885,980Merck & Co., Inc. 1,078,938 93,295,769
The fund’s portfolio 8/31/19

Global Health Care Fund 25
COMMON STOCKS (98.2%)* cont. Shares ValuePharmaceuticals cont.Novartis AG (Switzerland) 846,978 $76,170,257Novo Nordisk A/S Class B (Denmark) 361,897 18,792,155Pfizer, Inc. 1,174,640 41,758,452Roche Holding AG (Switzerland) 174,081 47,594,159Sanofi (France) 168,561 14,472,270Takeda Pharmaceutical Co., Ltd. (Japan) 373,000 12,604,073
531,374,243Total common stocks (cost $949,042,736) $1,234,592,318
PURCHASED OPTIONS OUTSTANDING (0.2%)* Counterparty
Expiration date/strike price
Notional amount
Contract amount Value
Barclays Bank PLCMedicines, Co. (The) (Put) Jan-20/$35.00 $21,091,026 $502,646 $2,580,433Total purchased options outstanding (cost $2,513,230) $2,580,433
WARRANTS (—%)* † Expiration date
Strike price Warrants Value
Neuralstem, Inc. Ser. K (acquired 4/20/17, cost $—) ∆∆ 1/9/22 $42.00 18,887 $—Total warrants (cost $—) $—
SHORT‑TERM INVESTMENTS (5.6%)*Principal amount/
shares ValuePutnam Cash Collateral Pool, LLC 2.32% d Shares 50,046,478 $50,046,478Putnam Short Term Investment Fund 2.19% L Shares 17,195,873 17,195,873State Street Institutional U.S. Government Money Market Fund, Premier Class 1.73% P Shares 1,610,000 1,610,000U.S. Treasury Bills 2.018%, 11/21/19 ∆ $1,334,000 1,328,326U.S. Treasury Bills 2.030%, 10/10/19 ∆ 109,000 108,776U.S. Treasury Bills 1.884%, 11/7/19 34,000 33,881Total short-term investments (cost $70,323,076) $70,323,334
TOTAL INVESTMENTSTotal investments (cost $1,021,879,042) $1,307,496,085
Key to holding’s abbreviations
ADR American Depository Receipts: represents ownership of foreign securities on deposit with a custodian bank
Notes to the fund’s portfolio
Unless noted otherwise, the notes to the fund’s portfolio are for the close of the fund’s reporting period, which ran from September 1, 2018 through August 31, 2019 (the reporting period). Within the following notes to the portfolio, references to “Putnam Management” represent Putnam Investment Management, LLC, the fund’s manager, an indirect wholly-owned subsidiary of Putnam Investments, LLC and references to “ASC 820” represent Accounting Standards Codification 820 Fair Value Measurements and Disclosures.
* Percentages indicated are based on net assets of $1,257,056,174.
† This security is non-income-producing.
∆∆ This security is restricted with regard to public resale. The total fair value of this security and any other restricted securities (excluding 144A securities), if any, held at the close of the reporting period was $0, or less than 0.1% of net assets.
26 Global Health Care Fund
∆ This security, in part or in entirety, was pledged and segregated with the custodian for collateral on certain derivative contracts at the close of the reporting period. Collateral at period end totaled $1,242,497 and is included in Investments in securities on the Statement of assets and liabilities (Notes 1 and 8).
d Affiliated company. See Notes 1 and 5 to the financial statements regarding securities lending. The rate quoted in the security description is the annualized 7-day yield of the fund at the close of the reporting period.
L Affiliated company (Note 5). The rate quoted in the security description is the annualized 7-day yield of the fund at the close of the reporting period.
P This security was pledged, or purchased with cash that was pledged, to the fund for collateral on certain derivative contracts. The rate quoted in the security description is the annualized 7-day yield of the fund at the close of the reporting period.
S Security on loan, in part or in entirety, at the close of the reporting period (Note 1).
At the close of the reporting period, the fund maintained liquid assets totaling $1,638,083 to cover certain derivative contracts.
Unless otherwise noted, the rates quoted in Short-term investments security descriptions represent the weighted average yield to maturity.
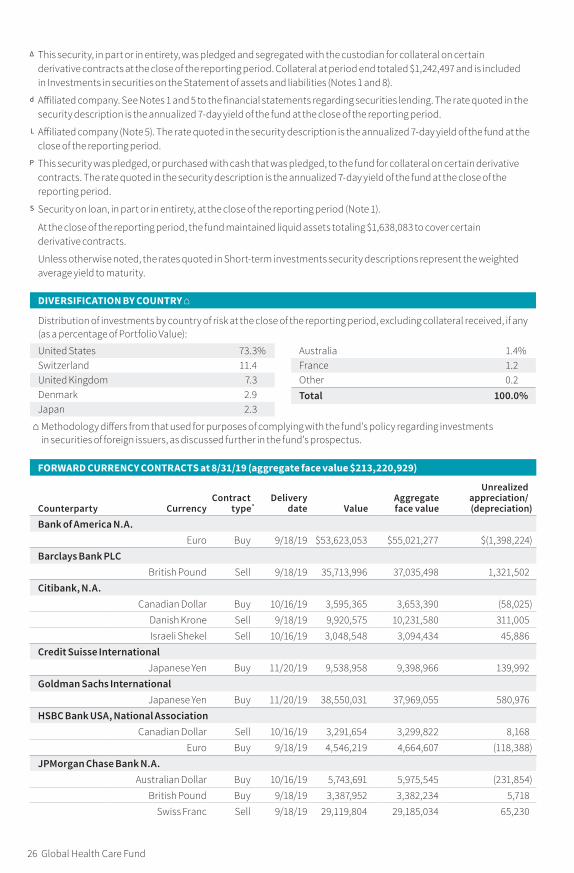
DIVERSIFICATION BY COUNTRY ⌂
Distribution of investments by country of risk at the close of the reporting period, excluding collateral received, if any (as a percentage of Portfolio Value):
United States 73.3%Switzerland 11.4United Kingdom 7.3Denmark 2.9Japan 2.3
Australia 1.4%France 1.2Other 0.2Total 100.0%
⌂ Methodology differs from that used for purposes of complying with the fund’s policy regarding investments in securities of foreign issuers, as discussed further in the fund’s prospectus.
FORWARD CURRENCY CONTRACTS at 8/31/19 (aggregate face value $213,220,929 )
Counterparty CurrencyContract
type*Delivery
date ValueAggregate face value
Unrealized appreciation/ (depreciation)
Bank of America N.A.Euro Buy 9/18/19 $53,623,053 $55,021,277 $(1,398,224 )
Barclays Bank PLCBritish Pound Sell 9/18/19 35,713,996 37,035,498 1,321,502
Citibank, N.A.Canadian Dollar Buy 10/16/19 3,595,365 3,653,390 (58,025 )
Danish Krone Sell 9/18/19 9,920,575 10,231,580 311,005Israeli Shekel Sell 10/16/19 3,048,548 3,094,434 45,886
Credit Suisse InternationalJapanese Yen Buy 11/20/19 9,538,958 9,398,966 139,992
Goldman Sachs InternationalJapanese Yen Buy 11/20/19 38,550,031 37,969,055 580,976
HSBC Bank USA, National AssociationCanadian Dollar Sell 10/16/19 3,291,654 3,299,822 8,168
Euro Buy 9/18/19 4,546,219 4,664,607 (118,388 )JPMorgan Chase Bank N.A.
Australian Dollar Buy 10/16/19 5,743,691 5,975,545 (231,854 )British Pound Buy 9/18/19 3,387,952 3,382,234 5,718
Swiss Franc Sell 9/18/19 29,119,804 29,185,034 65,230

Global Health Care Fund 27
The accompanying notes are an integral part of these financial statements.
FORWARD CURRENCY CONTRACTS at 8/31/19 (aggregate face value $213,220,929 ) cont.
Counterparty CurrencyContract
type*Delivery
date ValueAggregate face value
Unrealized appreciation/ (depreciation)
State Street Bank and Trust Co.Euro Buy 9/18/19 $5,115,927 $5,238,301 $(122,374 )
Israeli Shekel Buy 10/16/19 5,103,102 5,071,186 31,916Unrealized appreciation 2,510,393Unrealized (depreciation) (1,928,865 )Total $581,528
* The exchange currency for all contracts listed is the United States Dollar.
WRITTEN OPTIONS OUTSTANDING at 8/31/19 (premiums $1,382,277 )
CounterpartyExpiration date/strike price
Notional amount
Contract amount Value
Barclays Bank PLCMedicines, Co. (The) (Put) Jan-20/$28.00 $21,091,026 $502,646 $1,624,414Total
ASC 820 establishes a three-level hierarchy for disclosure of fair value measurements. The valuation hierarchy is based upon the transparency of inputs to the valuation of the fund’s investments. The three levels are defined as follows:
Level 1: Valuations based on quoted prices for identical securities in active markets.Level 2: Valuations based on quoted prices in markets that are not active or for which all significant inputs are observable, either directly or indirectly.Level 3: Valuations based on inputs that are unobservable and significant to the fair value measurement.
The following is a summary of the inputs used to value the fund’s net assets as of the close of the reporting period:
Valuation inputsInvestments in securities: Level 1 Level 2 Level 3
Common stocks*:Health care $1,188,038,958 $46,553,360 $—
Total common stocks 1,188,038,958 46,553,360 —
Purchased options outstanding — 2,580,433 —
Warrants — — —
Short-term investments 18,805,873 51,517,461 — Totals by level $1,206,844,831 $100,651,254 $—
Valuation inputsOther financial instruments: Level 1 Level 2 Level 3
Forward currency contracts $— $581,528 $—
Written options outstanding — (1,624,414 ) — Totals by level $— $(1,042,886 ) $—
* Common stock classifications are presented at the sector level, which may differ from the fund’s portfolio presentation.

Statement of assets and liabilities 8/31/19
ASSETSInvestment in securities, at value, including $48,014,210 of securities on loan (Notes 1 and 8):
Unaffiliated issuers (identified cost $954,636,691) $1,240,253,734 Affiliated issuers (identified cost $67,242,351) (Notes 1 and 5) 67,242,351
Cash 1,873,945 Foreign currency (cost $21) (Note 1) 21 Dividends, interest and other receivables 2,673,718 Foreign tax reclaim 1,972,508 Receivable for shares of the fund sold 145,423 Receivable for investments sold 7,411,614 Unrealized appreciation on forward currency contracts (Note 1) 2,510,393 Prepaid assets 42,128 Total assets 1,324,125,835
LIABILITIESPayable for investments purchased 8,897,204 Payable for shares of the fund repurchased 797,128 Payable for compensation of Manager (Note 2) 659,610 Payable for custodian fees (Note 2) 32,193 Payable for investor servicing fees (Note 2) 243,458 Payable for Trustee compensation and expenses (Note 2) 465,749 Payable for administrative services (Note 2) 4,984 Payable for distribution fees (Note 2) 532,371 Unrealized depreciation on forward currency contracts (Note 1) 1,928,865 Written options outstanding, at value (premiums $1,382,277) (Note 1) 1,624,414 Collateral on securities loaned, at value (Note 1) 50,046,478 Collateral on certain derivative contracts, at value (Notes 1 and 8) 1,610,000 Other accrued expenses 227,207 Total liabilities 67,069,661
Net assets $1,257,056,174
REPRESENTED BYPaid-in capital (Unlimited shares authorized) (Notes 1 and 4) $899,786,612 Total distributable earnings (Note 1) 357,269,562 Total — Representing net assets applicable to capital shares outstanding $1,257,056,174
(Continued on next page)
28 Global Health Care Fund

The accompanying notes are an integral part of these financial statements.
Statement of assets and liabilities cont.
COMPUTATION OF NET ASSET VALUE AND OFFERING PRICENet asset value and redemption price per class A share ($1,133,446,582 divided by 22,230,747 shares) $50.99 Offering price per class A share (100/94.25 of $50.99)* $54.10 Net asset value and offering price per class B share ($17,141,460 divided by 602,406 shares)** $28.45 Net asset value and offering price per class C share ($29,905,470 divided by 811,091 shares)** $36.87 Net asset value and redemption price per class M share ($9,636,976 divided by 249,042 shares) $38.70 Offering price per class M share (100/96.50 of $38.70)* $40.10 Net asset value, offering price and redemption price per class R share ($2,251,968 divided by 47,642 shares) $47.27 Net asset value, offering price and redemption price per class Y share ($64,673,718 divided by 1,176,063 shares) $54.99
*On single retail sales of less than $50,000. On sales of $50,000 or more the offering price is reduced.**Redemption price per share is equal to net asset value less any applicable contingent deferred sales charge.
Global Health Care Fund 29

The accompanying notes are an integral part of these financial statements.
Statement of operations Year ended 8/31/19
INVESTMENT INCOMEDividends (net of foreign tax of $904,430) $20,272,613Interest (including interest income of $491,252 from investments in affiliated issuers) (Note 5) 540,709 Securities lending (net of expenses) (Notes 1 and 5) 433,326Total investment income 21,246,648
EXPENSESCompensation of Manager (Note 2) 8,001,676 Investor servicing fees (Note 2) 2,089,093 Custodian fees (Note 2) 92,678 Trustee compensation and expenses (Note 2) 57,739 Distribution fees (Note 2) 3,484,570 Administrative services (Note 2) 39,096 Other 493,301 Total expenses 14,258,153
Expense reduction (Note 2) (108,590)Net expenses 14,149,563
Net investment income 7,097,085
REALIZED AND UNREALIZED GAIN (LOSS)Net realized gain (loss) on:
Securities from unaffiliated issuers (Notes 1 and 3) 71,430,209 Foreign currency transactions (Note 1) (287,334)Forward currency contracts (Note 1) (3,439,395)Written options (Note 1) 403,939
Total net realized gain 68,107,419 Change in net unrealized appreciation (depreciation) on:
Securities from unaffiliated issuers (67,335,727)Assets and liabilities in foreign currencies (67,895)Forward currency contracts 1,165,459 Written options (242,137)
Total change in net unrealized depreciation (66,480,300)
Net gain on investments 1,627,119
Net increase in net assets resulting from operations $8,724,204
30 Global Health Care Fund

The accompanying notes are an integral part of these financial statements.
Statement of changes in net assets
DECREASE IN NET ASSETS Year ended 8/31/19 Year ended 8/31/18OperationsNet investment income $7,097,085 $4,401,174 Net realized gain on investments and foreign currency transactions 68,107,419 104,272,990 Change in net unrealized appreciation (depreciation) of investments and assets and liabilities in foreign currencies (66,480,300) 3,924,903 Net increase in net assets resulting from operations 8,724,204 112,599,067 Distributions to shareholders (Note 1):
From ordinary incomeNet investment income
Class A (766,262) (6,841,923)Class B — (40,858)Class M — (22,076)Class R — (6,757)Class Y (213,559) (551,656)
Net realized short-term gain on investmentsClass A (10,793,057) (7,721,292)Class B (312,722) (249,301)Class C (393,978) (370,163)Class M (119,557) (82,784)Class R (21,131) (18,020)Class Y (605,171) (426,172)
From net realized long-term gain on investmentsClass A (58,779,032) (168,602,992)Class B (1,703,081) (5,443,768)Class C (2,145,605) (8,082,928)Class M (651,109) (1,807,672)Class R (115,082) (393,492)Class Y (3,295,763) (9,305,944)
Increase in capital from settlement payments 1,376 — Increase (decrease) from capital share transactions (Note 4) (69,002,676) 42,430,190 Total decrease in net assets (140,192,205) (54,938,541)
NET ASSETSBeginning of year 1,397,248,379 1,452,186,920
End of year (Note 1) $1,257,056,174 $1,397,248,379
Global Health Care Fund 31

Fund _FundCode, — NumbCols Columns — This section modified: 9/18/19 2:41:56 PM Fund _FundCode, — NumbCols Columns — This section modified: 9/18/19 2:41:56 PM
Global Health Care Fund 33 32 Global Health Care Fund
The accompanying notes are an integral part of these financial statements.
a Per share net investment income (loss) has been determined on the basis of the weighted average number of shares outstanding during the period.
b Total return assumes dividend reinvestment and does not reflect the effect of sales charges.
c Includes amounts paid through expense offset and brokerage service arrangements, if any (Note 2). Also excludes acquired fund fees and expenses, if any.
d Reflects a voluntary waiver of certain fund expenses in effect during the period. As a result of such waiver, the expenses of each class reflect a reduction of less than 0.01% as a percentage of average net assets per share for each class (Note 2).
Financial highlights (For a common share outstanding throughout the period)
INVESTMENT OPERATIONS LESS DISTRIBUTIONS RATIOS AND SUPPLEMENTAL DATA
Period ended
Net asset value,
beginning of period
Net investment income (loss ) a
Net realized and unrealized
gain (loss) on investments
Total from investment operations
From net investment
income
From net realized gain on investments
Total dis tri bu tions
Net asset value, end of period
Total return at net asset value (% ) b
Net assets, end of period
(in thousands )
Ratio of expenses to average
net assets (% ) c
Ratio of net investment
income (loss) to average
net assets (% )
Portfolio turnover
(% )
Class A August 31, 2019 $54.00 .29 (.18 ) .11 (.03 ) (3.09 ) (3.12 ) $50.99 1.15 $1,133,447 1.09 .57 81 August 31, 2018 58.35 .18 4.01 4.19 (.32 ) (8.22 ) (8.54 ) 54.00 8.56 1,251,883 1.08 .34 49 August 31, 2017 58.56 .28 4.85 5.13 (.26 ) (5.08 ) (5.34 ) 58.35 10.29 1,287,146 1.10 .51 53 August 31, 2016 71.32 .21 (4.75 ) (4.54 ) (.03 ) (8.19 ) (8.22 ) 58.56 (7.23 ) 1,336,219 1.13 d .35 d 16 August 31, 2015 67.02 .12 10.27 10.39 (.31 ) (5.78 ) (6.09 ) 71.32 16.29 1,590,624 1.10 .17 20 Class B August 31, 2019 $31.90 (.05 ) (.31 ) (.36 ) — (3.09 ) (3.09 ) $28.45 .39 $17,141 1.84 (.18 ) 81 August 31, 2018 37.98 (.14 ) 2.34 2.20 (.06 ) (8.22 ) (8.28 ) 31.90 7.73 22,390 1.83 (.42 ) 49 August 31, 2017 40.08 (.09 ) 3.07 2.98 — (5.08 ) (5.08 ) 37.98 9.48 27,546 1.85 (.24 ) 53 August 31, 2016 51.75 (.17 ) (3.28 ) (3.45 ) (.03 ) (8.19 ) (8.22 ) 40.08 (7.93 ) 35,044 1.88 d (.40 ) d 16 August 31, 2015 50.25 (.31 ) 7.59 7.28 — (5.78 ) (5.78 ) 51.75 15.42 40,640 1.85 (.58 ) 20 Class C August 31, 2019 $40.29 (.07 ) (.26 ) (.33 ) — (3.09 ) (3.09 ) $36.87 .38 $29,905 1.84 (.18 ) 81 August 31, 2018 45.69 (.16 ) 2.98 2.82 — (8.22 ) (8.22 ) 40.29 7.77 34,057 1.83 (.40 ) 49 August 31, 2017 47.13 (.11 ) 3.75 3.64 — (5.08 ) (5.08 ) 45.69 9.46 50,402 1.85 (.24 ) 53 August 31, 2016 59.40 (.20 ) (3.85 ) (4.05 ) (.03 ) (8.19 ) (8.22 ) 47.13 (7.92 ) 59,280 1.88 d (.40 ) d 16 August 31, 2015 56.89 (.34 ) 8.63 8.29 — (5.78 ) (5.78 ) 59.40 15.40 72,939 1.85 (.57 ) 20 Class M August 31, 2019 $42.00 .02 (.23 ) (.21 ) — (3.09 ) (3.09 ) $38.70 .67 $9,637 1.59 .06 81 August 31, 2018 47.28 (.07 ) 3.11 3.04 (.10 ) (8.22 ) (8.32 ) 42.00 8.02 11,133 1.58 (.16 ) 49 August 31, 2017 48.50 .01 3.87 3.88 (.02 ) (5.08 ) (5.10 ) 47.28 9.73 11,341 1.60 .01 53 August 31, 2016 60.74 (.08 ) (3.94 ) (4.02 ) (.03 ) (8.19 ) (8.22 ) 48.50 (7.67 ) 12,513 1.63 d (.15 ) d 16 August 31, 2015 57.97 (.20 ) 8.81 8.61 (.06 ) (5.78 ) (5.84 ) 60.74 15.68 16,014 1.60 (.33 ) 20 Class R August 31, 2019 $50.40 .15 (.19 ) (.04 ) — (3.09 ) (3.09 ) $47.27 .91 $2,252 1.34 .32 81 August 31, 2018 54.97 .01 3.78 3.79 (.14 ) (8.22 ) (8.36 ) 50.40 8.29 2,209 1.33 .01 49 August 31, 2017 55.45 .13 4.56 4.69 (.09 ) (5.08 ) (5.17 ) 54.97 10.00 3,400 1.35 .25 53 August 31, 2016 68.12 .06 (4.51 ) (4.45 ) (.03 ) (8.19 ) (8.22 ) 55.45 (7.45 ) 3,891 1.38 d .10 d 16 August 31, 2015 64.31 (.05 ) 9.83 9.78 (.19 ) (5.78 ) (5.97 ) 68.12 15.99 8,350 1.35 (.07 ) 20 Class Y August 31, 2019 $57.97 .44 (.16 ) .28 (.17 ) (3.09 ) (3.26 ) $54.99 1.41 $64,674 .84 .82 81 August 31, 2018 62.02 .34 4.30 4.64 (.47 ) (8.22 ) (8.69 ) 57.97 8.82 75,576 .83 .60 49 August 31, 2017 61.91 .45 5.16 5.61 (.42 ) (5.08 ) (5.50 ) 62.02 10.56 72,352 .85 .75 53 August 31, 2016 74.75 .38 (5.00 ) (4.62 ) (.03 ) (8.19 ) (8.22 ) 61.91 (6.98 ) 54,119 .88 d .58 d 16 August 31, 2015 69.96 .32 10.72 11.04 (.47 ) (5.78 ) (6.25 ) 74.75 16.57 74,556 .85 .42 20

34 Global Health Care Fund
Notes to financial statements 8/31/19
Within the following Notes to financial statements, references to “State Street” represent State Street Bank and Trust Company, references to “the SEC” represent the Securities and Exchange Commission, references to “Putnam Management” represent Putnam Investment Management, LLC, the fund’s manager, an indirect wholly-owned subsidiary of Putnam Investments, LLC and references to “OTC”, if any, represent over-the-counter. Unless otherwise noted, the “reporting period” represents the period from September 1, 2018 through August 31, 2019.
Putnam Global Health Care Fund (the fund) is a Massachusetts business trust, which is registered under the Investment Company Act of 1940, as amended, as a non-diversified open-end management investment company. The goal of the fund is to seek capital appreciation. For this non-diversified fund concentrating in the health care industries, the fund invests mainly in common stocks (growth or value stocks or both) of large and midsize companies worldwide that Putnam Management believes have favorable investment potential. Under normal circumstances, the fund invests at least 80% of the fund’s net assets in securities of companies in the health care industries. This policy may be changed only after 60 days’ notice to shareholders. Potential invest-ments include companies that manufacture health care supplies or provide health care-related services, and companies in the research, development, production and marketing of pharmaceuticals and biotechnology products. The fund may purchase stocks of companies with stock prices that reflect a value lower than that which Putnam Management places on the company. Putnam Management may also consider other factors that it believes will cause the stock price to rise. Putnam Management may consider, among other factors, a company’s valuation, financial strength, growth potential, competitive position in its industry, projected future earnings, cash flows and dividends when deciding whether to buy or sell investments. The fund may also use derivatives, such as futures, options, certain foreign currency transactions, warrants and swap contracts, for both hedging and non-hedging purposes, and may engage in short sales of securities. The use of the term “global” in the fund’s name is meant to emphasize that Putnam Management looks for investment opportunities on a worldwide basis and that its investment strategies are not constrained by the countries or regions in which companies are located. Under normal market conditions, the fund intends to invest in at least five different countries and at least 40% of its net assets in securities of foreign companies (or, if less, at least the percentage of net assets that is 10% less than the percentage of the fund’s benchmark represented by foreign companies, as determined by the providers of the benchmark).
The fund offers class A, class B, class C, class M, class R and class Y shares. Effective November 25, 2019, class M shares will no longer be available for purchase and will convert automatically to class A shares. Purchases of class B shares are closed to new and existing investors except by exchange from class B shares of another Putnam fund or through dividend and/or capital gains reinvestment. Class A and class M shares are sold with a maximum front-end sales charge of 5.75% and 3.50%, respectively. Class A shares generally are not subject to a contin-gent deferred sales charge, and class M, class R and class Y shares are not subject to a contingent deferred sales charge. Class B shares, which convert to class A shares after approximately eight years, are not subject to a front-end sales charge and are subject to a contingent deferred sales charge if those shares are redeemed within six years of purchase. Class C shares are subject to a one-year 1.00% contingent deferred sales charge and generally convert to class A shares after approximately ten years. Class R shares, which are not available to all investors, are sold at net asset value. The expenses for class A, class B, class C, class M and class R shares may differ based on the distribution fee of each class, which is identified in Note 2. Class Y shares, which are sold at net asset value, are generally subject to the same expenses as class A, class B, class C, class M and class R shares, but do not bear a distribution fee. Class Y shares are not available to all investors.
In the normal course of business, the fund enters into contracts that may include agreements to indemnify another party under given circumstances. The fund’s maximum exposure under these arrangements is unknown as this would involve future claims that may be, but have not yet been, made against the fund. However, the fund’s management team expects the risk of material loss to be remote.
The fund has entered into contractual arrangements with an investment adviser, administrator, distributor, share-holder servicing agent and custodian, who each provide services to the fund. Unless expressly stated otherwise, shareholders are not parties to, or intended beneficiaries of these contractual arrangements, and these contrac-tual arrangements are not intended to create any shareholder right to enforce them against the service providers or to seek any remedy under them against the service providers, either directly or on behalf of the fund.
Under the fund’s Amended and Restated Agreement and Declaration of Trust, any claims asserted against or on behalf of the Putnam Funds, including claims against Trustees and Officers, must be brought in state and federal courts located within the Commonwealth of Massachusetts.

Global Health Care Fund 35
Note 1: Significant accounting policiesThe following is a summary of significant accounting policies consistently followed by the fund in the preparation of its financial statements. The preparation of financial statements is in conformity with accounting principles generally accepted in the United States of America and requires management to make estimates and assump-tions that affect the reported amounts of assets and liabilities in the financial statements and the reported amounts of increases and decreases in net assets from operations. Actual results could differ from those esti-mates. Subsequent events after the Statement of assets and liabilities date through the date that the financial statements were issued have been evaluated in the preparation of the financial statements.
Investment income, realized and unrealized gains and losses and expenses of the fund are borne pro-rata based on the relative net assets of each class to the total net assets of the fund, except that each class bears expenses unique to that class (including the distribution fees applicable to such classes). Each class votes as a class only with respect to its own distribution plan or other matters on which a class vote is required by law or determined by the Trustees. If the fund were liquidated, shares of each class would receive their pro-rata share of the net assets of the fund. In addition, the Trustees declare separate dividends on each class of shares.
Security valuation Portfolio securities and other investments are valued using policies and procedures adopted by the Board of Trustees. The Trustees have formed a Pricing Committee to oversee the implementation of these procedures and have delegated responsibility for valuing the fund’s assets in accordance with these procedures to Putnam Management. Putnam Management has established an internal Valuation Committee that is respon-sible for making fair value determinations, evaluating the effectiveness of the pricing policies of the fund and reporting to the Pricing Committee.
Investments for which market quotations are readily available are valued at the last reported sales price on their principal exchange, or official closing price for certain markets, and are classified as Level 1 securities under Accounting Standards Codification 820 Fair Value Measurements and Disclosures (ASC 820). If no sales are reported, as in the case of some securities that are traded OTC, a security is valued at its last reported bid price and is generally categorized as a Level 2 security.
Investments in open-end investment companies (excluding exchange-traded funds), if any, which can be classi-fied as Level 1 or Level 2 securities, are valued based on their net asset value. The net asset value of such invest-ment companies equals the total value of their assets less their liabilities and divided by the number of their outstanding shares.
Market quotations are not considered to be readily available for certain debt obligations (including short-term investments with remaining maturities of 60 days or less) and other investments; such investments are valued on the basis of valuations furnished by an independent pricing service approved by the Trustees or dealers selected by Putnam Management. Such services or dealers determine valuations for normal institutional-size trading units of such securities using methods based on market transactions for comparable securities and various relation-ships, generally recognized by institutional traders, between securities (which consider such factors as security prices, yields, maturities and ratings). These securities will generally be categorized as Level 2.
Many securities markets and exchanges outside the U.S. close prior to the scheduled close of the New York Stock Exchange and therefore the closing prices for securities in such markets or on such exchanges may not fully reflect events that occur after such close but before the scheduled close of the New York Stock Exchange. Accord-ingly, on certain days, the fund will fair value certain foreign equity securities taking into account multiple factors including movements in the U.S. securities markets, currency valuations and comparisons to the valuation of American Depository Receipts, exchange-traded funds and futures contracts. The foreign equity securities, which would generally be classified as Level 1 securities, will be transferred to Level 2 of the fair value hierarchy when they are valued at fair value. The number of days on which fair value prices will be used will depend on market activity and it is possible that fair value prices will be used by the fund to a significant extent. At the close of the reporting period, fair value pricing was used for certain foreign securities in the portfolio. Securities quoted in foreign currencies, if any, are translated into U.S. dollars at the current exchange rate.
To the extent a pricing service or dealer is unable to value a security or provides a valuation that Putnam Manage-ment does not believe accurately reflects the security’s fair value, the security will be valued at fair value by Putnam Management in accordance with policies and procedures approved by the Trustees. Certain investments, including certain restricted and illiquid securities and derivatives, are also valued at fair value following procedures approved by the Trustees. These valuations consider such factors as significant market or specific security events such as interest rate or credit quality changes, various relationships with other securities, discount rates, U.S. Treasury, U.S. swap and credit yields, index levels, convexity exposures, recovery rates, sales and other multiples and resale restrictions. These securities are classified as Level 2 or as Level 3 depending on the priority of the significant inputs.
36 Global Health Care Fund
To assess the continuing appropriateness of fair valuations, the Valuation Committee reviews and affirms the reasonableness of such valuations on a regular basis after considering all relevant information that is reasonably available. Such valuations and procedures are reviewed periodically by the Trustees. The fair value of securities is generally determined as the amount that the fund could reasonably expect to realize from an orderly disposi-tion of such securities over a reasonable period of time. By its nature, a fair value price is a good faith estimate of the value of a security in a current sale and does not reflect an actual market price, which may be different by a material amount.
Security transactions and related investment income Security transactions are recorded on the trade date (the date the order to buy or sell is executed). Gains or losses on securities sold are determined on the identified cost basis.
Interest income, net of any applicable withholding taxes and including amortization and accretion of premiums and discounts on debt securities, is recorded on the accrual basis. Dividend income, net of any applicable with-holding taxes, is recognized on the ex-dividend date except that certain dividends from foreign securities, if any, are recognized as soon as the fund is informed of the ex-dividend date. Non-cash dividends, if any, are recorded at the fair value of the securities received. Dividends representing a return of capital or capital gains, if any, are reflected as a reduction of cost and/or as a realized gain.
Foreign currency translation The accounting records of the fund are maintained in U.S. dollars. The fair value of foreign securities, currency holdings, and other assets and liabilities is recorded in the books and records of the fund after translation to U.S. dollars based on the exchange rates on that day. The cost of each security is determined using historical exchange rates. Income and withholding taxes are translated at prevailing exchange rates when earned or incurred. The fund does not isolate that portion of realized or unrealized gains or losses resulting from changes in the foreign exchange rate on investments from fluctuations arising from changes in the market prices of the securities. Such gains and losses are included with the net realized and unrealized gain or loss on investments. Net realized gains and losses on foreign currency transactions represent net realized exchange gains or losses on disposition of foreign currencies, currency gains and losses realized between the trade and settlement dates on securities transactions and the difference between the amount of investment income and foreign withholding taxes recorded on the fund’s books and the U.S. dollar equivalent amounts actually received or paid. Net unrealized appreciation and depreciation of assets and liabilities in foreign currencies arise from changes in the value of assets and liabilities other than investments at the period end, resulting from changes in the exchange rate.
Options contracts The fund uses options contracts to hedge against changes in values of securities it owns, owned or expects to own.
The potential risk to the fund is that the change in value of options contracts may not correspond to the change in value of the hedged instruments. In addition, losses may arise from changes in the value of the underlying instru-ments if there is an illiquid secondary market for the contracts, if interest or exchange rates move unexpectedly or if the counterparty to the contract is unable to perform. Realized gains and losses on purchased options are included in realized gains and losses on investment securities. If a written call option is exercised, the premium originally received is recorded as an addition to sales proceeds. If a written put option is exercised, the premium originally received is recorded as a reduction to the cost of investments.
Exchange-traded options are valued at the last sale price or, if no sales are reported, the last bid price for purchased options and the last ask price for written options. OTC traded options are valued using prices supplied by dealers.
Options on swaps are similar to options on securities except that the premium paid or received is to buy or grant the right to enter into a previously agreed upon interest rate or credit default contract. Forward premium swap option contracts include premiums that have extended settlement dates. The delayed settlement of the premiums is factored into the daily valuation of the option contracts. In the case of interest rate cap and floor contracts, in return for a premium, ongoing payments between two parties are based on interest rates exceeding a specified rate, in the case of a cap contract, or falling below a specified rate in the case of a floor contract.
Written option contracts outstanding at period end, if any, are listed after the fund’s portfolio.
Forward currency contracts The fund buys and sells forward currency contracts, which are agreements between two parties to buy and sell currencies at a set price on a future date. These contracts are used to hedge foreign exchange risk.
The U.S. dollar value of forward currency contracts is determined using current forward currency exchange rates supplied by a quotation service. The fair value of the contract will fluctuate with changes in currency exchange

Global Health Care Fund 37
rates. The contract is marked to market daily and the change in fair value is recorded as an unrealized gain or loss. The fund records a realized gain or loss equal to the difference between the value of the contract at the time it was opened and the value at the time it was closed when the contract matures or by delivery of the currency. The fund could be exposed to risk if the value of the currency changes unfavorably, if the counterparties to the contracts are unable to meet the terms of their contracts or if the fund is unable to enter into a closing position. Risks may exceed amounts recognized on the Statement of assets and liabilities.
Forward currency contracts outstanding at period end, if any, are listed after the fund’s portfolio.
Master agreements The fund is a party to ISDA (International Swaps and Derivatives Association, Inc.) Master Agreements (Master Agreements) with certain counterparties that govern OTC derivative and foreign exchange contracts entered into from time to time. The Master Agreements may contain provisions regarding, among other things, the parties’ general obligations, representations, agreements, collateral requirements, events of default and early termination. With respect to certain counterparties, in accordance with the terms of the Master Agree-ments, collateral posted to the fund is held in a segregated account by the fund’s custodian and, with respect to those amounts which can be sold or repledged, is presented in the fund’s portfolio. Collateral posted to the fund which cannot be sold or repledged totaled $515,901 at the close of the reporting period.
Collateral pledged by the fund is segregated by the fund’s custodian and identified in the fund’s portfolio. Collat-eral can be in the form of cash or debt securities issued by the U.S. Government or related agencies or other secu-rities as agreed to by the fund and the applicable counterparty. Collateral requirements are determined based on the fund’s net position with each counterparty.
Termination events applicable to the fund may occur upon a decline in the fund’s net assets below a speci-fied threshold over a certain period of time. Termination events applicable to counterparties may occur upon a decline in the counterparty’s long-term and short-term credit ratings below a specified level. In each case, upon occurrence, the other party may elect to terminate early and cause settlement of all derivative and foreign exchange contracts outstanding, including the payment of any losses and costs resulting from such early termination, as reasonably determined by the terminating party. Any decision by one or more of the fund’s counterparties to elect early termination could impact the fund’s future derivative activity.
At the close of the reporting period, the fund had a net liability position of $1,759,808 on open derivative contracts subject to the Master Agreements. Collateral posted by the fund at period end for these agreements totaled $1,242,497 and may include amounts related to unsettled agreements.
Securities lending The fund may lend securities, through its agent, to qualified borrowers in order to earn addi-tional income. The loans are collateralized by cash in an amount at least equal to the fair value of the securities loaned. The fair value of securities loaned is determined daily and any additional required collateral is allocated to the fund on the next business day. The remaining maturities of the securities lending transactions are consid-ered overnight and continuous. The risk of borrower default will be borne by the fund’s agent; the fund will bear the risk of loss with respect to the investment of the cash collateral. Income from securities lending, net of expenses, is included in investment income on the Statement of operations. Cash collateral is invested in Putnam Cash Collateral Pool, LLC, a limited liability company managed by an affiliate of Putnam Management. Invest-ments in Putnam Cash Collateral Pool, LLC are valued at its closing net asset value each business day. There are no management fees charged to Putnam Cash Collateral Pool, LLC. At the close of the reporting period, the fund received cash collateral of $50,046,478 and the value of securities loaned amounted to $48,014,210.
Interfund lending The fund, along with other Putnam funds, may participate in an interfund lending program pursuant to an exemptive order issued by the SEC. This program allows the fund to borrow from or lend to other Putnam funds that permit such transactions. Interfund lending transactions are subject to each fund’s investment policies and borrowing and lending limits. Interest earned or paid on the interfund lending transac-tion will be based on the average of certain current market rates. During the reporting period, the fund did not utilize the program.
Lines of credit The fund participates, along with other Putnam funds, in a $317.5 million unsecured committed line of credit and a $235.5 million unsecured uncommitted line of credit, both provided by State Street. Borrowings may be made for temporary or emergency purposes, including the funding of shareholder redemp-tion requests and trade settlements. Interest is charged to the fund based on the fund’s borrowing at a rate equal to 1.25% plus the higher of (1) the Federal Funds rate and (2) the overnight LIBOR for the committed line of credit and the Federal Funds rate plus 1.30% for the uncommitted line of credit. A closing fee equal to 0.04% of the committed line of credit and 0.04% of the uncommitted line of credit has been paid by the participating funds. In addition, a commitment fee of 0.21% per annum on any unutilized portion of the committed line of credit is

38 Global Health Care Fund
allocated to the participating funds based on their relative net assets and paid quarterly. During the reporting period, the fund had no borrowings against these arrangements.
Federal taxes It is the policy of the fund to distribute all of its taxable income within the prescribed time period and otherwise comply with the provisions of the Internal Revenue Code of 1986, as amended (the Code), appli-cable to regulated investment companies. It is also the intention of the fund to distribute an amount sufficient to avoid imposition of any excise tax under Section 4982 of the Code.
The fund is subject to the provisions of Accounting Standards Codification 740 Income Taxes (ASC 740). ASC 740 sets forth a minimum threshold for financial statement recognition of the benefit of a tax position taken or expected to be taken in a tax return. The fund did not have a liability to record for any unrecognized tax benefits in the accompanying financial statements. No provision has been made for federal taxes on income, capital gains or unrealized appreciation on securities held nor for excise tax on income and capital gains. Each of the fund’s federal tax returns for the prior three fiscal years remains subject to examination by the Internal Revenue Service.
The fund may also be subject to taxes imposed by governments of countries in which it invests. Such taxes are generally based on either income or gains earned or repatriated. The fund accrues and applies such taxes to net investment income, net realized gains and net unrealized gains as income and/or capital gains are earned. In some cases, the fund may be entitled to reclaim all or a portion of such taxes, and such reclaim amounts, if any, are reflected as an asset on the fund’s books. In many cases, however, the fund may not receive such amounts for an extended period of time, depending on the country of investment.
Distributions to shareholders Distributions to shareholders from net investment income are recorded by the fund on the ex-dividend date. Distributions from capital gains, if any, are recorded on the ex-dividend date and paid at least annually. The amount and character of income and gains to be distributed are determined in accordance with income tax regulations, which may differ from generally accepted accounting principles. These differences include temporary and/or permanent differences from losses on wash sale transactions, from foreign currency gains and losses, and from straddle loss deferrals. Reclassifications are made to the fund’s capital accounts to reflect income and gains available for distribution (or available capital loss carryovers) under income tax regulations. At the close of the reporting period, the fund reclassified $3,725,353 to decrease undistributed net investment income, $1,376 to decrease paid-in capital and $3,726,729 to increase accumulated net realized gain.
Tax cost of investments includes adjustments to net unrealized appreciation (depreciation) which may not neces-sarily be final tax cost basis adjustments, but closely approximate the tax basis unrealized gains and losses that may be realized and distributed to shareholders. The tax basis components of distributable earnings and the federal tax cost as of the close of the reporting period were as follows:
Unrealized appreciation $304,493,351
Unrealized depreciation (24,594,649 )
Net unrealized appreciation 279,898,702
Undistributed ordinary income 4,012,053
Undistributed long-term gain 73,396,374
Cost for federal income tax purposes $1,026,554,497
For the fiscal year ended August 31, 2018, the fund had undistributed net investment income of $1,349,620.
Note 2: Management fee, administrative services and other transactionsThe fund pays Putnam Management a management fee (based on the fund’s average net assets and computed and paid monthly) at annual rates that may vary based on the average of the aggregate net assets of all open-end mutual funds sponsored by Putnam Management (excluding net assets of funds that are invested in, or that are invested in by, other Putnam funds to the extent necessary to avoid “double counting” of those assets). Such annual rates may vary as follows:
0.780 % of the first $5 billion,
0.730 % of the next $5 billion,
0.680 % of the next $10 billion,
0.630 % of the next $10 billion,
0.580 % of the next $50 billion,
0.560 % of the next $50 billion,
0.550 % of the next $100 billion and
0.545 % of any excess thereafter.

Global Health Care Fund 39
For the reporting period, the management fee represented an effective rate (excluding the impact from any expense waivers in effect) of 0.621% of the fund’s average net assets.
Putnam Management has contractually agreed, through December 30, 2020, to waive fees and/or reimburse the fund’s expenses to the extent necessary to limit the cumulative expenses of the fund, exclusive of brokerage, interest, taxes, investment-related expenses, extraordinary expenses, acquired fund fees and expenses and payments under the fund’s investor servicing contract, investment management contract and distribution plans, on a fiscal year-to-date basis to an annual rate of 0.20% of the fund’s average net assets over such fiscal year-to-date period. During the reporting period, the fund’s expenses were not reduced as a result of this limit.
Putnam Investments Limited (PIL), an affiliate of Putnam Management, is authorized by the Trustees to manage a separate portion of the assets of the fund as determined by Putnam Management from time to time. Putnam Management pays a quarterly sub-management fee to PIL for its services at an annual rate of 0.35% of the average net assets of the portion of the fund managed by PIL.
The Putnam Advisory Company, LLC (PAC), an affiliate of Putnam Management, is authorized by the Trustees to manage a separate portion of the assets of the fund, as designated from time to time by Putnam Management or PIL. PAC did not manage any portion of the assets of the fund during the reporting period. If Putnam Management or PIL were to engage the services of PAC, Putnam Management or PIL, as applicable, would pay a quarterly sub-advisory fee to PAC for its services at the annual rate of 0.35% of the average net assets of the portion of the fund’s assets for which PAC is engaged as sub-adviser.
The fund reimburses Putnam Management an allocated amount for the compensation and related expenses of certain officers of the fund and their staff who provide administrative services to the fund. The aggregate amount of all such reimbursements is determined annually by the Trustees.
Custodial functions for the fund’s assets are provided by State Street. Custody fees are based on the fund’s asset level, the number of its security holdings and transaction volumes.
Putnam Investor Services, Inc., an affiliate of Putnam Management, provides investor servicing agent functions to the fund. Putnam Investor Services, Inc. received fees for investor servicing for class A, class B, class C, class M, class R, and class Y shares that included (1) a per account fee for each direct and underlying non-defined contribu-tion account (retail account) of the fund; (2) a specified rate of the fund’s assets attributable to defined contribu-tion plan accounts; and (3) a specified rate based on the average net assets in retail accounts. Putnam Investor Services, Inc. has agreed that the aggregate investor servicing fees for each fund’s retail and defined contribution accounts for these share classes will not exceed an annual rate of 0.25% of the fund’s average assets attributable to such accounts.
During the reporting period, the expenses for each class of shares related to investor servicing fees were as follows:
Class A $1,876,128
Class B 31,166
Class C 50,690
Class M 16,132
Class R 3,544
Class Y 111,433
Total $2,089,093
The fund has entered into expense offset arrangements with Putnam Investor Services, Inc. and State Street whereby Putnam Investor Services, Inc.’s and State Street’s fees are reduced by credits allowed on cash balances. The fund also reduced expenses through brokerage/service arrangements. For the reporting period, the fund’s expenses were reduced by $15,818 under the expense offset arrangements and by $92,772 under the brokerage/service arrangements.
Each Independent Trustee of the fund receives an annual Trustee fee, of which $900, as a quarterly retainer, has been allocated to the fund, and an additional fee for each Trustees meeting attended. Trustees also are reimbursed for expenses they incur relating to their services as Trustees.
The fund has adopted a Trustee Fee Deferral Plan (the Deferral Plan) which allows the Trustees to defer the receipt of all or a portion of Trustees fees payable on or after July 1, 1995. The deferred fees remain invested in certain Putnam funds until distribution in accordance with the Deferral Plan.
The fund has adopted an unfunded noncontributory defined benefit pension plan (the Pension Plan) covering all Trustees of the fund who have served as a Trustee for at least five years and were first elected prior to 2004.

40 Global Health Care Fund
Benefits under the Pension Plan are equal to 50% of the Trustee’s average annual attendance and retainer fees for the three years ended December 31, 2005. The retirement benefit is payable during a Trustee’s lifetime, beginning the year following retirement, for the number of years of service through December 31, 2006. Pension expense for the fund is included in Trustee compensation and expenses in the Statement of operations. Accrued pension liability is included in Payable for Trustee compensation and expenses in the Statement of assets and liabilities. The Trustees have terminated the Pension Plan with respect to any Trustee first elected after 2003.
The fund has adopted distribution plans (the Plans) with respect to the following share classes pursuant to Rule 12b–1 under the Investment Company Act of 1940. The purpose of the Plans is to compensate Putnam Retail Management Limited Partnership, an indirect wholly-owned subsidiary of Putnam Investments, LLC, for services provided and expenses incurred in distributing shares of the fund. The Plans provide payments by the fund to Putnam Retail Management Limited Partnership at an annual rate of up to the following amounts (Maximum %) of the average net assets attributable to each class. The Trustees have approved payment by the fund at the following annual rate (Approved %) of the average net assets attributable to each class. During the reporting period, the class-specific expenses related to distribution fees were as follows:
Maximum % Approved % Amount
Class A 0.35 % 0.25 % $2,894,197
Class B 1.00 % 1.00 % 192,249
Class C 1.00 % 1.00 % 312,574
Class M 1.00 % 0.75 % 74,634
Class R 1.00 % 0.50 % 10,916
Total $3,484,570
For the reporting period, Putnam Retail Management Limited Partnership, acting as underwriter, received net commissions of $48,666 and $760 from the sale of class A and class M shares, respectively, and received $5,055 and $238 in contingent deferred sales charges from redemptions of class B and class C shares, respectively.
A deferred sales charge of up to 1.00% is assessed on certain redemptions of class A shares. For the reporting period, Putnam Retail Management Limited Partnership, acting as underwriter, received $87 on class A redemptions.
Note 3: Purchases and sales of securitiesDuring the reporting period, the cost of purchases and the proceeds from sales, excluding short-term investments, were as follows:
Cost of purchases Proceeds from sales
Investments in securities (Long-term ) $1,030,866,815 $1,184,382,793
U.S. government securities (Long-term ) — —
Total $1,030,866,815 $1,184,382,793
The fund may purchase or sell investments from or to other Putnam funds in the ordinary course of business, which can reduce the fund’s transaction costs, at prices determined in accordance with SEC requirements and policies approved by the Trustees. During the reporting period, purchases or sales of long-term securities from or to other Putnam funds, if any, did not represent more than 5% of the fund’s total cost of purchases and/or total proceeds from sales.

Global Health Care Fund 41
Note 4: Capital sharesAt the close of the reporting period, there were an unlimited number of shares of beneficial interest autho-rized. Transactions, including, if applicable, direct exchanges pursuant to share conversions, in capital shares were as follows:
YEAR ENDED 8/31/19 YEAR ENDED 8/31/18
Class A Shares Amount Shares Amount
Shares sold 472,090 $23,328,358 866,772 $44,662,785
Shares issued in connection with reinvestment of distributions 1,485,854 65,095,271 3,413,252 168,409,877
1,957,944 88,423,629 4,280,024 213,072,662
Shares repurchased (2,911,961 ) (144,767,485 ) (3,156,137 ) (166,644,537 )
Net increase (decrease ) (954,017 ) $(56,343,856 ) 1,123,887 $46,428,125
YEAR ENDED 8/31/19 YEAR ENDED 8/31/18
Class B Shares Amount Shares Amount
Shares sold 18,399 $502,937 54,109 $1,830,190
Shares issued in connection with reinvestment of distributions 78,641 1,932,987 184,090 5,393,841
97,040 2,435,924 238,199 7,224,031
Shares repurchased (196,437 ) (5,571,934 ) (261,758 ) (8,339,194 )
Net decrease (99,397 ) $(3,136,010 ) (23,559 ) $(1,115,163 )
YEAR ENDED 8/31/19 YEAR ENDED 8/31/18
Class C Shares Amount Shares Amount
Shares sold 78,678 $2,852,742 93,273 $3,741,727
Shares issued in connection with reinvestment of distributions 77,825 2,478,720 221,489 8,195,086
156,503 5,331,462 314,762 11,936,813
Shares repurchased (190,808 ) (6,965,969 ) (572,415 ) (22,231,585 )
Net decrease (34,305 ) $(1,634,507 ) (257,653 ) $(10,294,772 )
YEAR ENDED 8/31/19 YEAR ENDED 8/31/18
Class M Shares Amount Shares Amount
Shares sold 7,418 $278,553 16,223 $685,796
Shares issued in connection with reinvestment of distributions 22,319 744,771 48,005 1,848,680
29,737 1,023,324 64,228 2,534,476
Shares repurchased (45,757 ) (1,752,745 ) (39,040 ) (1,652,140 )
Net increase (decrease ) (16,020 ) $(729,421 ) 25,188 $882,336
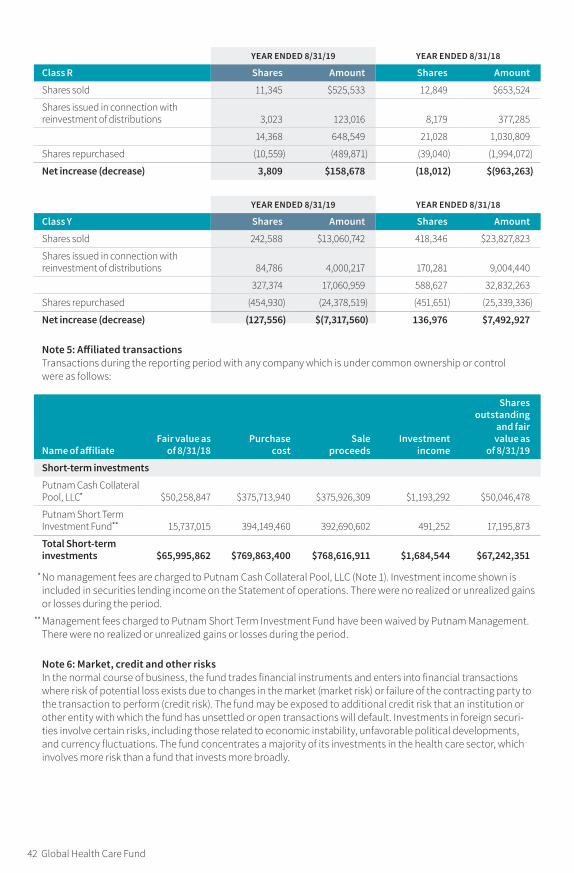
42 Global Health Care Fund
YEAR ENDED 8/31/19 YEAR ENDED 8/31/18
Class R Shares Amount Shares Amount
Shares sold 11,345 $525,533 12,849 $653,524
Shares issued in connection with reinvestment of distributions 3,023 123,016 8,179 377,285
14,368 648,549 21,028 1,030,809
Shares repurchased (10,559 ) (489,871 ) (39,040 ) (1,994,072 )
Net increase (decrease ) 3,809 $158,678 (18,012 ) $(963,263 )
YEAR ENDED 8/31/19 YEAR ENDED 8/31/18
Class Y Shares Amount Shares Amount
Shares sold 242,588 $13,060,742 418,346 $23,827,823
Shares issued in connection with reinvestment of distributions 84,786 4,000,217 170,281 9,004,440
327,374 17,060,959 588,627 32,832,263
Shares repurchased (454,930 ) (24,378,519 ) (451,651 ) (25,339,336 )
Net increase (decrease ) (127,556 ) $(7,317,560 ) 136,976 $7,492,927
Note 5: Affiliated transactionsTransactions during the reporting period with any company which is under common ownership or control were as follows:
Name of affiliateFair value as
of 8/31/18Purchase
costSale
proceedsInvestment
income
Shares outstanding
and fair value as
of 8/31/19
Short-term investments
Putnam Cash Collateral Pool, LLC * $50,258,847 $375,713,940 $375,926,309 $1,193,292 $50,046,478
Putnam Short Term Investment Fund * * 15,737,015 394,149,460 392,690,602 491,252 17,195,873
Total Short-term investments $65,995,862 $769,863,400 $768,616,911 $1,684,544 $67,242,351
* No management fees are charged to Putnam Cash Collateral Pool, LLC (Note 1). Investment income shown is included in securities lending income on the Statement of operations. There were no realized or unrealized gains or losses during the period.
** Management fees charged to Putnam Short Term Investment Fund have been waived by Putnam Management. There were no realized or unrealized gains or losses during the period.
Note 6: Market, credit and other risksIn the normal course of business, the fund trades financial instruments and enters into financial transactions where risk of potential loss exists due to changes in the market (market risk) or failure of the contracting party to the transaction to perform (credit risk). The fund may be exposed to additional credit risk that an institution or other entity with which the fund has unsettled or open transactions will default. Investments in foreign securi-ties involve certain risks, including those related to economic instability, unfavorable political developments, and currency fluctuations. The fund concentrates a majority of its investments in the health care sector, which involves more risk than a fund that invests more broadly.

Global Health Care Fund 43
Note 7: Summary of derivative activityThe volume of activity for the reporting period for any derivative type that was held during the period is listed below and was based on an average of the holdings at the end of each fiscal quarter:
Purchased equity option contracts (contract amount ) $230,000
Written equity option contracts (contract amount ) $120,000
Forward currency contracts (contract amount ) $176,100,000
Warrants (number of warrants ) 61,000
The following is a summary of the fair value of derivative instruments as of the close of the reporting period:
Fair value of derivative instruments as of the close of the reporting periodASSET DERIVATIVES LIABILITY DERIVATIVES
Derivatives not accounted for as hedging instruments under ASC 815
Statement of assets and
liabilities location Fair value
Statement of assets and
liabilities location Fair value
Foreign exchange contracts Investments, Receivables $2,510,393 Payables $1,928,865
Equity contracts
Investments, Receivables, Net
assets — Unrealized appreciation 2,580,433 Payables 1,624,414
Total $5,090,826 $3,553,279
The following is a summary of realized and change in unrealized gains or losses of derivative instruments in the Statement of operations for the reporting period (Note 1):
Amount of realized gain or (loss ) on derivatives recognized in net gain or (loss ) on investmentsDerivatives not accounted for as hedging instruments under ASC 815 Warrants Options
Forward currency
contracts Total
Foreign exchange contracts $— $— $(3,439,395 ) $(3,439,395 )
Equity contracts (60,391 ) (2,481,993 ) — $(2,542,384 )
Total $(60,391 ) $(2,481,993 ) $(3,439,395 ) $(5,981,779 )
Change in unrealized appreciation or (depreciation ) on derivatives recognized in net gain or (loss ) on investmentsDerivatives not accounted for as hedging instruments under ASC 815 Options
Forward currency contracts Total
Foreign exchange contracts $— $1,165,459 $1,165,459
Equity contracts (174,934 ) — $(174,934 )
Total $(174,934 ) $1,165,459 $990,525

Global Health Care Fund 45 44 Global Health Care Fund
Note 8: Offsetting of financial and derivative assets and liabilitiesThe following table summarizes any derivatives, repurchase agreements and reverse repurchase agreements, at the end of the reporting period, that are subject to an enforceable master netting agreement or similar agree-ment. For securities lending transactions or borrowing transactions associated with securities sold short, if any, see Note 1. For financial reporting purposes, the fund does not offset financial assets and financial liabilities that are subject to the master netting agreements in the Statement of assets and liabilities.
Bank
of
Amer
ica N
.A.
Barc
lays
Ban
k PL
C
Citib
ank,
N.A
.
Cred
it Su
isse
Inte
rnat
iona
l
Gold
man
Sa
chs
Inte
rnat
iona
l
HSBC
Ban
k US
A, N
atio
nal
Asso
ciat
ion
JPM
orga
n Ch
ase B
ank
N.A.
Stat
e Str
eet
Bank
and
Trus
t Co.
Tota
l
Assets:
Forward currency contracts# $— $1,321,502 $356,891 $139,992 $580,976 $8,168 $70,948 $31,916 $2,510,393
Purchased options**# — 2,580,433 — — — — — — 2,580,433
Total Assets $— $3,901,935 $356,891 $139,992 $580,976 $8,168 $70,948 $31,916 $5,090,826
Liabilities:
Forward currency contracts# 1,398,224 — 58,025 — — 118,388 231,854 122,374 1,928,865
Written options# — 1,624,414 — — — — — — 1,624,414
Total Liabilities $1,398,224 $1,624,414 $58,025 $— $— $118,388 $231,854 $122,374 $3,553,279
Total Financial and Derivative Net Assets $(1,398,224) $2,277,521 $298,866 $139,992 $580,976 $(110,220) $(160,906) $(90,458) $1,537,547
Total collateral received (pledged)†## $(936,878) $1,240,000 $240,000 $130,000 $515,901 $— $(160,906) $—
Net amount $(461,346) $1,037,521 $58,866 $9,992 $65,075 $(110,220) $— $(90,458)
Controlled collateral received (including TBA commitments)** $— $1,240,000 $240,000 $130,000 $— $— $— $— $1,610,000
Uncontrolled collateral received $— $— $— $— $515,901 $— $— $— $515,901
Collateral (pledged) (including TBA commitments)** $(936,878) $— $— $— $— $— $(305,619) $— $(1,242,497)
** Included with Investments in securities on the Statement of assets and liabilities.
† Additional collateral may be required from certain brokers based on individual agreements.
# Covered by master netting agreement (Note 1).
## Any over-collateralization of total financial and derivative net assets is not shown. Collateral may include amounts related to unsettled agreements.

46 Global Health Care Fund
Federal tax information (Unaudited)
Pursuant to §852 of the Internal Revenue Code, as amended, the fund hereby designates $81,458,596 as a capital gain dividend with respect to the taxable year ended August 31, 2019, or, if subsequently determined to be different, the net capital gain of such year.
The fund designated 100.00% of ordinary income distributions as qualifying for the dividends received deduction for corporations.
For the reporting period, the fund hereby designates 100.00%, or the maximum amount allow-able, of its taxable ordinary income distributions as qualified dividends taxed at the individual net capital gain rates.
For the reporting period, pursuant to §871(k) of the Internal Revenue Code, the fund hereby desig-nates $99,746 of distributions paid as qualifying to be taxed as interest-related dividends, and $12,245,616 to be taxed as short-term capital gain dividends for nonresident alien shareholders.
The Form 1099 that will be mailed to you in January 2020 will show the tax status of all distributions paid to your account in calendar 2019.

Global Health Care Fund 47
Services for shareholders
Investor services
Systematic investment plan Tell us how much you wish to invest regularly — weekly, semimonthly, or monthly — and the amount you choose will be transferred automatically from your checking or savings account. There’s no additional fee for this service, and you can suspend it at any time. This plan may be a great way to save for college expenses or to plan for your retirement.
Please note that regular investing does not guarantee a profit or protect against loss in a declining market. Before arranging a system-atic investment plan, consider your financial ability to continue making purchases in periods when prices are low.
Systematic exchange You can make regular transfers from one Putnam fund to another Putnam fund. There are no additional fees for this service, and you can cancel or change your options at any time.
Dividends PLUS You can choose to have the dividend distributions from one of your Putnam funds automatically reinvested in another Putnam fund at no additional charge.
Free exchange privilege You can exchange money between Putnam funds free of charge, as long as they are the same class of shares. A signature guarantee is required if you are exchanging more than $500,000. The fund reserves the right to revise or terminate the exchange privilege.
Reinstatement privilege If you’ve sold Putnam shares or received a check for a divi-dend or capital gain, you may reinvest the proceeds with Putnam within 90 days of the
transaction and they will be reinvested at the fund’s current net asset value — with no sales charge. However, reinstatement of class B shares may have special tax consequences. Ask your financial or tax representative for details.
Check-writing service You have ready access to many Putnam accounts. It’s as simple as writing a check, and there are no special fees or service charges. For more information about the check-writing service, call Putnam or visit our website.
Dollar cost averaging When you’re investing for long-term goals, it’s time, not timing, that counts. Investing on a systematic basis is a better strategy than trying to figure out when the markets will go up or down. This means investing the same amount of money regularly over a long period. This method of investing is called dollar cost averaging. When a fund’s share price declines, your investment dollars buy more shares at lower prices. When it increases, they buy fewer shares. Over time, you will pay a lower average price per share.
For more information
Visit the Individual Investors section at putnam.com A secure section of our website contains complete information on your account, including balances and transac-tions, updated daily. You may also conduct transactions, such as exchanges, additional investments, and address changes. Log on today to get your password.
Call us toll free at 1-800-225-1581 Ask a helpful Putnam representative or your financial advisor for details about any of these or other services, or see your prospectus.

48 Global Health Care Fund
Putnam family of fundsThe following is a list of Putnam’s open-end mutual funds offered to the public. Investors should carefully consider the investment objective, risks, charges, and expenses of a fund before investing. For a prospectus, or a summary prospectus if available, containing this and other information for any Putnam fund or product, contact your financial advisor or call Putnam Investor Services at 1-800-225-1581. Please read the prospectus carefully before investing.
BlendCapital Spectrum FundEmerging Markets Equity FundEquity Spectrum FundFocused Equity FundGlobal Equity FundInternational Capital Opportunities FundInternational Equity FundMulti-Cap Core FundResearch Fund
Global SectorGlobal Health Care FundGlobal Technology Fund
GrowthGrowth Opportunities FundInternational Growth FundSmall Cap Growth FundSustainable Future FundSustainable Leaders Fund
ValueConvertible Securities FundEquity Income FundInternational Value Fund Small Cap Value Fund
IncomeDiversified Income TrustFloating Rate Income FundGlobal Income TrustGovernment Money Market Fund*
High Yield FundIncome FundMoney Market Fund†
Mortgage Opportunities Fund Mortgage Securities FundShort Duration Bond FundUltra Short Duration Income Fund
Tax-free IncomeAMT-Free Municipal FundIntermediate-Term Municipal Income FundShort-Term Municipal Income FundTax Exempt Income FundTax-Free High Yield Fund
State tax-free income funds‡: California, Massachusetts, Minnesota, New Jersey, New York, Ohio, and Pennsylvania.

Global Health Care Fund 49
Absolute ReturnFixed Income Absolute Return FundMulti-Asset Absolute Return Fund
Putnam PanAgora**
Putnam PanAgora Managed Futures StrategyPutnam PanAgora Market Neutral FundPutnam PanAgora Risk Parity Fund
Asset AllocationDynamic Risk Allocation FundGeorge Putnam Balanced Fund
Dynamic Asset Allocation Balanced FundDynamic Asset Allocation Conservative FundDynamic Asset Allocation Growth Fund
Retirement Income Fund Lifestyle 1
RetirementReady® 2060 Fund RetirementReady® 2055 FundRetirementReady® 2050 FundRetirementReady® 2045 FundRetirementReady® 2040 FundRetirementReady® 2035 FundRetirementReady® 2030 FundRetirementReady® 2025 FundRetirementReady® 2020 Fund
* You could lose money by investing in the fund. Although the fund seeks to preserve the value of your investment at $1.00 per share, it cannot guarantee it will do so. An investment in the fund is not insured or guaranteed by the Federal Deposit Insurance Corporation or any other government agency. The fund’s sponsor has no legal obligation to provide financial support to the fund, and you should not expect that the sponsor will provide financial support to the fund at any time.
† You could lose money by investing in the fund. Although the fund seeks to preserve the value of your investment at $1.00 per share, it cannot guarantee it will do so. The fund may impose a fee upon sale of your shares or may temporarily suspend your ability to sell shares if the fund’s liquidity falls below required minimums because of market conditions or other factors. An investment in the fund is not insured or guaranteed by the Federal Deposit Insurance Corporation or any other government agency. The fund’s sponsor has no legal obligation to provide financial support to the fund, and you should not expect that the sponsor will provide financial support to the fund at any time.
‡ Not available in all states.
** Sub-advised by PanAgora Asset Management.Check your account balances and the most recent month-end performance in the Individual Investors section at putnam.com.

About the TrusteesINDEPENDENT TRUSTEES
Liaquat Ahamed Born 1952, Trustee since 2012Principal occupations during past five years: Pulitzer Prize-winning author of Lords of Finance: The Bankers Who
Broke the World, whose articles on economics have appeared in such publications as the New York Times, Foreign Affairs, and the Financial Times. Trustee of the Brookings Institution.
Other directorships: The Rohatyn Group, an emerging-market fund complex that manages money for institutions
Ravi AkhouryBorn 1947, Trustee since 2009Principal occupations during past five years: Trustee of the Rubin Museum. From 1992 to 2007, was Chairman and
CEO of MacKay Shields, a multi-product investment management firm.
Other directorships: English Helper, Inc., a private software company
Barbara M. Baumann Born 1955, Trustee since 2010Principal occupations during past five years: President and Owner of Cross Creek Energy Corporation, a strategic
consultant to domestic energy firms and direct investor in energy projects. Current Treasurer of the Board and Chair of the Finance Committee, The Denver Foundation. Member of the Finance Committee, the Children’s Hospital of Colorado. Senior Advisor to First Reserve, an energy and private equity firm.
Other directorships: Buckeye Partners, L.P., a publicly traded master limited partnership focused on pipeline transport, storage, and distribution of petroleum products; Devon Energy Corporation, an independent natural gas and oil exploration and production company
Katinka DomotorffyBorn 1975, Trustee since 2012Principal occupations during past five years: Voting member of the Investment Committees of the Anne Ray Charitable
Trust and Margaret A. Cargill Foundation, part of the Margaret A. Cargill Philanthropies. Until 2011, Partner, Chief Investment Officer, and Global Head of Quantitative Investment Strategies at Goldman Sachs Asset Management.
Other directorships: Great Lakes Science Center; College Now Greater Cleveland
Catharine Bond HillBorn 1954, Trustee since 2017Principal occupations during past five years: Managing Director of Ithaka S+R, a not-for-profit service that helps
the academic community navigate economic and technological change. From 2006 to 2016, served as the 10th President of Vassar College. Prior to 2006, was Provost of Williams College.
Other directorships: Director of Yale-NUS College; Alumni Fellow to the Yale Corporation
Dr. Paul L. JoskowBorn 1947, Trustee since 1997Principal occupations during past five years: Elizabeth and James Killian Professor of Economics, Emeritus at the
Massachusetts Institute of Technology (MIT). Head of the MIT Department of Economics from 1994 to 1998 and Director of the MIT Center for Energy and Environmental Policy Research from 1999 through 2007. From 2008 to 2017, President of the Alfred P. Sloan Foundation, a philanthropic institution focused primarily on research and education issues related to science, technology, and economic performance.
Other directorships: Yale University; Exelon Corporation, an energy company focused on power services; Member Emeritus of the Board of Advisors of the Boston Symphony Orchestra; Prior to April 2013, served as Director of TransCanada Corporation and TransCanada Pipelines Ltd., energy companies focused on natural gas transmission, oil pipelines and power services
50 Global Health Care Fund

Kenneth R. LeiblerBorn 1949, Trustee since 2006 Vice Chair from 2016 to 2018, and Chair since 2018Principal occupations during past
five years: Founder and former Chairman of Boston Options Exchange, an electronic marketplace for the trading of derivative securities. Vice Chair Emeritus of the Board of Trustees of Beth Israel Deaconess Hospital in Boston, Massachusetts, and former Director of Beth Israel Deaconess Care Organization. Until November 2010, Director of Ruder Finn Group, a global communications and advertising firm.
Other directorships: Eversource Corporation, which operates New England’s largest energy delivery system
Robert E. PattersonBorn 1945, Trustee since 1984Principal occupations during past five years: Until 2017, Co-Chairman of Cabot Properties, Inc., a private equity firm
investing in commercial real estate, and Chairman or Co-Chairman of the Investment Committees for various Cabot Funds. Past Chairman and Trustee of the Joslin Diabetes Center.
George Putnam, IIIBorn 1951, Trustee since 1984Principal occupations during past five years: Chairman of New Generation Research, Inc., a publisher of financial
advisory and other research services. Founder and President of New Generation Advisors, LLC, a registered investment advisor to private funds. Director of The Boston Family Office, LLC, a registered investment advisor.
Other directorships: Trustee of Gloucester Marine Genomics Institute. Until June 2019, a Trustee of the Marine Biological Laboratory.
Manoj P. SinghBorn 1952, Trustee since 2017Principal occupations during past five years: Until 2015, Chief Operating Officer and Global Managing Director at
Deloitte Touche Tohmatsu, Ltd., a global professional services organization. Served on the Deloitte U.S. Board of Directors and the boards of Deloitte member firms in China, Mexico, and Southeast Asia.
Other directorships: Director of Abt Associates, a global research firm focused on health, social and environmental policy, and international development. Trustee of Carnegie Mellon University. Trustee of Rubin Museum of Art. Director of Pratham USA, an organization dedicated to children’s education in India. Member of the Advisory Board of Altimetrik, a business transformation and technology solutions firm. Director of DXC Technology, a global IT services and consulting company
INTERESTED TRUSTEE
Robert L. Reynolds*
Born 1952, Trustee since 2008 and President of the Putnam Funds since 2009
Principal occupations during past five years: President and Chief Executive
Officer of Putnam Investments since 2008 and, since 2014, President and Chief Executive Officer of Great-West Financial, a financial services company that provides retirement savings plans, life insurance, and annuity and executive benefits products, and of Great-West Lifeco U.S. Inc., a holding company that owns Putnam Investments and Great-West Financial. Since 2019, Chair of Great-West Lifeco U.S. Inc. Prior to joining Putnam Investments, served as Vice Chairman and Chief Operating Officer of Fidelity Investments from 2000 to 2007.
* Mr. Reynolds is an “interested person” (as defined in the Investment Company Act of 1940) of the fund and Putnam Investments. He is President and Chief Executive Officer of Putnam Investments, as well as the President of your fund and each of the other Putnam funds.
The address of each Trustee is 100 Federal Street, Boston, MA 02110.
As of August 31, 2019, there were 91 Putnam funds. All Trustees serve as Trustees of all Putnam funds.
Each Trustee serves for an indefinite term, until his or her resignation, retirement at age 75, removal, or death.
Global Health Care Fund 51

The principal occupations of the officers for the past five years have been with the employers as shown above, although in some cases they have held different positions with such employers. The address of each officer is 100 Federal Street, Boston, MA 02110.
OfficersIn addition to Robert L. Reynolds, the other officers of the fund are shown below:
Robert T. Burns (Born 1961)Vice President and Chief Legal OfficerSince 2011General Counsel, Putnam Investments, Putnam Management, and Putnam Retail Management
James F. Clark (Born 1974)Vice President and Chief Compliance OfficerSince 2016Chief Compliance Officer and Chief Risk Officer, Putnam Investments and Chief Compliance Officer, Putnam Management
Nancy E. Florek (Born 1957)Vice President, Director of Proxy Voting and Corporate Governance, Assistant Clerk, and Assistant TreasurerSince 2000
Michael J. Higgins (Born 1976)Vice President, Treasurer, and ClerkSince 2010
Jonathan S. Horwitz (Born 1955)Executive Vice President, Principal Executive Officer, and Compliance LiaisonSince 2004
Richard T. Kircher (Born 1962)Vice President and BSA Compliance OfficerSince 2019Assistant Director, Operational Compliance, Putnam Investments and Putnam Retail Management
Susan G. Malloy (Born 1957)Vice President and Assistant TreasurerSince 2007Head of Accounting and Middle Office Services, Putnam Investments and Putnam Management
Denere P. Poulack (Born 1968)Assistant Vice President, Assistant Clerk, and Assistant TreasurerSince 2004
Janet C. Smith (Born 1965)Vice President, Principal Financial Officer, Principal Accounting Officer, and Assistant TreasurerSince 2007Head of Fund Administration Services, Putnam Investments and Putnam Management
Mark C. Trenchard (Born 1962)Vice PresidentSince 2002Director of Operational Compliance, Putnam Investments and Putnam Retail Management
52 Global Health Care Fund

Fund informationFounded over 80 years ago, Putnam Investments was built around the concept that a balance between risk and reward is the hallmark of a well-rounded financial program. We manage funds across income, value, blend, growth, sustainable, asset allocation, absolute return, and global sector categories.
Investment ManagerPutnam Investment Management, LLC 100 Federal Street Boston, MA 02110
Investment Sub-AdvisorsPutnam Investments Limited 16 St James’s Street London, England SW1A 1ER
The Putnam Advisory Company, LLC 100 Federal Street Boston, MA 02110
Marketing ServicesPutnam Retail Management 100 Federal Street Boston, MA 02110
CustodianState Street Bank and Trust Company
Legal CounselRopes & Gray LLP
Independent Registered Public Accounting FirmPricewaterhouseCoopers LLP
TrusteesKenneth R. Leibler, Chair Liaquat Ahamed Ravi Akhoury Barbara M. Baumann Katinka Domotorffy Catharine Bond Hill Paul L. Joskow Robert E. Patterson George Putnam, III Robert L. Reynolds Manoj P. Singh
OfficersRobert L. Reynolds President
Robert T. Burns Vice President and Chief Legal Officer
James F. Clark Vice President, Chief Compliance Officer, and Chief Risk Officer
Nancy E. Florek Vice President, Director of Proxy Voting and Corporate Governance, Assistant Clerk, and Assistant Treasurer
Michael J. Higgins Vice President, Treasurer, and Clerk
Jonathan S. Horwitz Executive Vice President, Principal Executive Officer, and Compliance Liaison
Richard T. Kircher Vice President and BSA Compliance Officer
Susan G. Malloy Vice President and Assistant Treasurer
Denere P. Poulack Assistant Vice President, Assistant Clerk, and Assistant Treasurer
Janet C. Smith Vice President, Principal Financial Officer, Principal Accounting Officer, and Assistant Treasurer
Mark C. Trenchard Vice President
This report is for the information of shareholders of Putnam Global Health Care Fund. It may also be used as sales literature when preceded or accompanied by the current prospectus, the most recent copy of Putnam’s Quarterly Performance Summary, and Putnam’s Quarterly Ranking Summary. For more recent performance, please visit putnam.com. Investors should carefully consider the investment objectives, risks, charges, and expenses of a fund, which are described in its prospectus. For this and other information or to request a prospectus or summary prospectus, call 1-800-225-1581 toll free. Please read the prospectus carefully before investing. The fund’s Statement of Additional Information contains additional information about the fund’s Trustees and is available without charge upon request by calling 1-800-225-1581.

AN00
8 31
8128
10
/19
Elec
tron
ic se
rvic
e re
ques
ted
100
Fede
ral S
tree
t Bo
ston
, MA
0211
0
1-80
0-22
5-15
81pu
tnam
.com
PRSR
T ST
D
U.S
. PO
STAG
E PA
ID
BRO
CKTO
N, M
A
PERM
IT N
O. 6
00
HOW
WOU
LD YO
U LI
KE T
O RE
CEIV
E RE
PORT
S LI
KE T
HIS?
Go gr
een w
ith p
aper
less
del
iver
y 1.
Log i
n to
your
acco
unt a
t put
nam
.com
2. Un
der a
ccou
nt p
refe
renc
es, s
elect
“m
ailin
g and
pap
erle
ss o
ptio
ns”
Cont
inue
with
pape
r rep
orts
by m
ail
Call P
utna
m at
1-80
0-22
5-15
81.