Embed Size (px)
DESCRIPTION
This PPT contains data on Global Innovation index (GII).Data on BRICS and how they performed in GII.What are the problems that they face and why they are ranked lower. Significant performance of China.
Citation preview

THE GLOBAL INNOVATION INDEX

ABOUT GII
● Conceived at INSEAD B-School, France. First published in 2007, last report in 2014.
● Uses objective data to rank a country’s innovation related policies and practices
● GII 2014 covered 143 countries○ 92.9% of world population○ 98.3% of world’s GDP
● Calculation methodology is revised and adjusted every year

INNOVATION
“Innovation is not just about generating new ideas. It is about translating these ideas into value-added
products and services.”
● Manufacturing => Services => Innovation● Driver of long-term economic growth and and
well-being● Innovation readiness at national level
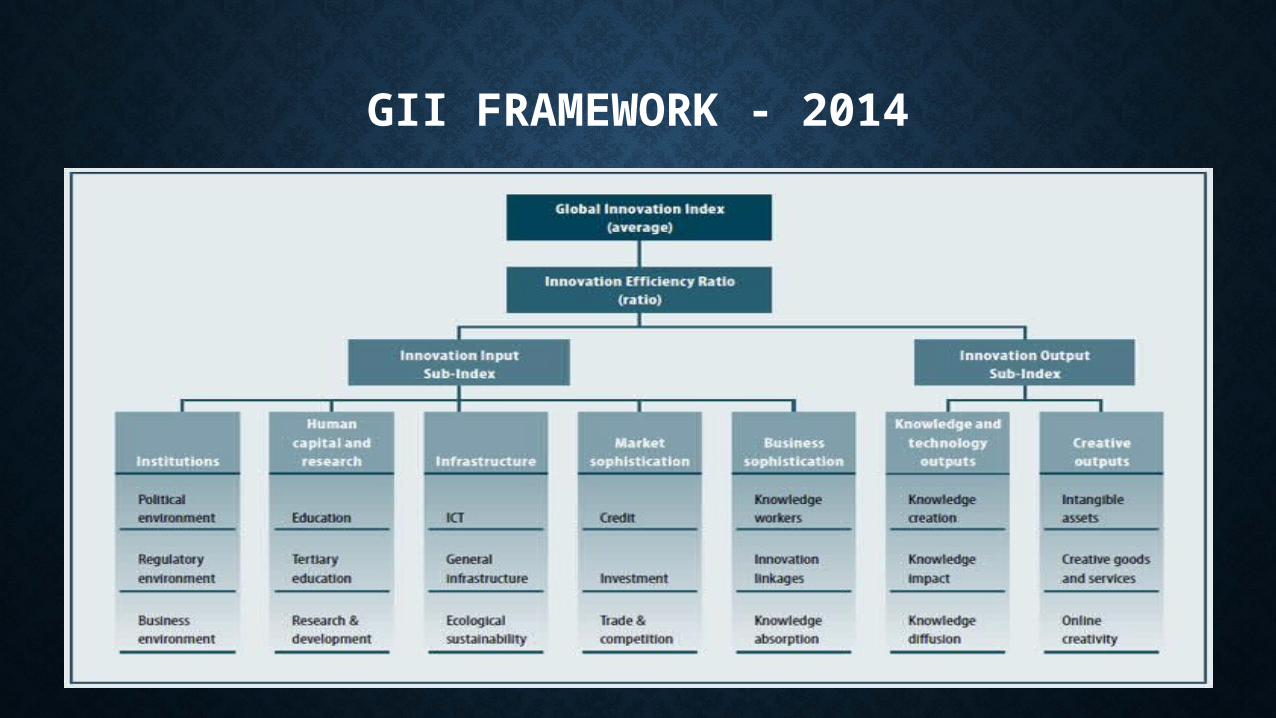
GII FRAMEWORK - 2014

HOW IS THE INDEX CALCULATED
• There are broadly two categories of parameters• Innovation Input Index
• Innovation Output Index
• Each of these has sub parameters for which a country is scored on a scale of ‘1-7’
Innovation Efficiency Index = Innovation Output Index
Innovation Input Index

TOP 20 COUNTRIES IN 2014
Country ScoreRank Country Score Rank
Switzerland 64.78 1 Ireland 56.67 11
UK 62.37 2 Canada 56.13 12
Sweden 62.29 3 Germany 56.02 13
Finland 60.67 4 Norway 55.59 14
Netherlands 60.59 5 Israel 55.46 15
US 60.09 6 South Korea 55.27 16
Singapore 59.24 7 Australia 55.01 17
Denmark 57.52 8 New Zealand 54.52 18
Luxembourg 56.86 9 Iceland 54.05 19
Hongkong 56.82 10 Austria 53.41 20

• The top 10 is almost intact since 2010
• The high income countries are consistently topping the list, with the only exception of China (Middle income) in the top 30
• Region wise, Europe and North America are in the top along with countries from South East Asia
• Israel is the only country from West Asian Region to be in the top 30
• India has a Innovation efficiency ratio of 0.82 which is in the range of High Income countries in the Top 10
• India is ranked 31st in innovation efficiency Ratio

WHAT DO THEY HAVE IN COMMON
• High Income Countries
• Strong institutions
• Infrastructure
• Knowledge creation and diffusion
• Market Sophistication

Switzerland vs IndiaIndicators Switzerland India
Population 8 Million 1236 Million
GDP Per Capita $46430 $1870
Income Group High Income Group Lower Middle Income
Rank 1 76
Innovation Output Sub Index
Score: 63.7 & Rank: 1 Score: 30.4 & Rank: 65
Innovation Input Sub Index
Score: 66.4 & Rank: 7 Score: 37 & Rank: 93
Innovation Efficiency Ratio
Score: 0.9 & Rank: 6 Score: 0.8 & Rank: 31
Switzerland strong areas1. Political stability2. Government effectiveness3. Rule of law4. Ease of paying taxes5. PISA scale in Reading, Maths and Science6. R&D7. ICT Access8. Ecological Sustainability9. Knowledge creation and diffusion10. University industry collaboration in research11. Venture capital
India’s strong areas1. R & D2. Gross capital formation which3. Knowledge diffusion4. Market capitalization5. Intensity of local competition


INDIA’S PERFORMANCE IN GII
Year Input Sub Index
Output Sub Index
2008 43 7
2009 49 34
2010 54 69
2011 87 44
2012 96 40
2013 87 42
2014 93 65
2008 2009 2010 2011 2012 2013 20140
20
40
60
80
100
120
India’s Performance in Input and Output Index
Input Sub Index Output Sup Index

INDIA’S PERFORMANCE IN VARIOUS PARAMETERS IN GII
Year Institutions
Human Capital & Research
Infrastrucutre
Market Sophistication
Business Sophistication
Knowledge and Tech Outputs
Creative Outputs
2009 44 28 76 39 50 23 90
2010 73 38 108 32 41 70 78
2011 94 104 63 45 84 60 38
2012 125 131 78 46 75 47 34
2013 102 105 89 49 94 37 65
2014 106 96 87 50 93 50 82

2009 2010 2011 2012 2013 20140
20
40
60
80
100
120
140
India’s Performance in Various Factors of GII
Institutions Human Capital & Research Infrastrucutre Market SophisticationBusiness Sophistication Knowledge and Tech Outputs Creative Outputs

MAIN ISSUES TO BE ADDRESSED
• Institutions• Political Stability
• Business Environment
• Human Capital• Education
• Tertiary Education
• Infrastructure• ICT Access
• Environmental Performance
• Business Sophistication• Knowledge Workers
• Knowledge Absorption
• Creative Outputs• Patents filed
• Wiki edits

HOW IS THE INDEX EVOLVING
• New Businesses
• E- participation
• Environmental performance
• Micro Finance
• Generic Top Level Domains
• GMAT Test Takers
• Domestic Resident Patent…………….

THANK YOU