Embed Size (px)
Citation preview
Global J. Environ. Sci. Manage. 5(1): 1-16, Winter 2019
*Corresponding Author:Email: [email protected].: +63905 763 9849 Fax: +6388 356 1912
Note: Discussion period for this manuscript open until April 1, 2019 on GJESM website at the “Show Article.
Global Journal of Environmental Science and Management (GJESM)
Homepage: https://www.gjesm.net/
ORIGINAL RESEARCH PAPER
Flood hazard zones using 2d hydrodynamic modeling and remote sensing approaches
M.B.T. Alivio*; G.R. Puno; B.A.M. Talisay
Geo-Safer Project, College of Forestry and Environmental Science, Central Mindanao University, Musuan, Bukidnon, Philippines
The increasing frequency and severity of flooding demands identification of flood hazard zones in Kalilangan, Bukidnon in response to the echoing need of better disaster preparedness via enhancing the understanding and awareness of the public on flood characteristics by integrating the use of two-dimensional hydrodynamic modeling and remote sensing. Flood simulation was carried out in a two-dimensional hydrodynamic model using hydrologic engineering center-river analysis system to derive the flood inundation area and flood depth of Kalilangan, Bukidnon. Thus, it was preceded by pre-processing of the model using software packages of hydrologic engineering center-hydrologic modeling system and ArcGIS along with interferometric synthetic aperture radar–digital elevation model, Manning’s roughness coefficient and precipitation data. Five different rain return flooding scenarios were simulated using rainfall intensity duration frequency data. Three zones of flood hazard were then set as low, medium and high. The result shows that most areas of Kalilangan are within the zones of medium to high hazard with residential buildings as the most flooded type of built-up structures. Flood hazard zone areas could be mapped at an accuracy of 79.51%. Thus, harnessing this potential approach offers cost-effective way of flood preparedness viewing hazard-prone areas with special attention and utmost importance.
©2019 GJESM. All rights reserved.
ARTICLE INFO
Article History:Received 17 August 2018Revised 21 October 2018Accepted 2 November 2018
Keywords:Digital elevation model (DEM)Hydrologic modeling system (HMS)Interferometric synthetic aperture
radar (IFSAR)Return periodRiver analysis system (RAS)
ABSTRAC T
INTRODUCTION
Located along the world’s busiest Pacific typhoon belt, Philippines endures an average of 20 tropical cyclones every year which enters the country’s area of responsibility causing weather-related or meteorological disasters (Acosta, 2016). According to 2016 World Risk Index which indicates the risk of disaster in consequence of extreme natural events,
Philippines ranked third as the most disaster-prone country in the world with the greatest exposure to natural disasters scoring 52.46% and should be understood as a warning to be prepared for a catastrophic events in the future with increased frequency and severity. Hence, the most devastating in terms of their economic and social impact are typhoons and floods accounting for 80 percent of all deaths, 90 percent of the total number of affected people, and 92 percent of the total economic impact (Comes et al., 2016). The most perilous natural threats and principal trigger of calamities (Alcantara-Ayala, 2002) which instigates flooding are related to
DOI: 10.22034/gjesm.2019.01.01
2
M.B.T. Alivio et al.
hydro-meteorological phenomena such as typhoons, tropical cyclones, monsoons (Kale et al., 1994), El Niño or La Niña. Typhoon-induced floods are the most common, inevitable and costly large natural disturbances affecting the Philippines annually causing devastation with known loss of over a thousand lives and properties, flood-induced diseases and social disruption hampering economic advancement which may have a serious effect on the quality of life of each people and impact on the social fabric of surrounding community (Jha et al., 2018; Gordon, 2014). Accordingly, as a result of the instability of the Earth’s surface features, geomorphic hazards like floods can be viewed as a group of threats to human’s lives, properties and natural resources. The municipality of Kalilangan, Bukidnon in Mindanao is no exemption to the distressing effect of floods due to the continuous heavy rainfall instigated by typhoons and/or monsoons. It can be recalled then that the main reason of major flooding in the municipality is the influence of Saguirayan, Malatipay and Maradugao Rivers which overflow due to uninterrupted rains wrought by a low-pressure area in the eastern part of Mindanao making it vulnerable to flooding (Yap, 2011). Attested by the Municipal Disaster Risk Reduction and Management Office (MDRRMO) of Kalilangan, past incidents of flash floods and inundation were only recorded earlier in the year 2003 to 2017 which has incurred damages on infrastructure, agriculture, poultry, livestock and even residential houses. This is affirmed by Secretary Luwalhati Antonino, head of the Mindanao Development Authority stressing that flooding has been viewed as the new normal particularly in the once considered typhoon-free Mindanao region which is attributed to climate change and weather disturbances in the country. Recently, a flashflood transpired in Kalilangan, Bukidnon on September 2, 2017, affecting six barangays with a total of 1,775 families or 8,875 persons. Furthermore, MDRRMO stressed out that three barangays, namely Poblacion, West Poblacion and Pamotolon were submerged in waist-deep floodwaters forcing 1,640 families from their homes. The flooding incident caused a damaging effect to 116.8 ha of rice fields, 48.5 ha of corn fields, 107 heads of livestock and poultry as well as the spillway connecting the two barangays of Kinura and Kibaning (NDRRMC Update, 2017). Consequently, the MDRRMO sought to control and manage the
recurrent flooding in a way that it will not be disastrous or its impact will be lessened. However, their disaster management system mostly relies on response and reactive approach based on post-disasters rather than preparedness and preventive approach which is deemed more preferable and effective. Thus, most studies connected with floods have shown the importance of flood hazard zoning and mapping on floodplain management, global disaster preparedness and risk mitigation. Indeed, no fully define mechanism and studies have been directed on the flood hazard zoning of Kalilangan, Bukidnon as a means and tool of LGUs in disaster preparedness and prevention. Hydrodynamic models simulate the motion of water by understanding the conditions derived from applying physical laws to fluid movement with varying degrees of complexity which involves the utilization of one-dimensional (1D) (Brunner, 2016; DHI, 2003), two-dimensional (2D) (DHI, 2012; Moulinec et al., 2011) and three-dimensional (3D) methodologies (Prakash et al., 2014; Vacondio et al., 2011). The concept of applying 2D hydrodynamic models to rivers and floodplain has been successful from large-scale floodplains to small urban areas on a regular basis (Tennakoon, 2004). It was agreed by Liu et al. (2012) that the capability of the 2D hydrodynamic model to calculate flood submerged area, flood water depth distribution and flood routing time attracts much attention in flood control management. Thus, the efficiency of flood emergency management could be improved thru provision of flood information which offers more help with risk indications. Its popularity is associated with the recent advancement of geographic information system (GIS) and remote sensing (RS) technology. GIS enhanced the visualization and presentation possibilities due to its capability of exporting the model output files into a raster (Tennakoon, 2004) and need to be used collectively with a hydraulic technique to estimate flood profile with a given recurrence interval. On the other hand, remote sensing provides floodplain topography data to augment the amount and type of information available for effective flood management (Schumann, 2015). Digital elevation model (DEM), a remotely sensed data is one of the most important input data in flood modeling because it determines the topographic information of a particular river basin and/or watershed (Neussner, Obermaier and

3
Global J. Environ. Sci. Manage., 5(1): 1-16, Winter 2019
Sanchez, 2012; Konadu and Fosu, 2009). The DEM incorporated in the present study was obtained from Interferometric Synthetic Aperture Radar (IFSAR), a technology which uses two radar antennae mounted on an aircraft called as the interferometric baseline and is displaced by a known distance. IFSAR-DEM has a 5-m resolution which is essentially cost-effective in providing data with accuracy and offers more strategic substitute for immediate response during the occurrence of a disaster especially for LGUs during tropical storms and flood (Suarez et al., 2014). The use of GIS and RS datasets have been broadly used in facilitating flood hazard modeling and mounted its application in the areas of flood management such as flood inundation mapping, floodplain zoning, and river morphological research (Ng et al., 2017; Khanna et al., 2018). However, along with RS and GIS, Hydrologic Modeling System (HMS) and River Analysis System (RAS) are the two computer models used to analyze the behaviors of a river basin and/or watershed (Chatterjee et al., 2014; Zope et al., 2015). HEC-HMS is used for rainfall-runoff modeling while HEC-RAS is intended for 2D hydrodynamic modeling (Tahmasbinejad et al., 2012). In recent years, the burgeoning interest in the application of modern technology in flood management is the unique capabilities of space technology in providing the basic information needed in the space, time and frequency domain of monitoring and managing flood dynamics. Flooding is frequent in Kalilangan, Bukidnon attributed by climate change which urged the Provincial Disaster Risk Reduction and Management Office of Bukidnon to ensure timelier, efficient and coordinated disaster preparedness among the local government units in the province by proposing a uniform alarm system in floodprone rivers. The advancement in hydrodynamic models and GIS techniques along with hydrologic model has paved a way for remote sensing to play a significant role in providing valuable information in flood assessment, mitigation and preparedness phases of floods (Khanna et al., 2018). Maximum flood inundation and water depth may be adequate for hazard mapping, environmental evaluation and water resources planning (Teng et al., 2011). So, as the frequency and severity of flooding increases, the need of flood hazard zonation remains wanting in response to societal demand and echoing need of better disaster preparedness via enhancing the understanding and
awareness of flood characteristics. Integrating the use of two-dimensional hydrodynamic modeling and remote sensing along with GIS techniques, the present study focuses on demarcating and zoning potential flood hazard-prone areas of Kalilangan, Bukidnon which will guide in setting evacuation routes, rescue actions and defining safe areas to allocate affected people. This study has been carried out in Maradugao River of the Municipality of Kalilangan, Bukidnon, Philippines in 2017.
MATERIALS AND METHODS
Study areaGeographically, Kalilangan, Bukidnon lies between
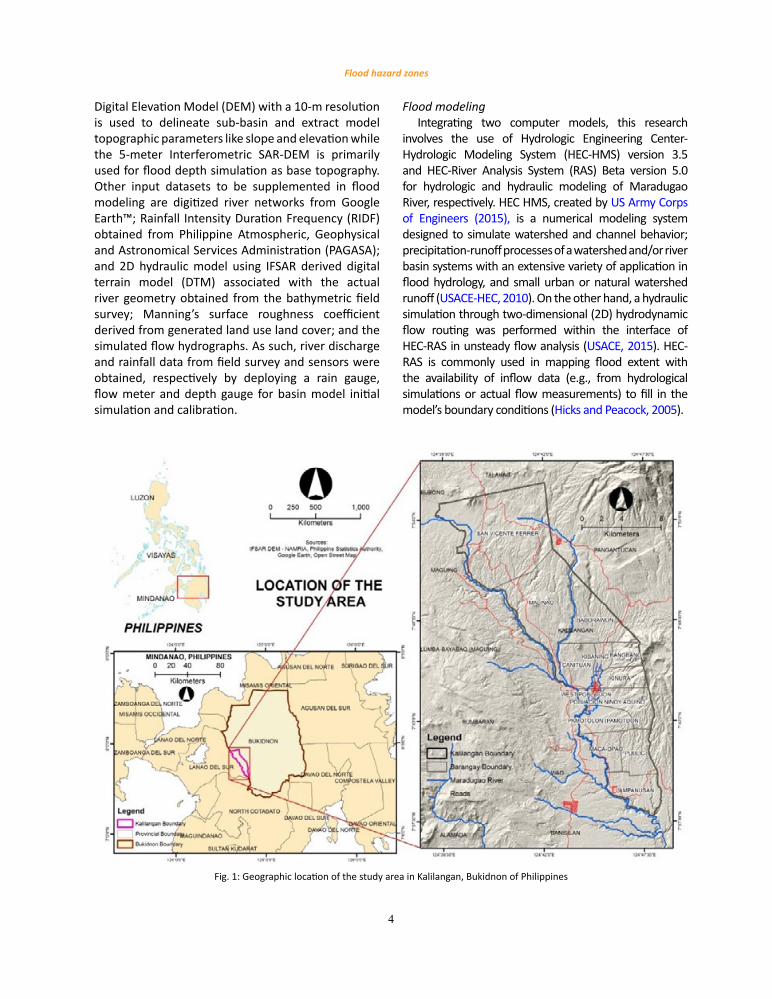
the coordinates of 7° 37’ 47.58” to 7° 56’ 2.42” north latitude and 124° 36’ 7.03” to 124° 48’ 26.31” east longitude which is bounded by the Municipality of Talakag on the north; by the Municipality of Pangantucan on the east and south; and by the Province of Lanao del Sur on the west. Further, the municipality of Kalilangan was selected as the focus of the study since Mines and Geosciences Bureau of Region 10 identified the location as susceptible to floods where there are several reports on flooding incidence in the area greatly influenced by Maradugao, Malatipay and Saguirayan River. Attested by the MDRRMO of Kalilangan, the root causes of flooding in some areas of Kalilangan are its basin-like geographical structure, non-sustainability on watershed management, denuded forest, land conversion, non-compliance of proper zoning, encroachment of easement and many others. The aforementioned causes of riverine flooding are triggered by continuous rain with high rainfall intensity and heavy rainfall at the neighboring municipality which drains to Kalilangan because of its low elevation profile which will then cause inundation of the area. Hence, the MDRRMO recognized Barangay Poblacion, West Poblacion, Ninoy Aquino, Kinura, Macaopao, and Pamotolon as susceptible to and heavily flooded areas which may be isolated during heavy rains. Fig. 1 shows the location of the study area.
Datasets preparationSeveral datasets and parameters were acquired
and prepared on the month of September 2017 to achieve realistic flood simulations and outputs, as well as, to satisfy the objective of the study. Remotely sensed data like Synthetic Aperture Radar (SAR)
4
Flood hazard zones
Digital Elevation Model (DEM) with a 10-m resolution is used to delineate sub-basin and extract model topographic parameters like slope and elevation while the 5-meter Interferometric SAR-DEM is primarily used for flood depth simulation as base topography. Other input datasets to be supplemented in flood modeling are digitized river networks from Google Earth™; Rainfall Intensity Duration Frequency (RIDF) obtained from Philippine Atmospheric, Geophysical and Astronomical Services Administration (PAGASA); and 2D hydraulic model using IFSAR derived digital terrain model (DTM) associated with the actual river geometry obtained from the bathymetric field survey; Manning’s surface roughness coefficient derived from generated land use land cover; and the simulated flow hydrographs. As such, river discharge and rainfall data from field survey and sensors were obtained, respectively by deploying a rain gauge, flow meter and depth gauge for basin model initial simulation and calibration.
Flood modelingIntegrating two computer models, this research
involves the use of Hydrologic Engineering Center-Hydrologic Modeling System (HEC-HMS) version 3.5 and HEC-River Analysis System (RAS) Beta version 5.0 for hydrologic and hydraulic modeling of Maradugao River, respectively. HEC HMS, created by US Army Corps of Engineers (2015), is a numerical modeling system designed to simulate watershed and channel behavior; precipitation-runoff processes of a watershed and/or river basin systems with an extensive variety of application in flood hydrology, and small urban or natural watershed runoff (USACE-HEC, 2010). On the other hand, a hydraulic simulation through two-dimensional (2D) hydrodynamic flow routing was performed within the interface of HEC-RAS in unsteady flow analysis (USACE, 2015). HEC-RAS is commonly used in mapping flood extent with the availability of inflow data (e.g., from hydrological simulations or actual flow measurements) to fill in the model’s boundary conditions (Hicks and Peacock, 2005).
Fig. 1: Geographic location of the study area in Kalilangan, Bukidnon of Philippines
Fig. 1: Geographic location of the study area in Kalilangan, Bukidnon of Philippines

5
Global J. Environ. Sci. Manage., 5(1): 1-16, Winter 2019
Hydrologic model development and calibrationDevelopment and generation of Maradugao
basin model is the initial step to flood modeling which involves the use of HEC- Geospatial HMS, a pre-processor of HEC-HMS software attached as an extension in ArcView GIS software. The watershed which is physically represented by a basin model was delineated using a 10-m SAR DEM and digitized river networks. It undergoes parameterization using the information derived from the land use land cover map that was generated from object-based image classification of Sentinel 2 images using support vector machine (SVM) algorithm. Additionally, selected model components in HEC-HMS were SCS for loss method, Clark UH for direct runoff, Recession for base flow and Muskingum-Cunge for channel routing method as shown in Table 1. Whilst, initial abstraction, curve number, storage coefficient, time of concentration, initial base flow, recession constant, and Manning’s N are considered as the calibration parameters. This parameters are well established, stable, widely accepted, used and recommended by various researchers dealing with flood modeling studies (Udhavrao (2014). The basin model was then exported to HEC-HMS version 3.5 for further model calibration and hydrologic simulations of a rainfall-runoff model. The created model was calibrated for the event-based simulation using one event of localized rainfall and discharge collected on October 8 to 10, 2017 recorded for a duration of 71.75 hours and 52 hours, respectively. Event-based simulation uses individual event with high precipitation causing peak discharges and water level rise on the basis of storm event (Duhan and Kumar, 2017) which was also employed in the studies of (Puno and Amper, 2016; Santillan et al., 2016; Udhavrao, 2014). The duration of the event may range from few hours to days which reveals the
response of a basin to an individual event (Udhavrao, 2014). The calibration process of the model involved adjusting or tuning the model parameters used in HEC-HMS such as Curve Number, Initial Abstraction, Time of Concentration, Storage Coefficient, and Recession Constant by evaluating the observed flow against the simulated flow produced by the model until the two closely fit each other which was used extensively in the field of flood modeling studies. The acceptability and accuracy of the model and the calibration procedure was evaluated and validated using various quantitative statistics such as Nash Sutcliffe Efficiency (NSE), Percent Bias (PBIAS), and the observation standard deviation ratio (RSR), an error index computed as the ratio of the root mean square error (RMSE) and standard deviation of measured data. These measures were calculated by comparing the measured and simulated hydrographs based on the comprehensive model evaluation guidelines developed by Moriasi et al., 2007 to facilitate systematic quantification of accuracy in hydrological simulations. NSE measures the certainty of the model indicating how well the plot of modeled discharge versus observed data matches the 1:1 line with an optimal value of 1 as the perfect match. RSR, on the other hand, is a standardization of RMSE which integrates the benefits of error index statistics and includes a scaling/normalization factor. Lower RSR designates lower RMSE which signifies better model simulation performance – a zero value means perfect model simulation. PBIAS gives an indication on the average tendency of the model results to be under- or overestimated compared to the observations with an ideal value of 0.0 (Moriasi et al., 2007). Consequently, the established rainfall-runoff model was used to simulate the flow for the five return periods, namely, 5-, 10-, 25-, 50-, and 100-year RIDFs.
Table 1: Input parameters for event‐based hydrological modeling
Model Parameter
Loss‐SCS Initial abstraction Curve number (CN)
Transform‐clark’s UH Storage coefficient Time of concentration
Base‐flow‐exponential recession Initial base flow/discharge Recession constant Ratio to peak
Routing‐Muskingum‐Cunge Manning’s N
Table 1: Input parameters for event-based hydrological modeling
6
M.B.T. Alivio et al.
Hydrodynamic modelingHEC-RAS was used in creating 2D hydrodynamic
model of Maradugao River with IFSAR DTM as the primary source of elevation data for the model simulations. However, the development of 2D model was preceded by the pre-processing procedure of geometric input data (2D flow area that defines the boundary of 2D computation, break lines and inflows) using HEC-Geospatial-RAS extension in ArcGIS interface and then, exported to RAS file format. Riverbed morphology gathered through a bathymetric survey using single beam echo sounder was integrated into DTM through bathymetric data burning to ensure that the 2D model can account for the effects of riverbed in flow simulation. The 2D flow modeling was accomplished by adding a 2D flow area representing the entire floodplain of the watershed; developing a 2D computational mesh and connecting the boundaries to the 2D areas in HEC-RAS environment. Hence, the 5 m spatial resolution IFSAR-derived DTM and the Manning’s roughness coefficients given to every land use land cover classes were the necessary data to set the model’s geometric information to anticipate or estimate flood depths and extents in Kalilangan, Bukidnon. Result of simulation is viewed under RAS Mapper, then exported and analyzed in ArcGIS environment and a spatially-distributed grid of maximum flood depths was created for each flood scenario.
Flood hazard validationTo evaluate the accuracy of the produced flood
hazard maps, the performance of the model was checked using the real flooding information obtained from the field through flood validation survey. Flood validation survey was carried out in predetermined points evenly scattered within the floodplain of the river whether they were flooded or not during typhoon Sendong (Washi) event in December 2011. The resulting flood map of historical events from numerical simulation was compared to the actual flooding information. Using the confusion matrix approach based on Ambiental (2013), the accuracy of the produced flood hazard map was assessed. Measure of fitness known as “F Measure” was also utilized to determine if the flooding extent generated in the map is the same as on the ground and it can be computed using Eq. 1 (Aronica et al., 2002; Horritt, 2006).
𝐹𝐹 = 𝐴𝐴
𝐴𝐴 + 𝐵𝐵 + 𝐶𝐶 (1)
Where; A is the number of points correctly anticipated as flooded by the model, B is the number of points anticipated as flooded while being not flooded in the real observation (over-prediction) and C is the flooded points not anticipated by the model (under-prediction). F is equivalent to 1 when observed and anticipated areas overlap exactly and equivalent to 0 when no overlap between observed and anticipated areas exists. Breilh, et al. (2013) subjectively assessed good fit measurements for F-values ≥ 0.7, intermediate fit measurements for 0.5 ≤ F-values < 0.7 and bad fit measurements for F-values < 0.5.
Flood hazard zoningA total of 5 scenarios were identified and
simulated during hydrologic and hydraulic modeling in this study. Flood inundation map shows areas which could be flooded complemented with flood extent and depth associated with flood hazard. In the current study, color coding of the three zones of flood hazard were set as yellow for low flood hazard (> 0.5 m flood depth), orange for moderate or medium flood hazard (0.5< flood depth <1.5 m), and red for high flood hazard (< 1.5 m flood depth). Flood layers were overlaid with exposure datasets to quantify the number of the affected building.
RESULTS AND DISCUSSION
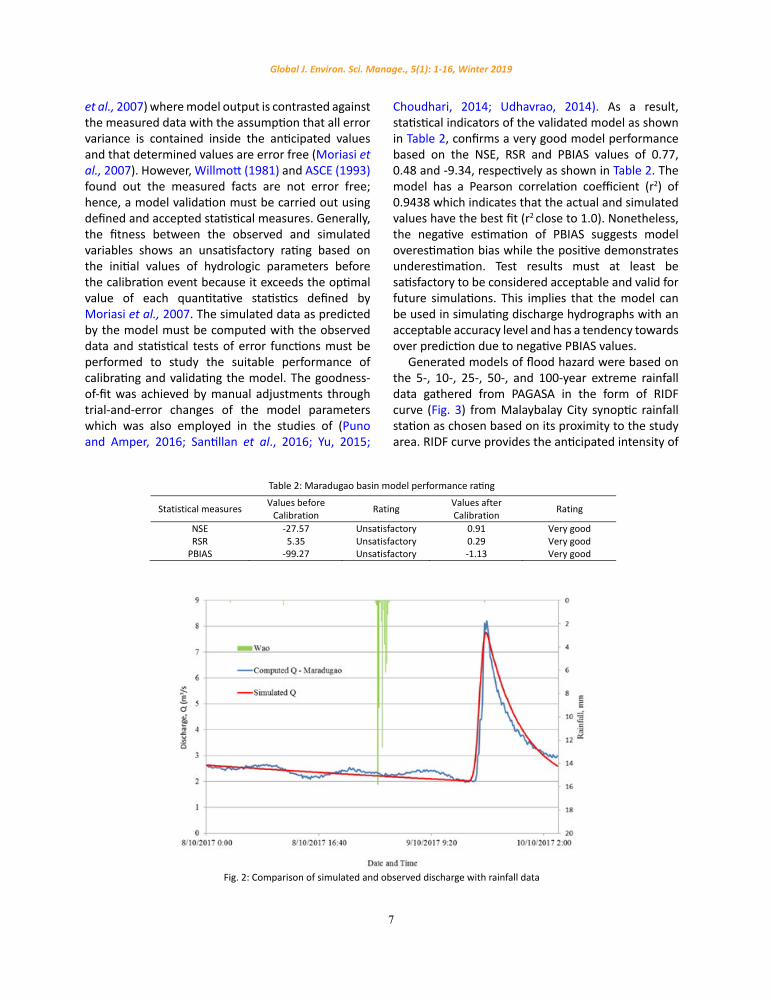
Calibrated hydrologic modelThe observed and calibrated hydrograph as
displayed in Fig. 2 shows a close fitness with each other having a simulated discharge of 7.771 m3/s and observed discharge of 8.199 m3/s. Rainfall peak of 15.8 mm was observed at 14:00 h (2:00 P.M.) of October 9, 2017 before the occurrence of observed peak discharge at 17:30 h (5:30 P.M.) of the same day. It can be inferred then that there is 3 h and 30 min. lag time before the highest discharge to arise. This delay in time between the maximum precipitation and peak river discharge gives time for the communities to prepare and evacuate their area to reduce possible damages and casualties it may incur.
In hydrologic modeling studies, reasonable adjustment and approval of the model is imperative to decrease the uncertainty in model simulations (Engel
7
Global J. Environ. Sci. Manage., 5(1): 1-16, Winter 2019
et al., 2007) where model output is contrasted against the measured data with the assumption that all error variance is contained inside the anticipated values and that determined values are error free (Moriasi et al., 2007). However, Willmott (1981) and ASCE (1993) found out the measured facts are not error free; hence, a model validation must be carried out using defined and accepted statistical measures. Generally, the fitness between the observed and simulated variables shows an unsatisfactory rating based on the initial values of hydrologic parameters before the calibration event because it exceeds the optimal value of each quantitative statistics defined by Moriasi et al., 2007. The simulated data as predicted by the model must be computed with the observed data and statistical tests of error functions must be performed to study the suitable performance of calibrating and validating the model. The goodness-of-fit was achieved by manual adjustments through trial-and-error changes of the model parameters which was also employed in the studies of (Puno and Amper, 2016; Santillan et al., 2016; Yu, 2015;
Choudhari, 2014; Udhavrao, 2014). As a result, statistical indicators of the validated model as shown in Table 2, confirms a very good model performance based on the NSE, RSR and PBIAS values of 0.77, 0.48 and -9.34, respectively as shown in Table 2. The model has a Pearson correlation coefficient (r2) of 0.9438 which indicates that the actual and simulated values have the best fit (r2 close to 1.0). Nonetheless, the negative estimation of PBIAS suggests model overestimation bias while the positive demonstrates underestimation. Test results must at least be satisfactory to be considered acceptable and valid for future simulations. This implies that the model can be used in simulating discharge hydrographs with an acceptable accuracy level and has a tendency towards over prediction due to negative PBIAS values.
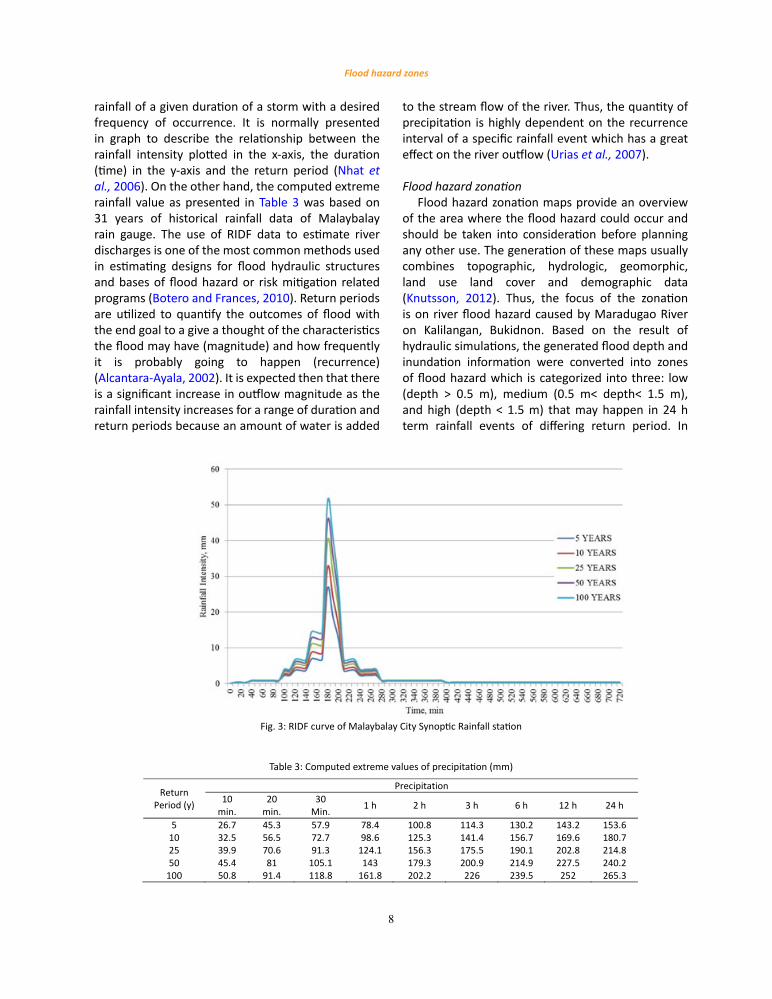
Generated models of flood hazard were based on the 5-, 10-, 25-, 50-, and 100-year extreme rainfall data gathered from PAGASA in the form of RIDF curve (Fig. 3) from Malaybalay City synoptic rainfall station as chosen based on its proximity to the study area. RIDF curve provides the anticipated intensity of
Fig. 2: Comparison of simulated and observed discharge with rainfall data
Fig. 2: Comparison of simulated and observed discharge with rainfall data
Table 2: Maradugao basin model performance rating
Statistical measures Values before Calibration Rating Values after
Calibration Rating
NSE ‐27.57 Unsatisfactory 0.91 Very good RSR 5.35 Unsatisfactory 0.29 Very good PBIAS ‐99.27 Unsatisfactory ‐1.13 Very good
Table 2: Maradugao basin model performance rating
8
Flood hazard zones
rainfall of a given duration of a storm with a desired frequency of occurrence. It is normally presented in graph to describe the relationship between the rainfall intensity plotted in the x-axis, the duration (time) in the y-axis and the return period (Nhat et al., 2006). On the other hand, the computed extreme rainfall value as presented in Table 3 was based on 31 years of historical rainfall data of Malaybalay rain gauge. The use of RIDF data to estimate river discharges is one of the most common methods used in estimating designs for flood hydraulic structures and bases of flood hazard or risk mitigation related programs (Botero and Frances, 2010). Return periods are utilized to quantify the outcomes of flood with the end goal to a give a thought of the characteristics the flood may have (magnitude) and how frequently it is probably going to happen (recurrence) (Alcantara-Ayala, 2002). It is expected then that there is a significant increase in outflow magnitude as the rainfall intensity increases for a range of duration and return periods because an amount of water is added
to the stream flow of the river. Thus, the quantity of precipitation is highly dependent on the recurrence interval of a specific rainfall event which has a great effect on the river outflow (Urias et al., 2007).
Flood hazard zonationFlood hazard zonation maps provide an overview
of the area where the flood hazard could occur and should be taken into consideration before planning any other use. The generation of these maps usually combines topographic, hydrologic, geomorphic, land use land cover and demographic data (Knutsson, 2012). Thus, the focus of the zonation is on river flood hazard caused by Maradugao River on Kalilangan, Bukidnon. Based on the result of hydraulic simulations, the generated flood depth and inundation information were converted into zones of flood hazard which is categorized into three: low (depth > 0.5 m), medium (0.5 m< depth< 1.5 m), and high (depth < 1.5 m) that may happen in 24 h term rainfall events of differing return period. In
Fig. 3: RIDF curve of Malaybalay City Synoptic Rainfall station
Fig. 3: RIDF curve of Malaybalay City Synoptic Rainfall station
Table 3: Computed extreme values of precipitation (mm)
Return Period (y)
Precipitation 10 min.
20 min.
30 Min. 1 h 2 h 3 h 6 h 12 h 24 h
5 26.7 45.3 57.9 78.4 100.8 114.3 130.2 143.2 153.6 10 32.5 56.5 72.7 98.6 125.3 141.4 156.7 169.6 180.7 25 39.9 70.6 91.3 124.1 156.3 175.5 190.1 202.8 214.8 50 45.4 81 105.1 143 179.3 200.9 214.9 227.5 240.2 100 50.8 91.4 118.8 161.8 202.2 226 239.5 252 265.3
Table 3: Computed extreme values of precipitation (mm)
9
Global J. Environ. Sci. Manage., 5(1): 1-16, Winter 2019
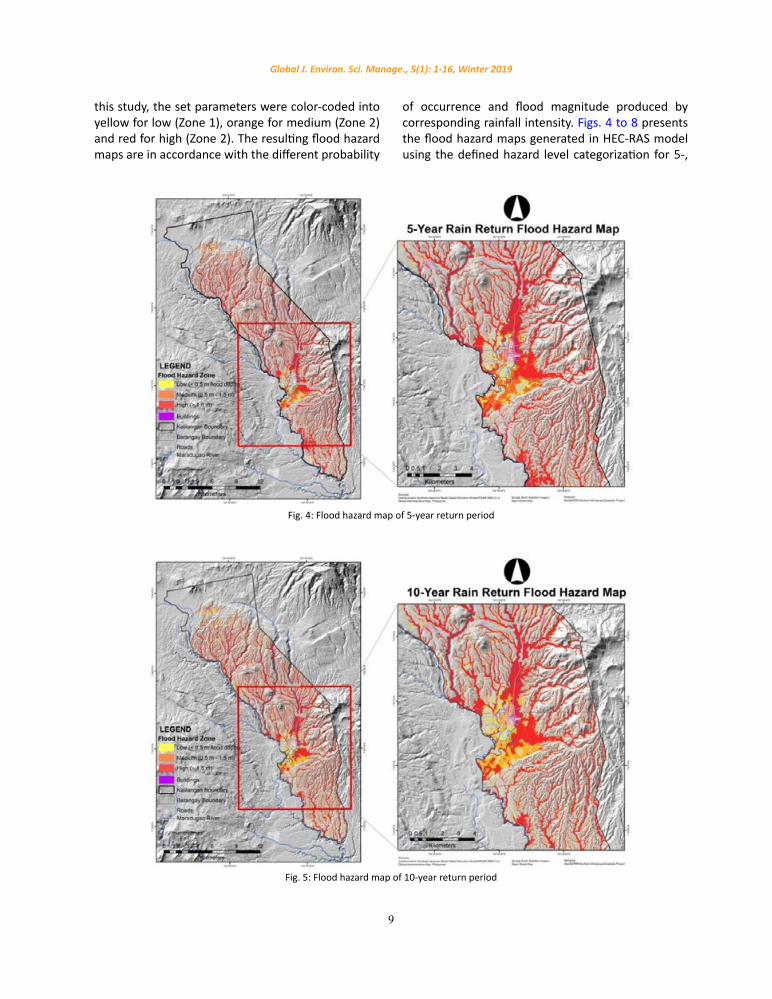
this study, the set parameters were color-coded into yellow for low (Zone 1), orange for medium (Zone 2) and red for high (Zone 2). The resulting flood hazard maps are in accordance with the different probability
of occurrence and flood magnitude produced by corresponding rainfall intensity. Figs. 4 to 8 presents the flood hazard maps generated in HEC-RAS model using the defined hazard level categorization for 5-,
Fig. 4: Flood hazard map of 5-year return period
Fig. 5: Flood hazard map of 10-year return period
Fig. 4: Flood hazard map of 5-year return period
Fig. 5: Flood hazard map of 10-year return period

10
M.B.T. Alivio et al.
10-, 25-, 50-, and 100-year flood events with 20%, 10%, 4%, 2%, and 1% probability of occurrence in a year, respectively, which clearly shows the area that is potentially inundated by flood instigated by
overflowing of Maradugao river and its tributary within the boundary of Kalilangan, Bukidnon. Flood map shows that at low recurrence period events, some areas are already susceptible to high hazard
Fig. 6: Flood hazard map of 25-year return period
Fig. 7: Flood hazard map of 50-year return period
Fig. 6: Flood hazard map of 25-year return period
Fig. 7: Flood hazard map of 50-year return period

11
Global J. Environ. Sci. Manage., 5(1): 1-16, Winter 2019
of flooding for a 5-year return period, among them are those residential building constructed in the floodplain of the river. In addition, it is depicted in Fig. 9 that in all flooding scenarios, areas within the zone of low hazard only constitutes 6% to 9% of the total inundation area which is evident in the map shown. Areas in low hazard zone are only apparent to Barangay Poblacion, West Poblacion, Pamotolon,
Kinura, Macaopao and some parts of Ninoy Aquino and Canituan which is also prominent to medium to high hazard zone attributed to its slope profile that is within 0% to 3% (expressed in percent rise), flat terrain and low lying profile. Slope within that range is categorized by the Bureau of Soil and Water Management as severe to flooding hazard. The flood hazard analysis carried out in the aforesaid barangays
Fig. 8: Flood hazard map of 100-year return period
Fig. 8: Flood hazard map of 100-year return period
Fig. 9: Flood inundation area of Kalilangan, Bukidnon in varying return periods
Fig. 9: Flood inundation area of Kalilangan, Bukidnon in varying return periods

12
Flood hazard zones
highlight the fact that the high flood hazard zone is influenced by Saguirayan and Malatipay River, a tributary river of Maradugao which traverses the said area making it a basin-like geographical structure and its watercourse is already disturbed due to extensive human activity. Zone 3 or high hazard level inundated 65% to 75% of Kalilangan relative to its return period which may cause disruption to the municipality. However, the zone of high hazard in other barangays is confined to the area along the watercourse with small streams or channel and does not affect the number of communities and buildings. Whilst, as the rainfall return periods increases, the areas previously within the zone of low hazard became susceptible to moderate to high level of flood hazard. Change of zone from low to high hazard level is observable in the increasing trend of the inundation area of the varying rainfall return periods as being shown in Fig. 9. A significant increase of flood extent and hazard level can be explained by the considerable increase in the rainfall intensity from 5 to 100-year return period. In parallel to the produced flood hazard maps, there was a high flood hazard threat to floodplain in relatively lowland compared to other location considering its slope and elevation profile. Thus, the escalation of flood event due to rain return scenarios leads to the increase of magnitude of the generated runoff which contributes to the enlargement of the flood inundated area and boosts flood hazard classes.
For the validation of flood hazard zonation map, its accuracy can be estimated using the validation outcomes of typhoon Sendong flood map generated by the same models. Accuracy of the produced flood hazard maps were evaluated using the confusion matrix approach as presented in Table 4 which consist of records of flooded and no flooded points predicted by model-generated flood hazard maps. In confusion (error) matrix, a number of correct and incorrect predictions will be determined by comparing two data sources (Cwik, 2017) which in this case are a
Table 4: Result of the flood map accuracy analysis in Maradugao River Basin for Typhoon Sendong (Washi) event
Actual Flooding Scenario
User's accuracy (%) Flooded Not flooded Total
Flood model simulated flooding
Flooded 63 15 78 80.77% Not Flooded 10 34 44 77.27%
Total 73 49 122 ‐ Producer's Accuracy (%) 86.30% 69.39% ‐ ‐ Overall Accuracy (%) 79.51% ‐ ‐ ‐
Table 4: Result of the flood map accuracy analysis in Maradugao River Basin for Typhoon Sendong (Washi) event
modeled flood from actual flood data. The result of the confusion matrix analysis of the model reveals that flood hazard areas could be mapped at an accuracy of 79.51% which gives us an assumption that what the models generate is approximately 79.51% accurate. Hence, this implies that the flood hazard zonation produced by the model has correctly predicted more than 75% of the actual-flooded points during the event of Typhoon Sendong. Measurement of fitness (F) was computed as 0.716 indicating that the flooding extent generated by the model in the map is a good fit, almost the same as on the ground.
The barangays recognized by MDRRMO of Kalilangan as susceptible to flooding correlates to the result of flood hazard zonation which has the highest population density of approximately 20,917 based on 2015 census residing along the indicated hazard zone. Hence, it is alarming knowing that most of the affected buildings are in the zone of high hazard which increases as per return period constituting 30% to 60% of the total number of affected buildings as illustrated in Fig. 10. As such, 90% of that affected buildings were residential type of built-up structures with known number of families and properties which may bring psychological and health impact to the affected person, dreadful condition and even worst, loss of life. Attested by the MDRRMO, a total of 1196 households are affected by floods or at risk of flooding from the above-mentioned barangays. Additionally, according to the records of MDRRMO on flood historical events that incurred damages, the extent of damage to houses, roads, and bridges were from partially to totally damage costing hundreds of thousand pesos. The floods also inflict damages on agriculture (crops), livestock, poultry and fisheries in the aforementioned barangays. They stressed out that no casualties were encountered so far in those areas but the possibility of damages to houses, structures, and yields along agrarian regions may result to a financial disability of the occupants, ranchers and

13
Global J. Environ. Sci. Manage., 5(1): 1-16, Winter 2019
their families as well as the municipality.The MDRRMO of Kalilangan affirmed that flooding
was worsened by inadequate and mushrooming of informal settlers in the floodplain of the river, land conversion, non-compliance to proper land use zoning, silted drainage system, clogged waterways, improper waste disposal and denuded forest. The increasing trend of exposed built-up structures to flooding is associated by enlargement of the area of river flood hazard due to the increase of rainfall event magnitude. The decrease and increase of the aforementioned level or classes can be observed by an increase of rainfall event magnitude from 5 to 100 year return period. This is in congruent to the result of flood inundation area in Kalilangan in various return periods as presented in Fig. 9 denoting a direct relationship with each other.
CONCLUSION
The integrated approach of hydrodynamic modeling and remote sensing with the aid of GIS techniques provides a potential and efficient way to increase the capability to model, predict and manage flood events for a reliable flood hazard zonation. Thus, harnessing this potential approach offers cost-effective way of flood hazard zone mapping in Kalilangan, Bukidnon to an acceptable accuracy level as regulated to restrict damages and casualties it may incur. The result shows that the generated flood hazard zonation is more influenced by flood
depth and inundation area that shows hazard level and its corresponding extent. The proliferation in the magnitude of rainfall event (return period) from 5- to 100-year leads to an increase of river discharge, thus significantly intensify flood inundation area and hazard level. The identified barangays of Poblacion, West Poblacion, Pamotolon, Kinura, Macaopao and some parts of Ninoy Aquino and Canituan falls into the zone of low to high hazard of flooding of which greater area of medium to high hazard zone constitutes the total inundation area of the aforesaid barangays. Residential buildings which can be linked to household and community were the most flooded-type and exposed built-up structures in all flooding scenarios and the majority falls into the zone of high hazard. Identification of flood hazard zones gives awareness to the community and Local Government Units of Kalilangan, Bukidnon in understanding flood characteristics coupled with disaster preparedness. Flood hazard zonation plays a significant role in updating the comprehensive land use plan of the municipality of Kalilangan, Bukidnon, to serve as a guideline for any development and construction of infrastructures of the areas within the hazard zones which should be viewed with special attention and utmost importance. Hence, combined non-structural and structural flood preventing strategies should be adopted in the identified barangays where high hazard level is prominent, with high population density and development exists. This could be an underlying advance for action and strategic planning
Fig. 10: Number of exposed building per return periods
Fig. 10: Number of exposed building per return periods

14
M.B.T. Alivio et al.
for disaster preparedness, reduction and prevention via incorporating the flood overlay zones on the land use plan, establishing necessary procedures as to operational communication and disaster response and public information and warning (Mohammed, 2018). Thus, harnessing this potential approach could set the evacuation routes and safe sites during flooding condition for flood control, disaster reduction and prevention considering that there is an appropriate actions administered towards its realization.
ACKNOWLEDGEMENTSThis paper is an output of the research work
conducted by Central Mindanao University under the Geo-Informatics for the Systematic Assessment of Flood Effects and Risks (GeoSAFER) for a Resilient Mindanao funded by Department of Science and Technology (DOST) thru its Philippine Council for Industry, Energy, and Emerging Technology Research and Development (PCIEERD).
CONFLICT OF INTEREST
The authors declare that there are no conflicts of interest regarding the publication of this manuscript. In addition, the ethical issues; including plagiarism, informed consent, misconduct, data fabrication and/or falsification, double publication and/or submission, redundancy have been completely observed by the authors.
ABBREVIATIONS
2D Two-dimensionalDEM Digital elevation modelDTM Digital terrain modelF measure Measurement of fitnessGIS Geographic information systemh hourha Hectare
HEC-GeoHMSHydrologic engineering cen-ter-Geospatial hydrologic model-ing system
HEC-HMS Hydrologic engineering center-Hydrologic modeling system
HEC-GeoRAS Hydrologic engineering center-Geospatial river analysis system
HEC-RAS Hydrologic engineering cen-ter-River analysis system
IFSAR Interferometric synthetic aperture radar
m meter
MDRRMO Municipal Disaster Risk Reduction and Management Office
Min. minutemm millimeterm3/s Cubic meter per second
NDRRMC National Disaster Risk Reduction and Management Council
NSE Nash-Sutcliffe Efficiency
PAGASAPhilippine Atmospheric, Geophysical and Astronomical Services Administration
PBIAS Percent biasP.M. Post meridiemRAS River analysis system
RIDF Rainfall intensity duration frequency
RMSE Root mean square errorRS Remote sensing
RSR Ratio of the root mean square error to the standard deviation
SAR Synthetic Aperture RadarSCS Soil conservation serviceSVM Support vector machineUH Unit hydrographUSACE US Army Corps of Engineersy year
REFERENCESAcosta, L.A.; Eugenio, E.A.; Macandog, P.B.M.; Magcale-Macandog,
D.B.; Lin, E.K.L., (2016). Loss and damage from typhoon-induced floods and landslides in the Philippines: community perceptions on climate impacts and adaptation options. Int. J. Global Warming. 9(1) (33 pages).
Alcantara-Ayala, I., (2002). Geomorphology, natural hazards, vulnerability and prevention of natural disasters in developing countries. Geomorphol., 47(2-4): 107-124 (18 pages).
Ambiental, (2013). Final Brisbane validation: 2011 Brisbane flood model validation. The Sussex Innovation Centre, Science Park Square, Brighton, BN1 9SB, UK (2 pages).
Aronica, G.; Bates, P.D.; Horritt, M.S., (2002). Assessing the uncertainty in distributed model predictions using observed binary pattern information within GLUE. Hydrol. Processes, 16(10): 2001–2016 (16 pages).
ASCE, (1993). Criteria for evaluation of watershed models. J. Irrig. Drain. Eng. 119(3): 429-442 (14 pages).
Botero, B.A.; Frances, F., (2010). Estimation of high return period

15
Global J. Environ. Sci. Manage., 5(1): 1-16, Winter 2019
flood quantiles using additional non-systematic information with upper bounded statistical models. Hydrol. Earth Syst. Sci., 14(12): 2617–2628 (12 pages).
Breilh, J.F.; Chaumillon, E.; Bertin, X.; Gravelle, M., (2013). Assessment of static flood modeling techniques: application to contrasting marshes flooded during xynthia (Western France). Nat. Hazards Earth Syst. Sci., 13(6): 1595–1612 (17 pages).
Brunner, G.W., (2016). HEC-RAS river analysis system - user’s manual version 5.0. US Army Corps of Engineers. Institute for Water Resources, Hydrologic Engineering Centre (HEC). (538 pages).
Chatterjee M.; De R.; Roy D.; Das S.; Mazumdar A., (2014). Hydrological modeling studies with HEC-HMS for Damodar basin, India. IDOSI Publications. World Appl. Sci. J., 31: 2148-2154 (7 pages).
Choudhari, K, Panigrahi, B, Paul, J.C., (2014). Simulation of the precipitation-runoff process using HEC-HMS model for Balijore Nala watershed, Odisha, India. International Journal of Geomatics Geosciences 5(2): 253-265 (13 pages).
Comes, M.; Dubbert, M.; Garschage, M.; Hagenlocher, M.; Sabelfeld; Lee, Y.J.; Grunewald; L.; Lanzendorfer, M.; Mucke, P.; Neuschafer, O.; Pott, S.; Post, J.; Schramm, S.; Scumann-Bolsche, D.; Vandemeulebroecke, B.; Welle, T.; Birkmann, J. (2016).World risk report 2016. Bündnis Entwicklung Hilft (Alliance Development Works) and United Nations University–Institute for Environment and Human Security (UNU-EHS), (74 pages).
Cwik, K., (2017). Flood mapping with the sentinel-1 time-series data in arid areas. Master Thesis, Department of Civil, Geo and Environmental Engineering, Technical University of Munich. 1-94 (94 pages).
DHI, (2003). MIKE 11-a modelling system for rivers and channels - User guide. DHI (430 pages).
DHI, (2012). MIKE 21-2D modelling of coast and sea. DHI Water and Environment Pty Ltd.
Duhan, S.; Kumar, M., (2017). Event and continuous hydrological modeling with HEC-HMS: a review study. Int. J. Eng. Technol. Sci. Res., 4(4): 1-6 (6 pages).
Engel B.; Storm, D.; White, D.; Arnold, J. G., (2007). A hydrologic/water quality model application protocol. J. Am. Water Resour. Assoc. (in press), 43(5): 1223-1236 (13 pages).
Gordon, R., (2004). The social system as a site of disaster impact and resource for recovery. Aust. J. Emerg. Manage. 19: 16-22 (7 pages).
Hicks, F.E.; Peacock, T., (2005). Suitability of HEC-RAS for flood forecasting. Can. Water Resour. J., 30(2): 159–174 (16 pages).
Horritt, M.S., (2006). A methodology for the validation of uncertain flood inundation models. Journal of Hydrol., 326(1-4): 153–165 (13 pages).
Jha, S.; Martinez, A.; Quising, P.; Ardaniel, Z.; Wang, L., (2018). Natural disasters, public spending, and creative destruction: a case study of the Philippines. ADBI Working Paper 817. Tokyo: Asian Development Bank Institute (30 pages).
Kale, V.S.; Ely, L.L.; Enzel, Y.; Baker, V.R., (1994). Geomorphic and hydrologic aspects of monsoon floods on the Narmada and Tapi rivers in Central India. Geomorphol., 10(1-4): 157–168 (12 pages).
Khanna, R. K., Agrawal, C. K., Kumar, P., (2018). Remote sensing and GIS applications in flood management. Central Water Commission New Delhi, India.
Knutsson, P., (2012). SECOA: Flood hazard zoning maps by solutions for environmental contrast in coastal areas. UNIPUNE, India (Vishwas Kale). School of Global Studies, Human Ecology, University of Gothenburg (146 pages).
Konadu, D.D.; Fosu, C., (2009). Digital elevation models and GIS for watershed modelling and flood prediction – a case study of Accra Ghana. Appropriate Technologies for Environmental Protection in the Developing World, 325–332 (8 pages).
Liu, Y.; Zhang, W.; & Cui, X., (2012). Flood emergency management using hydrodynamic modelling. Procedia Engineering, 28: 750–753 (4 pages).
Mohammed, M.P., (2018). Flood hazard zoning of Tarlac city: towards the development of flood overlay zones and provision. 7th International conference on building resilience; using scientific knowledge to inform policy and practice in disaster risk reduction, ICBR2017, Vol. 212. November 2017, Bangkok, Thailand: 69–76 (8 pages).
Moriasi, D.N.; Arnold, J.G.; Van Liew, M.W.; Bingner, R.L.; Harmel, R.D.; Veith, T.L., (2007). Model evaluation guidelines for systematic quantification of accuracy in watershed simulation. Am. Soc. Agric. Biol. Eng., 50(3): 885−900 (16 pages).
Moulinec, C.; Denis, C.; Pham, C.T.; Rouge, D.; Hervouet, J.M., (2011). TELEMAC: An efficient hydrodynamics suite for massively parallel architectures. Comput. Fluids., 51(1): 30-34 (5 pages).
NDRRMC Update, (2017). Incident monitored covering the period of 080800h–081700h September 2017 – Report on flashflood incident in Kalilangan, Bukidnon (Region X).
Neussner, O.; Obermaier, I.; Sanchez, A., (2012). Application of a digital elevation model for flood modelling for the Pagsangaan river in Leyte. 1st Philippines Geomatics Symposium Philippine Geomatics: Practice, Applications and Accomplishments, University of Philippines Diliman, Quezon City, Philippines.
Ng, Z.F.; Gisen, J.I.; Akbarj, A., (2017). Flood inundation modelling in the Kuantan river basin using 1d-2d flood modeller coupled with aster-gdem. IOP Conf. Ser. Mater. Sci. Eng. IOP Publishing, 318.
Nhat, L.M.; Tachikawa, Y.; Takara, K., (2006). Establishment of intensity-duration-frequency curves for precipitation in the monsoon area of Vietnam. Annu. Disaster Prev. Res. Inst., Kyoto University, No. 49 (11 pages).
Puno G.R.; Amper, R.A.L., (2016). Flood modeling of Musimusi River in Balingasag, Misamis Oriental. Central Mindanao Univ. J. Sci. 20(3): 150-165 (16 pages).
Prakash, M.; Rothauge, K.; Cleary, P.W., (2014). Modelling the impact of dam failure scenarios on flood inundation using SPH. Appl. Math. Model., 38(23): 5515-5534 (20 pages).
Schumann, G. (2015). Preface: Remote sensing in flood monitoring and management. Remote Sens., 7(12): 17013–17015 (3 pages).
Santillan, J.R.; Marqueso, J.T.; Makinano-Santillan, M.; Serviano, J.L., (2016). Beyond flood hazard maps: detailed flood characterization with remote sensing, GIS and 2d modelling. In: The International Archives of the Photogrammetry, Remote Sensing and Spatial Information Science, XLII-4/W1, 225-235 (11 pages).
Suarez, J.K.B.; Santiago, J.T.; Muldong, T.M.M.; Lagmay, A.M.A.; Caro, C.V.; Ramos, M., (2014). Comparison of high resolution topographic data sources (Sar, Ifsar, and Lidar) for storm surge hazard maps. American Geophysical Union, Fall Meeting.
Tahmasbinejad, H.; Feyzolahpour, M.; Mumipour, M.; Zakerhoseini,

16
M.B.T. Alivio et al.
F. (2012). Rainfall-runoff simulation and modeling of Karun River using HEC-RAS and HEC-HMS models, Izeh district, Iran. J. Appl. Sci., 12: 1900-1908 (9 pages).
Teng, J.; Jakeman, A. J.; Vaze, J.; Croke, B. F. W.; Dutta, D.; Kim, S., (2017). Flood inundation modelling: a review of methods, recent advances and uncertainty analysis. Environ. Model. Softw., 90: 201 -216 (16 pages).
Tennakoon, K.B.M., (2004). Parameterisation of 2d hydrodynamic models and flood hazard mapping for Naga city, Philippines. Ph.D. Dissertation, International Institute for Geo-Information Science and Earth Observation Enschede, Netherlands.
Udhavrao, J.P., (2014). EVENT based rainfall-runoff simulation using HEC-HMS model. Dissertation, Master of Technology in Soil and Water Conservation Engineering, College of Agricultural Engineering and Technology Dr. Balasaheb Sawant Konkan Krishi Vidyapeeth Dapoli- 415 712, Dist. Ratnagiri, Maharashtra State (India) (92 pages).
Urias, H.Q.; Garcia, H.; Mendoza, J.S.P., (2007). Determination of relationship between precipitation and return periods to assess flood risks in the city of Juarez, Mexico. University Council on Water Resources (UCOWR) Conference Proceedings, Southern Illinois University Carbondale (10 pages).
US Army Corps of Engineers, (2015). HEC-RAS river analysis system. 2d modeling user’s manual. Version 5.0 April 2015 by Gary W. Brunner, CEIWR-HEC. US Army Corps of Engineers Institute for Water Resources Hydrologic Engineering Center (HEC) Davis, California.
USACE-HEC, (2010). Hydrologic modelling system HEC-HMS user’s manual version 3.5, Hydrologic Engineering Center, United States Corps of Engineer, Davis, California, USA.
Vacondio, R.; Rogers, B., Stansby, P., Mignosa, P., (2011). SPH modeling of shallow flow with open boundaries for practical flood simulation. J. Hydrol. Eng., 138 (6): 530-541 (12 pages).
Willmott, C.J., (1981). On the validation of models. Phys. Geogr., 2: 184-194 (11 pages).
Yap, D.J., (2011). Floods destroy over P400M worth of crops, land in Mindanao—NDRRMC.
Yu, Z., (2015). Hydrology, floods and droughts modeling and prediction. Encyclopedia of Atmospheric Sciences, 217–223 (6 pages).
Zope, P.E.; Eldho, T.I.; Jothiprakash, V., (2015). Impacts of urbanization on flooding of a coastal urban catchment: a case study of Mumbai City, India. Natural Hazards 75(1): 887-908 (21 pages).
AUTHOR (S) BIOSKETCHES
Alivio, M.B.T., B.Sc., Research Associate, Geo-SAFER Project, College of Forestry and Environmental Science, Central Mindanao University, Musuan, Bukidnon, Philippines. Email: [email protected]
Puno, G.R., Ph.D., Associate Professor and Project Leader, Geo-SAFER Project, College of Forestry and Environmental Science, Central Mindanao University, Musuan, Bukidnon, Philippines. Email: [email protected]
Talisay, B.A.M., B.Sc., Research Associate, Geo-SAFER Project, College of Forestry and Environmental Science, Central Mindanao University, Musuan, Bukidnon, Philippines. Email: [email protected]
HOW TO CITE THIS ARTICLE
Alivio, M.B.T.; Puno, G.R.; Talisay, B.A.M., (2019). Flood hazard zones using 2d hydrodynamic modeling and remote sensing approaches. Global J. Environ. Sci. Manage., 5(1): 1-16.
DOI: 10.22034/gjesm.2019.01.01
url: https://www.gjesm.net/article_32992.html
COPYRIGHTS
Copyright for this article is retained by the author(s), with publication rights granted to the GJESM Journal.This is an open-access article distributed under the terms and conditions of the Creative Commons AttributionLicense (http://creativecommons.org/licenses/by/4.0/).


![Energyeciencytrade -osinsmalltolarge electricvehicles · 2020. 5. 29. · Weisset al. Environ Sci Eur Page2of17 Tractionbatteriesstilloera50–100timeslowerenergy densitythangasoline[15]andrequiremorespacethan](https://img.pdfslide.net/doc/110x75/611c26b82a693235690a339d/energyeciencytrade-osinsmalltolarge-electricvehicles-2020-5-29-weisset-al.jpg)