Embed Size (px)
Citation preview

FIRST QUARTER 2015

Contents
Introduction 1
United States 4
Eurozone 11
Japan 13
China 15
Emerging Markets 19
Not FDIC Insured | May Lose Value | No Bank Guarantee

Global Macro Shifts: Global Growth: Headwinds or Tailwinds?
Calvin Ho, Ph.D.Vice President, Senior Global Macro & Research Analyst Templeton Global Macro Group
1
IntroductionExcessive pessimism characterizes the current view on the global growth outlook. Many observers see the lowering of global growth
forecasts by the World Bank and the International Monetary Fund (IMF) as confirming a loss of global economic momentum. Some of
this pessimism also reflects a mistaken interpretation of the reasons behind the recent sharp decline in oil prices, and of its likely
consequences. Many analysts and commentators have argued that the plunge in oil prices reflects the slowing down of the global
economy, and some believe that the decline in oil prices itself will have a negative impact on global growth, by reducing energy
investment and causing deflation in some regions. As for key economic areas, while most observers are more upbeat on the US, many
observers seem to expect a major slowdown in China and to view the eurozone as being on the brink of recession.
This paper aims to provide an objective analysis of the main trends that will shape the global economy and to counter this exaggerated
pessimism prevailing in the marketplace.
Even the latest IMF forecasts, which have generated so many pessimistic headlines, show the global economy accelerating, not
decelerating. The IMF argues that the weakening of global oil demand owes in part to a loss of momentum concentrated in emerging
markets, which have a higher energy intensity than advanced economies. But the slowdown in emerging markets overall has been
marginal, and, most importantly, China’s oil demand continued to rise through the end of 2014.
Michael Hasenstab, Ph.D.Executive Vice President, Portfolio Manager, Chief Investment OfficerTempleton Global Macro Group
Sonal Desai, Ph.D.Senior Vice President, Portfolio Manager, Director of ResearchTempleton Global Macro Group
Hyung C. Shin, Ph.D.Vice President, Senior Global Macro & Research AnalystTempleton Global Macro Group
Kang Tan, Ph.D.Senior Global Macro & Research AnalystTempleton Global Macro Group
Diego Valderrama, Ph.D.Senior Global Macro & Research AnalystTempleton Global Macro Group
Attila Korpos, Ph.D.Research AnalystTempleton Global Macro Group
Global Macro Shifts
Global Macro Shifts is a quarterly research-based briefing
on global economies featuring the analysis and views of Dr.
Michael Hasenstab and senior members of the Templeton
Global Macro Group. Dr. Hasenstab and his team manage
Templeton’s global bond strategies, including unconstrained
fixed income, currency and global macro. This economic
team, trained in some of the leading universities in the world,
integrates global macroeconomic analysis with in-depth
country research to help identify long-term imbalances that
translate to investment opportunities.
GLOBAL GROWTH: HEADWINDS OR TAILWINDS?

Global Macro Shifts: Global Growth: Headwinds or Tailwinds? 2
With the global economy getting stronger, albeit at a moderate
pace, demand factors are unlikely to be the predominate drivers
behind the fall in the price of oil. Rather, three major supply
adjustments appear to explain the vast majority of this decline.
First, markets seem to have underestimated the boost in US oil
supply triggered by advances in shale oil extraction, as seen in
Chart 1. Second, expected reductions in supply in Libya and Iraq
due to political instability failed to materialize. Finally and most
importantly, the decision by OPEC (Organization of the Petroleum
Exporting Countries) last November to maintain current
production levels blindsided market participants. Most expected a
reduction to support prices at about US$80 per barrel. Saudi
Arabia instead drove the decision to maintain production
unchanged, probably with the aim of gaining market share against
higher cost producers, to discourage investment in US shale
fields, and for regional political reasons.
A positive supply shock that drives down the price of oil provides
a significant boost to global growth. It acts as a substantial global
tax cut for consumers; it redistributes income from oil exporters to
oil importers, the latter of which tend to have a higher propensity
to spend; over time, it boosts investment rates in non-energy
sectors as capital reallocates from energy-producing industries to
energy-consuming industries; and in several countries it creates
room to keep interest rates lower than they would otherwise be. It
takes a bit of time for these effects to feed through the system,
and we therefore think the positive impact on growth should
become more evident in one or two quarters. This delay may also
have contributed to the pessimism about the growth outlook we
mentioned above.
There will be winners and losers, and we will discuss some of
them in more detail below. Oil exporters will suffer, and those that
are already in a precarious position—like Venezuela and
US Surpassed Saudi Arabia as World's Largest Oil ProducerChart 1: US vs. Saudi Arabia Total Oil SupplyJanuary 2000–September 2014
Source: US Energy Information Administration (Sept. 2014).
Russia—will likely suffer most. Some oil producers are less
vulnerable than markets seem to believe. Malaysia and also
Mexico are two such examples, where for the latter we expect the
positive spillover of faster US growth to be far more important
than the decline in oil prices. And as Malaysia now imports more
oil than it exports, the impact should be quite manageable.
The US economy benefits significantly from lower oil prices. While
cutbacks in energy-related investment are short-term headwinds
to growth, the benefits to industries that consume oil and to the
US consumer through lower gasoline prices should turn to a net
growth positive over the course of 2015. Investment and
employment in the energy sector play a much smaller role in the
economy than overall personal consumption, which accounts for
about 70% of gross domestic product (GDP). We estimate that,
on net, lower oil prices should add about 0.7 percentage points to
US growth on an annual basis.
0
5
10
15
2000 2002 2004 2006 2008 2010 2012 2014
Saudi Arabia United States
Barrels per Day (Millions)
This benefit should further bolster a recovery that has already
become well entrenched. The improvement in the labor market
has outpaced the Federal Reserve’s (Fed’s) expectations, and the
degree of slack has been significantly reduced. We believe this
sets the conditions for the Fed to begin the normalization of
interest rates this year.
China, as the world’s largest importer of oil, will also be an
important beneficiary of lower energy prices. This should help
further mitigate the current mild and healthy slowdown, so that we
expect 2015 growth of about 7%, only marginally slower than last
year. Importantly, the quality of investment has improved, albeit at
a slower rate. This combined with a growing level of consumption
as a contribution to growth puts China on a path toward the long
sought after rebalancing. We would also observe that as China’s
economy has grown substantially over the past decade, even at a
more moderate growth rate its total

Global Macro Shifts: Global Growth: Headwinds or Tailwinds? 3
Importantly, the decline in oil prices will help subdue inflation in
the short term. While clearly the impact of oil on inflation will only
last temporarily, stronger growth this year without inflation puts the
world economy in a sweet spot for 2015. Risks to higher inflation
and lower growth beyond 2015 remain and are a topic we will
discuss in future pieces.
Uncertainty and risks remain important, and we are not arguing for
a return to the booming (overheated) global economy we
experienced prior to the global financial crisis. But this overall
growth should be sufficiently supportive to allow countries with
sound policies to thrive. We will likely see great differentiation in
cross-country performances, making fundamentals-based
investment strategies critical. Looking further ahead, central banks
will have to unwind the enormous interventions of these last few
years—and this will set the stage for possible sudden and sharp
market adjustments that should be factored into medium-term
investment views. This too will be a topic for future pieces.
contribution to global growth will remain larger than that of the
US. If China grows at 7% in 2015, the quantum of demand it
produces for world GDP will also be larger than in the prior year.
The market particularly exaggerates near-term growth pessimism
for the eurozone. The region’s growth in 2014 was higher than in
2013, and we expect this year to be higher still. The eurozone this
year should benefit from three important tailwinds: Quantitative
easing by the European Central Bank (ECB) will likely weaken the
euro even further, which together with stronger growth in the US
and the global economy overall will bolster export growth. This
has an important impact on growth, given that exports drive a
significant component of overall eurozone growth. Lower oil
prices will give a further stimulus to consumption and investment,
though not to the same degree as in the US. However, over the
longer term, these short-term tailwinds will be challenged by the
eurozone’s structural weaknesses ranging from a lack of broad-
based product and labor market reform to a lack of greater fiscal
and political integration.
The decline in oil prices will have other winners and losers across
the world economy, and further accentuate the differentiation
between strong and poor performers, notably in the emerging
markets universe. Countries like India and Indonesia are taking
advantage of the lower oil prices to reduce fuel subsidies and
thereby improve public finances. Russia and Venezuela suffer
from their undifferentiated growth base. And lower commodity
prices are testing the ability of some African countries to
strengthen policies and institutions. This variegated environment
should provide attractive opportunities for a fundamentals-driven
investment strategy.
Bottom line: We see the global growth outlook as significantly
healthier than is widely believed. In fact, in 2015 the global
economy will benefit from the confluence of some important
supportive factors:
• the decline in oil prices should give a much-welcomed lift to
global growth;
• monetary easing in Japan and the eurozone will maintain
ample global liquidity even as the Fed begins to normalize its
policy stance;
• ECB quantitative easing should also alleviate financial market
tensions even as the euro area works through difficult policy
issues;
• the euro area should get some precious help from liquidity, a
weaker exchange rate and stronger exports;
• the health of the US economy, in particular the labor market,
should continue to improve; and
• China remains on track for a healthy slowdown in its growth
rate while still contributing a greater quantum of demand in
2015 than in 2014.

Global Macro Shifts: Global Growth: Headwinds or Tailwinds? 4
Average Monthly Gains in Nonfarm Payrolls Accelerated over 2014Chart 2: Change in Nonfarm PayrollsJanuary 2008–January 2015
United States
We believe the US recovery is robust, indeed quite strong by most
metrics. Quarterly economic growth reached a 5.0% annualized
rate in the third quarter and accelerated to 2.4% in 2014 in the
year as a whole from 2.2% in 2013. The IMF has recently revised
its 2015 forecast for full-year US GDP up to 3.6%, largely on the
back of the positive impact of lower oil prices.1 The economic
recovery is broad-based: Household consumption has proved
resilient for some time, and business investment is now also
picking up.
The majority of labor market indicators suggest steadily improving
labor market conditions. The unemployment rate decreased to
5.7% in January from 6.7% at the end of 2013, while the
participation rate has remained steady. Chart 2 illustrates the
strengthening employment growth. It accelerated from 239,000 in
the first half of 2014 to 281,000 in the second half of 2014. During
the three-month period ended in January 2015, employment
growth averaged 336,000. Stronger employment creation has
played an extremely important role in supporting private
consumption.
There has been a lot of focus on the relatively anemic rise in
hourly wage growth, and the fact that the participation rate has not
yet returned to its pre-crisis levels. The dynamics of average
incomes are of course important, as are income distribution
issues. But the growth in the total wage bill matters most for
aggregate consumption—and this has gone relatively unnoticed.
Aggregate private payrolls have increased at a rapid pace due to
the growing labor force (see Chart 3). While nominal average
hourly earnings (AHE) are flat, aggregate private nonfarm payroll
income accelerated to 5.6% year-over-year (y/y) in January from
3.4% at the end of 2013. This is a substantial increase in the
overall disposable income that is the relevant driver of aggregate
demand in the economy. Aggregate nonfarm payroll income now
stands higher than it did before the global financial crisis.
-1,000
-800
-600
-400
-200
0
200
400
600
800
1/08 1/09 1/10 1/11 1/12 1/13 1/14 1/15
Thousands
Nonfarm Payroll Change
Source: US Department of Labor.
Aggregate Private Labor Income Growing Much Faster than Average Hourly WagesChart 3: Aggregate Private Payroll vs. Average Hourly EarningsJanuary 2011–January 2015
0%
1%
2%
3%
4%
5%
6%
1/11 1/12 1/13 1/14 1/15
Y/Y
Average Hourly Earnings Aggregate Weekly Payrolls
Source: US Department of Labor.

Global Macro Shifts: Global Growth: Headwinds or Tailwinds?
0%
2%
4%
6%
8%
10%
12%
14%
16%
1977 1984 1992 1999 2007 2014
Average Rate
5
Using a broader concept of revenues (including not only labor
compensation but also other sources like rents and government
transfers) also shows a growing household income (Chart 4).
Personal Income Growth Accelerated in 2014Chart 4: Nominal Personal IncomeJanuary 2000–December 2014
Source: US Department of Commerce.
$5
$7
$9
$11
$13
$15
$17
2000 2002 2004 2006 2008 2010 2012 2014
Personal Income Disposable Personal Income
USD (Trillions)
Real Personal Disposable Income Now Above Pre-Crisis LevelChart 5: Real Personal IncomeJanuary 2000–December 2014
Source: US Department of Commerce.
Household Financial Liabilities Continue to Decline Relative to Disposable Income Driven Largely by Reductions in Mortgage DebtChart 6: Household LiabilitiesMarch 1977–September 2014
Source: Federal Reserve, US Department of Labor.
Average Mortgage Interest Rates Remain Close to Historical LowsChart 7: Mortgage Interest Payments/Mortgages OutstandingMarch 1977–September 2014
Source: Federal Reserve.
Household spending is supported not only by rising labor income
(Chart 5), but also by better prospects of economic growth and
healthier balance sheets. Consumer confidence stands at or close
to its multi-year highs. Households continue to repair their balance
sheets, and net worth has accelerated rapidly. Mortgage interest
rate payments remain very low (Charts 6 and 7).
$5
$6
$7
$8
$9
$10
$11
$12
$13
2000 2002 2004 2006 2008 2010 2012 2014
Real Disposable Income Real Personal Income Less Transfers
Real USD (Trillions)
0%
20%
40%
60%
80%
100%
120%
140%
160%
1977 1984 1992 1999 2007 2014Household Mortgage Debt Total Household DebtFinancial Liabilities
% of Disposable Income
Improving economic conditions are boosting confidence, leading
to accelerating expenditures, particularly in forward-looking
components like household durable goods and business
investment. For instance, the annual growth rate of durable
personal consumption expenditures was 8.4% in Q4, and the
annual growth rate of gross domestic business investment was
9.1%.
More robust economic growth is reabsorbing slack at a fast pace,
a process which will eventually lead to stronger pricing power for
firms and to higher underlying inflation.

Global Macro Shifts: Global Growth: Headwinds or Tailwinds?
-10%
-8%
-6%
-4%
-2%
0%
2%
4%
6%
8%
1950 1958 1966 1974 1982 1990 1998 2006 2014CBO Output Gap Hodrick-Prescott Filter
% of Potential Output
6
The U.S. Congressional Budget Office (CBO) estimates that GDP
remains a little under 2% below its potential level. However, other
indicators of economic slack suggest tighter conditions. Using
statistical tools such as the Hodrick-Prescott filter yields a positive
output gap (i.e., GDP is above its potential level, Chart 8).
Manufacturing capacity utilization remains above its 10-year
average, and the labor market, in particular, appears to be healing
quickly (Charts 9 and 10). The unemployment rate is only slightly
above the natural non-accelerating inflation level (NAIRU), also
estimated by the CBO. Long-term unemployment is diminishing.
The unemployment rate due to those unemployed less than 27
weeks declined to 3.9% in January from 4.2% at the end of 2013
and for those unemployed more than 26 weeks to 1.8% from 2.5%
(Chart 11). The divergence from historical norms on
unemployment by age and educational attainment is also
normalizing rapidly.
Non-CBO Measures Indicate Less Slack in the EconomyChart 8: Output Gap: CBO vs. Hodrick-Prescott AnalysisMarch 1950–September 2014
Source: Calculations by Franklin Templeton Investments with data sourced from the US Congressional Budget Office and US Department of Commerce.
Manufacturing Capacity Utilization Above Its 10-Year AverageChart 9: Manufacturing Capacity UtilizationMarch 1950–December 2014
Source: Calculations by Franklin Templeton Investments with data sourced from the Federal Reserve.
Sharply Declining Rates for Both Short- and Long-Term UnemploymentChart 11: Unemployment RatesJanuary 1950–December 2014
Source: US Congressional Budget Office, US Department of Labor.
Unemployment Rate Close to Its Natural Non-Accelerating Inflation LevelChart 10: Unemployment Rate and NAIRU (Estimated by CBO)March 1957–December 2014
Source: US Department of Labor.
The labor force participation rate remains significantly below pre-
crisis levels. Many analysts argue that an eventual increase of the
participation rate will hold down wage inflation as the influx of
workers reduces wage pressures. However, there is an important
offset to this. The chart below shows the relationship between the
unemployment rate and the number of job openings, called the
Beveridge curve (Chart 12). The last data point in the chart
(December 2014) indicates that despite a greater number of job
openings than pre-crisis, the number of unemployed has remained
at higher levels—indicating a skills mismatch. In other words, an
60%
65%
70%
75%
80%
85%
90%
95%
1950 1958 1966 1974 1982 1990 1998 2006 2014
% of Capacity
Manufacturing Capacity Utilization 10-Year Moving Average
0
2
4
6
8
10
12
1957 1966 1976 1985 1995 2004 2014
12-Month
Unemployment Rate NAIRU (Long Term)
NAIRU (Short Term)
0%
1%
2%
3%
4%
5%
6%
7%
8%
9%
10%
1950 1958 1966 1974 1982 1990 1998 2006 2014
Unemployed < 27 Weeks Unemployed ≥ 27 Weeks
% of Labor Force

Global Macro Shifts: Global Growth: Headwinds or Tailwinds? 7
additional structural component to unemployment exists,
suggesting that wage pressures could materialize before the
unemployment rate reaches previous lows. In addition,
demographic shifts suggest that the participation rate is unlikely to
return to pre-crisis levels.
The various reports on labor earnings and compensation suggest
that wage costs are slowly firming. Average hourly earnings (AHE)
grew 2.2% y/y in January 2015. Private employee compensation
grew almost 2% in the fourth quarter of 2014. Accounting for the
change in composition of the labor force as measured by
employment cost index (ECI) data, hourly compensation is
growing faster in the fourth quarter (Charts 13 and 14). We
conducted a statistical analysis to study the historical relationship
between earnings growth, the level of slack in labor markets and
labor demand. The results indicate that, based on historical
Persistent Labor Market Skill MismatchesChart 12: Beveridge CurveJanuary 2001–December 2014
Source: US Department of Labor.
Accounting for Composition of the Labor Force (ECI), Wages Have Been Rising Faster than 2%Chart 13: Nonfarm Business Compensation per Hour and Private Employment Cost Index1990–2014
Source: US Department of Labor. Source: US Department of Labor.
Recent Pickup in Inflation-Adjusted Average Hourly EarningsChart 14: Real Average Hourly Earnings Total Private Nonfarm EmployeesJanuary 2008–December 2014
norms, hourly employee compensation will probably accelerate:
The models forecast AHE growth to rise toward 3% over 2015.
Headline measures of inflation have declined recently, particularly
on softer energy prices, but underlying inflationary pressures have
been much more stable, albeit still below the Fed’s 2.0% inflation
target (Charts 15–18). Note that core inflation measures still
include transportation prices, which tend to decline with lower
energy prices.
As with wages, the declining slack in labor markets suggests that
companies will have stronger pricing power, leading to higher
inflation. Our statistical analysis suggests that the current level of
the unemployment rate and the current level of inflation
expectations are consistent with a 2.24% core personal
consumption expenditure (PCE) inflation rate.
-1%
0%
1%
2%
3%
4%
5%
6%
7%
8%
9%
1990 1994 1998 2002 2006 2010 2014
Y/Y
Compensation per Hour Private Employment Cost Index
-5%
0%
5%
10%
15%
20%
1/08 1/09 1/10 1/11 1/12 1/13 1/14
Y/Y Q/Q Seasonally Adjusted Annual Rate
12/14
% Change, Seasonally Adjusted Annual Rate
Mar. 2007
Jul. 2009
Apr. 2010
Dec. 2014
0
1000
2000
3000
4000
5000
6000
0 5000 10000 15000 20000
Unemployed (Millions)
Down on old curve:recessionary - global financial crisis period
Up on new curve: expansionary, but skill mismatch persists
Curve shifts out: skill mismatch
5 10 15 20
1
2
3
4
5
6Job Openings (Millions)

Global Macro Shifts: Global Growth: Headwinds or Tailwinds? 8
We would like to stress this point. The US economy is currently in
a kind of “goldilocks” scenario: The financial sector has healed,
private debts have been reduced, and the recovery has firmed
while receiving a boost from lower oil prices. Even as these low oil
prices support growth, they help keep inflationary pressures
muted, thus allowing the Fed to maintain very accommodative
monetary conditions and very low interest rates. Sometime in
2016–17, however, base effects on energy prices will be much
less favorable and, combined with a tighter labor market and
faster GDP growth, could result in a meaningful acceleration in
inflation pressures. At that point we might see a sudden upward
adjustment in bond yields, which are still compressed at an
unsustainable level by the distortionary impact of massive Fed
purchases over the past few years, even as the federal funds rate
remains at the zero bound.
The US has become the world’s largest producer as well as
consumer of crude oil (Charts 19–20). In the United States, crude
Headline Inflation Has Declined Due to Oil Price Drop; Underlying Inflation Measures Have Remained Steady
Source: US Department of Commerce, Federal Reserve, US Department of Labor.
Chart 16: Core PCE InflationJanuary 2007–December 2014
oil production has grown 2 million barrels per day (mb/d) since
2004.2 More than 3 mb/d of that growth has come from fracking of
oil trapped in tight geologic formations.2 Without shale and other
new sources, US oil production would be down more than a
million barrels a day over the last 10 years and down 5½ mb/d
from its peak in 1970.
As the United States still imports oil and energy on a net basis—
net petroleum imports represent about 1.2% of GDP3—the US as
a whole will ultimately benefit from the drop in oil prices. Within the
US, there will be winners and losers. Households stand to gain
immediately: They will benefit from the oil price drop much like
they would benefit from a tax cut. Household expenditures on
energy-related goods and services represent about 6% of total
personal consumption expenditures.3 Likewise, businesses and
industries where energy prices are a large cost will also benefit.
The main losers from the oil price drop will be those companies
that invested heavily in oil and shale-gas expansion.
-2%
0%
2%
4%
6%
8%
1/07 1/08 1/09 1/10 1/11 1/12 1/13 1/14
Y/Y
PCE Core PCE
12/140%
1%
2%
3%
4%
1/07 1/08 1/09 1/10 1/11 1/12 1/13 1/14
Y/Y
Core PCE Trimmed Mean
12/14
Chart 17: CPI InflationJanuary 2007–December 2014
Chart 18: Core CPI InflationJanuary 2007–December 2014
-4%
-2%
0%
2%
4%
6%
8%
1/07 1/08 1/09 1/10 1/11 1/12 1/13 1/14
Y/Y
CPI Core CPI
12/140%
1%
2%
3%
4%
1/07 1/08 1/09 1/10 1/11 1/12 1/13 1/14
Y/Y
Core CPI Trimmed Mean Median
12/14
Chart 15: PCE InflationJanuary 2007–December 2014
Global Macro Shifts: Global Growth: Headwinds or Tailwinds? 9
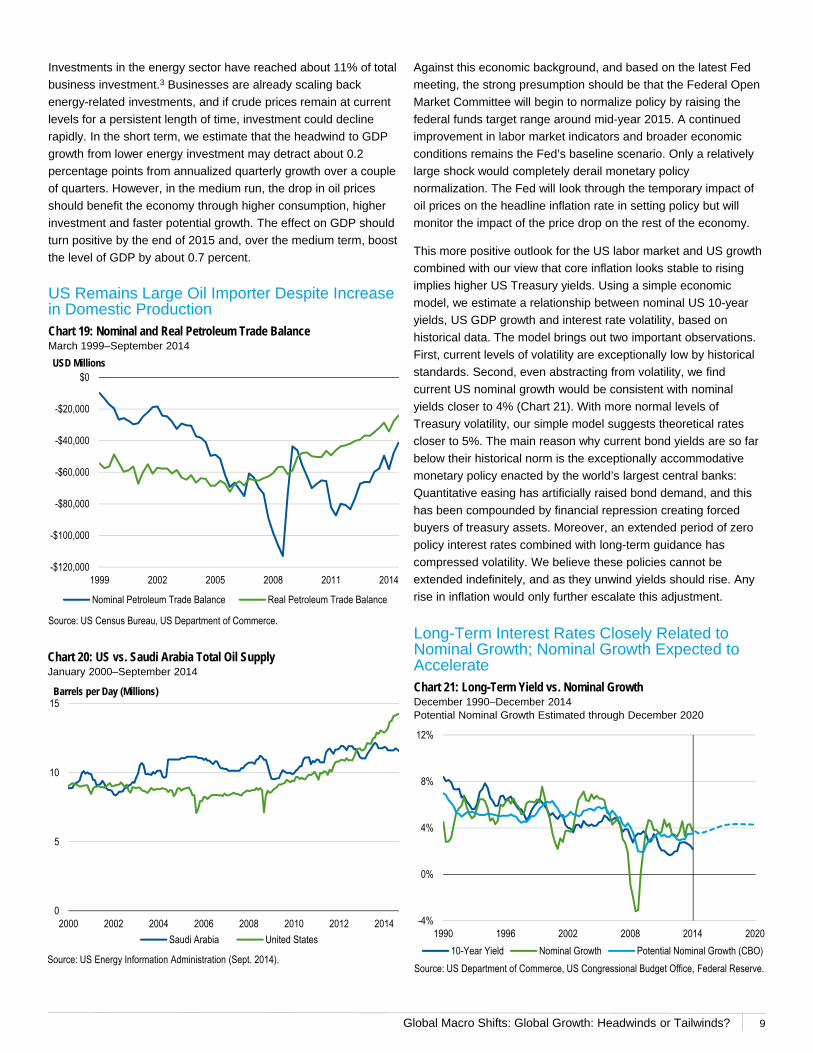
Investments in the energy sector have reached about 11% of total
business investment.3 Businesses are already scaling back
energy-related investments, and if crude prices remain at current
levels for a persistent length of time, investment could decline
rapidly. In the short term, we estimate that the headwind to GDP
growth from lower energy investment may detract about 0.2
percentage points from annualized quarterly growth over a couple
of quarters. However, in the medium run, the drop in oil prices
should benefit the economy through higher consumption, higher
investment and faster potential growth. The effect on GDP should
turn positive by the end of 2015 and, over the medium term, boost
the level of GDP by about 0.7 percent.
US Remains Large Oil Importer Despite Increase in Domestic ProductionChart 19: Nominal and Real Petroleum Trade BalanceMarch 1999–September 2014
Source: US Census Bureau, US Department of Commerce.
Chart 20: US vs. Saudi Arabia Total Oil SupplyJanuary 2000–September 2014
0
5
10
15
2000 2002 2004 2006 2008 2010 2012 2014
Saudi Arabia United States
Barrels per Day (Millions)
Source: US Energy Information Administration (Sept. 2014).
-$120,000
-$100,000
-$80,000
-$60,000
-$40,000
-$20,000
$0
1999 2002 2005 2008 2011 2014
USD Millions
Nominal Petroleum Trade Balance Real Petroleum Trade Balance
Long-Term Interest Rates Closely Related to Nominal Growth; Nominal Growth Expected to AccelerateChart 21: Long-Term Yield vs. Nominal GrowthDecember 1990–December 2014Potential Nominal Growth Estimated through December 2020
Source: US Department of Commerce, US Congressional Budget Office, Federal Reserve.
Against this economic background, and based on the latest Fed
meeting, the strong presumption should be that the Federal Open
Market Committee will begin to normalize policy by raising the
federal funds target range around mid-year 2015. A continued
improvement in labor market indicators and broader economic
conditions remains the Fed’s baseline scenario. Only a relatively
large shock would completely derail monetary policy
normalization. The Fed will look through the temporary impact of
oil prices on the headline inflation rate in setting policy but will
monitor the impact of the price drop on the rest of the economy.
This more positive outlook for the US labor market and US growth
combined with our view that core inflation looks stable to rising
implies higher US Treasury yields. Using a simple economic
model, we estimate a relationship between nominal US 10-year
yields, US GDP growth and interest rate volatility, based on
historical data. The model brings out two important observations.
First, current levels of volatility are exceptionally low by historical
standards. Second, even abstracting from volatility, we find
current US nominal growth would be consistent with nominal
yields closer to 4% (Chart 21). With more normal levels of
Treasury volatility, our simple model suggests theoretical rates
closer to 5%. The main reason why current bond yields are so far
below their historical norm is the exceptionally accommodative
monetary policy enacted by the world’s largest central banks:
Quantitative easing has artificially raised bond demand, and this
has been compounded by financial repression creating forced
buyers of treasury assets. Moreover, an extended period of zero
policy interest rates combined with long-term guidance has
compressed volatility. We believe these policies cannot be
extended indefinitely, and as they unwind yields should rise. Any
rise in inflation would only further escalate this adjustment.
-4%
0%
4%
8%
12%
1990 1996 2002 2008 2014 2020
10-Year Yield Nominal Growth Potential Nominal Growth (CBO)

Global Macro Shifts: Global Growth: Headwinds or Tailwinds? 10
As an important corollary of this outlook of stronger growth and
higher interest rates, we expect that the current cycle of relative
US dollar strength still has longer to run. Historically, dollar
strength cycles tend to run for about five to seven years, and in
this cycle the real effective exchange rate of the dollar has been
strengthening for about three years. We can therefore expect a
further strengthening of the US dollar, especially against the euro
and the Japanese yen, due to the expansionary monetary stance
in those countries. The performance of emerging-market
currencies against the dollar will be more differentiated: Countries
with weak fundamentals and large financing gaps will likely see
their currencies lose ground to the dollar, but countries with
stronger fundamentals and especially those with positive cyclical
ties to the US economy should see their currencies remain stable
and perhaps appreciate somewhat against the dollar.
-5%
0%
5%
10%
15%
20%
1980 1985 1991 1997 2002 2008 2014
Constant Nominal Growth Standard Deviation (One-Year T-Bill)
Long-Term Interest Rates Also Related to Volatility in Treasury YieldsChart 22: Disaggregation of Predicted US Treasury YieldsMarch 1980–December 2014
Source: Calculations by Franklin Templeton Investments with data sourced from the US Department of Commerce and Federal Reserve.

Global Macro Shifts: Global Growth: Headwinds or Tailwinds?
Euro Depreciation Likely to Benefit Euro Area’s ExportsChart 23: Eurozone Nominal Effective Exchange Rate vs. Exports (Year-over-Year)Q1 2000–Q4 2013
11
Eurozone
We would stress at the outset that the eurozone economy as a
whole relies to a very important extent on exports. In the case of
Germany (accounting for a third of eurozone GDP but over half of
all eurozone growth), about 50% of all growth over the last decade
has come from the contribution of net exports.4 Across the
eurozone as a whole, the ratio of exports to GDP has been
growing and now stands at some 45%.4 These trends have been
accentuated in the period following the global financial crisis as
domestic demand across the region collapsed and then struggled
to recover. While the impediments to strong growth in the
eurozone are well known, ranging from moribund investment to
the deep-rooted structural rigidities yet to be addressed, we think
that over the coming few years the region should benefit from
three strong tailwinds. These have been largely ignored by
markets, and we feel they are worth highlighting.
First, as noted in the section on the US outlook, we are
anticipating robust growth in the US, with a particularly strong
dynamic of consumer demand. This, in turn, will provide solid
support for eurozone exports to the US.
Second, the ECB made a commitment on January 22 to embark
on a very ambitious quantitative easing program, with the aim of
increasing the size of its balance sheet to a level north of its
previous peak. The monthly purchases will be similar in size to
those made by the Fed when it launched its QE3 program. The
ECB intends to continue the purchases until it sees a sustained
adjustment in the path of inflation toward its price stability norm of
inflation below but close to 2%, making the program effectively
open-ended. This will keep interest rates very low for very long,
and it will put further downward pressure on the euro, especially if
the Fed starts raising rates this year, as we expect. While we are
not anticipating that low rates will have a meaningful impact on
investment, the weak euro should further boost exports. The
charts below show the relationship between exports and the trade
weighted exchange rate for both Germany and the eurozone as a
whole, illustrating this point (Charts 23–24).
Source: Calculations by Franklin Templeton Investments with data sourced from Eurostat.
Chart 24: Germany Nominal Effective Exchange Rate vs. Exports (Year-over-Year)Q1 2000–Q3 2013
y = -0.6476x + 8.6572R² = 0.5278
-5
0
5
10
15
20
-15 -10 -5 0 5 10 15 20
Export
Nominal Effective Exchange Rate
y = -0.6433x + 9.7429R² = 0.4618
-5
0
5
10
15
20
25
-15 -10 -5 0 5 10 15 20
Export
Nominal Effective Exchange Rate

Global Macro Shifts: Global Growth: Headwinds or Tailwinds? 12
We have attempted to assess the size of the incremental impact
of these two tailwinds on eurozone exports, and from there the
potential impact on GDP. While our research does not aim at
providing a point forecast for euro area GDP, it suggests that the
generally accepted baseline of growth of about 1% (consensus
forecasts: 1.15%) seriously underestimates the upside potential
coming from these two distinct sources.
Third, oil prices have dropped by more than 50% since the middle
of last year.5 The IMF estimates that the incremental impact on
euro area growth from such a reduction in oil prices could be as
much as 0.5%.1 The ECB has a more conservative forecast, but
we think the key factor remains that the decline in oil prices will
support growth—adding to the potential for an upside surprise to
expectations of the region remaining mired in stagnation in the
year ahead. These factors put us squarely at odds with currently
perceived wisdom that sees the eurozone as the source of global
growth fears, and thus in part the cause of the collapse in oil
prices due to an impending decline in demand.
While this piece focuses on this year and the next, we would note
that this short-term outlook does not address some fundamental
problems associated with the increasing divergence between the
countries of the euro area. These differences are likely to be
exacerbated by contentious politics and the fact that many of the
factors that brighten the near-term growth prospects reduce the
pressure on governments for much needed structural reforms—in
turn with negative consequences for the longer-term growth
outlook.

Global Macro Shifts: Global Growth: Headwinds or Tailwinds?
94
96
98
100
102
104
1/12 7/12 1/13 7/13 1/14 7/14
Index
Input Prices Output Prices12/14
Output Prices Rising Faster than Input PricesChart 26: Output Prices Exceeding Input PricesJanuary 2012–December 2014
Positive Trend in Nominal GDP Growth Since AbenomicsChart 25: Nominal GDP Growth TrendQ1 2000–Q3 2014
13
Japan
Japanese GDP growth should rebound to over 1% this year,6
above potential, thanks to the expansionary macroeconomic
policy and favorable external environment. The IMF estimates
that a 50% reduction in oil prices would likely raise Japan’s GDP
by up to about 0.5% in 2015.1 A certain degree of uncertainty
accompanies this estimate given the clear increase in oil imports
after the Fukushima earthquake in 2011. The positive growth
impact will likely be gradual and materialize with some quarters’
lags.
Abstracting from the impact of oil prices, we recognize that the
efficacy of Abenomics, the Japanese macro policy experiment in
place since early 2013, generates some skepticism. Abenomics
aims to break Japan out of its multi-decade cycle of deflation, to
begin the process of fiscal consolidation, and, perhaps most
importantly, to improve Japan’s potential growth rate via structural
reforms.
In terms of achievements, it should be acknowledged that Japan
does appear to have exited from the cycle of deflation and
contraction in nominal growth since the launch of Abenomics, as
illustrated in Chart 25. This extremely important step forward has
eluded Japanese policymakers for a long time. Furthermore, as
illustrated in Charts 26 and 27, both input and output prices have
gone up since the start of Abenomics and the increase in output
prices has risen faster than input prices. And at the same time, the
trend in nominal growth has turned positive.
Source: Bank of Japan.
Chart 27: Ratio of Output Prices/Input PricesJanuary 2012–December 2014
94
96
98
100
102
104
1/12 7/12 1/13 7/13 1/14 7/14
Index
12/14
-1.6%
-1.2%
-0.8%
-0.4%
0.0%
0.4%
2000 2002 2004 2006 2008 2010 2012 2014
Y/Y
Abenomics Begins
Source: Calculations by Franklin Templeton Investments with data sourced from the Bank of Japan.

Global Macro Shifts: Global Growth: Headwinds or Tailwinds? 14
The question remains whether this begins a temporary or
permanent exit from Japan’s cycle of deflation, rising debt and
declining growth. The answer will depend on whether Prime
Minister Shinzo Abe’s government manages to make equally
decisive progress on other key reforms.
The government has put in place some important supporting
conditions: It has triggered positive financial sector dynamics via
the augmented quantitative easing and the portfolio rebalancing of
the Government Pension Investment Fund (GPIF); these changes
should continue to fuel a positive wealth effect, supporting
consumption and countering the adverse impact of higher inflation
on real wages. Moreover, with last year’s decisive election victory
Prime Minister Abe has secured strong legitimacy, which he can
leverage to tackle the tougher part of the reform agenda.
With respect to fiscal consolidation, so far the first stage of a two-
part increase in the consumption tax has taken effect. While the
second stage has been postponed, the government still plans to
have it go into effect with a delay. Perhaps more importantly, even
with the passage of the entire consumption tax, the sustainability
of the fiscal position would still require greater movement on the
other goals.
The famous “third arrow” of Abenomics has had mixed results so
far, with important actions in the areas of labor and product market
deregulation still to come. These will be very important, as they
are arguably the most important areas from the perspective of
raising productivity and potential growth. Thus far, the progress in
the reform of the health care and other high end sectors has been
limited. In the electricity sector, there has not been much
movement on increasing competition among power producers.
The government has done far better in the area of the financial
sector, such as the reform of the pension fund (GPIF) and
adopting a code of corporate governance, but labor market
reforms, including measures to increase female participation rates,
would have a much greater impact on potential growth. Japan now
needs decisive action to raise its potential growth path,
consolidate the positive inflation dynamics and improve revenue
collection. All three conditions are needed to secure stronger
growth and debt sustainability. Progress in 2015 will be the key
test.

Global Macro Shifts: Global Growth: Headwinds or Tailwinds? 15
China
We expect a 2015 GDP growth rate for China of about 7%, and
only slightly lower than 2014’s 7.4%. However, any decline in
China’s growth rate has been taken to be a significant headwind
to global growth by most commentators, which we would not
agree with. China is settling on a lower trend growth path
compared to the about 10% of past decades, but we think this is
playing out as a well-managed and desirable adjustment, and not
a hard landing. We see it more as a welcome indication that
China’s policymakers are committed to their stated aim of
rebalancing the economy and growth model away from such a
heavy reliance on fixed asset investment and exports. China’s
important progress in reducing some of the excesses that
developed during the immediate aftermath of the global financial
crisis should be noted: Credit expansion is being brought under
control, investment rates have declined, and the real estate
market is cooling off.
Separately, some commentators argue that official statistics
heavily overstate China’s true GDP growth, which could already
be as low as 3% rather than around 7%.7 We believe this
argument simply does not stand up to even a cursory scrutiny.
Undoubtedly, in China, as in other emerging markets (and
sometimes advanced economies), economic statistics suffer from
weaknesses and imprecisions. However, here we highlight just a
few of the many indicators that actually support the view that
China has indeed been growing at close to or above potential:
Labor markets have tightened; while one could argue that these
statistics are also flawed, we would highlight the lack of social
unrest that would follow deteriorating labor markets. Further
support comes from retail sales, which remain robust.
The labor market has tightened somewhat as the pace of
urbanization has slowed and as labor supply no longer outstrips
labor demand (Chart 28). As a consequence, wages have begun
to increase at a healthier pace (Chart 29). The rise in wages in
turn has helped accelerate consumption, helping rebalance the
makeup of growth. This kind of robust labor market dynamics
simply would not be possible without reasonably strong economic
growth. The high degree of political stability and absence of
violence, as evidenced by the World Bank’s World Governance
Indicator (which aggregates political stability indicators from nine
different sources) illustrated in Chart 30, supports the view that
labor market dynamics are indeed robust.
Indications of Tightening Labor MarketChart 28: China: Job Vacancy/Job SeekerQ1 2005–Q4 2014
Rising Migrant Workers’ Salaries Should Be Supportive for Domestic ConsumptionChart 29: Chinese Migrant Workers’ Monthly Salary1979–2014
Source: Lu Feng, “Employment Expansion and Wage Growth (2001–2010),” China Macroeconomic Research Center, Peking University, Beijing, June 2011. Update for 2010–2013 by Franklin Templeton Investments with data from the National Bureau of Statistics.
Source: China Ministry of Human Resources and Social Security.
80%
85%
90%
95%
100%
105%
110%
115%
2005 2006 2007 2008 2009 2010 2011 2012 2013 20140
100
200
300
400
500
1979 1984 1989 1994 1999 2004 2009 2014
Real Monthly Wages, 1979 Prices = 100

Global Macro Shifts: Global Growth: Headwinds or Tailwinds? 16
China’s government knows very well that it needs to maintain a
healthy pace of growth in employment and living standards to
maintain social cohesion and stability, and all indicators suggest
this is currently being achieved.
The healthy dynamics of retail sales, which are still growing at
double-digit rates, also confirm that rebalancing is underway
(Chart 31). It is also worth mentioning that the global impact of
China’s economy provides additional evidence that the economy
is indeed growing at about the reported rate. To give just one
example, China now ranks as the world’s largest oil importer, and
its oil imports have been rising through end-2014, at over 9%
year-to-date.8
We also think this rebalancing might already be further along than
is commonly believed: Academic work by Wang Xiaolu and Wing
Tye Woo suggests that GDP in China was underreported by 10%
and consumption underreported by 20%.9 Using these numbers
for adjustment, the consumption/GDP ratio in China could well be
around 62.5% GDP instead of the official reported 50% GDP
(Chart 32). This in turn would imply a lower risk to growth of a
sudden slowdown in investment than many think.
Source: National Bureau of Statistics of China.
Robust Retail Sales Growth Indicates Underlying Strength in Domestic ConsumptionChart 31: China: Retail SalesJanuary 31, 2004–December 31, 2014
Source: National Economic Research Institute. Estimate calculations by Franklin Templeton Investments based on methodology published by Xiaolu Wang and Wing ThyeWoo in China: Beyond the Miracle, 2011.
China’s Official Data Likely Underestimate Consumption as Share of GDPChart 32: China Consumption Share of GDP 1997–2013
0%
5%
10%
15%
20%
25%
2004 2006 2008 2010 2012 2014
Y/Y
45%
50%
55%
60%
65%
70%
75%
1997 2001 2005 2009 2013
GDP
Official Consumption Share (%) Estimated Consumption Share (%)
Source: National Bureau of Statistics of China.
Chart 33: China: Employment by Industry1978–2013
Labor Market Rebalancing: Tertiary Sector Has Surpassed Secondary Sector in Employment
0
100
200
300
400
1978 1983 1988 1993 1998 2003 2008 2013
Millions
Primary Secondary Tertiary
Source: The World Bank: Worldwide Governance Indicators.
Indicator of China’s Political Stability and Absence of ViolenceChart 30: World Bank World Governance Indicator for ChinaAs of September 27, 2013
20
25
30
35
40
45
1996 2000 2003 2005 2007 2009 2011 2013
Percentile Rank
Global Macro Shifts: Global Growth: Headwinds or Tailwinds? 17
Besides consumption, rebalancing seems to be happening in the
labor market too. The latest labor market data suggest that the
services sector already employs more persons than industry
(Chart 33). Finally, amongst the various monthly macro indicators,
retail sales have been relatively more resilient compared to
industrial production and fixed asset investments.
A healthy rebalancing also characterizes the allocation and use of
credit. While overall credit growth slows, financial institutions are
directing less credit to state-owned enterprises (SOEs). A number
of private sector companies are now benefiting from easier access
to credit markets. This in turn helps the private sector become a
more important driver of growth in China’s economy. Indeed,
private companies already create more jobs than SOEs.
The rebalancing of growth also implies scaling back and
headwinds in some areas. These often trigger alarmist comments
on the overall growth outlook. Most commentators seem to miss
the duality to China’s new growth framework, where different
elements fit together, and weaknesses in some areas are just the
counterpart to strengths in others.
For example, the reallocation of lending and curbing of credit
excesses have reduced fixed asset investment, notably in real
estate. And the increases in interest rates, together with the
stronger wage dynamics highlighted above, have put pressure on
corporate profits. On the other hand, the same wage dynamics are
powering consumption and retail sales, providing better profit
margins to other parts of the economy.
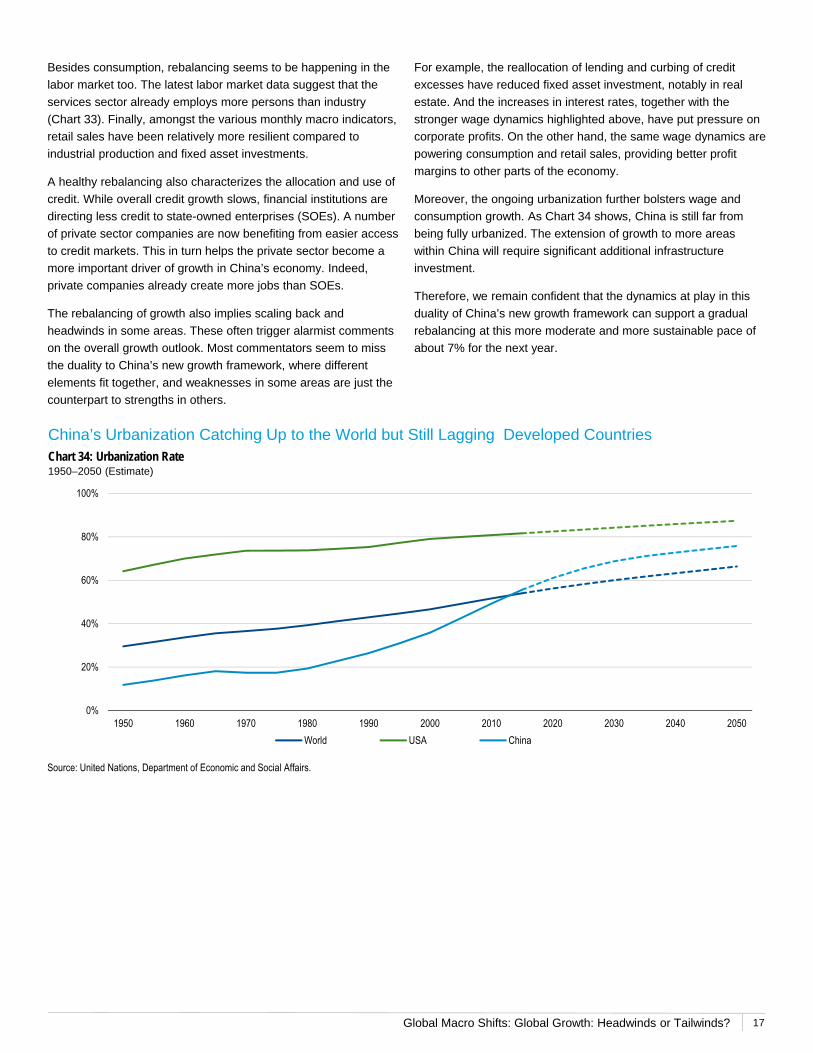
Moreover, the ongoing urbanization further bolsters wage and
consumption growth. As Chart 34 shows, China is still far from
being fully urbanized. The extension of growth to more areas
within China will require significant additional infrastructure
investment.
Therefore, we remain confident that the dynamics at play in this
duality of China’s new growth framework can support a gradual
rebalancing at this more moderate and more sustainable pace of
about 7% for the next year.
Source: United Nations, Department of Economic and Social Affairs.
China’s Urbanization Catching Up to the World but Still Lagging Developed CountriesChart 34: Urbanization Rate1950–2050 (Estimate)
0%
20%
40%
60%
80%
100%
1950 1960 1970 1980 1990 2000 2010 2020 2030 2040 2050
World USA China

Global Macro Shifts: Global Growth: Headwinds or Tailwinds? 18
Nonetheless, there remains a great deal of concern that even if
GDP growth remains on target while allowing for a healthy
rebalancing, this slower pace of growth in China will have a
significantly negative impact on global growth. We feel that this
concern misses a very important point which has to do with the
sheer speed and magnitude of China’s transformation. China’s
economy today has doubled in size since 2008. Charts 35 and 36
above illustrate the absolute changes in GDP for some of the
world’s major economies in 2014 and projected in 2015.
Importantly, China’s contribution to global GDP, even at a slower
pace than 2014, will be greater than that of the US.
We have done a simple calculation to simulate the impact of
China’s demand on the rest of the world’s growth, using as a
proxy Chinese imports. We have calculated the relationship
between China’s GDP growth and imports growth across two sub-
samples: (1988–2008) and (2009–2014). As Chart 37 illustrates,
China’s propensity to import has fallen over the years but at a very
gradual pace. Using the coefficients we derive in this fashion, a
simple back of the envelope calculation suggests that due to the
larger size of its economy, China today has almost double the
impact on global demand than it had prior to the global financial
crisis.
Finally, we would also note that much like the US, the eurozone
and Japan, China benefits significantly from the decline in oil
prices. China overtook the US in 2013 as the world’s largest
importer of oil, and we estimate that every US$10 reduction in the
price of oil results in a 0.2% increase in the trade surplus (or net
exports). We have also estimated the impact the reduction in price
has on consumption (positive) and investment (negative), and
believe that for every 10% decline in the oil price GDP could
increase by 0.17%. As in the case of the eurozone, we think that
oil prices could act as an important tailwind for Chinese growth.
Source: National Bureau of Statistics of China.
China’s Relatively High Marginal Propensity to Import and Large Nominal GDP Bode Well for Global Economic Growth and DemandChart 37: China: Marginal Propensity to Import1978–2013
y = 0.2926x - 596.04
y = 0.2108x + 542.5
0
2000
4000
6000
8000
10000
12000
14000
0 10000 20000 30000 40000 50000 60000 70000GDP, Renminbi Billions
1988–2008 2009–Latest Linear (1988–2008) Linear (2009–Latest)
Import, Renminbi Billions
Source: International Monetary Fund, World Economic Outlook, as of October 2014.
China Projected to Be Largest Contributor to Nominal World GDP in 2015Chart 35: Projected Change in Nominal GDP Chart 36: Major Economies' Share of World's GDP in 2014
0%
5%
10%
15%
20%
25%
Chi
na
USA U
K
Japa
n
Ger
man
y
Can
ada
Fran
ce
Italy
-$200
$0
$200
$400
$600
$800
$1,000
Chi
na
USA U
K
Japa
n
Ger
man
y
Can
ada
Fran
ce
Italy
USD Billions
2014 2015 (Estimate)

Global Macro Shifts: Global Growth: Headwinds or Tailwinds?
0%
20%
40%
60%
80%
100%
% of Merchandise Exports
19
Emerging Markets
Markets perceive the sharp reduction in oil prices as a net
negative for all emerging markets, rather than a major source of
differentiation. The emerging markets world includes some of the
world’s largest oil producers, which now face massive headwinds.
In particular, some of the largest emerging-market oil exporters
also tend to have highly concentrated economies, making them
very dependent on oil as a source of fiscal revenues, current
account surpluses and GDP growth. On the other hand, some of
the world’s largest oil consumers are also emerging markets, and
they stand to benefit from the impact of the tax cut implicit in the
reduction in oil prices (Charts 38 and 39).
To illustrate, perhaps the most striking example of the former
group is Russia, where GDP forecasts have been reduced by
between 3%–4%, implying a similar level of outright economic
contraction this year. This reflects the fact that the Russian
economy was already stagnating on the back of sanctions and
tight financial conditions, prior to the collapse of oil prices. Oil has
an enormous impact on the Russian economy—oil represents
about 25% of GDP, 50% of fiscal revenues and 70% of its
exports.10 Russia’s budget only breaks even at an oil price of
about US$98 per barrel,11 so that the current price of oil puts the
budget under significant stress.
On the other hand, China, as noted above stands to gain
significantly from the decline in oil prices, but importantly so do
most emerging markets. There are far more oil importers than
exporters in the world, including within the emerging markets
universe. India will likely see a boost to its GDP (albeit smaller
than China’s given the limited pass through from global oil prices
to the final consumer). Based on our calculations, South Korea,
for example, could see as much as a half percentage point boost
to its growth rate this year on the back of lower oil—bringing its
growth to near the 4% level.
When forecasting the outlook for emerging markets, the need to
be nuanced cannot be overstated. Despite superficial similarities,
individual countries differ enormously. Mexico, also an oil
exporter, maintains a very strong outlook because in contrast to
Russia, only 10% of Mexico’s exports are actually oil related.12 As
such for Mexico, the resurgence of the US consumer and US
growth is a far more important driver of export and GDP
performance than the price of oil. Thus, even all emerging-market
oil producers are not in the same boat as Russia—a fact little
recognized by most observers.
Source: The World Bank: World Development Indicators.
Share of Oil in Exports and Imports Varies Significantly Across Emerging-Market Countries Chart 38: Fuel Exports2013
Chart 39: Fuel Imports2013
0%
10%
20%
30%
40%
50%
% of Merchandise Imports

Global Macro Shifts: Global Growth: Headwinds or Tailwinds? 20
IMPORTANT LEGAL INFORMATION
This material is intended to be of general interest only and should not be construed as individual investment advice or a recommendation or solicitation to buy, sell or hold any security or to adopt any investment strategy. It does not constitute legal or tax advice.
The views expressed are those of the investment manager and the comments, opinions and analyses are rendered as of the publication date and may change without notice. The information provided in this material is not intended as a complete analysis of every material fact regarding any country, region or market. All investments involve risks, including possible loss of principal.
Data from third party sources may have been used in the preparation of this material and Franklin Templeton Investments (“FTI”) has not independently verified, validated or audited such data. FTI accepts no liability whatsoever for any loss arising from use of this information and reliance upon the comments opinions and analyses in the material is at the sole discretion of the user.
Products, services and information may not be available in all jurisdictions and are offered outside the U.S. by other FTI affiliates and/or their distributors as local laws and regulation permits. Please consult your own professional adviser for further information on availability of products and services in your jurisdiction.
Issued in the U.S. by Franklin Templeton Distributors, Inc., One Franklin Parkway, San Mateo, California 94403-1906, (800) DIAL BEN/342-5236, franklintempleton.com - Franklin Templeton Distributors, Inc. is the principal distributor of Franklin Templeton Investments’ U.S. registered products, which are available only in jurisdictions where an offer or solicitation of such products is permitted under applicable laws and regulation.
WHAT ARE THE RISKS?
All investments involve risks, including possible loss of principal.
Bond prices generally move in the opposite direction of interest
rates. Thus, as the prices of bonds in an investment portfolio
adjust to a rise in interest rates, the value of the portfolio may
decline. Special risks are associated with foreign investing,
including currency fluctuations, economic instability and political
developments. Investments in developing markets, of which
frontier markets are a subset, involve heightened risks related to
the same factors, in addition to those associated with these
markets’ smaller size, lesser liquidity and lack of established legal,
political, business and social frameworks to support securities
markets. Because these frameworks are typically even less
developed in frontier markets, as well as various factors including
the increased potential for extreme price volatility, illiquidity, trade
barriers and exchange controls, the risks associated with
developing markets are magnified in frontier markets.

Global Macro Shifts: Global Growth: Headwinds or Tailwinds? 21
1. Source: International Monetary Fund.2. Source: US Energy Information Administration (Jan. 2015), National Bureau of Economic Research.3. Source: US Department of Commerce, Bureau of Economic Analysis.4. Source: Eurostat.5. Source: Bloomberg.6. Source: Bank of Japan.7. Source: Nancy Lazar, Cornerstone Macro.8. Source: US Energy Information Administration (Mar. 2014).9. Source: “The Size and Distribution of Hidden Household Income in China,” (with Xiaolu Wang), Asian Economic Papers, Winter/Spring 2011, Vol. 10 No.1, pp. 1–26.10. Source: US Energy Information Administration (Jul. 2014), Ministry of Finance of the Russian Federation.11. Source: WSJ, Fitch Ratings.12. Source: Bank of Mexico, http://www.banxico.org.mx
For Charts 21, 34 and 35, there is no assurance that any estimate or projection will be realized.
See www.franklintempletondatasources.com for additional data provider information.
Australia: Issued by Franklin Templeton Investments Australia Limited (ABN 87 006 972 247) (Australian Financial Services License Holder No. 225328), Level 19, 101 Collins Street, Melbourne, Victoria, 3000. Austria/Germany: Issued by Franklin Templeton Investment Services GmbH, Mainzer Landstraße 16, D-60325 Frankfurt am Main, Germany. Authorized in Germany by IHK Frankfurt M., Reg. no. D-F-125-TMX1-08.Canada: Issued by Franklin Templeton Investments Corp., 5000 YongeStreet, Suite 900 Toronto, ON, M2N 0A7, Fax: (416) 364-1163, (800) 387-0830, www.franklintempleton.ca. Dubai: Issued by the branch of Franklin Templeton Investment Management Limited (FTIML) in Dubai. Gate, East Wing, Level 2, Dubai International Financial Centre, P.O. Box 506613, Dubai, U.A.E., Tel.: +9714-4284100 Fax:+9714-4284140. Authorized and regulated by the Dubai Financial Services Authority. France: Issued by Franklin Templeton France S.A., 20 rue de la Paix, 75002 Paris France. Hong Kong: Issued by Franklin Templeton Investments (Asia) Limited, 17/F, Chater House, 8 Connaught Road Central, Hong Kong. Italy: Issued by Franklin Templeton Italia Sim S.p.A., Corso Italia, 1 – Milan, 20122, Italy. Japan: Issued by Franklin Templeton Investments Japan Limited. Korea: Issued by Franklin Templeton Investment Trust Management Co., Ltd., 3rd fl., CCMM Building, 12 Youido-Dong, Youngdungpo-Gu, Seoul, Korea 150-968. Luxembourg/Benelux: Issued by Franklin Templeton International Services, S.à r.l. – Supervised by the Commission de Surveillance du Secteur Financier - 8A, rue Albert Borschette, L-1246 Luxembourg - Tel: +352-46 66 67-1 - Fax: +352-46 66 76. Malaysia: Issued by Franklin Templeton Asset Management (Malaysia) Sdn. Bhd. & Franklin Templeton GSC Asset Management Sdn. Bhd. Poland: Issued by Franklin Templeton Investments Poland Sp. z o.o.; Rondo ONZ 1; 00-124 Warsaw. Romania: Issued by the Bucharest branch of Franklin Templeton Investment Management Limited, 78-80 Buzesti Street,
Premium Point, 7th-8th Floor, 011017 Bucharest 1, Romania. Registered with CNVM under no. PJM05SSAM/400001/14.09.2009, and authorized and regulated in the UK by the Financial Conduct Authority. Singapore: Issued by Templeton Asset Management Ltd. Registration No. (UEN) 199205211E, 7 Temasek Boulevard, #38-03 Suntec Tower One, 038987, Singapore. Spain: Issued by the branch of Franklin Templeton Investment Management, Professional of the Financial Sector under the Supervision of CNMV, José Ortega y Gasset 29, Madrid. South Africa: Issued by Franklin Templeton Investments SA (PTY) Ltd which is an authorized Financial Services Provider. Tel: +27 (11) 341 2300 Fax: +27 (11) 341 2301. Switzerland & Liechtenstein: Issued by Franklin Templeton Switzerland Ltd, Stockerstrasse 38, CH-8002 Zurich. UK & Nordic regions: Issued by Franklin Templeton Investment Management Limited (FTIML), registered office: The Adelphi, 1-11 John Adam Street, London WC2N 6HT. Authorized and regulated in the United Kingdom by the Financial Conduct Authority and authorized to conduct investment business in Denmark by the Finanstilsynet, in Sweden by the Finansinspektionen, in Norway with Kredittilsynet, and in Finland with Rahoitustarkastuksen. Offshore Americas: In the U.S., this publication is made available only to financial intermediaries by Templeton/Franklin Investment Services, 100 Fountain Parkway, St. Petersburg, Florida 33716. Tel: (800) 239-3894 (USA Toll-Free), (877) 389-0076 (Canada Toll-Free), and Fax: (727) 299-8736. Investments are not FDIC insured; may lose value; and are not bank guaranteed. Distribution outside the U.S. may be made by Templeton Global Advisors Limited or other sub-distributors, intermediaries, dealers or professional investors that have been engaged by Templeton Global Advisors Limited to distribute shares of Franklin Templeton funds in certain jurisdictions. This is not an offer to sell or a solicitation of an offer to purchase securities in any jurisdiction where it would be illegal to do so.

Please visit www.franklinresources.com to be directed to your local Franklin Templeton website.
Copyright © 2015 Franklin Templeton Investments. All rights reserved.
franklintempletoninstitutonal.com
GMSWP_PERWP_0215