Embed Size (px)
Citation preview
© 2011 Graduate Management Admission Council®. All rights reserved. cGlobal ManaGeMent education Graduate Survey • 2011
2011Global Management Education Graduate SurveySurvey report
t h e G M a c ® S u r v e y S e r i e S
a b o u t t h i S S t u d y
The Global Management education Graduate
Survey is a product of the Graduate Management
Admission Council® (GMAC®), a global nonprofit
education organization of leading graduate business
schools and the owner of the Graduate Management
Admission Test® (GMAT®). The GMAT exam is an
important part of the admissions process for more than
5,000 graduate management programs around the
world. GMAC is dedicated to creating access to and
disseminating information about graduate management
education; these schools and others rely on the Council
as the premier provider of reliable data about the
graduate management education industry.
a c c o M pa n y i n G d ata
GMAC offers an interactive online data report to accompany
the findings presented in this 2011 Graduate Management
Education Graduate Survey Report. The comprehensive
interactive data report allows you to examine responses
for each of the various survey items. Schools that use the
GMAT exam as part of their admissions process can explore
the interactive data report through the GMAC research library
at gmac.com/GMacresearchlibrary (login required).
The interactive online report allows searching by program type.
Participating schools receive a special interactive data report
that allows them to view the responses by multiple demographic
levels such as gender, age, program type, citizenship,
residency, and more. Participating schools also can access
our new interactive online benchmark tool, which allows them
to select up to five different peer groups against which to
benchmark their programs. Information on how schools can
participate in this study can be found at the end of this report.
The icon at left appears throughout this report to indicate opportunities where readers may want
to consult the interactive report for more in-depth or customized data.
Technical Note: Our interactive reports require a minimum of Adobe® Flash Player 10.0 to run on your computer. You can obtain a free copy of the latest Adobe Flash Player from the following website: http://www.adobe.com/support/flashplayer/downloads.html.
c o n t e n t S
© 2011 Graduate Management Admission Council®. All rights reserved. 1Global ManaGeMent education Graduate Survey • 2011
2 i n t r o d u c t i o n
3 Key Findings
4 t h e e M p l o y M e n t r e p o r t
4 The Job Search
6 Employment Offers
8 Expected Changes in Salary
10 Employment Selection
15 Business Entrepreneurs
16 G r a d u at e b u S i n e S S e d u c at i o n e va l u at e d
16 Preparation for Employment
18 Development of Knowledge, Skills, and Abilities
20 Program Evaluation
20 Value of a Graduate Business Education
23 c o n c l u d i n G n o t e
23 Explore Interactive Data Report
23 Methodology
23 How to Participate in the Survey
24 c o n ta c t i n F o r M at i o n
24 Authorship
24 Acknowledgements
c o n t e n t S
2 © 2011 Graduate Management Admission Council®. All rights reserved. Global ManaGeMent education Graduate Survey • 2011
G r a d u at e b u S i n e S S e d u c at i o n e va l u at e di n t r o d u c t i o n
Each year for the past 12 years, the Graduate Management Admission Council® (GMAC®)
has conducted a survey of graduate management education students in their final year
of business school. This Global Management Education Graduate Survey is distributed
to students at participating business schools. The survey allows students to express their opinions
about their education, the value of their degrees, and what they intend to do with their degrees after
graduation, among other topics. GMAC also captures some post-graduation employment information
through the survey, although a complete jobs picture is not possible due to many respondents who
reported that they were continuing with a current employer, starting up their own businesses, or not
yet searching for a job.
This report explores the responses of 4,794 recent or soon-to-be graduates at 156 business schools worldwide. Responses from an additional 1,181 graduate management students who indicated they would be graduating in 2012 were collected in the study and will be supplied in the benchmark reports that their respective schools receive as a benefit of participation in the survey.
Indicative of graduate business education’s global reach, our 2011 survey drew responses from far and wide: 1,456 (35%) of survey respondents were citizens of countries other than the United States and 20 percent of respondents were attending schools outside the United States.
The graduate management program types represented in this analysis consist mainly of MBA programs, in which the vast majority of respondents (88%) were enrolled. Of this majority, 40 percent were enrolled in two-year full-time programs, 22 percent in one-year full-time programs (this includes all full-time programs with a duration of less than two years), 22 percent in part-time programs, 5 percent in executive programs, 4 percent in flexible programs, 4 percent in online/distance-learning programs, and 3 percent in joint-degree programs that include an MBA.
In addition, two categories of master’s business programs are included: quantitative master’s programs (accounting, economics, finance, and taxation) and qualitative master’s programs (management, international business, human resource management, marketing, project management, real estate, and business information technology). Among the 12 percent of non-MBA program respondents enrolled in master’s programs in business, 56 percent were students of quantitative master’s programs.
GMAC developed this survey to provide school administrators with information to help gauge what student needs are being met, what services students value most, and what services might yet present challenges and require market-wide improvements. Our hope is that student responses to the wide-ranging topics presented here will serve administrators by helping them improve their services, tailor programs to match student needs, and foster learning environments that allow students to make the most of their graduate business experiences. Graduates can look to these survey results to see how their opinions, preferences, and personal experiences with graduate business programs and the job market compare with those of their peers.
© 2011 Graduate Management Admission Council®. All rights reserved. 3Global ManaGeMent education Graduate Survey • 2011
Key Findings
Jobs Rebound
• The2011jobmarketforbusinessschoolgraduates has rebounded from 2010 levels. More than half (54%) of all graduate business students seeking employment had received at least one job offer by the time of the survey. Last year, only 32 percent had job offers.
• Thosewithjoboffersreceived2.0,onaverage,whichwas a slight increase compared with 2010 (1.8). New analysis of students receiving job offers revealed additional details about their job search efforts; for example, we learned they submitted nearly 16 resumes/applications and landed six job interviews, on average.
• StudentsattendingschoolsintheAsia-Pacificregionwere the most likely to have received a job offer (67%), followed by students at schools in the United States (54%).
Program Trends
• Animprovedjobmarketwasespeciallynoticeable for graduates surveyed from part-time MBA programs, for which 2011 set a record for the highest percentage of graduates (55%) with job offers in the past five years. This improvement for part-time MBA students is tempered by a lagging percentage increase in salary compared with graduates of other programs, however.
• Graduatesfromtwo-yearandone-yearfull-timeMBAprograms with job offers in hand expected to receive higher salaries than their counterparts from recent years. Salary increases for graduates of non-MBA master’s programs also surpassed those seen in 2010.
• Amajority(74%)ofexecutiveMBAprogram graduates intended to continue working for their current employers and only 10 percent were involved in the job search. Students in executive MBA programs were the only group to experience a decrease in the number of job offers per student this year compared with 2010; however, they were twice as likely as last year’s graduates to receive a job offer. Executive MBA programs also had the highest reported percentage of self-employed graduates (15.5%).
i n t r o d u c t i o n
Salary & Career Enhancements
• Onaverage,thosewhoplantoremainwiththeircurrent employer after graduation expect a 39 percent increase in salary. By industry, those with jobs in the products/services sector expect to increase their average salary by 59 percent.
• Besidesasalaryboost,classof2011graduatesexpectother enhancements in their employment situation such as an increase in responsibilities (44%), a promotion (35%), and a change in job title (30%).
Value of Graduate Management Education
• Althoughstudentsgraduatingfromeachprogramtype gave their education high marks, students enrolled in two-year full-time and executive MBA programs rated their programs more highly than all other students on nearly all measures.
• Studentsacrossallprogramtypescategorizedtheirexperience with their program as good to excellent, on average. Their responses show that nearly all program areas have experienced improvements over the past five years.
• Thevalueofgraduatebusinesseducationremainshigh: 92 percent of the class of 2011 rated the value of their education as outstanding, excellent, or good.
t h e e M p l o y M e n t r e p o r t
4 © 2011 Graduate Management Admission Council®. All rights reserved. Global ManaGeMent education Graduate Survey • 2011
The Employment Report
The results of this survey afford us an insider’s view of the progress students make in meeting the
goals they set before entering their graduate business program—namely, developing their career, increasing their knowledge, skills, and abilities, and improving their chances of obtaining challenging and interesting work.1
This section provides a detailed look at the job search experience of graduate management students in terms of offers of employment, expected changes in salary, and criteria they use when searching for work. It also offers information related to the class of 2011 career goals and key decisions in selecting an industry of employment or starting their own businesses.
The Job Search
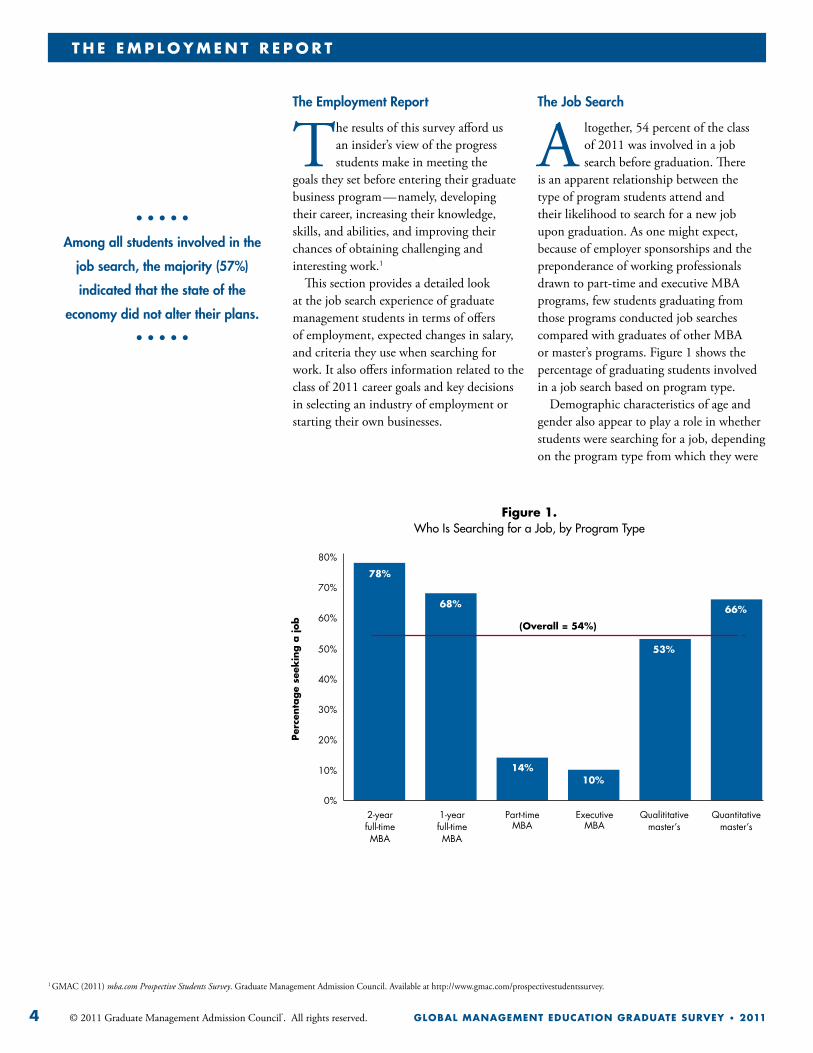
A ltogether, 54 percent of the class of 2011 was involved in a job search before graduation. There
is an apparent relationship between the type of program students attend and their likelihood to search for a new job upon graduation. As one might expect, because of employer sponsorships and the preponderance of working professionals drawn to part-time and executive MBA programs, few students graduating from those programs conducted job searches compared with graduates of other MBA or master’s programs. Figure 1 shows the percentage of graduating students involved in a job search based on program type.
Demographic characteristics of age and gender also appear to play a role in whether students were searching for a job, depending on the program type from which they were
1 GMAC (2011) mba.com Prospective Students Survey. Graduate Management Admission Council. Available at http://www.gmac.com/prospectivestudentssurvey.
Figure 1. Who Is Searching for a Job, by Program Type
0%
10%
20%
30%
40%
50%
60%
70%
80%
2-year full-time MBA
1-year full-time MBA
Part-time MBA
Qualititative master’s
Quantitative master’s
Executive MBA
78%
68%
(Overall = 54%)
14%10%
53%
66%
Per
centa
ge
seek
ing a
job
• • • • •
Among all students involved in the
job search, the majority (57%)
indicated that the state of the
economy did not alter their plans.
• • • • •
t h e e M p l o y M e n t r e p o r t
© 2011 Graduate Management Admission Council®. All rights reserved. 5Global ManaGeMent education Graduate Survey • 2011
graduating. For example, our analysis of two-year full-time MBA programs finds that students ages 24 to 30 (82%) were more likely than either younger (70%) or older students (68%) to be seeking employment.
School location also seems to be a factor in job search variations. Students attending schoolsintheAsia-Pacificregionwerethe most likely to be seeking employment (72%), followed by students in European schools (62%), US schools (52%), and Canadian schools (51%). Gender differences were only significant in Europe and the United States. In Europe, men (66%) were more likely than women (53%) to be searching for a job. Similarly, in the United States, men (56%) were more likely than women (50%) to be searching for a job.
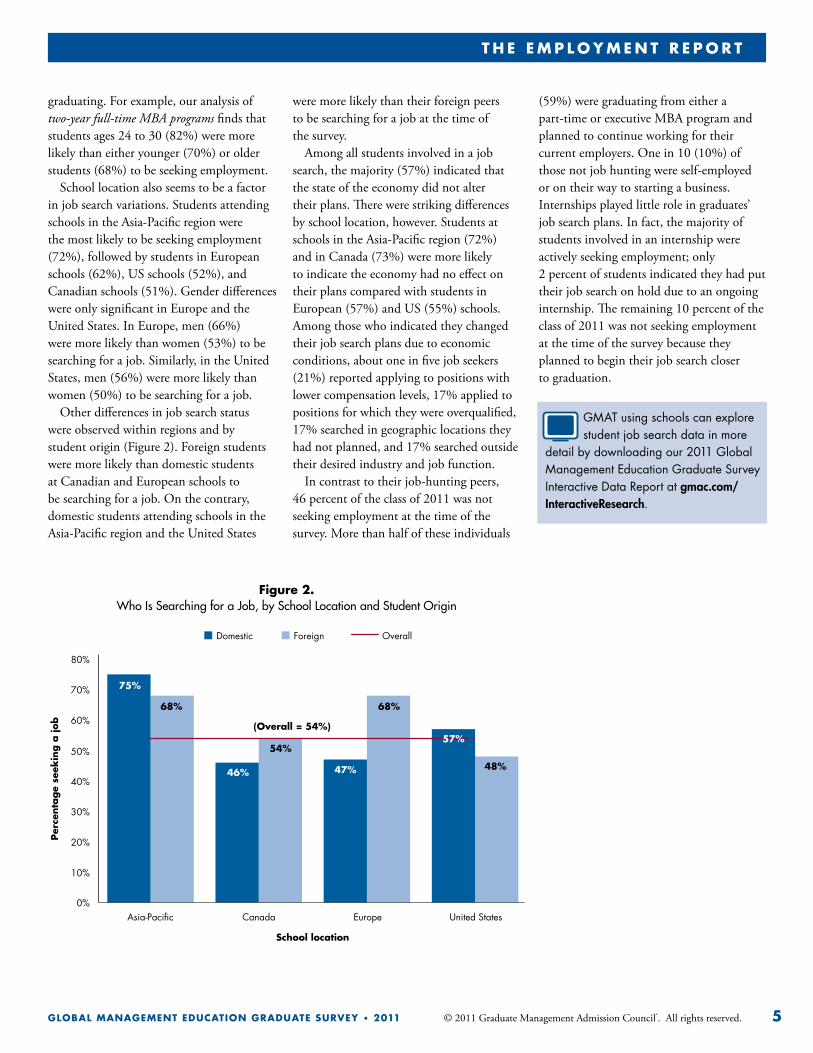
Other differences in job search status were observed within regions and by student origin (Figure 2). Foreign students were more likely than domestic students at Canadian and European schools to be searching for a job. On the contrary, domestic students attending schools in the Asia-PacificregionandtheUnitedStates
were more likely than their foreign peers to be searching for a job at the time of the survey.
Among all students involved in a job search, the majority (57%) indicated that the state of the economy did not alter their plans. There were striking differences by school location, however. Students at schoolsintheAsia-Pacificregion(72%)and in Canada (73%) were more likely to indicate the economy had no effect on their plans compared with students in European (57%) and US (55%) schools. Among those who indicated they changed their job search plans due to economic conditions, about one in five job seekers (21%) reported applying to positions with lower compensation levels, 17% applied to positions for which they were overqualified, 17% searched in geographic locations they had not planned, and 17% searched outside their desired industry and job function.
In contrast to their job-hunting peers, 46 percent of the class of 2011 was not seeking employment at the time of the survey. More than half of these individuals
Figure 2. Who Is Searching for a Job, by School Location and Student Origin
0%
10%
20%
30%
40%
50%
60%
70%
80%
Asia-Pacific Canada United StatesEurope
75%
68%
46%
54%
47%
68%
48%
(Overall = 54%)
Per
centa
ge
seek
ing a
job
School location
57%
Domestic Foreign Overall
(59%) were graduating from either a part-time or executive MBA program and planned to continue working for their current employers. One in 10 (10%) of those not job hunting were self-employed or on their way to starting a business. Internships played little role in graduates’ job search plans. In fact, the majority of students involved in an internship were actively seeking employment; only 2 percent of students indicated they had put their job search on hold due to an ongoing internship. The remaining 10 percent of the class of 2011 was not seeking employment at the time of the survey because they planned to begin their job search closer to graduation.
GMAT using schools can explore student job search data in more
detail by downloading our 2011 Global Management Education Graduate Survey Interactive Data Report at gmac.com/InteractiveResearch.
t h e e M p l o y M e n t r e p o r t
6 © 2011 Graduate Management Admission Council®. All rights reserved. Global ManaGeMent education Graduate Survey • 2011
• • • • •
Students in the Asia-Pacific region
were the most likely to have received
a job offer (67%), followed by students
at schools in the United States (54%),
Europe (46%), and Canada (37%).
• • • • •
Employment Offers
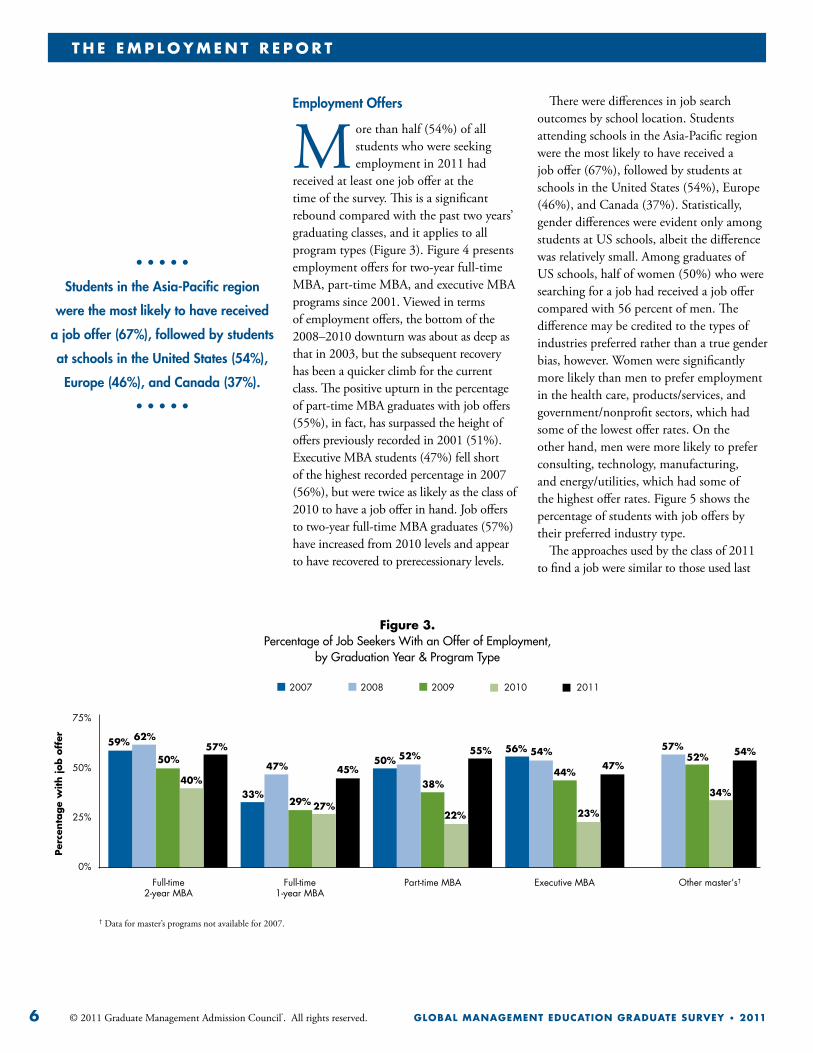
More than half (54%) of all students who were seeking employment in 2011 had
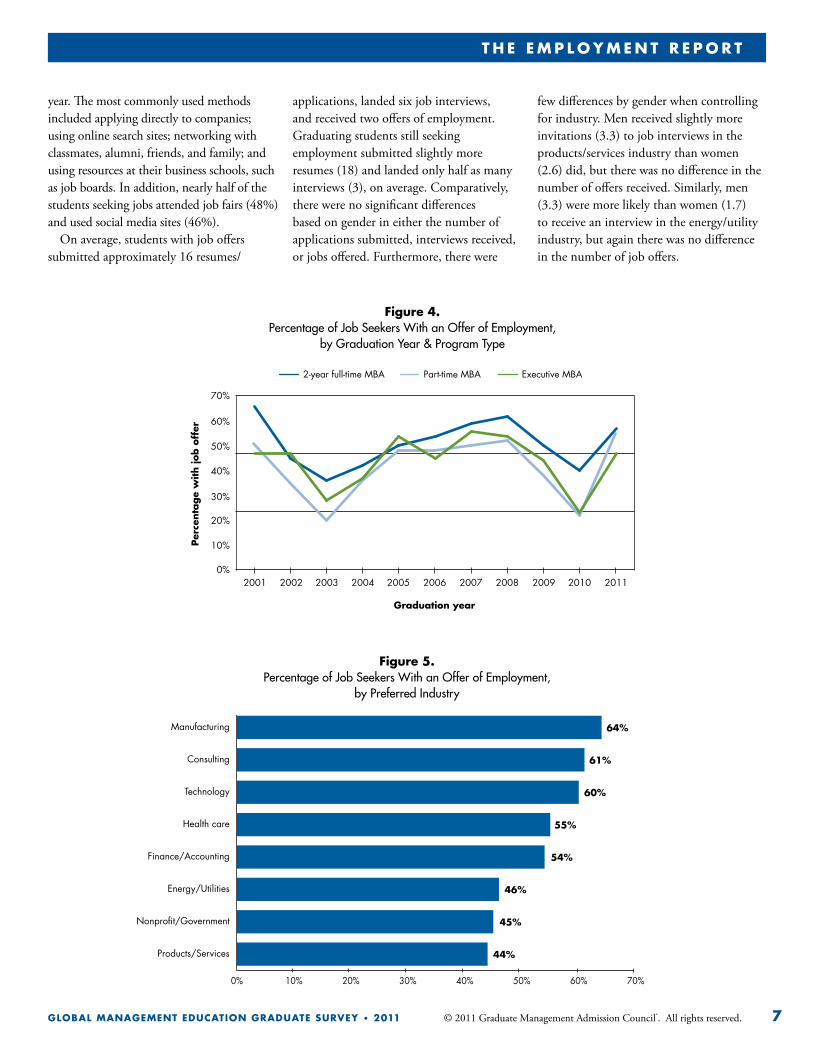
received at least one job offer at the time of the survey. This is a significant rebound compared with the past two years’ graduating classes, and it applies to all program types (Figure 3). Figure 4 presents employment offers for two-year full-time MBA, part-time MBA, and executive MBA programs since 2001. Viewed in terms of employment offers, the bottom of the 2008–2010 downturn was about as deep as that in 2003, but the subsequent recovery has been a quicker climb for the current class. The positive upturn in the percentage of part-time MBA graduates with job offers (55%), in fact, has surpassed the height of offers previously recorded in 2001 (51%). Executive MBA students (47%) fell short of the highest recorded percentage in 2007 (56%), but were twice as likely as the class of 2010 to have a job offer in hand. Job offers to two-year full-time MBA graduates (57%) have increased from 2010 levels and appear to have recovered to prerecessionary levels.
There were differences in job search outcomes by school location. Students attendingschoolsintheAsia-Pacificregionwere the most likely to have received a job offer (67%), followed by students at schools in the United States (54%), Europe (46%), and Canada (37%). Statistically, gender differences were evident only among students at US schools, albeit the difference was relatively small. Among graduates of US schools, half of women (50%) who were searching for a job had received a job offer compared with 56 percent of men. The difference may be credited to the types of industries preferred rather than a true gender bias, however. Women were significantly more likely than men to prefer employment in the health care, products/services, and government/nonprofit sectors, which had some of the lowest offer rates. On the other hand, men were more likely to prefer consulting, technology, manufacturing, and energy/utilities, which had some of the highest offer rates. Figure 5 shows the percentage of students with job offers by their preferred industry type.
The approaches used by the class of 2011 to find a job were similar to those used last
Figure 3. Percentage of Job Seekers With an Offer of Employment,
by Graduation Year & Program Type
0%
25%
50%
75%
Full-time 2-year MBA
Full-time 1-year MBA
Part-time MBA Executive MBA Other master‘s†
59% 62%
50%
40%
57%
33%
47%
29% 27%
45%50% 52%
38%
22%
56% 54%
44%
23%
57%52%
34%
2007 2008 2009 2010 2011
† Data for master’s programs not available for 2007.
Per
centa
ge
with jo
b o
ffer
55%47%
54%
t h e e M p l o y M e n t r e p o r t
© 2011 Graduate Management Admission Council®. All rights reserved. 7Global ManaGeMent education Graduate Survey • 2011
year. The most commonly used methods included applying directly to companies; using online search sites; networking with classmates, alumni, friends, and family; and using resources at their business schools, such as job boards. In addition, nearly half of the students seeking jobs attended job fairs (48%) and used social media sites (46%).
On average, students with job offers submitted approximately 16 resumes/
Figure 5. Percentage of Job Seekers With an Offer of Employment,
by Preferred Industry
0% 10% 20% 30% 40% 50% 60% 70%
Manufacturing
Consulting
Technology
Health care
Finance/Accounting
Energy/Utilities
Nonprofit/Government
Products/Services 44%
45%
46%
54%
55%
60%
61%
64%
Figure 4. Percentage of Job Seekers With an Offer of Employment,
by Graduation Year & Program Type
0%
10%
20%
30%
40%
50%
60%
70%
20042003 2005 2006 2009 20072002 2001 2011 2010 2008
2-year full-time MBA Part-time MBA Executive MBA
Graduation year
Per
centa
ge
with jo
b o
ffer
applications, landed six job interviews, and received two offers of employment. Graduating students still seeking employment submitted slightly more resumes (18) and landed only half as many interviews (3), on average. Comparatively, there were no significant differences based on gender in either the number of applications submitted, interviews received, or jobs offered. Furthermore, there were
few differences by gender when controlling for industry. Men received slightly more invitations (3.3) to job interviews in the products/services industry than women (2.6) did, but there was no difference in the number of offers received. Similarly, men (3.3) were more likely than women (1.7) to receive an interview in the energy/utility industry, but again there was no difference in the number of job offers.
t h e e M p l o y M e n t r e p o r t
8 © 2011 Graduate Management Admission Council®. All rights reserved. Global ManaGeMent education Graduate Survey • 2011
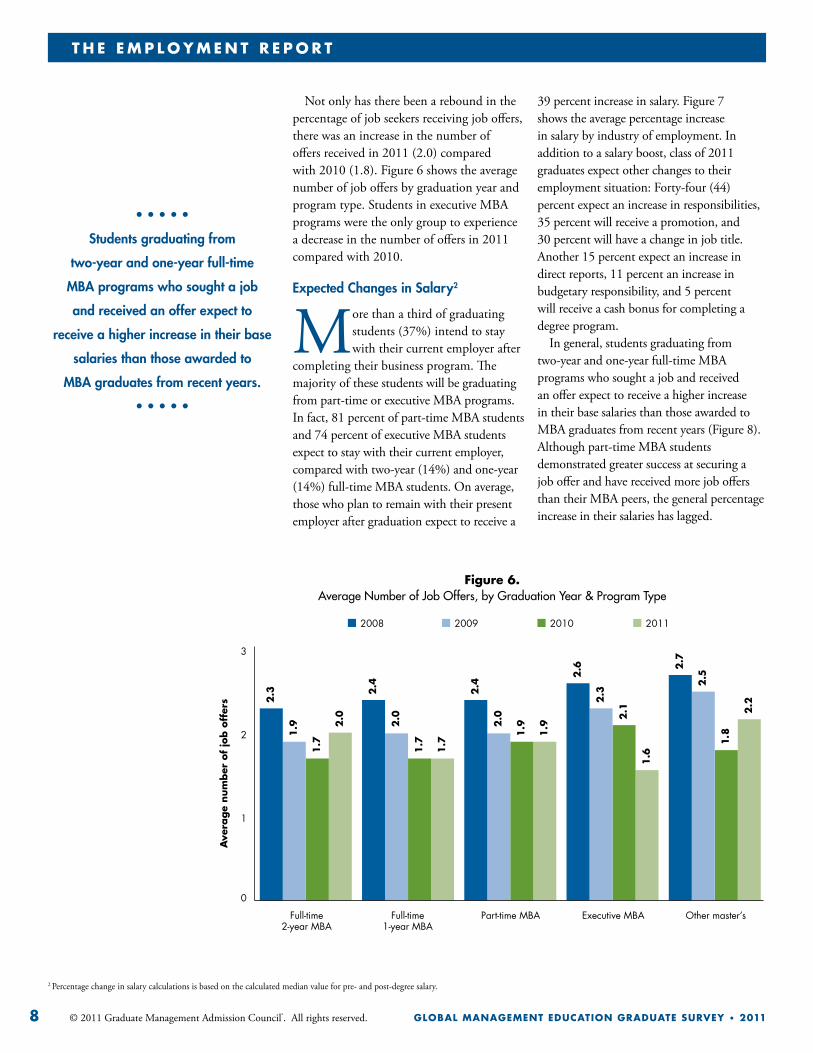
Not only has there been a rebound in the percentage of job seekers receiving job offers, there was an increase in the number of offers received in 2011 (2.0) compared with 2010 (1.8). Figure 6 shows the average number of job offers by graduation year and program type. Students in executive MBA programs were the only group to experience a decrease in the number of offers in 2011 compared with 2010.
Expected Changes in Salary2
More than a third of graduating students (37%) intend to stay with their current employer after
completing their business program. The majority of these students will be graduating from part-time or executive MBA programs. In fact, 81 percent of part-time MBA students and 74 percent of executive MBA students expect to stay with their current employer, compared with two-year (14%) and one-year (14%) full-time MBA students. On average, those who plan to remain with their present employer after graduation expect to receive a
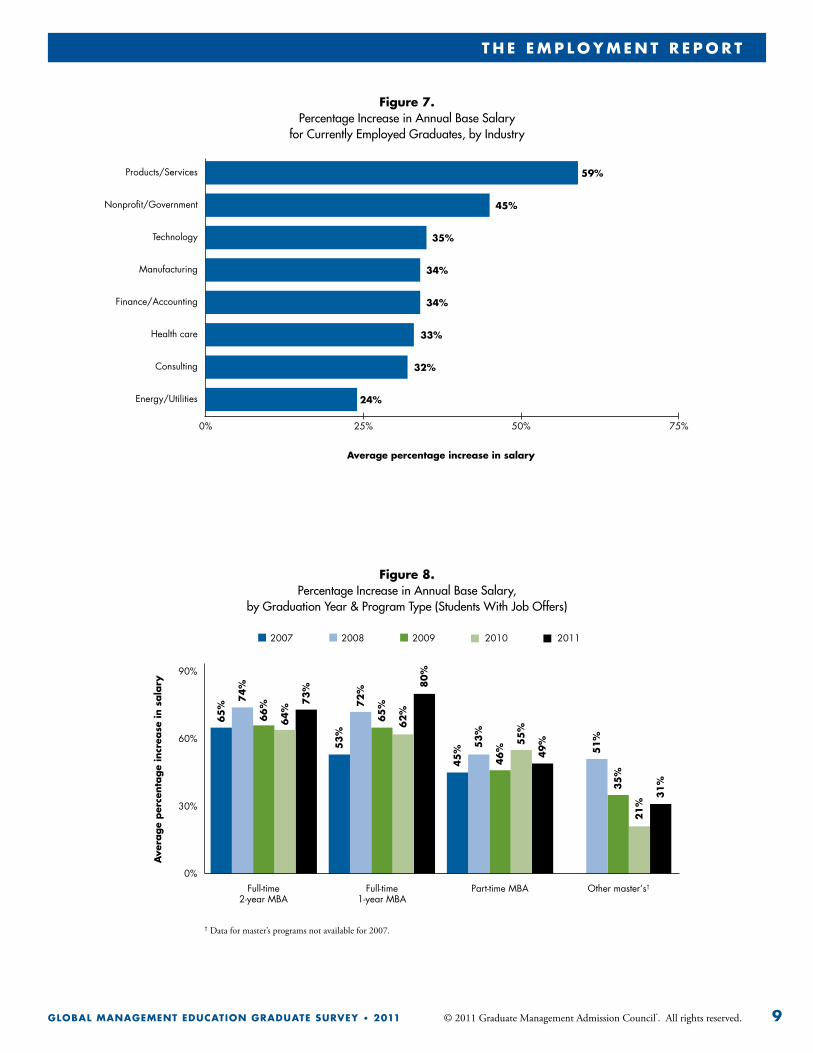
39 percent increase in salary. Figure 7 shows the average percentage increase in salary by industry of employment. In addition to a salary boost, class of 2011 graduates expect other changes to their employment situation: Forty-four (44) percent expect an increase in responsibilities, 35 percent will receive a promotion, and 30 percent will have a change in job title. Another 15 percent expect an increase in direct reports, 11 percent an increase in budgetary responsibility, and 5 percent will receive a cash bonus for completing a degree program.
In general, students graduating from two-year and one-year full-time MBA programs who sought a job and received an offer expect to receive a higher increase in their base salaries than those awarded to MBA graduates from recent years (Figure 8). Although part-time MBA students demonstrated greater success at securing a job offer and have received more job offers than their MBA peers, the general percentage increase in their salaries has lagged.
Figure 6. Average Number of Job Offers, by Graduation Year & Program Type
0
1
2
3
Full-time 2-year MBA
Part-time MBAFull-time 1-year MBA
Executive MBA Other master’s
2008 2009 2010 2011
2.3
1.9
1.7
2.0
2.4
2.0
1.7
1.7
2.4
2.0
1.9
1.9
2.6
2.3
2.1
1.6
2.5
2.7
1.8
2.2
Ave
rage
num
ber
of
job o
ffer
s• • • • •
Students graduating from
two-year and one-year full-time
MBA programs who sought a job
and received an offer expect to
receive a higher increase in their base
salaries than those awarded to
MBA graduates from recent years.
• • • • •
2 Percentagechangeinsalarycalculationsisbasedonthecalculatedmedianvalueforpre-andpost-degreesalary.
t h e e M p l o y M e n t r e p o r t
© 2011 Graduate Management Admission Council®. All rights reserved. 9Global ManaGeMent education Graduate Survey • 2011
Figure 7. Percentage Increase in Annual Base Salary
for Currently Employed Graduates, by Industry
Figure 8. Percentage Increase in Annual Base Salary,
by Graduation Year & Program Type (Students With Job Offers)
0% 25% 50% 75%
Products/Services
Nonprofit/Government
Technology
Manufacturing
Finance/Accounting
Health care
Consulting
Energy/Utilities 24%
32%
33%
34%
34%
35%
45%
59%
Average percentage increase in salary
0%
30%
60%
90%
Full-time 2-year MBA
Full-time 1-year MBA
Part-time MBA Other master‘s†
65
%
74
%
66%
64%
73
%
53
%
72
%
65%
62
%
80
%
45
% 53
%
46
%
55
%
49
%
51
%
35
%
21
%
31
%
2007 2008 2009 2010 2011
† Data for master’s programs not available for 2007.
Ave
rage
per
centa
ge
incr
ease
in s
ala
ry
t h e e M p l o y M e n t r e p o r t
10 © 2011 Graduate Management Admission Council®. All rights reserved. Global ManaGeMent education Graduate Survey • 2011
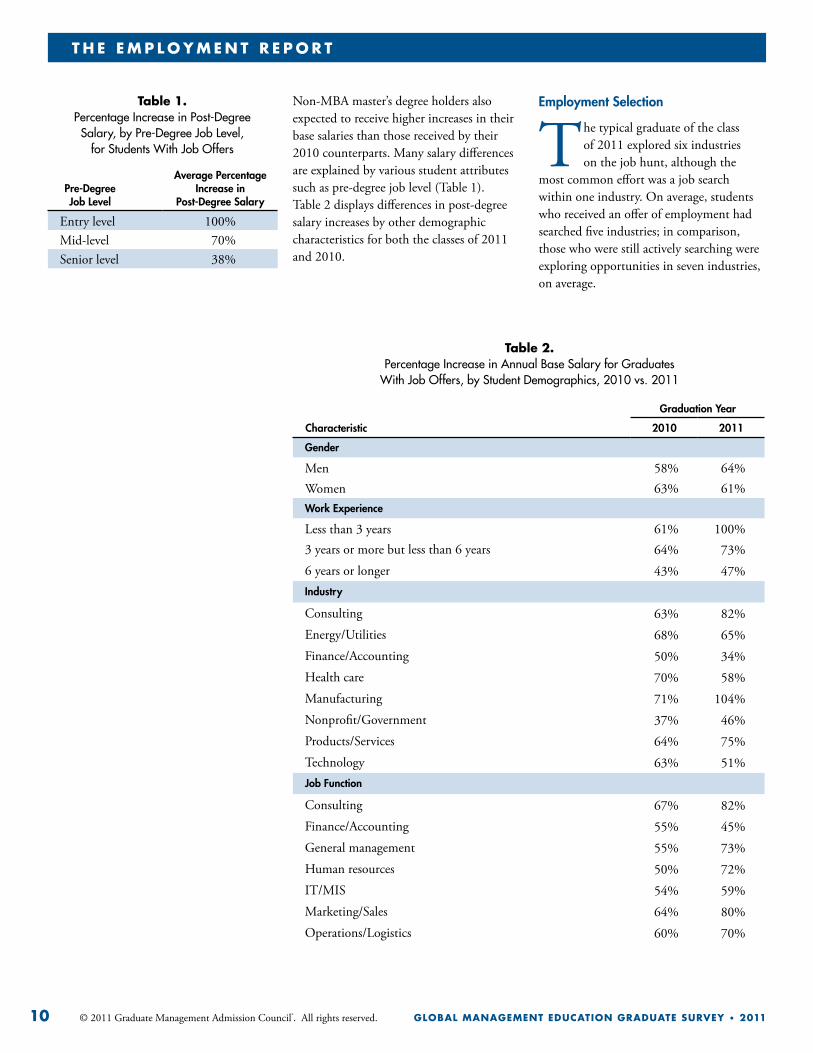
Non-MBA master’s degree holders also expected to receive higher increases in their base salaries than those received by their 2010 counterparts. Many salary differences are explained by various student attributes such as pre-degree job level (Table 1). Table 2 displays differences in post-degree salary increases by other demographic characteristics for both the classes of 2011 and 2010.
table 1. Percentage Increase in Post-Degree Salary, by Pre-Degree Job Level,
for Students With Job Offers
Pre-Degree Job Level
Average Percentage Increase in
Post-Degree Salary
Entry level 100%Mid-level 70%Senior level 38%
table 2. Percentage Increase in Annual Base Salary for Graduates
With Job Offers, by Student Demographics, 2010 vs. 2011
Graduation Year
Characteristic 2010 2011
Gender
Men 58% 64%Women 63% 61%Work Experience
Less than 3 years 61% 100%3 years or more but less than 6 years 64% 73%6 years or longer 43% 47%Industry
Consulting 63% 82%Energy/Utilities 68% 65%Finance/Accounting 50% 34%Health care 70% 58%Manufacturing 71% 104%Nonprofit/Government 37% 46%Products/Services 64% 75%Technology 63% 51%Job Function
Consulting 67% 82%Finance/Accounting 55% 45%General management 55% 73%Human resources 50% 72%IT/MIS 54% 59%Marketing/Sales 64% 80%Operations/Logistics 60% 70%
Employment Selection
The typical graduate of the class of 2011 explored six industries on the job hunt, although the
most common effort was a job search within one industry. On average, students who received an offer of employment had searched five industries; in comparison, those who were still actively searching were exploring opportunities in seven industries, on average.
t h e e M p l o y M e n t r e p o r t
© 2011 Graduate Management Admission Council®. All rights reserved. 11Global ManaGeMent education Graduate Survey • 2011
• • • • •
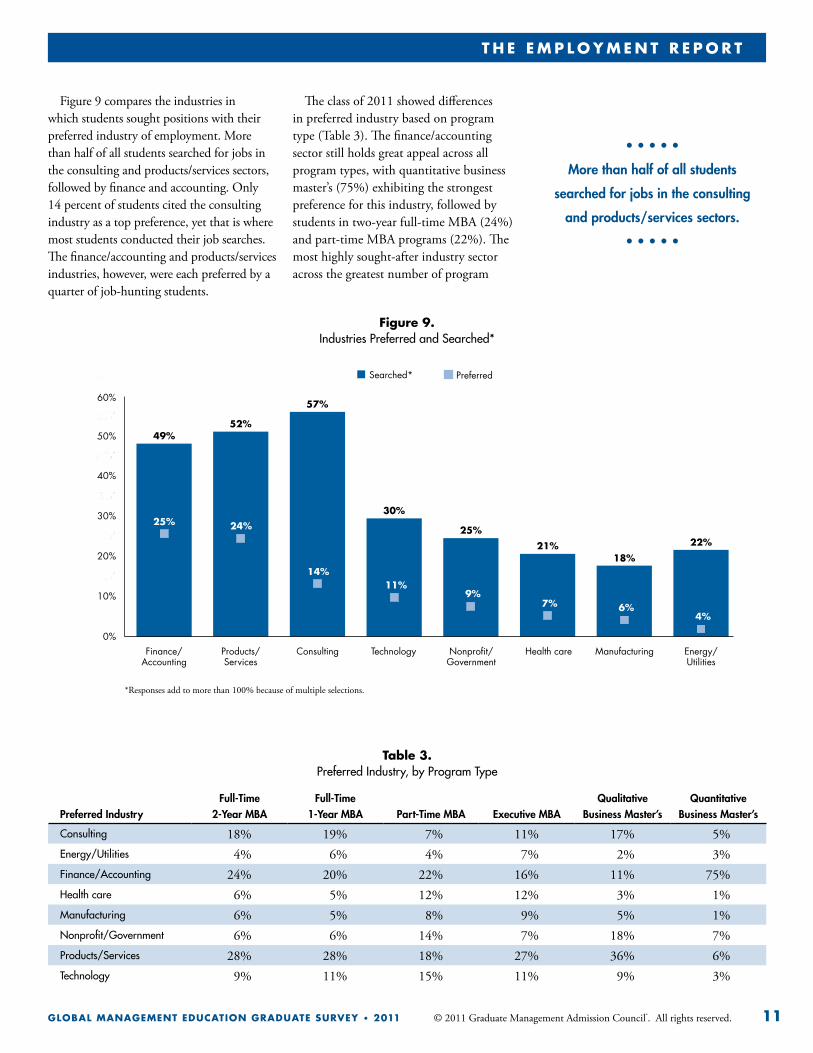
More than half of all students
searched for jobs in the consulting
and products/services sectors.
• • • • •
Figure 9. Industries Preferred and Searched*
0%
10%
20%
30%
40%
50%
60%
0%
10%
20%
30%
40%
50%
60%
Nonprofit/ Government
TechnologyConsulting Energy/ Utilities
ManufacturingHealth careProducts/ Services
Finance/ Accounting
Searched* Preferred
49%52%
57%
30%
25%
21%18%
22%
25% 24%
14%11%
9%7% 6%
4%
*Responses add to more than 100% because of multiple selections.
table 3. Preferred Industry, by Program Type
Preferred IndustryFull-Time
2-Year MBAFull-Time
1-Year MBA Part-Time MBA Executive MBAQualitative
Business Master’sQuantitative
Business Master’s
Consulting 18% 19% 7% 11% 17% 5%Energy/Utilities 4% 6% 4% 7% 2% 3%Finance/Accounting 24% 20% 22% 16% 11% 75%Health care 6% 5% 12% 12% 3% 1%Manufacturing 6% 5% 8% 9% 5% 1%Nonprofit/Government 6% 6% 14% 7% 18% 7%Products/Services 28% 28% 18% 27% 36% 6%Technology 9% 11% 15% 11% 9% 3%
Figure 9 compares the industries in which students sought positions with their preferred industry of employment. More than half of all students searched for jobs in the consulting and products/services sectors, followed by finance and accounting. Only 14 percent of students cited the consulting industry as a top preference, yet that is where most students conducted their job searches. The finance/accounting and products/services industries, however, were each preferred by a quarter of job-hunting students.
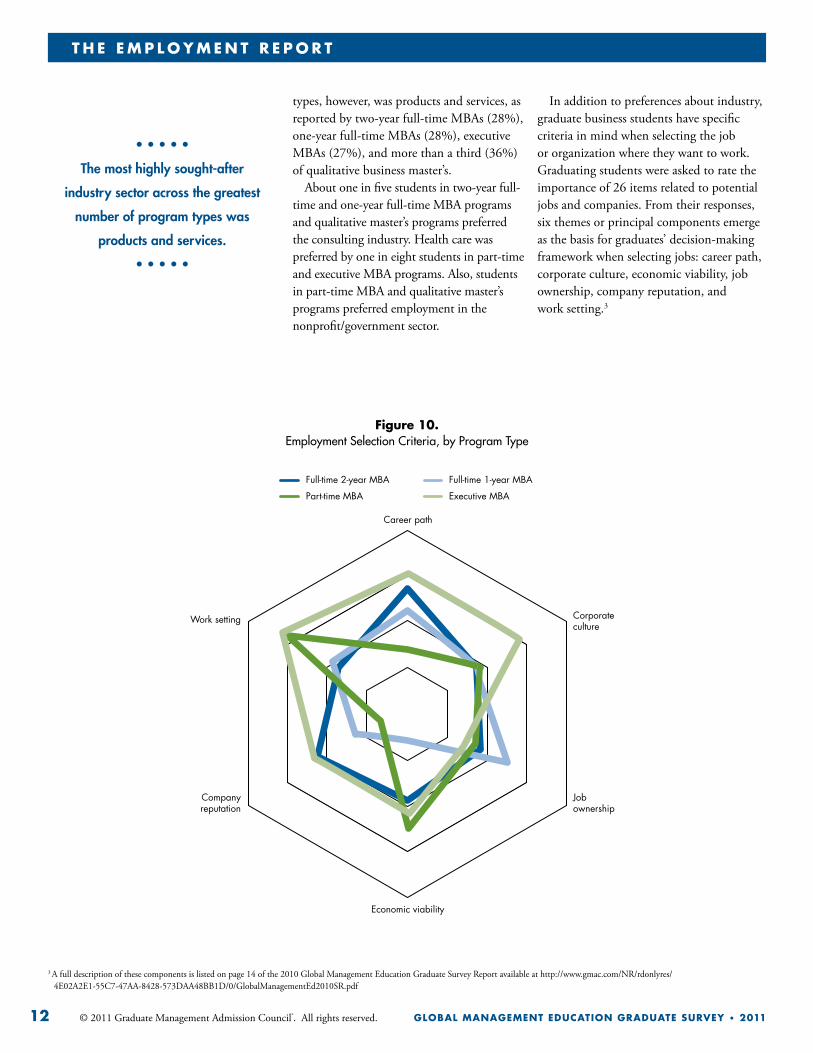
The class of 2011 showed differences in preferred industry based on program type (Table 3). The finance/accounting sector still holds great appeal across all program types, with quantitative business master’s (75%) exhibiting the strongest preference for this industry, followed by students in two-year full-time MBA (24%) and part-time MBA programs (22%). The most highly sought-after industry sector across the greatest number of program
t h e e M p l o y M e n t r e p o r t
12 © 2011 Graduate Management Admission Council®. All rights reserved. Global ManaGeMent education Graduate Survey • 2011
types, however, was products and services, as reported by two-year full-time MBAs (28%), one-year full-time MBAs (28%), executive MBAs (27%), and more than a third (36%) of qualitative business master’s.
About one in five students in two-year full-time and one-year full-time MBA programs and qualitative master’s programs preferred the consulting industry. Health care was preferred by one in eight students in part-time and executive MBA programs. Also, students in part-time MBA and qualitative master’s programs preferred employment in the nonprofit/government sector.
• • • • •
The most highly sought-after
industry sector across the greatest
number of program types was
products and services.
• • • • •
3 A full description of these components is listed on page 14 of the 2010 Global Management Education Graduate Survey Report available at http://www.gmac.com/NR/rdonlyres/ 4E02A2E1-55C7-47AA-8428-573DAA48BB1D/0/GlobalManagementEd2010SR.pdf
Figure 10. Employment Selection Criteria, by Program Type
Career path
Corporate culture
Job ownership
Economic viability
Companyreputation
Work setting
Full-time 2-year MBA Full-time 1-year MBA
Part-time MBA Executive MBA
In addition to preferences about industry, graduate business students have specific criteria in mind when selecting the job or organization where they want to work. Graduating students were asked to rate the importance of 26 items related to potential jobs and companies. From their responses, six themes or principal components emerge as the basis for graduates’ decision-making framework when selecting jobs: career path, corporate culture, economic viability, job ownership, company reputation, and work setting.3
t h e e M p l o y M e n t r e p o r t
© 2011 Graduate Management Admission Council®. All rights reserved. 13Global ManaGeMent education Graduate Survey • 2011
Our analysis shows that the same themes or components emerged as most important for both the class of 2011 and the class of 2010 when selecting jobs.4 For both years, similar preference patterns appeared by gender showing that men value career path and job ownership. Women, on the other hand, regard corporate culture, work setting, and economic viability of the organization more important when they selected a job.
Figure 10 shows how the six job selection criteria vary in level of importance based on respondents’ program type. As shown, company reputation was more important
Career path
Corporate culture
Job ownership
Economic viability
Companyreputation
Work setting
Asia-Pacific Canada
Europe United States
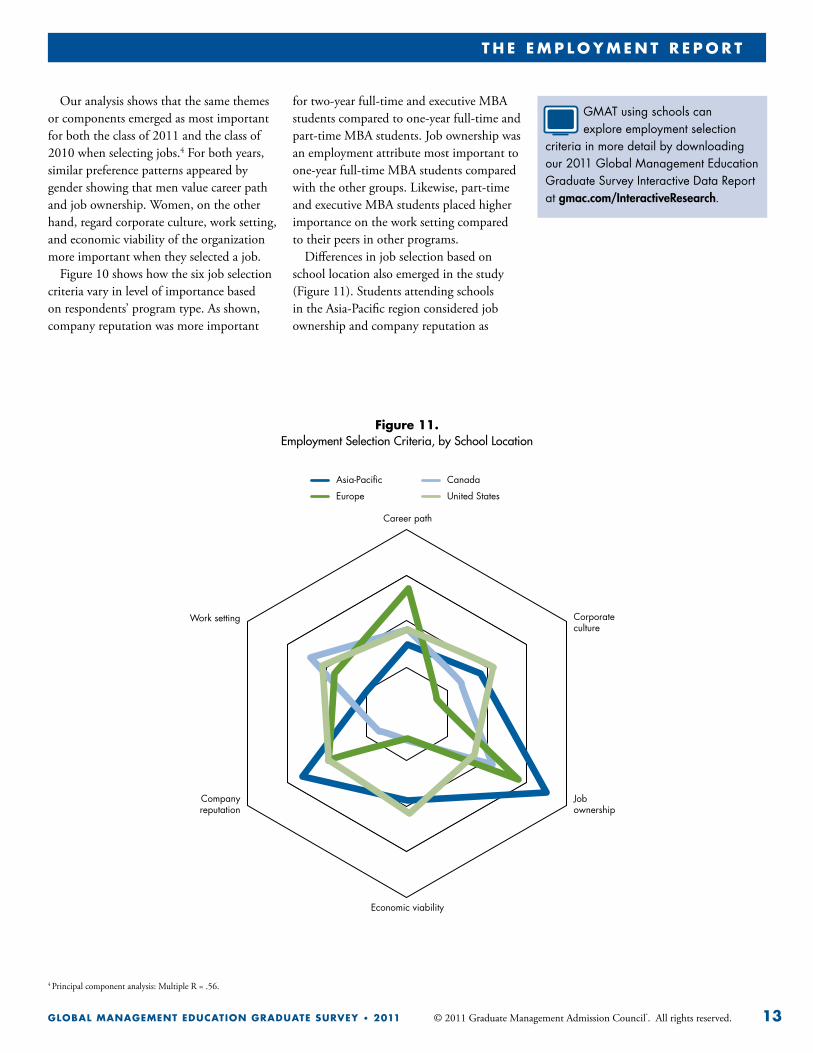
Figure 11. Employment Selection Criteria, by School Location
GMAT using schools can explore employment selection
criteria in more detail by downloading our 2011 Global Management Education Graduate Survey Interactive Data Report at gmac.com/InteractiveResearch.
for two-year full-time and executive MBA students compared to one-year full-time and part-time MBA students. Job ownership was an employment attribute most important to one-year full-time MBA students compared with the other groups. Likewise, part-time and executive MBA students placed higher importance on the work setting compared to their peers in other programs.
Differences in job selection based on school location also emerged in the study (Figure 11). Students attending schools intheAsia-Pacificregionconsideredjobownership and company reputation as
4 Principalcomponentanalysis:MultipleR=.56.

t h e e M p l o y M e n t r e p o r t
14 © 2011 Graduate Management Admission Council®. All rights reserved. Global ManaGeMent education Graduate Survey • 2011
the most important job selection criteria. Respondents in Europe indicated that job ownership and career path were most important. In Canada, students’ top two job criteria were work setting and job ownership. Analysis for US schools shows a relatively flat picture with no specific criteria standing out as important. This may be due to the diversity of US business program types represented in the survey responses. For instance, most survey respondents from outside the United States reported from one-year full-time MBA programs; whereas larger numbers of survey respondents located within the United States represented two-year full-time, part-time, and executive MBA programs.
At the organizational level, class of 2011 graduates have definite preferences when it comes to describing their preferred corporate cultures. The majority of students seek work settings characterized by the following profile: • Decentralizeddecisionmaking• Cooperativeatmosphere• Flexiblecareeropportunities• Informalatmosphere• Clearlydefinedresponsibilities• Formalizedprocedures• Aclearandwell-communicated
corporate vision• Afocusoncompanysuccess• Individualperformance-basedrewards
Characteristic Percentage
Gender
Men 5.3%Women 3.7%Age
Younger than 24 2.6%24 to 30 3.7%31 and older 6.2%Citizenship
Asia-Pacific 5.0%Europe 8.0%Canada 7.3%United States 3.8%Program Type
Two-year full-time MBA 3.9%One-year full-time MBA 5.2%Part-timeMBA 3.9%Executive MBA 15.5%
table 4. Profile of Business Entrepreneurs
• • • • •
Overall, 5 percent of students
intend to go into business for
themselves upon graduation.
• • • • •
t h e e M p l o y M e n t r e p o r t
© 2011 Graduate Management Admission Council®. All rights reserved. 15Global ManaGeMent education Graduate Survey • 2011
Although survey respondents reported some degree of difference in preferred work culture based on gender, age, school location, and citizenship, the general direction for each demographic group is similar to the overall cultural profile cited.
Business Entrepreneurs
Overall, 5 percent of students intend to go into business for themselves upon graduation. Compared with other students, those considering starting a business had significantly higher scores on the individual innovativeness scale5 for their comfort with change and likelihood of accepting innovative ideas. In fact, 31 percent of the self-employed were classified as innovators compared with 21 percent of all other
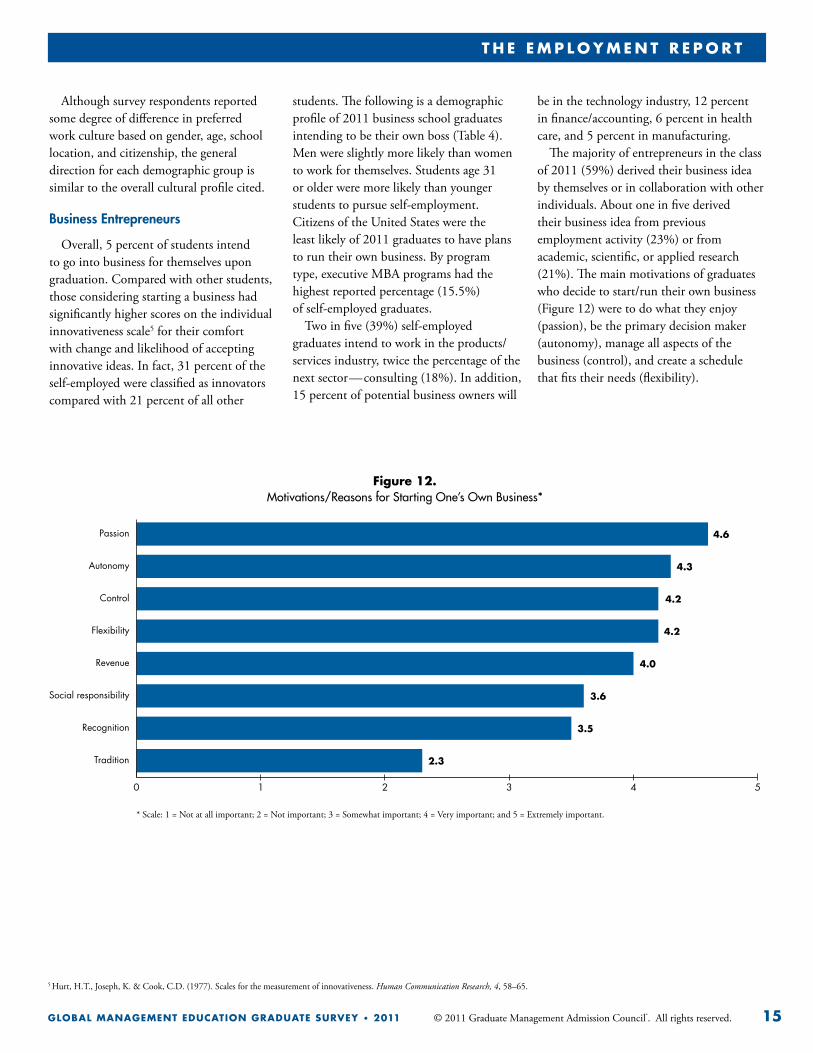
Figure 12. Motivations/Reasons for Starting One’s Own Business*
0 1 2 3 4 5
Passion
Autonomy
Control
Flexibility
Revenue
Social responsibility
Recognition
Tradition 2.3
3.5
3.6
4.0
4.2
4.2
4.3
4.6
* Scale: 1 = Not at all important; 2 = Not important; 3 = Somewhat important; 4 = Very important; and 5 = Extremely important.
students. The following is a demographic profile of 2011 business school graduates intending to be their own boss (Table 4). Men were slightly more likely than women to work for themselves. Students age 31 or older were more likely than younger students to pursue self-employment. Citizens of the United States were the least likely of 2011 graduates to have plans to run their own business. By program type, executive MBA programs had the highest reported percentage (15.5%) of self-employed graduates.
Two in five (39%) self-employed graduates intend to work in the products/services industry, twice the percentage of the next sector—consulting (18%). In addition, 15 percent of potential business owners will
be in the technology industry, 12 percent in finance/accounting, 6 percent in health care, and 5 percent in manufacturing.
The majority of entrepreneurs in the class of 2011 (59%) derived their business idea by themselves or in collaboration with other individuals. About one in five derived their business idea from previous employment activity (23%) or from academic, scientific, or applied research (21%). The main motivations of graduates who decide to start/run their own business (Figure 12) were to do what they enjoy (passion), be the primary decision maker (autonomy), manage all aspects of the business (control), and create a schedule that fits their needs (flexibility).
5 Hurt, H.T., Joseph, K. & Cook, C.D. (1977). Scales for the measurement of innovativeness. Human Communication Research, 4, 58–65.
16 © 2011 Graduate Management Admission Council®. All rights reserved. Global ManaGeMent education Graduate Survey • 2011
G r a d u at e b u S i n e S S e d u c at i o n e va l u at e d
Graduate Business Education Evaluated
This is the student satisfaction segment of our survey in which respondents candidly evaluated
how well their graduate business programs helped prepare them for employment. Graduates shared their thoughts on how job-ready they feel—whether their courses and programs enabled them to develop their knowledge, skills, and abilities to their own personal satisfaction and at a level to satisfy marketplace requirements. Students evaluated various school services, how significant a relationship they found between co-curricular activities and job search outcomes, and for those considering business start-ups, how well their education helped with business development skills. Finally, they told us how satisfied they were with their overall graduate management education.
Preparation for Employment
Students continue to give high marks to graduate business programs’ ability to prepare them for employment. The
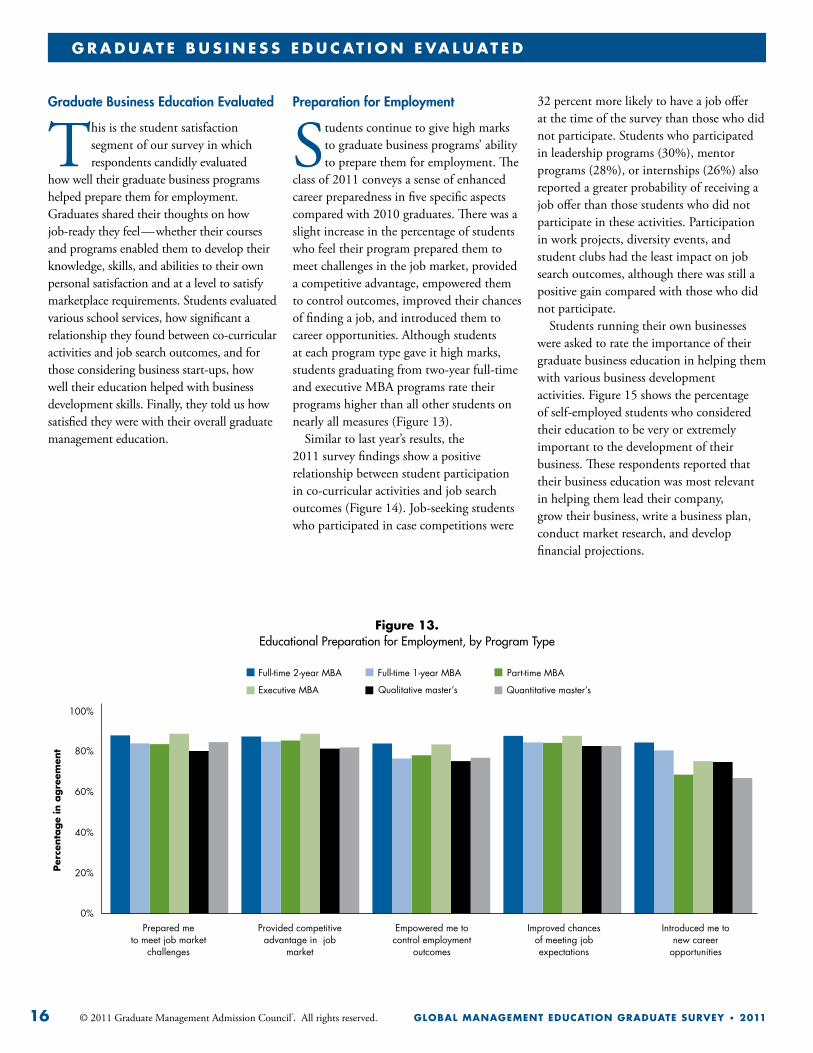
class of 2011 conveys a sense of enhanced career preparedness in five specific aspects compared with 2010 graduates. There was a slight increase in the percentage of students who feel their program prepared them to meet challenges in the job market, provided a competitive advantage, empowered them to control outcomes, improved their chances of finding a job, and introduced them to career opportunities. Although students at each program type gave it high marks, students graduating from two-year full-time and executive MBA programs rate their programs higher than all other students on nearly all measures (Figure 13).
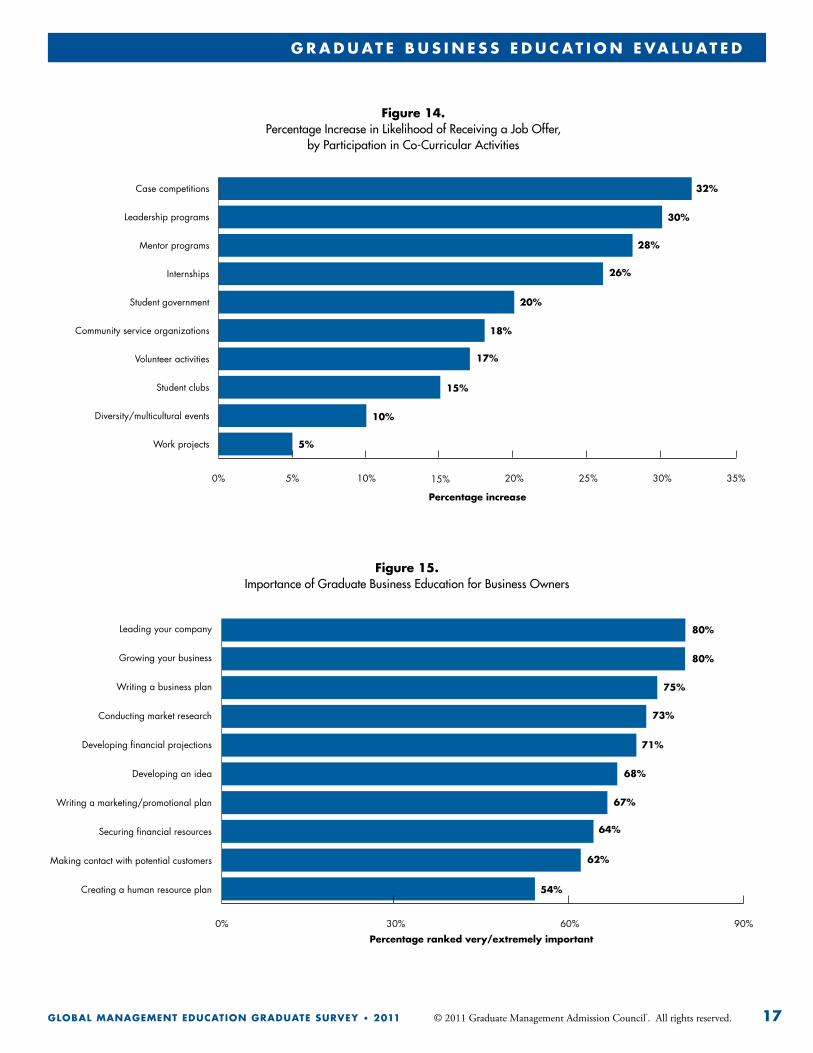
Similar to last year’s results, the 2011 survey findings show a positive relationship between student participation in co-curricular activities and job search outcomes (Figure 14). Job-seeking students who participated in case competitions were
32 percent more likely to have a job offer at the time of the survey than those who did not participate. Students who participated in leadership programs (30%), mentor programs (28%), or internships (26%) also reported a greater probability of receiving a job offer than those students who did not participateintheseactivities.Participationin work projects, diversity events, and student clubs had the least impact on job search outcomes, although there was still a positive gain compared with those who did not participate.
Students running their own businesses were asked to rate the importance of their graduate business education in helping them with various business development activities. Figure 15 shows the percentage of self-employed students who considered their education to be very or extremely important to the development of their business. These respondents reported that their business education was most relevant in helping them lead their company, grow their business, write a business plan, conduct market research, and develop financial projections.
Figure 13. Educational Preparation for Employment, by Program Type
0%
20%
40%
60%
80%
100%
Prepared me to meet job market
challenges
Provided competitive advantage in job
market
Empowered me to control employment
outcomes
Improved chances of meeting job expectations
Introduced me to new career
opportunities
Full-time 2-year MBA Full-time 1-year MBA Part-time MBA
Executive MBA Qualitative master’s Quantitative master’s
Per
centa
ge
in a
gre
emen
t
t h e e M p l o y M e n t r e p o r t
© 2011 Graduate Management Admission Council®. All rights reserved. 17Global ManaGeMent education Graduate Survey • 2011
G r a d u at e b u S i n e S S e d u c at i o n e va l u at e d
Figure 15. Importance of Graduate Business Education for Business Owners
0% 30% 60% 90%
54%Creating a human resource plan
Making contact with potential customers
Securing financial resources
Writing a marketing/promotional plan
Developing an idea
Developing financial projections
Conducting market research
Writing a business plan
Growing your business
Leading your company
62%
64%
67%
68%
71%
73%
75%
80%
80%
Percentage ranked very/extremely important
Figure 14. Percentage Increase in Likelihood of Receiving a Job Offer,
by Participation in Co-Curricular Activities
0% 5% 10% 15% 20% 25% 30% 35%
5%Work projects
Diversity/multicultural events
Student clubs
Volunteer activities
Community service organizations
Student government
Internships
Mentor programs
Leadership programs
Case competitions
10%
15%
17%
18%
20%
26%
28%
30%
32%
Percentage increase
18 © 2011 Graduate Management Admission Council®. All rights reserved. Global ManaGeMent education Graduate Survey • 2011
G r a d u at e b u S i n e S S e d u c at i o n e va l u at e d
Development of Knowledge, Skills, and Abilities
Graduating students were asked to indicate how well their business education developed their
knowledge, skills, and abilities using a five-point scale. Figure 16 shows the average improvement students reported in a host of areas by the type of program in which they were enrolled. Knowledge of general business functions, managing strategy and innovation, and managing the decision-making process received the highest ratings in each of the MBA program types.
Students enrolled in qualitative master’s programs reported the greatest improvement in their knowledge of general business
functions, management of the decision-making process, and interpersonal skills. Among those enrolled in quantitative master’s programs, the top three areas of improvement included managing the decision-making process, knowledge of general business functions, and generative thinking skills.
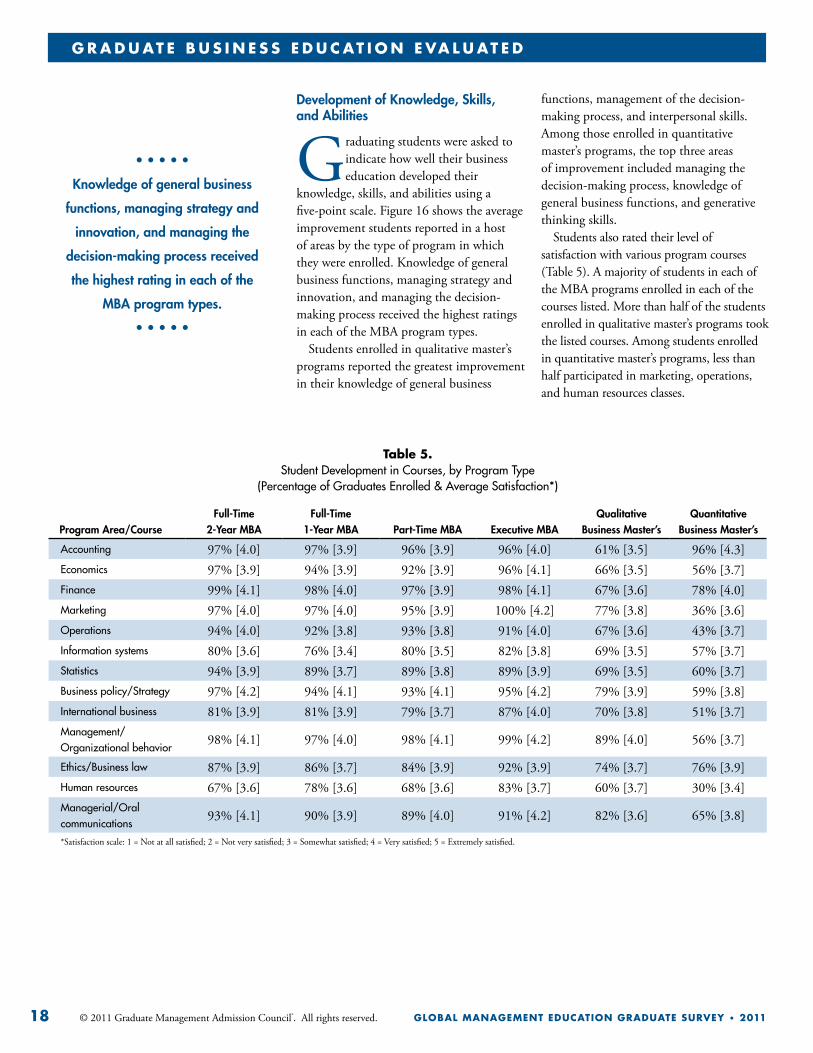
Students also rated their level of satisfaction with various program courses (Table 5). A majority of students in each of the MBA programs enrolled in each of the courses listed. More than half of the students enrolled in qualitative master’s programs took the listed courses. Among students enrolled in quantitative master’s programs, less than half participated in marketing, operations, and human resources classes.
table 5. Student Development in Courses, by Program Type
(Percentage of Graduates Enrolled & Average Satisfaction*)
Program Area/CourseFull-Time
2-Year MBAFull-Time
1-Year MBA Part-Time MBA Executive MBAQualitative
Business Master’sQuantitative
Business Master’s
Accounting 97% [4.0] 97% [3.9] 96% [3.9] 96% [4.0] 61% [3.5] 96% [4.3]Economics 97% [3.9] 94% [3.9] 92% [3.9] 96% [4.1] 66% [3.5] 56% [3.7]Finance 99% [4.1] 98% [4.0] 97% [3.9] 98% [4.1] 67% [3.6] 78% [4.0]Marketing 97% [4.0] 97% [4.0] 95% [3.9] 100% [4.2] 77% [3.8] 36% [3.6]Operations 94% [4.0] 92% [3.8] 93% [3.8] 91% [4.0] 67% [3.6] 43% [3.7]Information systems 80% [3.6] 76% [3.4] 80% [3.5] 82% [3.8] 69% [3.5] 57% [3.7]Statistics 94% [3.9] 89% [3.7] 89% [3.8] 89% [3.9] 69% [3.5] 60% [3.7]Business policy/Strategy 97% [4.2] 94% [4.1] 93% [4.1] 95% [4.2] 79% [3.9] 59% [3.8]International business 81% [3.9] 81% [3.9] 79% [3.7] 87% [4.0] 70% [3.8] 51% [3.7]Management/ Organizational behavior
98% [4.1] 97% [4.0] 98% [4.1] 99% [4.2] 89% [4.0] 56% [3.7]
Ethics/Business law 87% [3.9] 86% [3.7] 84% [3.9] 92% [3.9] 74% [3.7] 76% [3.9]Human resources 67% [3.6] 78% [3.6] 68% [3.6] 83% [3.7] 60% [3.7] 30% [3.4]Managerial/Oral communications
93% [4.1] 90% [3.9] 89% [4.0] 91% [4.2] 82% [3.6] 65% [3.8]
*Satisfactionscale:1=Notatallsatisfied;2=Notverysatisfied;3=Somewhatsatisfied;4=Verysatisfied;5=Extremelysatisfied.
• • • • •
Knowledge of general business
functions, managing strategy and
innovation, and managing the
decision-making process received
the highest rating in each of the
MBA program types.
• • • • •

t h e e M p l o y M e n t r e p o r t
© 2011 Graduate Management Admission Council®. All rights reserved. 19Global ManaGeMent education Graduate Survey • 2011
G r a d u at e b u S i n e S S e d u c at i o n e va l u at e d
Figure 16. Student Development, by Program Type
1
2
3
4
5
Full-time 2-year MBA Full-time 1-year MBA Part-time MBA Executive MBA Qualitative master’s Quantitative master’s
Strategy and innovation
Human capital
Decision-making processes
Administrative activities
Task environment
Tools and technology
Managing...
1
2
3
4
5
Full-time 2-year MBA Full-time 1-year MBA Part-time MBA Executive MBA Qualitative master’s Quantitative master’s
*Improvement scale: 1 = Not at all; 2 = A little; 3 = Some; 4 = A good amount; 5 = A great deal
Strategic and systems skills
Operations skills
Generative thinking
Foundation skills
Interpersonal skills
Skills
1
2
3
4
5
Full-time 2-year MBA Full-time 1-year MBA Part-time MBA Executive MBA Qualitative master’s Quantitative master’s
General business functions
Media communications and delivery
Human behavior and society
Technology, design, and production
Knowledge of...
20 © 2011 Graduate Management Admission Council®. All rights reserved. Global ManaGeMent education Graduate Survey • 2011
G r a d u at e b u S i n e S S e d u c at i o n e va l u at e d
Program Evaluation
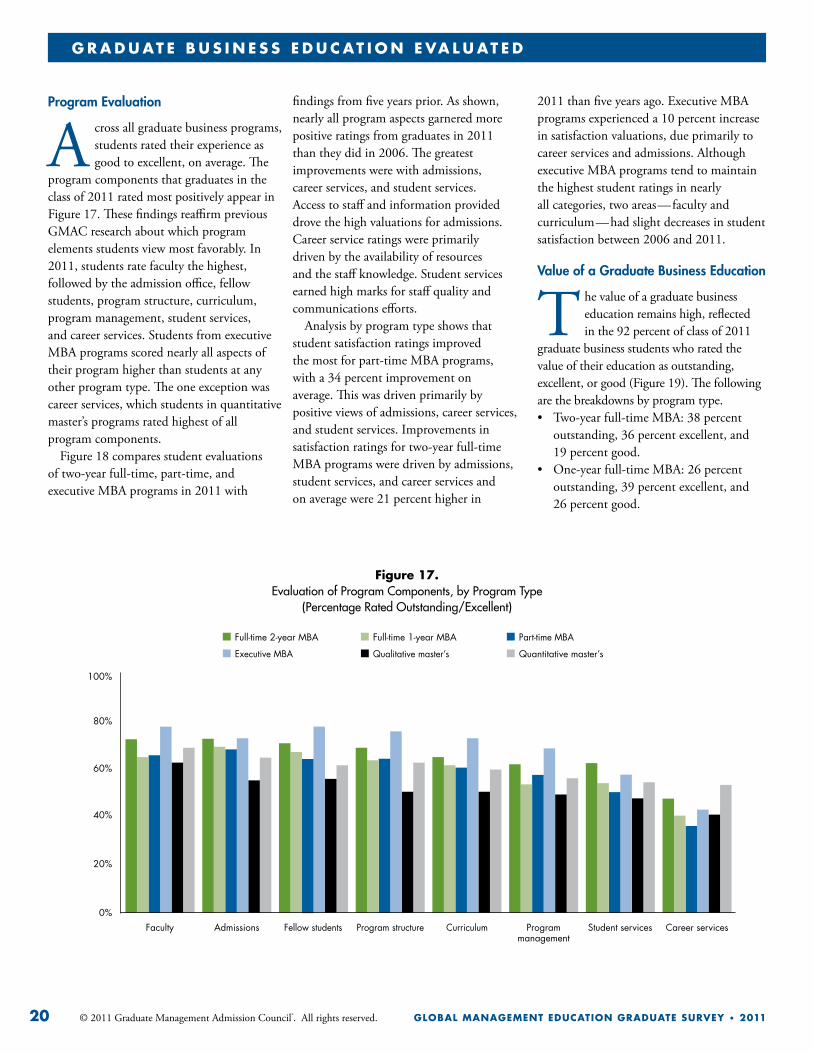
A cross all graduate business programs, students rated their experience as good to excellent, on average. The
program components that graduates in the class of 2011 rated most positively appear in Figure 17. These findings reaffirm previous GMAC research about which program elements students view most favorably. In 2011, students rate faculty the highest, followed by the admission office, fellow students, program structure, curriculum, program management, student services, and career services. Students from executive MBA programs scored nearly all aspects of their program higher than students at any other program type. The one exception was career services, which students in quantitative master’s programs rated highest of all program components.
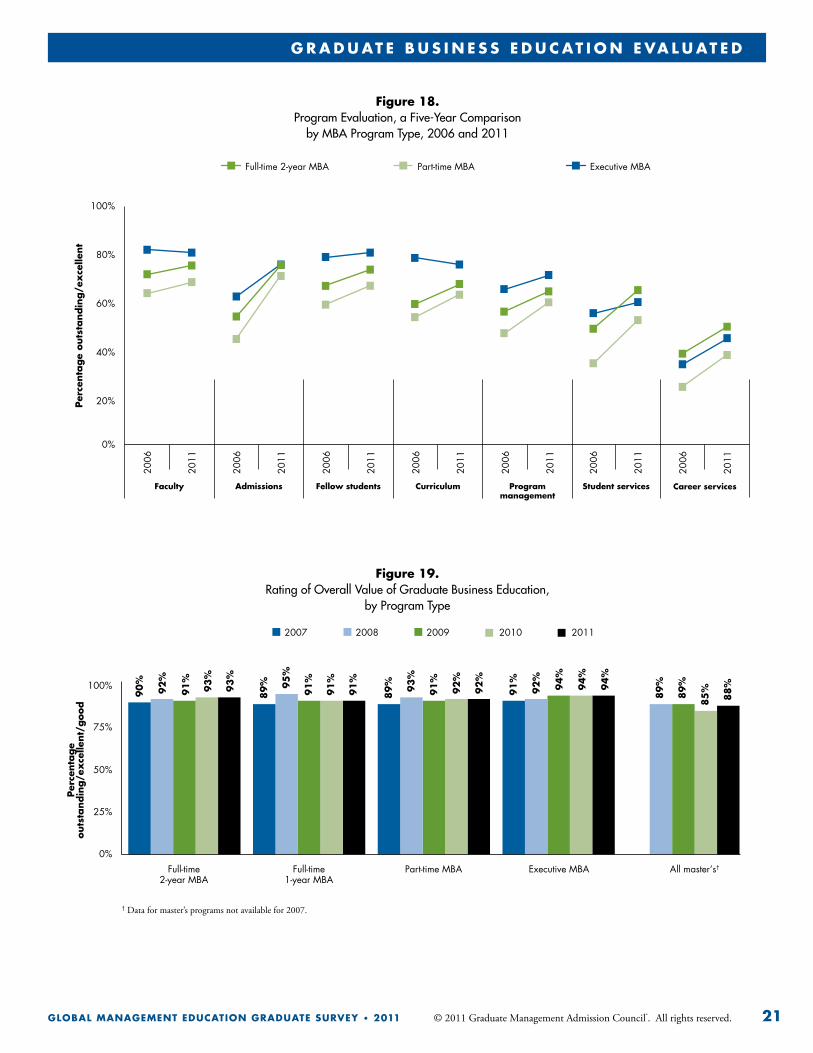
Figure 18 compares student evaluations of two-year full-time, part-time, and executive MBA programs in 2011 with
findings from five years prior. As shown, nearly all program aspects garnered more positive ratings from graduates in 2011 than they did in 2006. The greatest improvements were with admissions, career services, and student services. Access to staff and information provided drove the high valuations for admissions. Career service ratings were primarily driven by the availability of resources and the staff knowledge. Student services earned high marks for staff quality and communications efforts.
Analysis by program type shows that student satisfaction ratings improved the most for part-time MBA programs, with a 34 percent improvement on average. This was driven primarily by positive views of admissions, career services, and student services. Improvements in satisfaction ratings for two-year full-time MBA programs were driven by admissions, student services, and career services and on average were 21 percent higher in
Figure 17. Evaluation of Program Components, by Program Type
(Percentage Rated Outstanding/Excellent)
0%
20%
40%
60%
80%
100%
Faculty Admissions Fellow students Program structure Curriculum Program management
Student services Career services
Full-time 2-year MBA
Executive MBA
Full-time 1-year MBA
Qualitative master’s
Part-time MBA
Quantitative master’s
2011 than five years ago. Executive MBA programs experienced a 10 percent increase in satisfaction valuations, due primarily to career services and admissions. Although executive MBA programs tend to maintain the highest student ratings in nearly all categories, two areas—faculty and curriculum—had slight decreases in student satisfaction between 2006 and 2011.
Value of a Graduate Business Education
The value of a graduate business education remains high, reflected in the 92 percent of class of 2011
graduate business students who rated the value of their education as outstanding, excellent, or good (Figure 19). The following are the breakdowns by program type. • Two-yearfull-timeMBA:38percent
outstanding, 36 percent excellent, and 19 percent good.
• One-yearfull-timeMBA:26percentoutstanding, 39 percent excellent, and 26 percent good.
t h e e M p l o y M e n t r e p o r t
© 2011 Graduate Management Admission Council®. All rights reserved. 21Global ManaGeMent education Graduate Survey • 2011
G r a d u at e b u S i n e S S e d u c at i o n e va l u at e d
Figure 19. Rating of Overall Value of Graduate Business Education,
by Program Type
0%
25%
50%
75%
100%
Full-time 2-year MBA
Full-time 1-year MBA
Part-time MBA Executive MBA All master‘s†
90
%
92
%
91
%
93
%
93
%
89
% 95
%
91
%
91
%
91
%
89
% 93
%
91
%
92
%
91
%
92
%
94
%
94
%
89
%
89
%
85
%
2007 2008 2009 2010 2011
† Data for master’s programs not available for 2007.
Per
centa
ge
outs
tandin
g/e
xce
llent/
good
92
%
94
%
88
%
Figure 18. Program Evaluation, a Five-Year Comparison
by MBA Program Type, 2006 and 2011
0%
20%
40%
60%
80%
100%
2006
2011
Per
centa
ge
outs
tandin
g/e
xce
llent
Faculty Admissions
2006
2011
Fellow students
2006
2011
Curriculum
2006
2011
Program management
2006
2011
Student services
2006
2011
Career services
2006
2011
Full-time 2-year MBA Part-time MBA Executive MBA
22 © 2011 Graduate Management Admission Council®. All rights reserved. Global ManaGeMent education Graduate Survey • 2011
G r a d u at e b u S i n e S S e d u c at i o n e va l u at e d
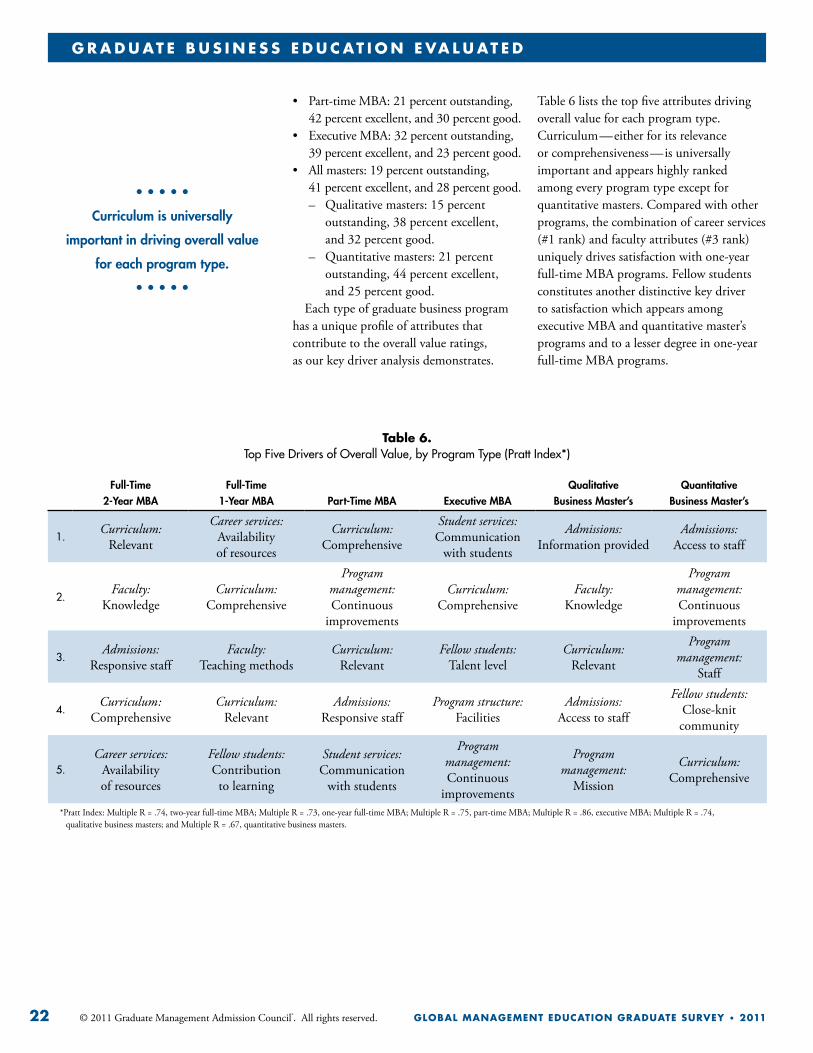
table 6. Top Five Drivers of Overall Value, by Program Type (Pratt Index*)
Full-Time 2-Year MBA
Full-Time 1-Year MBA Part-Time MBA Executive MBA
Qualitative Business Master’s
Quantitative Business Master’s
1.Curriculum:
Relevant
Career services: Availability of resources
Curriculum: Comprehensive
Student services: Communication
with students
Admissions: Information provided
Admissions: Access to staff
2.Faculty:
KnowledgeCurriculum:
Comprehensive
Program management: Continuous
improvements
Curriculum: Comprehensive
Faculty: Knowledge
Program management: Continuous
improvements
3.Admissions:
Responsive staffFaculty:
Teaching methodsCurriculum:
RelevantFellow students:
Talent levelCurriculum:
Relevant
Program management:
Staff
4.Curriculum:
ComprehensiveCurriculum:
RelevantAdmissions:
Responsive staffProgram structure:
FacilitiesAdmissions:
Access to staff
Fellow students: Close-knit community
5.Career services:
Availability of resources
Fellow students: Contribution
to learning
Student services: Communication
with students
Program management: Continuous
improvements
Program management:
Mission
Curriculum: Comprehensive
*PrattIndex:MultipleR=.74,two-yearfull-timeMBA;MultipleR=.73,one-yearfull-timeMBA;MultipleR=.75,part-timeMBA;MultipleR=.86,executiveMBA;MultipleR=.74, qualitativebusinessmasters;andMultipleR=.67,quantitativebusinessmasters.
• Part-timeMBA:21percentoutstanding,42 percent excellent, and 30 percent good.
• ExecutiveMBA:32percentoutstanding,39 percent excellent, and 23 percent good.
• Allmasters:19percentoutstanding, 41 percent excellent, and 28 percent good.
– Qualitative masters: 15 percent outstanding, 38 percent excellent, and 32 percent good.
– Quantitative masters: 21 percent outstanding, 44 percent excellent, and 25 percent good.
Each type of graduate business program has a unique profile of attributes that contribute to the overall value ratings, as our key driver analysis demonstrates.
Table 6 lists the top five attributes driving overall value for each program type. Curriculum—either for its relevance or comprehensiveness—is universally important and appears highly ranked among every program type except for quantitative masters. Compared with other programs, the combination of career services (#1 rank) and faculty attributes (#3 rank) uniquely drives satisfaction with one-year full-time MBA programs. Fellow students constitutes another distinctive key driver to satisfaction which appears among executive MBA and quantitative master’s programs and to a lesser degree in one-year full-time MBA programs.
• • • • •
Curriculum is universally
important in driving overall value
for each program type.
• • • • •
© 2011 Graduate Management Admission Council®. All rights reserved. 23Global ManaGeMent education Graduate Survey • 2011
c o n c l u d i n G n o t e
23
Concluding Note
The findings in this report suggest an overall optimistic jobs outlook for MBA and other business
master’s graduates in 2011 along with high satisfaction with the programs attended and skills attained. Data from the 2011 GMAC Corporate Recruiters Survey conducted during the same time frame as this graduate survey point to similar, although slightly more reserved, optimism in the job market and high program satisfaction from the employer perspective. GMAC further tracks the career progression of participating graduates in the Alumni PerspectivesSurvey.Findingsfromour latest alumni and employer surveys are available at gmac.com/surveys.
Explore Interactive Data Report
GMAC has prepared an interactive tool to accompany this report and provide an in-
depth, comprehensive examination of survey responses by various demographic criteria—the 2011 Global Management Education Graduate Survey Interactive Data Report—which is available only to schools participating in this year’s study. In addition to receiving copies of the summary report and accessing the interactive data report, participating schools can create individualized benchmark reports to compare the aggregated responses from their students with students from peer schools and all other students. The interactive data report allows participating schools to access data from their enrolled students who may have responded to this year’s survey but indicated a graduation date of 2012 or later.
Schools can access the interactive report by logging in to the GMAC Research Library at gmac.com/GMACResearchLibrary. A publicly available interactive data report allows viewers to examine survey responses byprogramtype.Participatingschoolsreceive a special interactive data report that shows responses by multiple demographic levels such as gender, age, program type, citizenship, residency, and more.
Methodology
Findings in this report are based on an analysis of data from 4,794 recent or soon-to-be graduates of business
schools worldwide. All GMAC member schools and a number of other schools representing a cross section of the global graduate management industry received email invitations to participate in the study. Schools participated by providing GMAC with the names and email addresses for their graduating class of 2011 or by forwarding the survey invitation directly to their students on GMAC’s behalf. The survey was in the field between February 9 and March 18, 2011. Frequency distributions were examined for both topical and classification questions. Response categories for some questions were collapsed to make final analysis more robust. Tests of statistical significance were used throughout the report, and a 95 percent confidence interval was used as the cutoff point for significance.
The results of this survey do not necessarily reflect a statistically representative sample of graduating students. Because of this limitation, the results of this research study should not be used to generalize about the student population, but they can be used as a reflection of the sample frame under consideration. Several clear trends emerge from the data, nevertheless.
How to Participate in the Survey
School professionals at business schools that offer graduate programs can help facilitate this annual survey,
either by sending invitations and survey links to your graduating students or by providing GMAC with your student contact list. Email [email protected] to secure your school’s invitation for the next Global Management Education Graduate Survey. School participation benefits include comprehensive statistics, customized reports that compare your data with that of your peers, and advance access to survey findings. Student participation benefits include an opportunity to voice their opinions and concerns to school professionals in a confidential manner, access to the survey reports, an opportunity to be included in a drawing for one of five US$1,000 prizes, and an opportunity to continue in the research process through the GMACAlumniPerspectivesSurvey.Thealumni survey allows graduates the unique opportunity to monitor their career progress long term in relation to their peer group.
GMAT using schools can explore student response details by
program type for the topics discussed in this report by downloading our 2011 Global Management Education Graduate Survey Interactive Data Report at gmac.com/InteractiveResearch.
24 © 2011 Graduate Management Admission Council®. All rights reserved. Global ManaGeMent education Graduate Survey • 2011
c l a S S o F 2 0 0 9c o n ta c t i n F o r M at i o n
Contact Information
For questions or comments regarding the study findings, methodology, or data, please contact the GMAC
Research and Development Department at [email protected].
Authorship
Gregg Schoenfeld, Director, Management Education Research, Graduate Management
Admission Council.
Acknowledgements
LawrenceRudner,VicePresident,Research and Development, GMAC, manuscript review; Michelle
Sparkman Renz, Director, Research and Development, GMAC, manuscript review; VeronicaSinz,ResearchPublicationsManager,GMAC,publicationreview;PaulaBruggeman, editing; and research of C. Dierdorff,PhDandRobertS.Rubin,PhD,DePaulUniversity,TheCharlesH.KellstadtSchool of Business, development of the list of skills and abilities.
The GMAC research department recognizes and thanks the 156 school contacts who took the time to sign up and participate in this survey, as well as the corresponding 5,975 graduate business students who completed the questionnaire. Without you, this report would not have been possible.
• • • • •
Viewed in terms of employment offers,
the bottom of the 2008–2010 downturn
was about as deep as that in 2003, but
the subsequent recovery has been a
quicker climb for the current class.
• • • • •
c l a S S o F 2 0 0 9b u S i n e S S S c h o o l p e r S p e c t i v e SG M a c . c o M / r e S e a r c h
S tay on top of the latest trends in graduate business education with our ever-expanding online research database. Here is a sample of the resources you will find along with our annual survey series at
gmac.com/research
• the Profile of Graduate Management admission test® candidates—Gauge the size and characteristics of your school’s potential applicant pool with this annual summary of demographic data about GMAT examinees over the last five testing years. Search tables for testing volumes and mean GMAT Total scores by gender, age group, intended degree, undergraduate major, citizenship, location, and world region.
• the Profile of Graduate Management admission test® candidates (interactive edition)—Dig deeper with this new online companion to the annual report. This tool offers nearly all the data included in the print version of the Profile with the added benefit of chart depictions, user-selected data views, download options to save data for reference or analysis, and a faster view of GMAT testing trends.
• Geographic trend reports for GMat® examinees—Map out smart recruiting visits with data on where students want to study. These annual reports merge score-sending patterns from GMAT examinees with their biographical data, such as citizenship and location of residence, submitted with the exam to determine preferences and changes by group. The series includes an overall World report and region-specific reports for Asia, Europe, and North America.
• GMac® interactive research—Sort through detailed data collected through our annual surveys with the ease of user-friendly graphical displays to work with deep information streams in ways not possible with print reports. Drill down to relevant data, customize your searches by program type and geographic location, and quickly visualize trends in the B-school pipeline with just a click of your mouse. Search the site by Public, GMAT Using Schools, and GMAC Member Schools categories to see what’s available for each user group.
• GMac® data-to-Go—Find quick facts and topic-specific analysis from our large-scale research studies in compact presentations and data briefs. Analysis varies from overall highlights to key findings by group and regional outlooks. Share findings of interest with colleagues and use pertinent material in your own meetings.
• the research report Series—Learn about the latest research on GMAT validity, management education program specifics, alumni concerns, minority and diversity issues, high-stakes testing innovations and more in white papers authored by GMAC staff and Management Education Research Institute (MERInstitute) awardees.
• the GMac® research library—Peruse our comprehensive online archive for copies of all research publications, survey reports, data reports, and analyses publicly released by GMAC, all in downloadable formats. The library contains many publications no longer accessible through our primary research pages on gmac.com.
visit us online today at gmac.com/research

b © 2011 Graduate Management Admission Council®. All rights reserved. Global ManaGeMent education Graduate Survey • 2011
© 2011 Graduate Management Admission Council® (GMAC®). All rights reserved.
No part of this publication may be reproduced, stored in a retrieval system, distributed, or transmitted in any form by any means, electronic, mechanical, photocopying, recording, or otherwise, without the prior written permission of GMAC. For permission, contact the GMAC legal department at [email protected].
The GMAC logo is a trademark and GMAC®, GMAT®, Graduate Management Admission Council®, and Graduate Management Admission Test® are registered trademarks of the Graduate Management Admission Council in the United States and other countries.
2011T he Global Management education Graduate Survey is one in a series of five annual or biannual surveys produced by the Graduate Management Admission Council® that explore relevant issues in graduate management education. Survey reports provide an overview of data in addition
to offering context for and discussing implications of the research. They frequently are used to help drive strategic decision-making processes in graduate business schools. All survey reports are available online at gmac.com/surveys. Print copies are free upon request from the GMAC® Research and Development Department at [email protected].
other surveys include—
mba.com Prospective Students Survey
Who is in the pipeline for a graduate business degree? What factors influence their enrollment decisions? Launched in 2003, this annual survey (formerly known as the mba.com Registrants Survey) profiles prospective students, tracking how and why they move through the pipeline, and what motivates them and gets their attention.
Application Trends Survey
How does a school’s application volume compare with that of other schools? Since its debut in 1999, this annual two-part survey compares current and previous year application data for business school programs worldwide, highlighting trends by program type and world region.
Alumni Perspectives Survey
What happens to MBAs after they graduate and begin to evaluate the value of their degrees? Launched in 2001, these biannual surveys follow MBA graduates long term to understand their career progression, their expectations, their attitudes about work, their assessment of their education, and general market trends.
Corporate Recruiters Survey
Who hires MBAs and why? What are the hiring plans in various industries? How do companies decide where to recruit? Launched in 2001–2002, this annual survey helps schools better understand the job market, clarify employer expectations, and benchmark their career services practices. Employers use the survey results to benchmark the MBA recruitment activities of their companies.
11921 Freedom Drive, Suite 300Reston, VA 20190 gmac.com mba.com
[email protected]/surveys