Embed Size (px)
Citation preview
HAL Id: hal-00505949https://hal.archives-ouvertes.fr/hal-00505949
Submitted on 31 Aug 2010
HAL is a multi-disciplinary open accessarchive for the deposit and dissemination of sci-entific research documents, whether they are pub-lished or not. The documents may come fromteaching and research institutions in France orabroad, or from public or private research centers.
L’archive ouverte pluridisciplinaire HAL, estdestinée au dépôt et à la diffusion de documentsscientifiques de niveau recherche, publiés ou non,émanant des établissements d’enseignement et derecherche français ou étrangers, des laboratoirespublics ou privés.
Global Maritime Networks. The case of MaerskA. Fremont
To cite this version:A. Fremont. Global Maritime Networks. The case of Maersk. Journal of Transport Geography,Elsevier, 2007, Vol15,n6, p431-442. �hal-00505949�
1
Journal of Transport Geography, Vol 15, issue 6 November 2007, Pp 431-442 Doi:10.1016/j.trangeo.2007.01.005 copyright©2007 Elsevier Ltd All reserved. http://www.sciencedirect.com/science/journal/09666923
Global maritime networks.
The case of Maersk
Dr Antoine FREMONT The French National Institute for Transport and Safety Research (INRETS) [email protected] Tel: 00 33 1 47 40 72 24 Fax: 00 33 1 45 47 55 06
Abstract
Two contrasting approaches to the provision of maritime services are frequently
presented: one based on direct port to port services, the other characterised by a hub and
spoke network. We demonstrate there is no contradiction between these two models,
that in fact they are complementary. Integrating direct services and with a hub structure
is necessary for assuring a wider geographical coverage. The complementarity is
explained by analysing the world’s largest container shipping line, Maersk, which over
the last 30 years has created a global shipping network.
Keywords:
Containerisation, Globalization, Maritime networks, Shipping lines, Transhipment.

2
3
1. Introduction
Since its appearance on the international scene in the 1960s, containerisation
has accompanied the expansion of the world economy in a virtuous circle. Two factors
largely explain the success of containerisation. The first involves the productivity gains
that containersiation made possible regarding cargo handling in ports, which accounted
for the rapid succes and diffusion of containerisation (Hayuth, 1992). The second and
more gradual process involved the refinement of the container networks of the major
shipping lines. This network evolution can be summarized in the following fashion: the
major carriers initially concentrated their resources on the major East-West routes
which linked the three poles of the global economy (Rimmer, 2004); but, with the
growing liberalization of maritime transport in the 1980s, they began to serve the North-
South markets as well (Hoffmann, 1998). The unrelenting growth in the size of ships
produced a cascade effect in which the newest and largest ships entering service were
deployed on the East-West routes, while the vessels they replaced were diverted to the
North-South markets (Guy, 2003). This spatial expansion of networks and services was
facilitated by cooperation between carriers through the establishment of strategic
alliances (Slack and alii, 2002) or by acquisition and internal growth. Because ports
became just one link in transport chains (Heaver, 2002; Slack, 1985 and 1993), hub and
spoke networks were established, linking the major East-West maritime motorway with
the secondary North-South services. This last factor is the focus of the present paper.
Different types of service models are capable of providing a global network. The
two most common are multi-port services, which offer direct connections between
ports, and transshipment, two networks that are often seen as being in competition with
each other. This distinction has been explored by Baird (2006) in a study of Northern
European ports. The essential question is one of comparing the supplementary handling
4
costs of feedering involved in transshipment with the scale economies achieved by
massifying the flows between the hub ports (Cullinane et al., 2000). The continued
growth of world trade and the parallel increases in the size of ships accentuates the
seeming difference between the alternate strategies: one to emphasize scale economies,
the other to offer direct services (Imai and alii, 2006). This distinction in basic network
structure is comparable with what has taken place in air transport, which adopted a hub
and spoke structure much earlier (Bryan, D. and O’Kelly, 1999; M.E. Goetz and
Graham, 2003; Martin and Roman, 2004). In air transport there is a dichotomy between
the ‘major’ carriers that focus routes on national hubs and who are joined in strategic
alliances to provide global coverage, with the regional low cost carriers who provide
city-to-city connections and frequently make use of secondary airports (Dobruszkes,
2006).
The hypothesis explored in this paper is that the choices between direct
shipments and transshipment are not incompatible for individual shipping lines. In
contrast it is suggested that mounting a global network, involving having a presence
along the main East-West corridors as well as on the lesser North-South routes, requires
a complementarity between direct services and transshipment. Thus, a mixture of direct
services with hub and spoke services are not incompatible, and indeed may be necessary
to provide a global coverage.
The paper begins by presenting a number of different strategies for linking the
different regions of the world. A purely theoretical example shows how regular shipping
lines are able to serve the same two regions of the world with differently configurated
maritime networks.
5
In the second part, we study the case of the world’s leading carrier, Maersk
Line1
2.1. Theoretical hypothesis concerning the linking of two continents
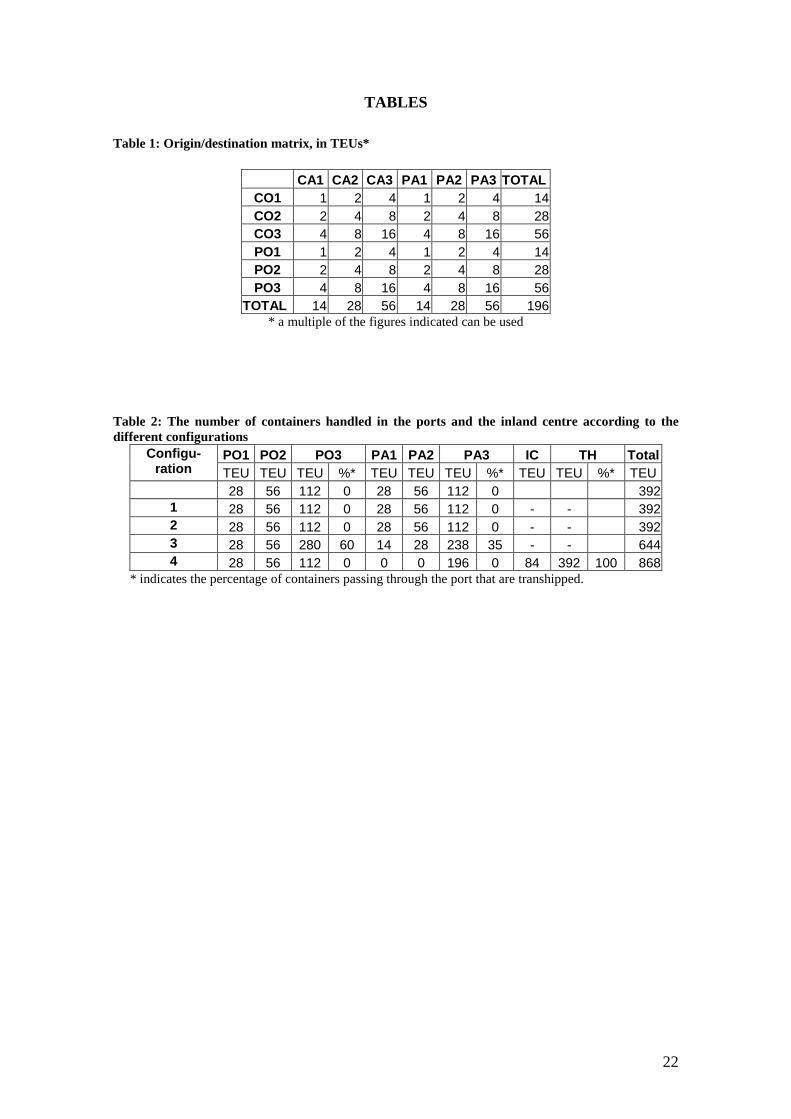
The theoretical example given below shows how a single origin/destination
matrix and a given quantity of transported containers can provide the multimodal
transport operator with several possible combinations.
The hypothetical situation considered involves the linkage of two continents
with a flow of exports from cities of origin (CO) and ports of origin (PO) towards ports
of arrival (PA) and cities of arrival (CA). The exported volumes are proportional to the
masses (M) of the cities and the ports measured, for example, by their economic
importance or the size of their populations. It is accepted that:
. Since the 1980s, this carrier has gradually built a global maritime network that
integrates a network of direct East-West and North-South services while establishing a
number of traffic hubs that interconnect the different services and enhance the overall
connectivity of the system. It enables Maersk to link the different regions of the world
and to operate at different scales, from the global to the local. In this way, Maersk is
able to serve the world economy while also responding to the very local situations of
each port and their hinterlands.
2. The configuration of containerized maritime networks: the theoretical
possibilities
- MVO1 = MP01 = MPA1 = M
- M
VA1
VO2 = MP02 = MPA2 = M
- M
VA2
VO3 = MP03 = MPA3 = M 1 We use the term « the Maersk line » throughout the paper. In fact, after Maersk’s purchase of Sea-Land and Safmarine in 1999, the name of the Danish shipping line became Maersk-Sealand, and Safmarine remained a subsidiary. We consider in this paper Maersk-Sealand/Safmarine as a whole. Since the purchase of P&ONedlloyd in 2005, the company reverted to its initial name “the Maersk line”.
VA3
6
- MV03 = 2*MV02 = 4*MV01
INSERT TABLE 1
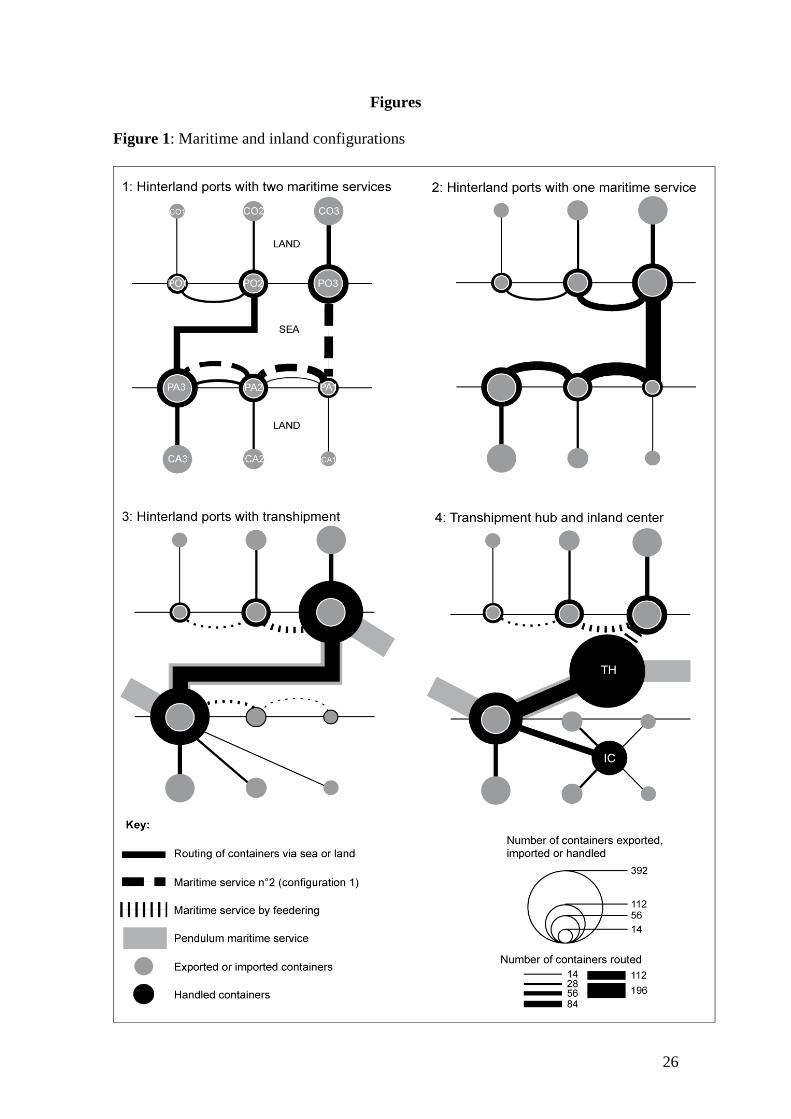
2.2. The direct maritime service solution
A first configuration (Figure 1) involves a direct land link between the ports and
the cities of origin or destination and the existence of two maritime services2
2.3. The transhipment hub solution
. A pattern
of this type can occur for two reasons. In the first phase of containerization, the
transport capacity of container vessels was still limited and the existence of two services
is justified in view of the volumes to be transported. The second possibility is that the
market generated by CO3 and PO3 is significantly large to justify a dedicated maritime
service.
The second configuration is when the increase in the size of container vessels
and economic and political integration in the export zone permit rationalization of the
two maritime services, which are merged into one. This second solution permits
economies of scale to be made on the maritime leg, but only on segment PO3-PA1
where the vessel carries all the containers for export from the region of origin to the
region of destination. This makes it necessary to use higher capacity vessels and reduces
the number of maritime links between ports. As in the first configuration, the six ports
are hinterland ports whose importance varies directly with the capacity of their
hinterland. Here it is the ports’ centrality (Fleming and Hayuth, 1994) that accounts for
the major part of their traffic.
The third configuration is structured by one or more very high capacity maritime
services which only call at the most important ports, PO3 and PA3. These pendulum
2 It would be possible to devise a maritime scenario which is even more spread out than this first configuration with direct maritime links between all the ports, i.e. a total of 9 maritime links.
7
services3
In the fourth configuration we shall consider, exports from the region of origin
depend on a maritime transhipment hub (TH in Figure 1) located near the region but
also near major East-West ocean traffic flows. As a result of this maritime hub, very
large mother vessels do not need to deviate from their circumterrestrial route and can
avoid making a detour to visit a seaboard whose volumes are not large enough to justify
direct calls by large mother vessels (Zohil, 1999). A very high capacity feeder connects
PO1, PO2 and PO3 to this transhipment hub (HT). This feedering and transhipment
hub, where several other maritime services call, can also be used by the shipping line to
send other containers, not considered here, from the region of origin to other ocean
seaboards, which further increases maritime massification. The transhipment hub has no
other terrestrial link with a hinterland, and all the containers are handled twice: it is a
do not just serve the two ocean seaboards in question, they also serve other
very large ports on other ocean seaboards not shown here. Two feeder services link the
secondary ports with the major ports. In the import region, the use of block trains makes
a direct inland link between PA3 and the terrestrial inland end destinations competitive
while the two secondary ports PA1 and PA2 lose their land link. In contrast, PA3’s
hinterland is no longer restricted to CA3 but is considerably enlarged. The number of
containers handled in PO3 and PA3 increases considerably as a result of feedering-
related transhipment operations. The increase in these operations is greater in PO3 than
PA3 as the latter concentrates on inland services. PO3 and PA3 are hubs or pivot ports
as traffic from both the sea and the land is concentrated in them. They act both as
maritime and terrestrial hubs and as transhipment and hinterland ports. The importance
of these two ports reflects their centrality as well as their intermediacy (Fleming and
Hayuth, 1994).
3 An example of a pendulum service consists of the West Coasts of North America, Eastern Asia, Southern Europe, Northern Europe and back.
8
pure maritime transhipment hub whose success is entirely based on its spatial quality of
intermediacy. It was created with no antecedents and its traffic, in TEUs, confers on it
first position in the port hierarchy. By setting up a direct high capacity terrestrial link
with an inland centre (IC in Figure 1), PA3 has strengthened its hold on the extended
and consolidated hinterland as well as its role as a hinterland port. Paradoxically, the
end of transhipment activities results in a reduction in the number of containers handled.
INSERT FIGURE 1
2.4. The hub: increasing port traffic and the number of links
An analysis of the table shows that the transhipment techniques used in
configurations 3 and 4 artificially increase port traffic as a result of double cargo
handling. Port traffic is increased by a factor of 1.6 in configuration 3 and 2.2 in
configuration 4. These increases are only justified if the economies in scale generated
by massification exceed the additional cargo handling costs.
INSERT TABLE 2
The hub also allows a large number of markets to be served by adding additional
links to the hub from a network that is already in place. This increases the potential for
massification. The hub opens up the possibility for the shipping line to serve secondary
markets at a lower cost, because a single additional physical link immediately provides
a large number of potential destinations. In addition to being responsible for
considerable massification, the hub provides a genuine increase in the number of
destinations. It provides a large number of markets with a comprehensive rather than a
segmented service (Rodrigue and alii, 2006).
9
In addition, the hub provides regular shipping lines with greater flexibility with
regard to the organization of their networks. While it is less costly to inaugurate a new
line, it is also less costly close a secondary link which is considered to be unprofitable,
as the network as a whole will not be put under threat. Depending on how the volumes
carried on the different routes change, it is possible to switch vessels from one route to
another more easily. Such cascade effects become increasingly easy to set up the more
substantial the network.
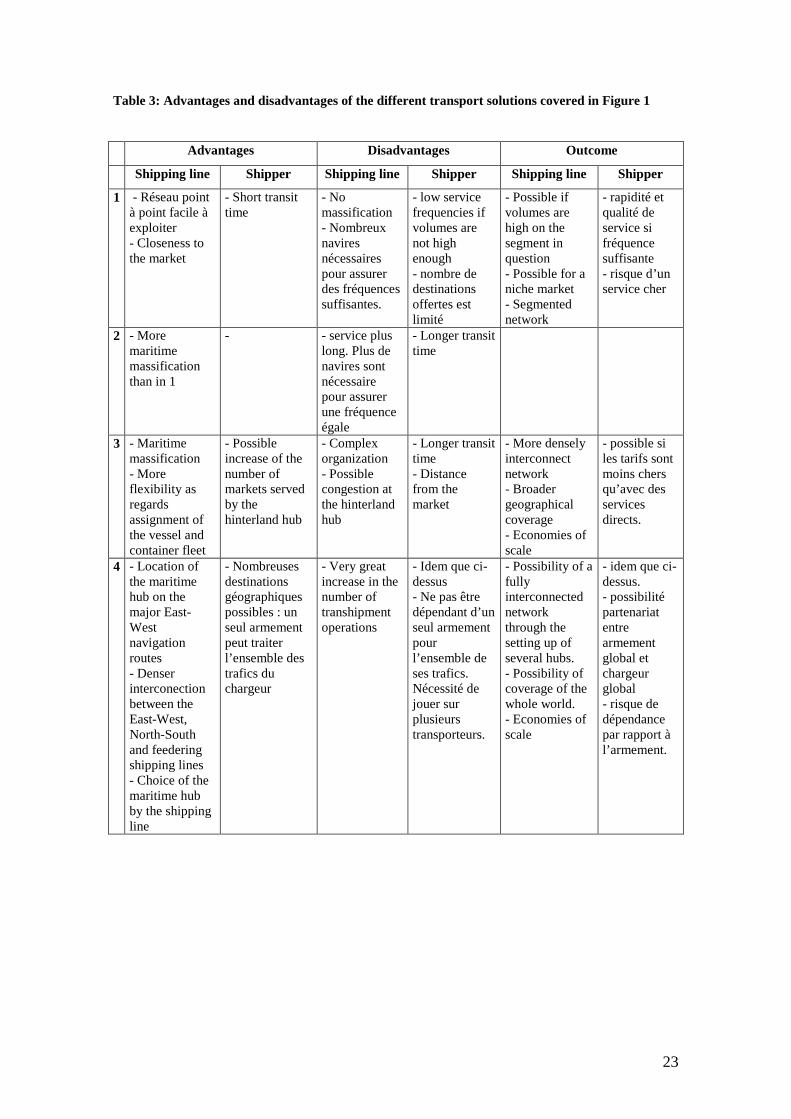
2.5. Advantages and disadvantages of the four scenarios
The four theoretical configurations considered in Figure 1 are not mutually
exclusive. They can be mixed, depending on the objectives of the shipping line but also,
above all, according to the market situation and thus the choice of the shippers. Table 3
summarizes the advantages and the disadvantages of each solution. The first two are
quite appropriate if the volumes to be transported are sufficient to justify setting up a
service that may operate more frequently than once a week, the widespread industry
norm. This would provide shippers ( the clients of the container operators) with the
shortest transit times and the greatest accessibility to the market. On the contrary, the
hub solution lengthens transit times, increases the number of transhipment operations
and requires the different regular shipping lines which call at the port to be perfectly
coordinated. It is complicated to organize and the quality of operations to some extent
determines the efficiency of the entire system of regular lines which depend on it. It is a
nerve centre of the network so its selection by the shipping line is critical. Hubs might
give greater flexibility, but disruptions along the chain make the whole system very
vulnerable.
INSERT TABLE 3
10
3. Maersk’s role in linking the different regions in the world
In 2002, Maersk’s 264 vessels represented a transport capacity of almost
700,000 TEUs which accounted for 9% of global containerized transport capacity. It is
by far the largest shipping line in the world. Its 97 maritime services offer worldwide
coverage, calling at 232 ports. Maersk constitutes a remarkable illustration of the
possibilities provided by a “hub and spoke” network. It played a trail-blazing role
amongst shipping lines in creating this type of network. However, the network was not
established spontaneously. Rather, it evolved out of developments that took place in the
1980s.
3.1. The emergence of the hub and spoke network in the 1980s
This global network consists of a network of hub ports which link the East-West
services with to each other or to the North-South services. At the end of the 1970s,
Maersk’s activity was based on the historical transpacific services, set up in 1928, and
on the more recent services (1968) between Europe and the Far East. These two were
containerized after 1975. But, even if these two services met in the ports of the Far East,
they were not coordinated at the time. Boxes were not exchanged between the two.
It was not until the mid-1980s that the first transhipment operations were
introduced. In 1984, Maersk introduced a maritime service between the West Coast of
the United States and the Middle East which involved transhipment at Hong Kong. This
technique for serving new markets became a genuine strategy when in the two years that
followed, the Algeciras and Dubai hubs were inaugurated. Algeciras allowed Maersk to
set up feeder lines in the West Mediterranean sector and gain a foothold on the West
African coast, and Dubai was used to operate services to the East African coast (see
Figure 2).
11
INSERT FIGURE 2
Algeciras was more of a genuine innovation than Hong Kong or Dubai, and
went on to be imitated by the other shipping lines. It serves no hinterland, its only
advantage being its location on a circumterrestrial East-West maritime route which
connects with more or less nearby regional markets. It allows mother ships to call at a
port without deviating from their principal route. These vessels can perform
transhipment operations either among themselves or with vessels assigned to the North-
South lines or with feeder vessels for geographically closer markets (Zohil et al., 1999).
Algeciras was the forerunner of all the major transhipment hubs which were to develop
during the 1990s.
However, at the end of the 1980s and the start of the 1990s, this global coverage
strategy was still in the early stages of implementation, as can be seen from the map of
the ports served in 19944
3.2: A global network in the 1990s
The Maersk maritime network took on a global dimension during the 1990s
thanks to considerable internal growth and merger/acquisition operations. These
culminated with Maersk’s purchase of Sea-Land in 1999 which allowed the group to
strengthen its position on the East-West route while in the same year the purchase of
Safmarine made Maersk a major shipping line in South Africa.
(see Figure 3).
INSERT FIGURE 3
4 The Weekly Containerized Transport Capacity (WCTC) is a measure of the number of TEUs provided each week by a shipping line on a link or at a port on the basis of its available nautical capacities. The figure is obtained from the “containerized transport capacities” database (see Frémont and Soppé, 2004) which is concerned with the commercial offer of transport capacity on the part of the 26 largest regular shipping lines in the world in 1994 and 2002. The database includes all the regular lines operated by the 26 shipping companies on the basis of weekly transport capacities made available on each maritime service. The information about the lines was obtained from the “Containerization International Yearbook” and from the websites of the shipping lines in question.
12
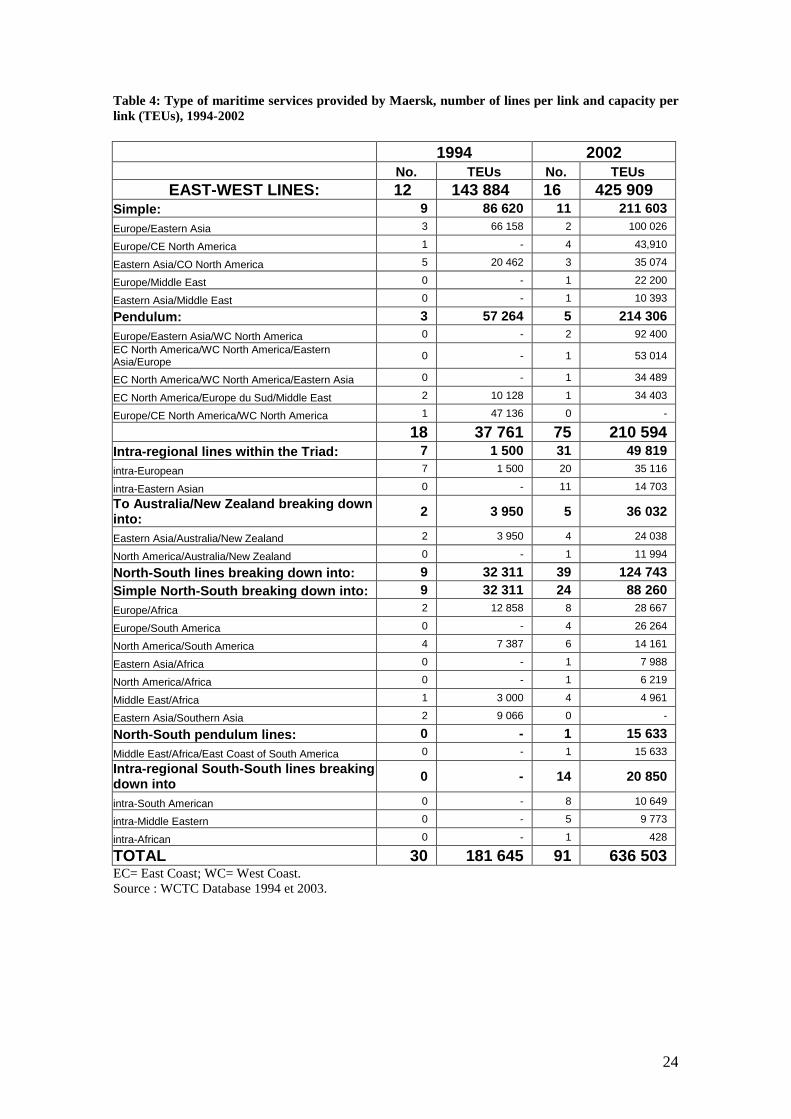
This growth gave birth to an increasingly complex maritime network. Between
1994 and 2002, the number of shipping services increased from 30 to 91 (see Table 4).
In absolute terms, the main increase was on the major East/West routes. Only four
services were added to these routes, but capacity on them increased by 282,000 TEUs,
which means that Maersk increased capacity by 62% between 1994 and 2002. For
Maersk, like the major Asian operators which belong to alliances, the first requirement
in order to dominate the market is massive presence on the East-West circumterrestrial
route.
INSERT TABLE 4
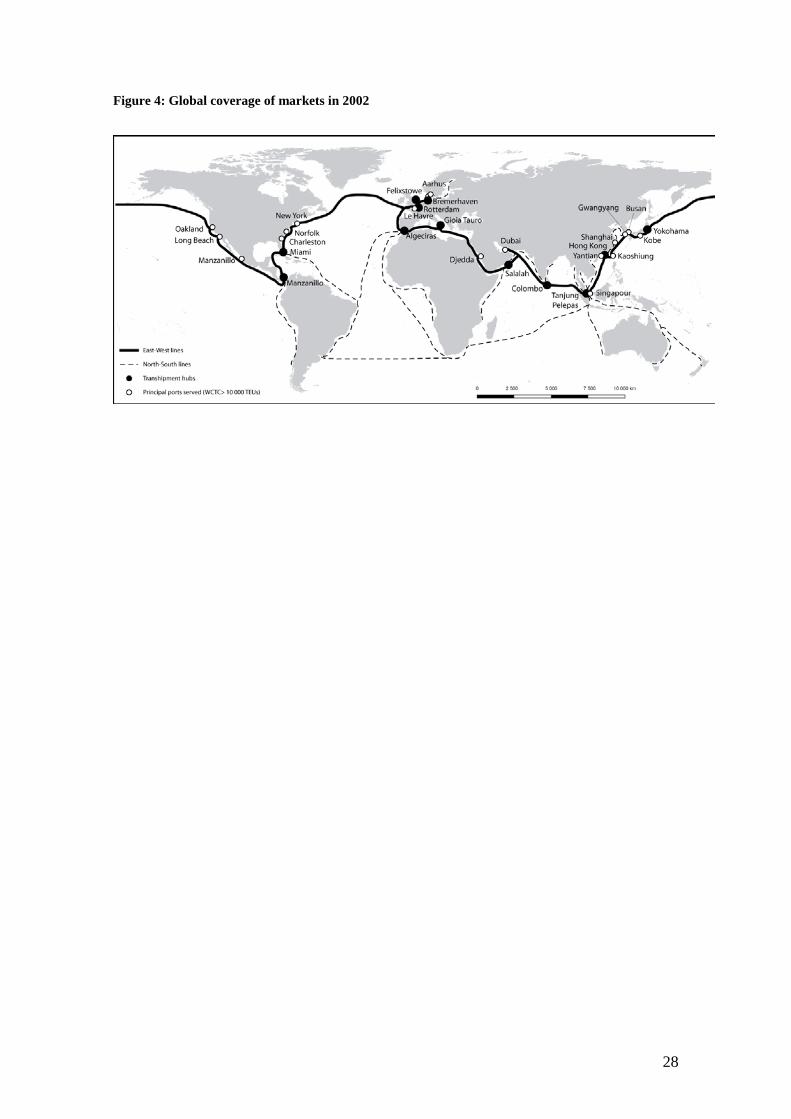
However, the considerable amount of effort put into the East-West trade route
does not prevent the development of global coverage. To achieve this, Maersk has
increased its number of hubs which are located mainly along the three major East-West
routes (see Figure 4).
INSERT FIGURE 4
3.3. The role of the hubs
Algeciras provides a good example of the large number of possibilities for
interconnections provided by this technique. Eighteen of the 91 lines in the Maersk
group’s network pass through Algeciras, which itself is linked to 88 of the 232 ports
that are served. Eighteen percent of the services link 37% of the ports in the network
together via a single hub. Four of these 18 lines are East-West lines which call at ports
in North America, Northern Europe and Eastern Asia. They are sufficient to link
Algeciras to Maersk’s other major hubs. A network of North-South lines then fans out,
six towards Africa, three towards South America and the West Indies, and finally five
13
feeder lines to nearby regional markets (countries in the Maghreb and on the Atlantic
Coast).
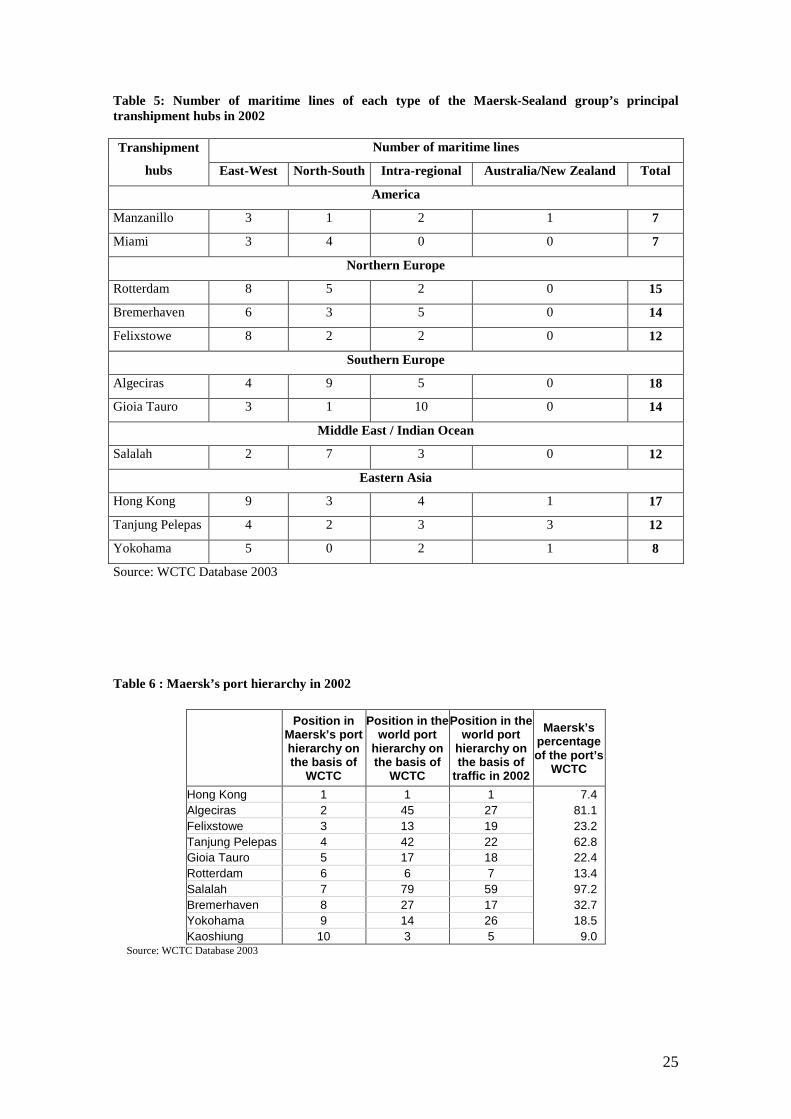
Each hub links several major regions by transferring traffic between the different
types of line (see Table 5 and Figure 4). In the Mediterrannean, Gioia Tauro
supplements Algeciras with a specialization in intra-Mediterranean services. Tanjung
Pelepas covers South-Eastern Asia but its services also extend to the Indian
subcontinent and Australia/New Zealand. Salalah serves the Middle East, East Africa
and the Indian Ocean, linking up with the Europe-Eastern Asia trade route. Last, Miami
in the United States and Manzanillo in Panama organize the American network.
INSERT TABLE 5
These pure transhipment hubs complement the hinterland ports which also
perform an interconnection function. In Northern Europe, Rotterdam, Felixstowe and
Bremerhaven play an important role in this respect. They are located at the intersection
of the East-West services using mother vessels from Eastern Asia and North America,
which allows Maersk to provide high volume links between the economic heartland of
Europe and the rest of the world. However, at the same time, these ports are also visited
by the North-South lines serving Africa or Latin America and the intra-regional lines
serving peripheral markets such as the Baltic. In Eastern Asia, Hong Kong first of all
serves the Pearl River delta but also permits connections with Chinese ports. Last,
although Yokohama is primarily the port for Japan, it also organizes services in North-
Eastern Asia. These ports serve a strategic double function. They act mainly as
hinterland ports but also possess transhipment functions. This is why the Möller group
seeks to operate dedicated terminals operated by its subsidiary, AP Möller Terminals.
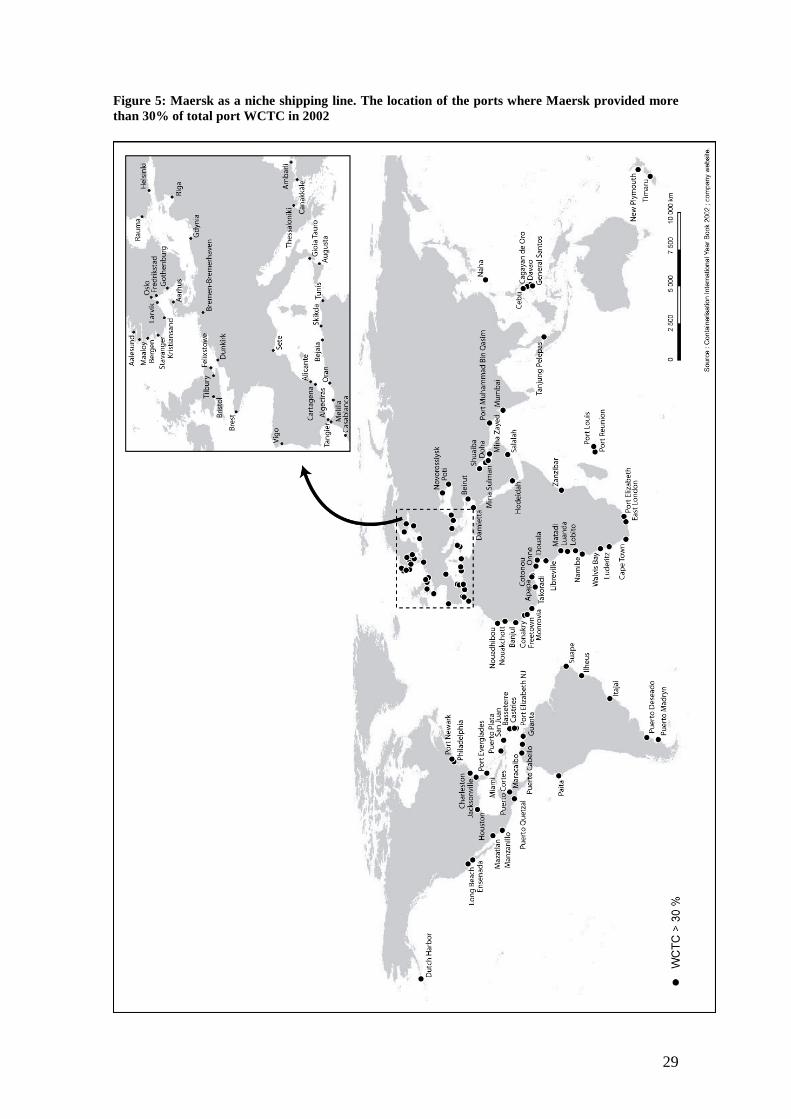
3.4: A niche shipping line
14
This global coverage of markets by means of “hub and spoke” network also
permits Maersk to operate as a niche shipping line. The Danish company has a
monopoly position (100% of the available WCTC) at 31 ports. It provides more than
50% of the WCTC in 62 ports in the world and more than 30% in 110 ports (see Figure
5). These are secondary ports, and usually very small, but they are ports where the
position of monopoly or strong domination doubtless provides secure profits and
considerable freedom as regards freight pricing. These ports are located in zones which
are served from the hubs, in the Western Mediterranean/North African and Western
African/South African ranges from Algeciras, the Baltic range from Bremerhaven, the
Middle Eastern ranges from Salalah and the East Coast of North America and the East
Coast of South America from Miami or Manzanillo. The hub therefore provides the
shipping company with a means of specializing in the coverage of a specific
geographical zone, which is how a niche shipping service is defined.
INSERT FIGURE 5
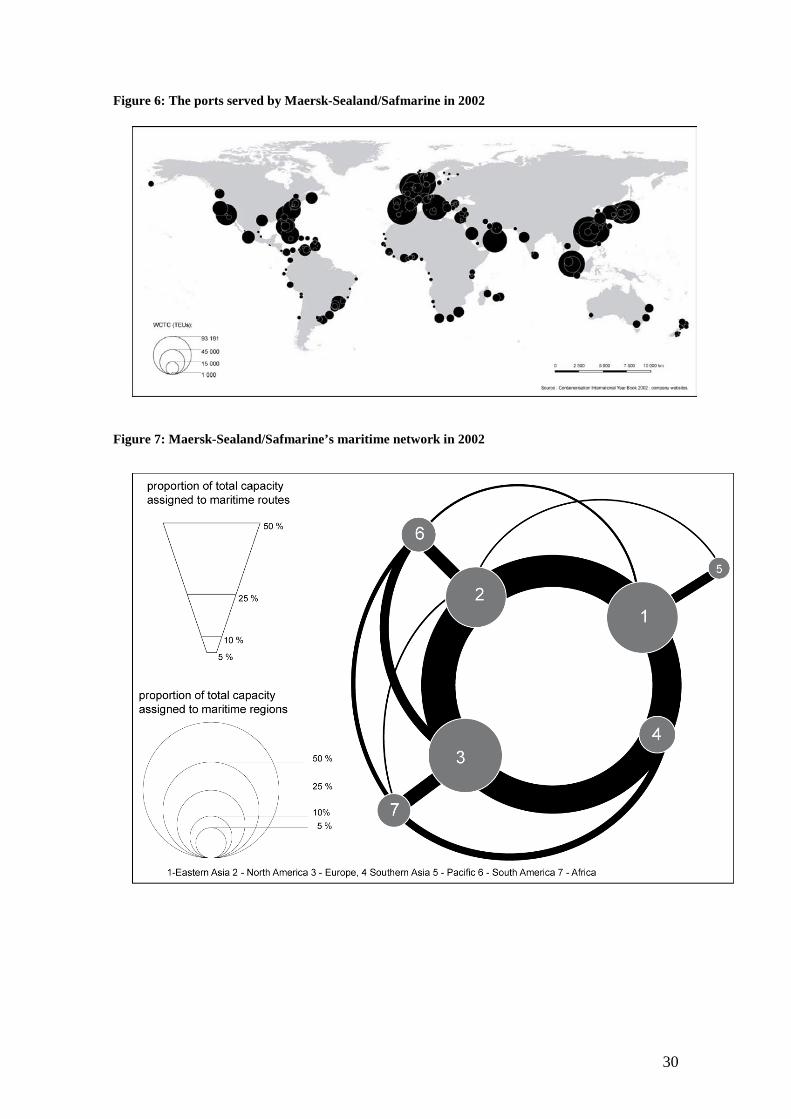
3.5. Maersk in the 21st century, the worlds leading carrier operating a very complex
and diversified network
In 2002, Maersk is the world’s leading carrier in part of its very complex and
diversified network. As with the other leading carriers, the Danish shipping line’s
maritime network is shaped by the major flows of international trade. Eastern Asia,
Europe and North America accounted for 73% of the Maersk’s Weekly Containerized
Transport Capacity (WCTC) in ports. It allows the company to offer high volume
services to the three poles of the Triad. In order to possess sufficient capacity on the
major East-West routes, other shipping lines need to group together and form major
maritime alliances. Alone, Maersk is the market leader on these routes, only pushed into
second place, sometimes, by the major maritime alliances.
15
Maersk is also a worldwide operator. Twenty-seven percent of Maersk's WCTC
serves the countries of the South, which means its network is global in nature. It
operates at a global level, as almost every region of the world (Madagascar being an
exception) was visited by a Maersk vessel. Last but not least, it is also a niche shipping
line as it is very often in a position of monopoly or very strong domination in many
secondary ports.
INSERT FIGURE 6
INSERT FIGURE 7
The traffic volumes on the East-West routes and even on many North-South
routes are sufficiently large to justify separate multi-port services. But the hub and
spoke network superimposed on the direct services provides greater connectivity and
more frequent services to clients. It also facilitates the search for scale economies by
deploying the largest ships on the densest East-West corridors. It is for this reason that
we argue that the direct multi-port service configuration and a hub and spoke network
are complementary in maritime transport. Hubs, because of their complexity, are the
nerve centres of container shipping, yet they also contribute flexibility to the network
and permit adjustments to be made at relatively little cost.
3.6. The role of the shipping services in creating the network of ports
Because of their importance and vulnerability hubs require sophisticated
management. Maersk differs from other shipping lines not only by virtue of its role as a
trail-blazer in the creation of a “hub and spoke” network, but also by virtue of the highly
specific nature of its port network, particularly its network of hubs.
In Maersk’s port hierarchy, such global ports as Hong Kong and Rotterdam still
have an important position, but Kaohsiung, Singapore and Busan have been relegated to
16
“secondary” status. On the other hand, some ports which have lower positions in the
world port hierarchy play a dominant role in Maersk’s maritime network. The
differences are particularly striking in the case of the pure transhipment hubs: Algeciras,
Tanjung Pelepas, Gioia Tauro, Salalah or Manzanillo (see Table 6).
INSERT TABLE 6
What are the reasons for this interest in “secondary ports”? Maersk is
responsible for a major share and sometimes the totality of activity in these ports
(Algeciras, Salalah). In ten of the twenty ports at which Maersk calls most frequently,
the company’s share of port WCTC exceeds 18%. In these ports, Maersk is also a
terminal operator via the cargo handling subsidiary of the AP Möller group, APM
Terminals, which holds a variable interest in these terminals. The only exceptions are
Hong Kong, Singapore, Felixstowe and Manzanillo. Control of the port link is regarded
as fundamental in order to limit the overall costs of the transport chain. It is also a
source of profits. To draw the maximum benefit from these two factors, by far the best
strategy to adopt is independence. Independence of this type is much easier to find or
acquire in relatively “minor” ports than in global ports where there may be a strong port
authority or where the largest international cargo handlers such as Hutchinson or PSA
are present.
The AP Möller group attempts to attain a key and dominant position in a port it
selects as a hub so as to secure its port operations in the long term, with, no doubt, the
ability to influence policy within the port as well. Maritime services play a key role in
creating A.P. Möller’s port network. The services have a degree of geographical
flexibility which means that Maersk can modify its network according to the
opportunities that arise and its financial capacities. The inauguration of a new service
may provide a high volume of traffic immediately to justify investments in a terminal.
17
In 1998, Maersk vacated Jebel Ali, a port in the United Arab Emirates, for Salalah in
Oman. The latter offers very good draft for vessels (16 metres). It has a good location
on the Europe-Eastern Asia route, which means that mother vessels do not have to be
diverted from their ocean route and makes it possible to serve the Middle East, Eastern
Africa and the islands in the Indian Ocean by a network of North-South lines. From
1998 to 1999, the traffic passing through Salalah increased by a factor of 37, from
17,493 to 648,613 TEUs.
In the transhipment hubs, Maersk handles a considerable proportion of the ports’
WCTC, more than 80% in Algeciras and Salalah. These are “Maersk ports”, which
depend completely on the shipping line’s maritime network.
When no competition exists between ports, Maersk’s power means it is able to
create one, even against the most powerful ports. In December 2000, Maersk suddenly
announced that it was leaving the port of Singapore for the neighbouring port of
Tanjung Pelepas, thus threatening Singapore’s quasi-monopoly position as a
transhipment hub in South-Eastern Asia and taking almost 2 million TEUs of traffic
away from it. In a few months, all the shipping services switched to the new port. The
traffic at Tanjung Pelepas increased by a factor of 5 between 2000 and 2001, from
418,000 to 2 million TEUs.
4. Conclusion:
In 2005, Maersk-Sealand purchased P&ONedlloyd and changed its name to
Maersk Line. The Danish operator strengthened its dominant position, accounting for
more than 18% of the transport capacity of the twenty largest shipping lines in the
world. The merger permitted a reorganization of lines which has, so far, resulted in an
increase in the number of services in order to use all the vessels belonging to the two
18
shipping lines. Ultimately, Maersk Line could implement new scenarios for scale
economies. The launching in August 2006 of the Emma Maersk, with a capacity of
between 11 000 and 15 000 TEUs is further indication that Maersk wishes to exploit
still further scale economies through its existing hub and spoke network.
The case study of Maersk demonstrates that direct maritime services and
transhipment configurations are not incompatible. The multi-port model is
complementary to the hub and spoke system, since the two network models possess
different advantages and disadvantages, and when combined permit an extensive global
coverage. Thus the hubs, located at strategic points along the prime East-West artery,
interconnect with other mainline North-South and East-West services. The latter are
essentially multi-port services linking different maritime ranges. The hubs provide great
flexibility to the entire network, a flexibility measured in three ways: 1) providing the
means for the company to serve a very wide market; 2) enabling the company to deploy
ships of different capacities in efficient manner given traffic imbalances; and, 3)
offering customers an extensive choice of services across a global spectrum of markets.
Feedering services are a distinct and separate element in the network and are
entirely dependent on a hub configuration. However, an increase in traffic between two
markets may lead the shipping line to replace indirect feeder services with direct port
connections, thereby supplanting the inconveniences of one system with the advantages
of another.
Because they serve primarily as interconnection points between mainline
services, hubs are the control centres of the network. This is not without danger. Any
dislocations in a hub may have major repercusions throughout the entire network. The
response of Maersk to this potential threat has been to establish its own hub ports over
the last 20 years, operating them under its subsidiary, AP Möller Terminals.
19
Acknowledgements:
The author would like to thank Prof. B. Slack for its comments and suggestions on an
earlier version of this paper and for the comments of two anonymous referees.
References
Ashar, A., 1999. The fourth revolution. Containerisation international. December, 57-
61.
Ashar, A., 2000. 2020 vision. Containerisation international. January, 35-39.
Ashar, A. 2002. Revolution now. Containerisation international. January, 56-59.
Baird, A. J., 2006. Optimising the container transhipment hub location in Northern
Europe. Journal of Transport Geography. 14(3), 195-214.
Bryan, D. O'Kelly, M. E., 1999. Hub-And-Spoke Networks in Air Transportation: An
Analytical Review. Journal of Regional Science. 39(2), 275-296.
Brooks, M.R., 2000. Sea Change in liner shipping. Oxford: Pergamon.
Charlier, J., 1992. Ports and Hinterland connections. In Dolman A., Van Ettinger J.
(Eds), Ports as Nodal Points in a Global system. Oxford: Pergamon, pp.105-121.
Cullinane, K., Khanna, M., 2000. Economies of scale in large containerships: optimal
size and geographical implications. Journal of Transport Geography. 8,181-195.
Dobruszkes, F., 2006. An analysis of European low-cost airlines and their networks.
Journal of Transport Geography. 14(4), 249-264.
Drewry, 2004. The Drewry Annual Container Market Review and Forecast 2004/05.
London.
20
Fleming, D.K., Hayuth, Y., 1994. Spatial Characteristics of Transportation Hubs:
Centrality and Intermediacy. Journal of Transport Geography. 2, 3-18.
Frankel, E. G., 2002. The Economics of International Trade Logistics and Shipping
Transactions. In Costas Th. Grammenos (Eds), The Handbook of Maritime Economics
and Business
Frémont, A. 2004. Le trafic maritime conteneurisé : ouverture sur le monde et
intégration régionale. In Taillard, Ch. (Eds), Intégrations régionales en Asie orientale,
Paris : Editions des Indes savantes, pp. 45-61.
Frémont, A., Soppé, M., 2004. Les stratégies des armateurs de lignes régulières en
matière de dessertes maritimes. Belgéo. 4, 391-406.
Gouvernal, E., Debrie, J., Slack, B., 2005. Dynamics of change in the port system of the
western Mediterranean. Maritime Policy and Management. 32(2), 1-15.
Guy, E., 2003. Shipping line networks and the integration of South America trades.
Maritime Policy and Management. 30(3), 231-242.
Hayuth, Y., 1992. Multimodal Freight Transport. In Hoyle, B., Knowles R., Modern
Transport Geography, London: Belhaven, pp.200-214.
, Londres, Hong Kong : LLP Professional Publishing, pp. 877- 898.
Hoffmann, J., 1998. Concentration in Liner Shipping: its Causes and Impacts for Port
and Shipping services in Developing regions. PDF document
http://www.eclac.cl/transporte/ (Economic Commission for Latin America and the
Carribean).
Heaver, T. D., 2002. The Evolving Roles of Shipping Lines in International Logistics.
International Journal of Maritime Economics. 4, 210-230.
Imai, A., Nishimura. E., Papadimitriou. S., Liu. M., 2006. The economic viability of
container mega-ships. Transportation Research Part E. 42(1), 21-41.
Martin, J. C., Roman, C., 2004. Analysing competition for hub location in
21
intercontinental aviation markets. Transportation Research Part E. 40(2), 135-150.
Notteboom, T., 2004. A carrier’s perspective on container network configuration at sea
and on land. Journal of International Logistics and Trade. 1(2), 65-87.
Notteboom, T., Konings, R., 2004. Network dynamics in container transport by barge.
Belgéo. 4, 461-478.
Rimmer, P., 2004. Global Flows, Local Hubs, Platforms and Corridors; Regional and
Economic Integration in Northeast Asia. Journal of International Logistics and Trade.
1(2), 1-24.
Rodrigue, J-P., Slack, B., Comtois, C., 2006. Transportation systems and networks. In
The geography of Transport System. Routledge. 38-73.
Slack, B., 1985. Containerization, inter-port competition, and port selection. Maritime
Policy and Management. 12(4), 293-303.
Slack, B., 1993. Pawns in the Game : Ports in a Global Transportation System. Growth
and Change. 24, 579-588.
Slack, B., Comtois, C., McCalla R., 2002. Strategic alliances in the container shipping
industry: a global perspective. Maritime Policy and Management. 29(1), 65-76.
Zohil, J., Prijon, M., 1999. The MED Rule: the interdependence of container throughput
and transhipment volumes in the Mediterranean ports. Maritime Policy and
Management. 26(2), 175-193.
22
TABLES Table 1: Origin/destination matrix, in TEUs*
CA1 CA2 CA3 PA1 PA2 PA3 TOTAL CO1 1 2 4 1 2 4 14 CO2 2 4 8 2 4 8 28 CO3 4 8 16 4 8 16 56 PO1 1 2 4 1 2 4 14 PO2 2 4 8 2 4 8 28 PO3 4 8 16 4 8 16 56
TOTAL 14 28 56 14 28 56 196 * a multiple of the figures indicated can be used
Table 2: The number of containers handled in the ports and the inland centre according to the different configurations
Configu-ration
PO1 PO2 PO3 PA1 PA2 PA3 IC TH Total TEU TEU TEU %* TEU TEU TEU %* TEU TEU %* TEU
28 56 112 0 28 56 112 0 392 1 28 56 112 0 28 56 112 0 - - 392 2 28 56 112 0 28 56 112 0 - - 392 3 28 56 280 60 14 28 238 35 - - 644 4 28 56 112 0 0 0 196 0 84 392 100 868
* indicates the percentage of containers passing through the port that are transhipped.
23
Table 3: Advantages and disadvantages of the different transport solutions covered in Figure 1 Advantages Disadvantages Outcome
Shipping line Shipper Shipping line Shipper Shipping line Shipper
1 - Réseau point à point facile à exploiter - Closeness to the market
- Short transit time
- No massification - Nombreux navires nécessaires pour assurer des fréquences suffisantes.
- low service frequencies if volumes are not high enough - nombre de destinations offertes est limité
- Possible if volumes are high on the segment in question - Possible for a niche market - Segmented network
- rapidité et qualité de service si fréquence suffisante - risque d’un service cher
2 - More maritime massification than in 1
- - service plus long. Plus de navires sont nécessaire pour assurer une fréquence égale
- Longer transit time
3 - Maritime massification - More flexibility as regards assignment of the vessel and container fleet
- Possible increase of the number of markets served by the hinterland hub
- Complex organization - Possible congestion at the hinterland hub
- Longer transit time - Distance from the market
- More densely interconnect network - Broader geographical coverage - Economies of scale
- possible si les tarifs sont moins chers qu’avec des services directs.
4 - Location of the maritime hub on the major East-West navigation routes - Denser interconection between the East-West, North-South and feedering shipping lines - Choice of the maritime hub by the shipping line
- Nombreuses destinations géographiques possibles : un seul armement peut traiter l’ensemble des trafics du chargeur
- Very great increase in the number of transhipment operations
- Idem que ci-dessus - Ne pas être dépendant d’un seul armement pour l’ensemble de ses trafics. Nécessité de jouer sur plusieurs transporteurs.
- Possibility of a fully interconnected network through the setting up of several hubs. - Possibility of coverage of the whole world. - Economies of scale
- idem que ci-dessus. - possibilité partenariat entre armement global et chargeur global - risque de dépendance par rapport à l’armement.
24
Table 4: Type of maritime services provided by Maersk, number of lines per link and capacity per link (TEUs), 1994-2002 1994 2002 No. TEUs No. TEUs
EAST-WEST LINES: 12 143 884 16 425 909 Simple: 9 86 620 11 211 603 Europe/Eastern Asia 3 66 158 2 100 026
Europe/CE North America 1 - 4 43,910
Eastern Asia/CO North America 5 20 462 3 35 074
Europe/Middle East 0 - 1 22 200
Eastern Asia/Middle East 0 - 1 10 393
Pendulum: 3 57 264 5 214 306 Europe/Eastern Asia/WC North America 0 - 2 92 400 EC North America/WC North America/Eastern Asia/Europe 0 - 1 53 014
EC North America/WC North America/Eastern Asia 0 - 1 34 489
EC North America/Europe du Sud/Middle East 2 10 128 1 34 403
Europe/CE North America/WC North America 1 47 136 0 -
18 37 761 75 210 594 Intra-regional lines within the Triad: 7 1 500 31 49 819 intra-European 7 1 500 20 35 116
intra-Eastern Asian 0 - 11 14 703
To Australia/New Zealand breaking down into: 2 3 950 5 36 032
Eastern Asia/Australia/New Zealand 2 3 950 4 24 038
North America/Australia/New Zealand 0 - 1 11 994
North-South lines breaking down into: 9 32 311 39 124 743 Simple North-South breaking down into: 9 32 311 24 88 260 Europe/Africa 2 12 858 8 28 667
Europe/South America 0 - 4 26 264
North America/South America 4 7 387 6 14 161
Eastern Asia/Africa 0 - 1 7 988
North America/Africa 0 - 1 6 219
Middle East/Africa 1 3 000 4 4 961
Eastern Asia/Southern Asia 2 9 066 0 -
North-South pendulum lines: 0 - 1 15 633 Middle East/Africa/East Coast of South America 0 - 1 15 633
Intra-regional South-South lines breaking down into 0 - 14 20 850
intra-South American 0 - 8 10 649
intra-Middle Eastern 0 - 5 9 773
intra-African 0 - 1 428
TOTAL 30 181 645 91 636 503 EC= East Coast; WC= West Coast. Source : WCTC Database 1994 et 2003.
25
Table 5: Number of maritime lines of each type of the Maersk-Sealand group’s principal transhipment hubs in 2002 Transhipment
hubs
Number of maritime lines
East-West North-South Intra-regional Australia/New Zealand Total
America
Manzanillo 3 1 2 1 7
Miami 3 4 0 0 7
Northern Europe
Rotterdam 8 5 2 0 15
Bremerhaven 6 3 5 0 14
Felixstowe 8 2 2 0 12
Southern Europe
Algeciras 4 9 5 0 18
Gioia Tauro 3 1 10 0 14
Middle East / Indian Ocean
Salalah 2 7 3 0 12
Eastern Asia
Hong Kong 9 3 4 1 17
Tanjung Pelepas 4 2 3 3 12
Yokohama 5 0 2 1 8
Source: WCTC Database 2003
Table 6 : Maersk’s port hierarchy in 2002
Position in Maersk’s port hierarchy on the basis of
WCTC
Position in the world port
hierarchy on the basis of
WCTC
Position in the world port
hierarchy on the basis of
traffic in 2002
Maersk’s percentage of the port’s
WCTC
Hong Kong 1 1 1 7.4 Algeciras 2 45 27 81.1 Felixstowe 3 13 19 23.2 Tanjung Pelepas 4 42 22 62.8 Gioia Tauro 5 17 18 22.4 Rotterdam 6 6 7 13.4 Salalah 7 79 59 97.2 Bremerhaven 8 27 17 32.7 Yokohama 9 14 26 18.5 Kaoshiung 10 3 5 9.0
Source: WCTC Database 2003
26
Figures
Figure 1: Maritime and inland configurations

27
Figure 2: The emergence of a hub and spoke network at the end of the 1980s
Figure 3: The ports served by Maersk in 1994
28
Figure 4: Global coverage of markets in 2002
29
Figure 5: Maersk as a niche shipping line. The location of the ports where Maersk provided more than 30% of total port WCTC in 2002
30
Figure 6: The ports served by Maersk-Sealand/Safmarine in 2002
Figure 7: Maersk-Sealand/Safmarine’s maritime network in 2002

![[PPT]Slide 1 · Web viewMaersk Rhine. Handytankers Ks. Maersk Rhone. Maersk Rapier. Ocean Quest. Maersk Rouen. Maersk Rugen. Asashio Maru. Bow Fortune. Bow Century. Dl](https://img.pdfslide.net/doc/110x75/5aa343597f8b9ada698e029f/pptslide-1-viewmaersk-rhine-handytankers-ks-maersk-rhone-maersk-rapier-ocean.jpg)