Embed Size (px)
Citation preview
Global Metals and Mining ConferenceDecember 2, 2015
Forward Looking Information
Both these slides and the accompanying oral presentations contain certain forward-looking statements within the meaning of the United States PrivateSecurities Litigation Reform Act of 1995 and forward-looking information within the meaning of the Securities Act (Ontario). Forward-looking statementsinvolve known and unknown risks, uncertainties and other factors which may cause the actual results, performance or achievements of Teck to bematerially different from any future results, performance or achievements expressed or implied by the forward-looking statements. These forward-lookingstatements include statements relating to the long-life our assets, estimated profit and estimated EBITDA, our expectation regarding market supply anddemand in the commodities we produce, our statement that we are in a strong financial position, our expected year-end cash balance, 2016 totalspending reduction expectations, capital and operating cost savings, our level of liquidity, statements regarding our credit rating, the availability of orcredit facilities and other sources of liquidity, reserve and resource life estimates, 2015 production and cost guidance, 2015 capital expenditure guidance,our statements that we have a strong growth pipeline, potential benefits of LNG use in haul trucks, all projections for Project Corridor, statementsregarding the production and economic expectations for the Fort Hills project, including but not limited to operating and sustaining cost projections,sustaining capital projection, free cash flow projections, estimated netback, operating margin, Alberta oil royalty, net margin, Teck’s share of go-forwardcapex, mine life, Fort Hills capital cost projections, transportation capacity and our ability to secure transport for our Fort Hills production, andmanagement’s expectations with respect to production, demand and outlook in the markets for coal, copper, zinc and energy.
These forward-looking statements involve numerous assumptions, risks and uncertainties and actual results may vary materially, which are described inTeck’s public filings available on SEDAR (www.sedar.com) and EDGAR (www.sec.gov). In addition, the forward-looking statements in these slides andaccompanying oral presentation are also based on assumptions, including, but not limited to, regarding general business and economic conditions, thesupply and demand for, deliveries of, and the level and volatility of prices of, zinc, copper and coal and other primary metals and minerals as well as oil,and related products, the timing of the receipt of regulatory and governmental approvals for our development projects and other operations, our costs ofproduction and production and productivity levels, as well as those of our competitors, power prices, continuing availability of water and power resourcesfor our operations, market competition, the accuracy of our reserve estimates (including with respect to size, grade and recoverability) and the geological,operational and price assumptions on which these are based, conditions in financial markets, the future financial performance of the company, our abilityto attract and retain skilled staff, our ability to procure equipment and operating supplies, positive results from the studies on our expansion projects, ourcoal and other product inventories, our ability to secure adequate transportation for our products, our ability to obtain permits for our operations andexpansions, our ongoing relations with our employees and business partners and joint venturers. Management’s expectations of mine life are based onthe current planned production rates and assume that all resources described in this presentation are developed. Certain forward-looking statements arebased on assumptions regarding the price for Fort Hills product and the expenses for the project, as disclosed in the slides. Assumptions regardingliquidity are based on the assumption that Teck’s current credit facilities remain fully available. Assumptions regarding our liquidity are also based oncurrent foreign exchange rates and assume that Teck’s 2015 guidance for production, costs and capital expenditures are met. Assumptions regardingFort Hills also include the assumption that project development and funding proceed as planned. Assumptions regarding our potential reserve andresource life assume that all resources are upgraded to reserves and that all reserves and resources could be mined. The foregoing list of assumptionsis not exhaustive. Assumptions regarding the Corridor project include that the transaction closes as planned and that the project is built and operated inaccordance with the conceptual preliminary design from a preliminary economic assessment.
2
Forward Looking Information
Factors that may cause actual results to vary materially include, but are not limited to, changes in commodity and power prices, changes in marketdemand for our products, changes in interest and currency exchange rates, acts of foreign governments and the outcome of legal proceedings,inaccurate geological and metallurgical assumptions (including with respect to the size, grade and recoverability of mineral reserves and resources),unanticipated operational difficulties (including failure of plant, equipment or processes to operate in accordance with specifications or expectations, costescalation, unavailability of materials and equipment, government action or delays in the receipt of government approvals, industrial disturbances orother job action, adverse weather conditions and unanticipated events related to health, safety and environmental matters), union labour disputes,political risk, social unrest, failure of customers or counterparties to perform their contractual obligations, changes in our credit ratings, unanticipatedincreases in costs to construct our development projects, difficulty in obtaining permits, inability to address concerns regarding permits of environmentalimpact assessments, and changes or further deterioration in general economic conditions. We will not achieve the maximum mine lives of our projects,or be able to mine all reserves at our projects, if we do not obtain relevant permits for our operations. Our Fort Hills project is not controlled by us andconstruction and production schedules may be adjusted by our partners. The Corridor project will be jointly owned. The effect of the price of oil onoperating costs will be affected by the exchange rate between Canadian and U.S. dollars.
Statements concerning future production costs or volumes are based on numerous assumptions of management regarding operating matters and onassumptions that demand for products develops as anticipated, that customers and other counterparties perform their contractual obligations, thatoperating and capital plans will not be disrupted by issues such as mechanical failure, unavailability of parts and supplies, labour disturbances,interruption in transportation or utilities, adverse weather conditions, and that there are no material unanticipated variations in the cost of energy orsupplies.
We assume no obligation to update forward-looking statements except as required under securities laws. Further information concerning assumptions,risks and uncertainties associated with these forward-looking statements and our business can be found in our Annual Information Form for the yearended December 31, 2014, filed under our profile on SEDAR (www.sedar.com) and on EDGAR (www.sec.gov) under cover of Form 40-F.
3
Agenda
Teck Overview & Strategy
Commodity Market Observations
Teck Update
4
Long-Term Strategy
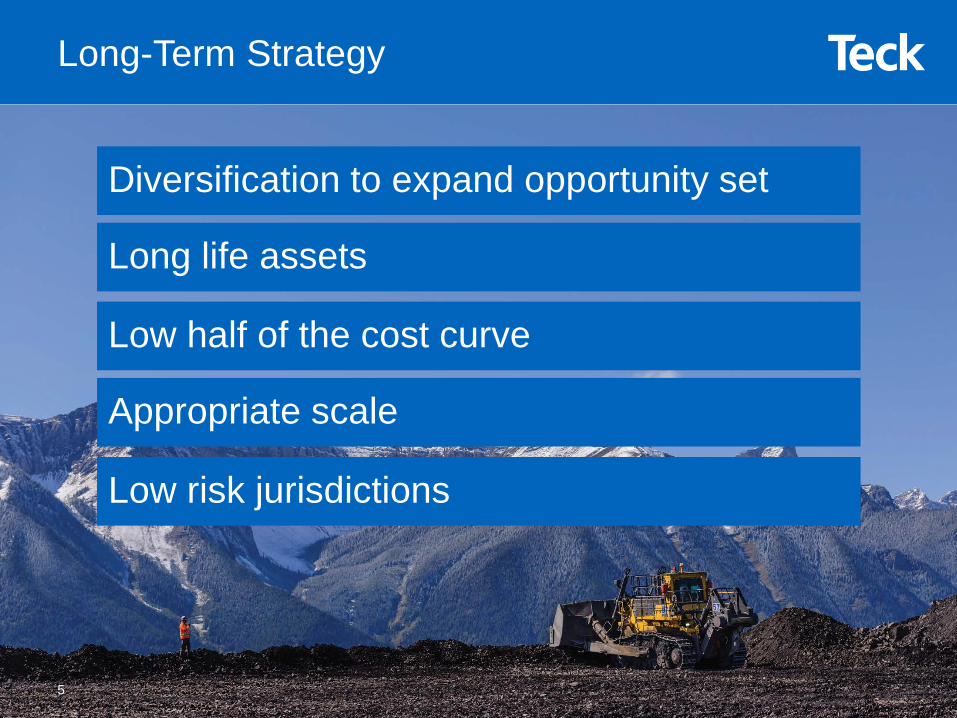
Diversification to expand opportunity set
Long life assets
Low half of the cost curve
Appropriate scale
Low risk jurisdictions
5
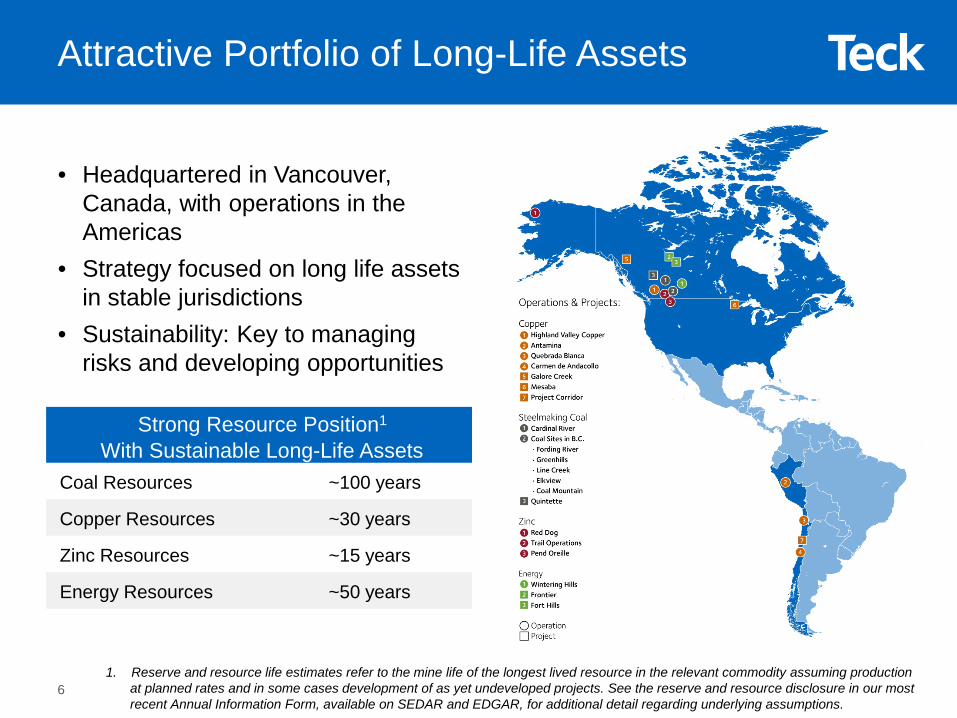
• Headquartered in Vancouver, Canada, with operations in the Americas
• Strategy focused on long life assets in stable jurisdictions
• Sustainability: Key to managing risks and developing opportunities
Strong Resource Position1
With Sustainable Long-Life AssetsCoal Resources ~100 years
Copper Resources ~30 years
Zinc Resources ~15 years
Energy Resources ~50 years
Attractive Portfolio of Long-Life Assets
1. Reserve and resource life estimates refer to the mine life of the longest lived resource in the relevant commodity assuming production at planned rates and in some cases development of as yet undeveloped projects. See the reserve and resource disclosure in our most recent Annual Information Form, available on SEDAR and EDGAR, for additional detail regarding underlying assumptions.
6
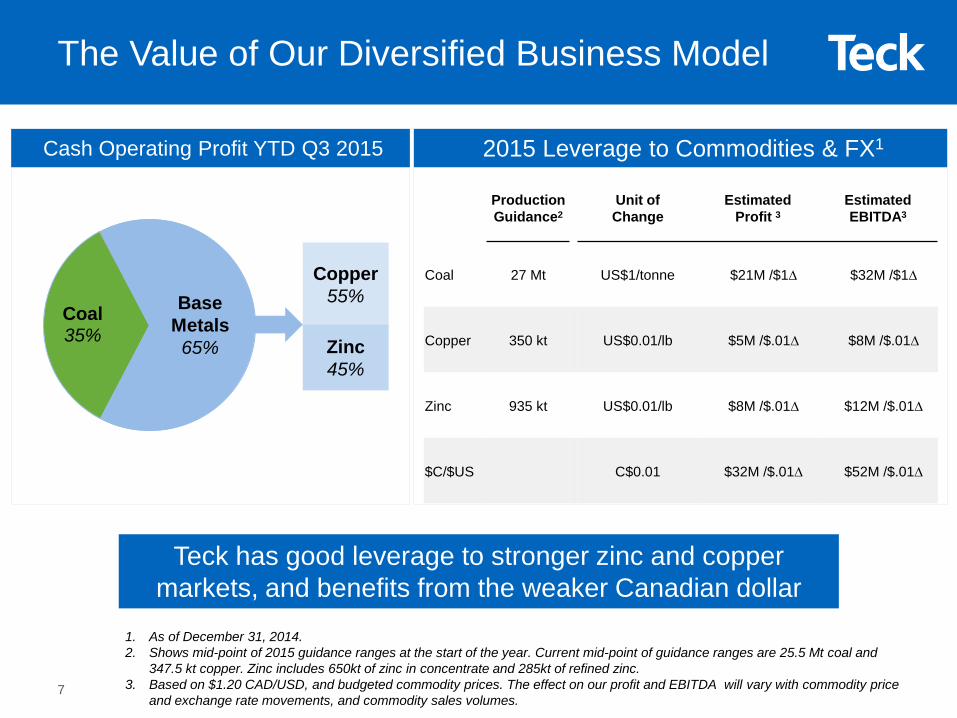
Coal35%
Copper 55%
Zinc45%
Teck has good leverage to stronger zinc and copper markets, and benefits from the weaker Canadian dollar
The Value of Our Diversified Business Model
Cash Operating Profit YTD Q3 2015
Production Guidance2
Unit of Change
Estimated Profit 3
EstimatedEBITDA3
Coal 27 Mt US$1/tonne $21M /$1∆ $32M /$1∆
Copper 350 kt US$0.01/lb $5M /$.01∆ $8M /$.01∆
Zinc 935 kt US$0.01/lb $8M /$.01∆ $12M /$.01∆
$C/$US C$0.01 $32M /$.01∆ $52M /$.01∆
2015 Leverage to Commodities & FX1
1. As of December 31, 2014.2. Shows mid-point of 2015 guidance ranges at the start of the year. Current mid-point of guidance ranges are 25.5 Mt coal and
347.5 kt copper. Zinc includes 650kt of zinc in concentrate and 285kt of refined zinc.3. Based on $1.20 CAD/USD, and budgeted commodity prices. The effect on our profit and EBITDA will vary with commodity price
and exchange rate movements, and commodity sales volumes.
Base Metals
65%
7
Agenda
Teck Overview & Strategy
Commodity Market Observations
Teck Update
8
YearsP
eak
to T
roug
h C
ycle
% C
hang
e
12%
-20%
14%
-12%
11%
-10%
547%
-17%
1%
-25%
21%
-12%
22%
-18%
347%
-26%
188%
-55%
94%
-73%
24 3 2
42
17
41
52 2 1 1
52 2 1 2
5
0
5
10
15
20
25
30
35
40
45
50
-500%
-300%
-100%
100%
300%
500%
700%
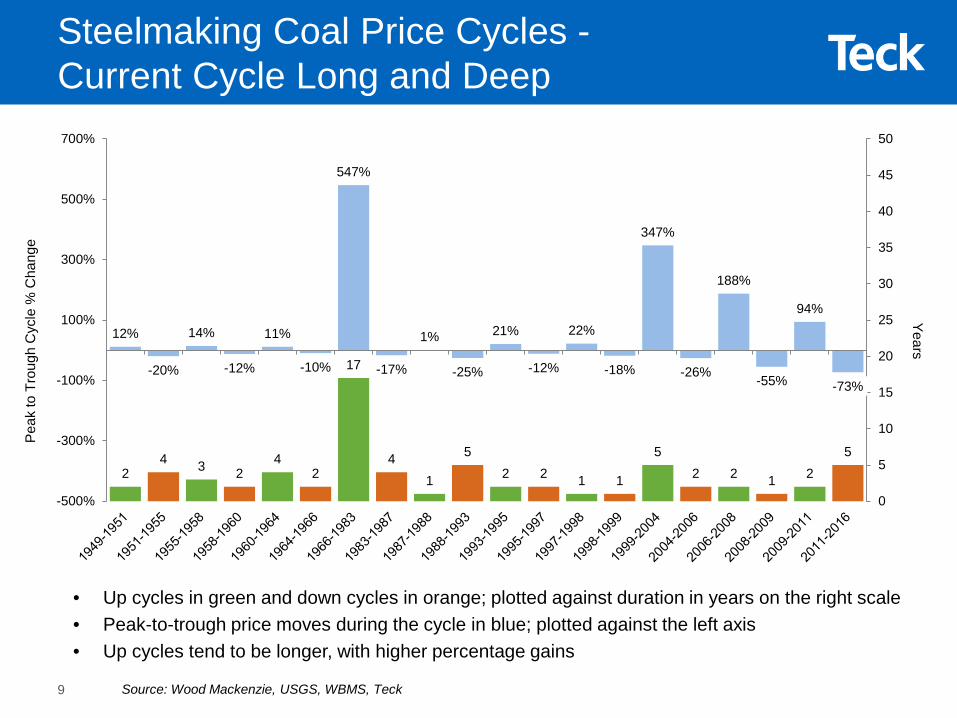
Steelmaking Coal Price Cycles -Current Cycle Long and Deep
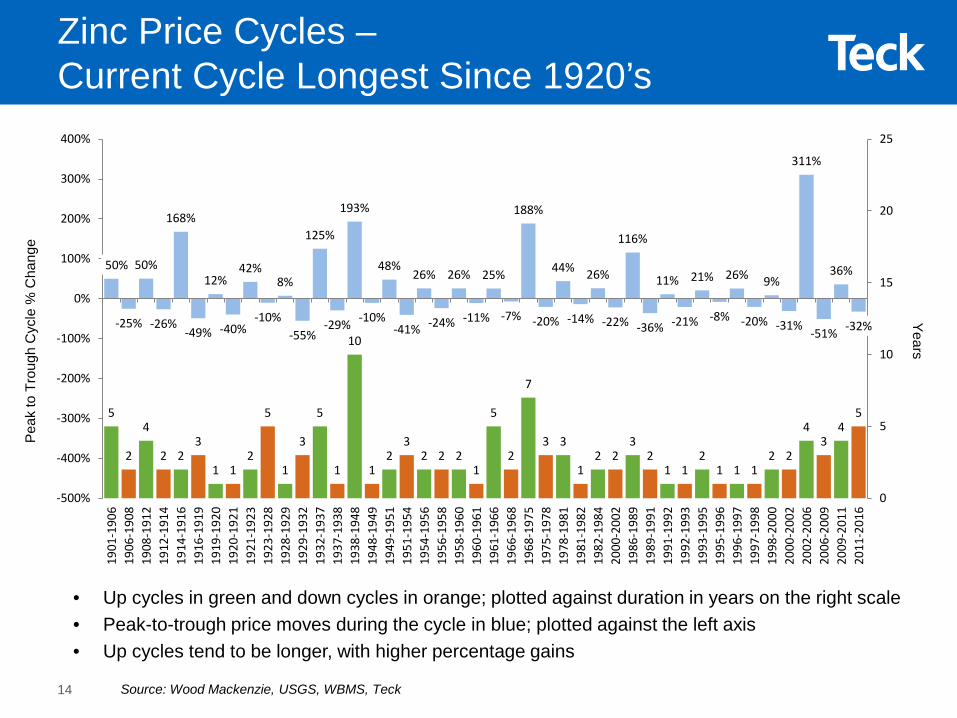
• Up cycles in green and down cycles in orange; plotted against duration in years on the right scale• Peak-to-trough price moves during the cycle in blue; plotted against the left axis• Up cycles tend to be longer, with higher percentage gains
Source: Wood Mackenzie, USGS, WBMS, Teck9
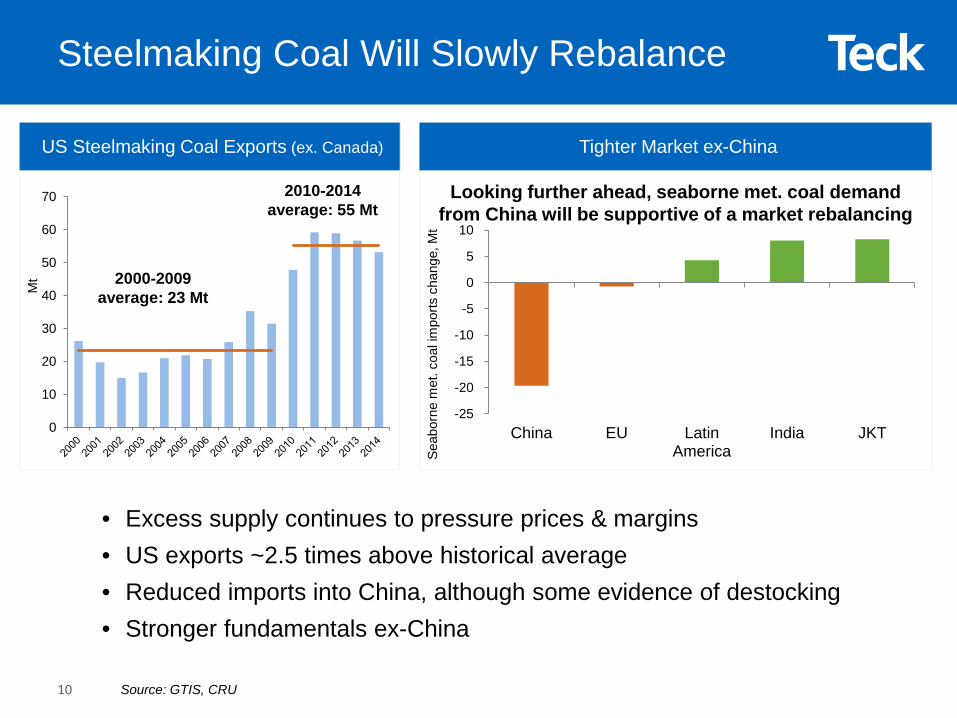
Steelmaking Coal Will Slowly Rebalance
• Excess supply continues to pressure prices & margins• US exports ~2.5 times above historical average• Reduced imports into China, although some evidence of destocking• Stronger fundamentals ex-China
Tighter Market ex-ChinaUS Steelmaking Coal Exports (ex. Canada)
0
10
20
30
40
50
60
70
2000-2009 average: 23 Mt
2010-2014 average: 55 Mt
Source: GTIS, CRU
Mt
-25
-20
-15
-10
-5
0
5
10
China EU LatinAmerica
India JKTSe
abor
nem
et. c
oal i
mpo
rts c
hang
e, M
t
Looking further ahead, seaborne met. coal demand from China will be supportive of a market rebalancing
10
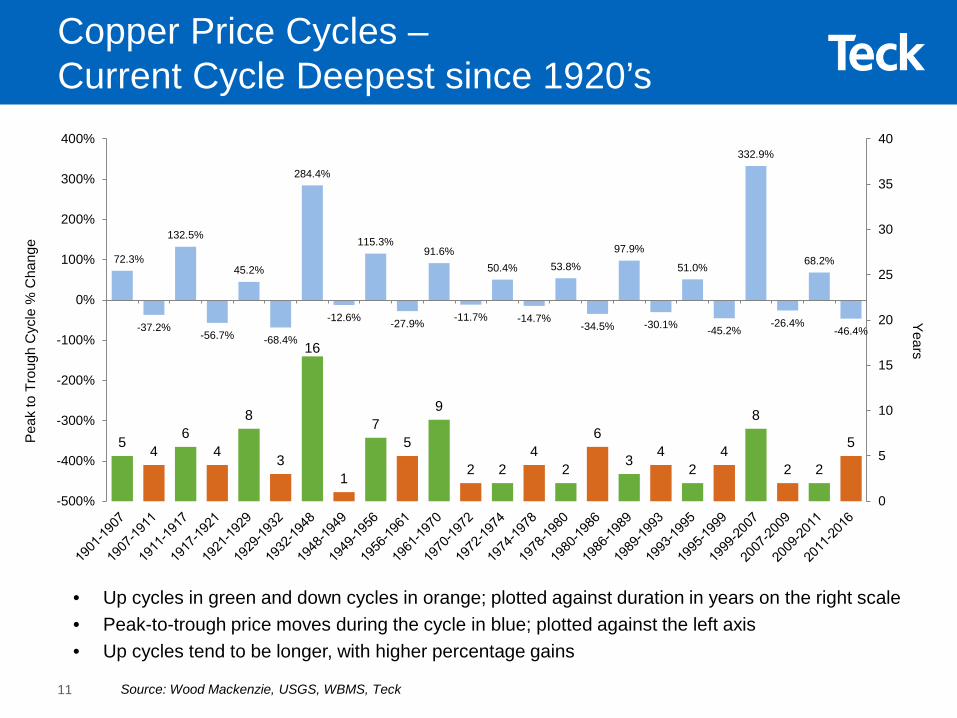
• Up cycles in green and down cycles in orange; plotted against duration in years on the right scale• Peak-to-trough price moves during the cycle in blue; plotted against the left axis• Up cycles tend to be longer, with higher percentage gains
Copper Price Cycles –Current Cycle Deepest since 1920’s
72.3%
-37.2%
132.5%
-56.7%
45.2%
-68.4%
284.4%
-12.6%
115.3%
-27.9%
91.6%
-11.7%
50.4%
-14.7%
53.8%
-34.5%
97.9%
-30.1%
51.0%
-45.2%
332.9%
-26.4%
68.2%
-46.4%
5 46
4
8
3
16
1
75
9
2 24
2
6
3 42
4
8
2 2
5
0
5
10
15
20
25
30
35
40
-500%
-400%
-300%
-200%
-100%
0%
100%
200%
300%
400%
YearsP
eak
to T
roug
h C
ycle
% C
hang
e
Source: Wood Mackenzie, USGS, WBMS, Teck11
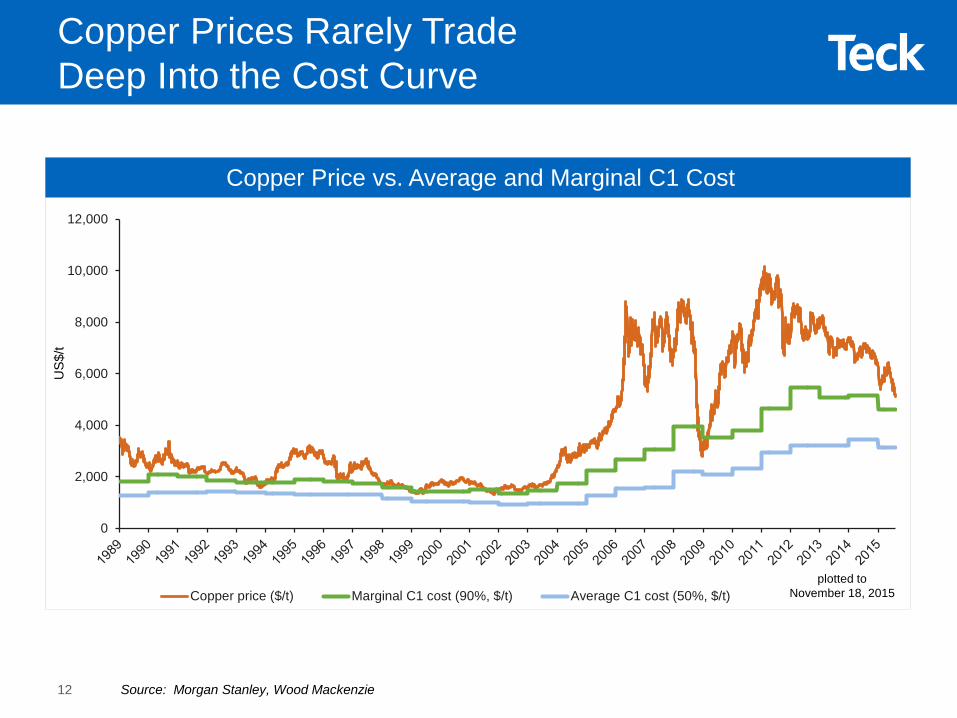
Copper Prices Rarely Trade Deep Into the Cost Curve
Copper Price vs. Average and Marginal C1 Cost
0
2,000
4,000
6,000
8,000
10,000
12,000
Copper price ($/t) Marginal C1 cost (90%, $/t) Average C1 cost (50%, $/t)
US$
/t
Source: Morgan Stanley, Wood Mackenzie
plotted to November 18, 2015
12
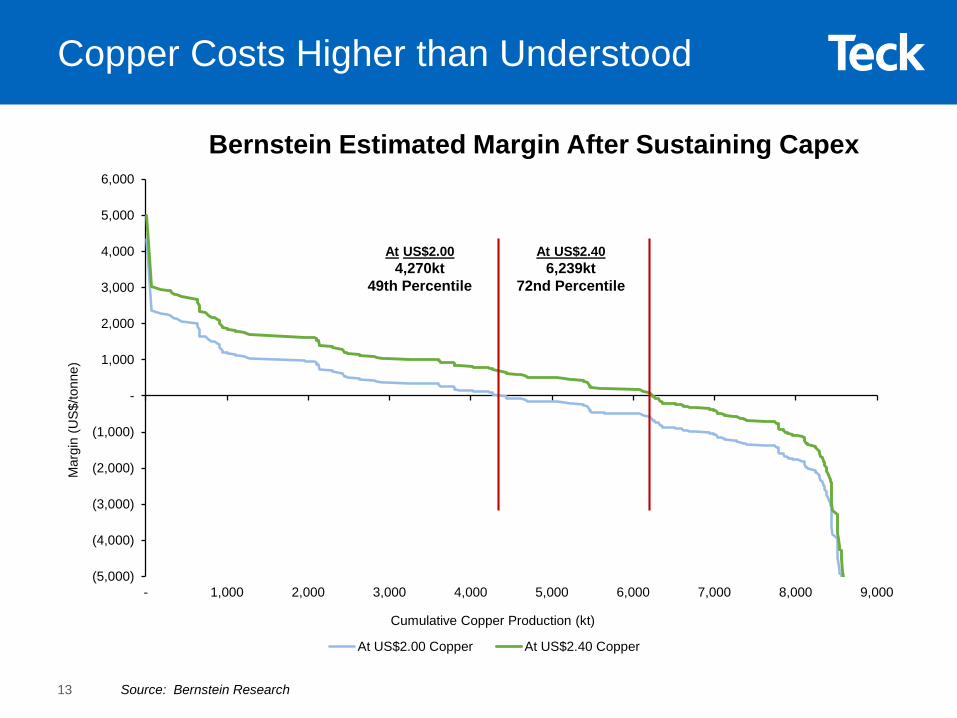
Copper Costs Higher than Understood
Source: Bernstein Research
Bernstein Estimated Margin After Sustaining Capex
(5,000)
(4,000)
(3,000)
(2,000)
(1,000)
-
1,000
2,000
3,000
4,000
5,000
6,000
- 1,000 2,000 3,000 4,000 5,000 6,000 7,000 8,000 9,000
Mar
gin
(US$
/tonn
e)
Cumulative Copper Production (kt)
At US$2.00 Copper At US$2.40 Copper
At US$2.40 6,239kt
72nd Percentile
At US$2.004,270kt
49th Percentile
13
• Up cycles in green and down cycles in orange; plotted against duration in years on the right scale• Peak-to-trough price moves during the cycle in blue; plotted against the left axis• Up cycles tend to be longer, with higher percentage gains
Zinc Price Cycles –Current Cycle Longest Since 1920’s
YearsP
eak
to T
roug
h C
ycle
% C
hang
e
Source: Wood Mackenzie, USGS, WBMS, Teck
50%
-25%
50%
-26%
168%
-49%
12%
-40%
42%
-10%
8%
-55%
125%
-29%
193%
-10%
48%
-41%
26%
-24%
26%
-11%
25%
-7%
188%
-20%
44%
-14%
26%
-22%
116%
-36%
11%
-21%
21%
-8%
26%
-20%
9%
-31%
311%
-51%
36%
-32%
5
2
4
2 23
1 12
5
1
3
5
1
10
12
32 2 2
1
5
2
7
3 3
12 2
32
1 12
1 1 12 2
43
45
0
5
10
15
20
25
-500%
-400%
-300%
-200%
-100%
0%
100%
200%
300%
400%
1901
-190
619
06-1
908
1908
-191
219
12-1
914
1914
-191
619
16-1
919
1919
-192
019
20-1
921
1921
-192
319
23-1
928
1928
-192
919
29-1
932
1932
-193
719
37-1
938
1938
-194
819
48-1
949
1949
-195
119
51-1
954
1954
-195
619
56-1
958
1958
-196
019
60-1
961
1961
-196
619
66-1
968
1968
-197
519
75-1
978
1978
-198
119
81-1
982
1982
-198
420
00-2
002
1986
-198
919
89-1
991
1991
-199
219
92-1
993
1993
-199
519
95-1
996
1996
-199
719
97-1
998
1998
-200
020
00-2
002
2002
-200
620
06-2
009
2009
-201
120
11-2
016
14
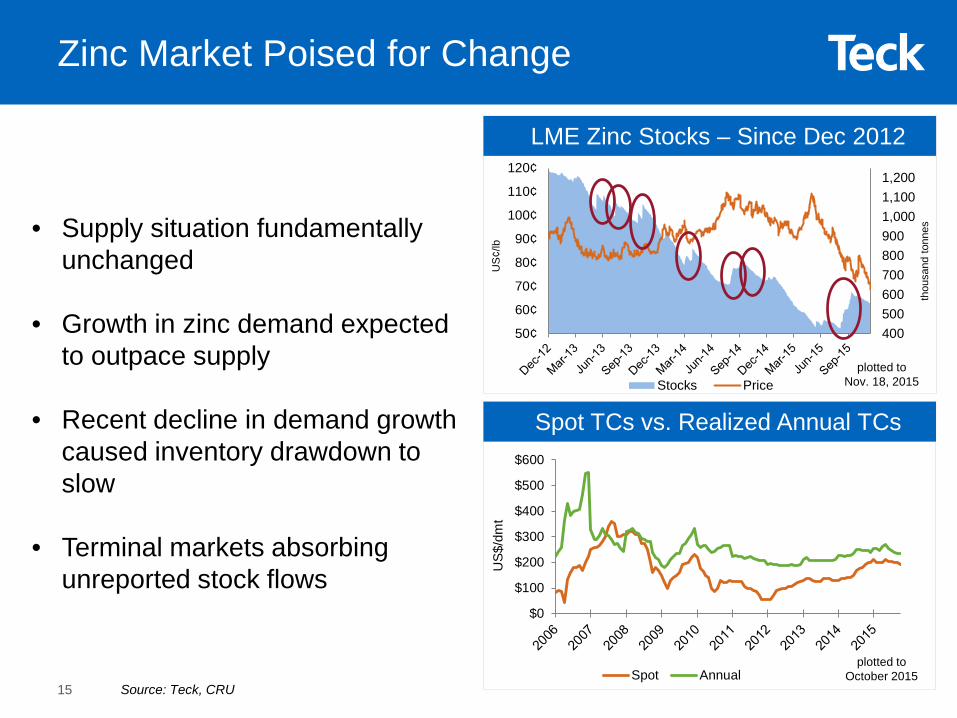
Spot TCs vs. Realized Annual TCs
LME Zinc Stocks – Since Dec 2012
Zinc Market Poised for Change
• Supply situation fundamentally unchanged
• Growth in zinc demand expected to outpace supply
• Recent decline in demand growth caused inventory drawdown to slow
• Terminal markets absorbing unreported stock flows
4005006007008009001,0001,1001,200
50¢
60¢
70¢
80¢
90¢
100¢
110¢
120¢
Stocks Price
US
¢/lb
thou
sand
tonn
es
plotted to Nov. 18, 2015
US$
/dm
t
plotted to October 2015
Source: Teck, CRU
$0
$100
$200
$300
$400
$500
$600
Spot Annual15
Agenda
Teck Overview & Strategy
Commodity Market Observations
Teck Update
16
Responding to Difficult Market Conditions
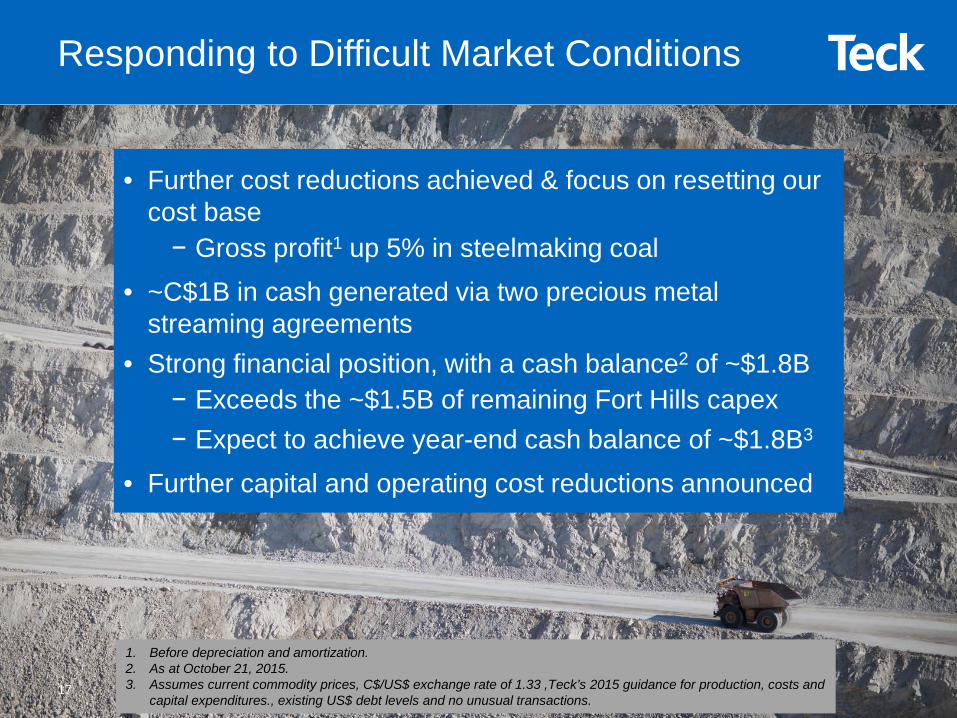
• Further cost reductions achieved & focus on resetting our cost base− Gross profit1 up 5% in steelmaking coal
• ~C$1B in cash generated via two precious metal streaming agreements
• Strong financial position, with a cash balance2 of ~$1.8B− Exceeds the ~$1.5B of remaining Fort Hills capex− Expect to achieve year-end cash balance of ~$1.8B3
• Further capital and operating cost reductions announced
1. Before depreciation and amortization.2. As at October 21, 2015.3. Assumes current commodity prices, C$/US$ exchange rate of 1.33 ,Teck’s 2015 guidance for production, costs and
capital expenditures., existing US$ debt levels and no unusual transactions. 17
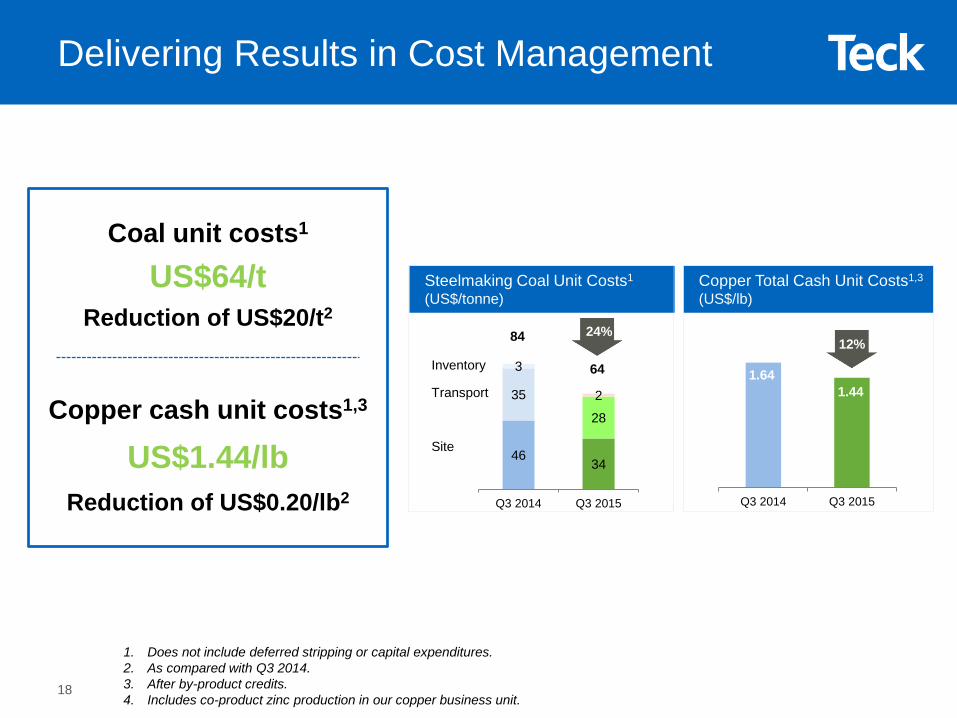
4634
35
28
3
2
Q3 2014 Q3 2015
Delivering Results in Cost Management
1. Does not include deferred stripping or capital expenditures. 2. As compared with Q3 2014. 3. After by-product credits.4. Includes co-product zinc production in our copper business unit.
24%
Steelmaking Coal Unit Costs1
(US$/tonne)
64
84
Site
Transport
Inventory
Q3 2014 Q3 2015
1.641.44
Copper Total Cash Unit Costs1,3
(US$/lb)
xx%12%
Coal unit costs1
US$64/tReduction of US$20/t2
Copper cash unit costs1,3
US$1.44/lbReduction of US$0.20/lb2
18
Ongoing Focus on Conserving Capital And Lowering Operating Costs
• Achieved >$650M in sustainable cost reductions from 2012-2014, and targeting an additional ~$100M in 2015
• Implementing additional measures:− Cut the dividend to $0.10/share on an annualized basis− $300M of operating cost savings− $350M of capital spending reductions and deferrals− Elimination of 1,000 additional positions, including senior management− Suspension of the Coal Mountain Phase 2 project
Expect to achieve a total spending reduction of $650M in 2016
19
$0
$250
$500
$750
$1,000
$1,250
$1,500
$1,750
$2,000
$2,250
$2,500
$2,750
$3,000
2016
2017
2018
2019
2020
2021
2022
2023
2024
2025
2026
2027
2028
2029
2030
2031
2032
2033
2034
2035
2036
2037
2038
2039
2040
2041
2042
2043
US$
M
201. As at October 21, 2015.2. Assumes current commodity prices, C$/US$ exchange rate of 1.31 ,Teck’s 2015 guidance for production, costs and capital
expenditures., existing US$ debt levels and no unusual transactions
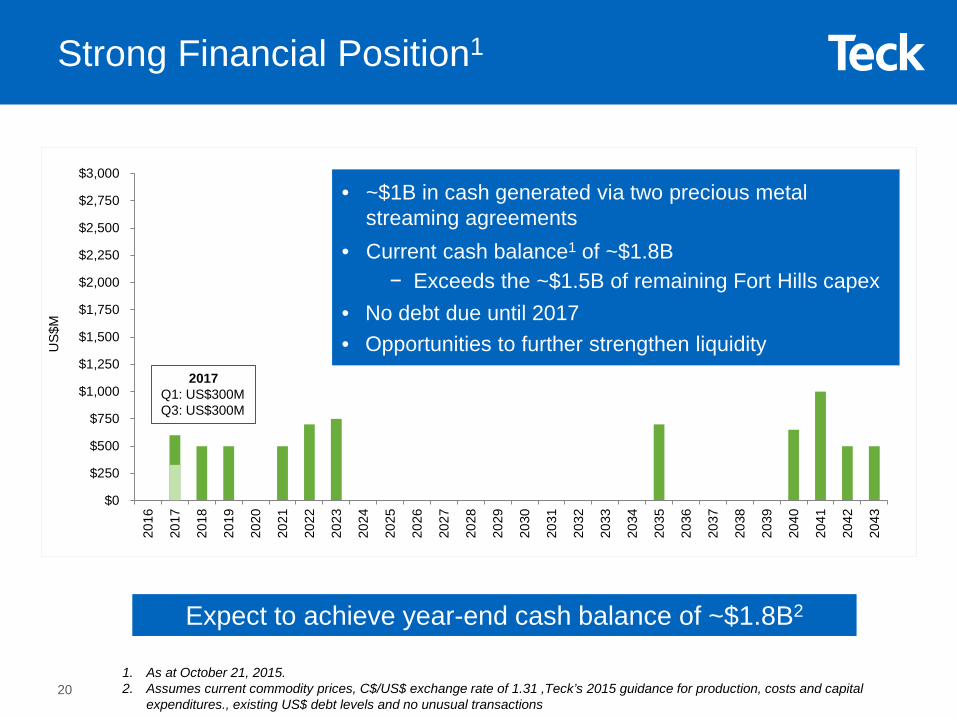
Strong Financial Position1
• ~$1B in cash generated via two precious metal streaming agreements
• Current cash balance1 of ~$1.8B− Exceeds the ~$1.5B of remaining Fort Hills capex
• No debt due until 2017• Opportunities to further strengthen liquidity
2017Q1: US$300MQ3: US$300M
Expect to achieve year-end cash balance of ~$1.8B2
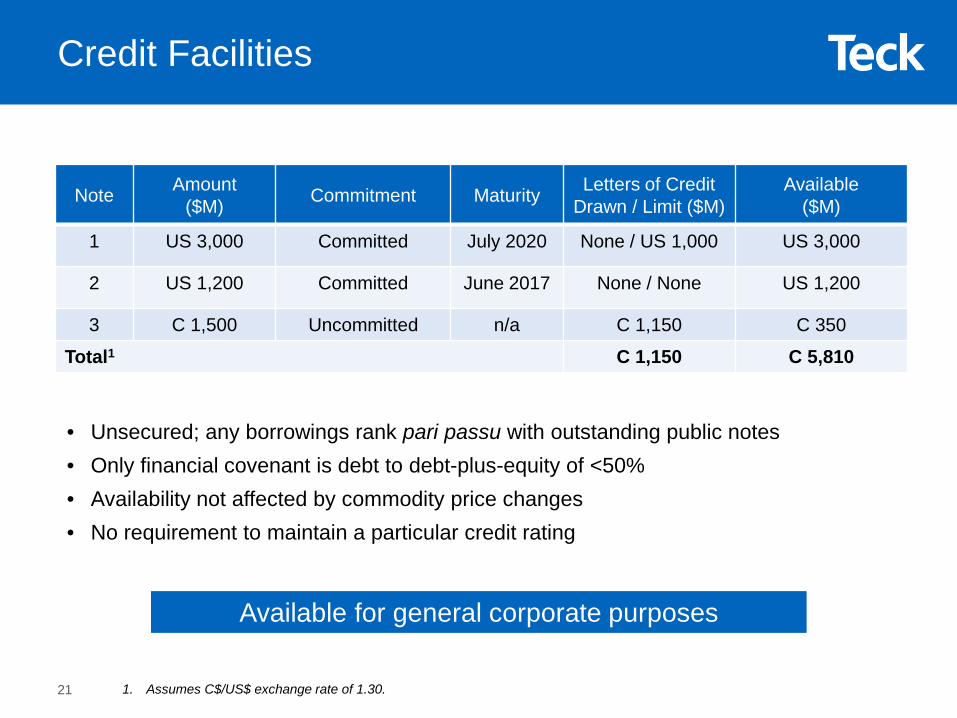
Credit Facilities
Note Amount ($M) Commitment Maturity Letters of Credit
Drawn / Limit ($M)Available
($M)
1 US 3,000 Committed July 2020 None / US 1,000 US 3,000
2 US 1,200 Committed June 2017 None / None US 1,200
3 C 1,500 Uncommitted n/a C 1,150 C 350
Total1 C 1,150 C 5,810
• Unsecured; any borrowings rank pari passu with outstanding public notes• Only financial covenant is debt to debt-plus-equity of <50% • Availability not affected by commodity price changes• No requirement to maintain a particular credit rating
Available for general corporate purposes
1. Assumes C$/US$ exchange rate of 1.30.21
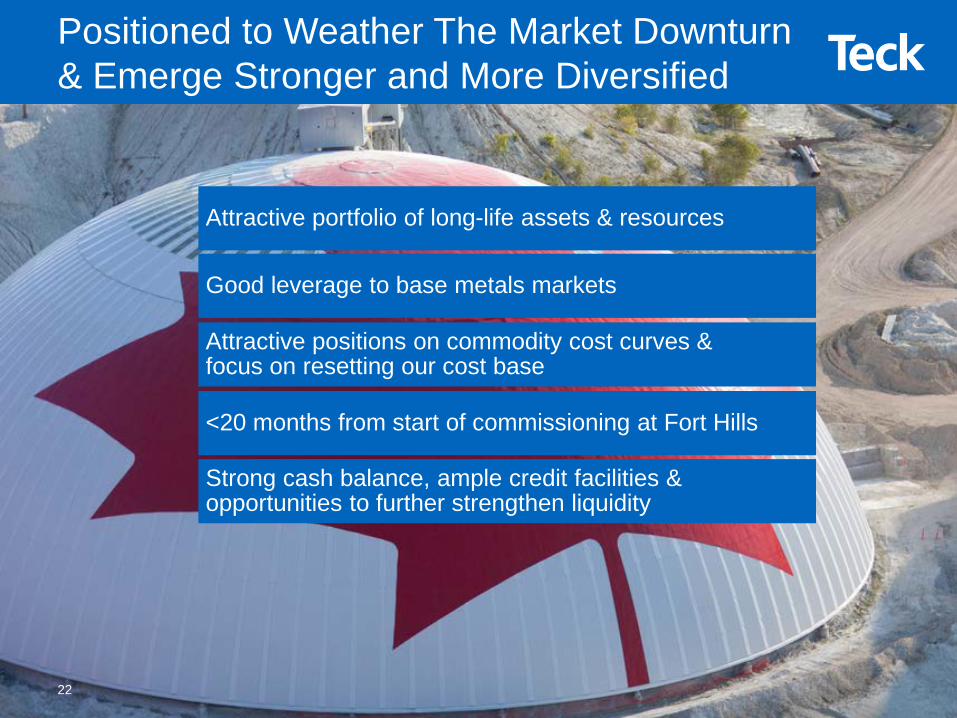
Positioned to Weather The Market Downturn & Emerge Stronger and More Diversified
Attractive portfolio of long-life assets & resources
Good leverage to base metals markets
Attractive positions on commodity cost curves & focus on resetting our cost base
<20 months from start of commissioning at Fort Hills
Strong cash balance, ample credit facilities & opportunities to further strengthen liquidity
22

Additional Information
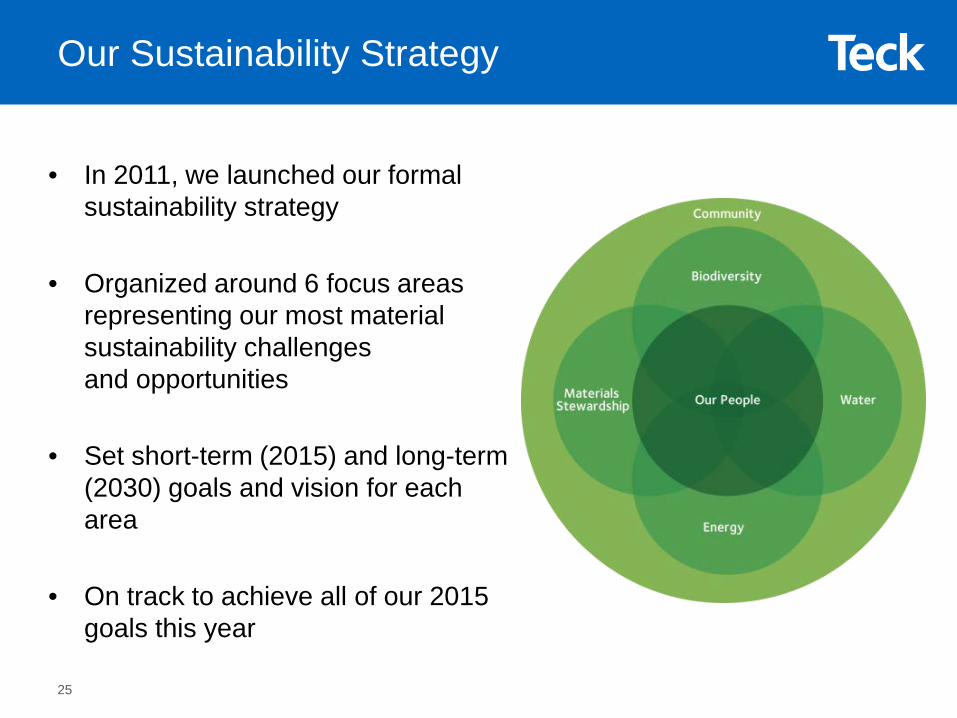
• In 2011, we launched our formal sustainability strategy
• Organized around 6 focus areas representing our most material sustainability challenges and opportunities
• Set short-term (2015) and long-term (2030) goals and vision for each area
• On track to achieve all of our 2015 goals this year
Our Sustainability Strategy
25
Received the PDAC 2014 Environmental and Social Responsibility Award
Best 50 Corporate Citizens in Canada 2015
On the Dow Jones Sustainability World Index six years in a row
One of top 100 most sustainable companies in the world and one of Canada’s most sustainable companies
Top 50 Socially Responsible Corporations in Canada
Received the Globe Foundation Environment Award in 2014
26
External Recognition
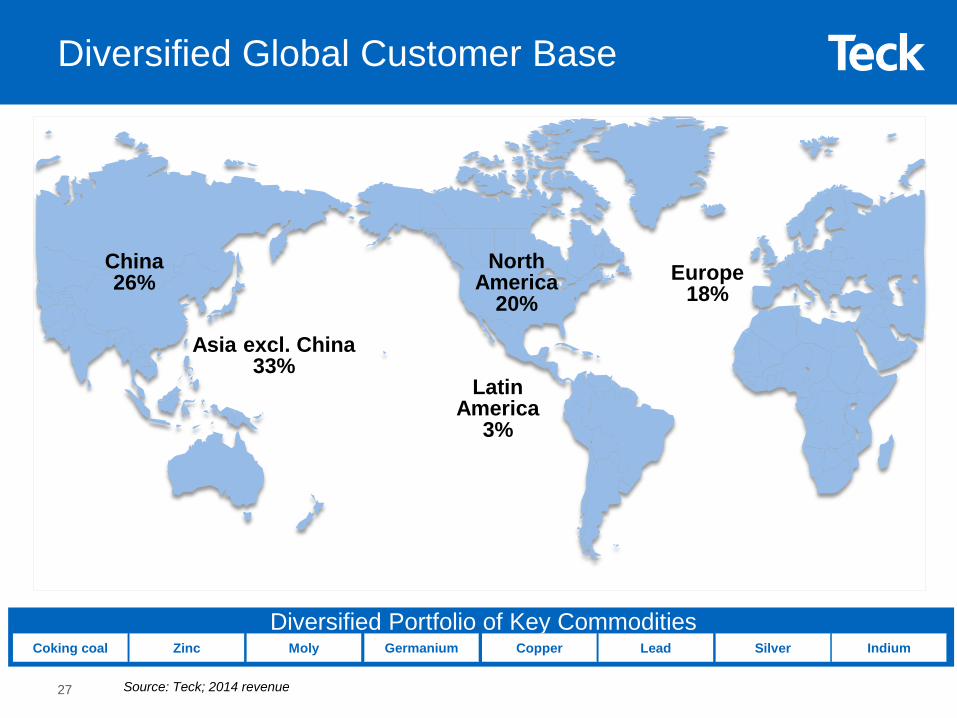
Diversified Portfolio of Key Commodities
NorthAmerica
20%Europe
18%
LatinAmerica
3%
China26%
Asia excl. China33%
27
Diversified Global Customer Base
Coking coal CopperZinc LeadMoly SilverGermanium Indium
Source: Teck; 2014 revenue
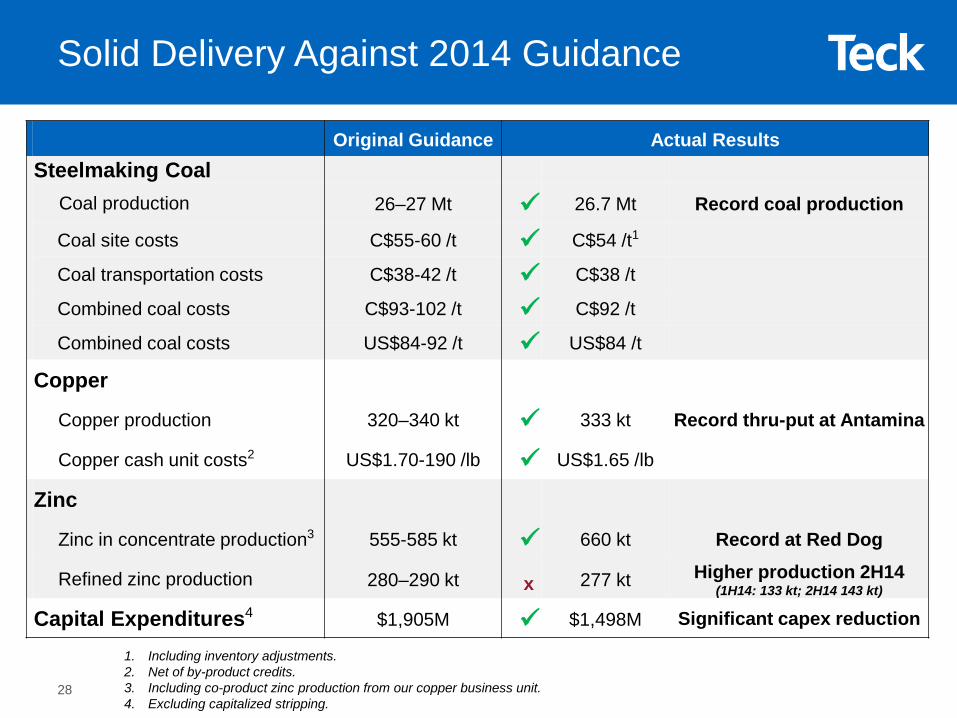
Original Guidance Actual ResultsSteelmaking Coal
Coal production 26–27 Mt 26.7 Mt Record coal production
Coal site costs C$55-60 /t C$54 /t1
Coal transportation costs C$38-42 /t C$38 /t
Combined coal costs C$93-102 /t C$92 /t
Combined coal costs US$84-92 /t US$84 /t
Copper
Copper production 320–340 kt 333 kt Record thru-put at Antamina
Copper cash unit costs2 US$1.70-190 /lb US$1.65 /lb
Zinc
Zinc in concentrate production3 555-585 kt 660 kt Record at Red Dog
Refined zinc production 280–290 kt x 277 kt Higher production 2H14(1H14: 133 kt; 2H14 143 kt)
Capital Expenditures4 $1,905M $1,498M Significant capex reduction
Solid Delivery Against 2014 Guidance
1. Including inventory adjustments.2. Net of by-product credits.3. Including co-product zinc production from our copper business unit.4. Excluding capitalized stripping.
28
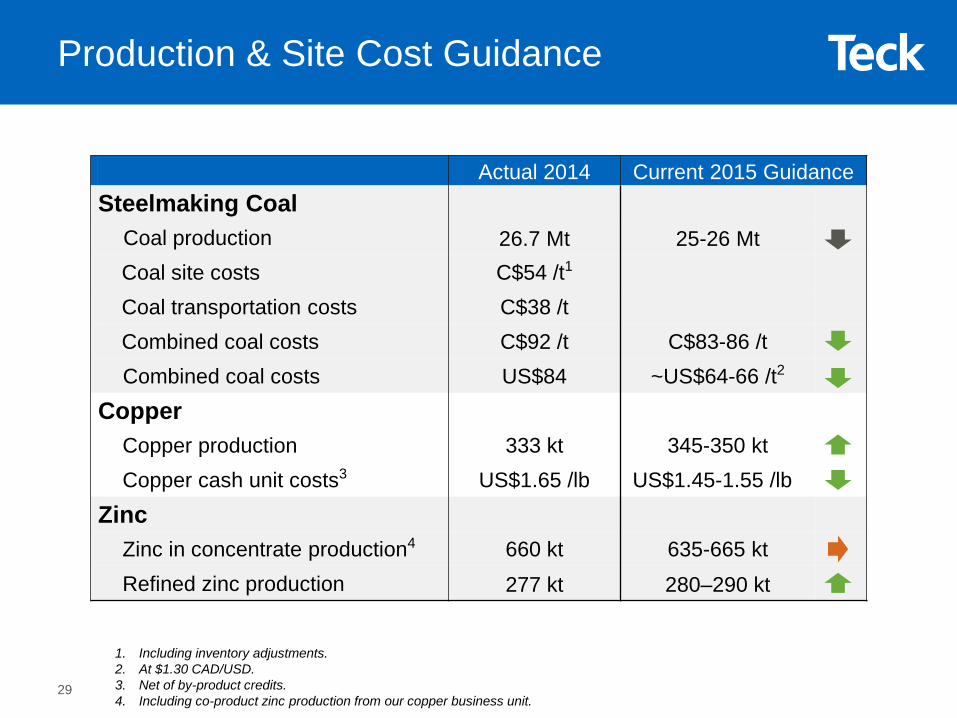
Actual 2014 Current 2015 GuidanceSteelmaking Coal
Coal production 26.7 Mt 25-26 MtCoal site costs C$54 /t1
Coal transportation costs C$38 /tCombined coal costs C$92 /t C$83-86 /tCombined coal costs US$84 ~US$64-66 /t2
CopperCopper production 333 kt 345-350 ktCopper cash unit costs3 US$1.65 /lb US$1.45-1.55 /lb
ZincZinc in concentrate production4 660 kt 635-665 ktRefined zinc production 277 kt 280–290 kt
Production & Site Cost Guidance
1. Including inventory adjustments.2. At $1.30 CAD/USD.3. Net of by-product credits.4. Including co-product zinc production from our copper business unit.
29
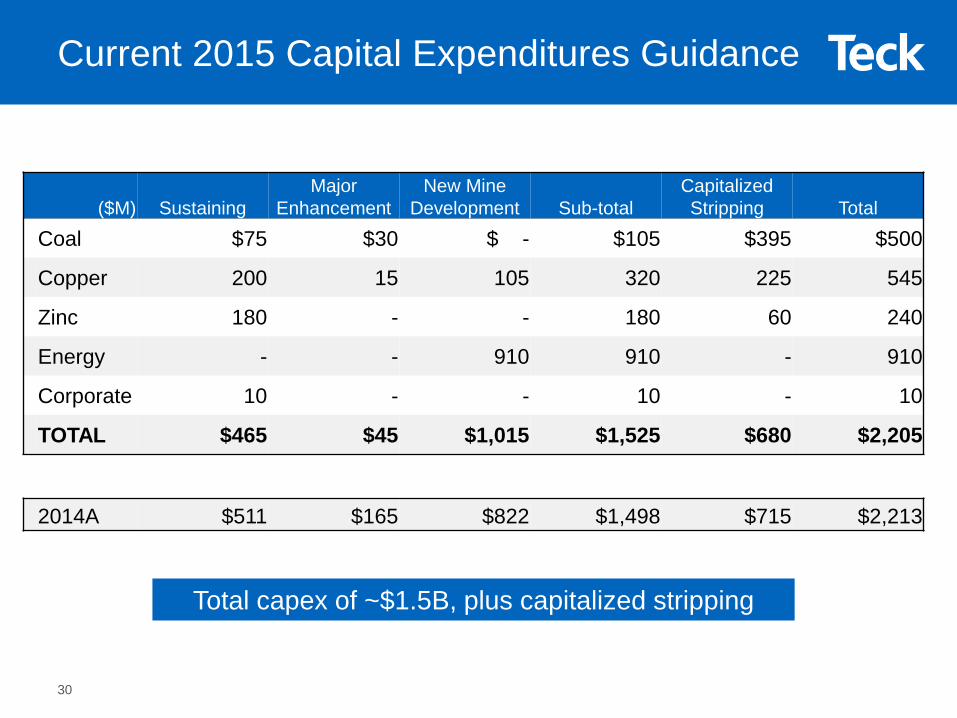
($M) SustainingMajor
EnhancementNew Mine
Development Sub-totalCapitalized Stripping Total
Coal $75 $30 $ - $105 $395 $500
Copper 200 15 105 320 225 545
Zinc 180 - - 180 60 240
Energy - - 910 910 - 910
Corporate 10 - - 10 - 10
TOTAL $465 $45 $1,015 $1,525 $680 $2,205
Total capex of ~$1.5B, plus capitalized stripping
2014A $511 $165 $822 $1,498 $715 $2,213
Current 2015 Capital Expenditures Guidance
30
0.00
0.50
1.00
1.50
2.00
2.50
2012 2013 2014 YTD Q32015
Before by-product creditsAfter by-product credits
US$
/lb
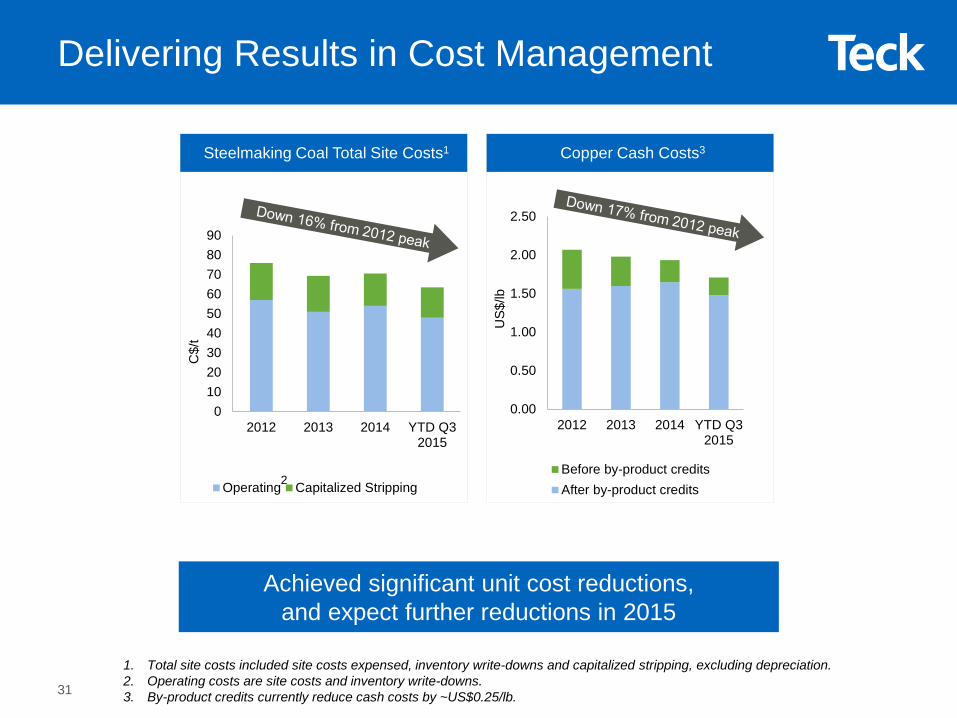
Delivering Results in Cost Management
Copper Cash Costs3
Achieved significant unit cost reductions, and expect further reductions in 2015
Steelmaking Coal Total Site Costs1
2
1. Total site costs included site costs expensed, inventory write-downs and capitalized stripping, excluding depreciation. 2. Operating costs are site costs and inventory write-downs.3. By-product credits currently reduce cash costs by ~US$0.25/lb.
0102030405060708090
2012 2013 2014 YTD Q32015
Operating Capitalized Stripping
C$/
t
31
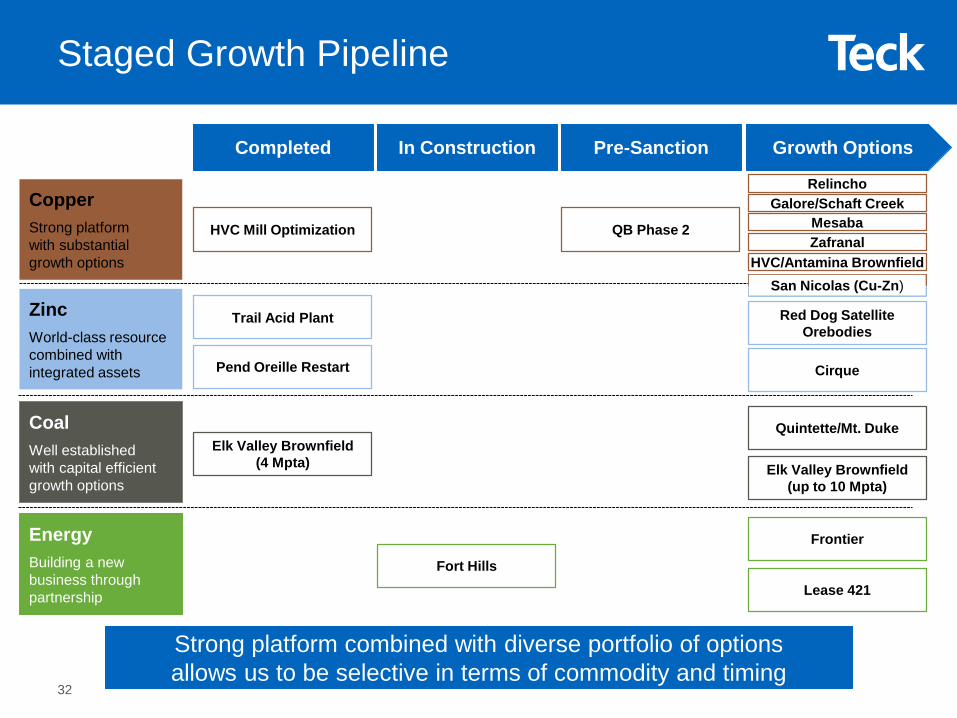
CoalWell established with capital efficient growth options
Strong platform combined with diverse portfolio of options allows us to be selective in terms of commodity and timing
Completed In Construction Pre-Sanction
CopperStrong platform with substantial growth options
ZincWorld-class resource combined with integrated assets
EnergyBuilding a new business through partnership
Trail Acid Plant
HVC Mill Optimization
Pend Oreille Restart
Fort Hills
Elk Valley Brownfield (4 Mpta)
Staged Growth Pipeline
Red Dog Satellite Orebodies
San Nicolas (Cu-Zn)
Elk Valley Brownfield (up to 10 Mpta)
Quintette/Mt. Duke
Frontier
Lease 421
QB Phase 2
Relincho
MesabaZafranal
HVC/Antamina Brownfield
Galore/Schaft Creek
Cirque
Growth Options
32
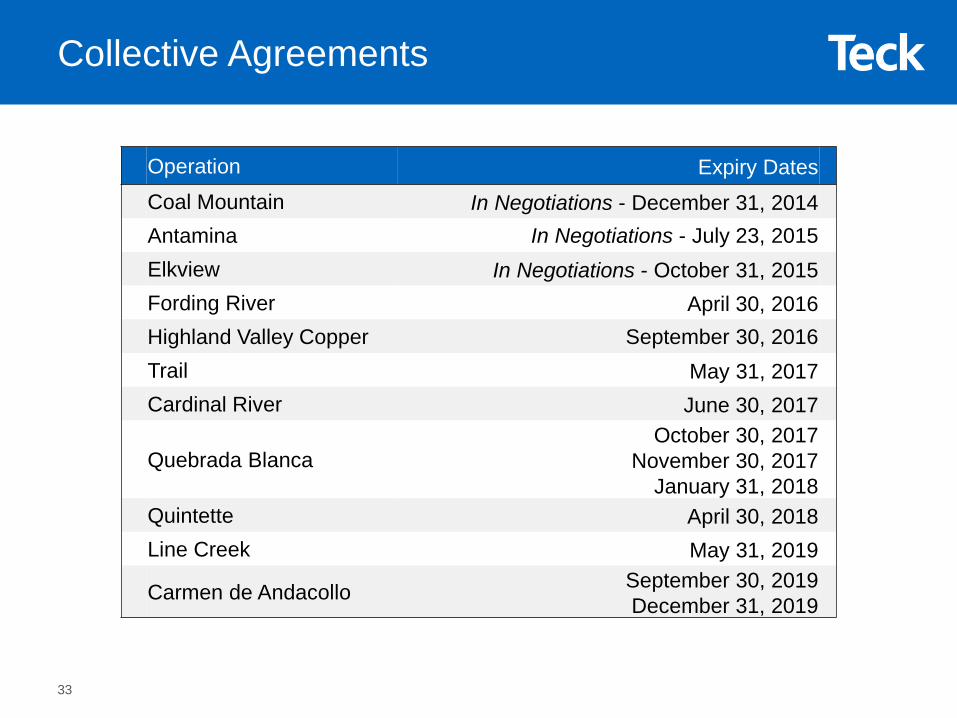
Operation Expiry DatesCoal Mountain In Negotiations - December 31, 2014Antamina In Negotiations - July 23, 2015Elkview In Negotiations - October 31, 2015Fording River April 30, 2016Highland Valley Copper September 30, 2016Trail May 31, 2017Cardinal River June 30, 2017
Quebrada BlancaOctober 30, 2017
November 30, 2017January 31, 2018
Quintette April 30, 2018Line Creek May 31, 2019
Carmen de Andacollo September 30, 2019December 31, 2019
Collective Agreements
33
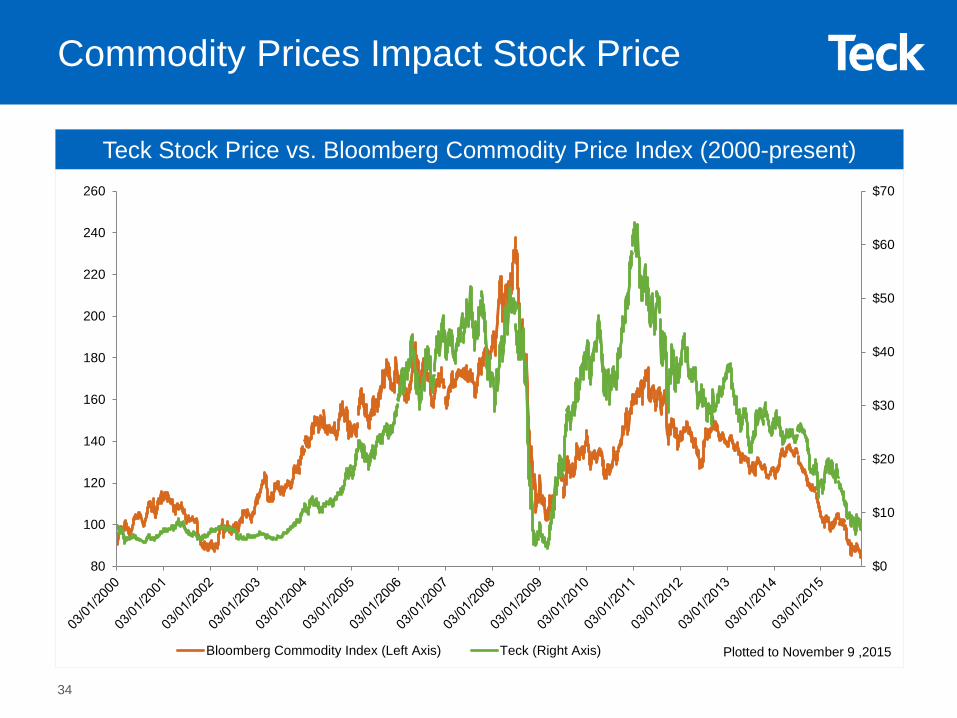
Teck Stock Price vs. Bloomberg Commodity Price Index (2000-present)
Commodity Prices Impact Stock Price
$0
$10
$20
$30
$40
$50
$60
$70
80
100
120
140
160
180
200
220
240
260
Bloomberg Commodity Index (Left Axis) Teck (Right Axis) Plotted to November 9 ,2015
34
Steelmaking CoalBusiness Unit & Markets
AUS$
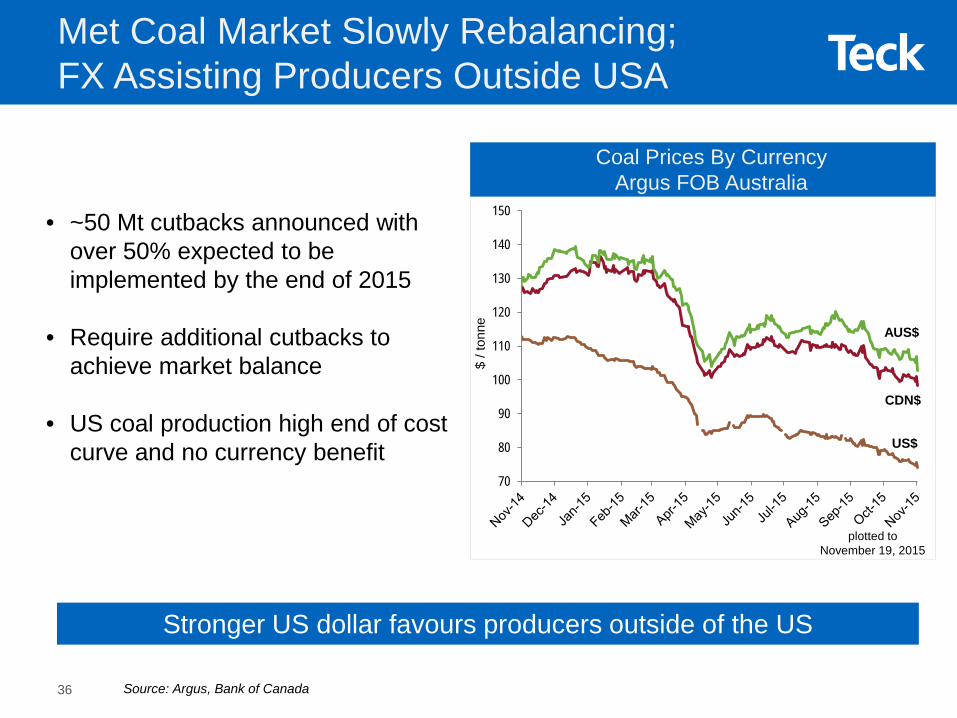
Stronger US dollar favours producers outside of the US
Source: Argus, Bank of Canada
• ~50 Mt cutbacks announced with over 50% expected to be implemented by the end of 2015
• Require additional cutbacks to achieve market balance
• US coal production high end of cost curve and no currency benefit
Coal Prices By CurrencyArgus FOB Australia
CDN$
US$
Met Coal Market Slowly Rebalancing; FX Assisting Producers Outside USA
plotted to November 19, 2015
70
80
90
100
110
120
130
140
150
$ / t
onne
36
45 55 65 75
China
0
3
6
9
12
15
Dec
-09
Mar
-10
Jun-
10S
ep-1
0D
ec-1
0M
ar-1
1Ju
n-11
Sep
-11
Dec
-11
Mar
-12
Jun-
12S
ep-1
2D
ec-1
2M
ar-1
3Ju
n-13
Sep
-13
Dec
-13
Mar
-14
Jun-
14S
ep-1
4D
ec-1
4M
ar-1
5Ju
n-15
Sep
-15
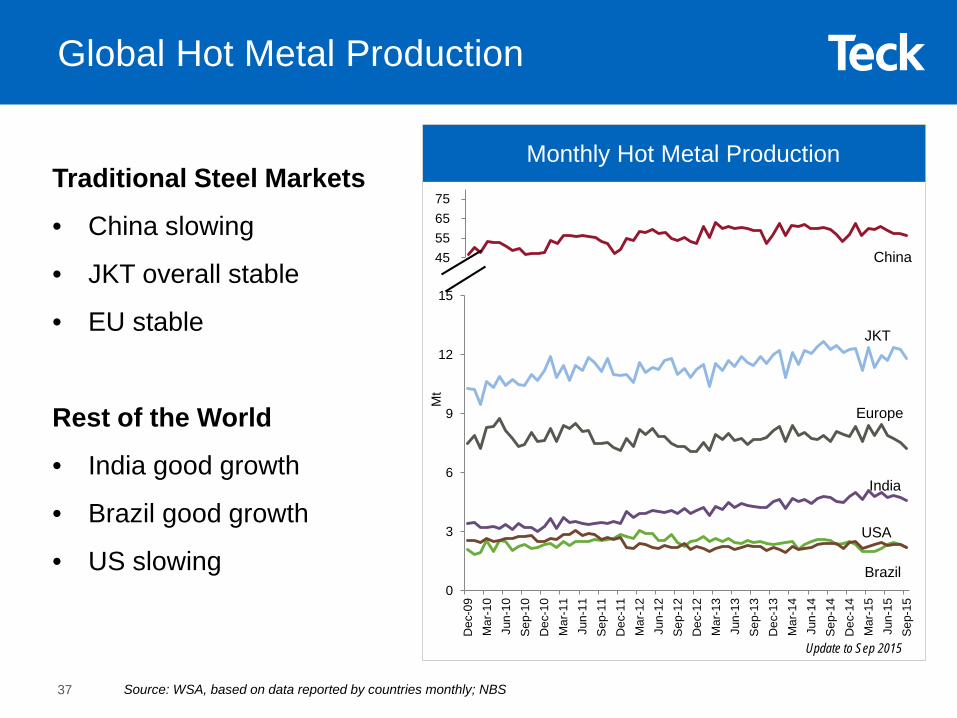
Traditional Steel Markets
• China slowing
• JKT overall stable
• EU stable
Rest of the World
• India good growth
• Brazil good growth
• US slowing
Monthly Hot Metal Production
Source: WSA, based on data reported by countries monthly; NBS
Mt
Update to Sep 2015
Global Hot Metal Production
JKT
India
Europe
USA
Brazil
37
Source: WSA, NBS, Wood Mackenzie, CRU1. Europe includes 12 countries.
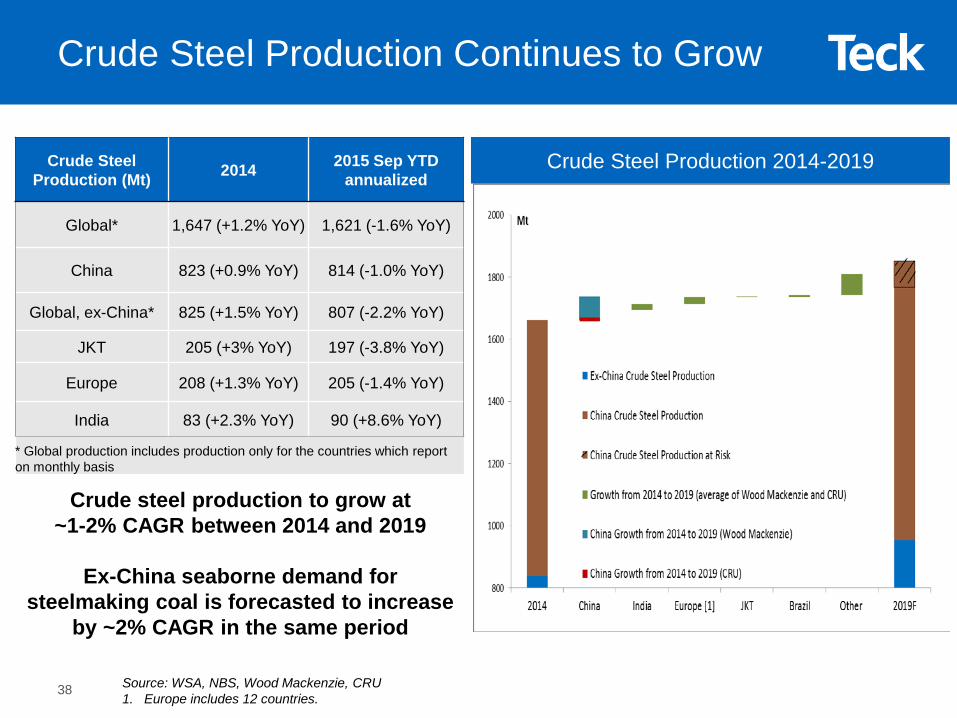
Crude steel production to grow at ~1-2% CAGR between 2014 and 2019
Ex-China seaborne demand for steelmaking coal is forecasted to increase
by ~2% CAGR in the same period
Crude Steel Production 2014-2019Crude Steel Production (Mt) 2014 2015 Sep YTD
annualized
Global* 1,647 (+1.2% YoY) 1,621 (-1.6% YoY)
China 823 (+0.9% YoY) 814 (-1.0% YoY)
Global, ex-China* 825 (+1.5% YoY) 807 (-2.2% YoY)
JKT 205 (+3% YoY) 197 (-3.8% YoY)
Europe 208 (+1.3% YoY) 205 (-1.4% YoY)
India 83 (+2.3% YoY) 90 (+8.6% YoY)
* Global production includes production only for the countries which report on monthly basis
Crude Steel Production Continues to Grow
38
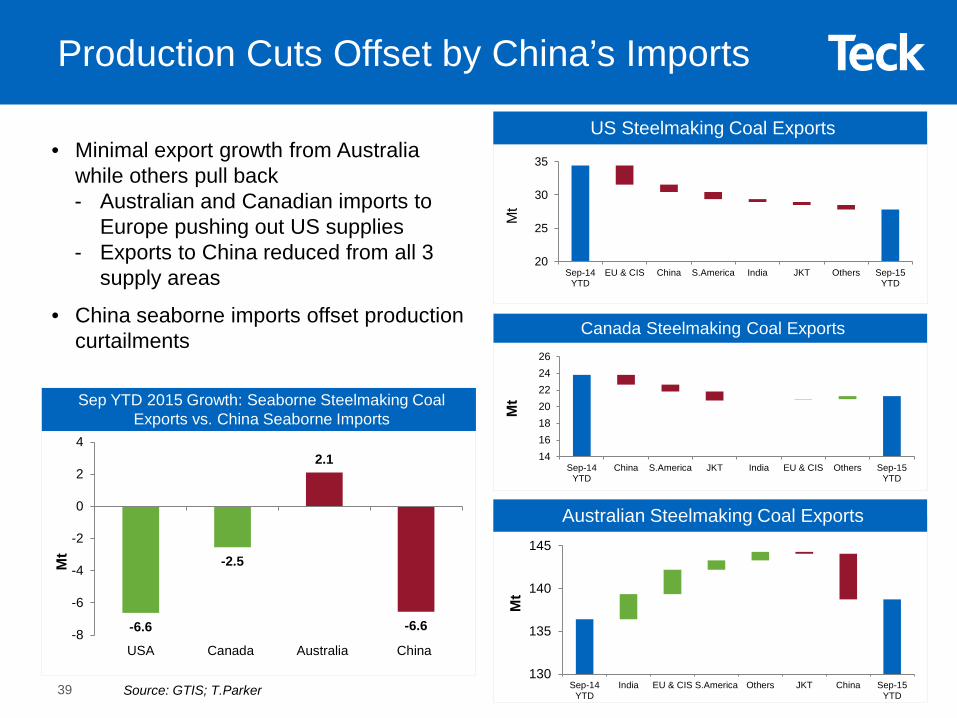
• Minimal export growth from Australia while others pull back- Australian and Canadian imports to
Europe pushing out US supplies- Exports to China reduced from all 3
supply areas
• China seaborne imports offset production curtailments
US Steelmaking Coal Exports
Australian Steelmaking Coal Exports
Sep YTD 2015 Growth: Seaborne Steelmaking CoalExports vs. China Seaborne Imports
Source: GTIS; T.Parker
20
25
30
35
Sep-14YTD
EU & CIS China S.America India JKT Others Sep-15YTD
Mt
Production Cuts Offset by China’s Imports
Canada Steelmaking Coal Exports
130
135
140
145
Sep-14YTD
India EU & CIS S.America Others JKT China Sep-15YTD
Mt
14161820222426
Sep-14YTD
China S.America JKT India EU & CIS Others Sep-15YTD
Mt
-6.6
-2.5
2.1
-6.6-8
-6
-4
-2
0
2
4
USA Canada Australia China
Mt
39
Source: Teck estimates based on public announcements* Production cuts are total market curtailments including sustaining cuts (mine idlings) and period cuts (guidance reductions).
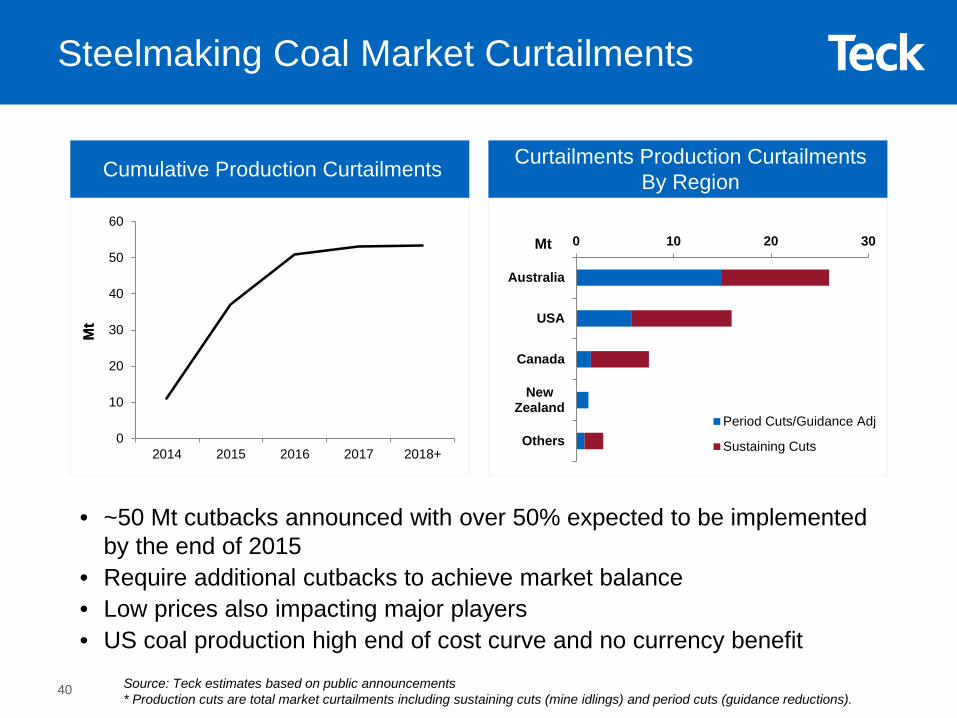
Curtailments Production Curtailments By RegionCumulative Production Curtailments
• ~50 Mt cutbacks announced with over 50% expected to be implemented by the end of 2015
• Require additional cutbacks to achieve market balance• Low prices also impacting major players• US coal production high end of cost curve and no currency benefit
Steelmaking Coal Market Curtailments
0
10
20
30
40
50
60
2014 2015 2016 2017 2018+
Mt
Mt
0 10 20 30
Australia
USA
Canada
NewZealand
OthersPeriod Cuts/Guidance Adj
Sustaining Cuts
Mt
40
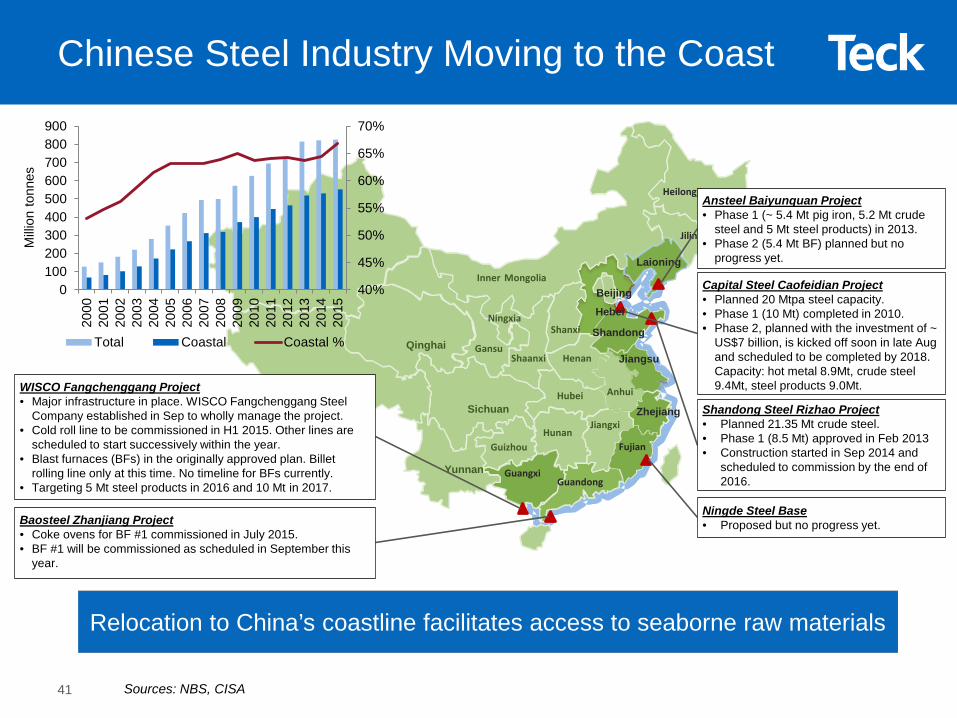
Relocation to China’s coastline facilitates access to seaborne raw materials
Sources: NBS, CISA
Chinese Steel Industry Moving to the Coast
41
Xinjiang
Tibet
Qinghai
Sichuan
Inner Mongolia
Henan
Shanxi
GuangxiGuandong
Fujian
Zhejiang
Jiangsu
Shandong
Laioning
Jilin
Heilongjiang
GuizhouHunan
Hubei
Jiangxi
Anhui
ShaanxiGansu
Ningxia
Qinghai
Sichuan
Yunnan
Beijing
Hebei
WISCO Fangchenggang Project• Major infrastructure in place. WISCO Fangchenggang Steel
Company established in Sep to wholly manage the project.• Cold roll line to be commissioned in H1 2015. Other lines are
scheduled to start successively within the year.• Blast furnaces (BFs) in the originally approved plan. Billet
rolling line only at this time. No timeline for BFs currently.• Targeting 5 Mt steel products in 2016 and 10 Mt in 2017.
Baosteel Zhanjiang Project• Coke ovens for BF #1 commissioned in July 2015. • BF #1 will be commissioned as scheduled in September this
year.
Ningde Steel Base• Proposed but no progress yet.
Ansteel Baiyunquan Project• Phase 1 (~ 5.4 Mt pig iron, 5.2 Mt crude
steel and 5 Mt steel products) in 2013.• Phase 2 (5.4 Mt BF) planned but no
progress yet.
Capital Steel Caofeidian Project• Planned 20 Mtpa steel capacity. • Phase 1 (10 Mt) completed in 2010.• Phase 2, planned with the investment of ~
US$7 billion, is kicked off soon in late Aug and scheduled to be completed by 2018. Capacity: hot metal 8.9Mt, crude steel 9.4Mt, steel products 9.0Mt.
Shandong Steel Rizhao Project• Planned 21.35 Mt crude steel. • Phase 1 (8.5 Mt) approved in Feb 2013• Construction started in Sep 2014 and
scheduled to commission by the end of 2016.
40%
45%
50%
55%
60%
65%
70%
0100200300400500600700800900
2000
2001
2002
2003
2004
2005
2006
2007
2008
2009
2010
2011
2012
2013
2014
2015
Milli
on to
nnes
Total Coastal Coastal %
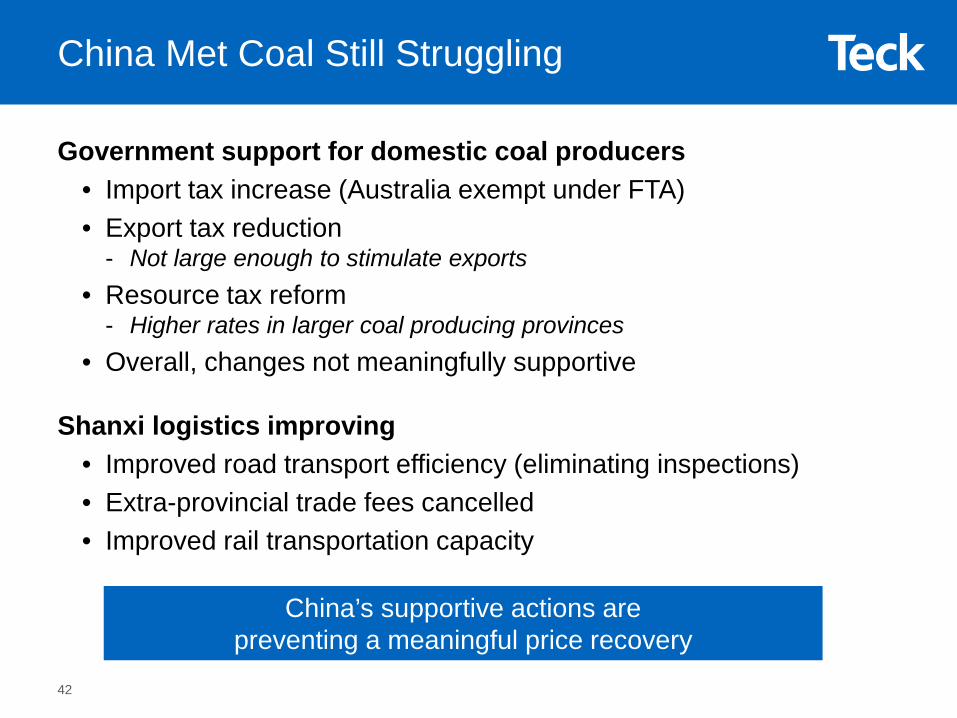
China Met Coal Still Struggling
Government support for domestic coal producers• Import tax increase (Australia exempt under FTA)• Export tax reduction
- Not large enough to stimulate exports• Resource tax reform
- Higher rates in larger coal producing provinces• Overall, changes not meaningfully supportive
Shanxi logistics improving• Improved road transport efficiency (eliminating inspections)• Extra-provincial trade fees cancelled• Improved rail transportation capacity
China’s supportive actions are preventing a meaningful price recovery
42
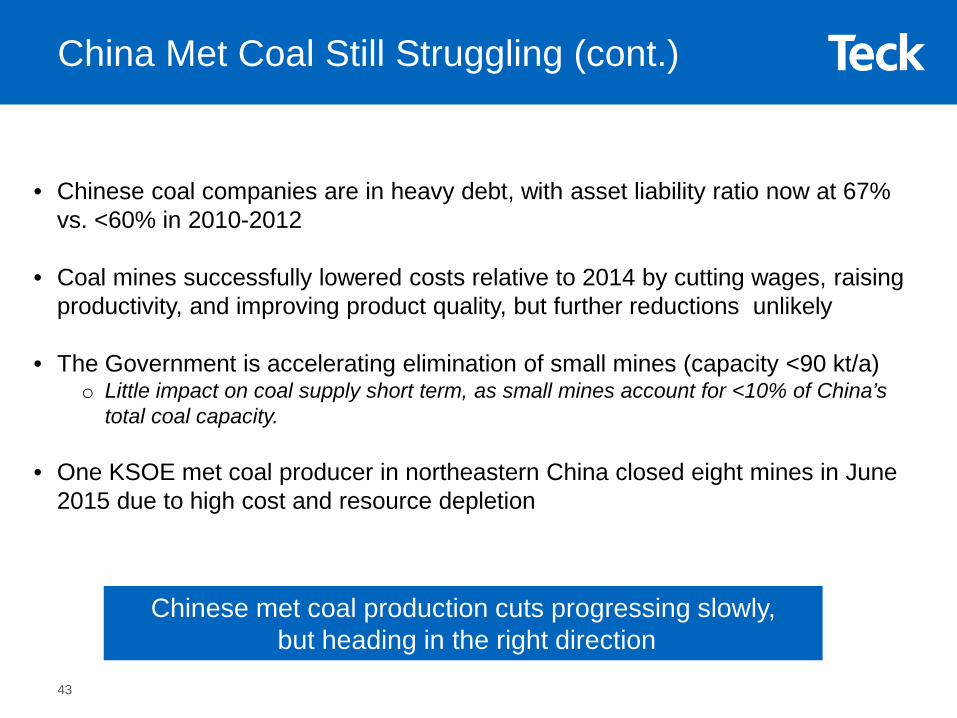
China Met Coal Still Struggling (cont.)
• Chinese coal companies are in heavy debt, with asset liability ratio now at 67% vs. <60% in 2010-2012
• Coal mines successfully lowered costs relative to 2014 by cutting wages, raising productivity, and improving product quality, but further reductions unlikely
• The Government is accelerating elimination of small mines (capacity <90 kt/a)o Little impact on coal supply short term, as small mines account for <10% of China’s
total coal capacity.
• One KSOE met coal producer in northeastern China closed eight mines in June 2015 due to high cost and resource depletion
Chinese met coal production cuts progressing slowly,but heading in the right direction
43
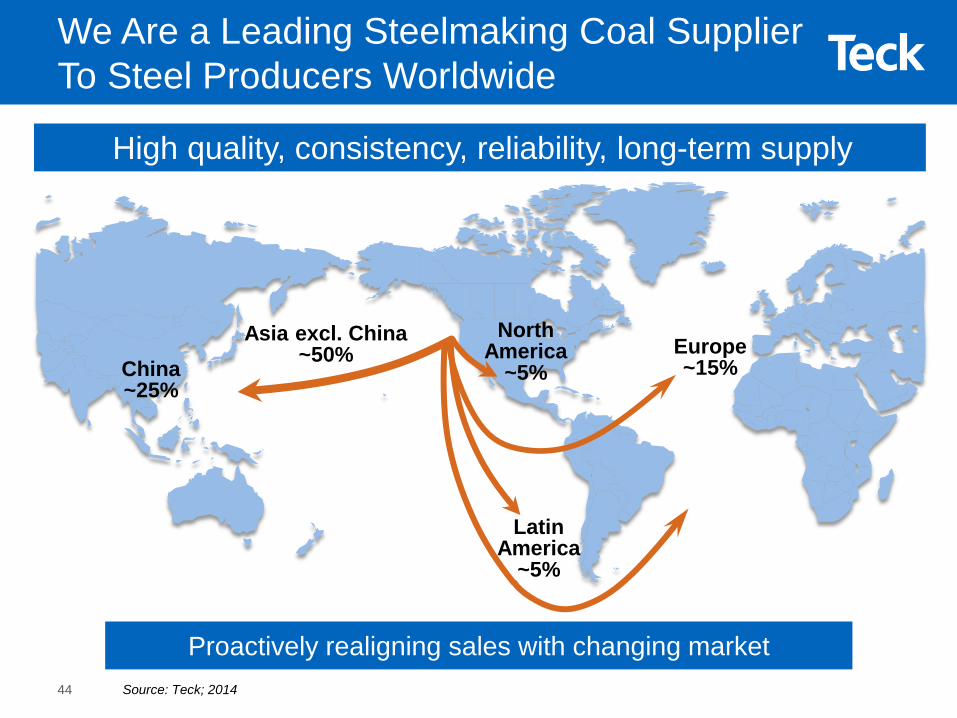
We Are a Leading Steelmaking Coal Supplier To Steel Producers Worldwide
NorthAmerica
~5%Europe~15%China
~25%
High quality, consistency, reliability, long-term supply
Asia excl. China~50%
Source: Teck; 2014
LatinAmerica
~5%
Proactively realigning sales with changing market44
0
50
100
150
200
250
300
350
Q1
2010
Q2
2010
Q3
2010
Q4
2010
Q1
2011
Q2
2011
Q3
2011
Q4
2011
Q1
2012
Q2
2012
Q3
2012
Q4
2012
Q1
2013
Q2
2013
Q3
2013
Q4
2013
Q1
2014
Q2
2014
Q3
2014
Q4
2014
Q1
2015
Q2
2015
Q3
2015
US$
/ to
nne
Teck Realized Price (US$) Benchmark Price
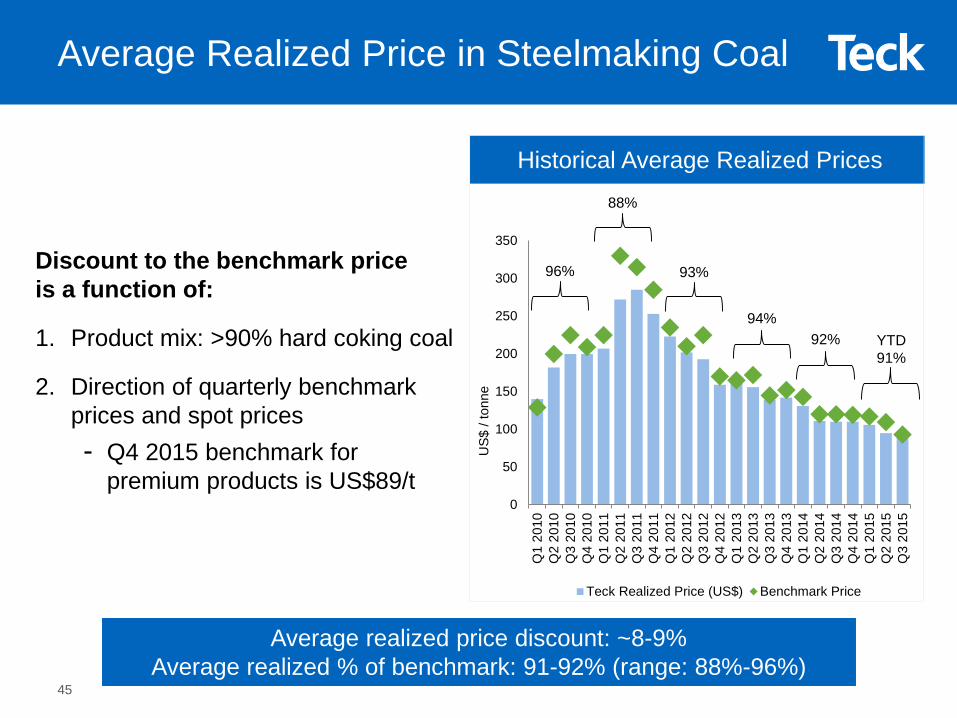
Discount to the benchmark price is a function of:
1. Product mix: >90% hard coking coal
2. Direction of quarterly benchmark prices and spot prices- Q4 2015 benchmark for
premium products is US$89/t
Historical Average Realized Prices
Average Realized Price in Steelmaking Coal
Average realized price discount: ~8-9%Average realized % of benchmark: 91-92% (range: 88%-96%)
96%
88%
93%
94%92% YTD
91%
45
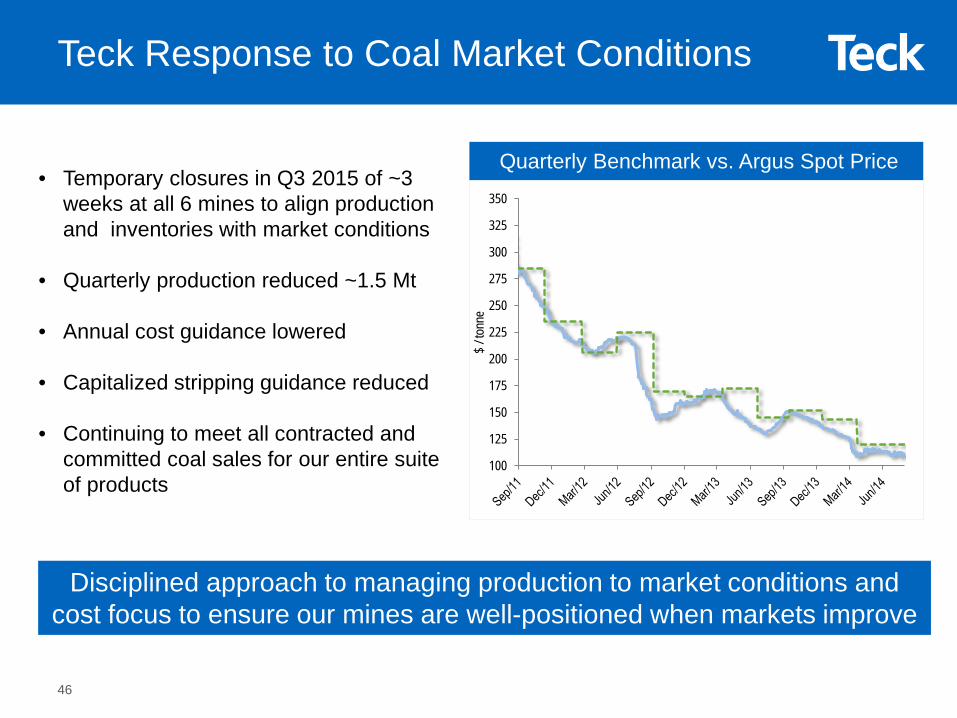
• Temporary closures in Q3 2015 of ~3 weeks at all 6 mines to align production and inventories with market conditions
• Quarterly production reduced ~1.5 Mt
• Annual cost guidance lowered
• Capitalized stripping guidance reduced
• Continuing to meet all contracted and committed coal sales for our entire suite of products
Disciplined approach to managing production to market conditions andcost focus to ensure our mines are well-positioned when markets improve
Teck Response to Coal Market Conditions
Quarterly Benchmark vs. Argus Spot Price
100
125
150
175
200
225
250
275
300
325
350
$ / to
nne
46
0
20
40
60
80
100
120
US$
/t
Site Costs TransportationInventory Write-Down Capitalized StrippingSustaining Capital
106
78
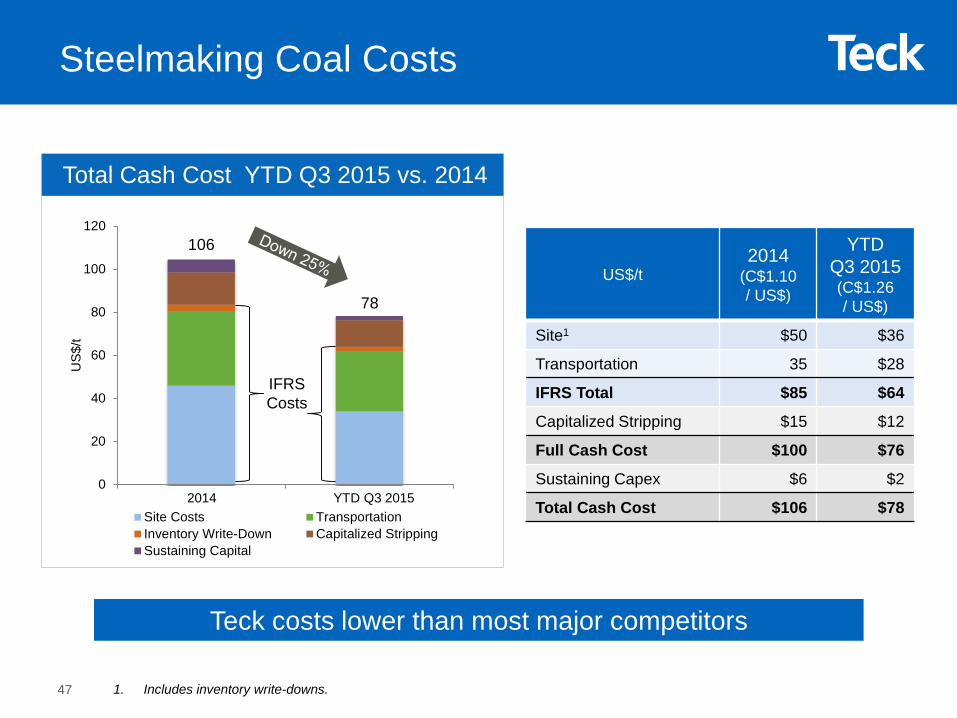
Teck costs lower than most major competitors
Total Cash Cost YTD Q3 2015 vs. 2014
a
47
US$/t2014
(C$1.10 / US$)
YTD Q3 2015(C$1.26/ US$)
Site1 $50 $36
Transportation 35 $28
IFRS Total $85 $64
Capitalized Stripping $15 $12
Full Cash Cost $100 $76
Sustaining Capex $6 $2
Total Cash Cost $106 $78
1. Includes inventory write-downs.
IFRS Costs
Steelmaking Coal Costs
2014 YTD Q3 2015
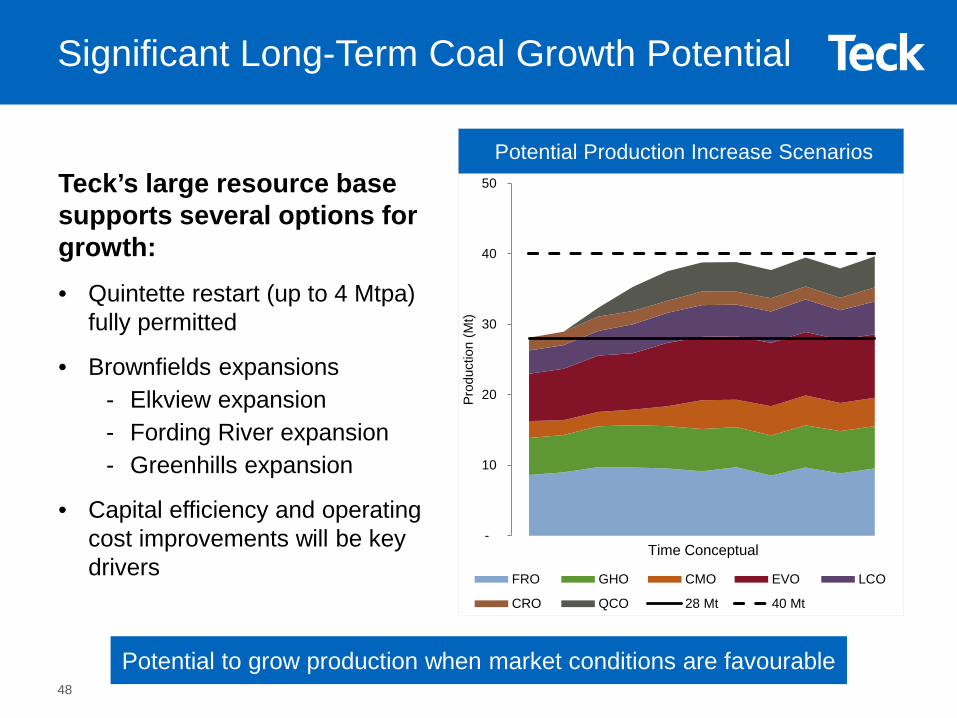
Significant Long-Term Coal Growth Potential
Potential Production Increase ScenariosTeck’s large resource base supports several options for growth:• Quintette restart (up to 4 Mtpa)
fully permitted
• Brownfields expansions- Elkview expansion - Fording River expansion- Greenhills expansion
• Capital efficiency and operating cost improvements will be key drivers
-
10
20
30
40
50
Prod
uctio
n (M
t)
FRO GHO CMO EVO LCO
CRO QCO 28 Mt 40 Mt
Time Conceptual
Potential to grow production when market conditions are favourable48
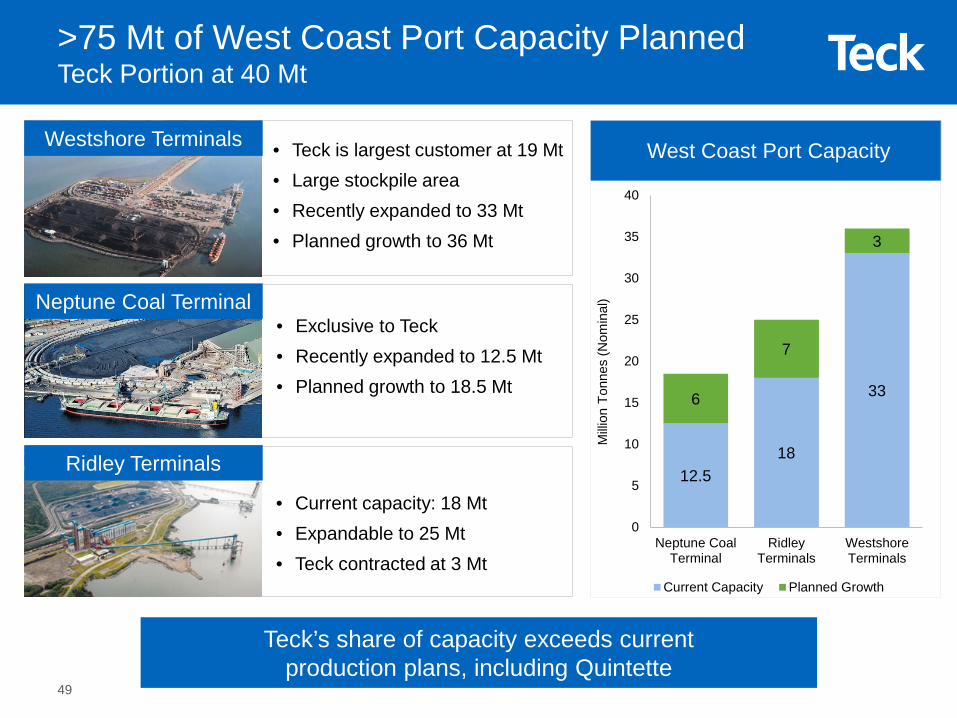
>75 Mt of West Coast Port Capacity PlannedTeck Portion at 40 Mt
• Exclusive to Teck • Recently expanded to 12.5 Mt • Planned growth to 18.5 Mt
Westshore Terminals
Neptune Coal Terminal
Ridley Terminals
West Coast Port Capacity
• Current capacity: 18 Mt• Expandable to 25 Mt• Teck contracted at 3 Mt
• Teck is largest customer at 19 Mt• Large stockpile area• Recently expanded to 33 Mt• Planned growth to 36 Mt
Milli
on T
onne
s (N
omin
al)
Teck’s share of capacity exceeds current production plans, including Quintette
12.518
336
7
3
0
5
10
15
20
25
30
35
40
Neptune CoalTerminal
RidleyTerminals
WestshoreTerminals
Current Capacity Planned Growth
49
0%
20%
40%
60%
80%
100%
CO2 NOx Particulate SOxDiesel Natural Gas
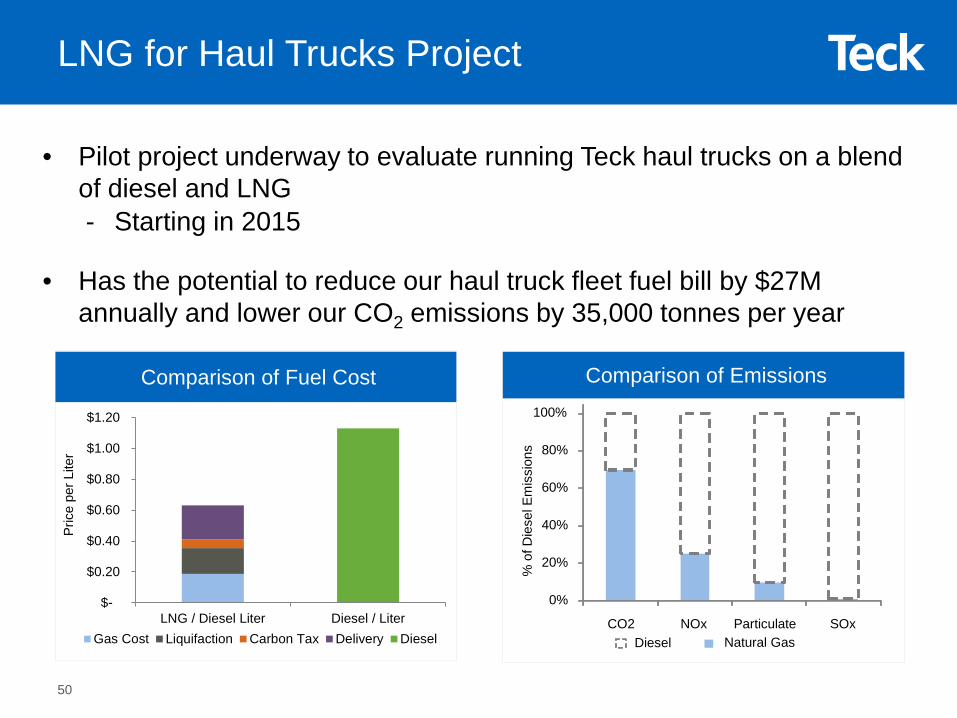
LNG for Haul Trucks Project
• Pilot project underway to evaluate running Teck haul trucks on a blend of diesel and LNG- Starting in 2015
• Has the potential to reduce our haul truck fleet fuel bill by $27M annually and lower our CO2 emissions by 35,000 tonnes per year
Comparison of Fuel Cost
$-
$0.20
$0.40
$0.60
$0.80
$1.00
$1.20
LNG / Diesel Liter Diesel / LiterGas Cost Liquifaction Carbon Tax Delivery Diesel
Pric
e pe
r Lite
r
Comparison of Emissions
% o
f Die
sel E
mis
sion
s
50
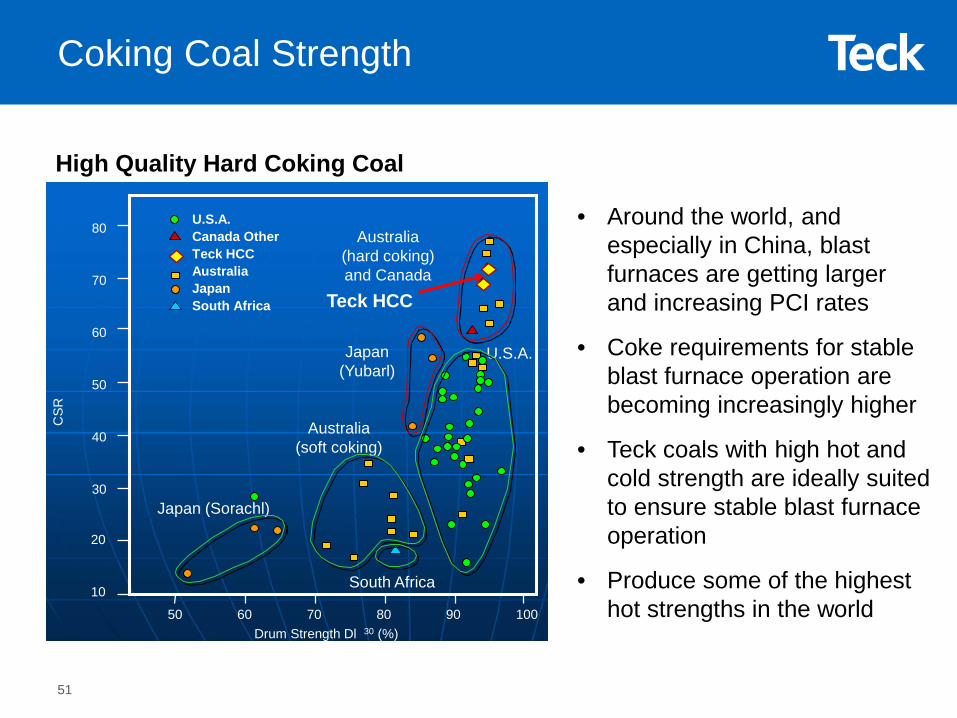
• Around the world, and especially in China, blast furnaces are getting larger and increasing PCI rates
• Coke requirements for stable blast furnace operation are becoming increasingly higher
• Teck coals with high hot and cold strength are ideally suited to ensure stable blast furnace operation
• Produce some of the highest hot strengths in the world50 60 70 80 90 100
South Africa
Japan (Sorachl)
Japan(Yubarl)
U.S.A.Canada OtherTeck HCCAustraliaJapanSouth Africa
Australia(hard coking)and Canada
U.S.A.
Australia(soft coking)
10
20
30
40
50
60
70
80
Drum Strength Dl 30 (%)
CSR
Teck HCC
51
Coking Coal Strength
High Quality Hard Coking Coal

Copper Business Unit & Markets
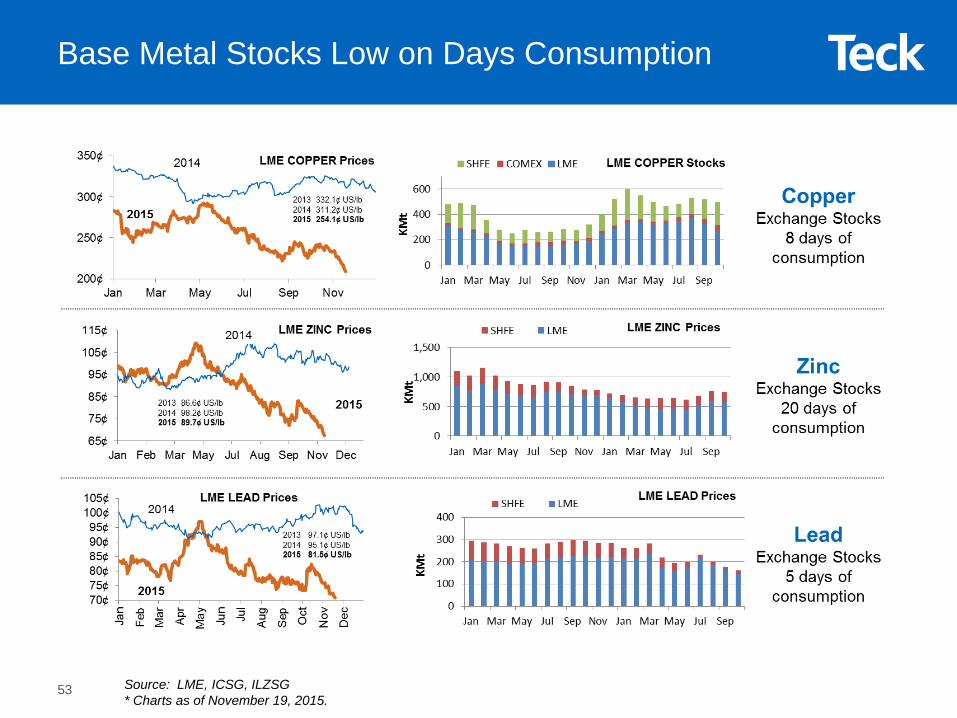
Base Metal Stocks Low on Days Consumption
Source: LME, ICSG, ILZSG* Charts as of November 19, 2015.
53
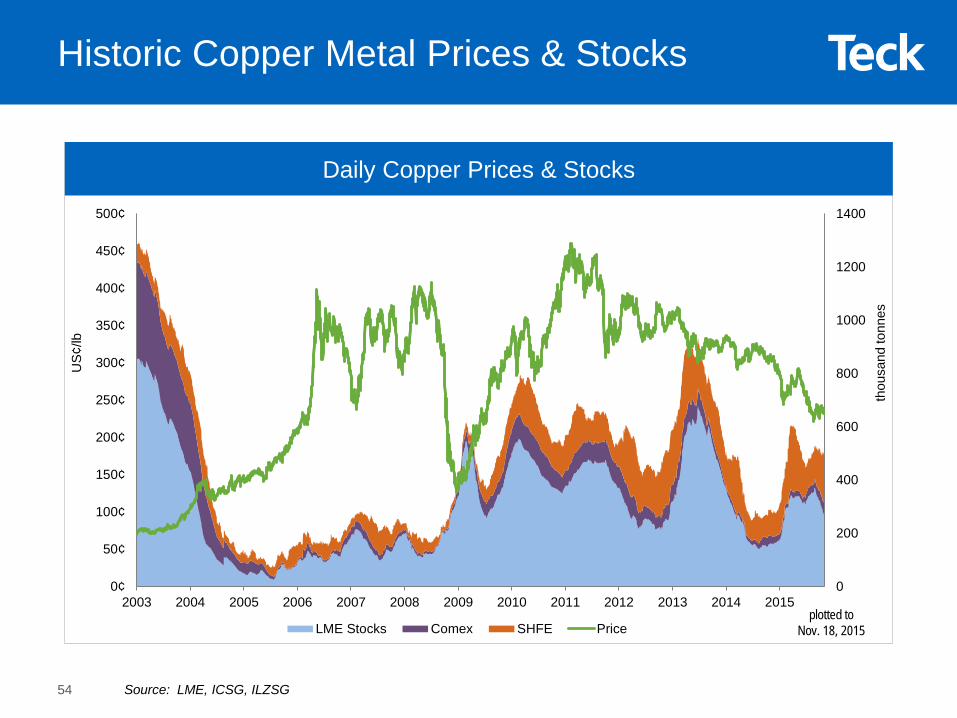
Historic Copper Metal Prices & StocksU
S¢/lb
thou
sand
tonn
es
plotted to Nov. 18, 2015
Daily Copper Prices & Stocks
Source: LME, ICSG, ILZSG
0
200
400
600
800
1000
1200
1400
0¢
50¢
100¢
150¢
200¢
250¢
300¢
350¢
400¢
450¢
500¢
2003 2004 2005 2006 2007 2008 2009 2010 2011 2012 2013 2014 2015
LME Stocks Comex SHFE Price
54
16,000
16,500
17,000
17,500
18,000
18,500
5% Disruption net of ProjectsMarket Adjustment2017 Adjusted
15,000
15,500
16,000
16,500
17,000
17,500
Feb-
13M
ay-1
3A
ug-1
3N
ov-1
3Fe
b-14
May
-14
Aug
-14
Nov
-14
Feb-
15M
ay-1
5A
ug-1
5
2015 AdjustedMarket Adjustment5% Disruption
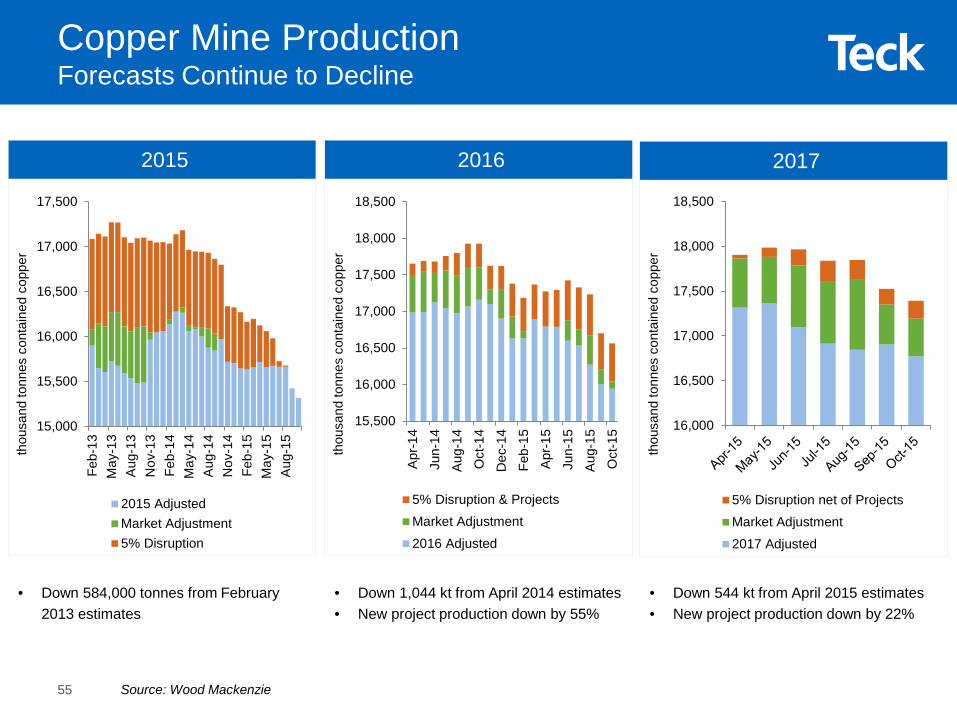
• Down 584,000 tonnes from February 2013 estimates
• Down 1,044 kt from April 2014 estimates• New project production down by 55%
Copper Mine Production Forecasts Continue to Decline
Source: Wood Mackenzie
thou
sand
tonn
es c
onta
ined
cop
per
2015 2016
15,500
16,000
16,500
17,000
17,500
18,000
18,500
Apr
-14
Jun-
14
Aug
-14
Oct
-14
Dec
-14
Feb-
15
Apr
-15
Jun-
15
Aug
-15
Oct
-15
5% Disruption & ProjectsMarket Adjustment2016 Adjusted
2017
• Down 544 kt from April 2015 estimates • New project production down by 22%
thou
sand
tonn
es c
onta
ined
cop
per
thou
sand
tonn
es c
onta
ined
cop
per
55
-950-859
-776-851
-945
-584
-839
-973
-831
-968-1,011
-1,000
-900
-800
-700
-600
-500
-400
-300
-200
-100
02005 2006 2007 2008 2009 2010 2011 2012 2013 2014
2015YTD
Thou
sand
tonn
es
0¢
10¢
20¢
30¢
40¢
50¢
60¢
2005 2006 2007 2008 2009 2010 2011 2012 2013 2014 2015
Standard Spot High Grade SpotRealised TC/RC
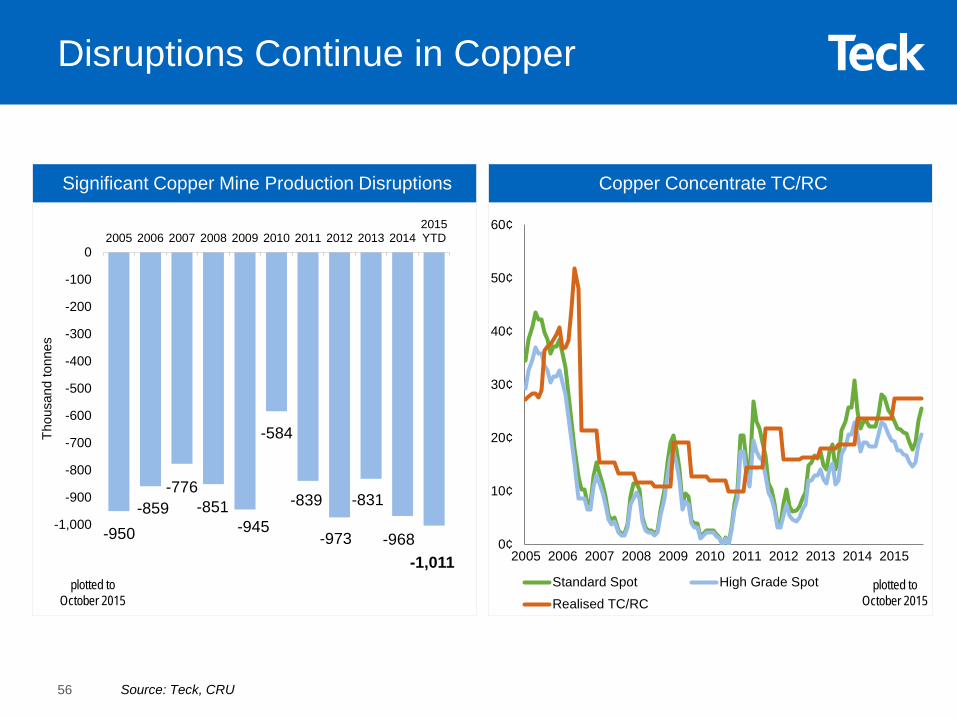
Disruptions Continue in Copper
Significant Copper Mine Production Disruptions Copper Concentrate TC/RC
plotted to October 2015
plotted to October 2015
Source: Teck, CRU56
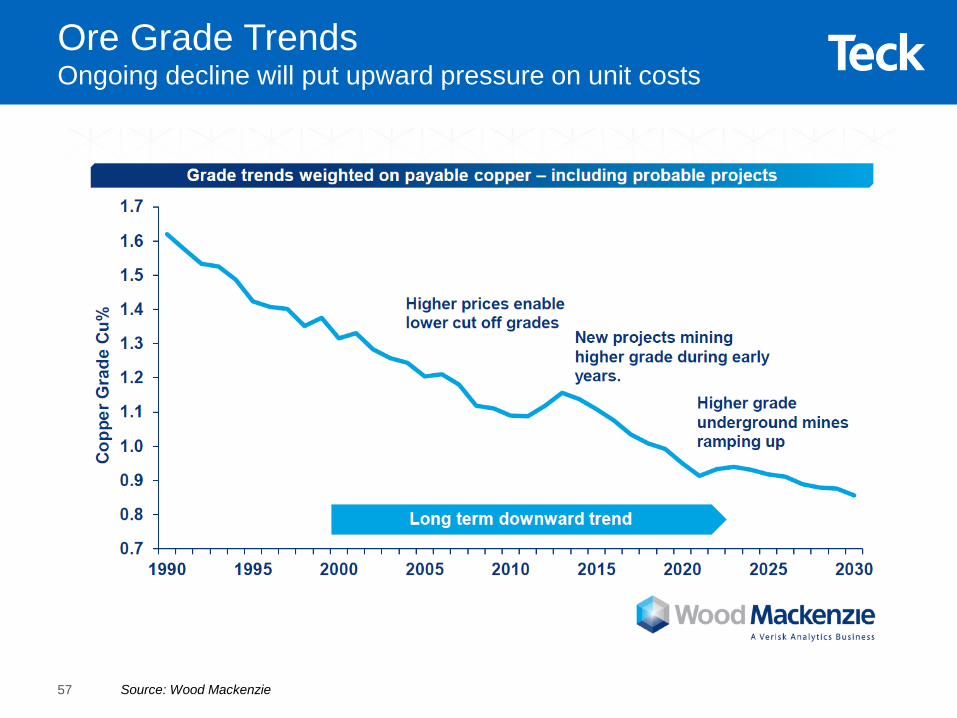
Ore Grade TrendsOngoing decline will put upward pressure on unit costs
Source: Wood Mackenzie57
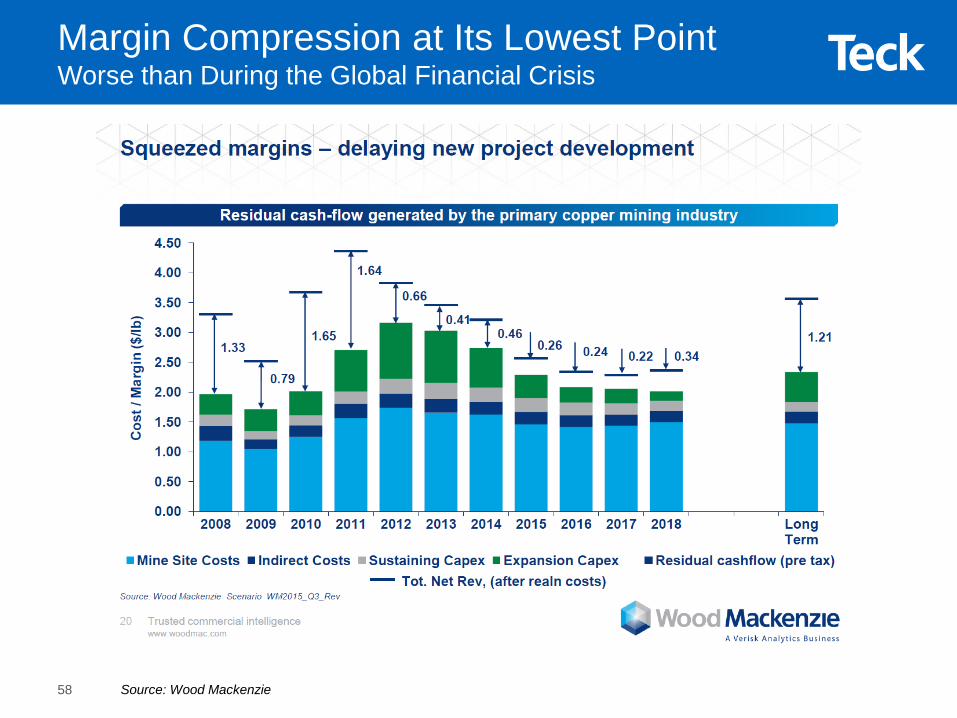
Margin Compression at Its Lowest PointWorse than During the Global Financial Crisis
Source: Wood Mackenzie58
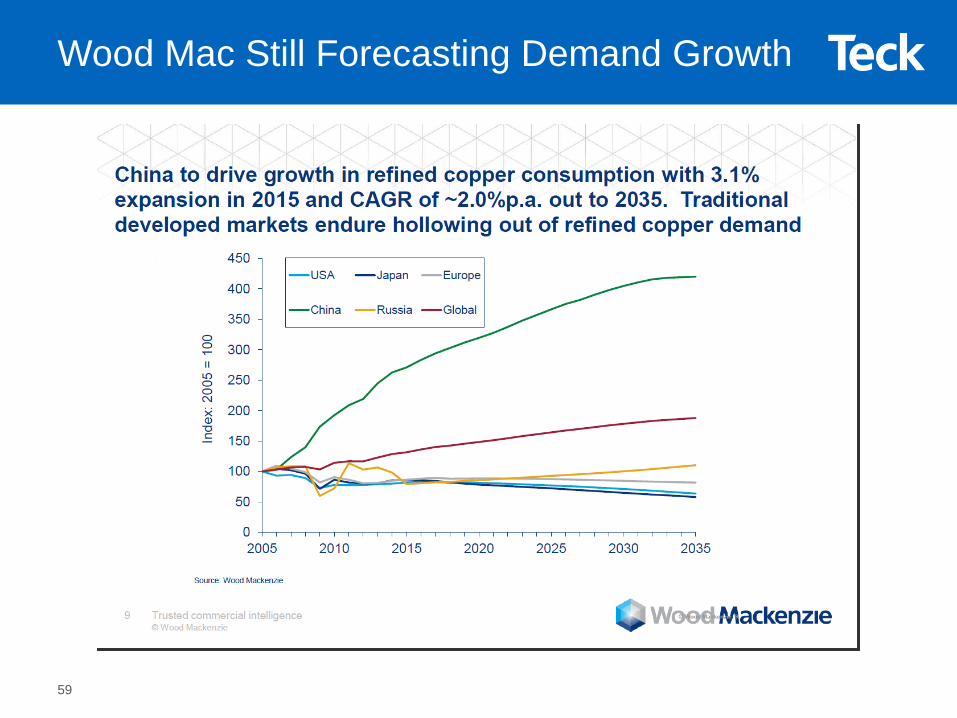
Wood Mac Still Forecasting Demand Growth
59
0100200300400500600700800900
1,000
2004 2005 2006 2007 2008 2009 2010 2011 2012 2013 2014 2015
Cathode Concs Scrap Blister/Semis
000’
s to
nnes
(con
tent
)
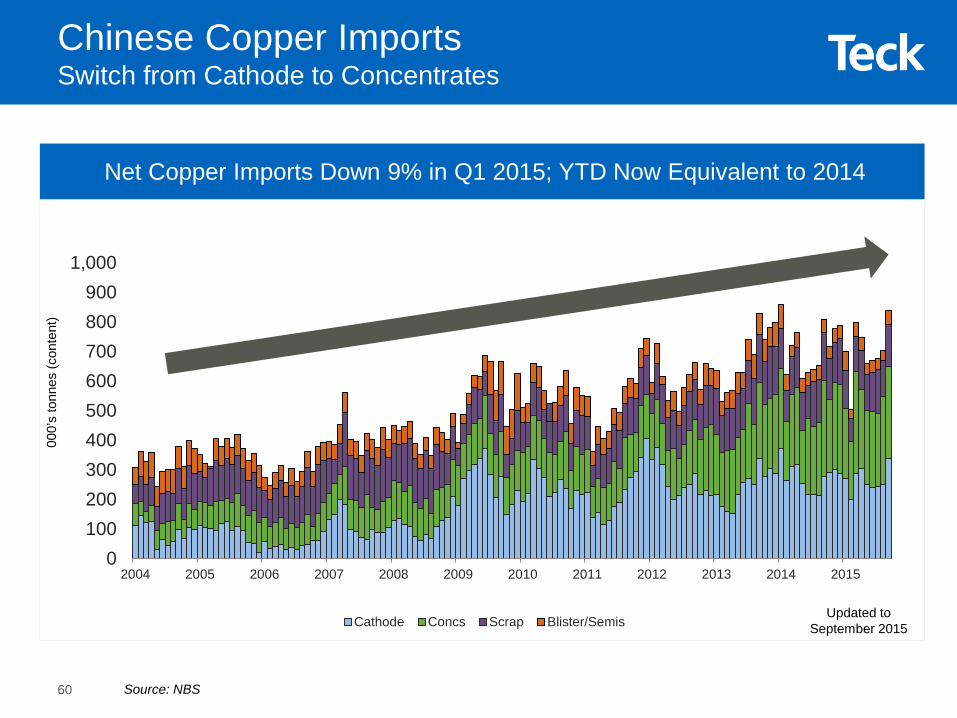
Net Copper Imports Down 9% in Q1 2015; YTD Now Equivalent to 2014
Source: NBS
Chinese Copper Imports Switch from Cathode to Concentrates
Updated to September 2015
60
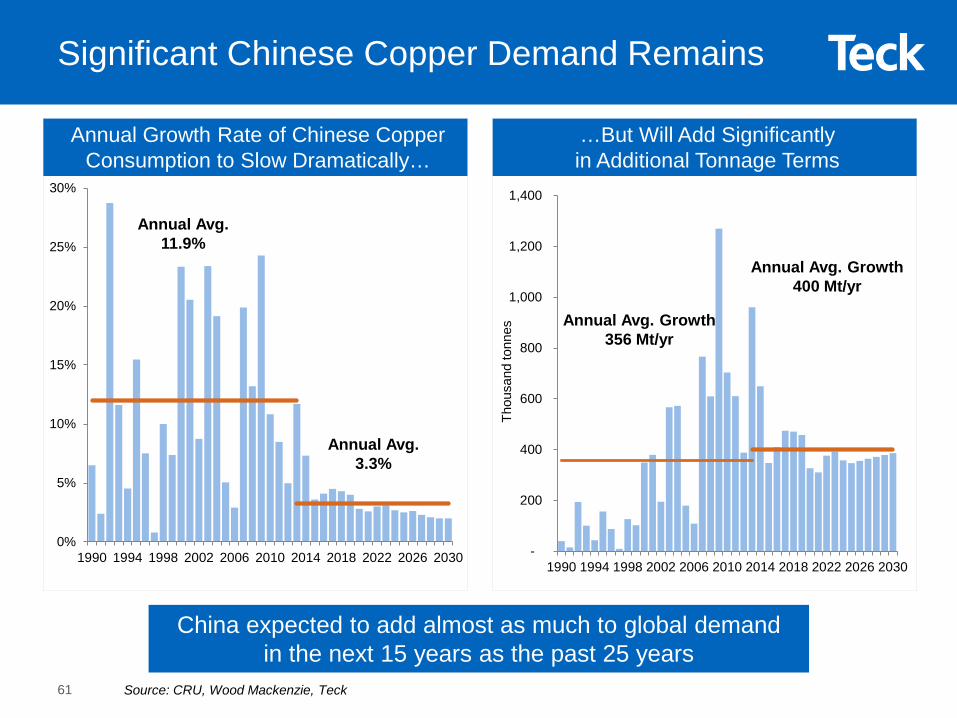
Significant Chinese Copper Demand Remains
…But Will Add Significantly in Additional Tonnage Terms
Annual Growth Rate of Chinese Copper Consumption to Slow Dramatically…
China expected to add almost as much to global demand in the next 15 years as the past 25 years
Source: CRU, Wood Mackenzie, Teck
-
200
400
600
800
1,000
1,200
1,400
1990 1994 1998 2002 2006 2010 2014 2018 2022 2026 2030
0%
5%
10%
15%
20%
25%
30%
1990 1994 1998 2002 2006 2010 2014 2018 2022 2026 2030
Annual Avg. 11.9%
Annual Avg. 3.3%
Annual Avg. Growth356 Mt/yr
Annual Avg. Growth400 Mt/yr
Thou
sand
tonn
es
61
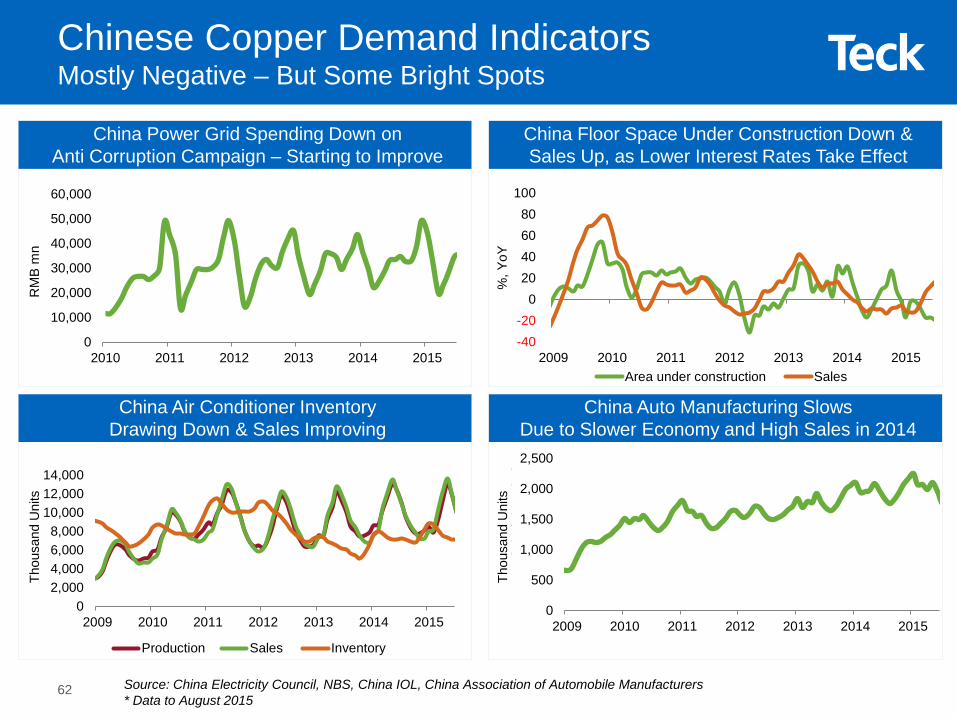
China Power Grid Spending Down on Anti Corruption Campaign – Starting to Improve
China Floor Space Under Construction Down & Sales Up, as Lower Interest Rates Take Effect
Source: China Electricity Council, NBS, China IOL, China Association of Automobile Manufacturers* Data to August 2015
China Air Conditioner Inventory Drawing Down & Sales Improving
China Auto Manufacturing SlowsDue to Slower Economy and High Sales in 2014
0
500
1,000
1,500
2,000
2,500
2009 2010 2011 2012 2013 2014 2015
ousa
dsTh
ousa
nd U
nits
02,0004,0006,0008,000
10,00012,00014,000
2009 2010 2011 2012 2013 2014 2015
Production Sales Inventory
Thou
sand
Uni
ts
%, Y
oY
-40-20
020406080
100
2009 2010 2011 2012 2013 2014 2015Area under construction Sales
0
10,000
20,000
30,000
40,000
50,000
60,000
2010 2011 2012 2013 2014 2015
RM
B m
nChinese Copper Demand IndicatorsMostly Negative – But Some Bright Spots
62

0
100
200
300
400
500
600
700
800
900
Apr
-14
May
-14
Jun-
14Ju
l-14
Aug
-14
Sep
-14
Oct
-14
Nov
-14
Dec
-14
Jan-
15Fe
b-15
Mar
-15
Apr
-15
May
-15
Jun-
15Ju
l-15
Aug
-15
Sep
-15
Oct
-15
Global Copper Cathode BalancesWood Mackenzie’s Outlook is Trending Down
‘000
s to
nnes
cop
per
Surplus only 0.9% of Global Demand
0
100
200
300
400
500
600
700
800
900
Jan-
13M
ar-1
3M
ay-1
3Ju
l-13
Sep
-13
Nov
-13
Jan-
14M
ar-1
4M
ay-1
4Ju
l-14
Sep
-14
Nov
-14
Jan-
15M
ar-1
5M
ay-1
5Ju
l-15
Sep
-15
Wood Mackenzie 2015F Refined Surplus Wood Mackenzie 2016F Refined Surplus
Surplus only 2% of Global Demand
‘000
s to
nnes
cop
per
Source: Wood Mackenzie63
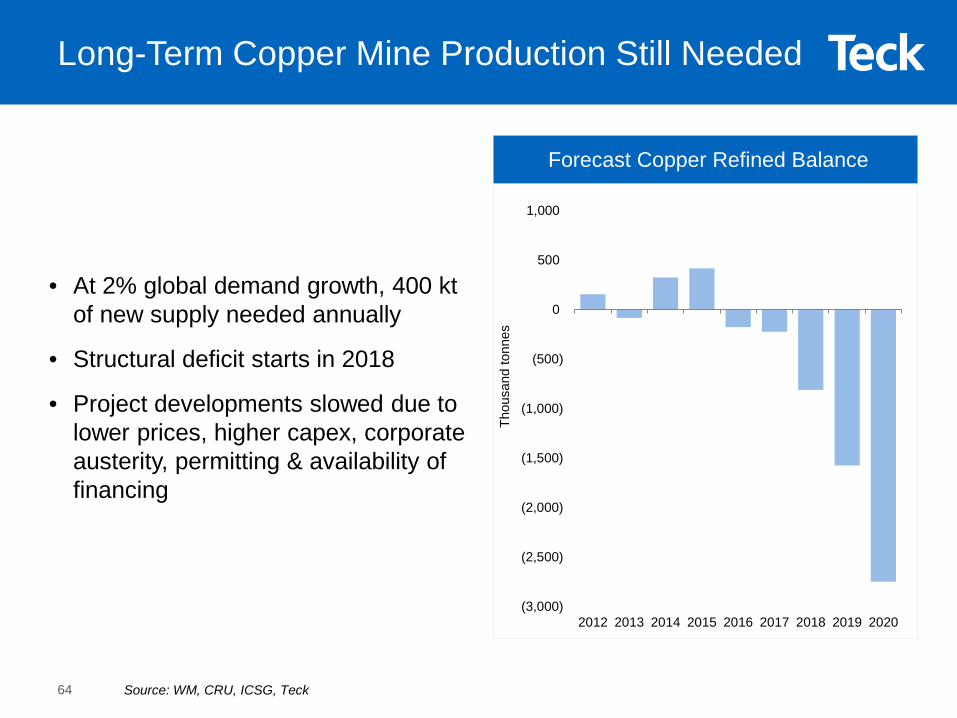
• At 2% global demand growth, 400 ktof new supply needed annually
• Structural deficit starts in 2018
• Project developments slowed due to lower prices, higher capex, corporate austerity, permitting & availability of financing
Forecast Copper Refined Balance
Long-Term Copper Mine Production Still Needed
Source: WM, CRU, ICSG, Teck
(3,000)
(2,500)
(2,000)
(1,500)
(1,000)
(500)
0
500
1,000
2012 2013 2014 2015 2016 2017 2018 2019 2020
Thou
sand
tonn
es
64
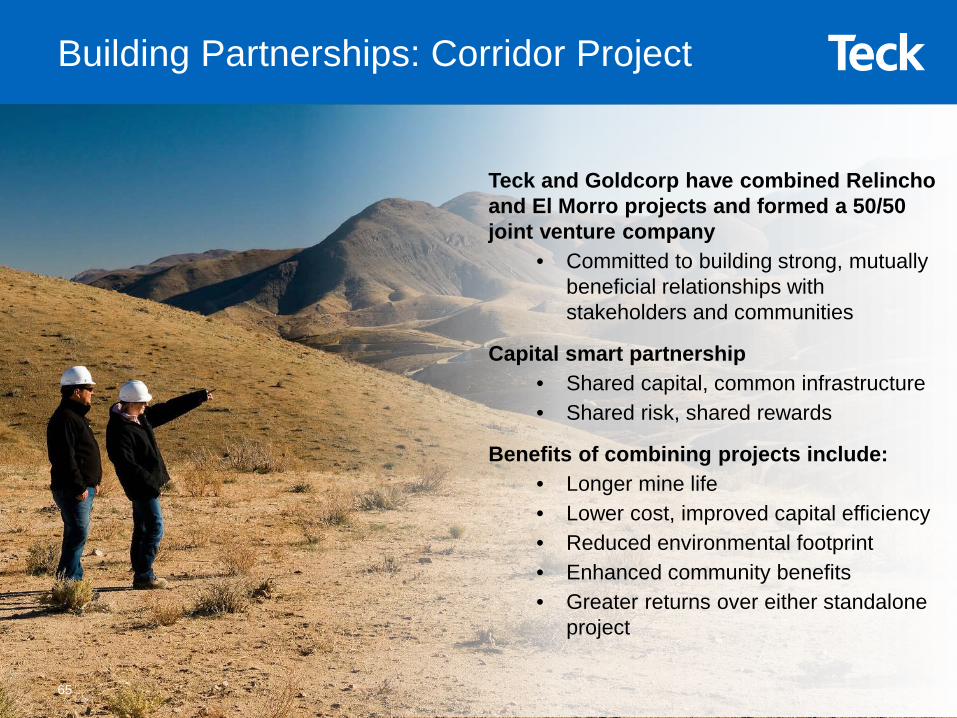
Building Partnerships: Corridor Project
Teck and Goldcorp have combined Relincho and El Morro projects and formed a 50/50 joint venture company
• Committed to building strong, mutually beneficial relationships with stakeholders and communities
Capital smart partnership • Shared capital, common infrastructure• Shared risk, shared rewards
Benefits of combining projects include:• Longer mine life• Lower cost, improved capital efficiency• Reduced environmental footprint• Enhanced community benefits• Greater returns over either standalone
project
65
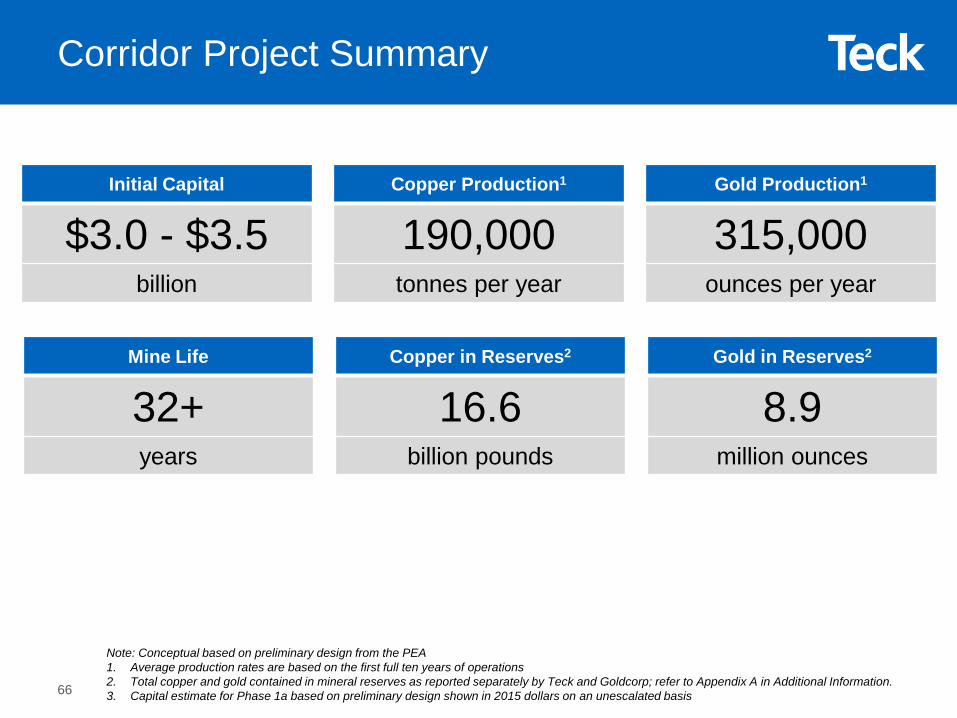
Corridor Project Summary
Initial Capital
$3.0 - $3.5billion
Copper Production1
190,000tonnes per year
Gold Production1
315,000ounces per year
Mine Life
32+years
Copper in Reserves2
16.6billion pounds
Gold in Reserves2
8.9million ounces
Note: Conceptual based on preliminary design from the PEA1. Average production rates are based on the first full ten years of operations2. Total copper and gold contained in mineral reserves as reported separately by Teck and Goldcorp; refer to Appendix A in Additional Information.3. Capital estimate for Phase 1a based on preliminary design shown in 2015 dollars on an unescalated basis66
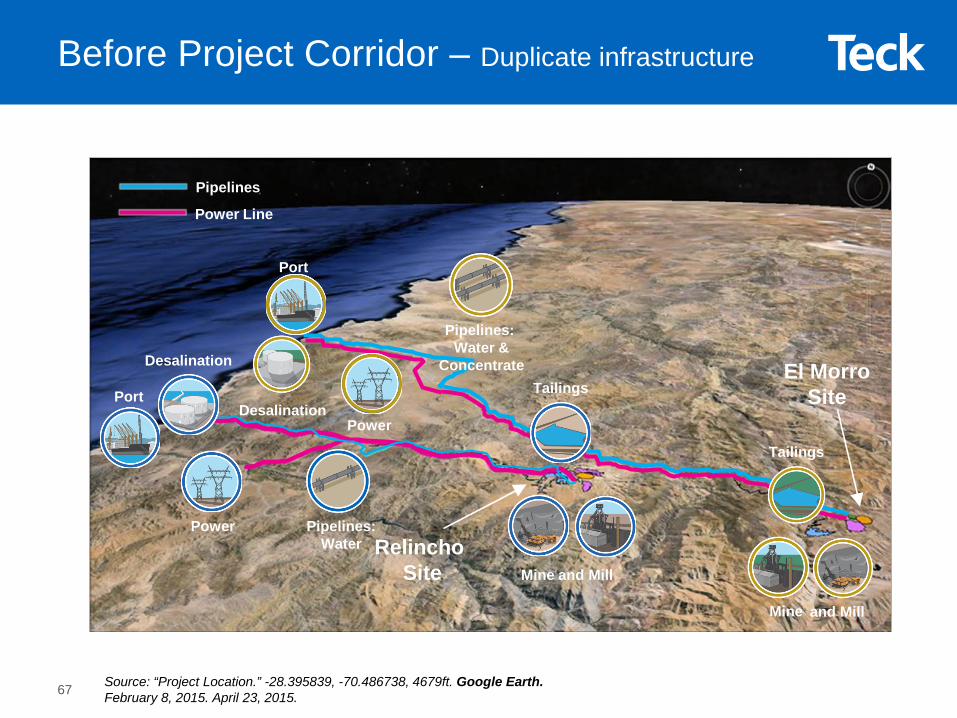
Desalination
Desalination
Power
Mine and Mill
Mine
Port
Relincho Site
El MorroSite
Before Project Corridor – Duplicate infrastructure
Pipelines
Power Line
and Mill
Pipelines:Water
Pipelines: Water &
ConcentrateTailings
Tailings
Power
Port
Source: “Project Location.” -28.395839, -70.486738, 4679ft. Google Earth.February 8, 2015. April 23, 2015.67
Mine
Tailings
Desalination
Port
Mine and Mill
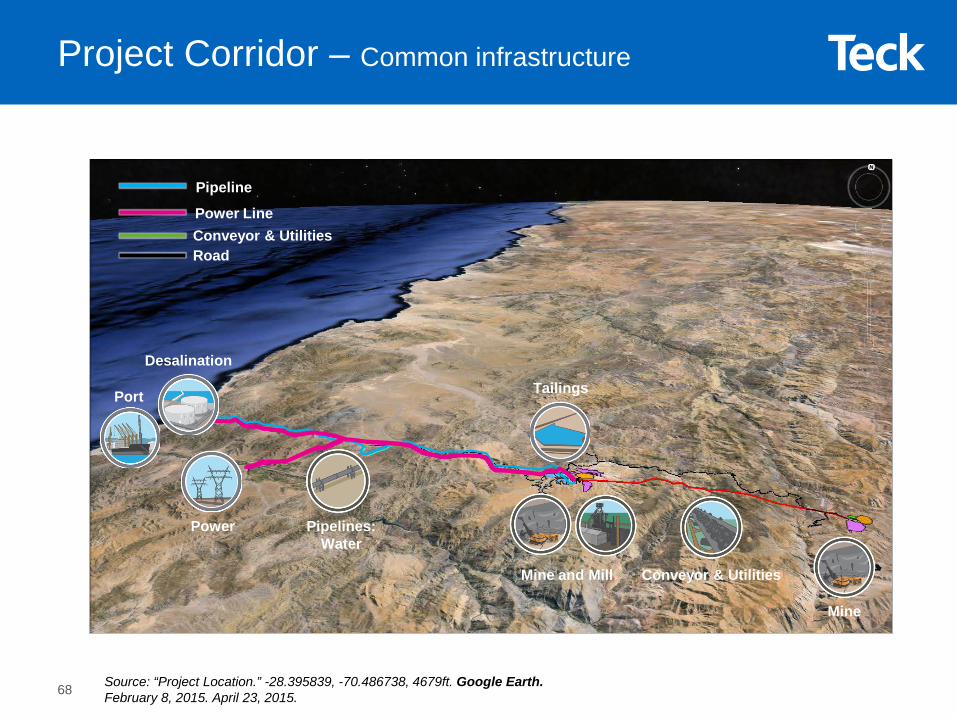
Project Corridor – Common infrastructure
Conveyor & Utilities
Power Pipelines:Water
Pipeline
Power LineConveyor & UtilitiesRoad
Source: “Project Location.” -28.395839, -70.486738, 4679ft. Google Earth.February 8, 2015. April 23, 2015.68
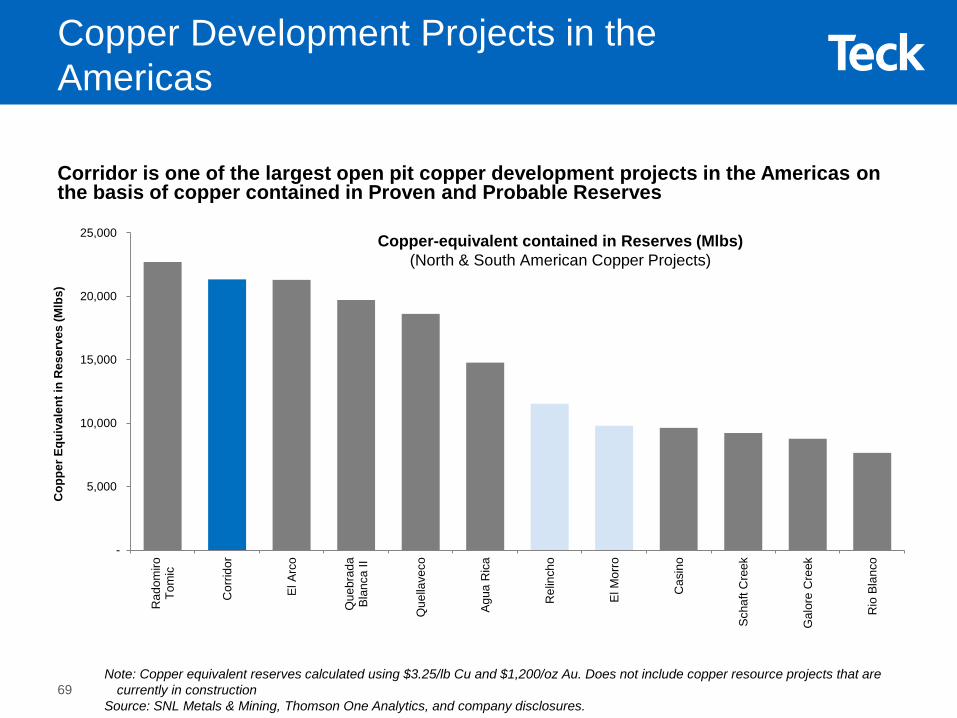
Copper Development Projects in theAmericas
Corridor is one of the largest open pit copper development projects in the Americas on the basis of copper contained in Proven and Probable Reserves
-
5,000
10,000
15,000
20,000
25,000
Rad
omiro
Tom
ic
Cor
ridor
El A
rco
Que
brad
aB
lanc
a II
Que
llave
co
Agu
a R
ica
Rel
inch
o
El M
orro
Cas
ino
Sch
aft C
reek
Gal
ore
Cre
ek
Rio
Bla
nco
Cop
per E
quiv
alen
t in
Res
erve
s (M
lbs)
Copper-equivalent contained in Reserves (Mlbs)(North & South American Copper Projects)
Note: Copper equivalent reserves calculated using $3.25/lb Cu and $1,200/oz Au. Does not include copper resource projects that are currently in construction
Source: SNL Metals & Mining, Thomson One Analytics, and company disclosures.69
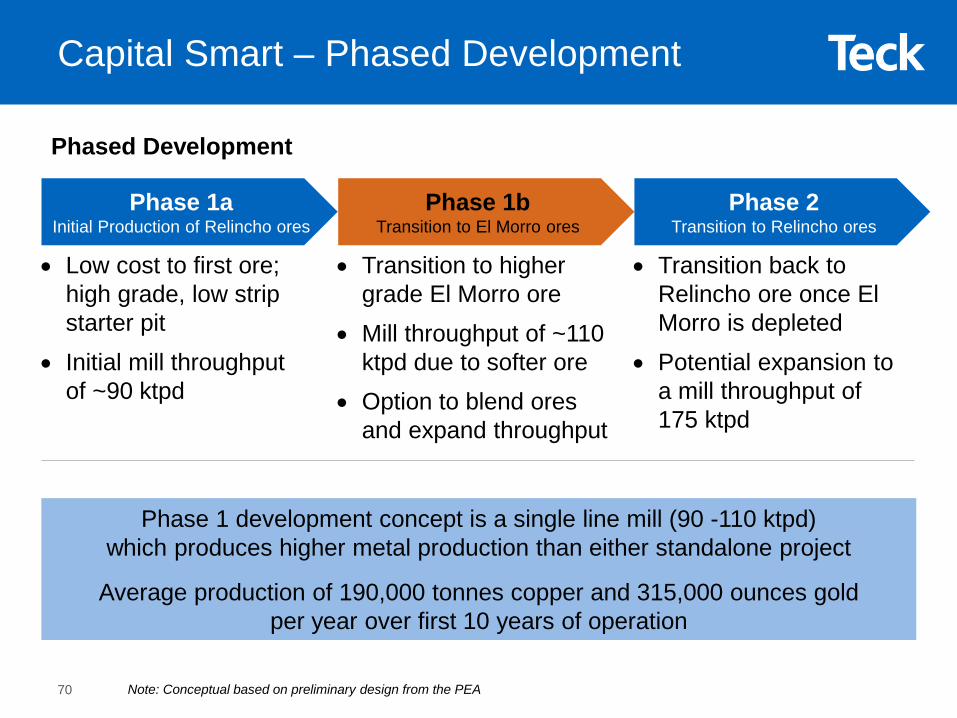
Capital Smart – Phased Development
Phase 1aInitial Production of Relincho ores
Phase 1bTransition to El Morro ores
Phase 2Transition to Relincho ores
• Low cost to first ore; high grade, low strip starter pit
• Initial mill throughput of ~90 ktpd
• Transition to higher grade El Morro ore
• Mill throughput of ~110 ktpd due to softer ore
• Option to blend ores and expand throughput
• Transition back to Relincho ore once El Morro is depleted
• Potential expansion to a mill throughput of 175 ktpd
Phase 1 development concept is a single line mill (90 -110 ktpd) which produces higher metal production than either standalone project
Average production of 190,000 tonnes copper and 315,000 ounces gold per year over first 10 years of operation
Note: Conceptual based on preliminary design from the PEA
Phased Development
70
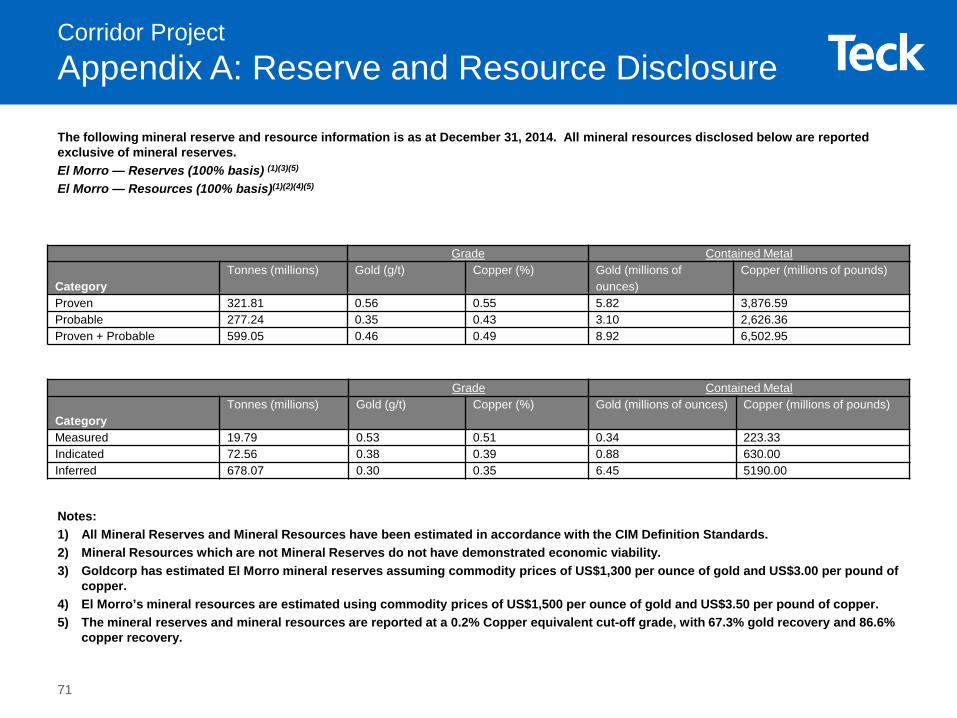
Corridor ProjectAppendix A: Reserve and Resource Disclosure
The following mineral reserve and resource information is as at December 31, 2014. All mineral resources disclosed below are reported exclusive of mineral reserves. El Morro — Reserves (100% basis) (1)(3)(5)
El Morro — Resources (100% basis)(1)(2)(4)(5)
Notes: 1) All Mineral Reserves and Mineral Resources have been estimated in accordance with the CIM Definition Standards. 2) Mineral Resources which are not Mineral Reserves do not have demonstrated economic viability.3) Goldcorp has estimated El Morro mineral reserves assuming commodity prices of US$1,300 per ounce of gold and US$3.00 per pound of
copper. 4) El Morro’s mineral resources are estimated using commodity prices of US$1,500 per ounce of gold and US$3.50 per pound of copper.5) The mineral reserves and mineral resources are reported at a 0.2% Copper equivalent cut-off grade, with 67.3% gold recovery and 86.6%
copper recovery.
Grade Contained Metal
CategoryTonnes (millions) Gold (g/t) Copper (%) Gold (millions of
ounces)Copper (millions of pounds)
Proven 321.81 0.56 0.55 5.82 3,876.59Probable 277.24 0.35 0.43 3.10 2,626.36Proven + Probable 599.05 0.46 0.49 8.92 6,502.95
Grade Contained Metal
CategoryTonnes (millions) Gold (g/t) Copper (%) Gold (millions of ounces) Copper (millions of pounds)
Measured 19.79 0.53 0.51 0.34 223.33Indicated 72.56 0.38 0.39 0.88 630.00Inferred 678.07 0.30 0.35 6.45 5190.00
71
Corridor ProjectAppendix A: Reserve and Resource Disclosure
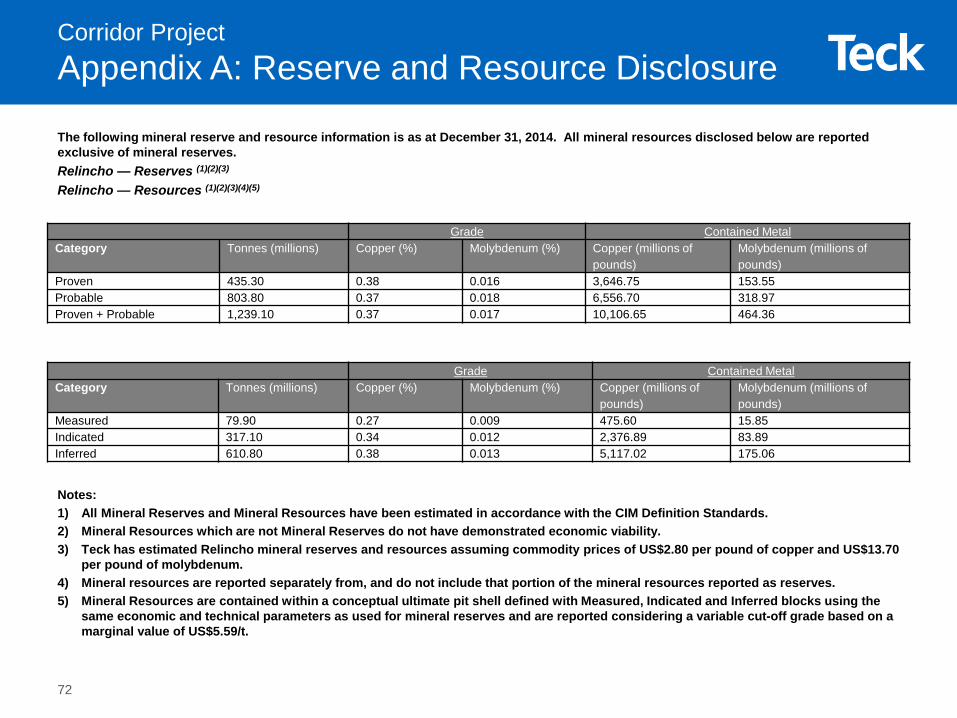
The following mineral reserve and resource information is as at December 31, 2014. All mineral resources disclosed below are reported exclusive of mineral reserves. Relincho — Reserves (1)(2)(3)
Relincho — Resources (1)(2)(3)(4)(5)
Notes: 1) All Mineral Reserves and Mineral Resources have been estimated in accordance with the CIM Definition Standards. 2) Mineral Resources which are not Mineral Reserves do not have demonstrated economic viability.3) Teck has estimated Relincho mineral reserves and resources assuming commodity prices of US$2.80 per pound of copper and US$13.70
per pound of molybdenum. 4) Mineral resources are reported separately from, and do not include that portion of the mineral resources reported as reserves. 5) Mineral Resources are contained within a conceptual ultimate pit shell defined with Measured, Indicated and Inferred blocks using the
same economic and technical parameters as used for mineral reserves and are reported considering a variable cut-off grade based on a marginal value of US$5.59/t.
Grade Contained MetalCategory Tonnes (millions) Copper (%) Molybdenum (%) Copper (millions of
pounds)Molybdenum (millions of pounds)
Proven 435.30 0.38 0.016 3,646.75 153.55Probable 803.80 0.37 0.018 6,556.70 318.97Proven + Probable 1,239.10 0.37 0.017 10,106.65 464.36
Grade Contained Metal Category Tonnes (millions) Copper (%) Molybdenum (%) Copper (millions of
pounds)Molybdenum (millions of pounds)
Measured 79.90 0.27 0.009 475.60 15.85Indicated 317.10 0.34 0.012 2,376.89 83.89Inferred 610.80 0.38 0.013 5,117.02 175.06
72
Corridor ProjectAppendix A: Reserve and Resource Disclosure Cont’d
These tables use the terms “Measured”, “Indicated” and “Inferred” Resources. United States investors are advised that while suchterms are recognized and required by Canadian regulations, the United States Securities and Exchange Commission does not recognize them. “Inferred Mineral Resources” have a great amount of uncertainty as to their existence, and as to their economic and legal feasibility. A significant amount of exploration must be completed in order to determine whether an Inferred Mineral Resource may be upgraded to a higher category. Under Canadian rules, estimates of Inferred Mineral Resources may not form the basis offeasibility or other economic studies. United States investors are cautioned not to assume that all or any part of Measured or Indicated Mineral Resources will ever be converted into Mineral Reserves. United States investors are also cautioned not to assume that all or any part of an Inferred Mineral Resource exists, or is economically or legally mineable.
The projected mine life of the combined project from the PEA is based on mineral reserves only and does not include other mineral resources. The financial analysis under the PEA of Project Corridor assumed commodity prices of US$1,200 per ounce of gold, US$3.25 per pound of copper and US$10.00 per pound of molybdenum. The projected mine life of the combined project and other results of the PEA disclosed in this news release have been reviewed and approved by Gil Lawson, P.Eng., Vice President of Geology and Mine Planning, Goldcorp and Rodrigo Marinho, P.Geo., Technical Director, Reserve Evaluation, Teck, each of whom is a qualified person as defined under NI 43-101.
73

ZincBusiness Unit & Markets
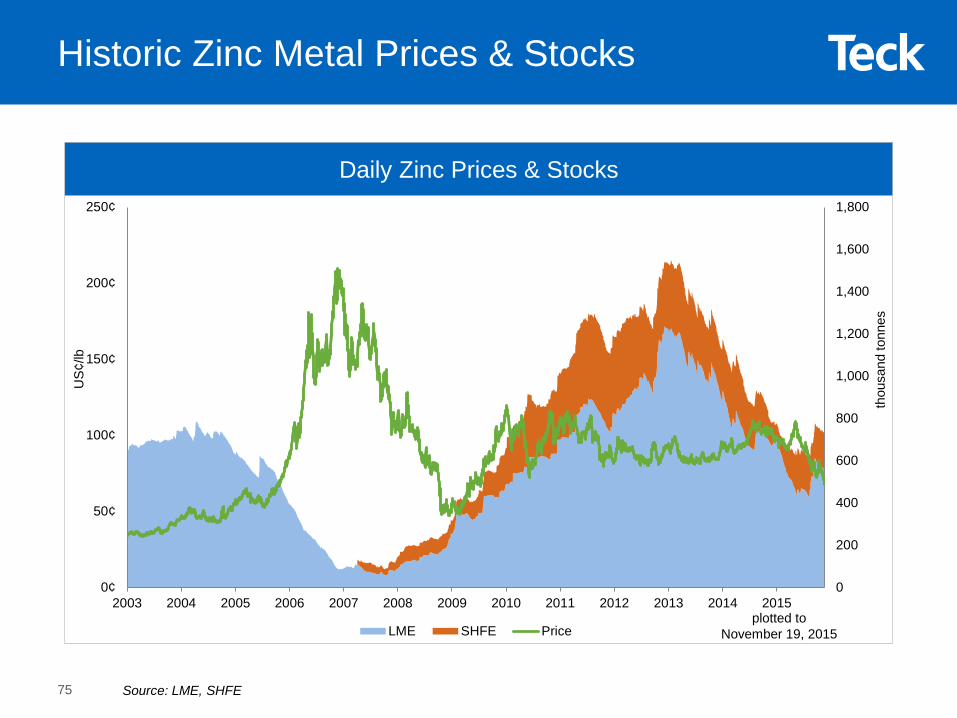
Historic Zinc Metal Prices & Stocks
Daily Zinc Prices & Stocks
0
200
400
600
800
1,000
1,200
1,400
1,600
1,800
0¢
50¢
100¢
150¢
200¢
250¢
2003 2004 2005 2006 2007 2008 2009 2010 2011 2012 2013 2014 2015
LME SHFE Price
US¢
/lb
thou
sand
tonn
es
plotted to November 19, 2015
Source: LME, SHFE75
0
1,000
2,000
3,000
4,000
5,000
6,000
0
100
200
300
400
500
600
Jan Feb Mar Apr May Jun Jul Aug Sep Oct Nov Dec
2013 2014 2015
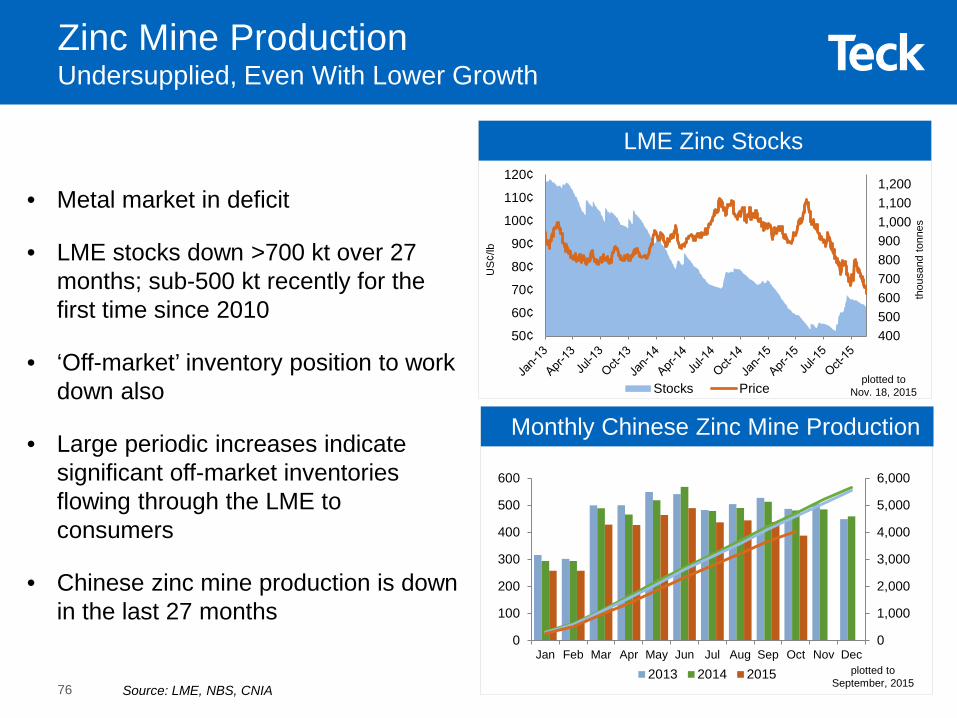
Monthly Chinese Zinc Mine Production
LME Zinc Stocks
Zinc Mine ProductionUndersupplied, Even With Lower Growth
4005006007008009001,0001,1001,200
50¢
60¢
70¢
80¢
90¢
100¢
110¢
120¢
Stocks Priceplotted to
Nov. 18, 2015
plotted to September, 2015
• Metal market in deficit
• LME stocks down >700 kt over 27 months; sub-500 kt recently for the first time since 2010
• ‘Off-market’ inventory position to work down also
• Large periodic increases indicate significant off-market inventories flowing through the LME to consumers
• Chinese zinc mine production is down in the last 27 months
US
¢/lb
thou
sand
tonn
es
Source: LME, NBS, CNIA76
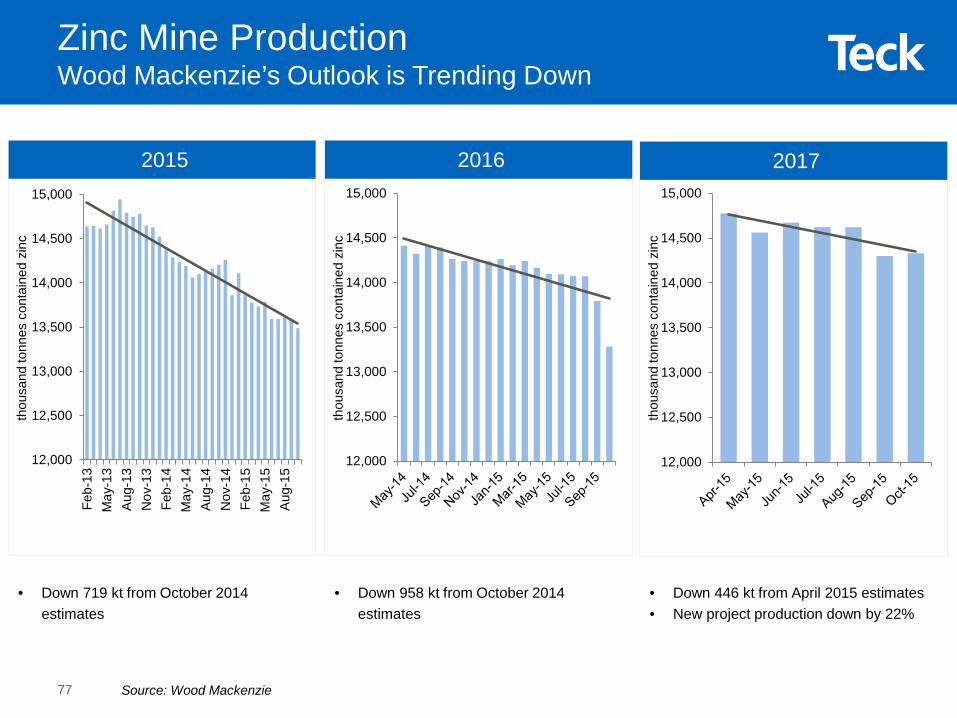
• Down 719 kt from October 2014 estimates
• Down 958 kt from October 2014 estimates
Zinc Mine Production Wood Mackenzie’s Outlook is Trending Down
thou
sand
tonn
es c
onta
ined
zin
c
2015 2016 2017
• Down 446 kt from April 2015 estimates • New project production down by 22%
thou
sand
tonn
es c
onta
ined
zin
c
thou
sand
tonn
es c
onta
ined
zin
c
12,000
12,500
13,000
13,500
14,000
14,500
15,000
Feb-
13M
ay-1
3A
ug-1
3N
ov-1
3Fe
b-14
May
-14
Aug
-14
Nov
-14
Feb-
15M
ay-1
5A
ug-1
5
12,000
12,500
13,000
13,500
14,000
14,500
15,000
12,000
12,500
13,000
13,500
14,000
14,500
15,000
Source: Wood Mackenzie77
2013-2020 2013-2020
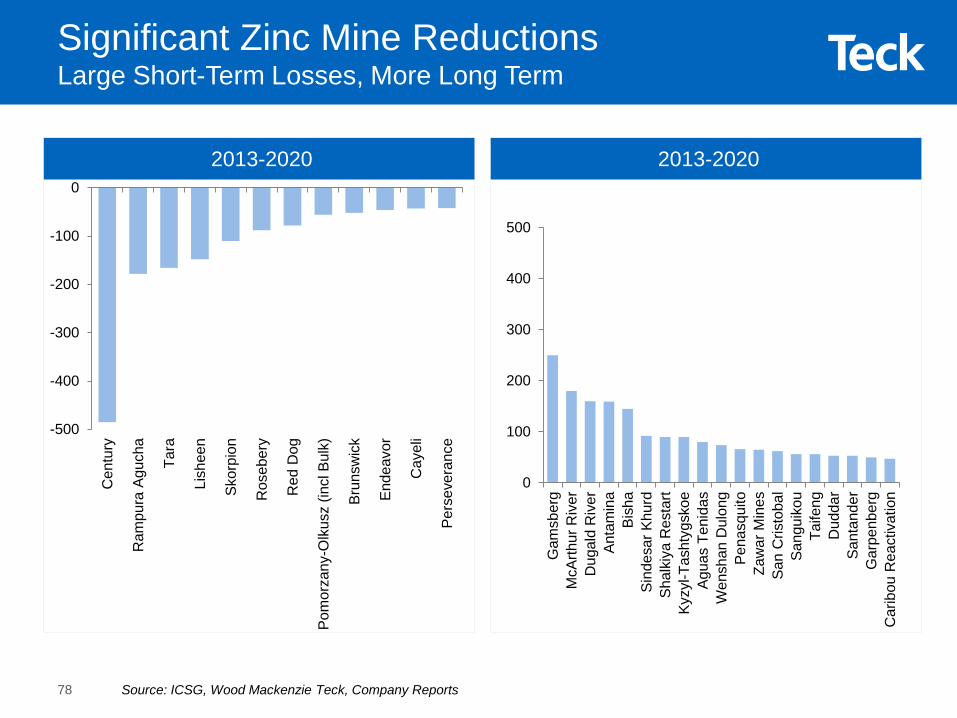
Significant Zinc Mine ReductionsLarge Short-Term Losses, More Long Term
-500
-400
-300
-200
-100
0
Cen
tury
Ram
pura
Agu
cha
Tara
Lish
een
Skor
pion
Ros
eber
y
Red
Dog
Pom
orza
ny-O
lkus
z (in
cl B
ulk)
Brun
swic
k
Ende
avor
Cay
eli
Pers
ever
ance
0
100
200
300
400
500
Gam
sber
gM
cArth
ur R
iver
Dug
ald
Riv
erAn
tam
ina
Bish
aSi
ndes
ar K
hurd
Shal
kiya
Res
tart
Kyzy
l-Tas
htyg
skoe
Agua
s Te
nida
sW
ensh
an D
ulon
gPe
nasq
uito
Zaw
ar M
ines
San
Cris
toba
lSa
ngui
kou
Taife
ngD
udda
rSa
ntan
der
Gar
penb
erg
Car
ibou
Rea
ctiv
atio
n
Source: ICSG, Wood Mackenzie Teck, Company Reports78
LME Zinc Stocks – Since Dec 2012LME Zinc Stocks - 11 Years
Zinc Inventories Declining
400
500
600
700
800
900
1,000
1,100
1,200
50¢
60¢
70¢
80¢
90¢
100¢
110¢
120¢
Stocks Price
0
200
400
600
800
1,000
1,200
1,400
0¢
50¢
100¢
150¢
200¢
250¢
2003
2004
2005
2006
2007
2008
2009
2010
2011
2012
2013
2014
2015
Stocks Price
US
¢/lb
thou
sand
tonn
esplotted to
Nov. 18, 2015
US
¢/lb
thou
sand
tonn
es
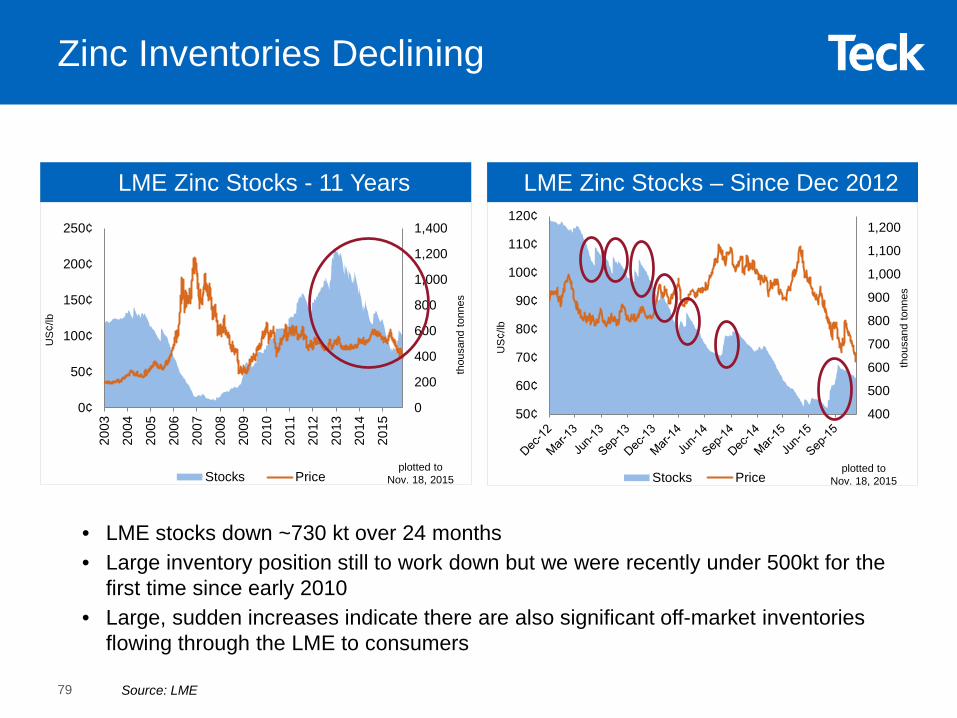
• LME stocks down ~730 kt over 24 months• Large inventory position still to work down but we were recently under 500kt for the
first time since early 2010• Large, sudden increases indicate there are also significant off-market inventories
flowing through the LME to consumers
plotted to Nov. 18, 2015
Source: LME79
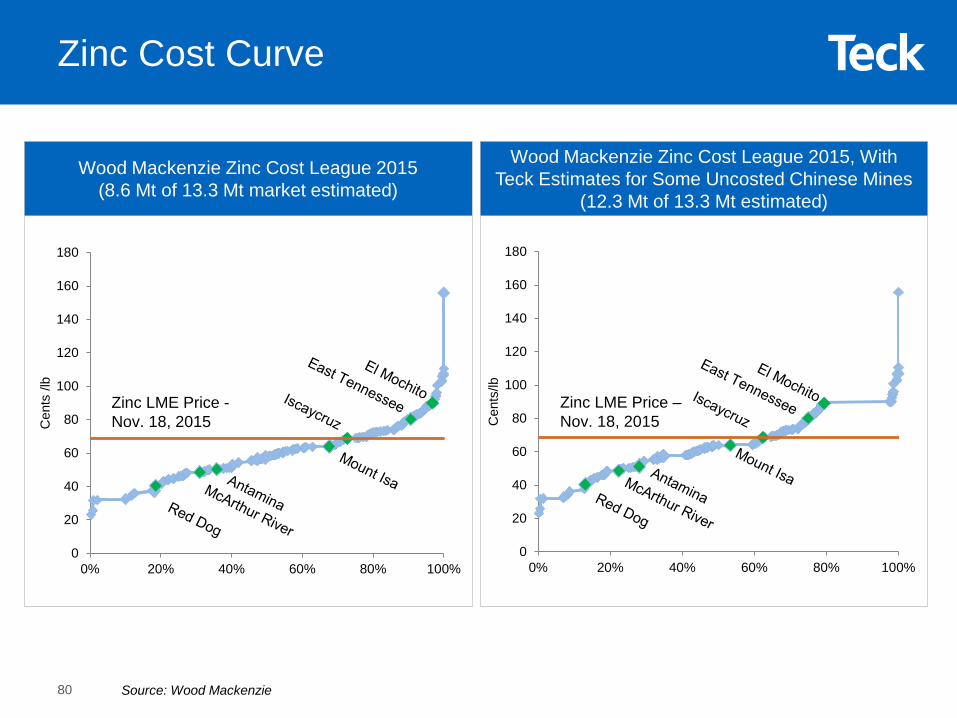
Zinc Cost Curve
Wood Mackenzie Zinc Cost League 2015(8.6 Mt of 13.3 Mt market estimated)
Wood Mackenzie Zinc Cost League 2015, With Teck Estimates for Some Uncosted Chinese Mines
(12.3 Mt of 13.3 Mt estimated)
0
20
40
60
80
100
120
140
160
180
0% 20% 40% 60% 80% 100%
Cen
ts/lb
Zinc LME Price –Nov. 18, 2015
0
20
40
60
80
100
120
140
160
180
0% 20% 40% 60% 80% 100%
Cen
ts /l
b
Zinc LME Price -Nov. 18, 2015
Source: Wood Mackenzie80
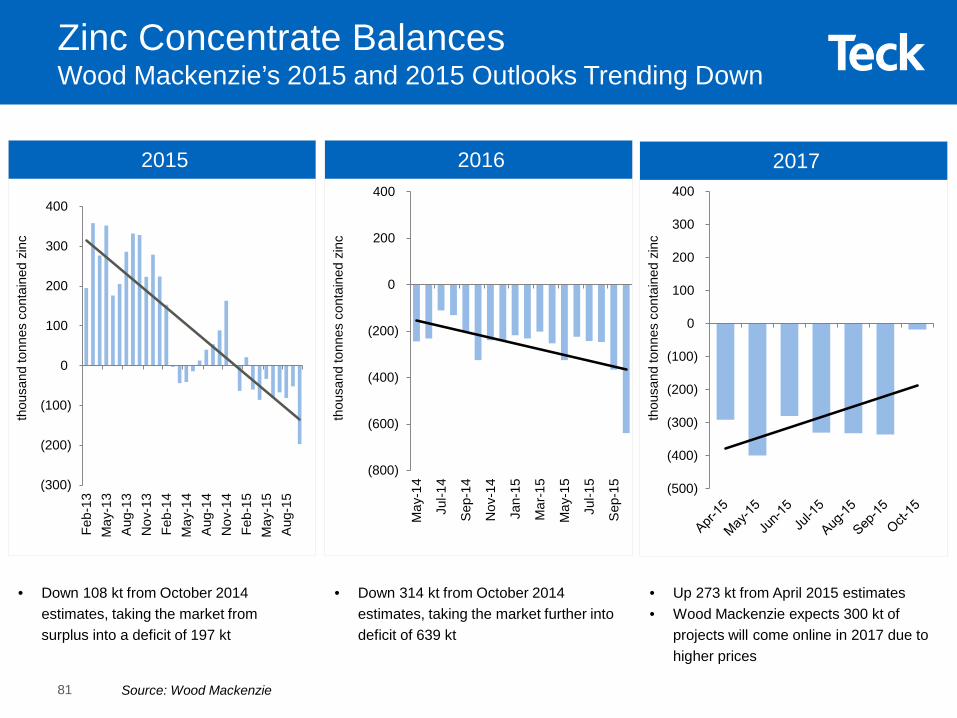
• Down 108 kt from October 2014 estimates, taking the market from surplus into a deficit of 197 kt
• Down 314 kt from October 2014 estimates, taking the market further into deficit of 639 kt
thou
sand
tonn
es c
onta
ined
zin
c
2015 2016 2017
• Up 273 kt from April 2015 estimates • Wood Mackenzie expects 300 kt of
projects will come online in 2017 due to higher prices
thou
sand
tonn
es c
onta
ined
zin
c
thou
sand
tonn
es c
onta
ined
zin
c
(300)
(200)
(100)
0
100
200
300
400
Feb-
13M
ay-1
3A
ug-1
3N
ov-1
3Fe
b-14
May
-14
Aug
-14
Nov
-14
Feb-
15M
ay-1
5A
ug-1
5
(800)
(600)
(400)
(200)
0
200
400
May
-14
Jul-1
4
Sep
-14
Nov
-14
Jan-
15
Mar
-15
May
-15
Jul-1
5
Sep
-15 (500)
(400)
(300)
(200)
(100)
0
100
200
300
400
Zinc Concentrate BalancesWood Mackenzie’s 2015 and 2015 Outlooks Trending Down
Source: Wood Mackenzie81
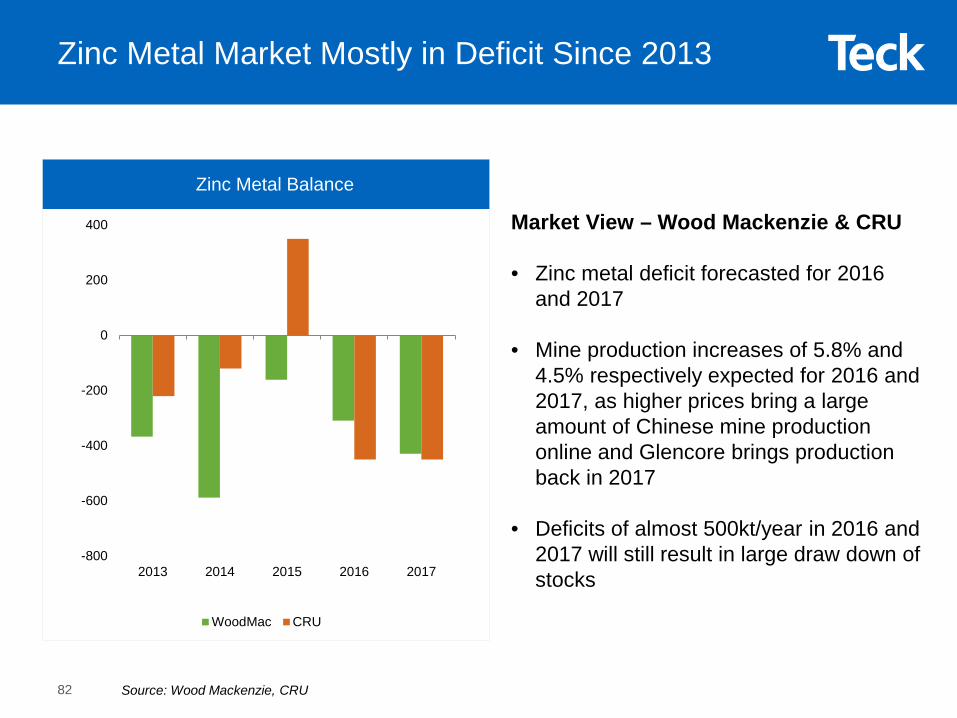
Zinc Metal Market Mostly in Deficit Since 2013
-800
-600
-400
-200
0
200
400
2013 2014 2015 2016 2017
WoodMac CRU
Market View – Wood Mackenzie & CRU
• Zinc metal deficit forecasted for 2016 and 2017
• Mine production increases of 5.8% and 4.5% respectively expected for 2016 and 2017, as higher prices bring a large amount of Chinese mine production online and Glencore brings production back in 2017
• Deficits of almost 500kt/year in 2016 and 2017 will still result in large draw down of stocks
Zinc Metal Balance
Source: Wood Mackenzie, CRU82
China6%
USA 19%
0%
2%
4%
6%
8%
10%
12%
14%
16%
18%
20%
00 01 02 03 04 05 06 07 08 09 10 11 12 13 14
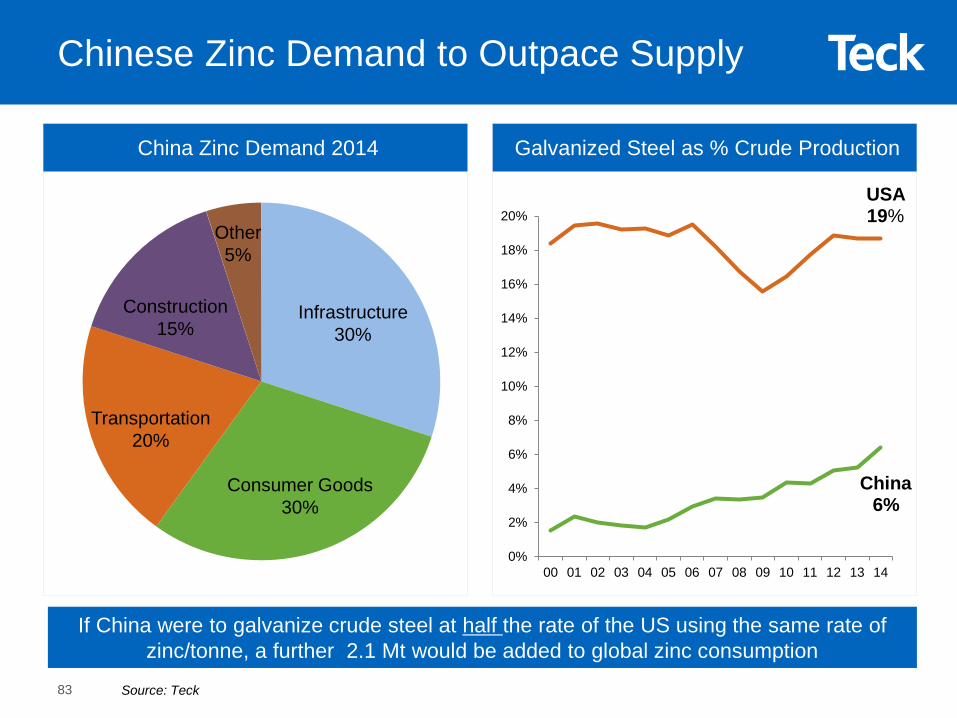
Galvanized Steel as % Crude ProductionChina Zinc Demand 2014
Construction15%
Transportation 20%
Other 5%
Consumer Goods30%
Infrastructure30%
Chinese Zinc Demand to Outpace Supply
Source: Teck
If China were to galvanize crude steel at half the rate of the US using the same rate of zinc/tonne, a further 2.1 Mt would be added to global zinc consumption
83
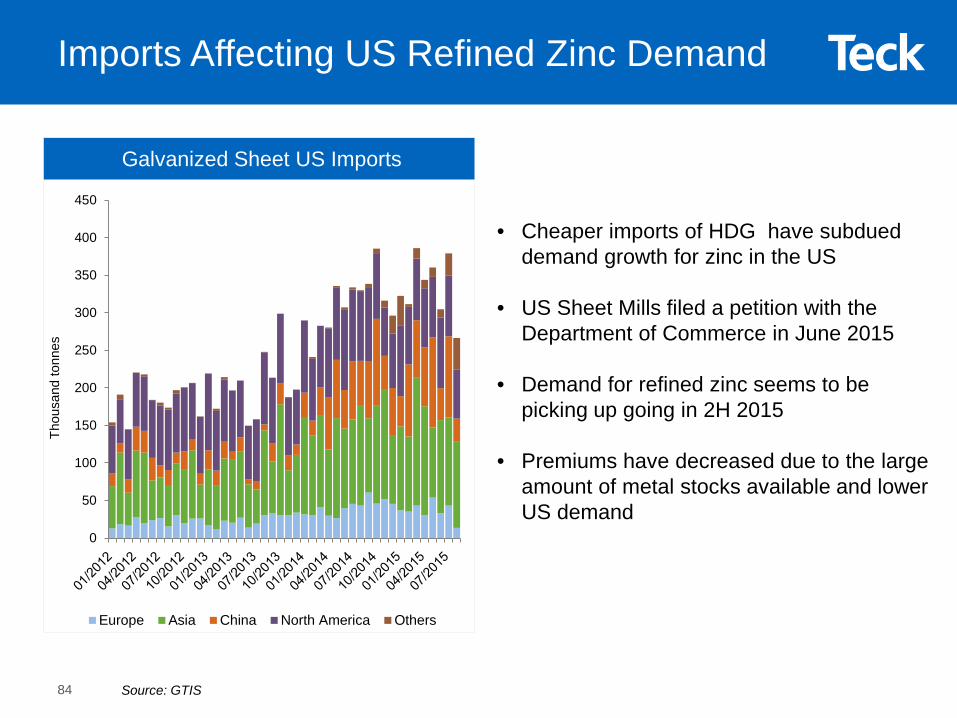
• Cheaper imports of HDG have subdued demand growth for zinc in the US
• US Sheet Mills filed a petition with the Department of Commerce in June 2015
• Demand for refined zinc seems to be picking up going in 2H 2015
• Premiums have decreased due to the large amount of metal stocks available and lower US demand
0
50
100
150
200
250
300
350
400
450
Thou
sand
tonn
es
Europe Asia China North America Others
Galvanized Sheet US Imports
Imports Affecting US Refined Zinc Demand
Source: GTIS84
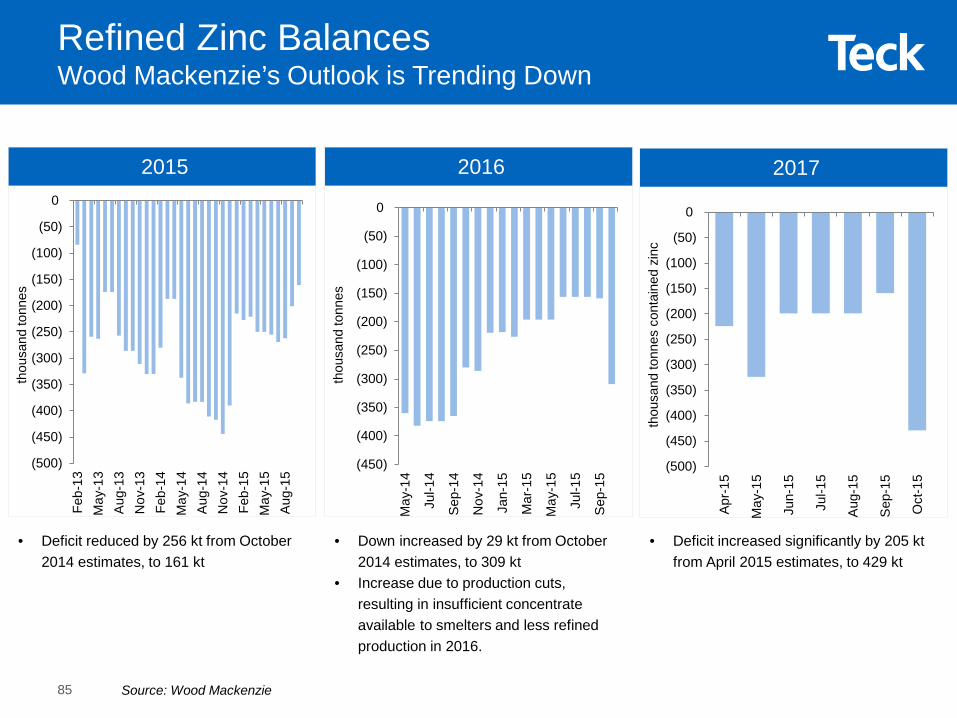
• Deficit reduced by 256 kt from October 2014 estimates, to 161 kt
• Down increased by 29 kt from October 2014 estimates, to 309 kt
• Increase due to production cuts, resulting in insufficient concentrate available to smelters and less refined production in 2016.
thou
sand
tonn
es
2015 2016 2017
• Deficit increased significantly by 205 ktfrom April 2015 estimates, to 429 kt
thou
sand
tonn
es
thou
sand
tonn
es c
onta
ined
zin
c
Refined Zinc BalancesWood Mackenzie’s Outlook is Trending Down
(500)
(450)
(400)
(350)
(300)
(250)
(200)
(150)
(100)
(50)
0
Feb-
13M
ay-1
3A
ug-1
3N
ov-1
3Fe
b-14
May
-14
Aug
-14
Nov
-14
Feb-
15M
ay-1
5A
ug-1
5
(450)
(400)
(350)
(300)
(250)
(200)
(150)
(100)
(50)
0
May
-14
Jul-1
4
Sep
-14
Nov
-14
Jan-
15
Mar
-15
May
-15
Jul-1
5
Sep
-15
(500)
(450)
(400)
(350)
(300)
(250)
(200)
(150)
(100)
(50)
0
Apr
-15
May
-15
Jun-
15
Jul-1
5
Aug
-15
Sep
-15
Oct
-15
Source: Wood Mackenzie85
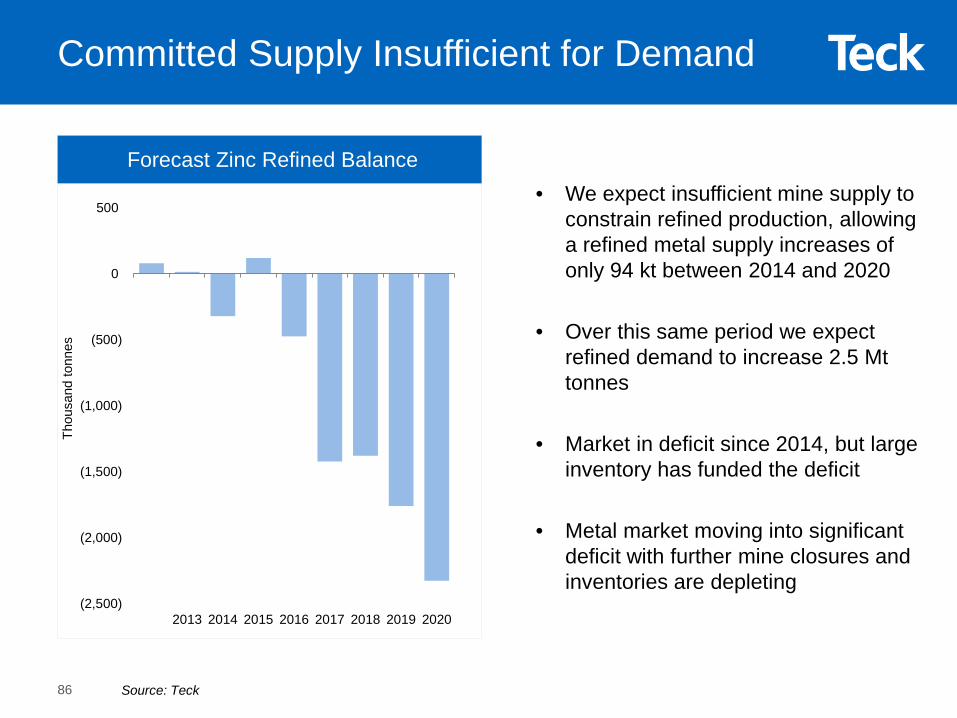
Committed Supply Insufficient for Demand
Forecast Zinc Refined Balance
Source: Teck
• We expect insufficient mine supply to constrain refined production, allowing a refined metal supply increases of only 94 kt between 2014 and 2020
• Over this same period we expect refined demand to increase 2.5 Mt tonnes
• Market in deficit since 2014, but large inventory has funded the deficit
• Metal market moving into significant deficit with further mine closures and inventories are depleting
(2,500)
(2,000)
(1,500)
(1,000)
(500)
0
500
2013 2014 2015 2016 2017 2018 2019 2020
Thou
sand
tonn
es
86
EnergyBusiness Unit & Markets
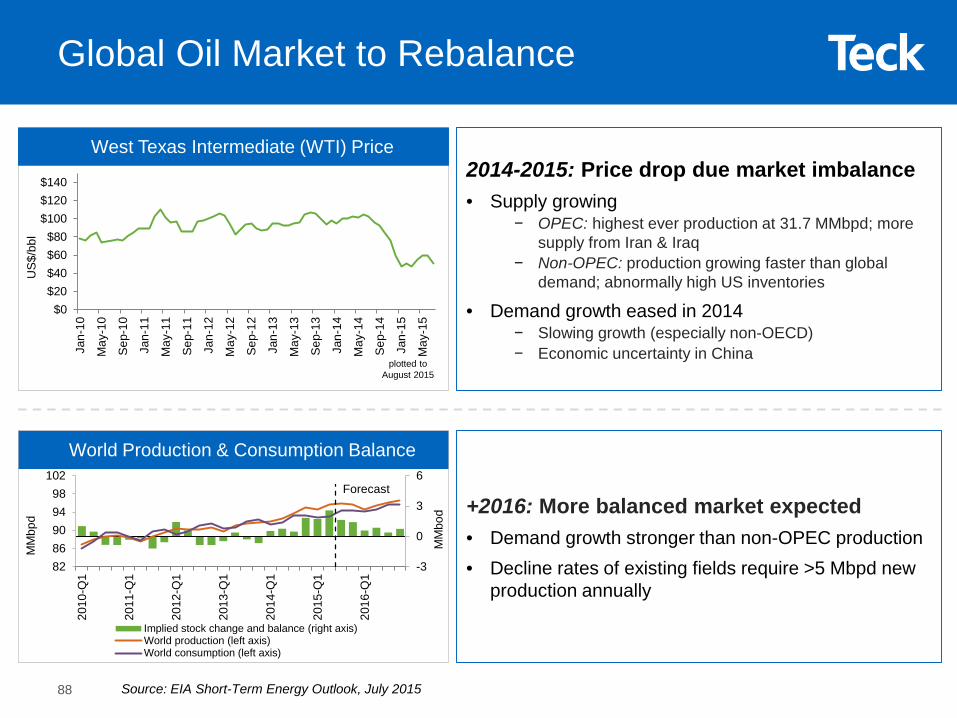
Global Oil Market to Rebalance
$0$20$40$60$80
$100$120$140
Jan-
10
May
-10
Sep
-10
Jan-
11
May
-11
Sep
-11
Jan-
12
May
-12
Sep
-12
Jan-
13
May
-13
Sep
-13
Jan-
14
May
-14
Sep
-14
Jan-
15
May
-15
US
$/bb
l
plotted to August 2015
Source: EIA Short-Term Energy Outlook, July 2015
Forecast
-3
0
3
6
8286909498
102
2010
-Q1
2011
-Q1
2012
-Q1
2013
-Q1
2014
-Q1
2015
-Q1
2016
-Q1
MM
bod
MM
bpd
Implied stock change and balance (right axis)World production (left axis)World consumption (left axis)
2014-2015: Price drop due market imbalance• Supply growing
− OPEC: highest ever production at 31.7 MMbpd; more supply from Iran & Iraq
− Non-OPEC: production growing faster than global demand; abnormally high US inventories
• Demand growth eased in 2014− Slowing growth (especially non-OECD)− Economic uncertainty in China
+2016: More balanced market expected• Demand growth stronger than non-OPEC production• Decline rates of existing fields require >5 Mbpd new
production annually
West Texas Intermediate (WTI) Price
World Production & Consumption Balance
88
Building An Energy Business
Strategic diversification
Large truck & shovel mining projects
World-class resources
Long-life assets
Mining-friendly jurisdiction
Competitive margins
Minimizing execution risk
Tax effective
89
Mined bitumen is in Teck’s ‘sweet spot’
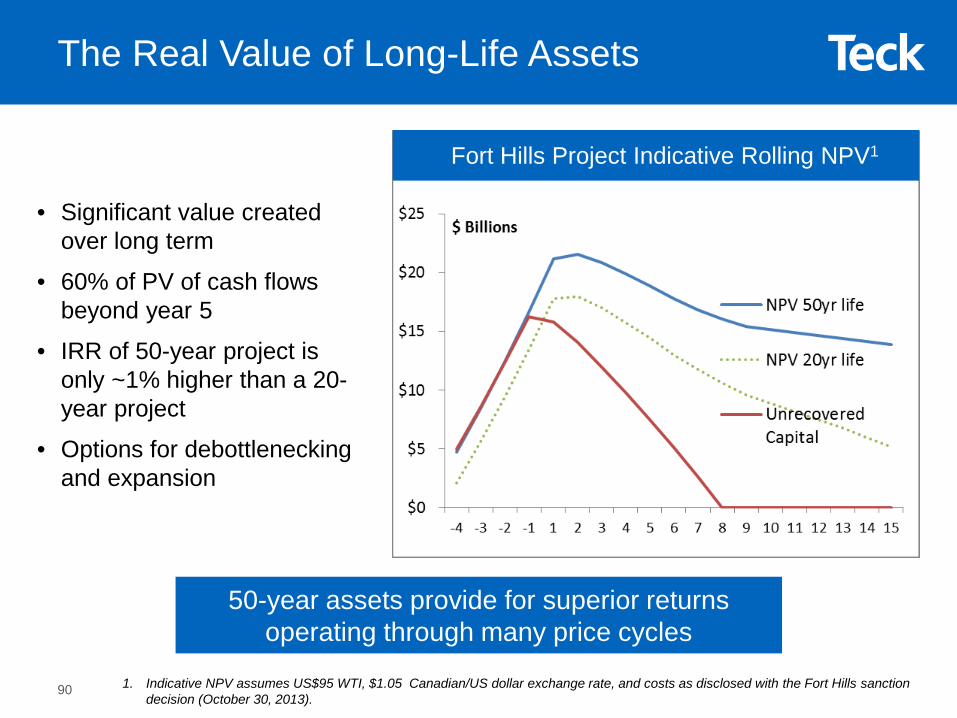
• Significant value created over long term
• 60% of PV of cash flows beyond year 5
• IRR of 50-year project is only ~1% higher than a 20-year project
• Options for debottlenecking and expansion
50-year assets provide for superior returns operating through many price cycles
The Real Value of Long-Life Assets
Fort Hills Project Indicative Rolling NPV1
1. Indicative NPV assumes US$95 WTI, $1.05 Canadian/US dollar exchange rate, and costs as disclosed with the Fort Hills sanction decision (October 30, 2013).
90
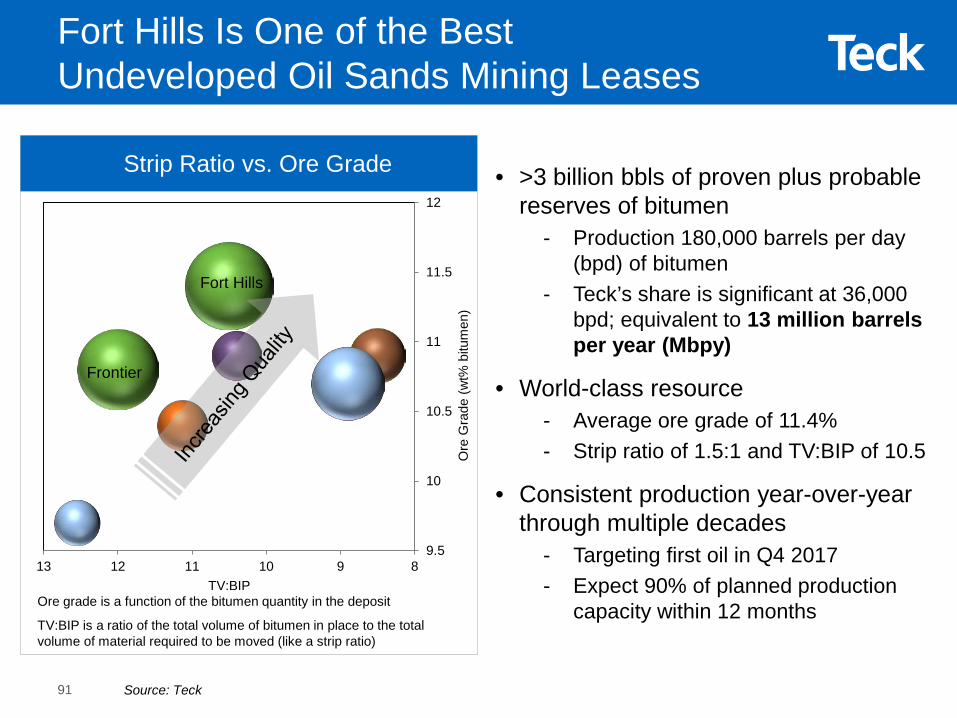
Fort Hills Is One of the Best Undeveloped Oil Sands Mining Leases
Ore grade is a function of the bitumen quantity in the deposit
TV:BIP is a ratio of the total volume of bitumen in place to the total volume of material required to be moved (like a strip ratio)
Strip Ratio vs. Ore Grade
Source: Teck
9.5
10
10.5
11
11.5
12
8910111213
Ore
Gra
de (w
t% b
itum
en)
TV:BIP
Fort Hills
Frontier
• >3 billion bbls of proven plus probable reserves of bitumen
- Production 180,000 barrels per day (bpd) of bitumen
- Teck’s share is significant at 36,000 bpd; equivalent to 13 million barrels per year (Mbpy)
• World-class resource- Average ore grade of 11.4%- Strip ratio of 1.5:1 and TV:BIP of 10.5
• Consistent production year-over-year through multiple decades
- Targeting first oil in Q4 2017- Expect 90% of planned production
capacity within 12 months
91
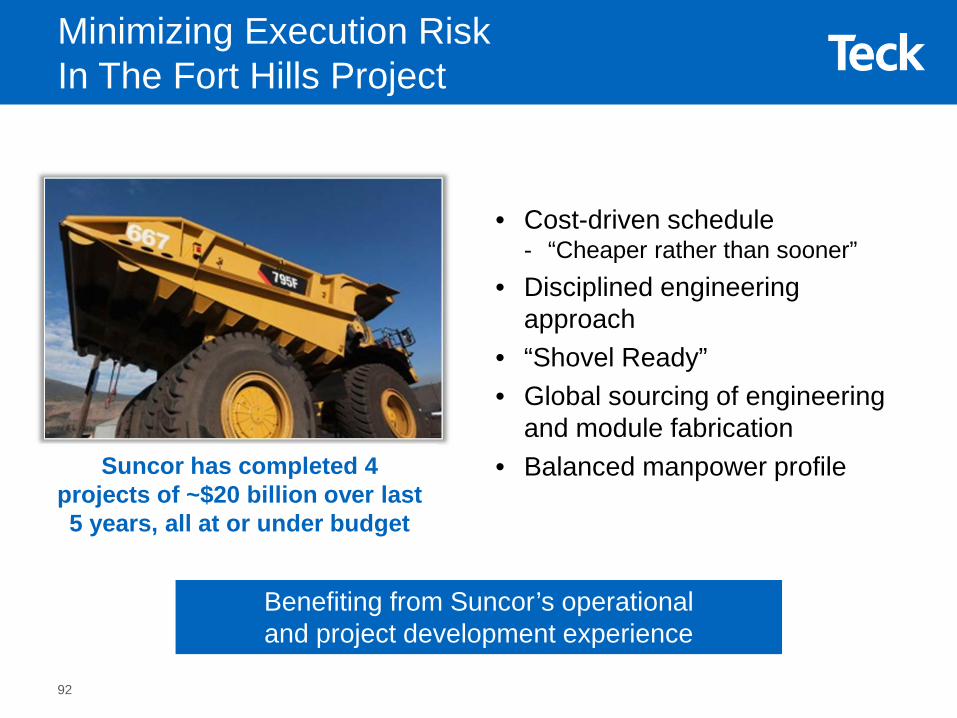
Minimizing Execution Risk In The Fort Hills Project
• Cost-driven schedule- “Cheaper rather than sooner”
• Disciplined engineering approach
• “Shovel Ready” • Global sourcing of engineering
and module fabrication• Balanced manpower profileSuncor has completed 4
projects of ~$20 billion over last 5 years, all at or under budget
Benefiting from Suncor’s operational and project development experience
92
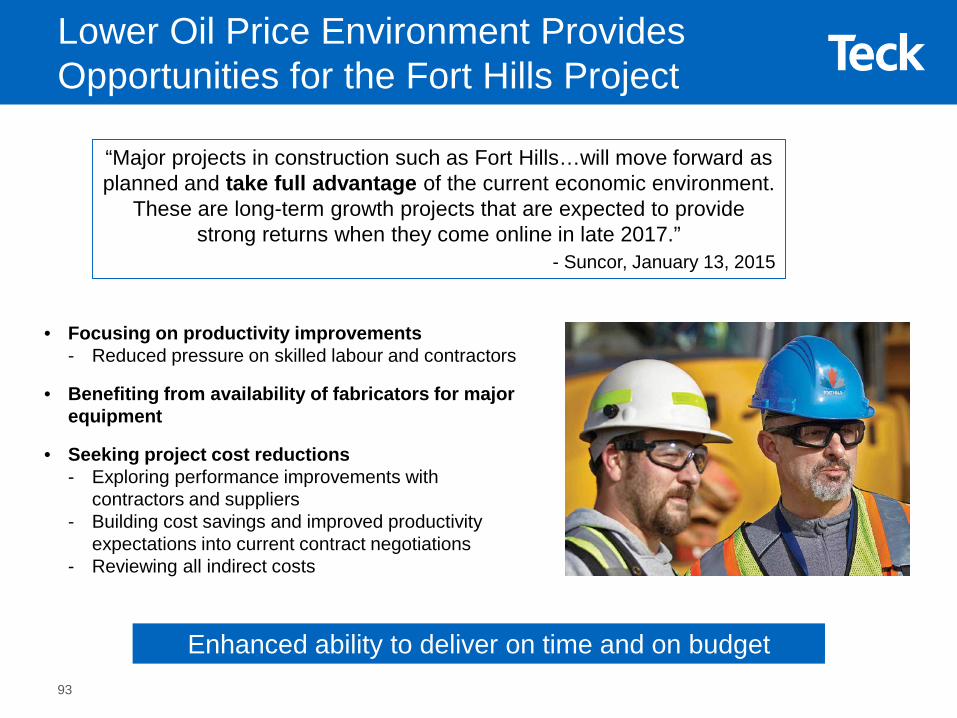
• Focusing on productivity improvements- Reduced pressure on skilled labour and contractors
• Benefiting from availability of fabricators for major equipment
• Seeking project cost reductions- Exploring performance improvements with
contractors and suppliers- Building cost savings and improved productivity
expectations into current contract negotiations- Reviewing all indirect costs
Lower Oil Price Environment Provides Opportunities for the Fort Hills Project
“Major projects in construction such as Fort Hills…will move forward as planned and take full advantage of the current economic environment.
These are long-term growth projects that are expected to provide strong returns when they come online in late 2017.”
- Suncor, January 13, 2015
Enhanced ability to deliver on time and on budget93
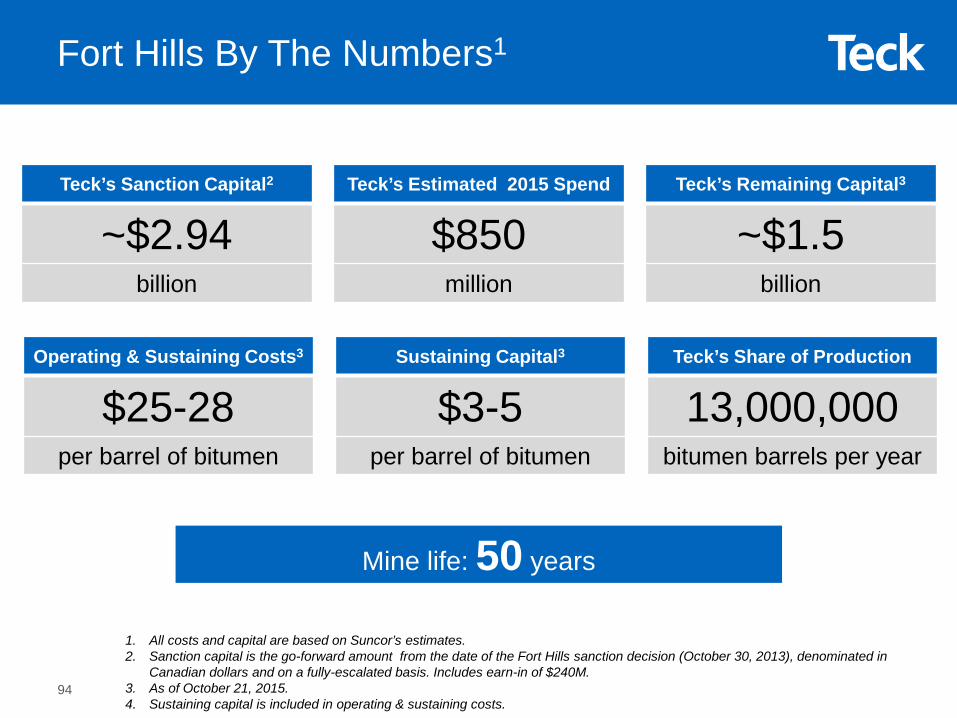
Teck’s Sanction Capital2
~$2.94billion
Teck’s Estimated 2015 Spend
$850million
Teck’s Remaining Capital3
~$1.5billion
Operating & Sustaining Costs3
$25-28per barrel of bitumen
Sustaining Capital3
$3-5per barrel of bitumen
Teck’s Share of Production
13,000,000bitumen barrels per year
1. All costs and capital are based on Suncor’s estimates.2. Sanction capital is the go-forward amount from the date of the Fort Hills sanction decision (October 30, 2013), denominated in
Canadian dollars and on a fully-escalated basis. Includes earn-in of $240M. 3. As of October 21, 2015.4. Sustaining capital is included in operating & sustaining costs.
Mine life: 50 years
Fort Hills By The Numbers1
94
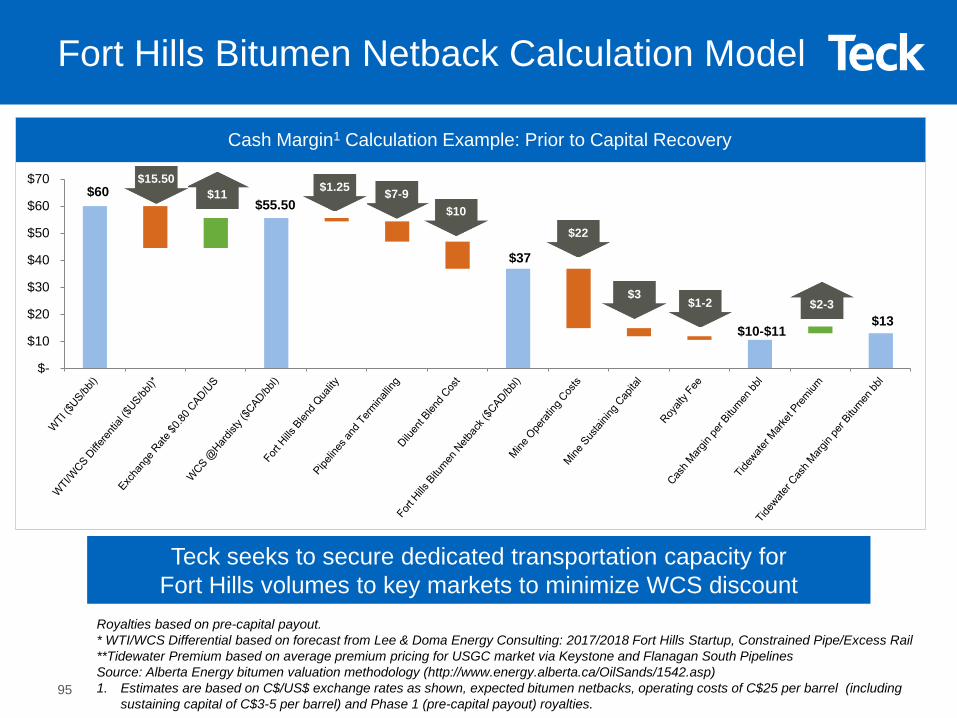
Royalties based on pre-capital payout. * WTI/WCS Differential based on forecast from Lee & Doma Energy Consulting: 2017/2018 Fort Hills Startup, Constrained Pipe/Excess Rail**Tidewater Premium based on average premium pricing for USGC market via Keystone and Flanagan South PipelinesSource: Alberta Energy bitumen valuation methodology (http://www.energy.alberta.ca/OilSands/1542.asp)1. Estimates are based on C$/US$ exchange rates as shown, expected bitumen netbacks, operating costs of C$25 per barrel (including
sustaining capital of C$3-5 per barrel) and Phase 1 (pre-capital payout) royalties.
Cash Margin1 Calculation Example: Prior to Capital Recovery
Teck seeks to secure dedicated transportation capacity for Fort Hills volumes to key markets to minimize WCS discount
Fort Hills Bitumen Netback Calculation Model
$60$55.50
$37
$10-$11 $13
$-
$10
$20
$30
$40
$50
$60
$70$11
$10
$15.50$7-9$1.25
$22
$3$1-2 $2-3
95
Source: Shorecam, Net Energy, Lee & Doma
Western Canadian Select (WCS)
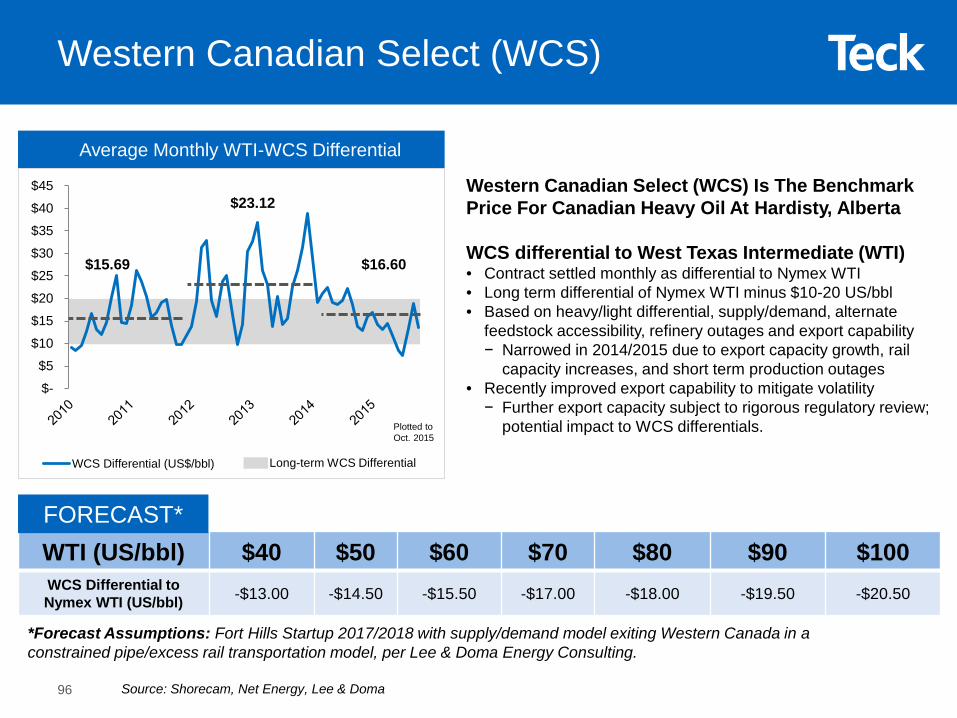
Average Monthly WTI-WCS Differential
Western Canadian Select (WCS) Is The Benchmark Price For Canadian Heavy Oil At Hardisty, Alberta
WCS differential to West Texas Intermediate (WTI) • Contract settled monthly as differential to Nymex WTI• Long term differential of Nymex WTI minus $10-20 US/bbl• Based on heavy/light differential, supply/demand, alternate
feedstock accessibility, refinery outages and export capability− Narrowed in 2014/2015 due to export capacity growth, rail
capacity increases, and short term production outages• Recently improved export capability to mitigate volatility− Further export capacity subject to rigorous regulatory review;
potential impact to WCS differentials.
$-
$5
$10
$15
$20
$25
$30
$35
$40
$45
WCS Differential (US$/bbl)
Plotted to Oct. 2015
Long-term WCS Differential
$16.60
$23.12
$15.69
WTI (US/bbl) $40 $50 $60 $70 $80 $90 $100WCS Differential to Nymex WTI (US/bbl) -$13.00 -$14.50 -$15.50 -$17.00 -$18.00 -$19.50 -$20.50
*Forecast Assumptions: Fort Hills Startup 2017/2018 with supply/demand model exiting Western Canada in a constrained pipe/excess rail transportation model, per Lee & Doma Energy Consulting.
FORECAST*
96
Source: Shorecam, Net Energy, Lee & Doma
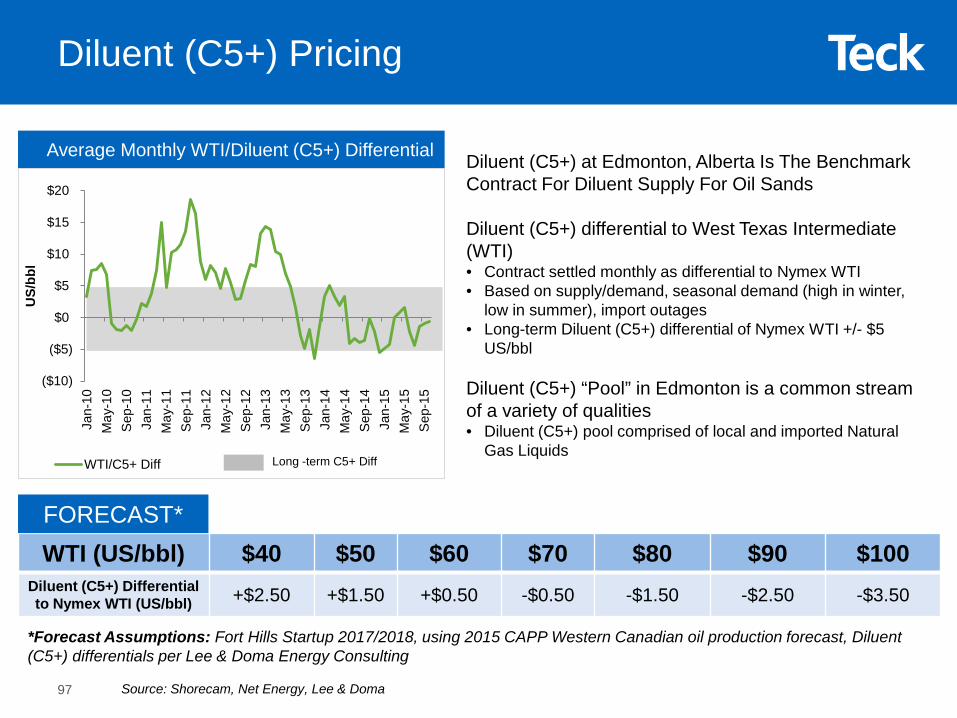
Diluent (C5+) Pricing
Average Monthly WTI/Diluent (C5+) Differential Diluent (C5+) at Edmonton, Alberta Is The Benchmark Contract For Diluent Supply For Oil Sands
Diluent (C5+) differential to West Texas Intermediate (WTI)• Contract settled monthly as differential to Nymex WTI• Based on supply/demand, seasonal demand (high in winter,
low in summer), import outages• Long-term Diluent (C5+) differential of Nymex WTI +/- $5
US/bbl
Diluent (C5+) “Pool” in Edmonton is a common stream of a variety of qualities• Diluent (C5+) pool comprised of local and imported Natural
Gas Liquids
WTI (US/bbl) $40 $50 $60 $70 $80 $90 $100Diluent (C5+) Differentialto Nymex WTI (US/bbl) +$2.50 +$1.50 +$0.50 -$0.50 -$1.50 -$2.50 -$3.50
*Forecast Assumptions: Fort Hills Startup 2017/2018, using 2015 CAPP Western Canadian oil production forecast, Diluent (C5+) differentials per Lee & Doma Energy Consulting
($10)
($5)
$0
$5
$10
$15
$20
Jan-
10M
ay-1
0S
ep-1
0Ja
n-11
May
-11
Sep
-11
Jan-
12M
ay-1
2S
ep-1
2Ja
n-13
May
-13
Sep
-13
Jan-
14M
ay-1
4S
ep-1
4Ja
n-15
May
-15
Sep
-15
US/
bbl
WTI/C5+ Diff Long -term C5+ Diff
FORECAST*
97
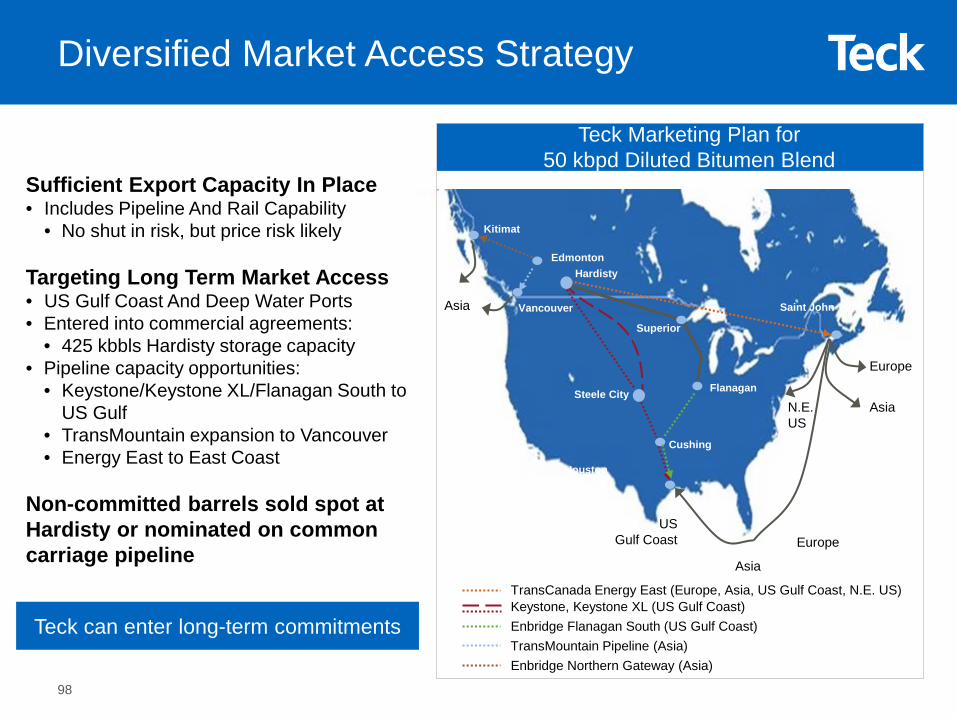
Diversified Market Access Strategy
Teck Marketing Plan for 50 kbpd Diluted Bitumen Blend
Cushing
Flanagan
Houston
Kitimat
HardistyEdmonton
Saint John
N.E. US
US Gulf Coast
Europe
Asia
TransCanada Energy East (Europe, Asia, US Gulf Coast, N.E. US)
Teck can enter long-term commitments
Enbridge Northern Gateway (Asia)
Keystone, Keystone XL (US Gulf Coast)Enbridge Flanagan South (US Gulf Coast)
Vancouver
TransMountain Pipeline (Asia)
Steele City
Asia
Europe
Asia
Superior
Sufficient Export Capacity In Place• Includes Pipeline And Rail Capability
• No shut in risk, but price risk likely
Targeting Long Term Market Access • US Gulf Coast And Deep Water Ports • Entered into commercial agreements:
• 425 kbbls Hardisty storage capacity• Pipeline capacity opportunities:
• Keystone/Keystone XL/Flanagan South to US Gulf
• TransMountain expansion to Vancouver• Energy East to East Coast
Non-committed barrels sold spot at Hardisty or nominated on common carriage pipeline
98
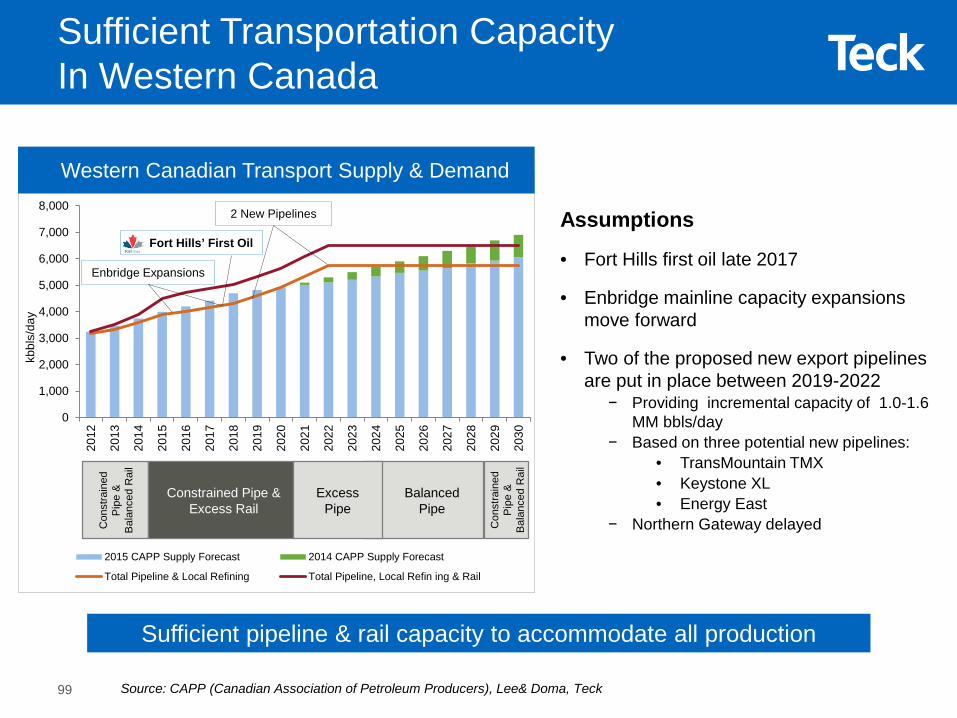
Sufficient Transportation Capacity In Western Canada
0
1,000
2,000
3,000
4,000
5,000
6,000
7,000
8,000
2012
2013
2014
2015
2016
2017
2018
2019
2020
2021
2022
2023
2024
2025
2026
2027
2028
2029
2030
kbbl
s/da
y
2015 CAPP Supply Forecast 2014 CAPP Supply Forecast
Total Pipeline & Local Refining Total Pipeline, Local Refin ing & Rail
Con
stra
ined
P
ipe
&
Bal
ance
d R
ail
Constrained Pipe & Excess Rail
Excess Pipe
Balanced Pipe
2 New Pipelines
Enbridge Expansions
Western Canadian Transport Supply & Demand
Assumptions
• Fort Hills first oil late 2017
• Enbridge mainline capacity expansions move forward
• Two of the proposed new export pipelines are put in place between 2019-2022
− Providing incremental capacity of 1.0-1.6 MM bbls/day
− Based on three potential new pipelines:• TransMountain TMX• Keystone XL• Energy East
− Northern Gateway delayed
Source: CAPP (Canadian Association of Petroleum Producers), Lee& Doma, Teck
Sufficient pipeline & rail capacity to accommodate all production
Fort Hills’ First Oil
Con
stra
ined
P
ipe
&
Bal
ance
d R
ail
99
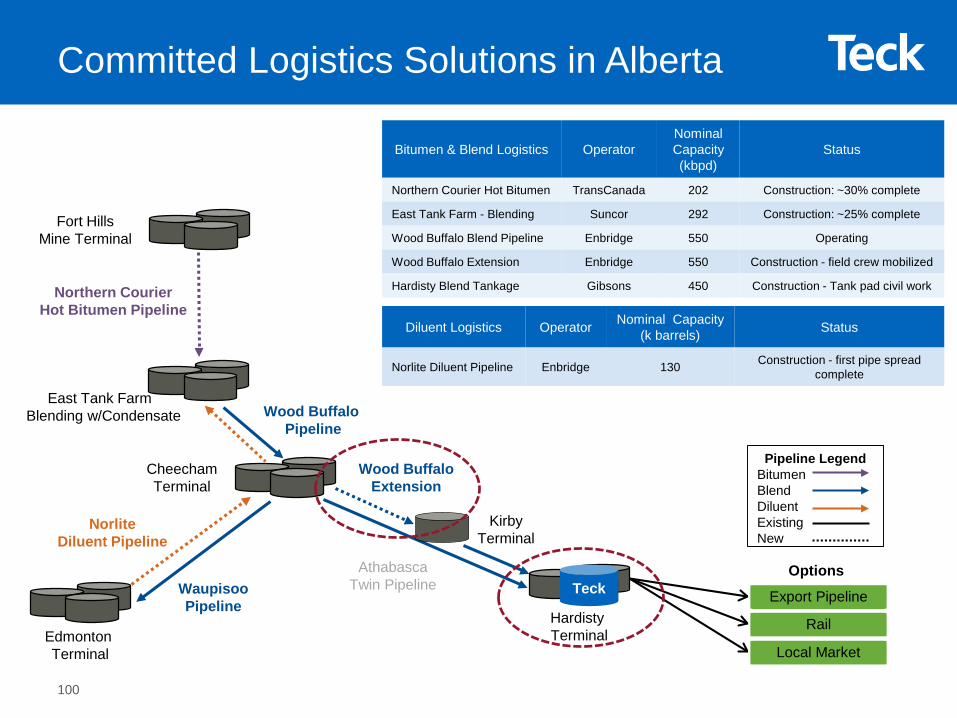
East Tank Farm Blending w/Condensate
Bitumen & Blend Logistics OperatorNominalCapacity(kbpd)
Status
Northern Courier Hot Bitumen TransCanada 202 Construction: ~30% complete
East Tank Farm - Blending Suncor 292 Construction: ~25% complete
Wood Buffalo Blend Pipeline Enbridge 550 Operating
Wood Buffalo Extension Enbridge 550 Construction - field crew mobilized
Hardisty Blend Tankage Gibsons 450 Construction - Tank pad civil work
Wood BuffaloExtension
NorliteDiluent Pipeline
Cheecham Terminal
Hardisty Terminal
Wood Buffalo Pipeline
AthabascaTwin PipelineWaupisoo
Pipeline
Edmonton Terminal
Fort HillsMine Terminal
Northern CourierHot Bitumen Pipeline
TeckOptions
Export Pipeline
Rail
Local Market
Pipeline LegendBitumenBlendDiluentExistingNew
Kirby Terminal
Diluent Logistics Operator Nominal Capacity (k barrels) Status
Norlite Diluent Pipeline Enbridge 130 Construction - first pipe spread complete
Committed Logistics Solutions in Alberta
100