Embed Size (px)
Citation preview

May 2016
Global Metals, Mining & Steel Conference 2016
Aditya Mittal, CFO and CEO Europe

Disclaimer
Forward-Looking Statements
This document may contain forward-looking information and statements about ArcelorMittal and its subsidiaries. These
statements include financial projections and estimates and their underlying assumptions, statements regarding plans,
objectives and expectations with respect to future operations, products and services, and statements regarding future
performance. Forward-looking statements may be identified by the words “believe,” “expect,” “anticipate,” “target” or similar
expressions. Although ArcelorMittal’s management believes that the expectations reflected in such forward-looking
statements are reasonable, investors and holders of ArcelorMittal’s securities are cautioned that forward-looking information
and statements are subject to numerous risks and uncertainties, many of which are difficult to predict and generally beyond
the control of ArcelorMittal, that could cause actual results and developments to differ materially and adversely from those
expressed in, or implied or projected by, the forward-looking information and statements. These risks and uncertainties
include those discussed or identified in the documents filed with or furnished to the Luxembourg Stock Market Authority for
the Financial Markets (Commission de Surveillance du Secteur Financier) and the U.S. Securities and Exchange
Commission (the “SEC”). ArcelorMittal undertakes no obligation to publicly update its forward-looking statements, whether
as a result of new information, future events, or otherwise.
Non-GAAP Measures
This document may include supplemental financial measures that are or may be non-GAAP financial measures, as defined
in the rules of the SEC. They may exclude or include amounts that are included or excluded, as applicable, in the
calculation of the most directly comparable financial measures calculated in accordance with IFRS. Accordingly, they should
be considered in conjunction with ArcelorMittal's consolidated financial statements prepared in accordance with IFRS, which
are available in the documents filed or furnished by ArcelorMittal with the SEC, including its annual report on Form 20-F and
its interim financial report furnished on Form 6-K. A reconciliation of non-GAAP measures to IFRS is available on the
ArcelorMittal website.
1

Safety progress
2
Continued progress along our journey towards zero harm
0.720.810.850.85
2014 20152013 1Q’162010
1.8
2009
1.9
2008 20122011
1.0
1.4
2.5
2007
3.1
-77%
Health & Safety Lost time injury frequency (LTIF) rate*
Mining & steel, employees and contractors
* LTIF = Lost time injury frequency defined as Lost Time Injuries per 1.000.000 worked hours; based on own personnel and contractors

Message from Barcelona
Unique global platform with
Europe/US at its core
Product leadership through
commitment to innovation &
unrivalled R&D
Preferred supplier to automotive
Europe footprint optimising
delivering relative performance
improvement
Reduced cash requirements to
support improved EBITDA
conversion to free cash flow
3
Key theme of Barcelona conference presentation was LEADERSHIP… for Miami it is ACTION
Takeaways
• ArcelorMittal is the leader in the differentiated steel
industry
• ArcelorMittal is the leader in steel for automotive and
will continue to invest to capture the opportunities
• The learning's of footprint optimisation in Europe will be
applied to the US asset base
• The demand recovery in Europe is driving improved
steel spreads and profitability
• Clear progress has been achieved on mining costs,
cash conversion and repositioning the balance sheet
• Positive outlook for core developed markets
13

Challenging past 12 months
4
Actions taken to reduce cash requirements enabled net debt reduction in 2015
-4.3%
China steel
demand*
-10%
US steel
demand*
-€70/t
Europe
HRC**
-43%
Iron Ore
price***
Capex cut by $2.3bn since 2012
US$mn
Net interest reduced by $0.8bn since 2012
US$mn
4.7
3.5 3.72.7 2.4
2012 2013 2014 2015 2016F
1.9 1.81.5
1.3 1.1
2012 2013 2014 2015 2016F
Ended 2015 with net debt of $15.7bn
Lowest level since ArcelorMittal merger
* ArcelorMittal estimates of apparent steel consumption 2015 vs 2014 ** Source SteelFirst. Dec 31, 2014 price of €405/t as compared to Dec 31, 2015 price of €335/t; *** Iron ore price Fe (62% Fe Platts) average 2015 vs. average 2014

Price environment has improved
5
Prices have recovered from unsustainable levels of 2H’15
China steel spreads ($/t differential between China HRC domestic price ex VAT and
international RM Basket, $/t)
210
1249387
125146159
132
Current*1Q164Q153Q152Q151Q1520142013
Europe steel spreads(€/t differential between North Europe domestic HRC
price and international RM Basket)
207186186
212217220208178
2013 Current**1Q164Q153Q’152Q151Q152014
* China current data: week of May 5, 2016; ** Europe current data: week of April 15, 2016
Northern and Southern Europe price differential
vs HRC China export FOB Shanghai priceNorthern and Southern Europe Ex. Works $/t
(20)
0
20
40
60
80
100
120
140
160
Oct-
15
Apr
16
July
15
Jan-1
6
Jan 1
5
Oct
14
Apr
15
July
14
Apri
l 14
Jan 1
4
Oct
13
July
13
Apri
l 13
Jan 1
3
Oct
12
Jul 12
Apr-
12
Jan 1
2
S.Europe
N.Europe

China addressing its excess capacity
6
China steel capacity rationalisation will take time… trade action to protect during this transition
11th 5-year plan
• Eliminate capacity
below following
standard:
- BF < 300m3
- BOF < 20t
- EAF < 20t
• By 2005, overall
energy consumption
< 0.76 tons of coal
equivalent; water
consumption < 12t
per ton
• By 2010, overall
energy consumption
< 0.73 TCE; water
consumption < 8t
• By 2012, overall
energy consumption
< 0.7 TCE; water
consumption < 6t
• Eliminate capacity
below following
standard by 2011:
- BF < 400m3
- BOF < 30t
- EAF < 30t
• By 2011, overall
energy consumption
< 0.62 TCE; water
consumption < 5t
per ton; dust
emission per ton < 1
kilogram; CO2
emission per ton <
1.8 kilogram
• Eliminate capacity
below following
standard :
- BF < 400m3
- BOF < 30t
- EAF < 30t
• By 2015, overall
energy
consumption < 0.58
TCE; water
consumption < 4
m3; SO2 emission
per ton < 1 kilogram
• Reduce 80mt
capacity
• Increase financial
incentives in
capacity reduction
or volume swap
proposals
• Implement
penalties through
high electricity &
water prices for
those companies
that fail to meet
environmental
standard
2009 12th 5-year plan 2013 September
• Reduce 100-150mt
capacity over 5 years
• No projects of new
capacity
• There will be a
“mandatory” part and
a “voluntary” part
• The “mandatory” part
uses same criteria as
earlier policy but adds
criteria for product
quality and for
safety
• The “voluntary” part
will rely upon financial
incentives to cut
capacity. Special
funds* will be used
for redeployment
incentives and debt
restructuring
2016 February
Previous capacity closures more than offset by rapid capacity additions
77* Cash inflow of ~$4.0bn following the completed capital raise (cash received in 2Q’16) and agreed sale of Gestamp (cash expected within six months from sale date) including premium paid on early repayment of debt subsequent to rights issue of $0.1 billion
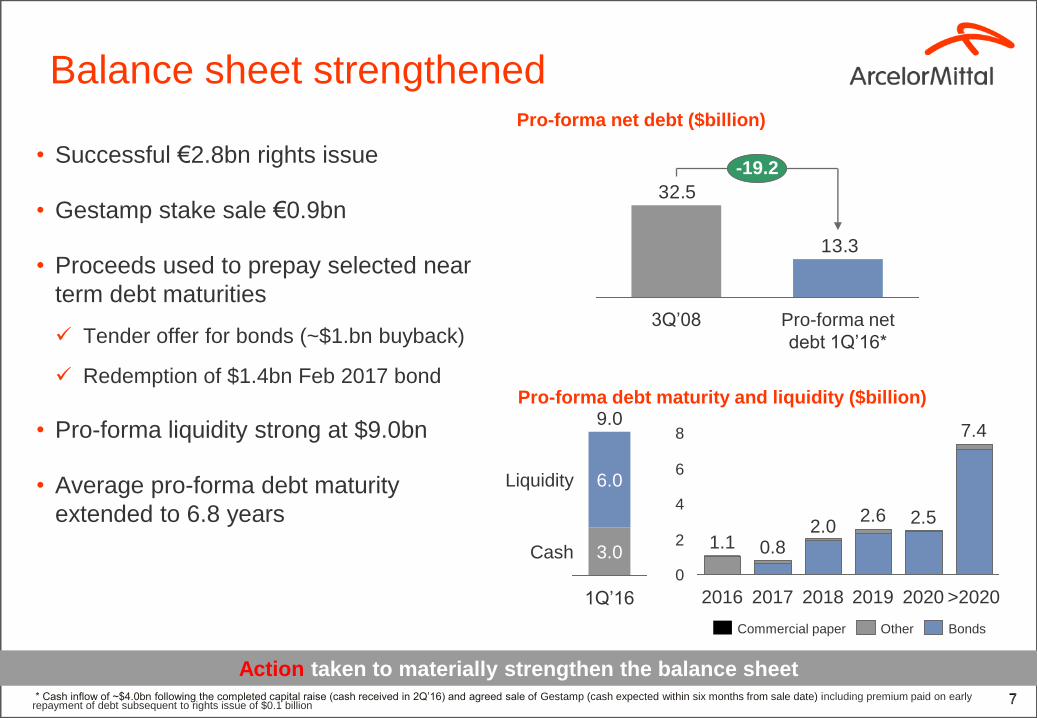
• Successful €2.8bn rights issue
• Gestamp stake sale €0.9bn
• Proceeds used to prepay selected near
term debt maturities
Tender offer for bonds (~$1.bn buyback)
Redemption of $1.4bn Feb 2017 bond
• Pro-forma liquidity strong at $9.0bn
• Average pro-forma debt maturity
extended to 6.8 years
0
2
4
6
8
2.5
>2020
7.4
20202019
2.6
20182017
2.01.1 0.8
2016
Other BondsCommercial paper
Pro-forma net debt ($billion)
Pro-forma debt maturity and liquidity ($billion)
6.0
Cash
Liquidity
9.0
3.0
1Q’16
13.3
32.5
-19.2
3Q’08 Pro-forma net
debt 1Q’16*
Action taken to materially strengthen the balance sheet
Balance sheet strengthened

Action 2020 improvement plan
Return to >$85 EBITDA per tonne
$3bn structural EBITDA improvement
Support annual FCF >$2bn
8
Action taken to sustainably improve EBITDA and FCF generation
Experience
Unique
Business driven

Takeaways
• ArcelorMittal is the global steel industry leader
• Actions taken in recent periods to reduce cash requirements enabled
net debt reduction in 2015 despite exceptional market conditions
• Global destock has ended and steel spreads are recovering from
unsustainable levels
• Lower cash requirements will support improved conversion of
EBITDA to free cash
• Balance sheet now amongst the strongest in the industry, reinforcing
ArcelorMittal’s leadership position
• Commitment to Action 2020 and sustainable improvements to drive
outperformance
Taking the right actions to leverage leadership positions to maximise shareholder returns
9

Appendix

11
Trade casesUS Flat Rolled
Prod Exporter Status Timeline
Core AD/CVD China
India
Italy
Korea
Taiwan
• Petition filed on Jun 3, 2015
• ITC voted affirmative on Jul 16, 2015
• DOC preliminary CVD determinations Q4
2015: China : 26-235%, India: 2.8-7.7%; Italy:
0.04-38%; Korea: 0.69-1.37%; Taiwan – de
minimus (no duty imposed)
• DOC preliminary AD determinations: China
255%; India 6.6-6.9%; Italy 0-3.1%; Korea 2.9-
3.5%; Taiwan: 0%
• DOC final determination
(AD/CVD) expected
mid-May 2016
• ITC final hearing on
May 26, 2016
• ITC final vote expected
late Jun 2016
CRC AD/CVD Brazil
China
India
Korea
Russia
AD only
Japan Netherland
UK
• Petition filed on July 28, 2015;
• ITC voted affirmative Sep 10, 2015
(Netherlands imports negligible)
• DOC preliminary CVD determinations: Brazil:
7.4%, China: 227%, India: 4.4%, Russia: 0-6.3%,
Korea: de minimis (no duty imposed)
• DOC preliminary AD determination: China:
265.79%, India: 6.78%, Japan: 71.35%, Korea:
from 2.17 to 6.85%, Russia: from 12.62% to
16.89%. UK from 5.79% to 31.39%
• DOC final determination
on China and Japan
expected mid-May; all
other countries
expected mid-July 2016
• ITC hearing on May 24,
2016
• ITC vote on
China/Japan expected
late June; all others
expected late Aug 2016
HRC AD/CVD
Korea
Turkey
Brazil
AD only
Japan,
Netherland,
Australia , UK
• Petition filed Aug 11, 2015
• ITC voted affirmative on Sep 24, 2015
• DOC preliminary CVD determinations: Korea:
de minimis, Turkey: de minimis, Brazil: 7.42%
• DOC preliminary AD determination: Australia:
23%; Brazil: 34%; Japan: 7-11%, Netherlands:
5%; South Korea: 4-7%; Turkey: 5-7%; UK: 49%
• DOC final determination
(AD/CVD) expected
early Aug 2016
• ITC final hearing on Aug
4, 2016
• ITC final vote expected
early Sept 2016
QP AD/ CVD
Brazil, China,
Korea
AD
Austria,Belgium,
France, Germany,
Italy, Japan, South
Africa, Turkey, and
Taiwan
• Petition filed April 8, 2016
• Initiation of DOC investigation expected Apr
28, 2016
• ITC preliminary determination expected in late
May 2016 and DOC AD preliminary
determination expected mid-Sept. or early Nov.
depending on extensions
• ITC Staff conference
Apr 29, 2016
• ITC preliminary
determination late May
2016
• DOC AD preliminary
determinations mid-
Sept or early Nov
depending on
extensions
Europe Flat, Long and Tubes
Prod Exporter Status Timeline
CRC AD
China
Russia
• Investigation
initiated May
2015
• Provisional
measures
implemented
12th Feb 2016;
Russia up to
28% and China
up to 16 %
• Definitive measures could
be expected not later
than Aug 2016
HRC AD
China
• AD
Investigation
started 13th of
February 2016
• AD Provisional measures
could be expected not
later than Nov 2016
• AD Definitive measures
could be expected not
later than May 2017
QP AD
China
• Investigation
initiated 13th of
Feb 2016
• Provisional measures
could be expected not
later than Nov 2016
• Definitive measures could
be expected not later than
May 2017
Rebar (HF)
AD
China
• Provisional
measures
implemented
1st February
duties from
9.2% to 13%
• Definitive measures could
be expected not later than
August 2016
Seamless
Tubes
(Large
diameter)
AD
China
• Investigation
confirmed on
13 February
• Provisional measures
could be expected not
later than Nov 2016
• Definitive measures could
be expected not later than
May 2017

Strategic progress in 2016
12
Strategic priorities on track and progressing well* Cash inflow of ~$4.0 billion following the completed capital raise (cash received in 2Q’16) and agreed sale of Gestamp (cash expected within six months from sale) including premium paid on early
repayment of debt subsequent to rights issue of $0.1 billion
• Balance sheet materially strengthened
Rights issue complete: $3.2 billion raised
Pro-forma net debt at end of 1Q’16 of
$13.3bn*
• Improved conversion of EBITDA to FCF
EBITDA “free cash flow breakeven” point
reduced to $4.5bn
• Focus on capex discipline
• Cost control and operational excellence
Action 2020 plan underway
• Portfolio optimization ongoing
Sale of US long products division Vinton
and LaPlace
Closure / idling of non-performing assets
Automotive business development
• Calvert ramp up progressing :
Automotive certification ongoing and
increased utilization
Phase 1: Slab yard expansion complete
• Automotive awards:
General Motors awarded ArcelorMittal its
“Supplier of the Year award” for the 3rd
consecutive year
Ford gave ArcelorMittal its highest
ranking for the 5th consecutive year
• ArcelorMittal and Voestalpine announce
global market launch of galvanized, press
hardened steels for direct hot forming
Global presence, industry leading product
portfolio and continuous investment
• World’s leading steel and mining company
• Developed markets are core
• Low cost assets…. well positioned on global cost curve
• Optimized asset base in Europe…
… next comes the US footprint optimization
• Primary position in premium grades & global automotive…
… supported by industry leading R&D capability with 12 major research
centres globally
• Capacity to capitalize on demand recovery
• Roadmap to achieve annual FCF of $2bn by 2020 (at current spreads)
13
World’s leading global steel company positioned to deliver value to shareholders

1Q 2016 financial results

15
• EBITDA: 1Q’16 EBITDA of $0.9bn
• Steel performance: primarily impacted by low steel selling prices (-8.7% QoQ) offset by improved
steel shipments (+8.8% QoQ )
• Mining performance: EBITDA stable as improved costs offset seasonally lower volumes
• Net loss: driven by lower operating result and deferred tax
• Net Debt: Pro-forma net debt of $13.3 billion* as of March 31, 2016 giving effect of proceeds from
successful capital raise and Gestamp asset sale
1Q’16 performance impacted by lagged effect
of weak steel pricing
(USDm) unless otherwise shown 1Q'16 4Q'15 3Q’15 2Q'15 1Q’15
Steel shipments (Mt) 21.5 19.7 21.1 22.2 21.6
Iron ore shipments market price (Mt) 7.8 9.9 10.3 10.8 9.4
Sales 13,399 13,981 15,589 16,890 17,118
EBITDA 927 1,103 1,351 1,399 1,378
Net (loss) / income (416) (6,686)** (711) 179 (728)
Adjusted net (loss) / income (176) (375) (63) 153 (36)
Note: QoQ refers to 1Q’16 v 4Q’15 * Includes premium paid on early repayment of debt subsequent to rights issue of $0.1 billion ** 4Q’15 net loss of $6.7 billion includes $4.7 billion of impairments and $0.9 billion of exceptional charges related to the write-down of inventory following the rapid decline of international steel prices.
1Q’16 EBITDA impacted by low steel selling prices

16
Mining performance stable in 1Q’16
• EBITDA: 1Q’16 EBITDA stable vs 4Q’15
• Prices: Iron ore reference prices +3.5% QoQ
• Lower volumes:
− Seasonally lower production/shipments in Canada
− Operational scope change at Liberia (capacity
reduced from 5mtpa to 3mtpa to increase
competitiveness)
− Volcan mine closure (c. annual 2Mt impact)
− For FY 2016, marketable shipments are expected to
decline by ~10% vs. 2015
• Ongoing cost reduction: FY’16 iron ore cash costs
expected to be reduced by >10%
• Cash flow: FCF breakeven point of $40/t*
Market price iron ore shipments (Mt)
Mining profitability stable as improved prices and costs offset seasonally lower volumes
63 58 55 47 48
2Q’15 3Q’15
+3.5%
1Q’164Q’151Q’15
Iron ore 62% Fe Platts (CFR) ($/t)
* CFR China 62% Fe
9.4 10.8 10.3 9.97.8
2Q’15 3Q’15 1Q’164Q’151Q’15

17
Steel performance: EBITDA declined due to
lagged impacts of weak steel pricing
1Q’16 EBITDA primarily impacted by low steel selling prices
1Q’16 Steel shipments (Mt) vs. 4Q’15
NAFTA, 5.5
+19.2%
Brazil, 2.5(-14%)
Europe, 10.4
+10.3%
ACIS, 3.3+7.7%
21.5Mt
+8.8%
1Q’16 Steel-only* EBITDA ($M) vs. 4Q’15
• Steel-only EBITDA down 18.1% QoQ to $0.8bn lower ASP (-8.7%) offset by improved volumes (+8.8%)
− NAFTA: Improved market demand following end of destock and cost performance offset by lower ASP (-10.1%)
− Brazil: Impacted by ongoing weak demand and Tubular business (impacted by currency devaluation) steel
shipments and ASP declined (-14%) and (-16.1%) respectively
− Europe: Performance impacted by lagged effect of weak steel prices (-6.7%), partially offset by improving steel
volumes
− ACIS: Improved volumes and costs performance offset weak pricing (-10.2%)
NAFTA, 339
+24.2%
Brazil, 145(-19.8%)
Europe, 363
(-33.3%)
ACIS, 61+0.5%
$0.8bn
(-18.1%)
* Steel-only EBITDA defined as Group EBITDA less Mining segment EBITDA
• The Company expects FY 2016 EBITDA to be in excess of $4.5 billion. The impact
of the improving steel spread environment is expected to be fully reflected in the results
of the second half of the year.
• The Company's cash requirements in 2016 are expected to total $4.5 billion, a
greater than $1 billion reduction as compared to 2015. The components of this
reduction are: lower capex spend (FY 2016 capex is expected to be approximately
$2.4 billion as compared to $2.7 billion in FY 2015), lower interest expenses (FY 2016
net interest is expected to be approximately $1.1 billion as compared to $1.3 billion in
FY 2015); no dividend in respect of the 2015 financial year; and lower cash taxes.
• The improving market conditions are likely to consume working capital in 2016 (current
estimate ~$0.5 billion); the Company, nevertheless, continues to expect to be free
cash flow positive in 2016.
18
Outlook and guidance
Company expects to be FCF positive in 2016

MACRO (highlights)
20Source: *ArcelorMittal PMIs (weighted by ArcelorMittal steel deliveries) ** ArcelorMittal estimates *** Excludes tubular demand
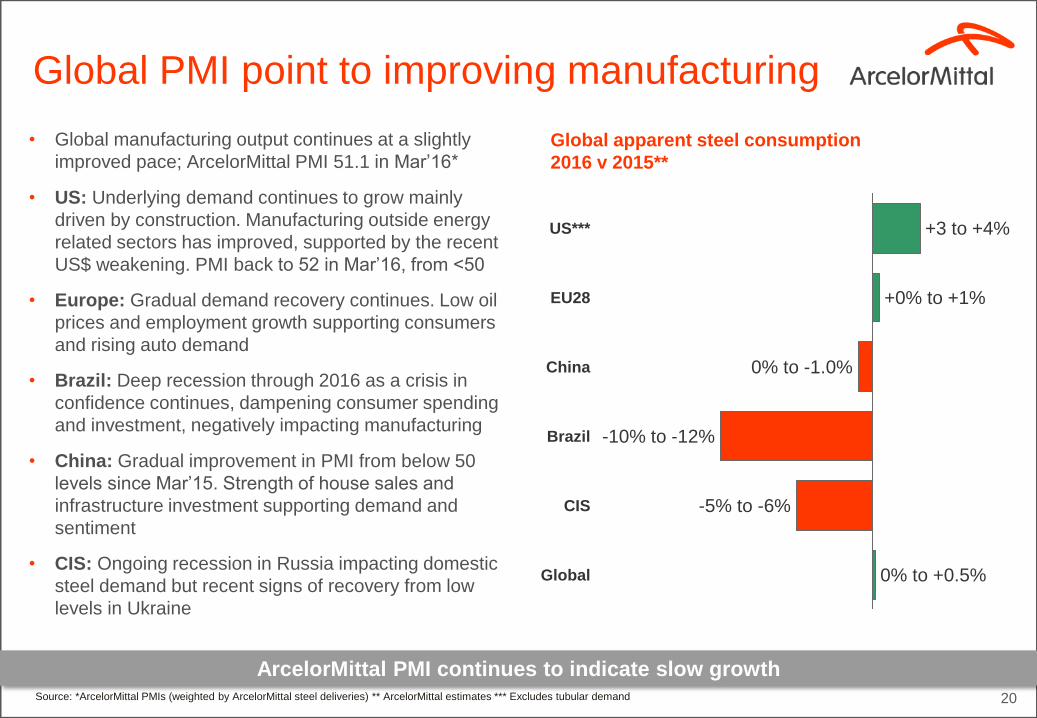
Global PMI point to improving manufacturing
ArcelorMittal PMI continues to indicate slow growth
• Global manufacturing output continues at a slightly
improved pace; ArcelorMittal PMI 51.1 in Mar’16*
• US: Underlying demand continues to grow mainly
driven by construction. Manufacturing outside energy
related sectors has improved, supported by the recent
US$ weakening. PMI back to 52 in Mar’16, from <50
• Europe: Gradual demand recovery continues. Low oil
prices and employment growth supporting consumers
and rising auto demand
• Brazil: Deep recession through 2016 as a crisis in
confidence continues, dampening consumer spending
and investment, negatively impacting manufacturing
• China: Gradual improvement in PMI from below 50
levels since Mar’15. Strength of house sales and
infrastructure investment supporting demand and
sentiment
• CIS: Ongoing recession in Russia impacting domestic
steel demand but recent signs of recovery from low
levels in Ukraine
Global
+0% to +1%
0% to +0.5%
US*** +3 to +4%
EU28
-10% to -12%
CIS
China
-5% to -6%
0% to -1.0%
Brazil
Global apparent steel consumption
2016 v 2015**
IBDROOT\PROJECTS\IBD-LN\FRACTION2015\585460_1\6. Presentations\2016.02.08 - Roadshow Presentation\ProjectRose_investorpresentation_V7 160204 speakernotes.pptx
21
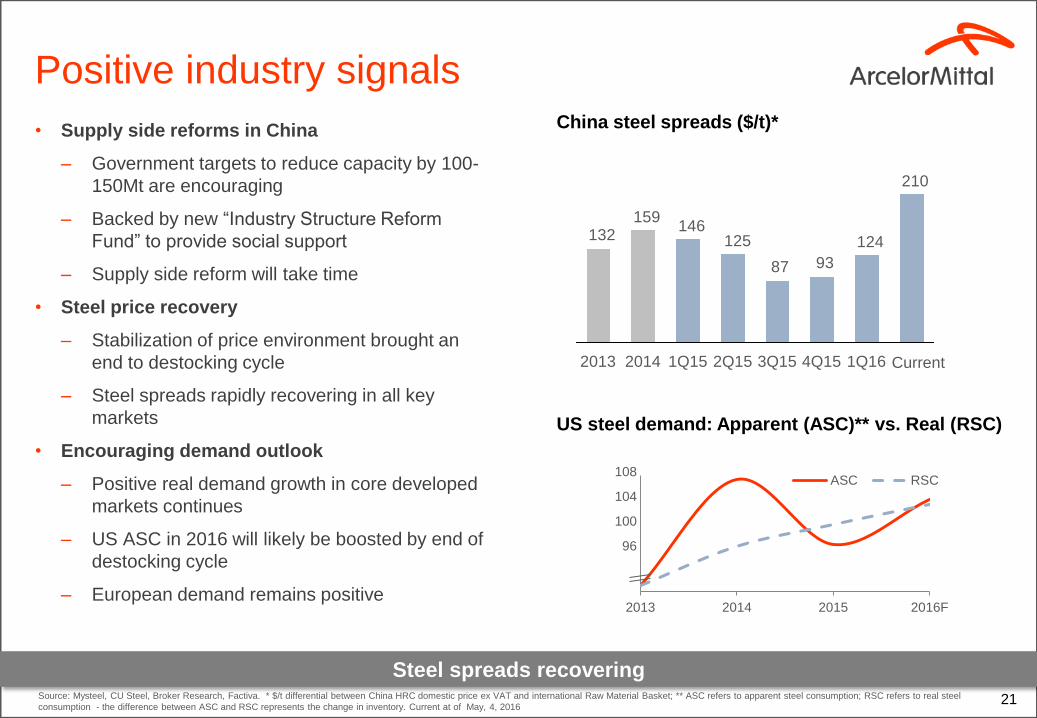
• Supply side reforms in China
– Government targets to reduce capacity by 100-
150Mt are encouraging
– Backed by new “Industry Structure Reform
Fund” to provide social support
– Supply side reform will take time
• Steel price recovery
– Stabilization of price environment brought an
end to destocking cycle
– Steel spreads rapidly recovering in all key
markets
• Encouraging demand outlook
– Positive real demand growth in core developed
markets continues
– US ASC in 2016 will likely be boosted by end of
destocking cycle
– European demand remains positive Policy
actions in China combined with improving
market conditions support medium term
outlook
Source: Mysteel, CU Steel, Broker Research, Factiva. * $/t differential between China HRC domestic price ex VAT and international Raw Material Basket; ** ASC refers to apparent steel consumption; RSC refers to real steel
consumption - the difference between ASC and RSC represents the change in inventory. Current at of May, 4, 2016
China steel spreads ($/t)*
US steel demand: Apparent (ASC)** vs. Real (RSC)
2013 2014 2015 2016F
ASC RSC108
96
100
104
Positive industry signals
Steel spreads recovering
210
124
9387
125146
159132
Current4Q152013 2014 1Q15 2Q15 3Q15 1Q16

3
5
7
9
11
13
15
17
19
Ja
n-0
7
Ma
y-0
7
Se
p-0
7
Ja
n-0
8
Ma
y-0
8
Se
p-0
8
Ja
n-0
9
Ma
y-0
9
Se
p-0
9
Ja
n-1
0
Ma
y-1
0
Se
p-1
0
Ja
n-1
1
Ma
y-1
1
Se
p-1
1
Jan-1
2
Ma
y-1
2
Se
p-1
2
Ja
n-1
3
Ma
y-1
3
Sep-1
3
Ja
n-1
4
Ma
y-1
4
Se
p-1
4
Ja
n-1
5
Ma
y-1
5
Se
p-1
5
Ja
n-1
6
EU28
USA
15
25
35
45
55
65
Ja
n-0
7
Ma
y-0
7
Sep-0
7
Ja
n-0
8
Ma
y-0
8
Se
p-0
8
Ja
n-0
9
Ma
y-0
9
Se
p-0
9
Ja
n-1
0
Ma
y-1
0
Se
p-1
0
Ja
n-1
1
Ma
y-1
1
Sep-1
1
Ja
n-1
2
Ma
y-1
2
Se
p-1
2
Ja
n-1
3
Ma
y-1
3
Se
p-1
3
Ja
n-1
4
Ma
y-1
4
Se
p-1
4
Ja
n-1
5
Ma
y-1
5
Sep-1
5
Ja
n-1
6
Developing ex China
China
Developed
22* ArcelorMittal estimates; AISI, Eurofer and ArcelorMittal estimates
Global ASC rates
Global ASC improved in 1Q’16 v 4Q’15 primarily in US and European markets
Global apparent steel consumption (ASC)* (million
tonnes per month)US and European apparent steel consumption
(ASC)* (million tonnes per month)
• China ASC -1.3% in 1Q’16 vs. 4Q’15
• China ASC -5.9% in 1Q’16 vs. 1Q’15• EU28 ASC +10.2% in 1Q’16 vs. 4Q’15
• EU28 ASC -0.1% in 1Q’16 vs. 1Q’15
• Global ASC +1.4% in 1Q’16 vs. 4Q’15
• Global ASC -3.0% in 1Q’16 vs. 1Q’15
• US ASC +7.4% in 1Q’16 vs. 4Q’15
• US ASC -9.1% in 1Q’16 vs. 1Q’15
(latest data point: Feb’16)(latest data point: Feb‘16)

30
35
40
45
50
55
60
65
2006 2007 2008 2009 2010 2011 2012 2013 2014 2015 2016
Eurozone construction PMI
USA Architectural Billings Index
200
300
400
500
600
700
800
2006 2007 2008 2009 2010 2011 2012 2013 2014 2015 2016
Non-residential
Residential
23* Source: US Census Bureau; ** Source: Markit and The American Institute of Architects
Construction markets in developed market
Construction gradually improving
• Non-residential growth weaker led by weaker
manufacturing investment. Architecture Billings
Index (ABI) remained in positive territory in Mar’16
to just over 50
• Residential will lead growth in construction in
2016. Non-residential to grow more slowly in 2016
from 8% in 2015 due to reduced spending in
manufacturing
US residential and non-residential construction indicators (SAAR) $bn*
Eurozone and US construction indicators**
(latest data point: Mar’16)
(latest data point: Mar’16)
United States
Europe
• EU28 construction output grew almost 1.5% y-o-
y in 2015 due mainly to strong civil engineering,
with a pick-up in buildings growth toward year
end
• EU28 construction growth expected to increase
to 2 to 3% in 2016 with all major construction
markets growing.
2.0
2.2
2.4
2.6
2.8
3.0
3.2
3.4
3.6
0
2,000
4,000
6,000
8,000
10,000
12,000
14,000
Jan-0
7A
pr-
07
Jul-
07
Oct-
07
Jan-0
8A
pr-
08
Jul-
08
Oct-
08
Jan-0
9A
pr-
09
Jul-
09
Oct-
09
Jan-1
0A
pr-
10
Ju
l-1
0O
ct-
10
Jan-1
1A
pr-
11
Jul-
11
Oct-
11
Jan-1
2A
pr-
12
Jul-
12
Oct-
12
Jan-1
3A
pr-
13
Jul-
13
Oct-
13
Jan-1
4A
pr-
14
Jul-
14
Oct-
14
Jan-1
5A
pr-
15
Jul-
15
Oct-
15
Jan-1
6
USA (MSCI)Months Supply
1.5
2.0
2.5
3.0
3.5
4.0
4.5
5.0
0100200300400500600700800900
1,0001,1001,2001,3001,400
Jan
-07
Ap
r-07
Jul-
07
Oct-
07
Jan
-08
Ap
r-08
Jul-
08
Oct-
08
Jan
-09
Ap
r-09
Jul-
09
Oct-
09
Jan
-10
Ap
r-10
Jul-
10
Oct-
10
Jan
-11
Ap
r-11
Jul-
11
Oct-
11
Jan
-12
Ap
r-12
Jul-
12
Oct-
12
Jan
-13
Ap
r-13
Jul-
13
Oct-
13
Jan
-14
Ap
r-14
Jul-
14
Oct-
14
Jan
-15
Ap
r-15
Jul-
15
Oct-
15
Jan
-16
Flat stocks at service centres
Months of supply (RHS)
0%
5%
10%
15%
20%
25%
30%
35%
40%
45%
2468
10121416182022
Jan
-07
Ap
r-07
Jul-
07
Oct-
07
Jan
-08
Ap
r-08
Jul-
08
Oct-
08
Jan
-09
Ap
r-09
Jul-
09
Oct-
09
Jan
-10
Ap
r-10
Jul-
10
Oct-
10
Jan
-11
Ap
r-11
Jul-
11
Oct-
11
Jan
-12
Ap
r-12
Jul-
12
Oct-
12
Jan
-13
Ap
r-13
Jul-
13
Oct-
13
Jan
-14
Ap
r-14
Jul-
14
Oct-
14
Jan
-15
Ap
r-15
Jul-
15
Oct-
15
Jan
-16
Ap
r-16
Flat and Long
% of ASC (RHS)
0.0
1.0
2.0
3.0
4.0
5.0
0
500
1,000
1,500
2,000
2,500
Jan-0
7A
pr-
07
Jul-0
7O
ct-
07
Jan-0
8A
pr-
08
Jul-0
8O
ct-
08
Jan-0
9A
pr-
09
Jul-0
9O
ct-
09
Jan-1
0A
pr-
10
Jul-1
0O
ct-
10
Jan-1
1A
pr-
11
Jul-1
1O
ct-
11
Jan-1
2A
pr-
12
Jul-1
2O
ct-
12
Ja
n-1
3A
pr-
13
Jul-1
3O
ct-
13
Jan-1
4A
pr-
14
Jul-1
4O
ct-
14
Jan-1
5A
pr-
15
Jul-1
5O
ct-
15
Germany Flat Stocks
Months Supply (RHS)
24* Source: WSA, Mysteel, ArcelorMittal Strategy estimates
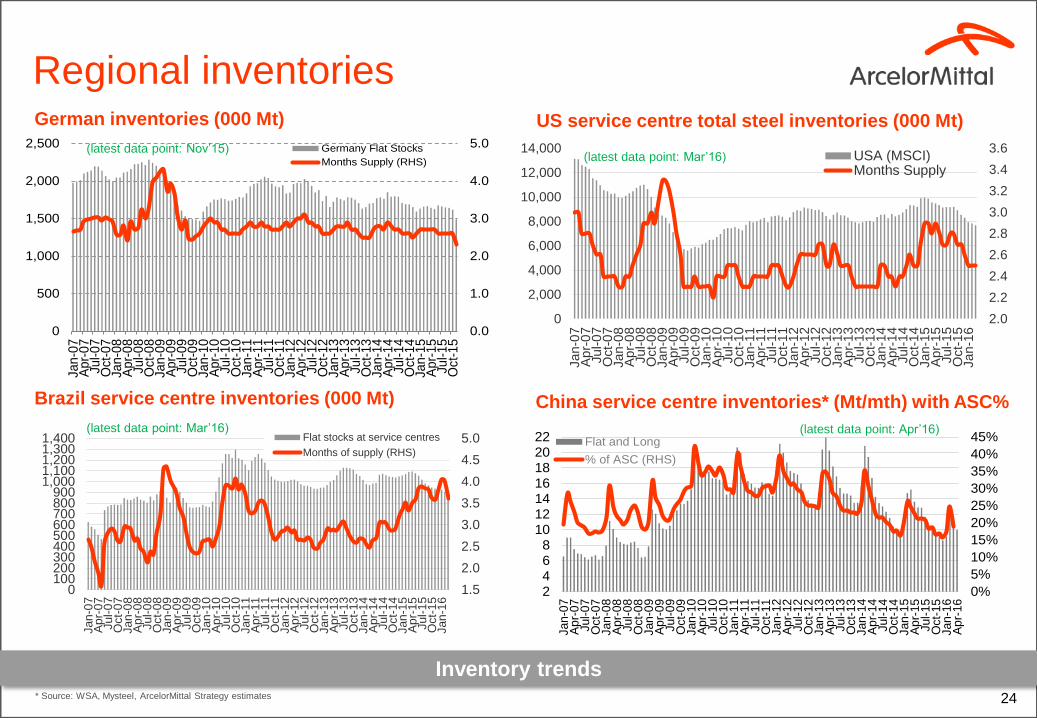
Regional inventories
Inventory trends
German inventories (000 Mt)
China service centre inventories* (Mt/mth) with ASC%Brazil service centre inventories (000 Mt)
US service centre total steel inventories (000 Mt)
(latest data point: Mar’16)
(latest data point: Mar’16)(latest data point: Nov’15)
(latest data point: Apr’16)

280
380
480
580
680
780
880
980
1080
1180
1280
Jan 0
8
Ap
r 08
Jul 08
Oct 08
Jan 0
9
Ap
r 09
Jul 09
Oct 09
Jan 1
0
Ap
r 10
Jul 10
Oct 10
Jan 1
1
Ap
r 11
Jul 11
Oct 11
Jan 1
2
Ap
r 12
Jul 12
Oct 12
Jan 1
3
Ap
r 13
Jul 13
Oct 13
Jan 1
4
Ap
r 14
Jul 14
Oct 14
Jan-1
5
Ap
r-15
Jul-15
Oct-
15
Jan-1
6
Ap
r-16
China domestic Shanghai (Inc 17% VAT)
N.America FOB Midwest
N.Europe domestic ex-works
10
20
30
40
50
60
70
80
90
100
110
120
130
Jan 0
8
Ap
r 08
Jul 08
Oct 08
Jan 0
9
Ap
r 09
Jul 09
Oct 09
Jan 1
0
Ap
r 10
Jul 10
Oct 10
Jan 1
1
Ap
r 11
Jul 11
Oct 11
Jan 1
2
Ap
r 12
Jul 12
Oct 12
Jan 1
3
Ap
r 13
Jul 13
Oct 13
Jan 1
4
Ap
r 14
Jul 14
Oct 14
Jan-1
5
Ap
r-15
Jul-15
Oct-
15
Jan-1
6
Ap
r-16
Spot Iron Ore
Coking Coal
Scrap
25* Source data: ArcelorMittal estimates; Platts
Raw material and prices
Steel prices and raw material prices have rebounded
Spot iron ore, coking coal and scrap price(index IH 2008=100)*
Regional steel price HRC ($/t)
(latest data point: Apr ’16) (latest data point: Apr’16)

26
Imports into US declining
Imports into US declining
Chinese Imports - Carbon Flat Roll ‘000 tons*
0%
5%
10%
15%
20%
25%
30%
0
200
400
600
800
1,000
1,200
1,400
1,600
1,800
Ja
n-1
3
Ma
r-13
Ma
y-1
3
Ju
l-1
3
Sep
-13
Nov-1
3
Ja
n-1
4
Ma
r-14
Ma
y-1
4
Ju
l-1
4
Sep
-14
Nov-1
4
Ja
n-1
5
Ma
r-15
Ma
y-1
5
Ju
l-1
5
Sep
-15
Nov-1
5
Ja
n-1
6
Ma
r-16
Imports % Share of ASC
Imports - Carbon Flat Roll ‘000 tons*
0%
4%
8%
12%
16%
20%
0
50
100
150
200
250
300
Ja
n-1
3
Ma
r-13
Ma
y-1
3
Ju
l-1
3
Sep
-13
Nov-1
3
Ja
n-1
4
Ma
r-14
Ma
y-1
4
Ju
l-1
4
Sep
-14
Nov-1
4
Ja
n-1
5
Ma
r-15
Ma
y-1
5
Ju
l-1
5
Sep
-15
Nov-1
5
Ja
n-1
6
Ma
r-16
Imports % Share of Imports
• Carbon flat roll imports into the U.S. in 1Q’16
dropped 35.4% vs. 1Q’15
• Flat roll import market share fell to 17.1% in
1Q16 vs. 24.6% in 1Q15. Import market
share in March’16 of 15.7% was at its lowest
level since December’13
• Domestic producers have been benefiting
from the falling imports into the U.S.
• Due to high preliminary CVD and AD
margins for CORE and CRC, imports of
carbon flat roll from China have reduced
significantly. Recent plate trade case could
push direct flat roll imports from China down
further, assuming high preliminary CVD and
AD margins are applied
* Source data: U.S. Census Bureau, Department of Commerce; in short tons
China overview

-40%
-20%
0%
20%
40%
60%
80%
100%
2008 2009 2010 2011 2012 2013 2014 2015 2016
Residential floor space sold (6 month lag)
Residential floor space started
28* Source: China National Bureau of Statistics, China Real Estate Index System (via Haver) and ArcelorMittal estimates; Source: NBS, CISA, WSA, Mysteel, ArcelorMittal Strategy estimates
China overview
Economic growth eased as steel demand negatively impacted by real estate
• Chinese GDP growth eased slightly in 1Q’16 but
stimulus measures, a turn-around in real estate and
better exports led to a rebound in activity in March
• Fixed investment, particularly state sponsored,
improved in Mar’16 as a rebound in both
infrastructure and real estate offset continued weak
manufacturing investment
• Rapidly rising house sales (+32% y-o-y 1Q’16) has
led to a jump in new starts. Yet, housing inventory
remains high and real estate demand declines on
year-on-year basis
• 2016 real demand still expected to decline in 2016
and outlook is only marginally better than expected
but ASC will continue to be supported by an end to
destocking
• Crude steel production is expected to decline again
in 2016, despite a near stabilisation in domestic
demand, as exports decline from 112mt level in
2015
Crude steel finished production and inventory (mmt)
(latest data point: Mar’16)
(latest data point: Mar’16)
China construction % change YoY, (3mth moving av.)*
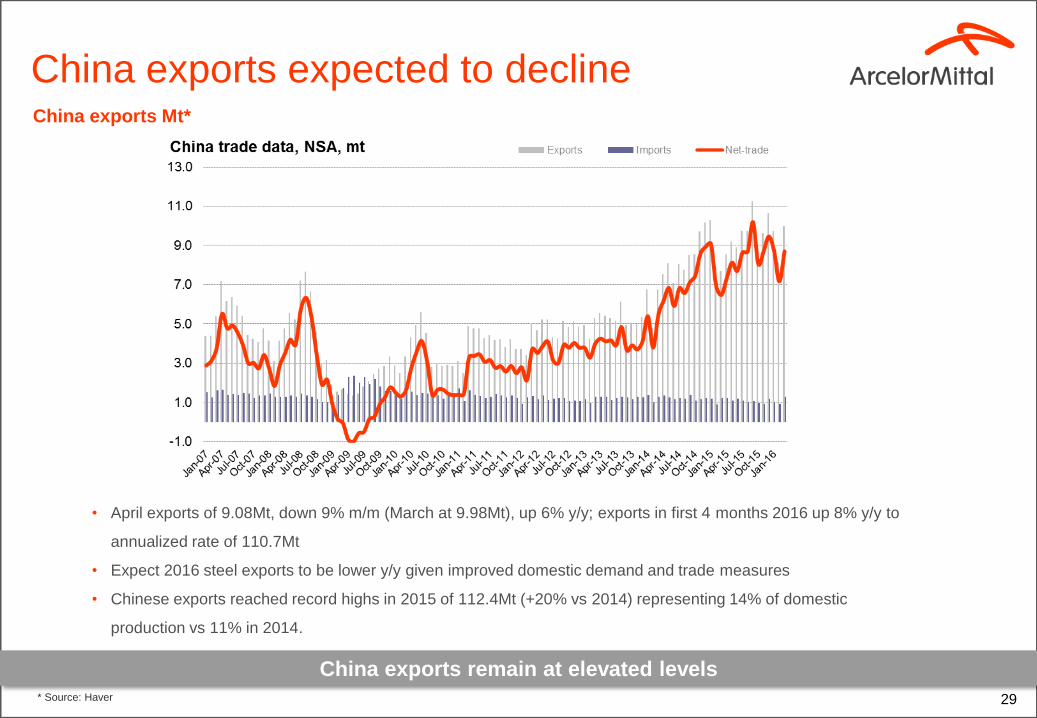
China exports expected to decline
29
China exports Mt*
• April exports of 9.08Mt, down 9% m/m (March at 9.98Mt), up 6% y/y; exports in first 4 months 2016 up 8% y/y to
annualized rate of 110.7Mt
• Expect 2016 steel exports to be lower y/y given improved domestic demand and trade measures
• Chinese exports reached record highs in 2015 of 112.4Mt (+20% vs 2014) representing 14% of domestic
production vs 11% in 2014.
China exports remain at elevated levels* Source: Haver

Steel investments

31
Europe: ArcelorMittal Krakow Poland
Investments in excess of €130m in upstream and downstream installations in Krakow
On July 7, 2015, ArcelorMittal Poland announced it will restart preparations for the relining of BF#5 in Krakow,
which is coming to the end of its lifecycle in mid-2016.
• Further investments in the primary operations include:
– The modernization of the BOF #3 Total expected cost PLN 200m (more than €40m).
• Investment in the downstream operations include:
– The extension of the hot rolling mill capacity by 0.9Mtpa
– Increasing the hot dip galvanizing capacity by 0.4Mtpa
– Expected completion in 2016 Total capex value of both projects expected to exceed PLN 300m (€90m)
HRM Krakow HRM

Cost optimization, mix improvement and increase of shipments of galvanized products:
• Phase 1: New heavy gauge galvanize line (#6 Galvanize Line):
– Completed construction of heavy gauge galvanizing line #6 (cap. 660ktpy) and closure of line #2 (cap. 400ktpy)
increased shipments of galvanized sheet by 260ktpy, along with improved mix and optimized cost
– Line #6 will incorporate AHSS capability part of program to improve Dofasco’s ability to serve customers in
the automotive, construction, and industrial markets
– The first commercial coil was produced in April 2015 with ramp up ongoing
• Phase 2: Approved galvanize line conversion to Galvalume and Galvanize:
– Restart conversion of #4 galvanize line to dual pot line (capacity 160ktpy of galvalume and 128ktpy of
galvanize products) and closure of line #1 galvanize line (cap.170ktpy of galvalume) increased shipments of
galvanized sheet by 128ktpy, along with improved mix and optimized cost
– Expected completion in 2016
32
Dofasco (NAFTA)
Expansion supported by strong market for galvanized products

33
VAMA-JV with Hunan Valin
Robust Chinese automotive market: > 50% growth to 25 million vehicles by 2018
• VAMA: JV between ArcelorMittal and Hunan Valin which will produce steel for high-end applications in the automobile industry,
supplying international automakers and first-tier Chinese car manufacturers as well as their supplier networks for rapidly growing
Chinese market
• Construction of automotive facility : State of the art pickling tandem CRM (1.5Mt); Continuous annealing line (1.0Mt), and Hot dip
galvanizing line (0.5Mt)
• Capex ~$832 million (100% basis) First automotive coils produced during 1Q 2015
• Recent developments:
– VAMA has completed development of DP780, BH180 and Ductibor and received approval on advanced high strength steel and
USIBOR by key auto OEMs.
– During 1Q’16, VAMA completed homologation of IF, USIBOR and DP600 with tier 1 auto OEMs; also officially homologated by
some of the biggest domestic OEM’s
– Obtained ISO/TS16949 certification
Automotive packaging lineCGL furnace Entry section of Continuous Annealing Line

34
AM/NS Calvert JV
Investment in Calvert to further enhance automotive capabilities
Investment in the existing No.4 continuous coating line: Project completed 1Q 2015:
• Increases ArcelorMittal’s North American capacity to produce press hardenable steels one of the strongest steels used in
automotive applications, Usibor®, a type one aluminum-silicon coated (Al Si) high strength steel
• AM/NS Calvert will also be capable of producing Ductibor®, an energy-absorbing high strength steel grade designed specifically to
complement Usibor® and offer ductility benefits to customers
• Modifications completed at the end of 2014 and the first commercial coil was produced in January 2015
Slab yard expansion to increase Calvert’s slab staging capacity and efficiency (capex $40m):
• To expand the HSM slab yard bays 4 & 5 with overhead cranes and roller table to feed the HSM production up to 5.3mt/year of
coils.
• The current HSM consists of 3 bays with 335kt capacity for incoming slabs (less than the staging capacity required to achieve
5.3mt target).
• Phase 1 completed 1Q 2016: Slab yard expansion of Bay 4 and minor installations for Bay 5 increase coil production up to
4.6mt/pa
• Phase 2: Slab yard expansion Bay 5 Increase coil production from 4.6mt/pa to 5.3mt/pa. Completion expected in 2017
HSM Slab yard Bay 4

35
Acindar (Brazil segment)
Expansion supported by construction market in Argentina
• New rolling mill (Huatian) in Santa Fe province to increase rebar
capacity by 0.4mt/year for civil construction market:
– New rolling mill will also enable Acindar to optimize production at its
special bar quality (SBQ) rolling mill in Villa Constitución, which in
future will only manufacture products for the automotive and mining
industries
• Estimated capital expenditure of ~$100m
• Project completed in 1Q 2016 and currently under ramp up
Reheating Furnace New Building
Finishing blockPlant overview
New rolling mill at Acindar (Argentina):
Hot commissioning

36
Automotive
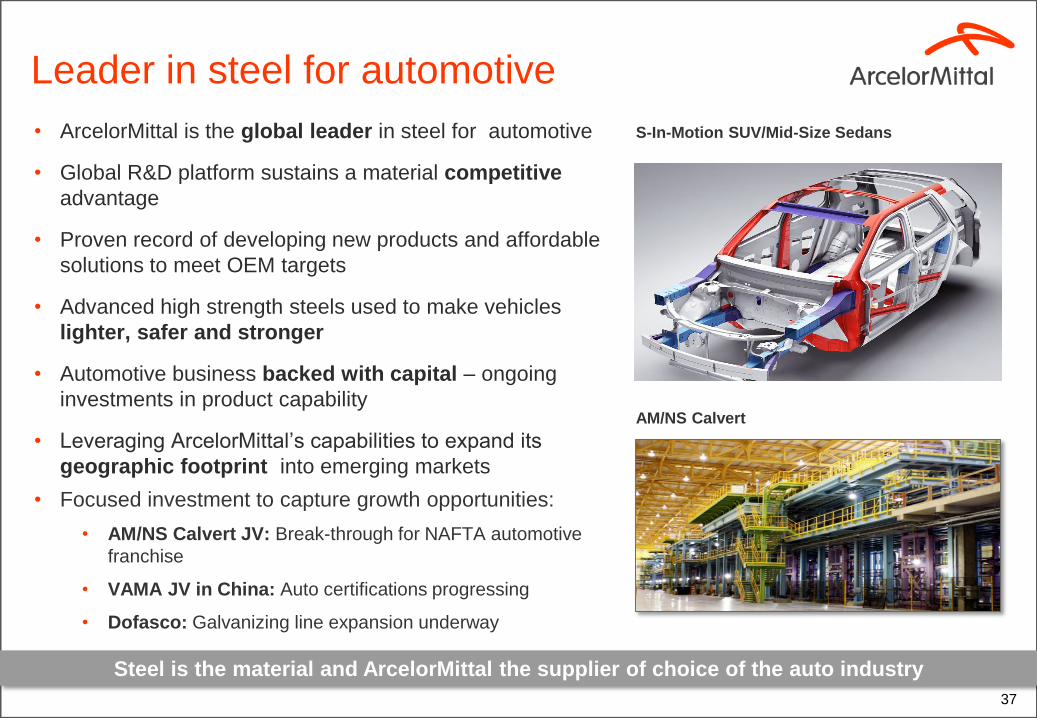
Leader in steel for automotive
• ArcelorMittal is the global leader in steel for automotive
• Global R&D platform sustains a material competitive
advantage
• Proven record of developing new products and affordable
solutions to meet OEM targets
• Advanced high strength steels used to make vehicles
lighter, safer and stronger
• Automotive business backed with capital – ongoing
investments in product capability
• Leveraging ArcelorMittal’s capabilities to expand its
geographic footprint into emerging markets
• Focused investment to capture growth opportunities:
• AM/NS Calvert JV: Break-through for NAFTA automotive
franchise
• VAMA JV in China: Auto certifications progressing
• Dofasco: Galvanizing line expansion underway
37
S-In-Motion SUV/Mid-Size Sedans
AM/NS Calvert
Steel is the material and ArcelorMittal the supplier of choice of the auto industry

38
Automotive growth in developed world
USA / Canada and EU28 + Turkey vehicles production units• USA and Canadian automotive production
forecast to stabilize at ~14m units level
• EU28 and Turkey recovery ongoing.
Expected to return to 2007 level in 2017
with further growth potential beyond
2020201820142012201020082006 2016
8,000
11,000
10,000
9,000
0
2022
21,000
20,000
19,000
18,000
17,000
16,000
15,000
14,000
13,000
12,000
13,818
18,056
USA & Canada
EU28 & Turkey
Developed market vehicle production rates increasing; recovery ongoing

Through innovation, steel remains the
material of choice
• ArcelorMittal has developed a unique full range of coated Advanced High Strength Steels in the last 25 years
• This has had significant impact on automotive construction:
– Safety: Most vehicles get 5 stars NCAP rating today
– Weight saving: Body structures are 25% lighter than in the 1980s
– Environment: 6% less greenhouse gas emissions than in the 1980s
– Corrosion protection: 12 years is the mainstream guarantee for corrosion thanks to the hugeshare of coated products
1990 2008 2014
1st Generation, phase 1: HSLA, HSS
1st Generation, phase 2 : Dual Phase (DP1180 since 2008), TRIP Steels, Martensitic(MS>1200MPa since 80’s)
1st Generation, phase 3: Usibor® for hot stamping
3rd Generation AHSS
Fortiform® for cold stamping
2nd Generation: TWIP, X-IP
20031993
39
ArcelorMittal has developed the broadest product offer in the world

40
Further weight reduction potential
• Due to a very aggressive and weight reduction driven product development, ArcelorMittal keeps enhancing:
• Our portfolio of products for cold stamping with developments like Fortiform®, our family of 3rd Generation AHSS
• Our portfolio of products for hot stamping with Usibor® 2000 and Ductibor® 1000
23 2420Current
Potential
North America
D segment
(2015 base)
Pick up truck
(2013 base)
C Segment
(2009 base)
Potential weight savings of
additional 3% over the next
2 years across our solutions
Further potential weight savings with new products (%)
New product developments to offer an additional 3% weight reduction in next 2 years

The all-new Volvo XC90 is now
made with about 40% of hot-
formed boron steel, including
the entire safety cage
protecting the occupants.
Volvo XC90: Steel provides maximum
occupant protection in all crash scenarios
“This [use of hot-formed boron steel] is approximately five times more than the first generation XC90. To our knowledge,
this high usage of high-strength steel is unique compared with our competitors.”
-- Prof. Lotta Jakobsson, Senior Technical Specialist Safety, -Volvo Cars Safety Centre in press release about Volvo’s new XC90, July 22, 2014
41

The 2015 Chevrolet Colorado and GMC Canyon showcases
Usibor® 1500 in their updated body structure to enhance
performance, safety and mass reduction without comprised
durability.
Chevrolet Colorado/GMC Canyon utilizes Usibor®
to offer full-size capabilities in mid-size truck
Changes to: Windshield Inner Rail ;
Windshield Outer Rail ; B-Pillar Outer
Reinforcement ; Front Door Beam; and
Rear Door Beam
Use of Usibor® 1500 in Chevrolet Colorado/GMC Canyon
42
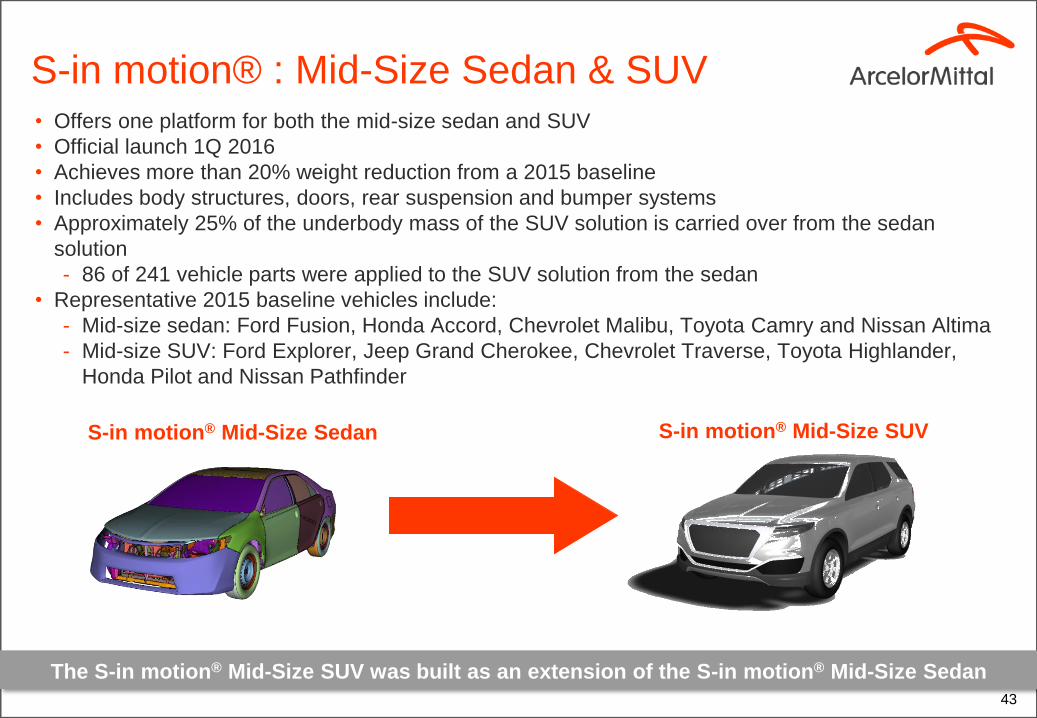
S-in motion® : Mid-Size Sedan & SUV• Offers one platform for both the mid-size sedan and SUV
• Official launch 1Q 2016
• Achieves more than 20% weight reduction from a 2015 baseline
• Includes body structures, doors, rear suspension and bumper systems
• Approximately 25% of the underbody mass of the SUV solution is carried over from the sedan
solution
- 86 of 241 vehicle parts were applied to the SUV solution from the sedan
• Representative 2015 baseline vehicles include:
- Mid-size sedan: Ford Fusion, Honda Accord, Chevrolet Malibu, Toyota Camry and Nissan Altima
- Mid-size SUV: Ford Explorer, Jeep Grand Cherokee, Chevrolet Traverse, Toyota Highlander,
Honda Pilot and Nissan Pathfinder
43
S-in motion® Mid-Size SUVS-in motion® Mid-Size Sedan
The S-in motion® Mid-Size SUV was built as an extension of the S-in motion® Mid-Size Sedan

Source: NHTSA Volpe Transportation Research Center CAFE Compliance and Effects Model
0
10
20
60
50
30
40
Fue
l E
co
no
my (
MP
G)
54.5 MPG
25 MPG
58%
12%
15%
8%7%
• A range of technologies are
being implemented by
automakers to reach the 54.5
MPG target
• Power train, electrification,
aerodynamics and rolling
resistance are the largest
contributors
• Weight reduction is necessary to
close the gap and compensate
for under achievement by other
technologies
US fuel economy breakdown (MPG)
Technologies to meet US 2025 fuel
economy mandate
44
20% BIW weight reduction ie required to meet the 54.5 MPG target

GROUP (highlights)
46
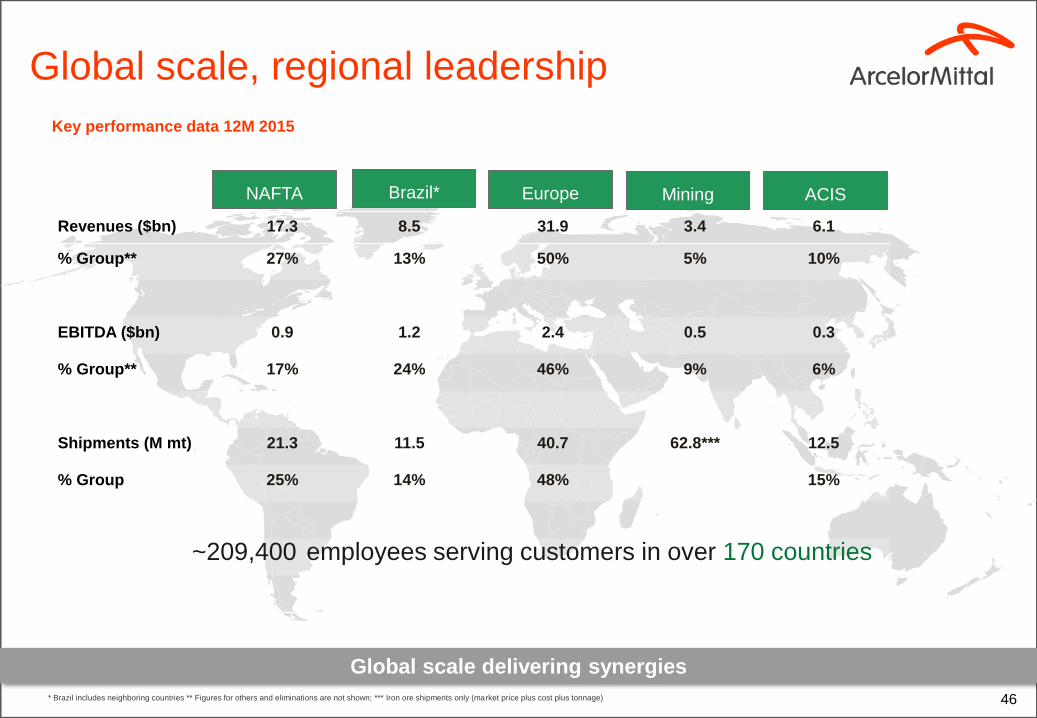
Brazil*
Revenues ($bn) 17.3 8.5 31.9 3.4 6.1
% Group** 27% 13% 50% 5% 10%
EBITDA ($bn) 0.9 1.2 2.4 0.5 0.3
% Group** 17% 24% 46% 9% 6%
Shipments (M mt) 21.3 11.5 40.7 62.8*** 12.5
% Group 25% 14% 48% 15%
~209,400 employees serving customers in over 170 countries
Europe Mining ACIS
* Brazil includes neighboring countries ** Figures for others and eliminations are not shown; *** Iron ore shipments only (market price plus cost plus tonnage)
NAFTA
Global scale, regional leadership
Key performance data 12M 2015
Global scale delivering synergies

Steel demand by end market
47
Europe & NAFTA
China steel demand split
Railway
1%
Construction
68%
Household appliances
2%
Automobiles
8%
Machinery
19%
Shipbuilding
1%
Other transport
2%
Tubes
13%
Other
2%
Metal goods
14%
Mechanical enginering
14%
Domestic appliances
3%
Automobiles
18%
Construction
35%
Construction
40%
Defense & Homeland Security
3%
Appliances
4%
Machinery and equipment
10%
Automobile
26%
Container
4%
Energy
10%
Other
3%
US steel demand split
Europe steel demand split
Regional steel demand by end markets
Sources: China-Bloomberg, Europe: Eurofer, US: AISI

48
Africa 7%
BELGIUM 2%
FRANCE 6%
GERMANY 9%
ITALY 3%
SPAIN 5%
Others 6%
EU 15 30%
CZECH REPUBLIC 2%
POLAND 4%
ROMANIA 1%
Others 2%
Rest EU 9%
EU 39%
BRAZIL 8%
ARGENTINA 2%
Others 3%
LATAM 13%
EU39%
LATAM13%
Africa, 7%
CANADA 4%
MEXICO 3%
USA 20%
NAFTA 26%
Sales by destination as % of total Group
Largely exposed to the developed markets of
NAFTA and EU
Approximately 2/3 of sales to developed markets

49
Group performance 1Q’16 v 4Q’15
Group performance declined primarily due to lower steel prices
Average steel selling price $/t
Steel shipments (000’t)
Underlying EBITDA ($ Millions) and EBITDA/t
668 520569
1Q’164Q’151Q’15
-8.7%
-22.1%
21,605 19,737 21,472
1Q’15 1Q’164Q’15
+8.8%
-0.6%
1,4479271,103
-15.9%
1Q’15* 4Q’15 1Q’16
-35.9%
$67/t $56/t $43/t• Crude steel production increased 7% to 23.2Mt with increases in
NAFTA and Europe offset in part by decease in Brazil.
• Steel shipments increased 8.8% due to improvements across all
steel divisions except Brazil driven by weak demand (NAFTA
(+19.2%), Europe (+10.3%) and ACIS (+7.7%), Brazil (-14.0%)
• Sales in 1Q 2016, were 4.2% lower primarily due to lower ASP (-
8.7%) and lower market priced iron ore shipments (-21.1%), offset in
part by higher steel shipments (+8.8%) and higher iron ore reference
prices (+3.5%)
• EBITDA declined 15.9% primarily due to lower ASP offset in part by
higher steel shipment volumes
• 4Q’15 operating performance was impacted by $4.7bn impairments
charges (including $0.9bn with respect to the Mining segment
goodwill and $3.8bn related to fixed assets) and $0.9bn exceptional
charges (primarily $0.8bn inventory related charges following the
rapid decline of international steel prices and litigation and other
costs in South Africa $0.1bn). There were no such impairment or
exceptional items in 1Q’16.
1Q’16 v 4Q’15 analysis:
* Impacted by $69m provision primarily related to onerous hot rolled and cold rolled contracts in the US

Segments

51
NAFTA performance 1Q’16 v 4Q’15
Performance improved due to higher volumes and lower costs, partly offset by lower steel prices
Average steel selling price $/t
Steel shipments (000’t)
Underlying EBITDA ($ Millions) and EBITDA/t
635706796
1Q’15 4Q’15 1Q’16
-20.2%
-10.1%
5,463 4,581 5,463
1Q’15 4Q’15
+19.2%
1Q’16
339273122
1Q’15* 4Q’15 1Q’16
+178.5%
+24.2%
$22/t $60/t $62/t• Crude steel production increased 9.9% to 5.6mt.
• Steel shipments increased 19.2% to 5.5mt, primarily driven by a
20.8% increase in flat product steel shipments and 11.7% increase in
long product shipment volumes (mainly Canada and Mexico).
• Sales in 1Q 2016 increased by 6.2% to $3.8bn, primarily due to
higher steel shipment volumes, offset in part by lower ASP (-10.1%).
• EBITDA in 1Q’16 increased 24.2% primarily due to higher steel
volumes, lower costs and improved performance at Calvert.
• Operating performance in 4Q’15 was impacted by impairments
totalling $507m with respect to the intended sale of Long Carbon
facilities in the US (ArcelorMittal LaPlace, Steelton and Vinton
totalling $0.2bn), and following planned asset optimization at Indiana
Harbor East and West in the US ($0.3bn). In addition, operating
performance in 4Q 2015 was impacted by exceptional inventory
related charges of $353m following the rapid decline of steel prices.
1Q’16 v 4Q’15 analysis:
* Impacted by $69m provision primarily related to onerous hot rolled and cold rolled contracts in the US

Improvement
52
Crude steel achievable capacity (million Mt)
NAFTA
USA
Long
Flat
Canada
6.3
Mexico
5.6
16.9
Long
Flat
NAFTA
100.0%
20.0%
80.0%
Number of facilities (BF and EAF)
NAFTA No. of BF No. of EAF
USA 7 6
Canada 3 4
Mexico 1 4
Total 11 14
Note: Indiana Harbor West BF #3 temporarily idled; Georgetown wire rod facility closed in August 2015, Vinton and LaPlace sold in 2Q 2016
NAFTA leading producer with 28.7Mt /pa installed capacity

53
Brazil performance 1Q’16 v 4Q’15
Performance declined due to lower volumes and steel prices; weaker Tubular performance
Average steel selling price $/t
Steel shipments (000’t)
EBITDA ($ Millions) and EBITDA/t
474565713
-33.5%
-16.1%
1Q’164Q’151Q’15
2,707 2,873 2,472
-14.0%
1Q’164Q’151Q’15
-8.7%
377145181
-19.8%
1Q’164Q’151Q’15
-61.5%
$139/t $63/t $59/t
• Brazil segment crude steel production decreased 6.4% to 2.7mt in
1Q 2016
• Steel shipments in 1Q 2016 decreased by 14.0% to 2.5mt, primarily
due to a 17.3% decrease in flat steel shipments and 7% decrease in
long product shipments (primarily in neighboring countries to Brazil -
20.4%) due to slowdown in demand.
• Sales in 1Q 2016 decreased by 40.0% to $1.3bn, due to lower ASP
(-16.1%), and lower steel shipments.
• EBITDA in 1Q 2016 declined by 19.8% to $145m on account of
lower ASP (primarily long steel products -9.2%), lower steel
shipment volumes as well as weaker Tubular operations in
Venezuela.
• Operating performance in 4Q 2015 was impacted by the $176 million
impairment related to Point Lisas (Trinidad and Tobago) indefinitely
idled, and exceptional charges of $52m relating to inventory write
down in Point Lisas.
1Q’16 v 4Q’15 analysis:

Improvement
54
Crude steel achievable capacity (million Mt)
Brazil
0.3
1.4Long
Flat
TrinidadArgentinaBrazil
10.5
Long
Flat
100.0%
Brazil
43.0%
57.0%
Number of facilities (BF and EAF)
No. of BF No. of EAF
Flat 3 -
Long 3 8
Total 6 8
Geographical footprint and logistics
Cariacica
Long
Flat
BRAZIL facilities
Tubarao
Monlevade
Piracicaba
Point Lisas
The map is showing primary facilities excl. Pipes and Tubes.
Acindar
Brazil leading producer with 12.3Mt /pa installed capacity

55
Europe performance 1Q’16 v 4Q’15
Performance declined primarily due to lower steel prices offset in part by improved volumes
Average steel selling price $/t
Steel shipments (000’t)
EBITDA ($ Millions) and EBITDA/t
633 568 530
4Q’15
-16.2%
1Q’16
-6.7%
1Q’15
10,662 9,473 10,444
+10.3%
1Q’164Q’151Q’15
-2.0%
616 544 363
-41.0%
4Q’15 1Q’16
-33.3%
1Q’15
$58/t $57/t $35/t• Europe segment crude steel production increased by 11.8% to
11.2mt in 1Q 2016
• Steel shipments in 1Q 2016 increased by 10.3% to 10.4mt, primarily
due to a 13.7% increase in flat product shipment volumes.
• Sales in 1Q 2016 increased 1.1% to $7.2bn as compared to 4Q’15,
primarily due to higher steel shipments as discussed above, offset in
part by lower ASP which declined by 6.7% overall, (flat and long
products declined 7.1% and 6.7%, respectively).
• EBITDA in 1Q 2016 decreased by 33.3% to $363m, mainly driven by
lower ASP offset in part by higher steel shipment volumes and
improved cost performance. Operating performance in 4Q 2015 was
impacted by impairments of $398m primarily in connection with the
idling for an indefinite time of the ArcelorMittal Sestao plant in Spain
and exceptional charges of $345m, relating to the write-down of
inventories following the rapid decline of steel prices.
1Q16 v 4Q15 analysis:

Improvement
56
Crude steel achievable capacity (million Mt)
Europe
Long
Flat
53.3
Long
Flat
Europe
100.0%
30.0%
70.0%
Number of facilities (BF and EAF)
EUROPE No. of BF No. of EAF
Flat 20 5
Long 5 10
Total 25 15
Geographical footprint and logistics
(*) Excludes 2BF’s in Florange
(*)
(*)
The map is showing primary facilities excl. Pipes and Tubes.
Long
Flat
EUROPE facilities
Asturias
Dunkirk
Bremen
Florange
LiègeGhent
EHSDabrowa
Krakow
Fos
GalatiZenica
Ostrava
Flat and Long
Duisburg
Hamburg
Belval; Differdange
Europe leading producer with 53.3Mt /pa installed capacity

57
ACIS performance 1Q’16 v 4Q’15
Stable performance as improved costs and volumes offset steel price decline
Average steel selling price $/t
Steel shipments (000’t)
EBITDA ($ Millions) and EBITDA/t
320356507
4Q’151Q’15
-36.9%
-10.2%
1Q’16
3,006 3,078 3,315
+10.3%
4Q’15 1Q’161Q’15
+7.7%
1336161
-53.9%
+0.5%
1Q’164Q’151Q’15
$44/t $20/t $18/t• ACIS segment crude steel production in 1Q’16 was stable at 3.7mt.
• Steel shipments in 1Q’16 increased by 7.7% to 3.3mt primarily due
to increased shipments in South Africa due to seasonality.
• Sales in 1Q’16 decreased by 4.7% to $1.2bn, primarily due to lower
ASP (-10.2%) offset in part by higher steel shipments as discussed
above.
• EBITDA in 1Q’16 of $61m was stable compared to 4Q’15, primarily
due to lower ASP offset in part with higher steel shipments and
improved costs.
• Operating performance in 4Q’15 was impacted by impairments of
$267m primarily with respect to the Saldanha plant in South Africa
due to its revised competitive outlook, and exceptional charges of
$159m primarily relating to a deferred stripping prepayment, a
provision in relation to competition cases in South Africa and the
write-down of inventories following the rapid decline of steel prices.
1Q16 v 4Q15 analysis:
58
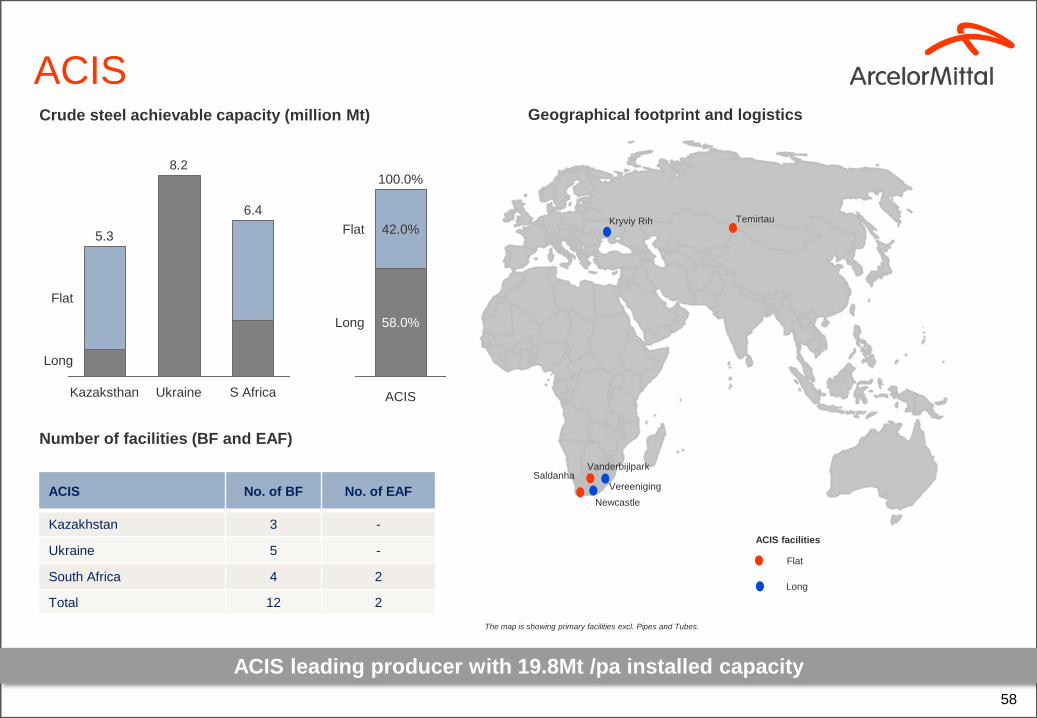
Crude steel achievable capacity (million Mt)
ACIS
8.2
Long
6.4
UkraineKazaksthan
5.3
Flat
S Africa
Long
Flat
58.0%
42.0%
100.0%
ACIS
Number of facilities (BF and EAF)
ACIS No. of BF No. of EAF
Kazakhstan 3 -
Ukraine 5 -
South Africa 4 2
Total 12 2
Geographical footprint and logistics
Note
The map is showing primary facilities excl. Pipes and Tubes.
Long
Flat
ACIS facilities
Kryviy Rih Temirtau
Vanderbijlpark
VereenigingSaldanha
Newcastle
4
ACIS leading producer with 19.8Mt /pa installed capacity
59
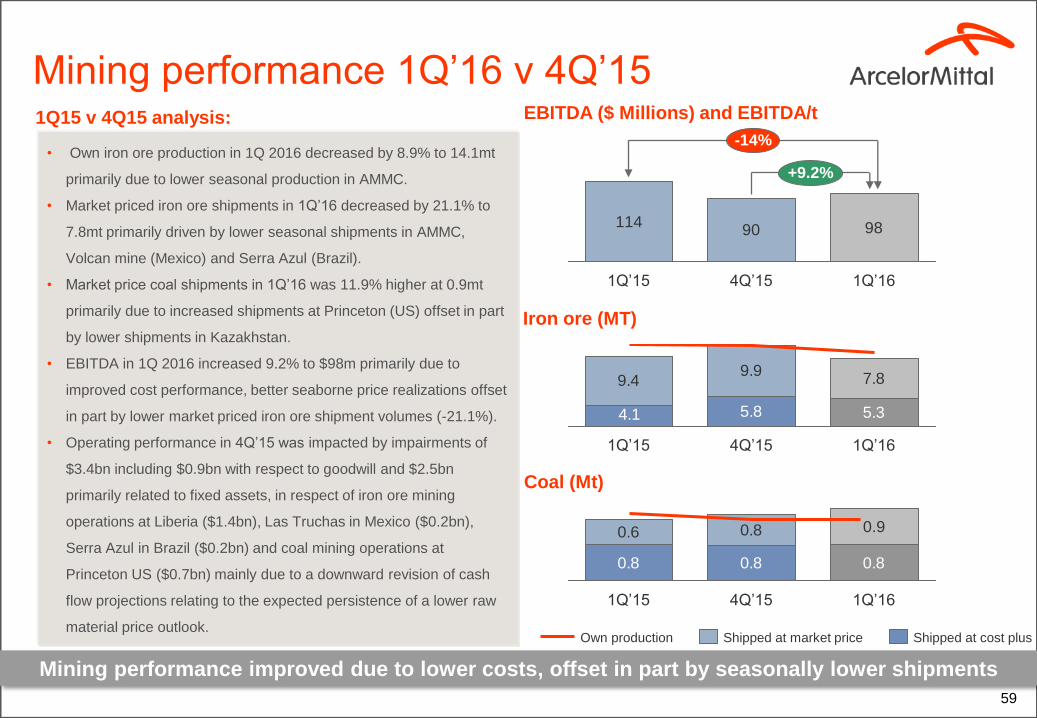
Mining performance 1Q’16 v 4Q’15
Mining performance improved due to lower costs, offset in part by seasonally lower shipments
Iron ore (MT)
Coal (Mt)
EBITDA ($ Millions) and EBITDA/t
11490 98
-14%
+9.2%
1Q’164Q’151Q’15
• Own iron ore production in 1Q 2016 decreased by 8.9% to 14.1mt
primarily due to lower seasonal production in AMMC.
• Market priced iron ore shipments in 1Q’16 decreased by 21.1% to
7.8mt primarily driven by lower seasonal shipments in AMMC,
Volcan mine (Mexico) and Serra Azul (Brazil).
• Market price coal shipments in 1Q’16 was 11.9% higher at 0.9mt
primarily due to increased shipments at Princeton (US) offset in part
by lower shipments in Kazakhstan.
• EBITDA in 1Q 2016 increased 9.2% to $98m primarily due to
improved cost performance, better seaborne price realizations offset
in part by lower market priced iron ore shipment volumes (-21.1%).
• Operating performance in 4Q’15 was impacted by impairments of
$3.4bn including $0.9bn with respect to goodwill and $2.5bn
primarily related to fixed assets, in respect of iron ore mining
operations at Liberia ($1.4bn), Las Truchas in Mexico ($0.2bn),
Serra Azul in Brazil ($0.2bn) and coal mining operations at
Princeton US ($0.7bn) mainly due to a downward revision of cash
flow projections relating to the expected persistence of a lower raw
material price outlook.
1Q15 v 4Q15 analysis:
9.49.9
7.8
4.1 5.8 5.3
1Q’164Q’151Q’15
0.8 0.8 0.8
0.6 0.8
1Q’16
0.9
4Q’151Q’15
Shipped at cost plusShipped at market priceOwn production

South Africa
Iron Ore**
* Includes share of production
** Includes purchases made under July 2010 interim agreement with Kumba (South Africa)
1) Following an agreement signed off in December 2012, on February 20th, 2013, Nunavut Iron Ore subscribed for new shares in Baffinland Iron Mines Corporation which diluted AM’s stake to 50%
2) January 2nd, 2013 AM entered into an agreement to sell 15% of its stake in AM Mines Canada to a consortium lead POSCO and China Steel Corporation (CSC).
3) New exploration projects, Indian Iron Ore & Coal exploration , Coal of Africa (9.71%) and South Africa Manganese (50% ) are excluded in the above .
4) On January 19, 2015, ArcelorMittal announced the sale of its interest in the Kuzbass Coal mines in the Kemerovo region of Siberia, Russia, to Russia’s National Fuel Company (NTK). This transaction closed on December 31, 2014.
A global mining portfolio addressing Group
steel needs and external market
Key assets and projects
USA Iron Ore
Minorca 100%
Hibbing 62.31%*
Mexico Iron Ore
Las Truchas &
Volcan 100%;
Pena 50%*Liberia
Iron Ore 85%
Brazil
Iron Ore
100%Existing mines
Canada
AMMC 85% (2)
Bosnia
Iron Ore
51%
USA Coal
100%
Ukraine
Iron Ore
95.13%
Kazakhstan
Coal
8 mines 100%
Kazakhstan Iron
Ore
4 mines 100%
Iron ore mine
Coal mine
Canada
Baffinland 50%(1)
60
Geographically diversified mining assets

Daniel Fairclough – Global Head Investor Relations
+44 207 543 1105
Hetal Patel – UK/European Investor Relations
+44 207 543 1128
Valérie Mella – European/Retail Investor Relations
+44 207 543 1156
Maureen Baker – Fixed Income/Debt Investor Relations
+33 1 71 92 10 26
Lisa Fortuna – US Investor Relations
+312 899 3985
We have released a new ArcelorMittal investor relations app available for download on IOS or android devices
New ArcelorMittal IR app and contacts