Embed Size (px)
Citation preview
© 2012, IHS Inc. No portion of this presentation may be reproduced, reused, or otherwise distributed in any form without prior written consent.
Global Methanol Market
Review
Dewey Johnson
Sr. Director Chemical Market Research
June 2012
© 2012, IHS Inc. No portion of this presentation may be reproduced, reused, or otherwise distributed in any form without prior written consent.
Presentation Agenda
•Methanol global and regional balance
•Methanol global trade
•Methanol price mechanisms and regional feedstock
costs
•Key methanol derivatives
© 2012, IHS Inc. No portion of this presentation may be reproduced, reused, or otherwise distributed in any form without prior written consent.
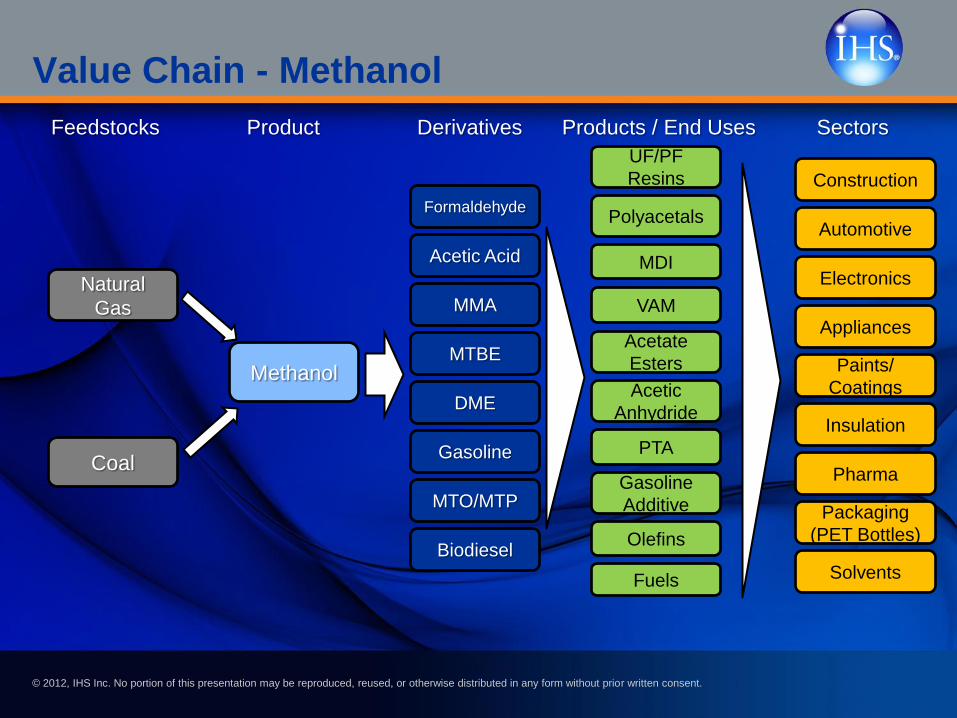
Value Chain - Methanol
Feedstocks Product Derivatives Products / End Uses Sectors
Natural
Gas
Methanol
Formaldehyde
Acetic Acid
MMA
MTBE
DME
Gasoline Coal
Construction
Automotive
Electronics
Appliances
Paints/
Coatings
Insulation
Pharma
Packaging
(PET Bottles)
MTO/MTP
Biodiesel
UF/PF
Resins
MDI
VAM
Gasoline
Additive
Polyacetals
Acetate
Esters
Acetic
Anhydride
Olefins
Fuels
PTA
Solvents
© 2012, IHS Inc. No portion of this presentation may be reproduced, reused, or otherwise distributed in any form without prior written consent. 4
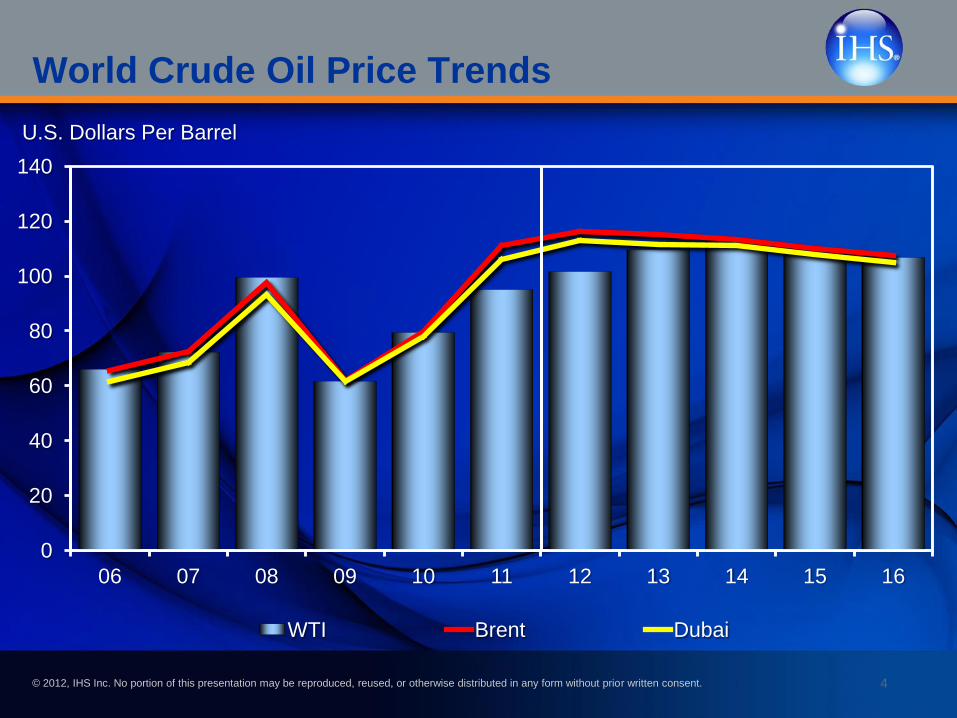
World Crude Oil Price Trends
0
20
40
60
80
100
120
140
06 07 08 09 10 11 12 13 14 15 16
WTI Brent Dubai
U.S. Dollars Per Barrel
© 2012, IHS Inc. No portion of this presentation may be reproduced, reused, or otherwise distributed in any form without prior written consent.
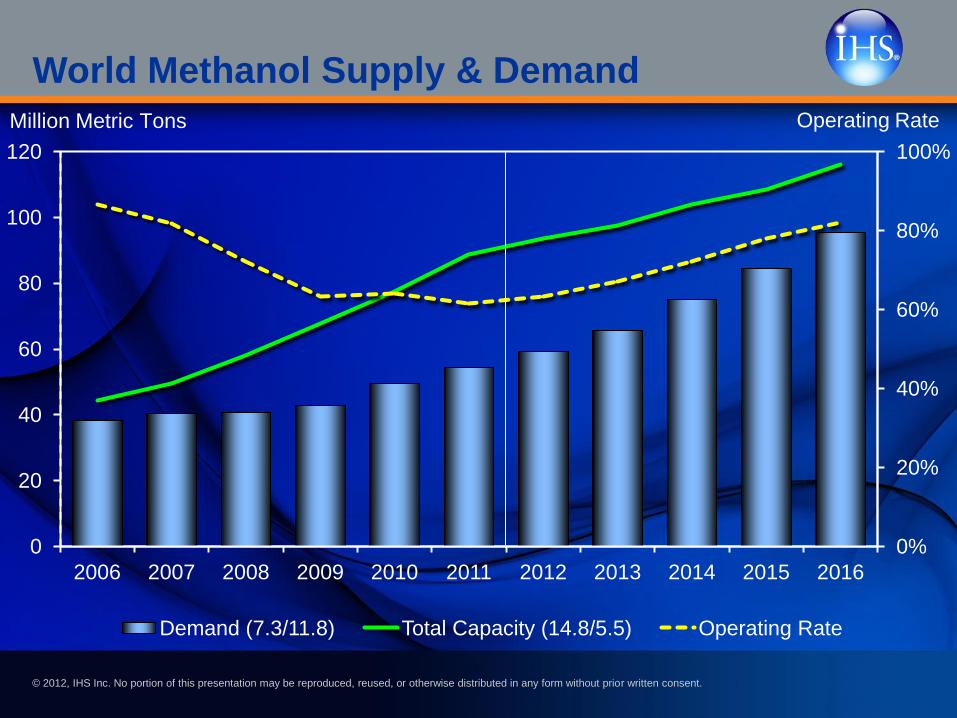
World Methanol Supply & Demand
0%
20%
40%
60%
80%
100%
0
20
40
60
80
100
120
2006 2007 2008 2009 2010 2011 2012 2013 2014 2015 2016
Demand (7.3/11.8) Total Capacity (14.8/5.5) Operating Rate
Million Metric Tons Operating Rate
© 2012, IHS Inc. No portion of this presentation may be reproduced, reused, or otherwise distributed in any form without prior written consent.
40%
50%
60%
70%
80%
90%
100%
0.0
20.0
40.0
60.0
80.0
100.0
120.0
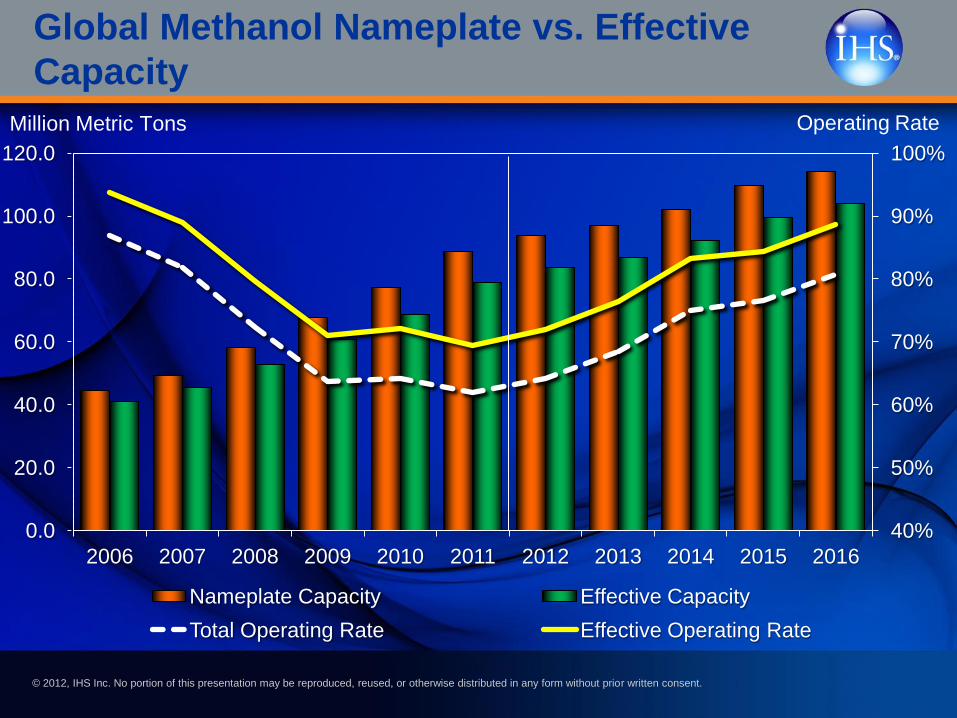
2006 2007 2008 2009 2010 2011 2012 2013 2014 2015 2016
Nameplate Capacity Effective Capacity
Total Operating Rate Effective Operating Rate
Million Metric Tons Operating Rate
Global Methanol Nameplate vs. Effective
Capacity
© 2012, IHS Inc. No portion of this presentation may be reproduced, reused, or otherwise distributed in any form without prior written consent.
7
Formaldehyde 32%
Acetic Acid 10%
MTBE/TAME 10%
Methyl Methacrylate
2%
Gasoline/Fuel 11%
Dimethyl Ether 11%
Methylamines 4%
Chloromethanes 1%
MTO/MTP 6%
Solvents 5%
DMT/Others 8%
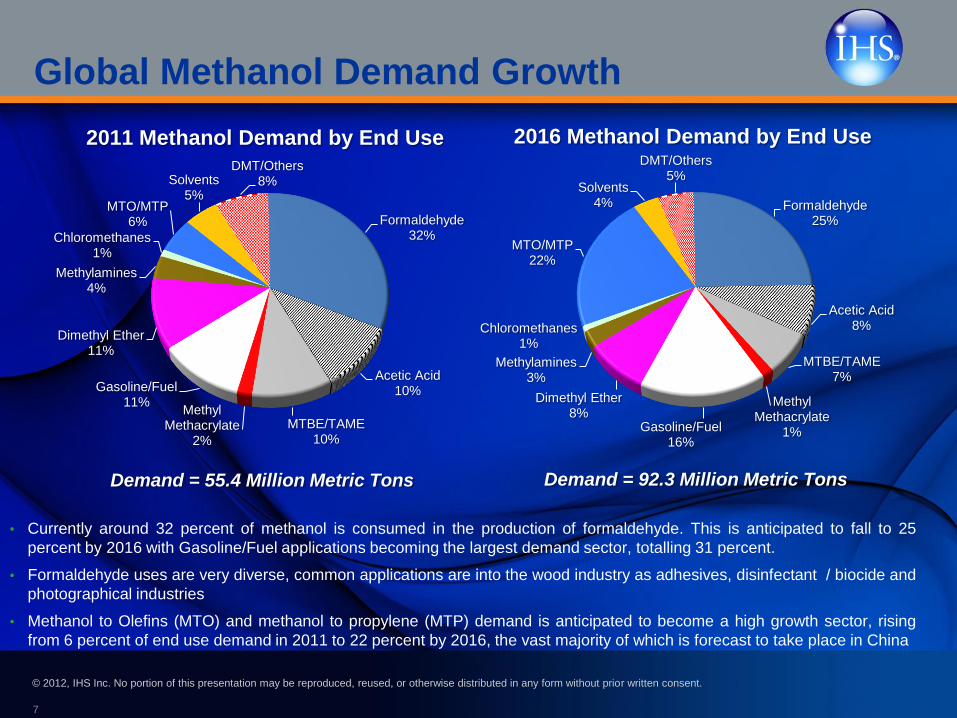
Demand = 55.4 Million Metric Tons
2011 Methanol Demand by End Use
Formaldehyde 25%
Acetic Acid 8%
MTBE/TAME 7%
Methyl Methacrylate
1% Gasoline/Fuel 16%
Dimethyl Ether 8%
Methylamines 3%
Chloromethanes 1%
MTO/MTP 22%
Solvents 4%
DMT/Others 5%
Demand = 92.3 Million Metric Tons
2016 Methanol Demand by End Use
• Currently around 32 percent of methanol is consumed in the production of formaldehyde. This is anticipated to fall to 25
percent by 2016 with Gasoline/Fuel applications becoming the largest demand sector, totalling 31 percent.
• Formaldehyde uses are very diverse, common applications are into the wood industry as adhesives, disinfectant / biocide and
photographical industries
• Methanol to Olefins (MTO) and methanol to propylene (MTP) demand is anticipated to become a high growth sector, rising
from 6 percent of end use demand in 2011 to 22 percent by 2016, the vast majority of which is forecast to take place in China
Global Methanol Demand Growth
© 2012, IHS Inc. No portion of this presentation may be reproduced, reused, or otherwise distributed in any form without prior written consent.
20%
30%
40%
50%
60%
70%
80%
90%
100%
0.0
20.0
40.0
60.0
80.0
100.0
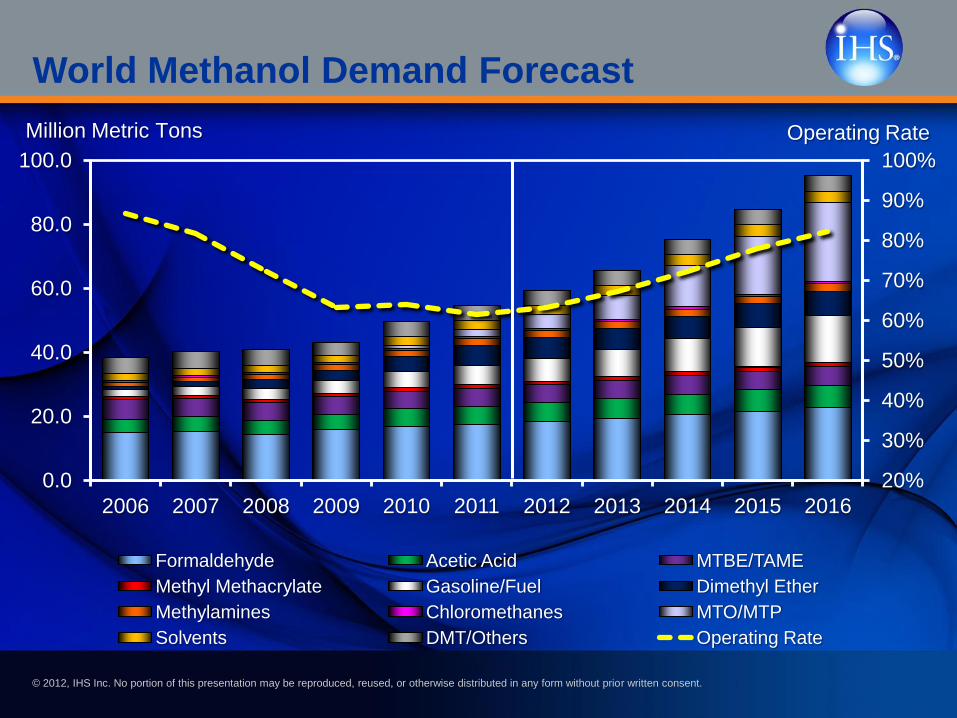
2006 2007 2008 2009 2010 2011 2012 2013 2014 2015 2016
Formaldehyde Acetic Acid MTBE/TAME
Methyl Methacrylate Gasoline/Fuel Dimethyl Ether
Methylamines Chloromethanes MTO/MTP
Solvents DMT/Others Operating Rate
Million Metric Tons Operating Rate
World Methanol Demand Forecast
© 2012, IHS Inc. No portion of this presentation may be reproduced, reused, or otherwise distributed in any form without prior written consent.
9
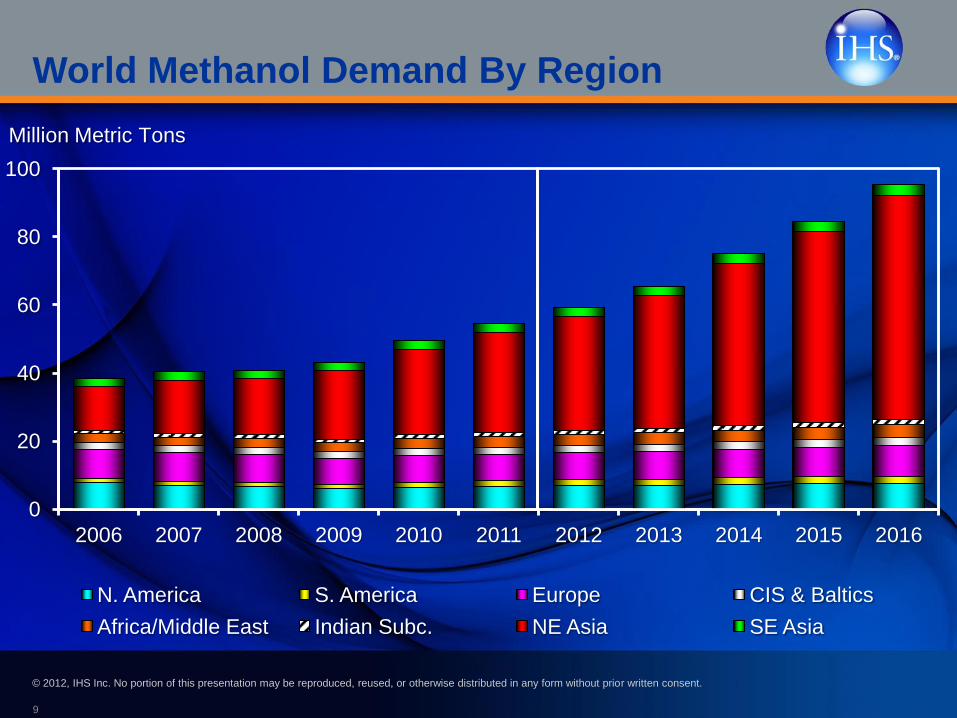
0
20
40
60
80
100
2006 2007 2008 2009 2010 2011 2012 2013 2014 2015 2016
N. America S. America Europe CIS & Baltics
Africa/Middle East Indian Subc. NE Asia SE Asia
Million Metric Tons
World Methanol Demand By Region
© 2012, IHS Inc. No portion of this presentation may be reproduced, reused, or otherwise distributed in any form without prior written consent. 10
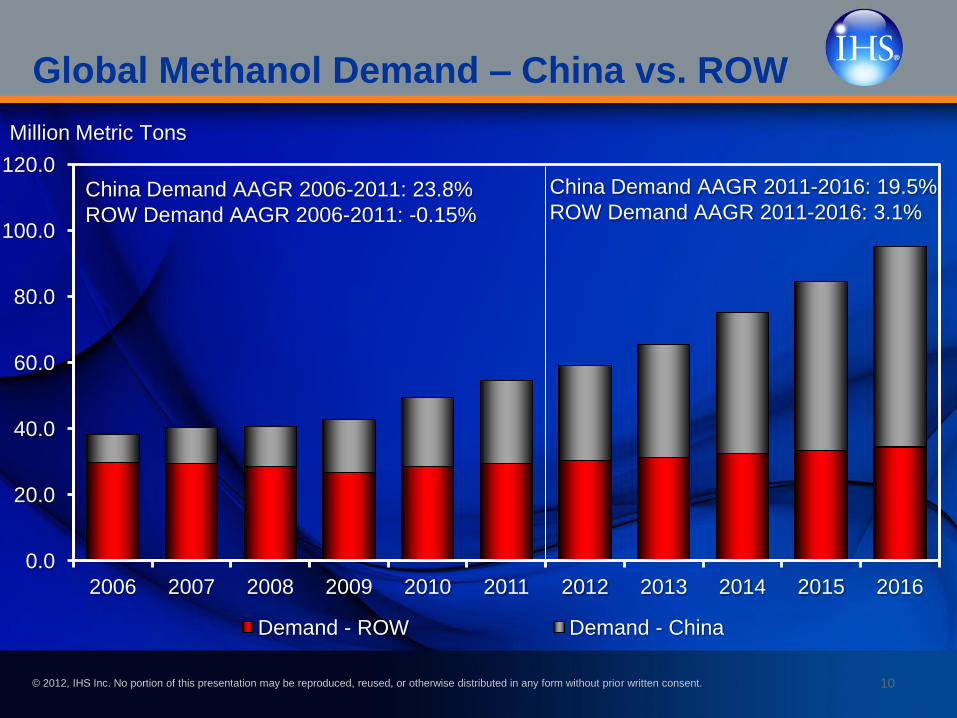
0.0
20.0
40.0
60.0
80.0
100.0
120.0
2006 2007 2008 2009 2010 2011 2012 2013 2014 2015 2016
Demand - ROW Demand - China
Million Metric Tons
China Demand AAGR 2006-2011: 23.8%
ROW Demand AAGR 2006-2011: -0.15%
China Demand AAGR 2011-2016: 19.5%
ROW Demand AAGR 2011-2016: 3.1%
Global Methanol Demand – China vs. ROW
© 2012, IHS Inc. No portion of this presentation may be reproduced, reused, or otherwise distributed in any form without prior written consent. 11
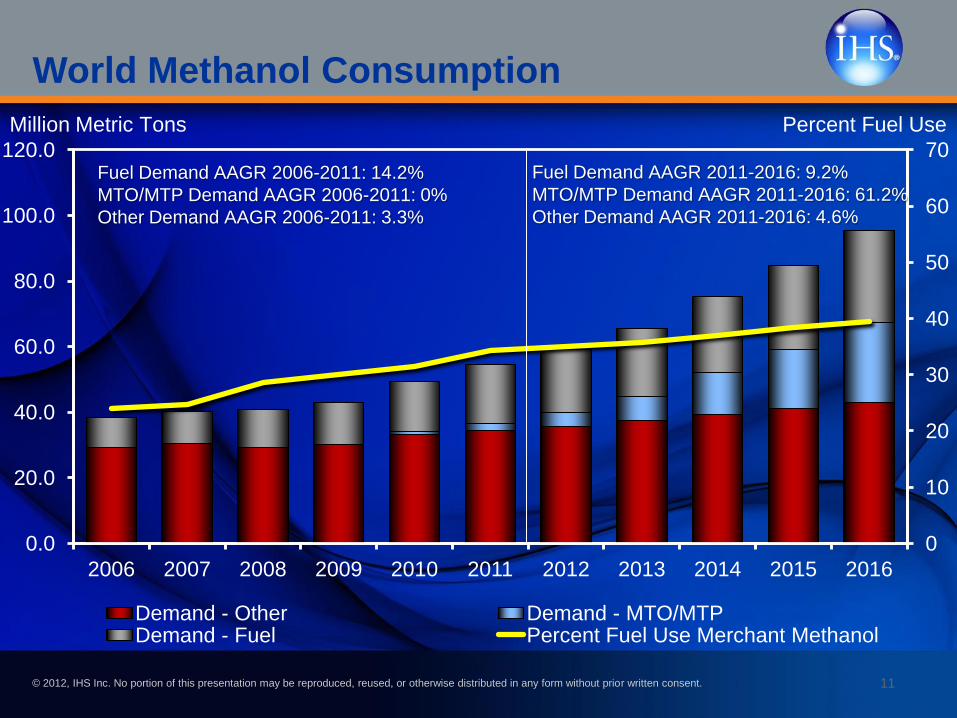
World Methanol Consumption
0
10
20
30
40
50
60
70
0.0
20.0
40.0
60.0
80.0
100.0
120.0
2006 2007 2008 2009 2010 2011 2012 2013 2014 2015 2016
Demand - Other Demand - MTO/MTP Demand - Fuel Percent Fuel Use Merchant Methanol
Million Metric Tons Percent Fuel Use
Fuel Demand AAGR 2006-2011: 14.2%
MTO/MTP Demand AAGR 2006-2011: 0%
Other Demand AAGR 2006-2011: 3.3%
Fuel Demand AAGR 2011-2016: 9.2%
MTO/MTP Demand AAGR 2011-2016: 61.2%
Other Demand AAGR 2011-2016: 4.6%

© 2012, IHS Inc. No portion of this presentation may be reproduced, reused, or otherwise distributed in any form without prior written consent.
West Europe
© 2012, IHS Inc. No portion of this presentation may be reproduced, reused, or otherwise distributed in any form without prior written consent.
13
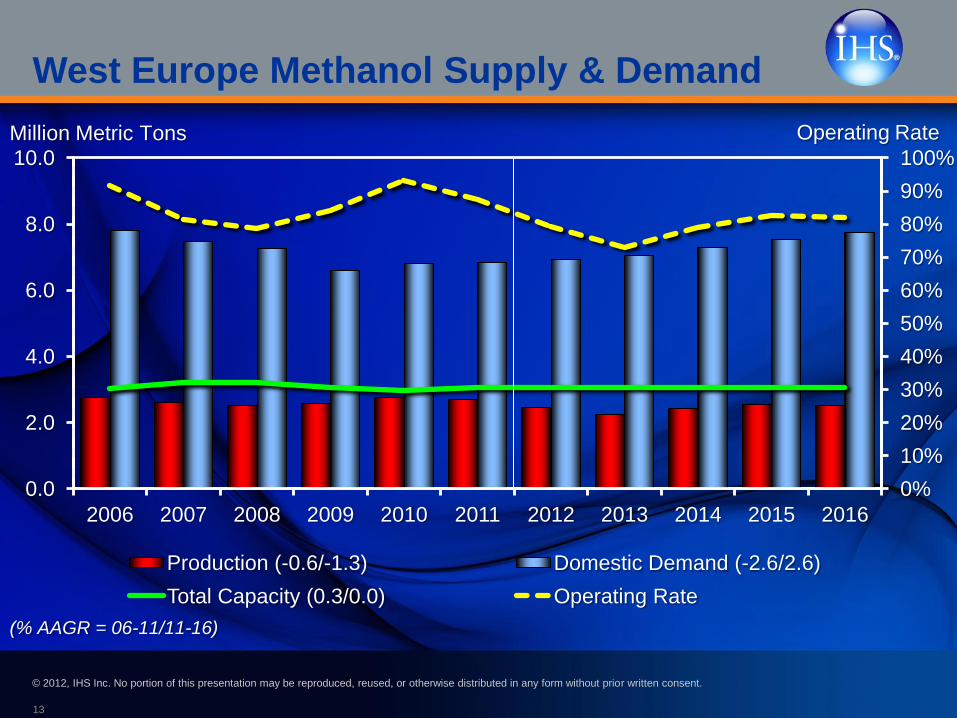
West Europe Methanol Supply & Demand
0%
10%
20%
30%
40%
50%
60%
70%
80%
90%
100%
0.0
2.0
4.0
6.0
8.0
10.0
2006 2007 2008 2009 2010 2011 2012 2013 2014 2015 2016
Production (-0.6/-1.3) Domestic Demand (-2.6/2.6)
Total Capacity (0.3/0.0) Operating Rate
Million Metric Tons Operating Rate
(% AAGR = 06-11/11-16)
© 2012, IHS Inc. No portion of this presentation may be reproduced, reused, or otherwise distributed in any form without prior written consent.
Middle East
© 2012, IHS Inc. No portion of this presentation may be reproduced, reused, or otherwise distributed in any form without prior written consent.
15
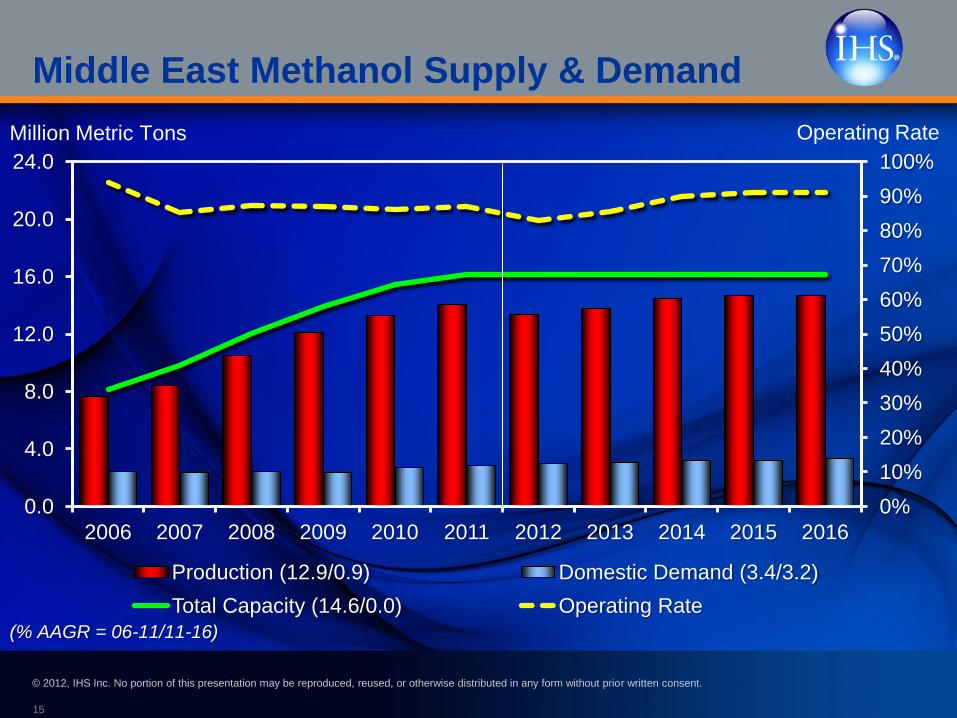
Middle East Methanol Supply & Demand
0%
10%
20%
30%
40%
50%
60%
70%
80%
90%
100%
0.0
4.0
8.0
12.0
16.0
20.0
24.0
2006 2007 2008 2009 2010 2011 2012 2013 2014 2015 2016
Production (12.9/0.9) Domestic Demand (3.4/3.2)
Total Capacity (14.6/0.0) Operating Rate
Million Metric Tons Operating Rate
(% AAGR = 06-11/11-16)
© 2012, IHS Inc. No portion of this presentation may be reproduced, reused, or otherwise distributed in any form without prior written consent.
Asia
© 2012, IHS Inc. No portion of this presentation may be reproduced, reused, or otherwise distributed in any form without prior written consent.
17
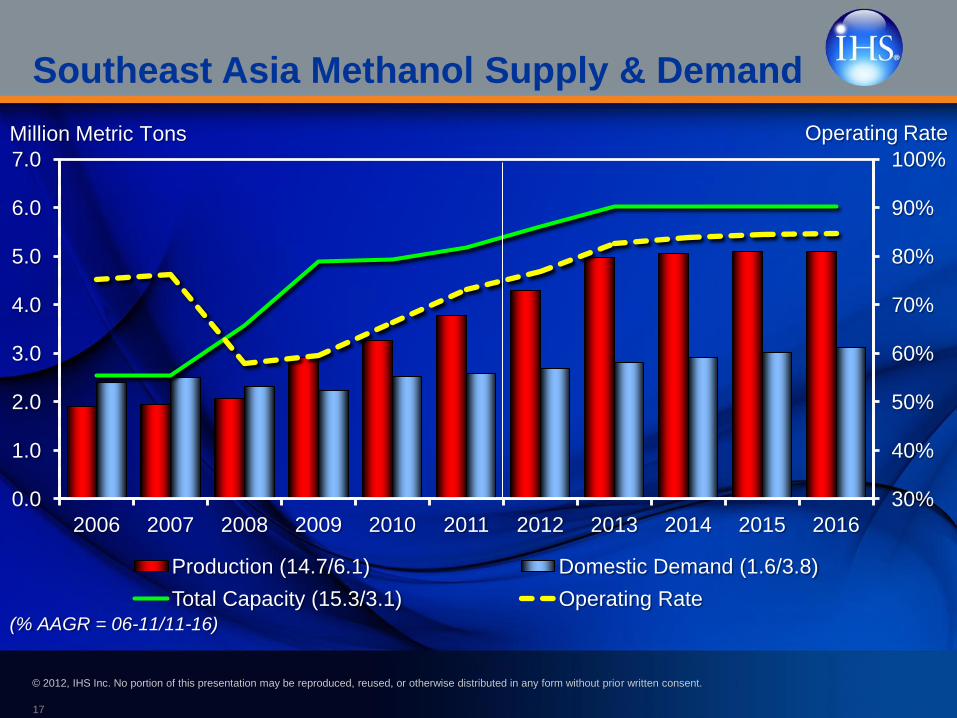
Southeast Asia Methanol Supply & Demand
30%
40%
50%
60%
70%
80%
90%
100%
0.0
1.0
2.0
3.0
4.0
5.0
6.0
7.0
2006 2007 2008 2009 2010 2011 2012 2013 2014 2015 2016
Production (14.7/6.1) Domestic Demand (1.6/3.8)
Total Capacity (15.3/3.1) Operating Rate
Million Metric Tons Operating Rate
(% AAGR = 06-11/11-16)
© 2012, IHS Inc. No portion of this presentation may be reproduced, reused, or otherwise distributed in any form without prior written consent.
18
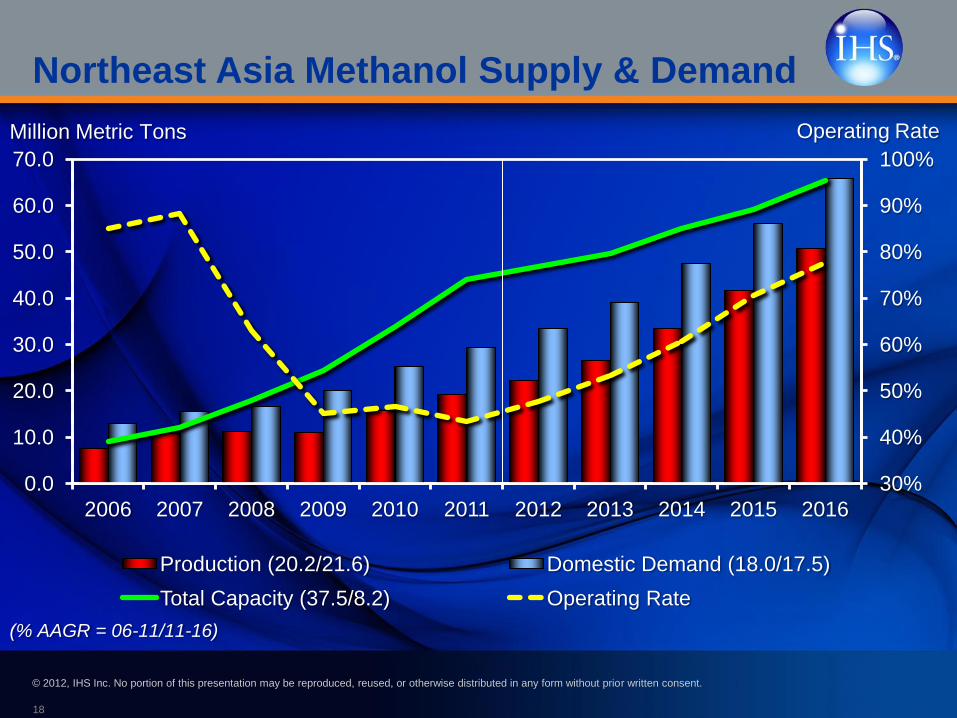
Northeast Asia Methanol Supply & Demand
30%
40%
50%
60%
70%
80%
90%
100%
0.0
10.0
20.0
30.0
40.0
50.0
60.0
70.0
2006 2007 2008 2009 2010 2011 2012 2013 2014 2015 2016
Production (20.2/21.6) Domestic Demand (18.0/17.5)
Total Capacity (37.5/8.2) Operating Rate
Million Metric Tons Operating Rate
(% AAGR = 06-11/11-16)

© 2012, IHS Inc. No portion of this presentation may be reproduced, reused, or otherwise distributed in any form without prior written consent.
Numerous Coal to Olefin Projects Are Coming
Shenhua Baotou
MTO: 600 KTA
On-stream: Aug 2010
Shenhua Ningmei
MTP: 500 KTA
Q2/2011
2nd Phase MTP: 500 KTA
Mid/2014
Datang Intl
MTP: 500 KTA
Q1/2012
Zhongyuan PC
MTO: 200 KTA
On-stream: Oct 2011
Shaanxi Yanchang
MTO: 900 KTA
Mid/2014
Yankuang
MTO: 600 KTA
End 2014
Shanxi Coking
MTO: 600 KTA
End 2014
Sinopec
MTO: 600 KTA
End 2014
Shenhua/Dow JV
Integrated complex
2016
CPI/Total JV
MTO: 800 KTA
2016
Shenhua
MTO: 600 KTA
2016
Yili Meidianhua
MTO: 600 KTA
2016
Yulin Energy & Chem
MTO: 600 KTA
Q2/2013
Pucheng Clean Energy
MTO: 680 KTA
Mid/2013
Zhejiang Heyuan
MTO: 600 KTA
Q1/2013
Wison
MTO: 300 KTA
End 2012
© 2012, IHS Inc. No portion of this presentation may be reproduced, reused, or otherwise distributed in any form without prior written consent.
Americas
© 2012, IHS Inc. No portion of this presentation may be reproduced, reused, or otherwise distributed in any form without prior written consent.
21
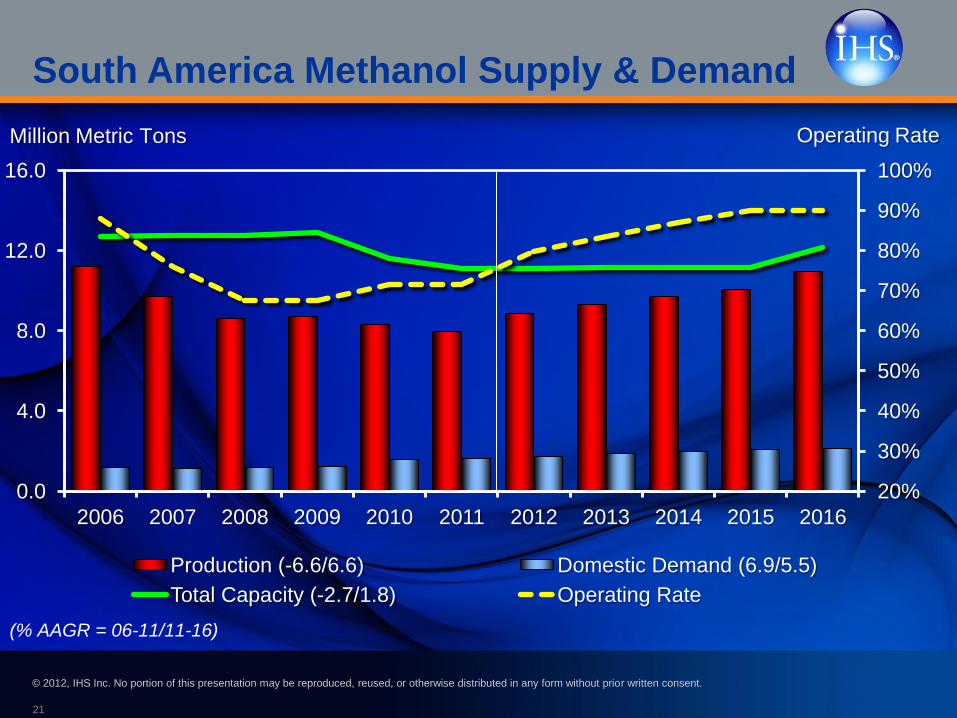
South America Methanol Supply & Demand
20%
30%
40%
50%
60%
70%
80%
90%
100%
0.0
4.0
8.0
12.0
16.0
2006 2007 2008 2009 2010 2011 2012 2013 2014 2015 2016
Production (-6.6/6.6) Domestic Demand (6.9/5.5)
Total Capacity (-2.7/1.8) Operating Rate
Million Metric Tons Operating Rate
(% AAGR = 06-11/11-16)
© 2012, IHS Inc. No portion of this presentation may be reproduced, reused, or otherwise distributed in any form without prior written consent.
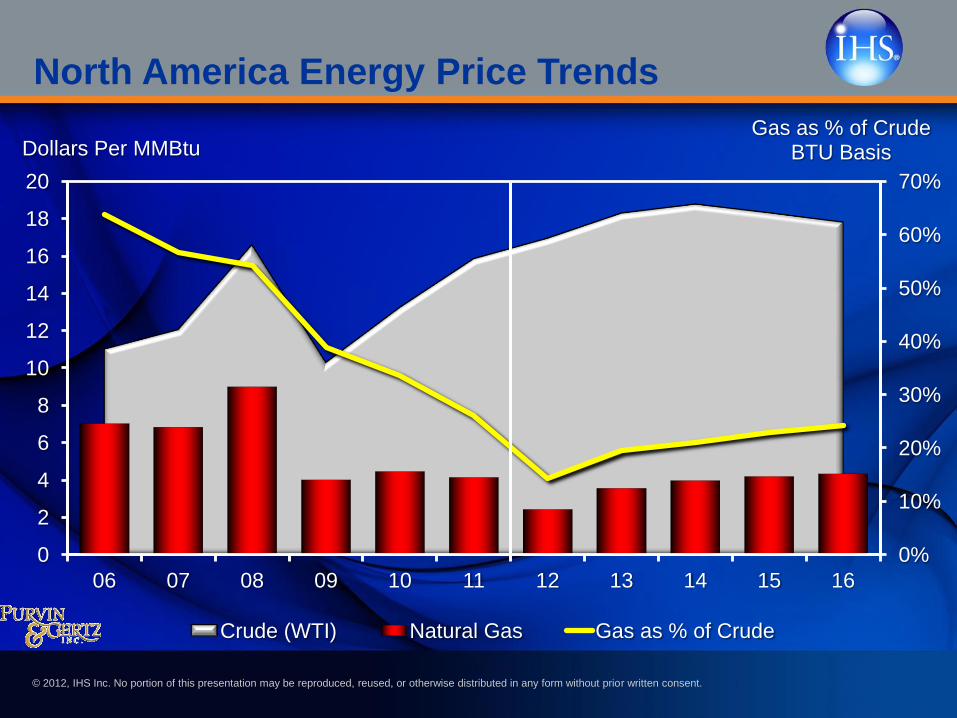
North America Energy Price Trends
0%
10%
20%
30%
40%
50%
60%
70%
0
2
4
6
8
10
12
14
16
18
20
06 07 08 09 10 11 12 13 14 15 16
Gas as % of Crude BTU Basis Dollars Per MMBtu
Crude (WTI) Natural Gas Gas as % of Crude
© 2012, IHS Inc. No portion of this presentation may be reproduced, reused, or otherwise distributed in any form without prior written consent.
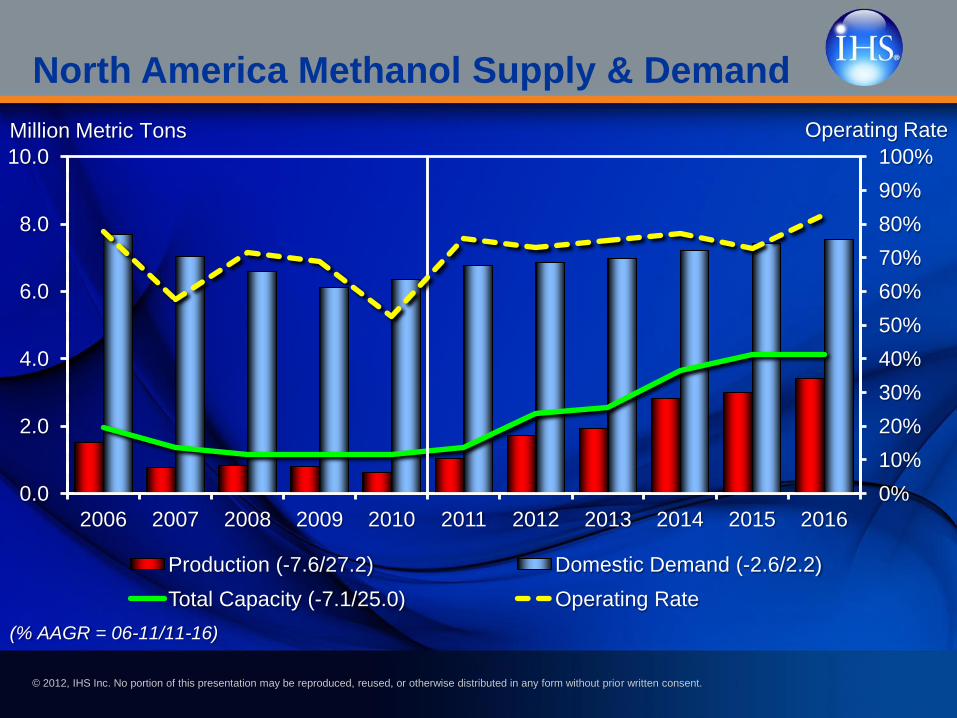
North America Methanol Supply & Demand
0%
10%
20%
30%
40%
50%
60%
70%
80%
90%
100%
0.0
2.0
4.0
6.0
8.0
10.0
2006 2007 2008 2009 2010 2011 2012 2013 2014 2015 2016
Production (-7.6/27.2) Domestic Demand (-2.6/2.2)
Total Capacity (-7.1/25.0) Operating Rate
Million Metric Tons Operating Rate
(% AAGR = 06-11/11-16)
© 2012, IHS Inc. No portion of this presentation may be reproduced, reused, or otherwise distributed in any form without prior written consent.
0%
20%
40%
60%
80%
100%
0
2
4
6
8
10
2006 2007 2008 2009 2010 2011 2012 2013 2014 2015 2016
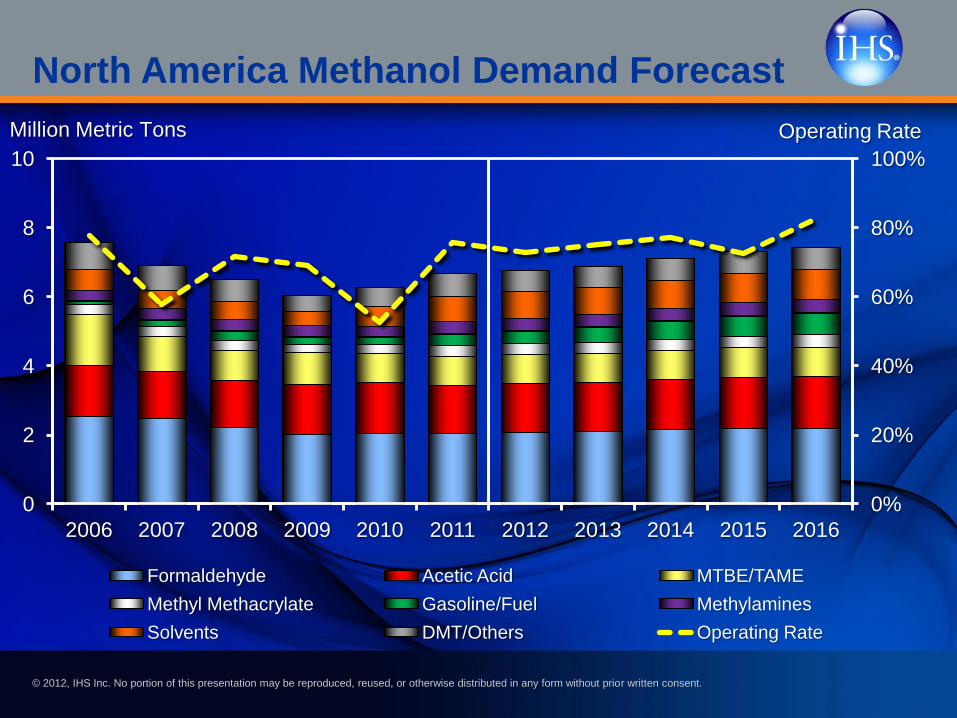
Formaldehyde Acetic Acid MTBE/TAME
Methyl Methacrylate Gasoline/Fuel Methylamines
Solvents DMT/Others Operating Rate
Million Metric Tons Operating Rate
North America Methanol Demand Forecast
© 2012, IHS Inc. No portion of this presentation may be reproduced, reused, or otherwise distributed in any form without prior written consent.
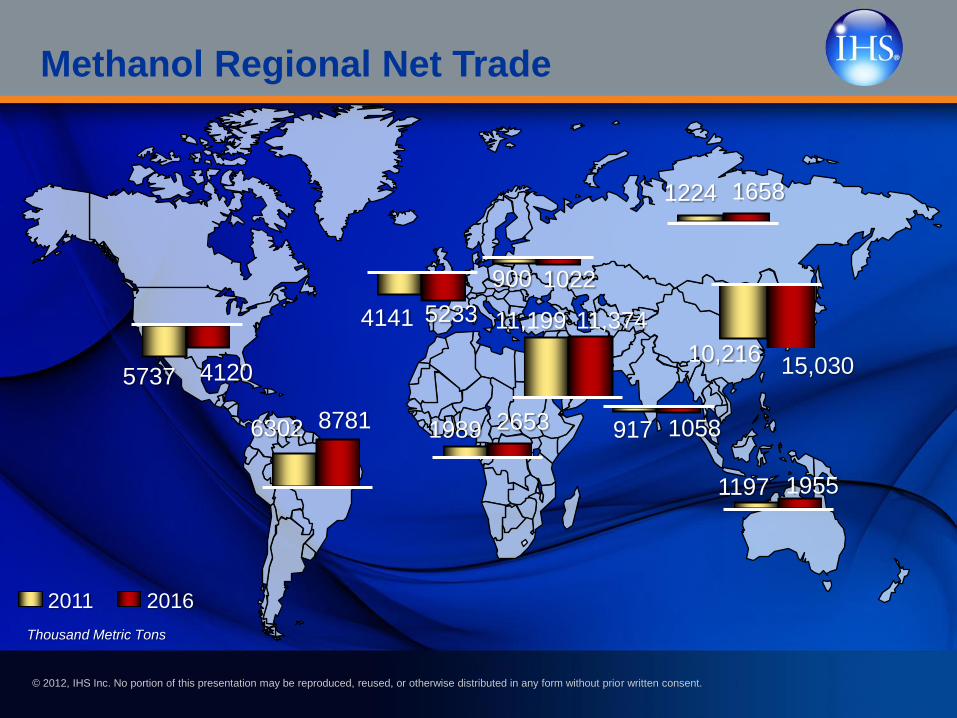
Methanol Regional Net Trade
2011 2016
Thousand Metric Tons
5737 4120
6302 8781 1989 2653
4141 5233
1224 1658
900 1022
11,199 11,374
10,216 15,030
1197 1955
917 1058
© 2012, IHS Inc. No portion of this presentation may be reproduced, reused, or otherwise distributed in any form without prior written consent.
Price
© 2012, IHS Inc. No portion of this presentation may be reproduced, reused, or otherwise distributed in any form without prior written consent.
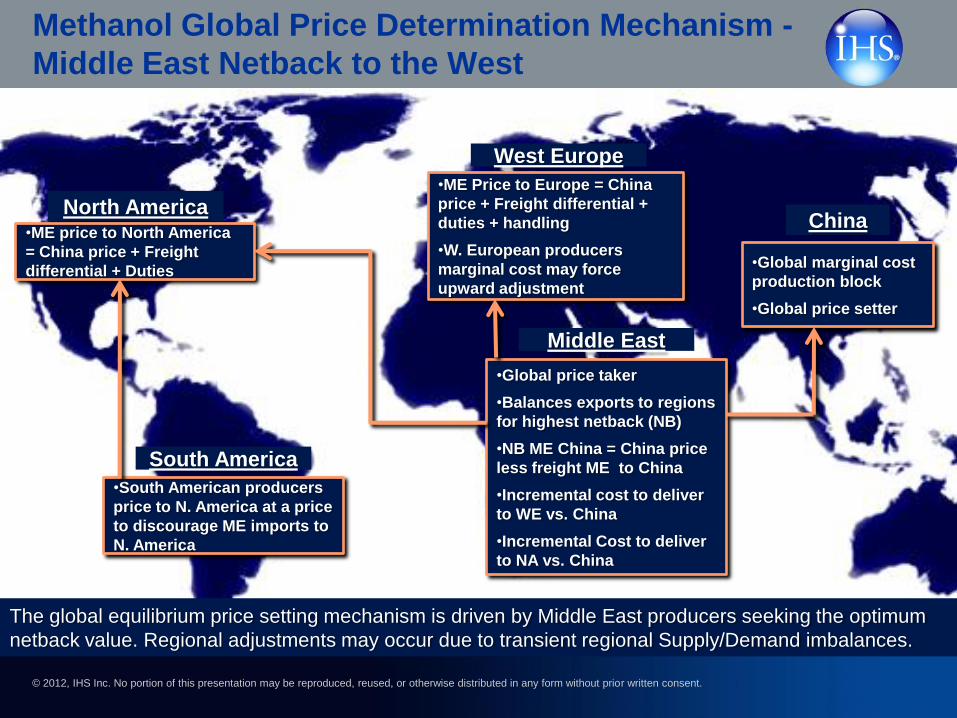
North America •ME price to North America
= China price + Freight
differential + Duties
South America
•South American producers
price to N. America at a price
to discourage ME imports to
N. America
West Europe
•ME Price to Europe = China
price + Freight differential +
duties + handling
•W. European producers
marginal cost may force
upward adjustment
Middle East
•Global price taker
•Balances exports to regions
for highest netback (NB)
•NB ME China = China price
less freight ME to China
•Incremental cost to deliver
to WE vs. China
•Incremental Cost to deliver
to NA vs. China
China
•Global marginal cost
production block
•Global price setter
The global equilibrium price setting mechanism is driven by Middle East producers seeking the optimum
netback value. Regional adjustments may occur due to transient regional Supply/Demand imbalances.
Methanol Global Price Determination Mechanism -
Middle East Netback to the West
© 2012, IHS Inc. No portion of this presentation may be reproduced, reused, or otherwise distributed in any form without prior written consent.
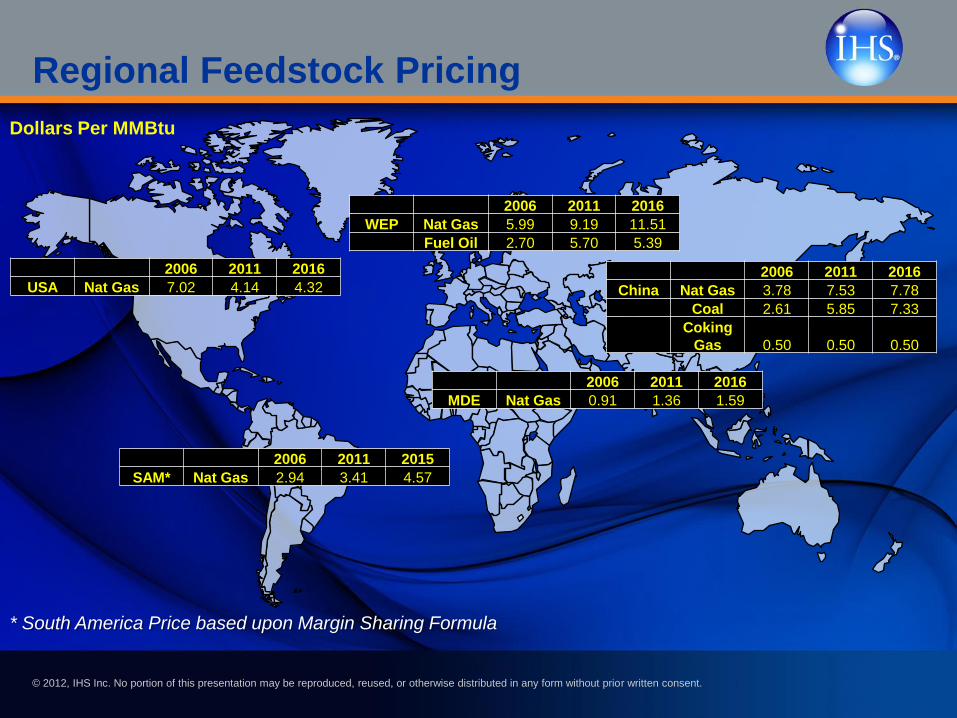
Regional Feedstock Pricing
2006 2011 2016
USA Nat Gas 7.02 4.14 4.32
2006 2011 2015
SAM* Nat Gas 2.94 3.41 4.57
2006 2011 2016
WEP Nat Gas 5.99 9.19 11.51
Fuel Oil 2.70 5.70 5.39
2006 2011 2016
MDE Nat Gas 0.91 1.36 1.59
2006 2011 2016
China Nat Gas 3.78 7.53 7.78
Coal 2.61 5.85 7.33
Coking
Gas 0.50 0.50 0.50
Dollars Per MMBtu
* South America Price based upon Margin Sharing Formula
© 2012, IHS Inc. No portion of this presentation may be reproduced, reused, or otherwise distributed in any form without prior written consent.
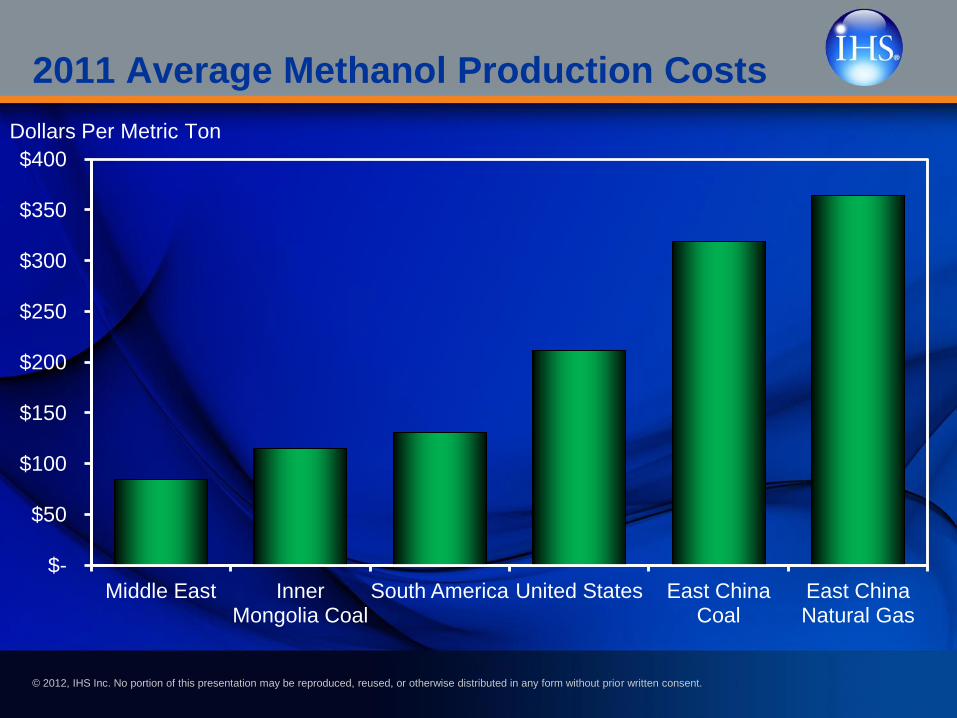
2011 Average Methanol Production Costs
$-
$50
$100
$150
$200
$250
$300
$350
$400
Middle East Inner Mongolia Coal
South America United States East China Coal
East China Natural Gas
Dollars Per Metric Ton
© 2012, IHS Inc. No portion of this presentation may be reproduced, reused, or otherwise distributed in any form without prior written consent.
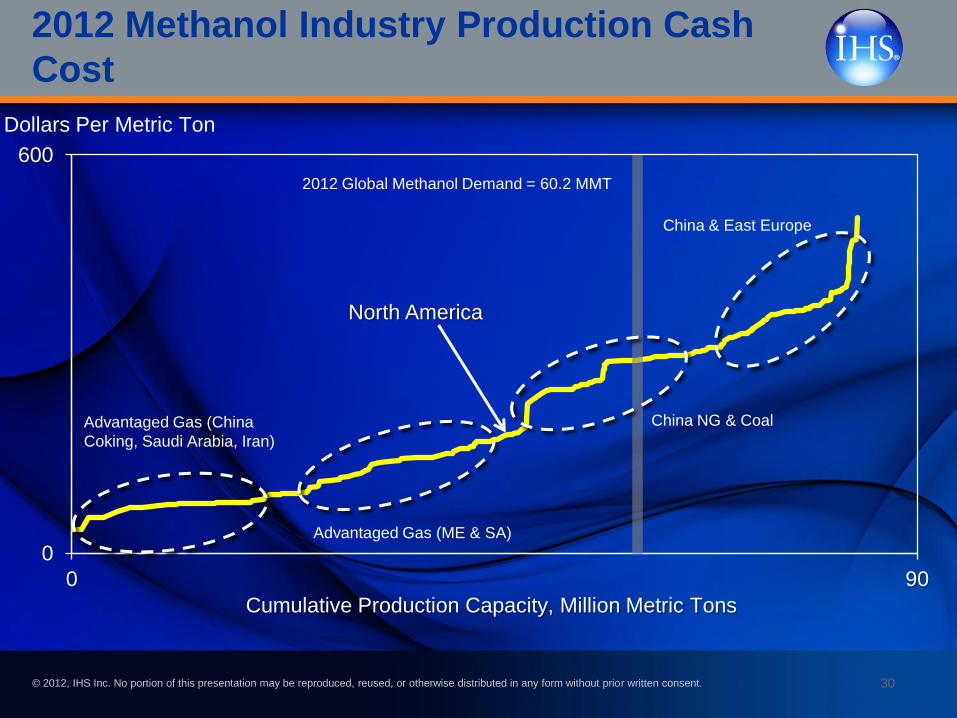
2012 Methanol Industry Production Cash
Cost
30
0
600
0 90
Cumulative Production Capacity, Million Metric Tons
Dollars Per Metric Ton
China & East Europe
China NG & Coal
Advantaged Gas (ME & SA)
Advantaged Gas (China
Coking, Saudi Arabia, Iran)
2012 Global Methanol Demand = 60.2 MMT
North America
© 2012, IHS Inc. No portion of this presentation may be reproduced, reused, or otherwise distributed in any form without prior written consent. 31
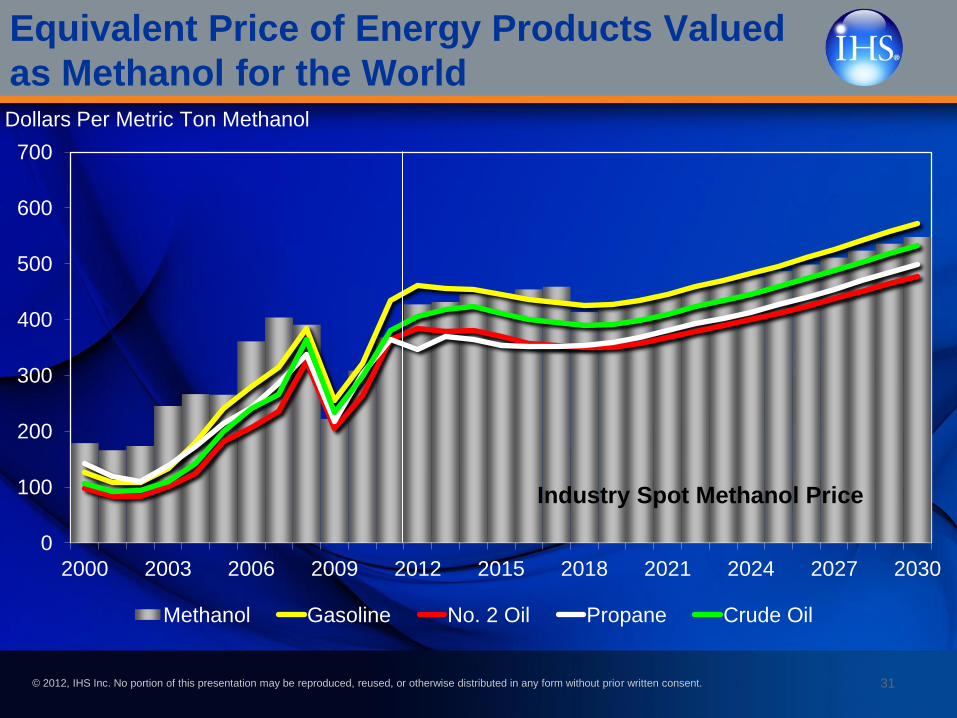
0
100
200
300
400
500
600
700
2000 2003 2006 2009 2012 2015 2018 2021 2024 2027 2030
Methanol Gasoline No. 2 Oil Propane Crude Oil
Industry Spot Methanol Price
Dollars Per Metric Ton Methanol
Equivalent Price of Energy Products Valued
as Methanol for the World
© 2012, IHS Inc. No portion of this presentation may be reproduced, reused, or otherwise distributed in any form without prior written consent. 32
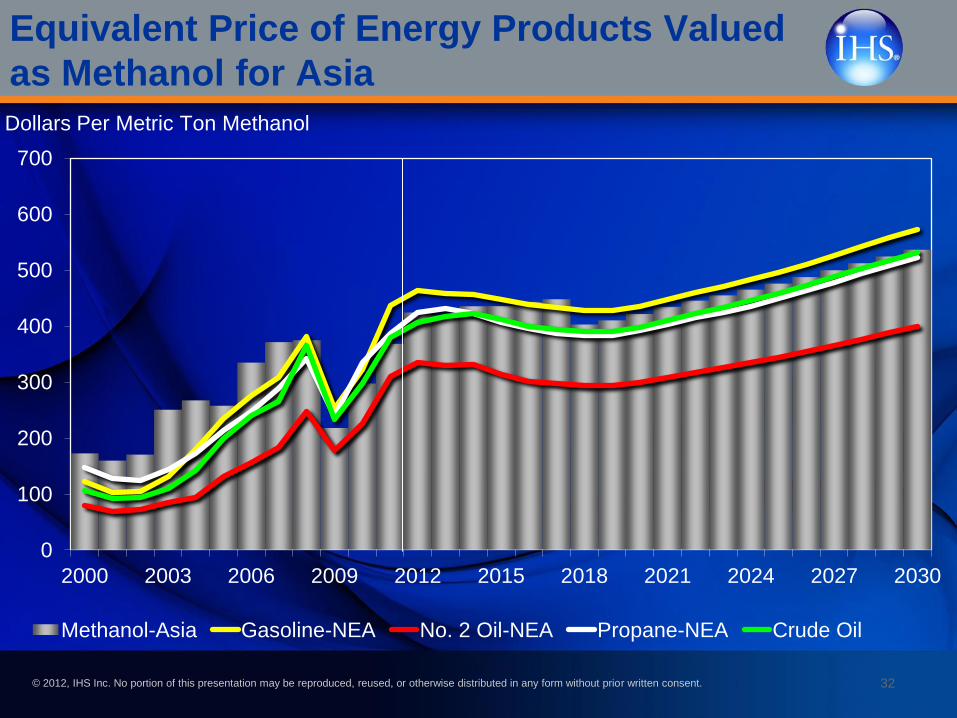
0
100
200
300
400
500
600
700
2000 2003 2006 2009 2012 2015 2018 2021 2024 2027 2030
Methanol-Asia Gasoline-NEA No. 2 Oil-NEA Propane-NEA Crude Oil
Dollars Per Metric Ton Methanol
Equivalent Price of Energy Products Valued
as Methanol for Asia
© 2012, IHS Inc. No portion of this presentation may be reproduced, reused, or otherwise distributed in any form without prior written consent.
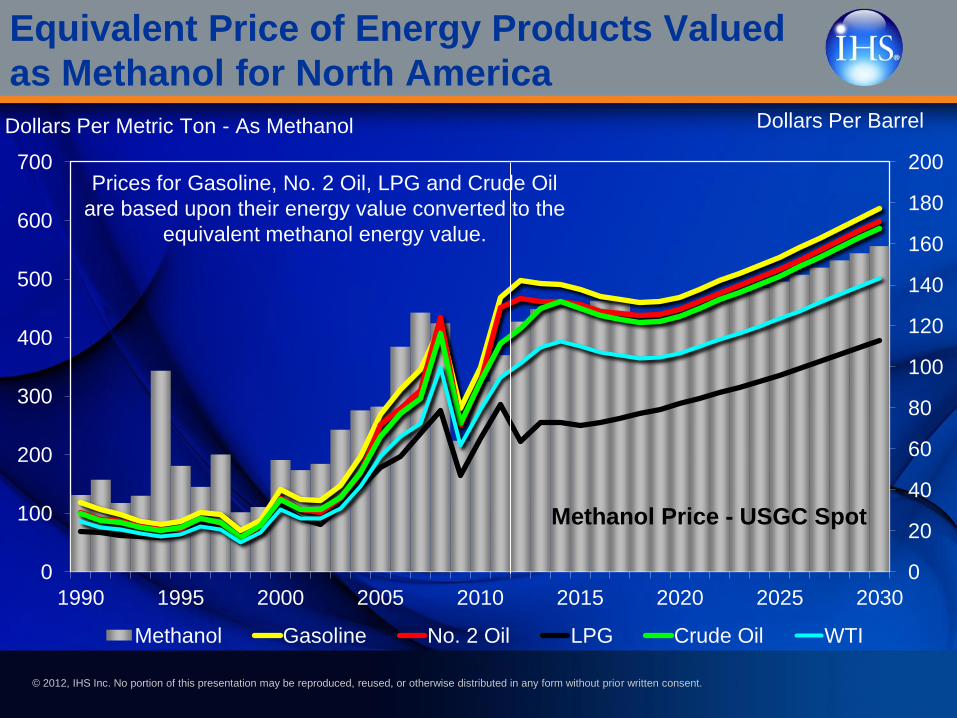
0
20
40
60
80
100
120
140
160
180
200
0
100
200
300
400
500
600
700
1990 1995 2000 2005 2010 2015 2020 2025 2030
Methanol Gasoline No. 2 Oil LPG Crude Oil WTI
Methanol Price - USGC Spot
Dollars Per Barrel Dollars Per Metric Ton - As Methanol
Prices for Gasoline, No. 2 Oil, LPG and Crude Oil
are based upon their energy value converted to the
equivalent methanol energy value.
Equivalent Price of Energy Products Valued
as Methanol for North America
© 2012, IHS Inc. No portion of this presentation may be reproduced, reused, or otherwise distributed in any form without prior written consent.
34
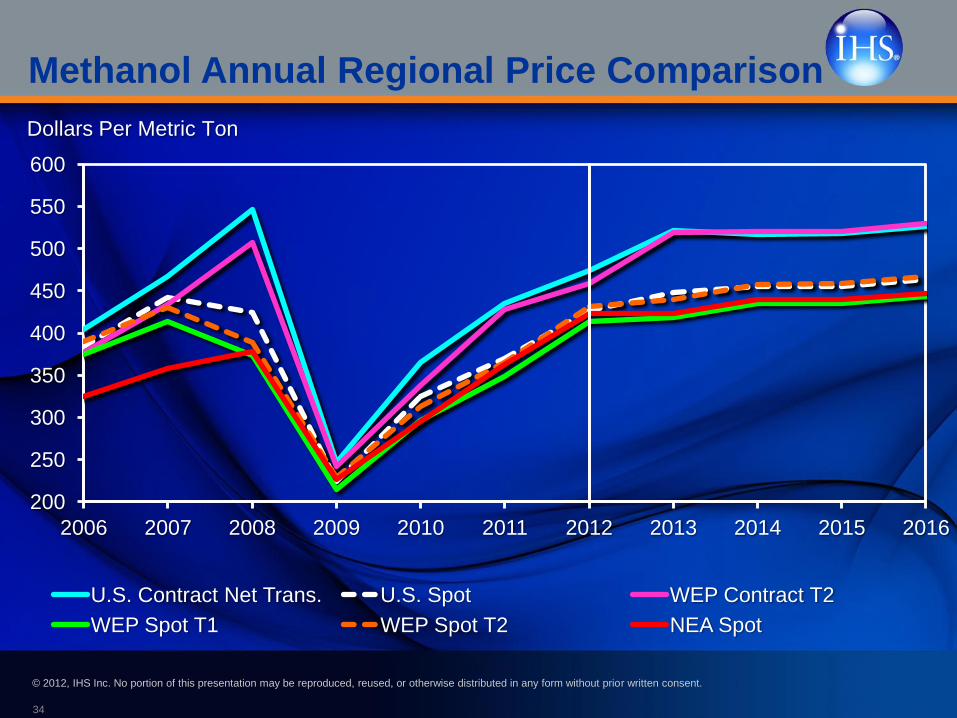
Methanol Annual Regional Price Comparison
200
250
300
350
400
450
500
550
600
2006 2007 2008 2009 2010 2011 2012 2013 2014 2015 2016
U.S. Contract Net Trans. U.S. Spot WEP Contract T2
WEP Spot T1 WEP Spot T2 NEA Spot
Dollars Per Metric Ton
© 2012, IHS Inc. No portion of this presentation may be reproduced, reused, or otherwise distributed in any form without prior written consent.
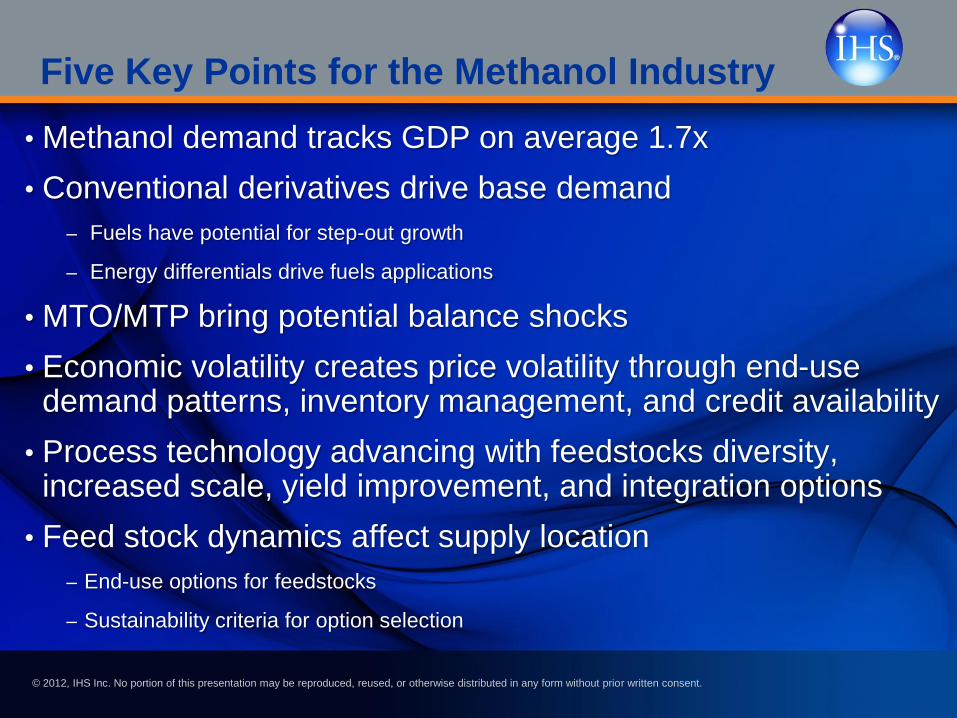
Five Key Points for the Methanol Industry
• Methanol demand tracks GDP on average 1.7x
• Conventional derivatives drive base demand
– Fuels have potential for step-out growth
– Energy differentials drive fuels applications
• MTO/MTP bring potential balance shocks
• Economic volatility creates price volatility through end-use demand patterns, inventory management, and credit availability
• Process technology advancing with feedstocks diversity, increased scale, yield improvement, and integration options
• Feed stock dynamics affect supply location
– End-use options for feedstocks
– Sustainability criteria for option selection
© 2012, IHS Inc. No portion of this presentation may be reproduced, reused, or otherwise distributed in any form without prior written consent. 36
Methanol Derivatives
•Formaldehyde
•Acetyls
© 2012, IHS Inc. No portion of this presentation may be reproduced, reused, or otherwise distributed in any form without prior written consent. 37
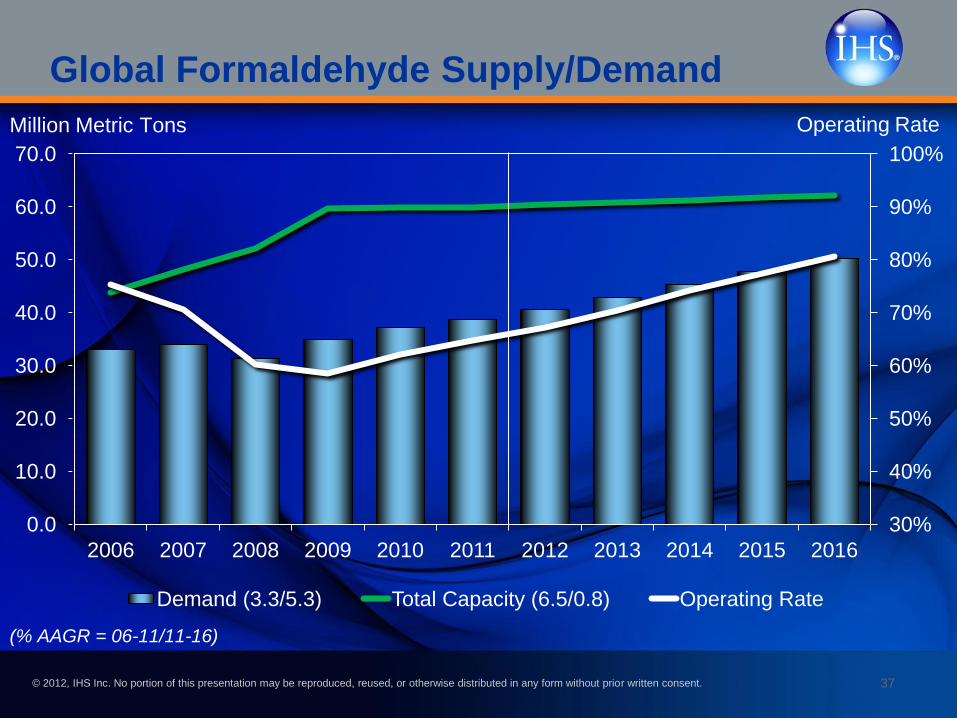
Global Formaldehyde Supply/Demand
30%
40%
50%
60%
70%
80%
90%
100%
0.0
10.0
20.0
30.0
40.0
50.0
60.0
70.0
2006 2007 2008 2009 2010 2011 2012 2013 2014 2015 2016
Demand (3.3/5.3) Total Capacity (6.5/0.8) Operating Rate
Million Metric Tons Operating Rate
(% AAGR = 06-11/11-16)
© 2012, IHS Inc. No portion of this presentation may be reproduced, reused, or otherwise distributed in any form without prior written consent.
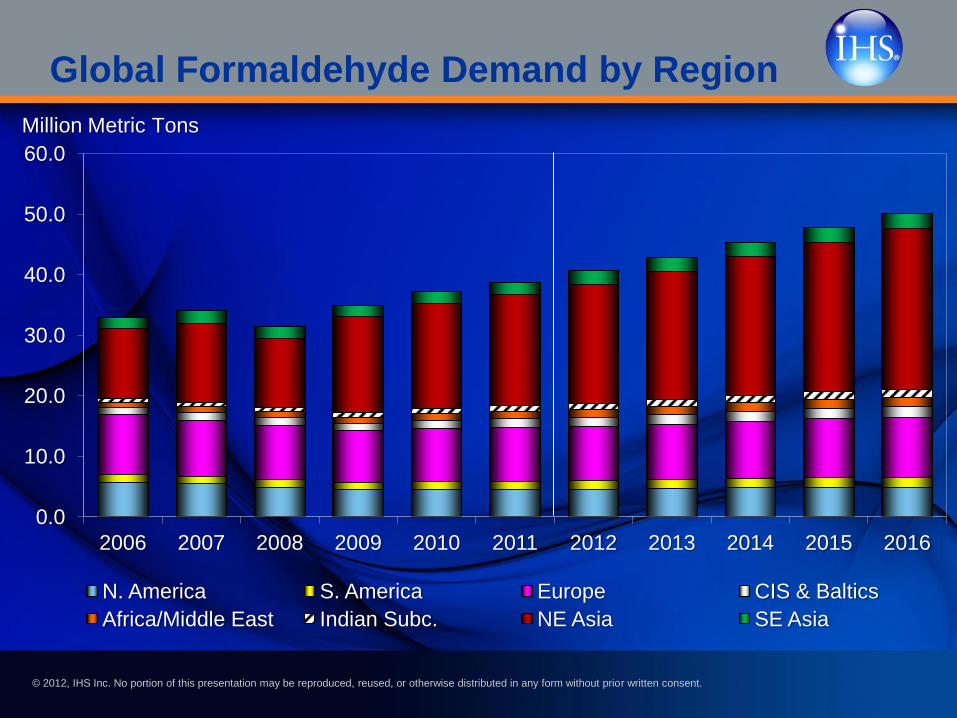
Global Formaldehyde Demand by Region
0.0
10.0
20.0
30.0
40.0
50.0
60.0
2006 2007 2008 2009 2010 2011 2012 2013 2014 2015 2016
N. America S. America Europe CIS & Baltics
Africa/Middle East Indian Subc. NE Asia SE Asia
Million Metric Tons
© 2012, IHS Inc. No portion of this presentation may be reproduced, reused, or otherwise distributed in any form without prior written consent.
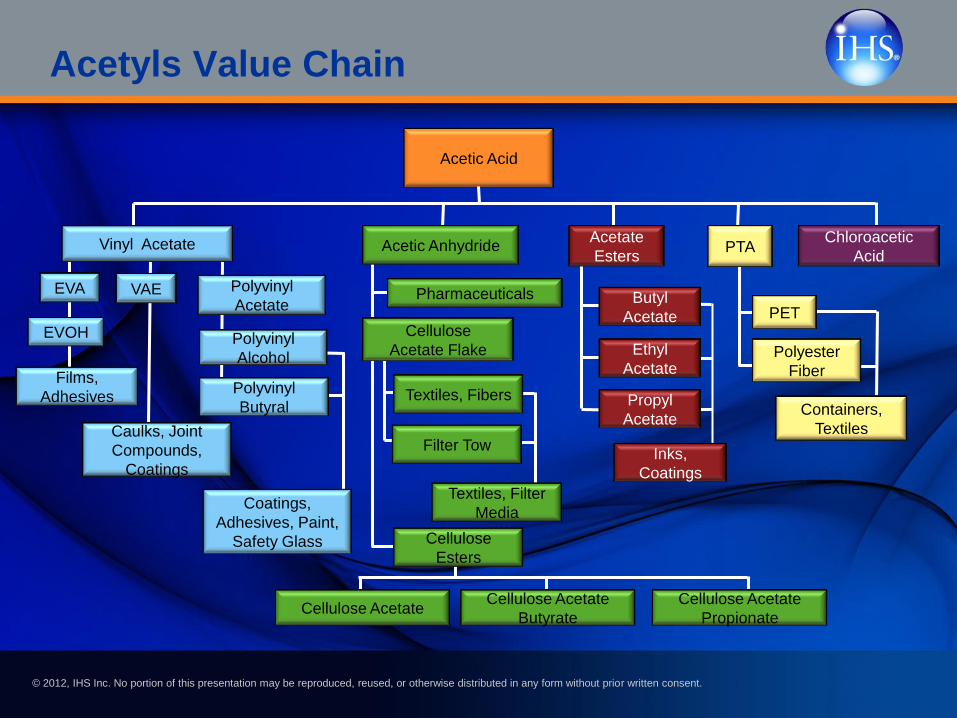
Acetic Acid
EVA VAE
EVOH
Polyvinyl
Acetate
Polyvinyl
Alcohol
Polyvinyl
Butyral
Films,
Adhesives
Caulks, Joint
Compounds,
Coatings
Coatings,
Adhesives, Paint,
Safety Glass
Vinyl Acetate Chloroacetic
Acid
Butyl
Acetate
Ethyl
Acetate
Propyl
Acetate
Inks,
Coatings
Acetate
Esters
PET
Polyester
Fiber
Containers,
Textiles
PTA
Pharmaceuticals
Cellulose
Acetate Flake
Textiles, Fibers
Filter Tow
Textiles, Filter
Media
Acetic Anhydride
Cellulose
Esters
Cellulose Acetate Cellulose Acetate
Butyrate
Cellulose Acetate
Propionate
Acetyls Value Chain
© 2012, IHS Inc. No portion of this presentation may be reproduced, reused, or otherwise distributed in any form without prior written consent.
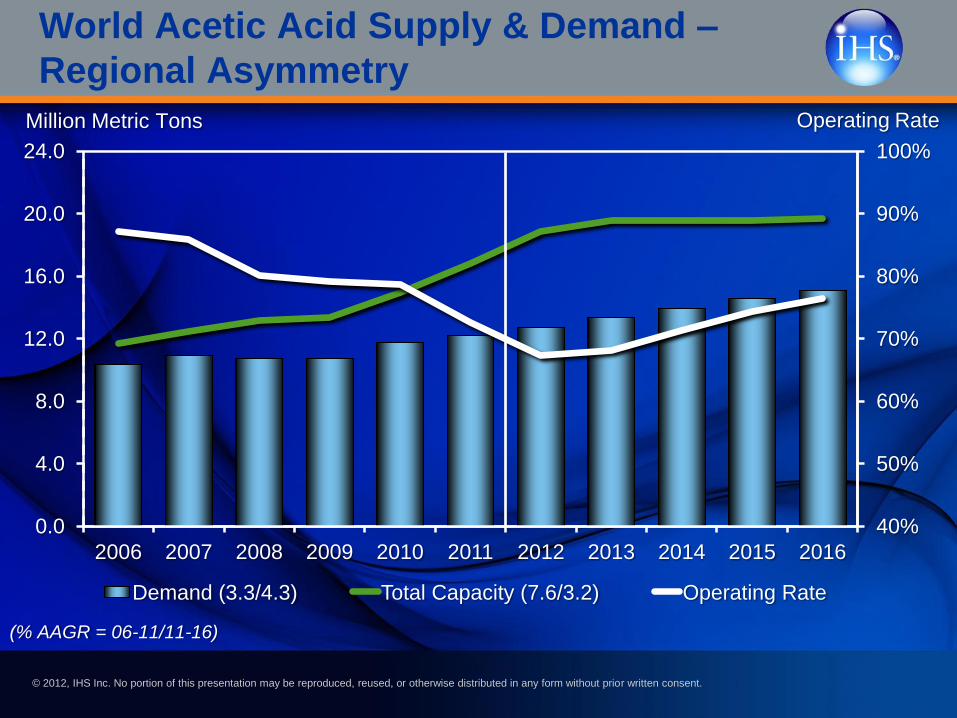
World Acetic Acid Supply & Demand –
Regional Asymmetry
40%
50%
60%
70%
80%
90%
100%
0.0
4.0
8.0
12.0
16.0
20.0
24.0
2006 2007 2008 2009 2010 2011 2012 2013 2014 2015 2016
Demand (3.3/4.3) Total Capacity (7.6/3.2) Operating Rate
Million Metric Tons Operating Rate
(% AAGR = 06-11/11-16)
© 2012, IHS Inc. No portion of this presentation may be reproduced, reused, or otherwise distributed in any form without prior written consent.
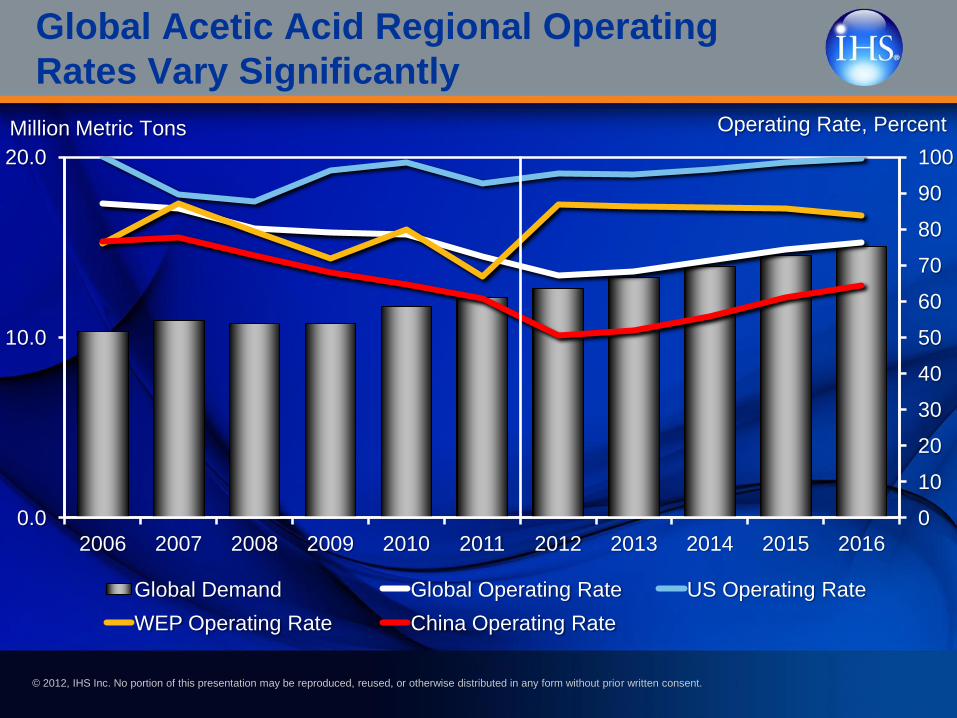
Global Acetic Acid Regional Operating
Rates Vary Significantly
0
10
20
30
40
50
60
70
80
90
100
0.0
10.0
20.0
2006 2007 2008 2009 2010 2011 2012 2013 2014 2015 2016
Global Demand Global Operating Rate US Operating Rate
WEP Operating Rate China Operating Rate
Million Metric Tons Operating Rate, Percent
© 2012, IHS Inc. No portion of this presentation may be reproduced, reused, or otherwise distributed in any form without prior written consent.
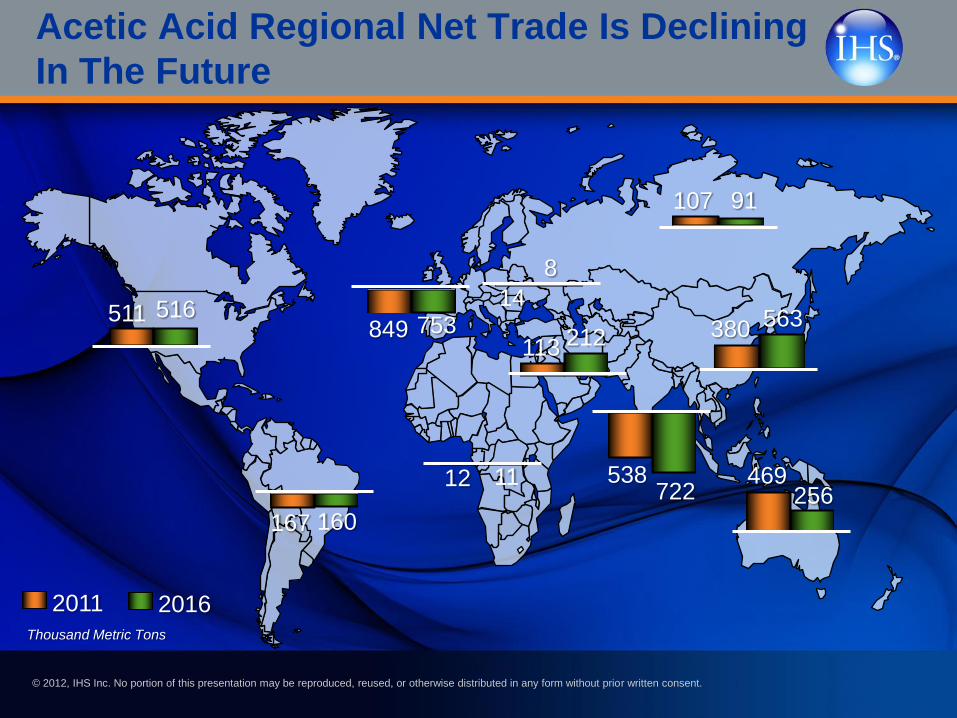
Acetic Acid Regional Net Trade Is Declining
In The Future
2011 2016 Thousand Metric Tons
511 516
167 160
12 11
849 753
107 91
14
8
113 212 380 563
469 256
538 722
© 2012, IHS Inc. No portion of this presentation may be reproduced, reused, or otherwise distributed in any form without prior written consent.
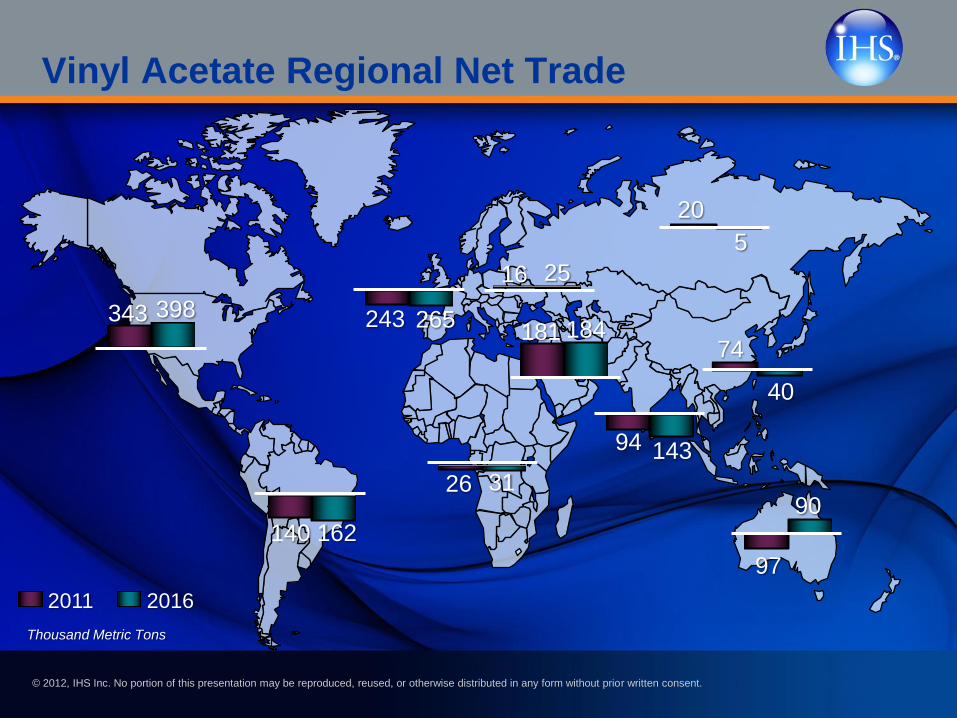
Vinyl Acetate Regional Net Trade
2011 2016
Thousand Metric Tons
343 398
140 162
26 31
243 265
20
5
16 25
181 184 74
40
97
90
94 143

© 2012, IHS Inc. No portion of this presentation may be reproduced, reused, or otherwise distributed in any form without prior written consent.
Acetyls Value Chain-Conclusions
•Acetic Acid & VAM market dynamics driven by: Cost position
Regional discipline.
• Acetyls economics driven by Feedstock position, Scale &
Integration, Technology.
•Methanol will tighten through 2016. Iranian trade position &
feedstock cost shifts will have greatest effects on supply
balance and price.
• Coal to ethanol through acetic acid is a potential growth
engine for the acetyls chain.