Embed Size (px)
Citation preview

ARCHIVE | Criteria | Structured Finance | CDOs:
Global Methodologies And Assumptions ForCorporate Cash Flow And Synthetic CDOsAugust 8, 2016
(Editor's Note: This criteria article is no longer current. It has been superseded by the article titled "Global Methodology AndAssumptions For CLOs And Corporate CDOs," published on June 21, 2019.)
1. S&P Global Ratings is publishing its methodologies and assumptions for rating corporate cashflow and synthetic collateralized debt obligations (CDOs).
2. This criteria addresses the "credit quality of the securitized assets" principle as described in"Principles Of Credit Ratings," published Feb. 16, 2011.
SCOPE OF THE CRITERIA3. This article concerns cash flow CDOs backed by corporate debt (loans and bonds) and synthetic
CDOs that reference pools of corporate obligations. It also applies to CDO transactions that arebacked by corporate assets consisting of a mix of cash and synthetic instruments. Additionally, itis relevant for CDOs of corporate CDOs, and CDOs backed by sovereign securities. For ease ofreference, we refer to these transactions as "corporate CDOs."
4. These criteria do not cover CDOs of structured finance securities, CDOs of mixed pools ofcorporate and structured finance securities that have very small concentrations of corporate debt,CDOs of municipal debt, market value CDOs, and structured counterparties.
5. These criteria apply to all new and existing corporate CDO transactions that containwell-diversified pools of corporate credits and have fairly uniform exposure to all the credits.Exposure refers to a number of parameters affecting the potential performance of the assetportfolio, including asset size, rating distribution, spread/premium distribution, and recoveryprospects.
6. We believe that, in most cases, these criteria address the objectives discussed in paragraph 8.However, particular transactions may call for additional types of stress testing and analysis--forexample, novel or unusual transactions that contain concentrated or "bar-belled" asset portfolios.We may apply these criteria as a starting point for our analysis and will likely make specificmodifications or apply additional stresses according to our evaluation of the structure and theassociated credit risks.
7. Our primary focus is not on any individual input assumption or stress test, but rather on thecombination of assumptions and stresses that, in our opinion, would generate an appropriatetargeted level of credit protection against future defaults.
ARCHIVE | Criteria | Structured Finance | CDOs:
Global Methodologies And Assumptions ForCorporate Cash Flow And Synthetic CDOsAugust 8, 2016
ANALYTICAL MANAGER, U.S. CLOS
Jimmy N Kobylinski
New York
(1) 212-438-6314
ANALYTICAL MANAGER, EUROPEANCLOS
Emanuele Tamburrano
London
(44) 20-7176-3825
ANALYTICAL MANAGER,ASIA-PACIFIC SOUTH/SOUTHEAST
Kate J Thomson
Melbourne
(61) 3-9631-2104
STRUCTURED FINANCE CRITERIASECTOR HEAD
Katrien Van Acoleyen
London
(44) 20-7176-3860
STRUCTURED FINANCE SECTORLEAD
Stephen A Anderberg
New York
(1) 212-438-8991
www.spglobal.com/ratingsdirect August 8, 2016 1
8. We believe that quantitative and qualitative elements in our analysis--apart from the Monte Carlodefault simulations run in Standard & Poor's CDO Evaluator--provide a more robust analysis thanusing only simulation models. We also believe that by calibrating CDO Evaluator to specific"targeted portfolio default rates," we have made it easier and more transparent for investors tounderstand our ratings and analysis and to relate them to their investment objectives.
9. In summary, the criteria include:
- Quantitative and qualitative tests, including certain stress tests, concentration limits, andminimum capital (equity) levels;
- Targeted 'AAA' default rates that we consider are commensurate with conditions of extrememacroeconomic stress, such as, for example, the Great Depression (see "UnderstandingStandard & Poor's Rating Definitions");
- Targeted corporate 'BBB' default rates consistent with the highest actual corporate defaultsthat have occurred since 1981;
- Tiering of recoveries;
- Recovery assumptions based on the expected stress levels for CDO tranches, commensuratewith their ratings;
- Cash flow stress parameters, such as the starting time of defaults and tranche break-evendefault rate (BDR) analysis;
- Credit stability as a consideration in our CDO analysis; and
- Sensitivity to modeling parameters as a consideration in our CDO analysis.
10. In considering a proposed rating for a particular tranche, we look to see whether it passes (i) allapplicable supplemental tests, such as concentration limits and minimum equity, (ii) the standardCDO Evaluator tests, and, if applicable, (iii) the cash flow stresses and additional qualitativeconsiderations included in paragraph 98. Any of these three analyses may constrain the tranche'srating.
11. Additionally, the criteria include the calibration of our CDO Evaluator model to specific targetedstressed default scenarios at each of our rating categories. The criteria also include the assetdefault rates, correlation, and other model parameters to produce asset portfolio default resultsfor 'AAA' rated CDO tranches that reflect conditions that we consider to be of extreme stress, suchas, for example, the Great Depression. Like other securities in the 'AAA' rating category, we believe'AAA' rated corporate CDO tranches should be able to withstand extreme macroeconomic stresswithout defaulting.
12. Finally, the criteria include a scenario analysis to test what effects changes in key portfolioparameters (correlation, recovery, spreads, and default bias) would have on tranche ratings. Thisaspect of the criteria is intended to further address the issue of credit stability (see "Methodology:Credit Stability Criteria," published May 3, 2010) by identifying CDO tranches that exhibit agreater-than-expected effect from parameters other than asset defaults.
13. This paragraph has been deleted.
14. This paragraph has been deleted. See the "Revisions And Updates" section.
www.spglobal.com/ratingsdirect August 8, 2016 2
ARCHIVE | Criteria | Structured Finance | CDOs: Global Methodologies And Assumptions For Corporate Cash Flow And Synthetic CDOs

METHODOLOGY AND ASSUMPTIONS
Supplemental Stress Tests15. The criteria include supplemental tests intended to address both event risk and model risk that
may be present in rated transactions.
16. The first test is a "largest obligor default test." This test assesses whether a CDO tranche hassufficient credit enhancement to withstand specified combinations of underlying asset defaultsbased on the ratings on the underlying assets, with a flat recovery of 5%. For sovereign assets, therecovery rate used to calculate the largest obligor default test is 25%.
17. The second test is a "largest industry default test." This test consists of two parts: the "primarylargest industry default test" and the "alternative largest industry default test." Together, theyassess whether a CDO tranche rated 'AAA', 'AA+', 'AA', or 'AA-' has sufficient credit enhancementto withstand the default of all obligors in the transaction's largest industry, with a flat recovery of17%, or otherwise meet an alternative largest industry default test. Either of the tests may be alimiting factor for our rating on a CDO tranche. The largest industry default test does not apply tosovereign assets.
Applicability of the supplemental tests18. Typically, we run all applicable tests when assessing the rating on a CDO tranche. For example, in
considering a proposed 'AAA' rating, we assess whether the CDO tranche has sufficient creditenhancement to pass the supplemental tests and meet the standards associated with CDOEvaluator and the relevant cash flow stresses.
19. Exceptional circumstances may warrant an adjustment of these supplemental tests. For example,it is possible that small CDO tranche balances and expected tranche amortization profiles maycall for the use of alternative supplemental tests. For these tests we use the same obligor ratingsthat we use in CDO Evaluator. For ease of implementation and transparency, we have programmedthese tests into CDO Evaluator. The tests are separate and distinct from the Monte Carlosimulation of defaults and, as such, we refer to them as supplemental tests.
Table 1
Largest Obligor Default Test
Event risk test: Survive a number of defaults with 5% recoveries (25% for sovereign assets)
CDO liability rating*
Obligor rating AAA AA A BBB BB B CCC
'AAA' to 'CCC-' 2 1 - - - - -
'AA+' to 'CCC-' 3 2 1 - - - -
'A+' to 'CCC-' 4 3 2 1 - - -
'BBB+' to 'CCC-' 6 4 3 2 1 - -
'BB+' to 'CCC-' 8 6 4 3 2 1 -
'B+' to 'CCC-' 10 8 6 4 3 2 1
www.spglobal.com/ratingsdirect August 8, 2016 3
ARCHIVE | Criteria | Structured Finance | CDOs: Global Methodologies And Assumptions For Corporate Cash Flow And Synthetic CDOs
Table 1
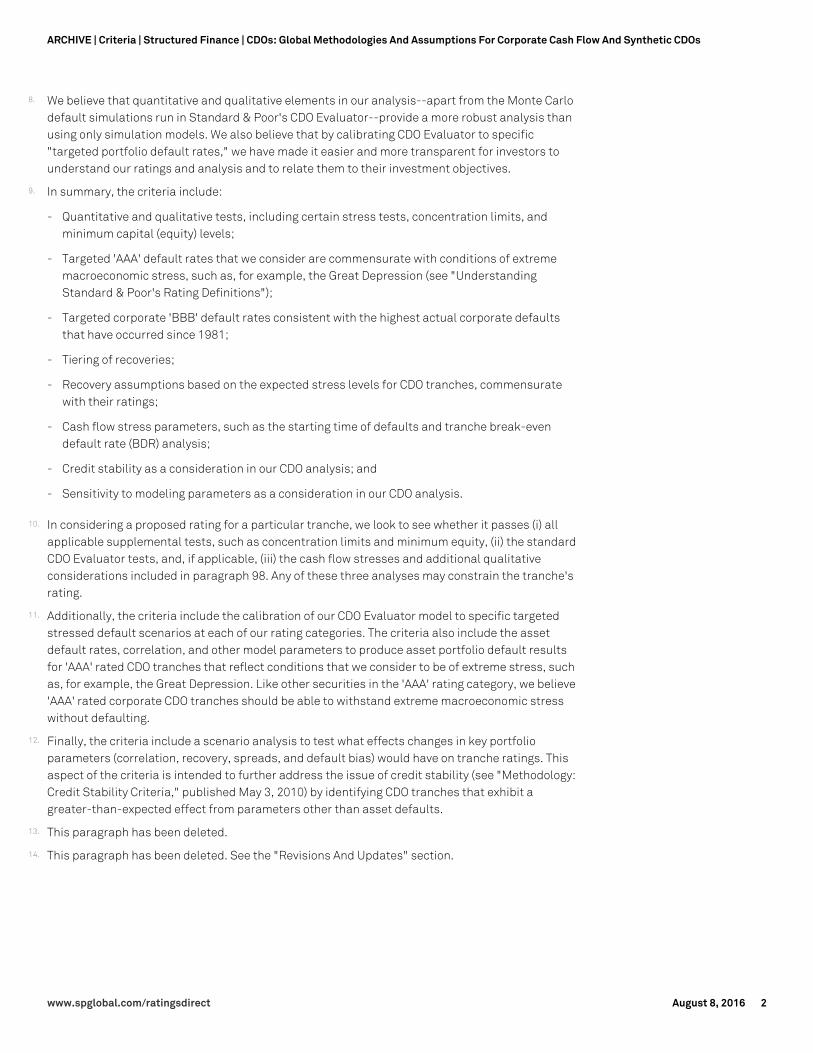
Largest Obligor Default Test (cont.)
Event risk test: Survive a number of defaults with 5% recoveries (25% for sovereign assets)
CDO liability rating*
Obligor rating AAA AA A BBB BB B CCC
'CCC+' to 'CCC-' 12 10 8 6 4 3 2
*In all tables used throughout this article, unless otherwise noted, CDO tranche or liability rating categories below 'AAA' include ratingsubcategories, e.g., the 'AA' column also applies to CDO tranches rated 'AA+' and 'AA-'.
20. For example, under our criteria, a 'AAA' rated tranche should have sufficient credit enhancementto survive the highest level of losses associated with the defaults of each of the followingcombinations of underlying obligors, assuming 5% recovery (for sovereign assets, the recoveryrate used for the purpose of this test is 25%):
- The two largest obligors rated between 'AAA' and 'CCC-';
- The three largest obligors rated between 'AA+' and 'CCC-';
- The four largest obligors rated between 'A+' and 'CCC-';
- The six largest obligors rated between 'BBB+' and 'CCC-';
- The eight largest obligors rated between 'BB+' and 'CCC-';
- The 10 largest obligors rated between 'B+' and 'CCC-'; and
- The 12 largest obligors rated between 'CCC+' and 'CCC-'.
21. For transactions that employ excess spread, we typically apply this test by running our cash flowmodeling using the forward interest rate curve, including the highest of the losses from the largestobligor default test net of their respective recoveries. We deem the test to have passed if cashflows show that the tranche that is subject to the test receives timely interest (or full interest, ifthe tranche is deferrable) and ultimate principal payments.
22. For transactions that allocate principal pro rata, the default rate derived from the application ofthe largest obligor or industry tests may be applied at different times during the life of thetransaction on a prospective basis.
23. For transactions that do not employ excess spread, such as synthetic CDOs, we consider whetherthe attachment point is set sufficiently high to allow the highest losses from the obligor testwithout breaching the rated tranche's loss attachment point.
24. For this test, the criteria deem all assets rated below 'CCC-' and still included in the CDO assetpool to be defaulted. Also, under these criteria, the value we assume for defaulted assets alreadyheld by the CDO is the lower of the recovery value shown in table 10, or in table 11 if the assetshave a recovery rating, or the current market value. For defaulted synthetic reference obligors, thevalue we assume is the respective recovery value shown in table 10 until the actual recoveries aredetermined through the International Swaps and Derivatives Association (ISDA) protocol or theapplicable valuation mechanism detailed in the transaction's documents. If the transactiondocuments specify fixed recoveries, we use the fixed recovery amounts.
25. If looking at a 'BBB' tranche rating, the tranche should have sufficient credit enhancement tosurvive the highest losses associated with the defaults of each of the following combinations ofunderlying obligors, assuming 5% recovery (25% for sovereign assets):
- The largest obligor rated between 'A+' and 'CCC-';
www.spglobal.com/ratingsdirect August 8, 2016 4
ARCHIVE | Criteria | Structured Finance | CDOs: Global Methodologies And Assumptions For Corporate Cash Flow And Synthetic CDOs
- The two largest obligors rated between 'BBB+' and 'CCC-';
- The three largest obligors rated between 'BB+' and 'CCC-';
- The four largest obligors rated between 'B+' and 'CCC-'; and
- The six largest obligors rated between 'CCC+' and 'CCC-'.
26. Because this test specifically attempts to capture event risk not addressed by the Monte Carlodefault simulation in CDO Evaluator, we have deliberately included defaults of assets rated higherthan the issuer's target rating on a CDO tranche. The larger the numbers of assets, the more likelyit is that defaults of highly rated assets may occur. This test applies to transactions that hadactual asset pools purchased at closing, as well as transactions with proposed asset pools thatramp up--or acquire new assets--after closing. Appendix A presents an example of how this testworks.
27. In these criteria, the term "obligor" includes entities to which the CDO has direct exposure either (i)in the asset pool or (ii) as a third party. Direct third-party risk may exist where a default by a thirdparty could cause a CDO to suffer a direct loss. For example, a CDO might allow 5% loanparticipations with a financial intermediary where the intermediary is not obligated to postcollateral or replace itself on a rating downgrade. In participations, the intermediary retains thelegal title to the subject loan, but transfers an economic interest to the CDO. In this case, thecriteria treat the entire 5% to be an exposure to one obligor, because if the intermediary defaults,the CDO's rights in the loan could be impaired.
28. The criteria apply the same treatment to similar types of exposures, including unhedged orunmodeled emerging markets sovereign risk, uncollateralized securities lending, and any otherrisks where an intermediary's default could impair the performance of the asset or the CDO'srights in the asset. If, in our view, the trustees' information on how much direct third-partyexposure exists in the portfolio isn't clear, we ask the trustee and the collateral manager for thisinformation. If this is not provided, we use the maximum concentrations allowed as per thetransaction documents.
Largest industry default test29. Corporate CDO tranches rated 'AAA' or 'AA' should be able to withstand the default of all obligors
in the largest single industry in the asset pool with 17% recoveries. For this test we use the sameindustry classification as used in CDO Evaluator. For example, assume a transaction has a 12%concentration in the largest industry. Under the test, a tranche rated 'AAA', 'AA+', 'AA', or 'AA-' insuch a transaction should have sufficient credit enhancement to survive the default of 9.96%(12% industry concentration * [1-17% recovery]) of the asset pool. This is even if the CDOEvaluator simulation model indicates that a lower level of credit enhancement would be sufficient.
30. The 17% assumption is the same recovery we assign to senior secured debt from Group Ccountries (see the "Asset Recovery Assumptions" section later in this article). This test applies ahigher recovery assumption than the largest obligor default test because recoveries across awhole industry imply an averaging effect. So, industrywide recoveries are necessarily higher thanthe lowest recovery within the group.
31. Although defaults of all companies in a given industry would be extremely unlikely, that is notrelevant for the test in CDOs. It is important to highlight that actual CDO transactions do not haveexposures to all the companies from any given industry, but rather just to a more concentratedsubset of companies from each industry. Thus, it is within the realm of possibility that when anindustry experiences stress, all the members of that industry represented in a given CDO may face
www.spglobal.com/ratingsdirect August 8, 2016 5
ARCHIVE | Criteria | Structured Finance | CDOs: Global Methodologies And Assumptions For Corporate Cash Flow And Synthetic CDOs
higher stresses.
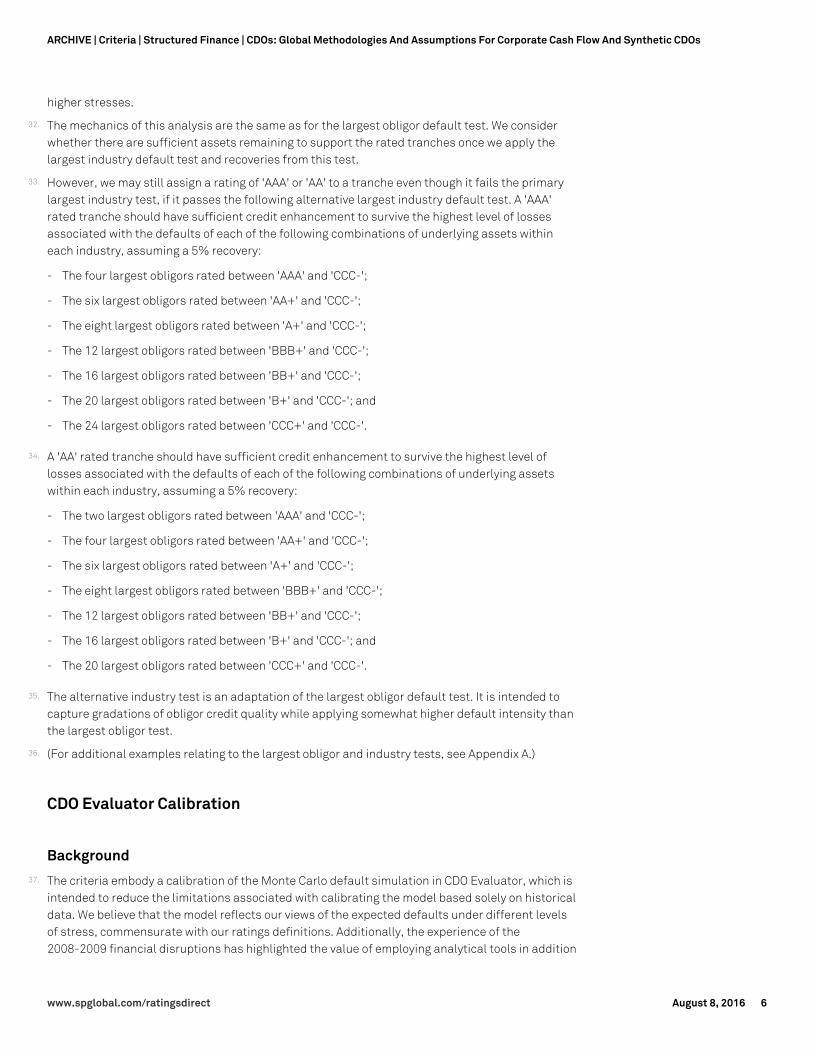
32. The mechanics of this analysis are the same as for the largest obligor default test. We considerwhether there are sufficient assets remaining to support the rated tranches once we apply thelargest industry default test and recoveries from this test.
33. However, we may still assign a rating of 'AAA' or 'AA' to a tranche even though it fails the primarylargest industry test, if it passes the following alternative largest industry default test. A 'AAA'rated tranche should have sufficient credit enhancement to survive the highest level of lossesassociated with the defaults of each of the following combinations of underlying assets withineach industry, assuming a 5% recovery:
- The four largest obligors rated between 'AAA' and 'CCC-';
- The six largest obligors rated between 'AA+' and 'CCC-';
- The eight largest obligors rated between 'A+' and 'CCC-';
- The 12 largest obligors rated between 'BBB+' and 'CCC-';
- The 16 largest obligors rated between 'BB+' and 'CCC-';
- The 20 largest obligors rated between 'B+' and 'CCC-'; and
- The 24 largest obligors rated between 'CCC+' and 'CCC-'.
34. A 'AA' rated tranche should have sufficient credit enhancement to survive the highest level oflosses associated with the defaults of each of the following combinations of underlying assetswithin each industry, assuming a 5% recovery:
- The two largest obligors rated between 'AAA' and 'CCC-';
- The four largest obligors rated between 'AA+' and 'CCC-';
- The six largest obligors rated between 'A+' and 'CCC-';
- The eight largest obligors rated between 'BBB+' and 'CCC-';
- The 12 largest obligors rated between 'BB+' and 'CCC-';
- The 16 largest obligors rated between 'B+' and 'CCC-'; and
- The 20 largest obligors rated between 'CCC+' and 'CCC-'.
35. The alternative industry test is an adaptation of the largest obligor default test. It is intended tocapture gradations of obligor credit quality while applying somewhat higher default intensity thanthe largest obligor test.
36. (For additional examples relating to the largest obligor and industry tests, see Appendix A.)
CDO Evaluator Calibration
Background37. The criteria embody a calibration of the Monte Carlo default simulation in CDO Evaluator, which is
intended to reduce the limitations associated with calibrating the model based solely on historicaldata. We believe that the model reflects our views of the expected defaults under different levelsof stress, commensurate with our ratings definitions. Additionally, the experience of the2008-2009 financial disruptions has highlighted the value of employing analytical tools in addition
www.spglobal.com/ratingsdirect August 8, 2016 6
ARCHIVE | Criteria | Structured Finance | CDOs: Global Methodologies And Assumptions For Corporate Cash Flow And Synthetic CDOs

to Gaussian copula models (see "How A Formula Ignited Market That Burned Some Big Investors,"M. Whitehouse, Wall Street Journal, p. A1 (Sept. 12, 2005)(http://www.nowandfutures.com/download/credit_default_swaps_WSJ_news20050912.pdf) and"Testing The Gaussian Copula Hypothesis For Financial Assets Dependences," Y. Malevergne andD. Sornette, University of California (Nov. 16, 2001) (https://hal.inria.fr/hal-00520539/document).We are sensitive to the possibility that any model may not fully capture real-world dynamics as ittransforms input variables into outputs, especially since individual CDOs contain only a subset ofthe obligors from the rated corporate universe. In the process of moving from inputs to outputs, amodel can lose some realism because of its imperfect ability to reproduce the nuance of the realworld. As such, in deciding to continue to use such a model in our corporate CDO analysis, wefocused on recalibrating the CDO Evaluator model to produce output results as close as possibleto our view of what the real-world results would likely be at each rating stress level.
38. The actual process of calibrating CDO Evaluator, therefore, started with the construction of a tableof minimum targeted portfolio default rates that 'AAA' rated CDO tranches should, in our opinion,be able to withstand over various time horizons, supported by underlying pools of assets ofuniform credit quality and having the widest possible diversification. The table of targetedportfolio default rates functions as the desired output of the model. As such, it also influencessome level of adjustments to the model inputs beyond the historically observed parameters. Byallowing us to adjust input values that produce the targeted results through the Gaussian copulaframework, we reduce the dependence of our analysis on the modeled inputs. The outputexpresses our view of likely outcome, regardless of the modeling framework. Before discussing thecalibration, it is important to highlight that we do not ascribe "default probabilities" to each ratingcategory. Rather, our credit ratings express a relative ranking of creditworthiness and mayencompass not only relative likelihood of default but also payment priorities, recoveries, creditstability, and additional stress factors. However, for modeling purposes, we sometimes use thesomewhat artificial and simplifying assumption that each rating category has a specificassociated default probability.
39. The first consideration in establishing the targeted default table was an analysis of S&P GlobalRatings' CreditPro database of corporate defaults since 1981 (see Appendix D for an explanationof the methodology used to compute defaults). From the CreditPro database (for the U.S., Canada,Western Europe, Australia, and New Zealand), we extracted the maximum observed default ratesfor different rating categories over varying time horizons (see table 2). Comparing the default ratesof corporate credits rated in different rating categories, according to our CreditPro data, weobserved that 'BBB' has historically been the cusp category: Corporate obligations rated lower hadmuch higher default rates and those rated higher had significantly lower default rates. We alsonoted two distinct waves of default of 'BBB' rated corporate credits, one in the wake of the 1982recession and one in the wake of the early 2000s tech bubble and corporate governance scandals.Accordingly, we concluded that for corporate credits, the worst observed performance since 1981generally represents a 'BBB' level of stress for the purposes of our CDO criteria, meaning that, ingeneral, we expect 'BBB' rated CDO issuers or issues to withstand this stress without defaulting.
40. This is consistent with our view of corresponding stress levels across different recessions andfinancial crises. Since the early 1980s, there have been the 1982 recession in the U.S., the 1989Japanese bubble, the early 1990s U.K. recession, and the early 1990s Nordic banking crisis, eachof which, in our view, is generally commensurate with a 'BBB' stress level for corporate CDOs (see"Understanding Standard & Poor's Rating Definitions" for additional details). Therefore, ourtargeted default table for the 'A' stress would have to reflect somewhat higher default rates, onefor the 'AA' stress would have to reflect substantially higher default rates, and one for the 'AAA'stress would have to reflect still higher default rates than observed since 1981. While forcorporate CDOs we view the worst observed corporate default levels as representing a 'BBB'
www.spglobal.com/ratingsdirect August 8, 2016 7
ARCHIVE | Criteria | Structured Finance | CDOs: Global Methodologies And Assumptions For Corporate Cash Flow And Synthetic CDOs
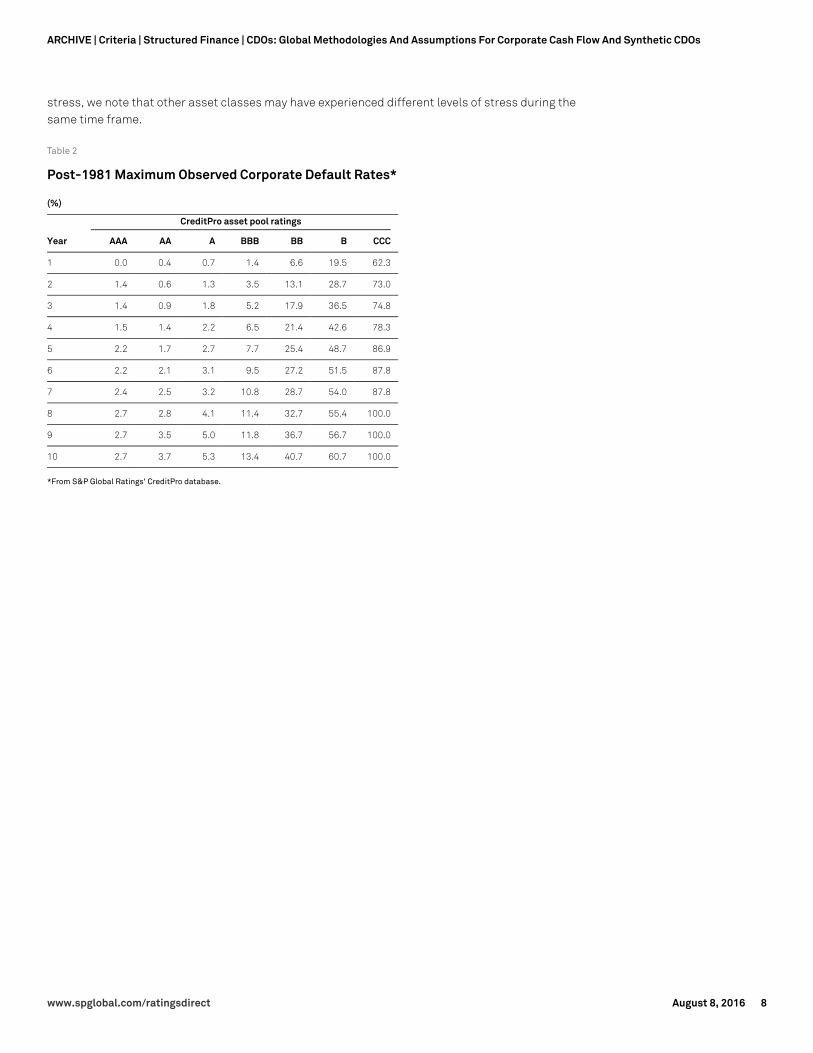
stress, we note that other asset classes may have experienced different levels of stress during thesame time frame.
Table 2
Post-1981 Maximum Observed Corporate Default Rates*
(%)
CreditPro asset pool ratings
Year AAA AA A BBB BB B CCC
1 0.0 0.4 0.7 1.4 6.6 19.5 62.3
2 1.4 0.6 1.3 3.5 13.1 28.7 73.0
3 1.4 0.9 1.8 5.2 17.9 36.5 74.8
4 1.5 1.4 2.2 6.5 21.4 42.6 78.3
5 2.2 1.7 2.7 7.7 25.4 48.7 86.9
6 2.2 2.1 3.1 9.5 27.2 51.5 87.8
7 2.4 2.5 3.2 10.8 28.7 54.0 87.8
8 2.7 2.8 4.1 11.4 32.7 55.4 100.0
9 2.7 3.5 5.0 11.8 36.7 56.7 100.0
10 2.7 3.7 5.3 13.4 40.7 60.7 100.0
*From S&P Global Ratings' CreditPro database.
www.spglobal.com/ratingsdirect August 8, 2016 8
ARCHIVE | Criteria | Structured Finance | CDOs: Global Methodologies And Assumptions For Corporate Cash Flow And Synthetic CDOs
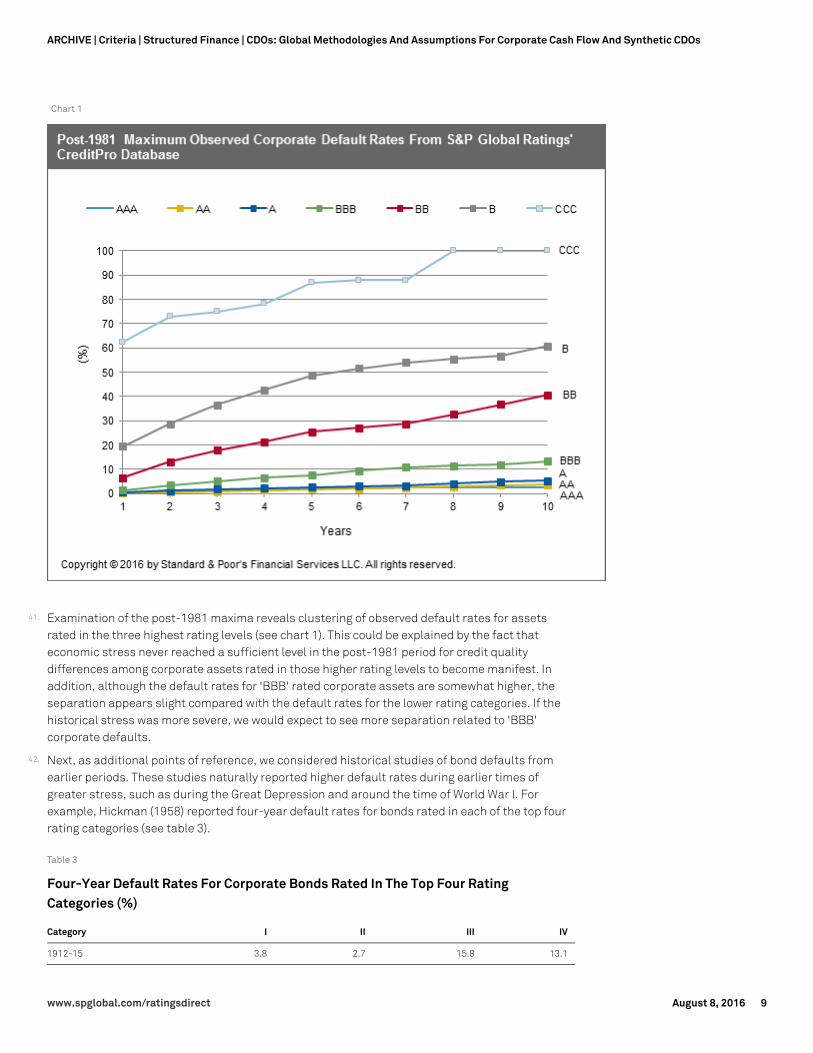
Chart 1
41. Examination of the post-1981 maxima reveals clustering of observed default rates for assetsrated in the three highest rating levels (see chart 1). This could be explained by the fact thateconomic stress never reached a sufficient level in the post-1981 period for credit qualitydifferences among corporate assets rated in those higher rating levels to become manifest. Inaddition, although the default rates for 'BBB' rated corporate assets are somewhat higher, theseparation appears slight compared with the default rates for the lower rating categories. If thehistorical stress was more severe, we would expect to see more separation related to 'BBB'corporate defaults.
42. Next, as additional points of reference, we considered historical studies of bond defaults fromearlier periods. These studies naturally reported higher default rates during earlier times ofgreater stress, such as during the Great Depression and around the time of World War I. Forexample, Hickman (1958) reported four-year default rates for bonds rated in each of the top fourrating categories (see table 3).
Table 3
Four-Year Default Rates For Corporate Bonds Rated In The Top Four RatingCategories (%)
Category I II III IV
1912-15 3.8 2.7 15.8 13.1
www.spglobal.com/ratingsdirect August 8, 2016 9
ARCHIVE | Criteria | Structured Finance | CDOs: Global Methodologies And Assumptions For Corporate Cash Flow And Synthetic CDOs
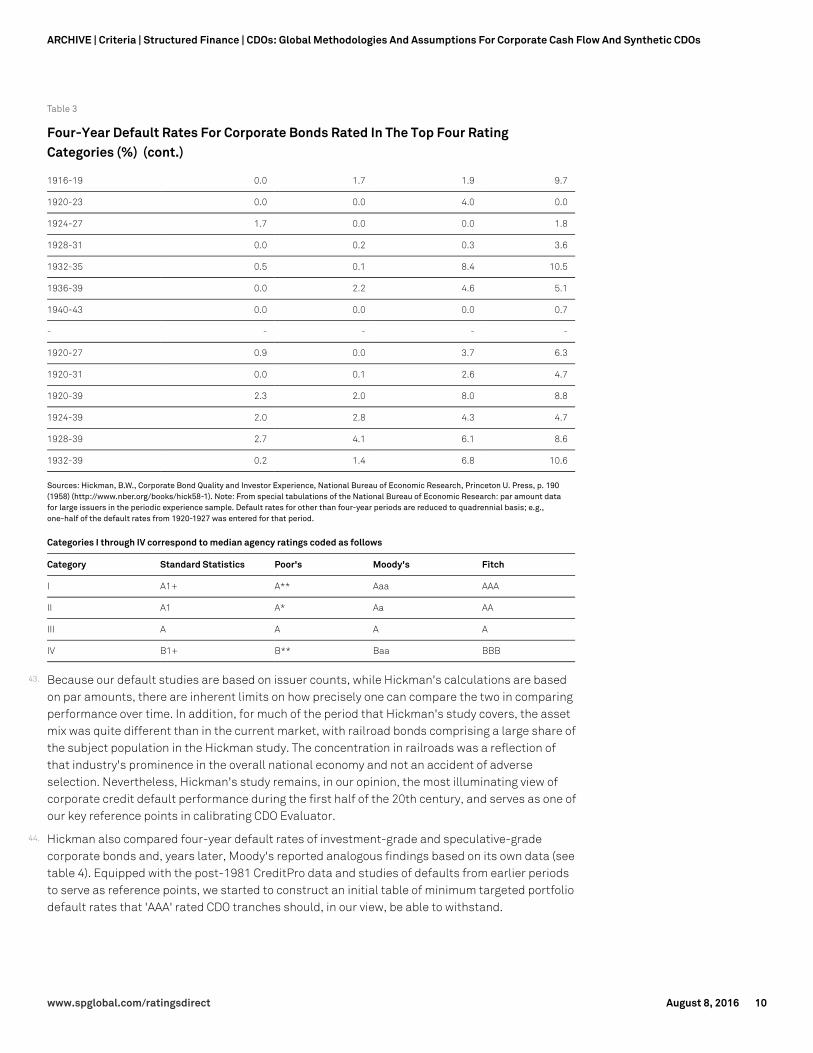
Table 3
Four-Year Default Rates For Corporate Bonds Rated In The Top Four RatingCategories (%) (cont.)
1916-19 0.0 1.7 1.9 9.7
1920-23 0.0 0.0 4.0 0.0
1924-27 1.7 0.0 0.0 1.8
1928-31 0.0 0.2 0.3 3.6
1932-35 0.5 0.1 8.4 10.5
1936-39 0.0 2.2 4.6 5.1
1940-43 0.0 0.0 0.0 0.7
- - - - -
1920-27 0.9 0.0 3.7 6.3
1920-31 0.0 0.1 2.6 4.7
1920-39 2.3 2.0 8.0 8.8
1924-39 2.0 2.8 4.3 4.7
1928-39 2.7 4.1 6.1 8.6
1932-39 0.2 1.4 6.8 10.6
Sources: Hickman, B.W., Corporate Bond Quality and Investor Experience, National Bureau of Economic Research, Princeton U. Press, p. 190(1958) (http://www.nber.org/books/hick58-1). Note: From special tabulations of the National Bureau of Economic Research: par amount datafor large issuers in the periodic experience sample. Default rates for other than four-year periods are reduced to quadrennial basis; e.g.,one-half of the default rates from 1920-1927 was entered for that period.
Categories I through IV correspond to median agency ratings coded as follows
Category Standard Statistics Poor's Moody's Fitch
I A1+ A** Aaa AAA
II A1 A* Aa AA
III A A A A
IV B1+ B** Baa BBB
43. Because our default studies are based on issuer counts, while Hickman's calculations are basedon par amounts, there are inherent limits on how precisely one can compare the two in comparingperformance over time. In addition, for much of the period that Hickman's study covers, the assetmix was quite different than in the current market, with railroad bonds comprising a large share ofthe subject population in the Hickman study. The concentration in railroads was a reflection ofthat industry's prominence in the overall national economy and not an accident of adverseselection. Nevertheless, Hickman's study remains, in our opinion, the most illuminating view ofcorporate credit default performance during the first half of the 20th century, and serves as one ofour key reference points in calibrating CDO Evaluator.
44. Hickman also compared four-year default rates of investment-grade and speculative-gradecorporate bonds and, years later, Moody's reported analogous findings based on its own data (seetable 4). Equipped with the post-1981 CreditPro data and studies of defaults from earlier periodsto serve as reference points, we started to construct an initial table of minimum targeted portfoliodefault rates that 'AAA' rated CDO tranches should, in our view, be able to withstand.
www.spglobal.com/ratingsdirect August 8, 2016 10
ARCHIVE | Criteria | Structured Finance | CDOs: Global Methodologies And Assumptions For Corporate Cash Flow And Synthetic CDOs
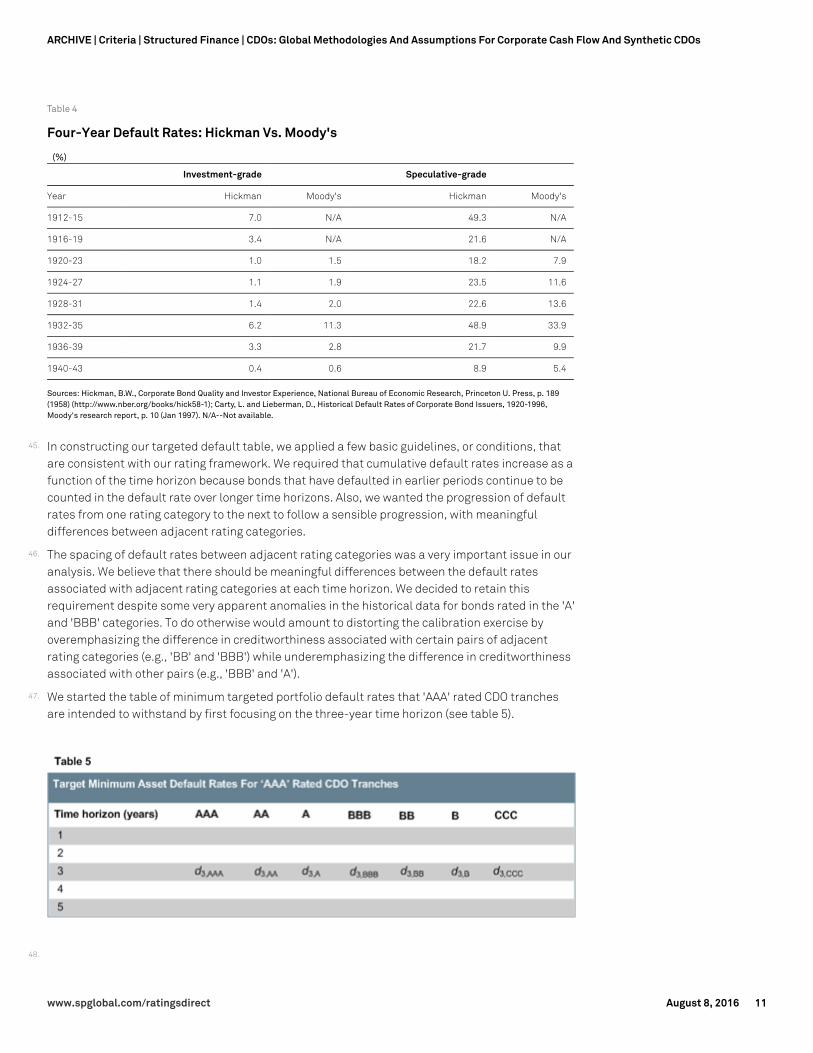
Table 4
Four-Year Default Rates: Hickman Vs. Moody's
(%)
Investment-grade Speculative-grade
Year Hickman Moody's Hickman Moody's
1912-15 7.0 N/A 49.3 N/A
1916-19 3.4 N/A 21.6 N/A
1920-23 1.0 1.5 18.2 7.9
1924-27 1.1 1.9 23.5 11.6
1928-31 1.4 2.0 22.6 13.6
1932-35 6.2 11.3 48.9 33.9
1936-39 3.3 2.8 21.7 9.9
1940-43 0.4 0.6 8.9 5.4
Sources: Hickman, B.W., Corporate Bond Quality and Investor Experience, National Bureau of Economic Research, Princeton U. Press, p. 189(1958) (http://www.nber.org/books/hick58-1); Carty, L. and Lieberman, D., Historical Default Rates of Corporate Bond Issuers, 1920-1996,Moody's research report, p. 10 (Jan 1997). N/A--Not available.
45. In constructing our targeted default table, we applied a few basic guidelines, or conditions, thatare consistent with our rating framework. We required that cumulative default rates increase as afunction of the time horizon because bonds that have defaulted in earlier periods continue to becounted in the default rate over longer time horizons. Also, we wanted the progression of defaultrates from one rating category to the next to follow a sensible progression, with meaningfuldifferences between adjacent rating categories.
46. The spacing of default rates between adjacent rating categories was a very important issue in ouranalysis. We believe that there should be meaningful differences between the default ratesassociated with adjacent rating categories at each time horizon. We decided to retain thisrequirement despite some very apparent anomalies in the historical data for bonds rated in the 'A'and 'BBB' categories. To do otherwise would amount to distorting the calibration exercise byoveremphasizing the difference in creditworthiness associated with certain pairs of adjacentrating categories (e.g., 'BB' and 'BBB') while underemphasizing the difference in creditworthinessassociated with other pairs (e.g., 'BBB' and 'A').
47. We started the table of minimum targeted portfolio default rates that 'AAA' rated CDO tranchesare intended to withstand by first focusing on the three-year time horizon (see table 5).
48.
www.spglobal.com/ratingsdirect August 8, 2016 11
ARCHIVE | Criteria | Structured Finance | CDOs: Global Methodologies And Assumptions For Corporate Cash Flow And Synthetic CDOs
By using post-1981 CreditPro data as a reference (see table 2), we wanted to find default valuesfor differently rated asset pools so that:
49. However, notwithstanding that the CreditPro data reported a maximum three-year default rate for'AAA' rated bonds that was actually higher than the three-year default rate for 'AA' rated bonds,we determined that:
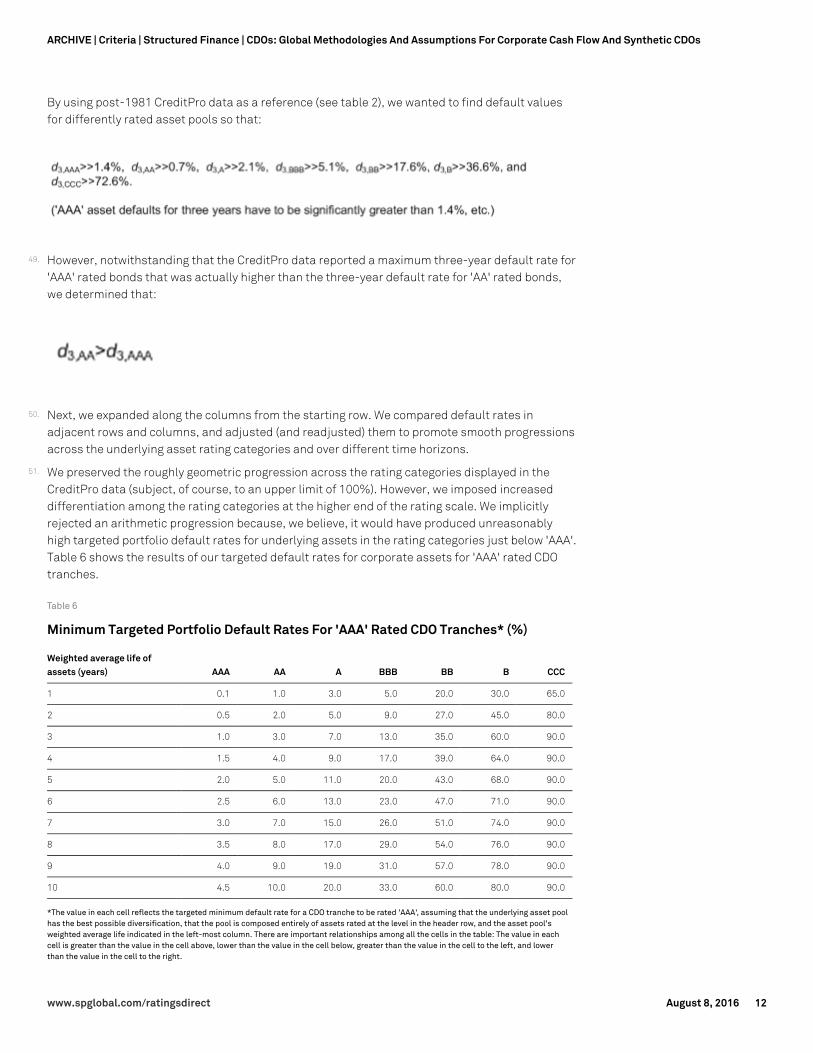
50. Next, we expanded along the columns from the starting row. We compared default rates inadjacent rows and columns, and adjusted (and readjusted) them to promote smooth progressionsacross the underlying asset rating categories and over different time horizons.
51. We preserved the roughly geometric progression across the rating categories displayed in theCreditPro data (subject, of course, to an upper limit of 100%). However, we imposed increaseddifferentiation among the rating categories at the higher end of the rating scale. We implicitlyrejected an arithmetic progression because, we believe, it would have produced unreasonablyhigh targeted portfolio default rates for underlying assets in the rating categories just below 'AAA'.Table 6 shows the results of our targeted default rates for corporate assets for 'AAA' rated CDOtranches.
Table 6
Minimum Targeted Portfolio Default Rates For 'AAA' Rated CDO Tranches* (%)
Weighted average life ofassets (years) AAA AA A BBB BB B CCC
1 0.1 1.0 3.0 5.0 20.0 30.0 65.0
2 0.5 2.0 5.0 9.0 27.0 45.0 80.0
3 1.0 3.0 7.0 13.0 35.0 60.0 90.0
4 1.5 4.0 9.0 17.0 39.0 64.0 90.0
5 2.0 5.0 11.0 20.0 43.0 68.0 90.0
6 2.5 6.0 13.0 23.0 47.0 71.0 90.0
7 3.0 7.0 15.0 26.0 51.0 74.0 90.0
8 3.5 8.0 17.0 29.0 54.0 76.0 90.0
9 4.0 9.0 19.0 31.0 57.0 78.0 90.0
10 4.5 10.0 20.0 33.0 60.0 80.0 90.0
*The value in each cell reflects the targeted minimum default rate for a CDO tranche to be rated 'AAA', assuming that the underlying asset poolhas the best possible diversification, that the pool is composed entirely of assets rated at the level in the header row, and the asset pool'sweighted average life indicated in the left-most column. There are important relationships among all the cells in the table: The value in eachcell is greater than the value in the cell above, lower than the value in the cell below, greater than the value in the cell to the left, and lowerthan the value in the cell to the right.
www.spglobal.com/ratingsdirect August 8, 2016 12
ARCHIVE | Criteria | Structured Finance | CDOs: Global Methodologies And Assumptions For Corporate Cash Flow And Synthetic CDOs
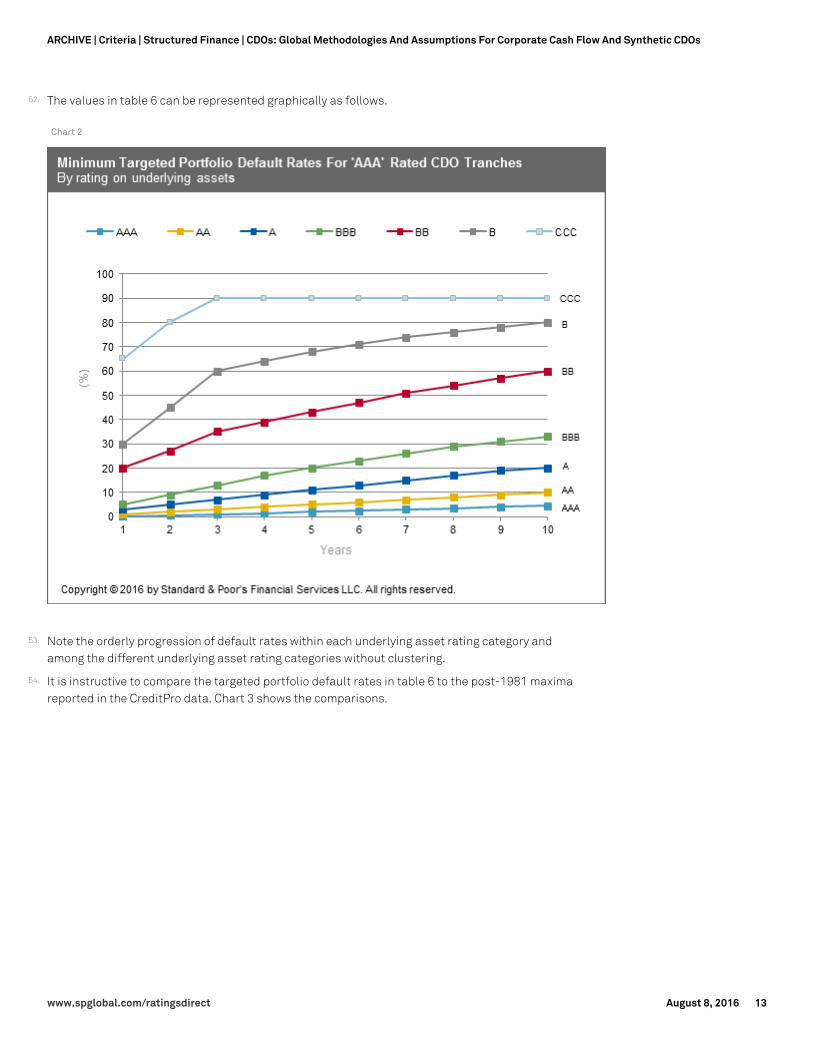
52. The values in table 6 can be represented graphically as follows.
Chart 2
53. Note the orderly progression of default rates within each underlying asset rating category andamong the different underlying asset rating categories without clustering.
54. It is instructive to compare the targeted portfolio default rates in table 6 to the post-1981 maximareported in the CreditPro data. Chart 3 shows the comparisons.
www.spglobal.com/ratingsdirect August 8, 2016 13
ARCHIVE | Criteria | Structured Finance | CDOs: Global Methodologies And Assumptions For Corporate Cash Flow And Synthetic CDOs
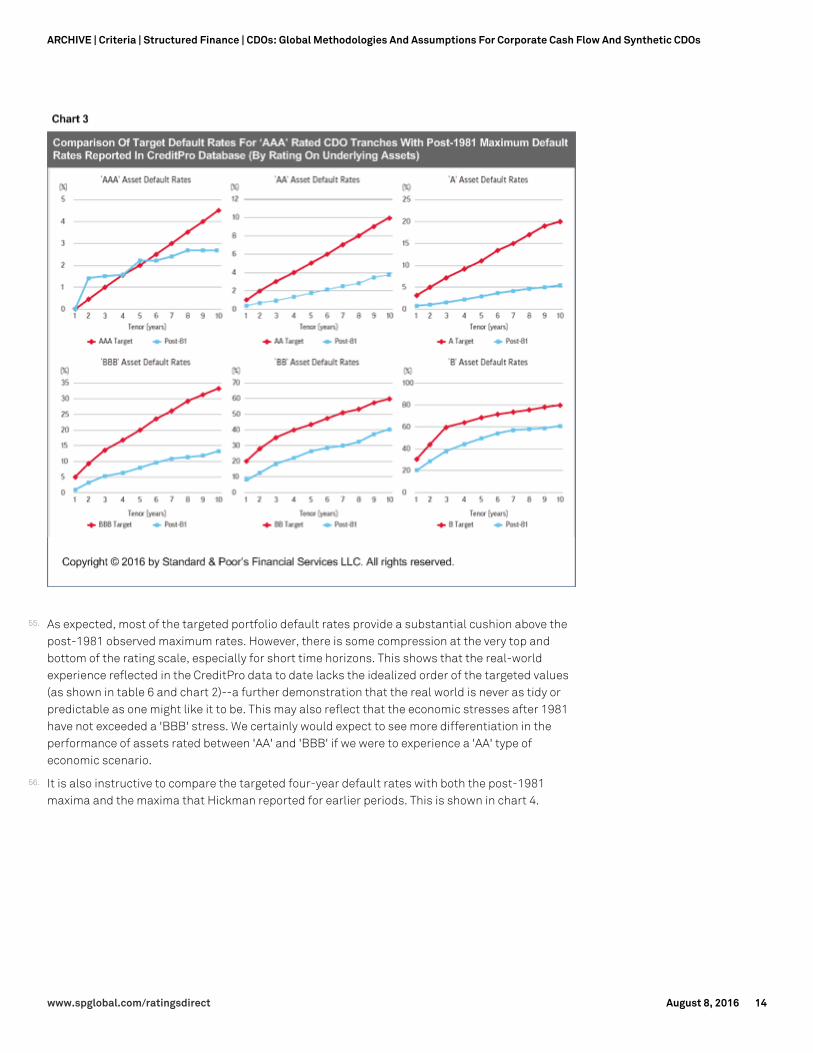
55. As expected, most of the targeted portfolio default rates provide a substantial cushion above thepost-1981 observed maximum rates. However, there is some compression at the very top andbottom of the rating scale, especially for short time horizons. This shows that the real-worldexperience reflected in the CreditPro data to date lacks the idealized order of the targeted values(as shown in table 6 and chart 2)--a further demonstration that the real world is never as tidy orpredictable as one might like it to be. This may also reflect that the economic stresses after 1981have not exceeded a 'BBB' stress. We certainly would expect to see more differentiation in theperformance of assets rated between 'AA' and 'BBB' if we were to experience a 'AA' type ofeconomic scenario.
56. It is also instructive to compare the targeted four-year default rates with both the post-1981maxima and the maxima that Hickman reported for earlier periods. This is shown in chart 4.
www.spglobal.com/ratingsdirect August 8, 2016 14
ARCHIVE | Criteria | Structured Finance | CDOs: Global Methodologies And Assumptions For Corporate Cash Flow And Synthetic CDOs
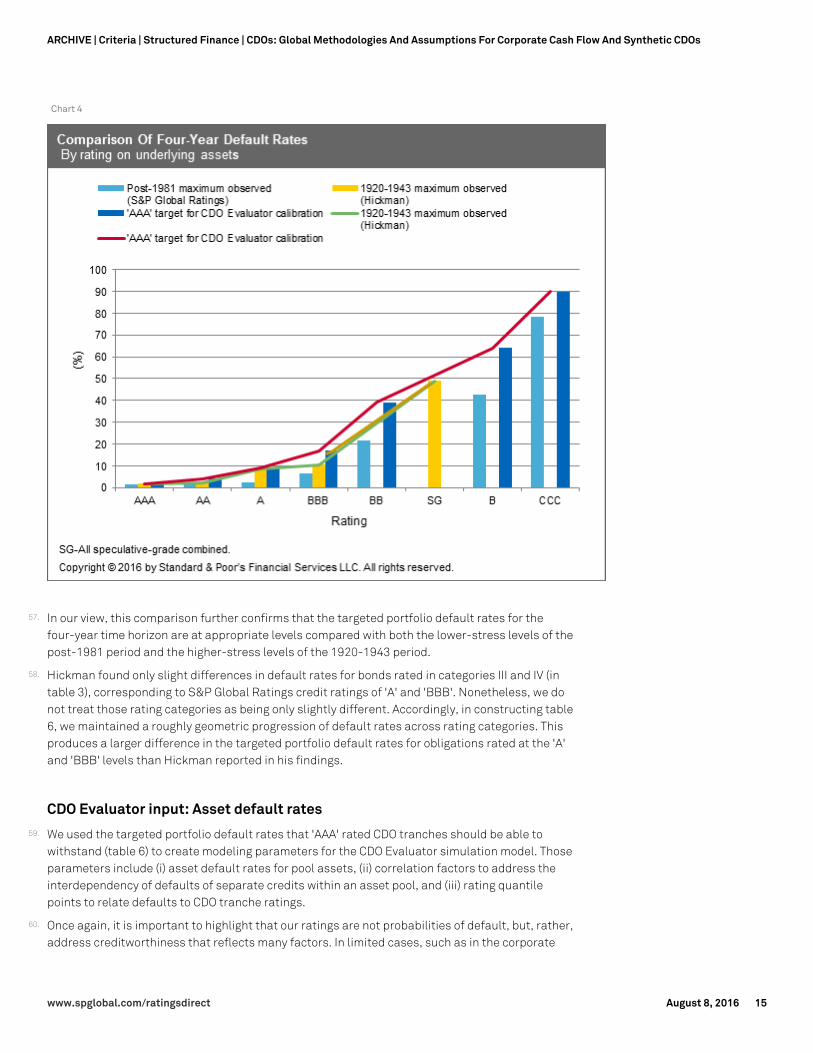
Chart 4
57. In our view, this comparison further confirms that the targeted portfolio default rates for thefour-year time horizon are at appropriate levels compared with both the lower-stress levels of thepost-1981 period and the higher-stress levels of the 1920-1943 period.
58. Hickman found only slight differences in default rates for bonds rated in categories III and IV (intable 3), corresponding to S&P Global Ratings credit ratings of 'A' and 'BBB'. Nonetheless, we donot treat those rating categories as being only slightly different. Accordingly, in constructing table6, we maintained a roughly geometric progression of default rates across rating categories. Thisproduces a larger difference in the targeted portfolio default rates for obligations rated at the 'A'and 'BBB' levels than Hickman reported in his findings.
CDO Evaluator input: Asset default rates59. We used the targeted portfolio default rates that 'AAA' rated CDO tranches should be able to
withstand (table 6) to create modeling parameters for the CDO Evaluator simulation model. Thoseparameters include (i) asset default rates for pool assets, (ii) correlation factors to address theinterdependency of defaults of separate credits within an asset pool, and (iii) rating quantilepoints to relate defaults to CDO tranche ratings.
60. Once again, it is important to highlight that our ratings are not probabilities of default, but, rather,address creditworthiness that reflects many factors. In limited cases, such as in the corporate
www.spglobal.com/ratingsdirect August 8, 2016 15
ARCHIVE | Criteria | Structured Finance | CDOs: Global Methodologies And Assumptions For Corporate Cash Flow And Synthetic CDOs
CDO analyses, we use ratings in a unidimensional way as a proxy for an asset's default rate, solelyfor modeling purposes.
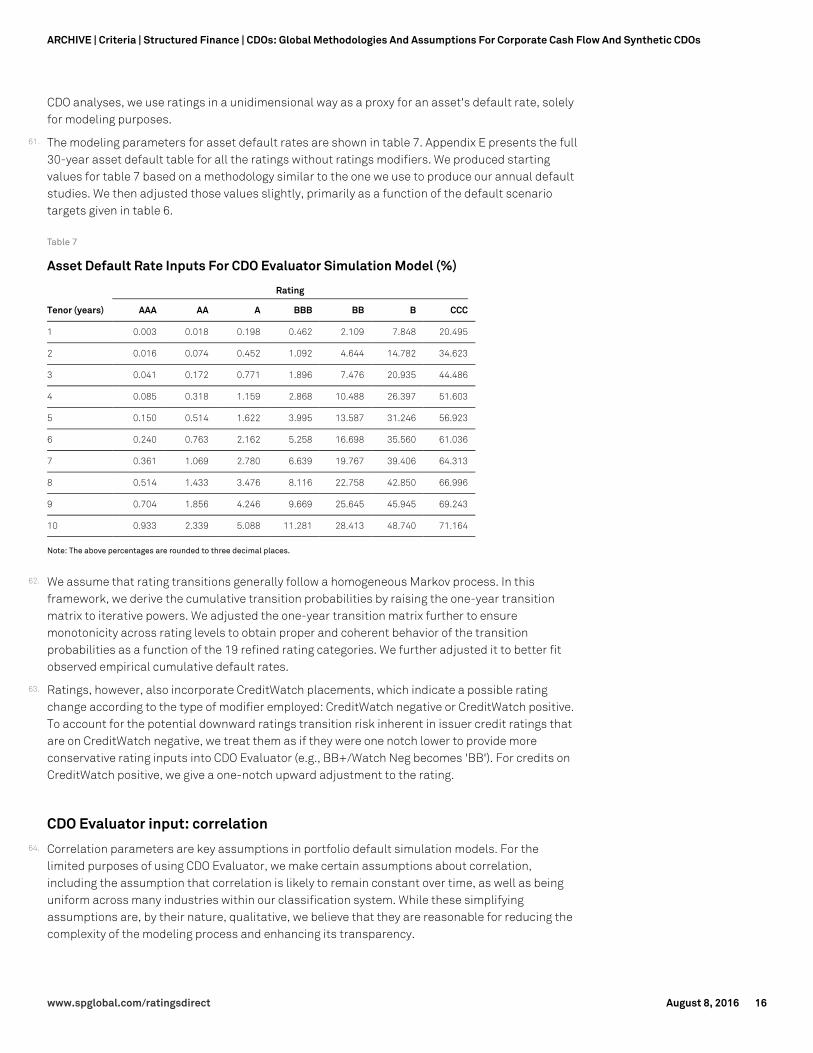
61. The modeling parameters for asset default rates are shown in table 7. Appendix E presents the full30-year asset default table for all the ratings without ratings modifiers. We produced startingvalues for table 7 based on a methodology similar to the one we use to produce our annual defaultstudies. We then adjusted those values slightly, primarily as a function of the default scenariotargets given in table 6.
Table 7
Asset Default Rate Inputs For CDO Evaluator Simulation Model (%)
Rating
Tenor (years) AAA AA A BBB BB B CCC
1 0.003 0.018 0.198 0.462 2.109 7.848 20.495
2 0.016 0.074 0.452 1.092 4.644 14.782 34.623
3 0.041 0.172 0.771 1.896 7.476 20.935 44.486
4 0.085 0.318 1.159 2.868 10.488 26.397 51.603
5 0.150 0.514 1.622 3.995 13.587 31.246 56.923
6 0.240 0.763 2.162 5.258 16.698 35.560 61.036
7 0.361 1.069 2.780 6.639 19.767 39.406 64.313
8 0.514 1.433 3.476 8.116 22.758 42.850 66.996
9 0.704 1.856 4.246 9.669 25.645 45.945 69.243
10 0.933 2.339 5.088 11.281 28.413 48.740 71.164
Note: The above percentages are rounded to three decimal places.
62. We assume that rating transitions generally follow a homogeneous Markov process. In thisframework, we derive the cumulative transition probabilities by raising the one-year transitionmatrix to iterative powers. We adjusted the one-year transition matrix further to ensuremonotonicity across rating levels to obtain proper and coherent behavior of the transitionprobabilities as a function of the 19 refined rating categories. We further adjusted it to better fitobserved empirical cumulative default rates.
63. Ratings, however, also incorporate CreditWatch placements, which indicate a possible ratingchange according to the type of modifier employed: CreditWatch negative or CreditWatch positive.To account for the potential downward ratings transition risk inherent in issuer credit ratings thatare on CreditWatch negative, we treat them as if they were one notch lower to provide moreconservative rating inputs into CDO Evaluator (e.g., BB+/Watch Neg becomes 'BB'). For credits onCreditWatch positive, we give a one-notch upward adjustment to the rating.
CDO Evaluator input: correlation64. Correlation parameters are key assumptions in portfolio default simulation models. For the
limited purposes of using CDO Evaluator, we make certain assumptions about correlation,including the assumption that correlation is likely to remain constant over time, as well as beinguniform across many industries within our classification system. While these simplifyingassumptions are, by their nature, qualitative, we believe that they are reasonable for reducing thecomplexity of the modeling process and enhancing its transparency.
www.spglobal.com/ratingsdirect August 8, 2016 16
ARCHIVE | Criteria | Structured Finance | CDOs: Global Methodologies And Assumptions For Corporate Cash Flow And Synthetic CDOs
65. As previously described, to enhance the overall analysis and lessen dependence on inputparameters, we added the supplemental tests and calibrated the CDO Evaluator model withtargeted outputs. We are also aware of the experience of CDOs of structured finance securitiesduring the credit crisis. The degree of correlation observed among the assets in thesetransactions' underlying portfolios since 2006 has been far higher than the correlation observed inearlier times.
66. The correlation parameters under the criteria are 0.20 for two firms in the same corporate industryand 0.075 for two firms in different corporate industries. In addition, the criteria provide forcorrelation of 0.05 between assets from different industries in different geographic regions. Byincreasing correlation, the criteria fatten the tails of the simulated default frequency distributionand move the expected level of defaults closer to the aforementioned CDO Evaluator defaulttargets. Appendix F shows the correlation assumptions by asset type.
Ratings quantiles and results calibration67. The model needs rating quantiles (cut-off points) associated with each rating level so that the
simulated level of asset defaults can be related to a CDO tranche rating. Chart 5 shows that, givena ratings quantile, it is possible to determine the amount of simulated defaults and thus the creditsupport appropriate for the corresponding rating level for corporate CDO tranches (before theeffect of the supplemental tests).
68. However, in brief, the concept behind the rating quantiles and how they affect our rating results isas follows: CDO Evaluator first runs a Monte Carlo simulation of defaults, which produces asimulated distribution of defaults as shown in chart 5. This distribution, however, does notautomatically relate to the specific creditworthiness of a CDO tranche. To do this, one must relateportfolio defaults to CDO tranche ratings.
www.spglobal.com/ratingsdirect August 8, 2016 17
ARCHIVE | Criteria | Structured Finance | CDOs: Global Methodologies And Assumptions For Corporate Cash Flow And Synthetic CDOs

Chart 5
69. To achieve this, the criteria adjust the rating quantiles so that the model reflects the targetedbenchmarks given in table 6. In other words, we set the rating quantiles for 'AAA' rated tranches ata level where the tranches can withstand the gross asset simulated defaults specified in table 6.Accordingly, the rating quantiles are a principal device for calibrating the CDO Evaluator model.
70. As chart 5 shows, the modeled default frequency for a CDO tranche corresponds to the area of thedefault distribution to the right of a specified rating quantile. Moving the quantile point to the rightamounts to strengthening the tranche's credit quality since it has to withstand more defaults,while moving the rating quantile to the left amounts to weakening the tranche's credit qualitysince it has to withstand fewer defaults.
71. Because the model targets minimum asset default rates that a 'AAA' rated CDO tranche should beable to withstand, the criteria allow the model's rating quantile parameters to be different fromthe corresponding asset default rate parameters. Indeed, doing so is necessary for achievingcalibration outputs with appropriate differentiation between default frequencies of adjacentrating categories. Appendix G presents the rating quantiles table.
CDO Evaluator output: calibration results72. To calibrate CDO Evaluator to the targeted portfolio default rates in table 6, we used highly
diversified portfolios of corporate credits. We ran these pools of assets using the CDO Evaluator
www.spglobal.com/ratingsdirect August 8, 2016 18
ARCHIVE | Criteria | Structured Finance | CDOs: Global Methodologies And Assumptions For Corporate Cash Flow And Synthetic CDOs
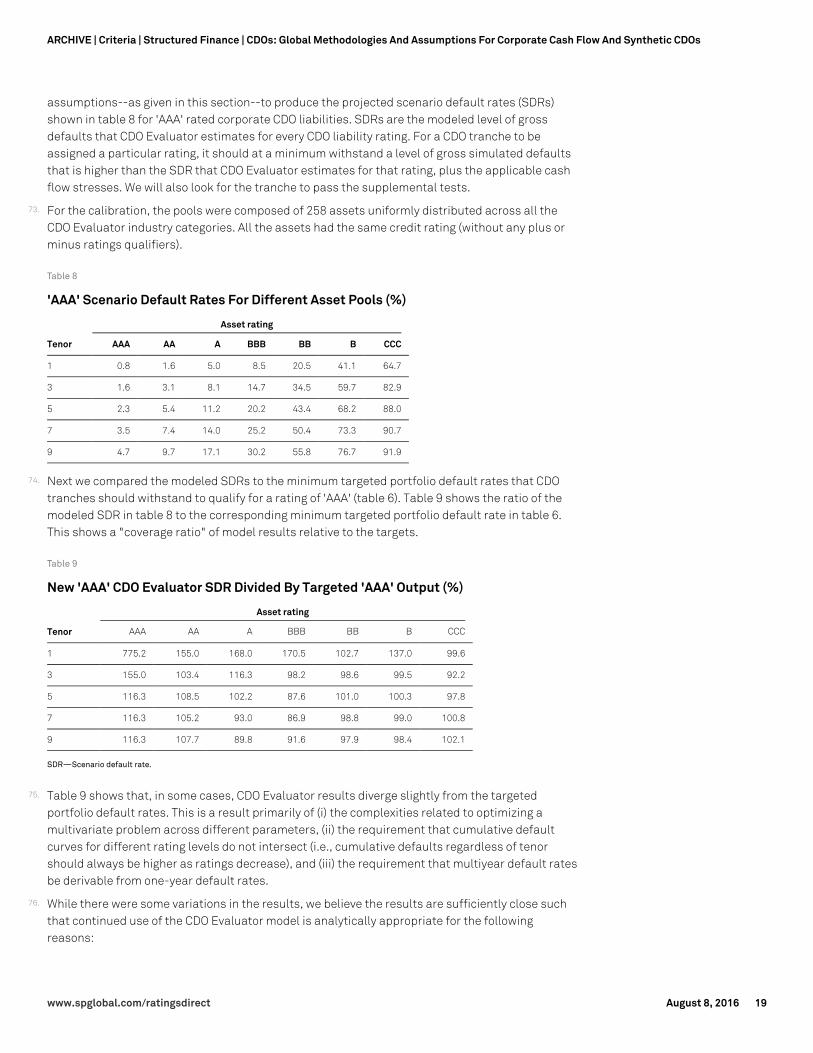
assumptions--as given in this section--to produce the projected scenario default rates (SDRs)shown in table 8 for 'AAA' rated corporate CDO liabilities. SDRs are the modeled level of grossdefaults that CDO Evaluator estimates for every CDO liability rating. For a CDO tranche to beassigned a particular rating, it should at a minimum withstand a level of gross simulated defaultsthat is higher than the SDR that CDO Evaluator estimates for that rating, plus the applicable cashflow stresses. We will also look for the tranche to pass the supplemental tests.
73. For the calibration, the pools were composed of 258 assets uniformly distributed across all theCDO Evaluator industry categories. All the assets had the same credit rating (without any plus orminus ratings qualifiers).
Table 8
'AAA' Scenario Default Rates For Different Asset Pools (%)
Asset rating
Tenor AAA AA A BBB BB B CCC
1 0.8 1.6 5.0 8.5 20.5 41.1 64.7
3 1.6 3.1 8.1 14.7 34.5 59.7 82.9
5 2.3 5.4 11.2 20.2 43.4 68.2 88.0
7 3.5 7.4 14.0 25.2 50.4 73.3 90.7
9 4.7 9.7 17.1 30.2 55.8 76.7 91.9
74. Next we compared the modeled SDRs to the minimum targeted portfolio default rates that CDOtranches should withstand to qualify for a rating of 'AAA' (table 6). Table 9 shows the ratio of themodeled SDR in table 8 to the corresponding minimum targeted portfolio default rate in table 6.This shows a "coverage ratio" of model results relative to the targets.
Table 9
New 'AAA' CDO Evaluator SDR Divided By Targeted 'AAA' Output (%)
Asset rating
Tenor AAA AA A BBB BB B CCC
1 775.2 155.0 168.0 170.5 102.7 137.0 99.6
3 155.0 103.4 116.3 98.2 98.6 99.5 92.2
5 116.3 108.5 102.2 87.6 101.0 100.3 97.8
7 116.3 105.2 93.0 86.9 98.8 99.0 100.8
9 116.3 107.7 89.8 91.6 97.9 98.4 102.1
SDR—Scenario default rate.
75. Table 9 shows that, in some cases, CDO Evaluator results diverge slightly from the targetedportfolio default rates. This is a result primarily of (i) the complexities related to optimizing amultivariate problem across different parameters, (ii) the requirement that cumulative defaultcurves for different rating levels do not intersect (i.e., cumulative defaults regardless of tenorshould always be higher as ratings decrease), and (iii) the requirement that multiyear default ratesbe derivable from one-year default rates.
76. While there were some variations in the results, we believe the results are sufficiently close suchthat continued use of the CDO Evaluator model is analytically appropriate for the followingreasons:
www.spglobal.com/ratingsdirect August 8, 2016 19
ARCHIVE | Criteria | Structured Finance | CDOs: Global Methodologies And Assumptions For Corporate Cash Flow And Synthetic CDOs
- There are very few corporate CDOs where the average collateral ratings are above 'A' or thematurities are less than three years. Most rated transactions have assets in the 'BBB' to 'B'range and maturities of five to nine years. Model results are quite close to their correspondingtargets in that range.
- The absolute default rates for the pools where higher ratios occur are relatively small, and thetransaction ratings in such cases would likely be driven by the supplemental stress tests.
- The hypothetical pools we used in recalibrating the model were highly diversified. Actual CDOpools are generally more concentrated and are likely to produce SDRs higher than thehypothetical pools produce. This would increase the coverage relative to the targetedoutcomes.
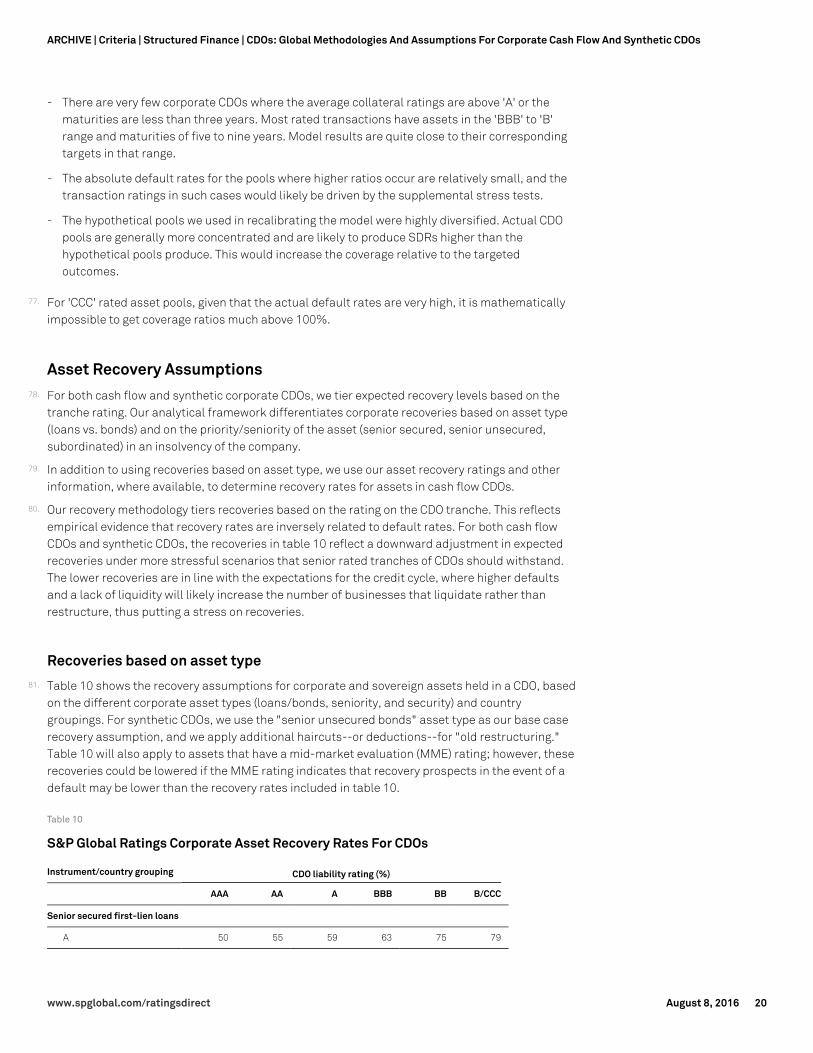
77. For 'CCC' rated asset pools, given that the actual default rates are very high, it is mathematicallyimpossible to get coverage ratios much above 100%.
Asset Recovery Assumptions78. For both cash flow and synthetic corporate CDOs, we tier expected recovery levels based on the
tranche rating. Our analytical framework differentiates corporate recoveries based on asset type(loans vs. bonds) and on the priority/seniority of the asset (senior secured, senior unsecured,subordinated) in an insolvency of the company.
79. In addition to using recoveries based on asset type, we use our asset recovery ratings and otherinformation, where available, to determine recovery rates for assets in cash flow CDOs.
80. Our recovery methodology tiers recoveries based on the rating on the CDO tranche. This reflectsempirical evidence that recovery rates are inversely related to default rates. For both cash flowCDOs and synthetic CDOs, the recoveries in table 10 reflect a downward adjustment in expectedrecoveries under more stressful scenarios that senior rated tranches of CDOs should withstand.The lower recoveries are in line with the expectations for the credit cycle, where higher defaultsand a lack of liquidity will likely increase the number of businesses that liquidate rather thanrestructure, thus putting a stress on recoveries.
Recoveries based on asset type81. Table 10 shows the recovery assumptions for corporate and sovereign assets held in a CDO, based
on the different corporate asset types (loans/bonds, seniority, and security) and countrygroupings. For synthetic CDOs, we use the "senior unsecured bonds" asset type as our base caserecovery assumption, and we apply additional haircuts--or deductions--for "old restructuring."Table 10 will also apply to assets that have a mid-market evaluation (MME) rating; however, theserecoveries could be lowered if the MME rating indicates that recovery prospects in the event of adefault may be lower than the recovery rates included in table 10.
Table 10
S&P Global Ratings Corporate Asset Recovery Rates For CDOs
Instrument/country grouping CDO liability rating (%)
AAA AA A BBB BB B/CCC
Senior secured first-lien loans
A 50 55 59 63 75 79
www.spglobal.com/ratingsdirect August 8, 2016 20
ARCHIVE | Criteria | Structured Finance | CDOs: Global Methodologies And Assumptions For Corporate Cash Flow And Synthetic CDOs
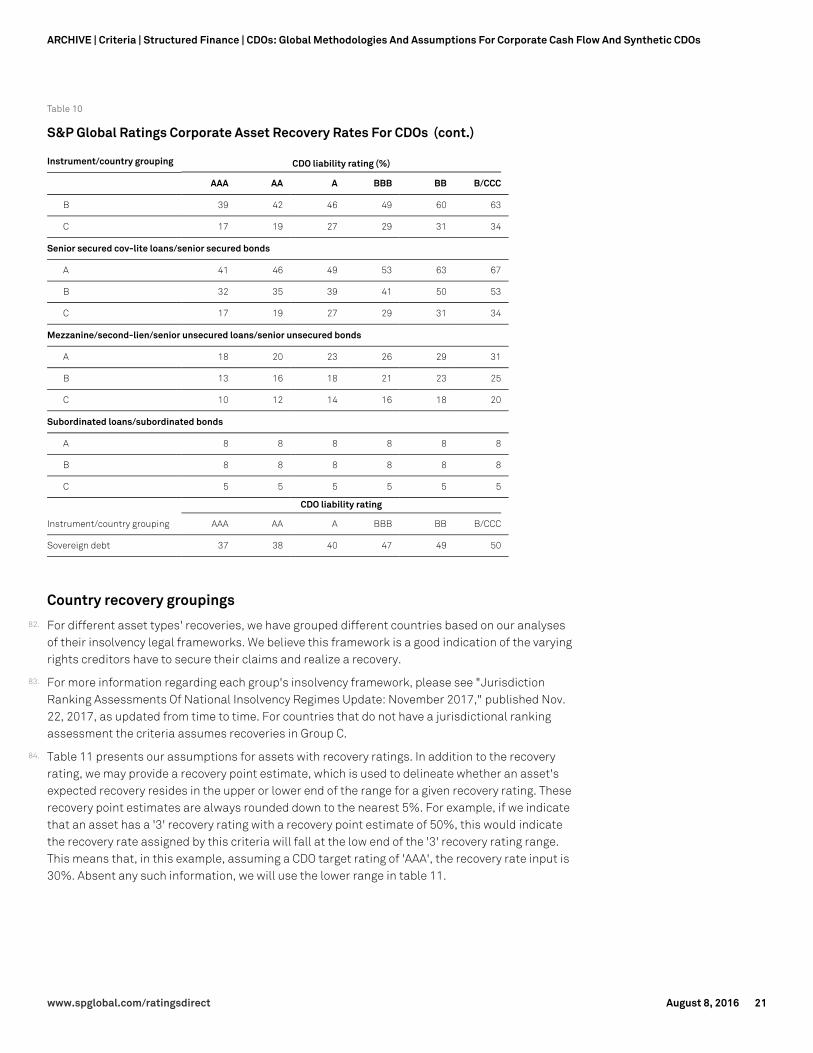
Table 10
S&P Global Ratings Corporate Asset Recovery Rates For CDOs (cont.)
Instrument/country grouping CDO liability rating (%)
AAA AA A BBB BB B/CCC
B 39 42 46 49 60 63
C 17 19 27 29 31 34
Senior secured cov-lite loans/senior secured bonds
A 41 46 49 53 63 67
B 32 35 39 41 50 53
C 17 19 27 29 31 34
Mezzanine/second-lien/senior unsecured loans/senior unsecured bonds
A 18 20 23 26 29 31
B 13 16 18 21 23 25
C 10 12 14 16 18 20
Subordinated loans/subordinated bonds
A 8 8 8 8 8 8
B 8 8 8 8 8 8
C 5 5 5 5 5 5
CDO liability rating
Instrument/country grouping AAA AA A BBB BB B/CCC
Sovereign debt 37 38 40 47 49 50
Country recovery groupings82. For different asset types' recoveries, we have grouped different countries based on our analyses
of their insolvency legal frameworks. We believe this framework is a good indication of the varyingrights creditors have to secure their claims and realize a recovery.
83. For more information regarding each group's insolvency framework, please see "JurisdictionRanking Assessments Of National Insolvency Regimes Update: November 2017," published Nov.22, 2017, as updated from time to time. For countries that do not have a jurisdictional rankingassessment the criteria assumes recoveries in Group C.
84. Table 11 presents our assumptions for assets with recovery ratings. In addition to the recoveryrating, we may provide a recovery point estimate, which is used to delineate whether an asset'sexpected recovery resides in the upper or lower end of the range for a given recovery rating. Theserecovery point estimates are always rounded down to the nearest 5%. For example, if we indicatethat an asset has a '3' recovery rating with a recovery point estimate of 50%, this would indicatethe recovery rate assigned by this criteria will fall at the low end of the '3' recovery rating range.This means that, in this example, assuming a CDO target rating of 'AAA', the recovery rate input is30%. Absent any such information, we will use the lower range in table 11.
www.spglobal.com/ratingsdirect August 8, 2016 21
ARCHIVE | Criteria | Structured Finance | CDOs: Global Methodologies And Assumptions For Corporate Cash Flow And Synthetic CDOs
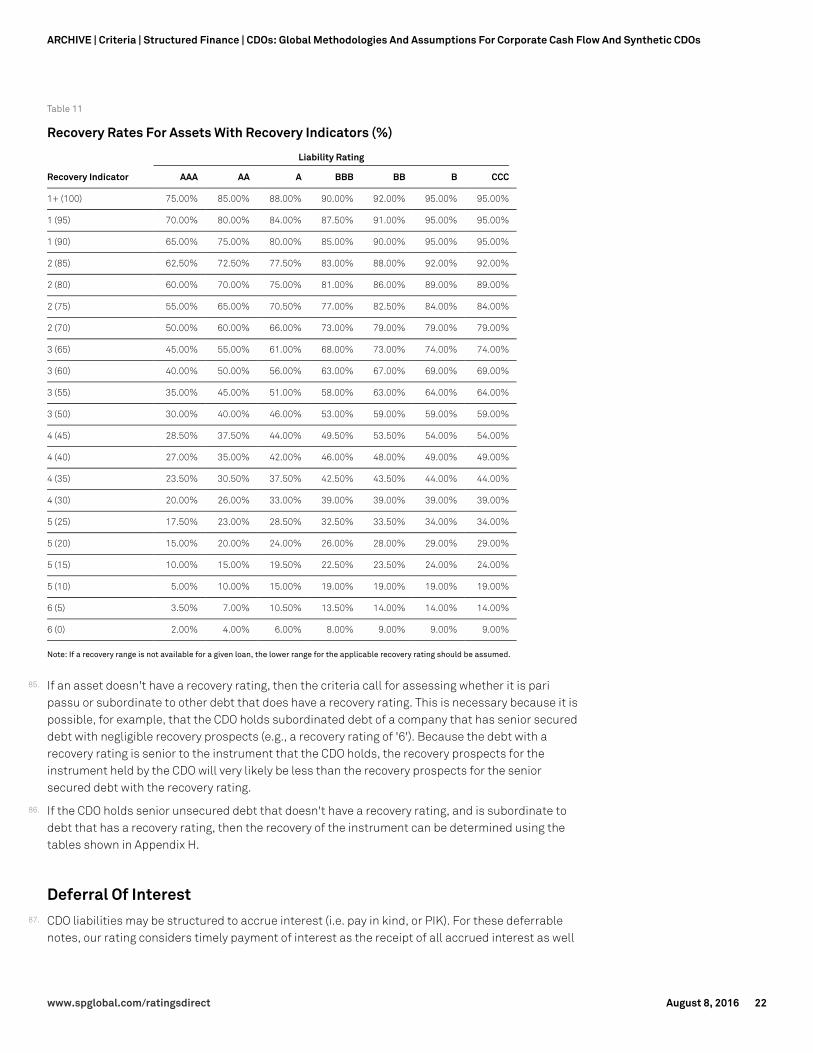
Table 11
Recovery Rates For Assets With Recovery Indicators (%)
Liability Rating
Recovery Indicator AAA AA A BBB BB B CCC
1+ (100) 75.00% 85.00% 88.00% 90.00% 92.00% 95.00% 95.00%
1 (95) 70.00% 80.00% 84.00% 87.50% 91.00% 95.00% 95.00%
1 (90) 65.00% 75.00% 80.00% 85.00% 90.00% 95.00% 95.00%
2 (85) 62.50% 72.50% 77.50% 83.00% 88.00% 92.00% 92.00%
2 (80) 60.00% 70.00% 75.00% 81.00% 86.00% 89.00% 89.00%
2 (75) 55.00% 65.00% 70.50% 77.00% 82.50% 84.00% 84.00%
2 (70) 50.00% 60.00% 66.00% 73.00% 79.00% 79.00% 79.00%
3 (65) 45.00% 55.00% 61.00% 68.00% 73.00% 74.00% 74.00%
3 (60) 40.00% 50.00% 56.00% 63.00% 67.00% 69.00% 69.00%
3 (55) 35.00% 45.00% 51.00% 58.00% 63.00% 64.00% 64.00%
3 (50) 30.00% 40.00% 46.00% 53.00% 59.00% 59.00% 59.00%
4 (45) 28.50% 37.50% 44.00% 49.50% 53.50% 54.00% 54.00%
4 (40) 27.00% 35.00% 42.00% 46.00% 48.00% 49.00% 49.00%
4 (35) 23.50% 30.50% 37.50% 42.50% 43.50% 44.00% 44.00%
4 (30) 20.00% 26.00% 33.00% 39.00% 39.00% 39.00% 39.00%
5 (25) 17.50% 23.00% 28.50% 32.50% 33.50% 34.00% 34.00%
5 (20) 15.00% 20.00% 24.00% 26.00% 28.00% 29.00% 29.00%
5 (15) 10.00% 15.00% 19.50% 22.50% 23.50% 24.00% 24.00%
5 (10) 5.00% 10.00% 15.00% 19.00% 19.00% 19.00% 19.00%
6 (5) 3.50% 7.00% 10.50% 13.50% 14.00% 14.00% 14.00%
6 (0) 2.00% 4.00% 6.00% 8.00% 9.00% 9.00% 9.00%
Note: If a recovery range is not available for a given loan, the lower range for the applicable recovery rating should be assumed.
85. If an asset doesn't have a recovery rating, then the criteria call for assessing whether it is paripassu or subordinate to other debt that does have a recovery rating. This is necessary because it ispossible, for example, that the CDO holds subordinated debt of a company that has senior secureddebt with negligible recovery prospects (e.g., a recovery rating of '6'). Because the debt with arecovery rating is senior to the instrument that the CDO holds, the recovery prospects for theinstrument held by the CDO will very likely be less than the recovery prospects for the seniorsecured debt with the recovery rating.
86. If the CDO holds senior unsecured debt that doesn't have a recovery rating, and is subordinate todebt that has a recovery rating, then the recovery of the instrument can be determined using thetables shown in Appendix H.
Deferral Of Interest87. CDO liabilities may be structured to accrue interest (i.e. pay in kind, or PIK). For these deferrable
notes, our rating considers timely payment of interest as the receipt of all accrued interest as well
www.spglobal.com/ratingsdirect August 8, 2016 22
ARCHIVE | Criteria | Structured Finance | CDOs: Global Methodologies And Assumptions For Corporate Cash Flow And Synthetic CDOs
as interest on interest by the notes' final maturity. Under our criteria, we apply cash flow stressesto assess the capacity of the deferrable notes to pay all interest, including accrued interest,interest on interest, and principal by the legal final maturity.
Cash Flow Modeling Assumptions
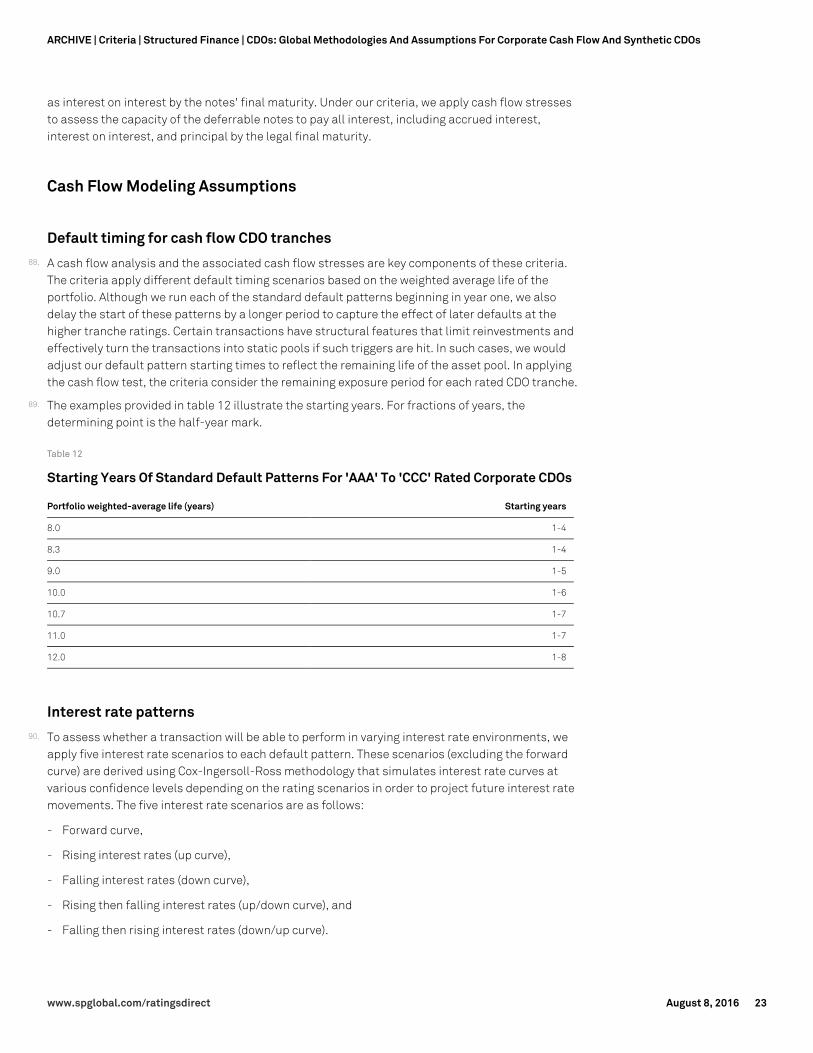
Default timing for cash flow CDO tranches88. A cash flow analysis and the associated cash flow stresses are key components of these criteria.
The criteria apply different default timing scenarios based on the weighted average life of theportfolio. Although we run each of the standard default patterns beginning in year one, we alsodelay the start of these patterns by a longer period to capture the effect of later defaults at thehigher tranche ratings. Certain transactions have structural features that limit reinvestments andeffectively turn the transactions into static pools if such triggers are hit. In such cases, we wouldadjust our default pattern starting times to reflect the remaining life of the asset pool. In applyingthe cash flow test, the criteria consider the remaining exposure period for each rated CDO tranche.
89. The examples provided in table 12 illustrate the starting years. For fractions of years, thedetermining point is the half-year mark.
Table 12
Starting Years Of Standard Default Patterns For 'AAA' To 'CCC' Rated Corporate CDOs
Portfolio weighted-average life (years) Starting years
8.0 1-4
8.3 1-4
9.0 1-5
10.0 1-6
10.7 1-7
11.0 1-7
12.0 1-8
Interest rate patterns90. To assess whether a transaction will be able to perform in varying interest rate environments, we
apply five interest rate scenarios to each default pattern. These scenarios (excluding the forwardcurve) are derived using Cox-Ingersoll-Ross methodology that simulates interest rate curves atvarious confidence levels depending on the rating scenarios in order to project future interest ratemovements. The five interest rate scenarios are as follows:
- Forward curve,
- Rising interest rates (up curve),
- Falling interest rates (down curve),
- Rising then falling interest rates (up/down curve), and
- Falling then rising interest rates (down/up curve).
www.spglobal.com/ratingsdirect August 8, 2016 23
ARCHIVE | Criteria | Structured Finance | CDOs: Global Methodologies And Assumptions For Corporate Cash Flow And Synthetic CDOs
Break-even result analysis for cash flow CDOs91. Under the criteria, part of the cash flow analysis remains the consideration of a tranche's BDR.
This is a measure of the maximum level of gross defaults that a tranche can withstand and stillfully repay the noteholders, given the transaction structure, asset characteristics, paymentmechanics, and proposed credit enhancement. To analyze a tranche, we run a number of cashflow scenarios using different starting times for defaults, different patterns of how the defaultswill occur once defaults start, and different interest rate scenarios.
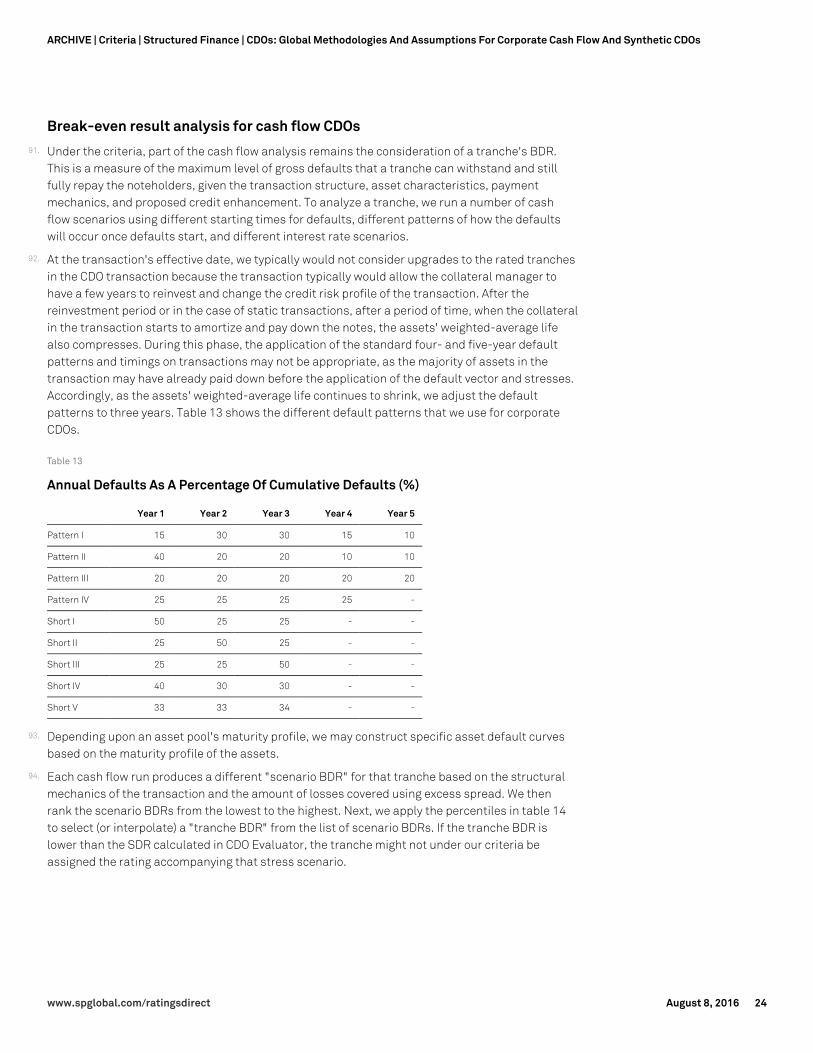
92. At the transaction's effective date, we typically would not consider upgrades to the rated tranchesin the CDO transaction because the transaction typically would allow the collateral manager tohave a few years to reinvest and change the credit risk profile of the transaction. After thereinvestment period or in the case of static transactions, after a period of time, when the collateralin the transaction starts to amortize and pay down the notes, the assets' weighted-average lifealso compresses. During this phase, the application of the standard four- and five-year defaultpatterns and timings on transactions may not be appropriate, as the majority of assets in thetransaction may have already paid down before the application of the default vector and stresses.Accordingly, as the assets' weighted-average life continues to shrink, we adjust the defaultpatterns to three years. Table 13 shows the different default patterns that we use for corporateCDOs.
Table 13
Annual Defaults As A Percentage Of Cumulative Defaults (%)
Year 1 Year 2 Year 3 Year 4 Year 5
Pattern I 15 30 30 15 10
Pattern II 40 20 20 10 10
Pattern III 20 20 20 20 20
Pattern IV 25 25 25 25 -
Short I 50 25 25 - -
Short II 25 50 25 - -
Short III 25 25 50 - -
Short IV 40 30 30 - -
Short V 33 33 34 - -
93. Depending upon an asset pool's maturity profile, we may construct specific asset default curvesbased on the maturity profile of the assets.
94. Each cash flow run produces a different "scenario BDR" for that tranche based on the structuralmechanics of the transaction and the amount of losses covered using excess spread. We thenrank the scenario BDRs from the lowest to the highest. Next, we apply the percentiles in table 14to select (or interpolate) a "tranche BDR" from the list of scenario BDRs. If the tranche BDR islower than the SDR calculated in CDO Evaluator, the tranche might not under our criteria beassigned the rating accompanying that stress scenario.
www.spglobal.com/ratingsdirect August 8, 2016 24
ARCHIVE | Criteria | Structured Finance | CDOs: Global Methodologies And Assumptions For Corporate Cash Flow And Synthetic CDOs
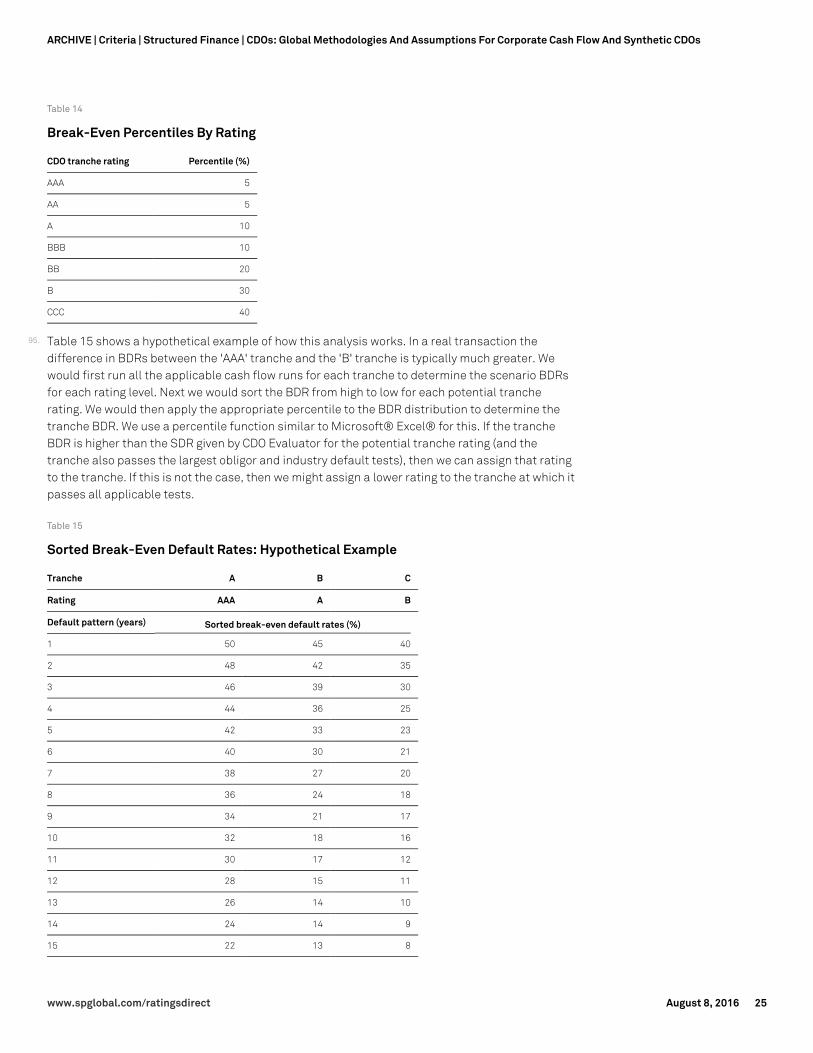
Table 14
Break-Even Percentiles By Rating
CDO tranche rating Percentile (%)
AAA 5
AA 5
A 10
BBB 10
BB 20
B 30
CCC 40
95. Table 15 shows a hypothetical example of how this analysis works. In a real transaction thedifference in BDRs between the 'AAA' tranche and the 'B' tranche is typically much greater. Wewould first run all the applicable cash flow runs for each tranche to determine the scenario BDRsfor each rating level. Next we would sort the BDR from high to low for each potential trancherating. We would then apply the appropriate percentile to the BDR distribution to determine thetranche BDR. We use a percentile function similar to Microsoft® Excel® for this. If the trancheBDR is higher than the SDR given by CDO Evaluator for the potential tranche rating (and thetranche also passes the largest obligor and industry default tests), then we can assign that ratingto the tranche. If this is not the case, then we might assign a lower rating to the tranche at which itpasses all applicable tests.
Table 15
Sorted Break-Even Default Rates: Hypothetical Example
Tranche A B C
Rating AAA A B
Default pattern (years) Sorted break-even default rates (%)
1 50 45 40
2 48 42 35
3 46 39 30
4 44 36 25
5 42 33 23
6 40 30 21
7 38 27 20
8 36 24 18
9 34 21 17
10 32 18 16
11 30 17 12
12 28 15 11
13 26 14 10
14 24 14 9
15 22 13 8
www.spglobal.com/ratingsdirect August 8, 2016 25
ARCHIVE | Criteria | Structured Finance | CDOs: Global Methodologies And Assumptions For Corporate Cash Flow And Synthetic CDOs
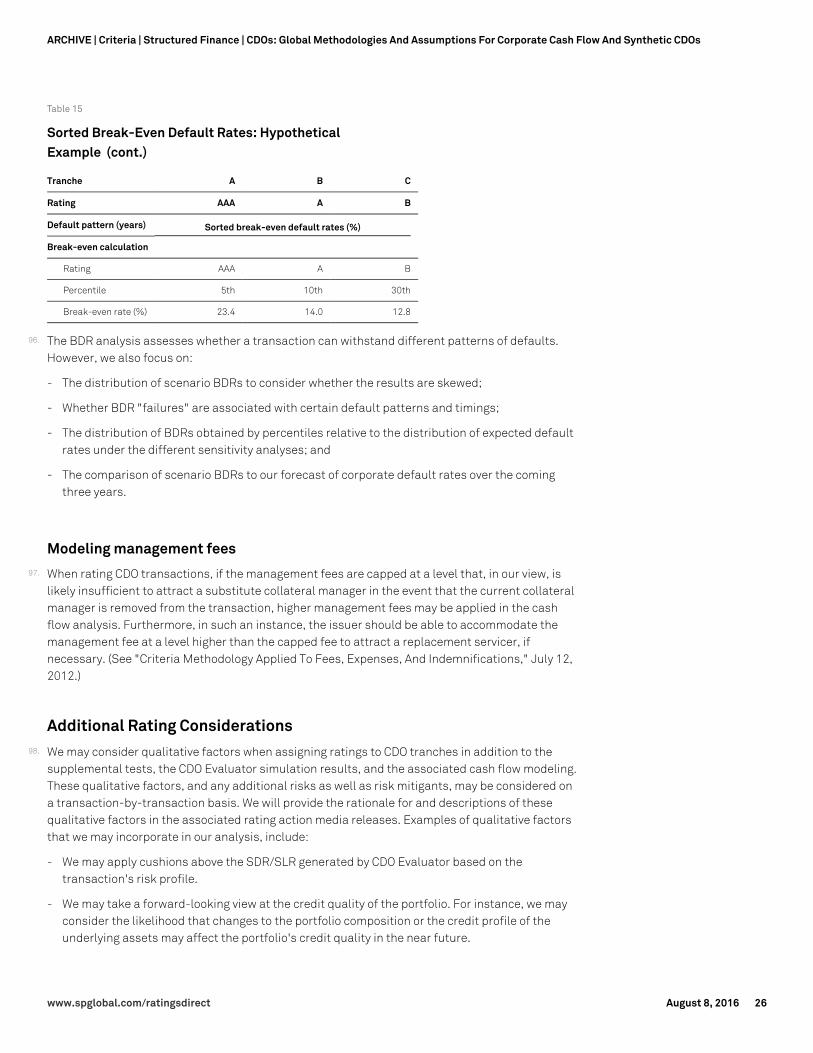
Table 15
Sorted Break-Even Default Rates: HypotheticalExample (cont.)
Tranche A B C
Rating AAA A B
Default pattern (years) Sorted break-even default rates (%)
Break-even calculation
Rating AAA A B
Percentile 5th 10th 30th
Break-even rate (%) 23.4 14.0 12.8
96. The BDR analysis assesses whether a transaction can withstand different patterns of defaults.However, we also focus on:
- The distribution of scenario BDRs to consider whether the results are skewed;
- Whether BDR "failures" are associated with certain default patterns and timings;
- The distribution of BDRs obtained by percentiles relative to the distribution of expected defaultrates under the different sensitivity analyses; and
- The comparison of scenario BDRs to our forecast of corporate default rates over the comingthree years.
Modeling management fees97. When rating CDO transactions, if the management fees are capped at a level that, in our view, is
likely insufficient to attract a substitute collateral manager in the event that the current collateralmanager is removed from the transaction, higher management fees may be applied in the cashflow analysis. Furthermore, in such an instance, the issuer should be able to accommodate themanagement fee at a level higher than the capped fee to attract a replacement servicer, ifnecessary. (See "Criteria Methodology Applied To Fees, Expenses, And Indemnifications," July 12,2012.)
Additional Rating Considerations98. We may consider qualitative factors when assigning ratings to CDO tranches in addition to the
supplemental tests, the CDO Evaluator simulation results, and the associated cash flow modeling.These qualitative factors, and any additional risks as well as risk mitigants, may be considered ona transaction-by-transaction basis. We will provide the rationale for and descriptions of thesequalitative factors in the associated rating action media releases. Examples of qualitative factorsthat we may incorporate in our analysis, include:
- We may apply cushions above the SDR/SLR generated by CDO Evaluator based on thetransaction's risk profile.
- We may take a forward-looking view at the credit quality of the portfolio. For instance, we mayconsider the likelihood that changes to the portfolio composition or the credit profile of theunderlying assets may affect the portfolio's credit quality in the near future.
www.spglobal.com/ratingsdirect August 8, 2016 26
ARCHIVE | Criteria | Structured Finance | CDOs: Global Methodologies And Assumptions For Corporate Cash Flow And Synthetic CDOs
- We may consider any attributes of the portfolio (such as credit watch negatives) that may affectits credit profile;
- We may make adjustments to the portfolio's weighted average spread, recoveries, or otherportfolio parameters depending on the collateral manager's ability to make trades that maylower these metrics.
Credit stability99. We published criteria addressing credit stability (see "Methodology: Credit Stability Criteria," May
3, 2010). The stability guidelines specify for each rating level the maximum degree of projectedcredit deterioration under conditions of moderate stress for time horizons of one and three years.For example, we intend for 'AAA' ratings not to change more than one rating category in one year orthree rating categories in three years under what we consider to be a moderate stressenvironment. A tranche's projected rating stability determines the maximum rating that it canachieve.
100. A key aspect of the targeted portfolio default rates for the calibration process was the spacing oftargeted portfolio default rates between adjacent rating levels. In a similar vein, we considerwhether the modeled default frequencies for actual CDO tranches at different rating levels alsodisplay appropriate spacing. In our opinion, this has the benefit of moderating undesirablevolatility of modeled creditworthiness. That is, appropriate spacing of modeled default frequencybetween adjacent rating categories helps reduce the problem of tranches flipping repeatedlybetween adjacent categories because of small changes in underlying asset quality.
101. We tested various asset portfolios and changed their ratings using a rating transition matrix asderived under our opinion of a moderate stress scenario. We then ran the resulting transition poolsthrough the recalibrated CDO Evaluator to see the resulting changes in the CDO tranche ratings.These analyses show that the resultant CDO tranche ratings would perform within the allowablecredit stability guidelines. Thus, in our view, the analytical framework presented in this articlemeets the credit stability guidelines.
Rating sensitivity to modeling parameters102. We further apply sensitivity testing to three model parameters: Asset correlation, spread, and
recoveries. These sensitivity analyses are different from the analyses of credit stability describedabove. The goal of these analyses is to further test the sensitivity of a transaction relative to keymodel parameters and to illustrate the effect that varying these parameters would have on modelresults. Given the diversified nature of the asset portfolios and similar structural mechanics, onewould expect most transactions to respond similarly to different changes in stresses, absentidiosyncratic factors.
103. The salient issue is whether the model results and transaction structure display exceptionally highsensitivity to changes in input parameters. If they do, then it is our view that there must be someexplanatory factor either in the transaction structure or in the portfolio construction that iscausing such distinct behavior.
104. We may modify some of the modeling assumptions or applied stresses for portfolios that showheightened sensitivity to the following analyses:
105. Changes to correlation. The criteria call for consideration of sensitivity to correlation assumptionsby running portfolios with the three correlation scenarios shown in table 16.
www.spglobal.com/ratingsdirect August 8, 2016 27
ARCHIVE | Criteria | Structured Finance | CDOs: Global Methodologies And Assumptions For Corporate Cash Flow And Synthetic CDOs
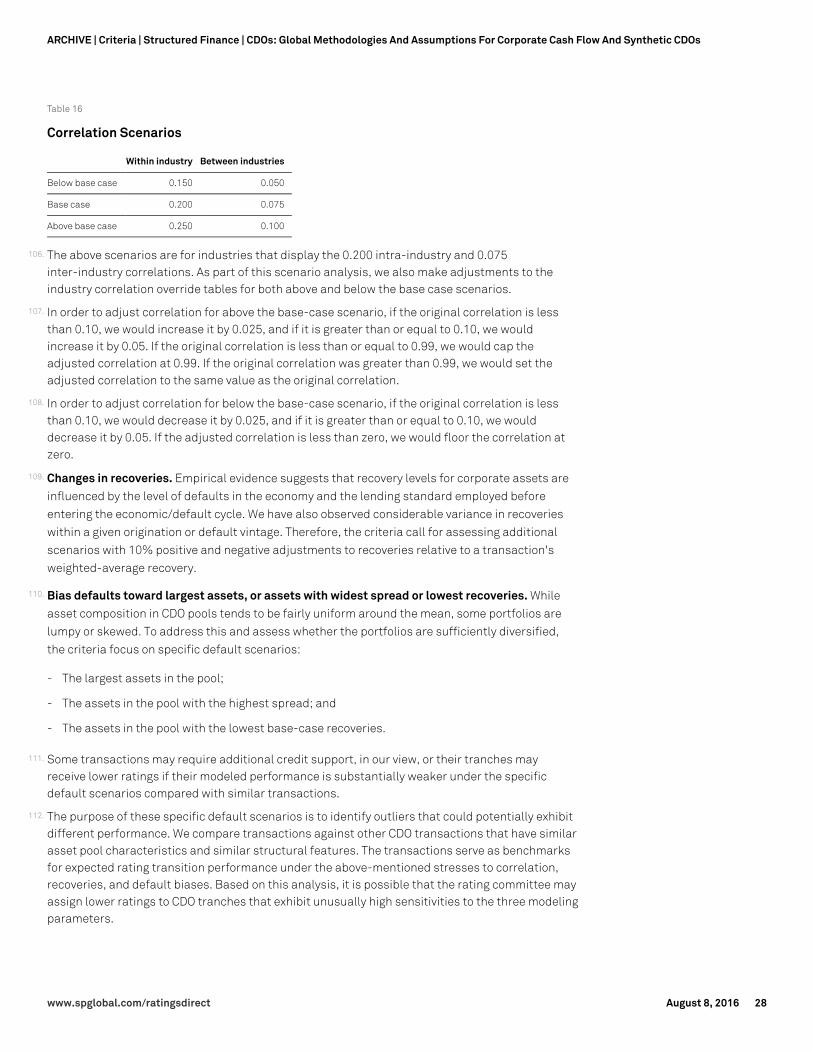
Table 16
Correlation Scenarios
Within industry Between industries
Below base case 0.150 0.050
Base case 0.200 0.075
Above base case 0.250 0.100
106. The above scenarios are for industries that display the 0.200 intra-industry and 0.075inter-industry correlations. As part of this scenario analysis, we also make adjustments to theindustry correlation override tables for both above and below the base case scenarios.
107. In order to adjust correlation for above the base-case scenario, if the original correlation is lessthan 0.10, we would increase it by 0.025, and if it is greater than or equal to 0.10, we wouldincrease it by 0.05. If the original correlation is less than or equal to 0.99, we would cap theadjusted correlation at 0.99. If the original correlation was greater than 0.99, we would set theadjusted correlation to the same value as the original correlation.
108. In order to adjust correlation for below the base-case scenario, if the original correlation is lessthan 0.10, we would decrease it by 0.025, and if it is greater than or equal to 0.10, we woulddecrease it by 0.05. If the adjusted correlation is less than zero, we would floor the correlation atzero.
109. Changes in recoveries. Empirical evidence suggests that recovery levels for corporate assets areinfluenced by the level of defaults in the economy and the lending standard employed beforeentering the economic/default cycle. We have also observed considerable variance in recoverieswithin a given origination or default vintage. Therefore, the criteria call for assessing additionalscenarios with 10% positive and negative adjustments to recoveries relative to a transaction'sweighted-average recovery.
110. Bias defaults toward largest assets, or assets with widest spread or lowest recoveries. Whileasset composition in CDO pools tends to be fairly uniform around the mean, some portfolios arelumpy or skewed. To address this and assess whether the portfolios are sufficiently diversified,the criteria focus on specific default scenarios:
- The largest assets in the pool;
- The assets in the pool with the highest spread; and
- The assets in the pool with the lowest base-case recoveries.
111. Some transactions may require additional credit support, in our view, or their tranches mayreceive lower ratings if their modeled performance is substantially weaker under the specificdefault scenarios compared with similar transactions.
112. The purpose of these specific default scenarios is to identify outliers that could potentially exhibitdifferent performance. We compare transactions against other CDO transactions that have similarasset pool characteristics and similar structural features. The transactions serve as benchmarksfor expected rating transition performance under the above-mentioned stresses to correlation,recoveries, and default biases. Based on this analysis, it is possible that the rating committee mayassign lower ratings to CDO tranches that exhibit unusually high sensitivities to the three modelingparameters.
www.spglobal.com/ratingsdirect August 8, 2016 28
ARCHIVE | Criteria | Structured Finance | CDOs: Global Methodologies And Assumptions For Corporate Cash Flow And Synthetic CDOs

Focus on minimum portfolio standards113. Most cash flow CLOs and some synthetic CDO transactions allow for reinvestments and asset
trading. These transactions have asset eligibility criteria and contractual provisions that governthe type of trading allowed and the requirements for maintaining the asset portfolio within certainboundaries. Often, however, sponsors or asset managers may select a transaction's initialportfolio with characteristics that are stronger than the minimum requirements of the governingdocuments. However, in our experience, an asset manager may commit (barring creditdeterioration of the assets) to manage a transaction's portfolio and maintain the original level ofasset quality even though the transaction's governing documents allow for a weaker assetportfolio composition.
114. The criteria allow for rating a CDO transaction based on the manager either (i) managing thetransaction to maintain the portfolio's original credit quality (the "stable quality" approach), or (ii)managing the transaction within the eligibility criteria of the governing documents (the "stressedportfolio" approach).
115. For us to apply the "stable quality" approach in rating a CDO transaction, we look for the managerto commit in the transaction's governing documents to apply Standard & Poor's CDO Monitor testor the synthetic rated overcollateralization (SROC) test within the constraints of not breaching ormaintaining the CDO Monitor or SROC tests (note that for "credit risk" trades, the manager is notconstrained by these tests.) The CDO Monitor and SROC tests detect possible changes in an assetpool's credit quality when the manager carries out discretionary trading or trading ofcredit-improved assets.
116. For credit-risk trades (defined as trades where the credit is at risk of default or impairment) theCDO Monitor test is designed so that the manager may reinvest in any asset that fits within theminimum portfolio eligibility criteria without maintaining or improving the test results with thetrade.
117. Alternatively, some transactions are structured from the start based on the "stressed portfolio"approach, even though the initial portfolios may be stronger. For such a transaction, the criteriadeem the portfolio to comprise the minimum number of obligors concentrated in the minimumnumber of industries permitted in the documents. In addition, the criteria further apply theassumption that the largest obligors are all in the same industry and have the lowest ratingsallowed by the eligibility criteria. Also, the criteria continue to assume that the portfolio has theminimum weighted-average spread and coupon allowed, and that it has the longestweighted-average life and lowest projected recoveries allowed under the eligibility andreinvestment criteria. Certain transactions may have more precisely defined characteristics forthe hypothetical "stressed portfolio" by mandating more precise and definitive asset eligibility,pool concentration, and reinvestment guidelines.
118. If sponsors and managers structure a transaction based on the hypothetical stressed portfolioapproach, and we rate it on that basis, then the sponsor, trustee, or manager could, on the"effective date," simply confirm that the trades and portfolio ramp-up meet the asset eligibility,quality, and reinvestment guidelines specified in the applicable transaction documents.
119. The "stressed portfolio" approach applies whenever a collateral manager does not commit in thetransaction documents to maintain portfolio credit quality by using CDO Monitor, or whenever amanager breaches or repudiates such a prior commitment.
www.spglobal.com/ratingsdirect August 8, 2016 29
ARCHIVE | Criteria | Structured Finance | CDOs: Global Methodologies And Assumptions For Corporate Cash Flow And Synthetic CDOs
Small interest shortfalls120. The cash flows modeling for a given transaction may show that there are insufficient proceeds to
pay full interest on nonpayment-in-kind tranches. If we believe these interest shortfalls may bedue to the modeled portfolio amortization profile, we may choose to give a different weighting tosuch scenarios. This is based on observations that collateral managers typically forecast andmanage cash flows by adjusting portfolio maturities, holding back on reinvestments, and sellingassets to avoid such shortfalls. Historically, we understand that managers have not invested100% of their available cash and have maintained small amounts of cash on hand. However, themodeling assumptions limit such nonconsecutive instances to no more than five.
Treatment of CDOs of corporate CDOs ("CDO-squared" transactions)121. The treatment of corporate CDOs within a CDO portfolio should follow the criteria provided in the
global CDO of pooled structured finance assets (see "Global CDOs Of Pooled Structured FinanceAssets: Methodology And Assumptions," Feb. 21, 2012).
122. Additionally, the criteria generally assume zero recoveries for junior CDO tranches held as assets(i.e., those tranches that we identify as subordinated to senior noteholders, which have controllingrights to liquidate the transaction if an event of default occurs from a coverage test failure).
Correlation between corporate assets and CDO assets123. From 2005-2007, corporate CDOs increased the concentration of CDO assets they hold in their
asset pools. We believe this occurred because, in part, of the difficulties that collateral managershad in sourcing new corporate loans. As such, to stay fully invested and minimize negative carry,more and more managers purchased mezzanine tranches of other corporate CDOs. The criteriaapply a correlation of 0.10 between corporate assets and corporate CDO tranches.
Correlation between corporate CDO tranches124. Events in 2007-2009 also highlighted that, because many corporate CDOs hold similar assets,
there can accordingly be a greater degree of correlation than previously thought. The criteria applya correlation of 0.70 between corporate CDO tranches. This will affect CDOs of CDOs("CDO-squared") transactions. Also, we now assume asset default rates for corporate CDOs to bethe same as for corporate assets.
Correlation override table in CDO Evaluator125. Table 30 shows the correlation assumptions used in CDO Evaluator.
Treatment of other asset types in corporate CDOs126. These criteria apply to CDOs of corporate assets. However, some corporate CDO collateral pools
may also contain limited exposure to other asset classes. If CDO transactions have a mixedportfolio of asset types, we may consider applying a combination of criteria, giving more weight tothe dominant asset type in the transaction's portfolio. We deem pools where the default amountsare predominantly driven by the non-corporate assets as CDOs of structured finance assets, CDOsof sovereign debt, or CDOs of municipal debt. These are subject to our criteria for such assets and
www.spglobal.com/ratingsdirect August 8, 2016 30
ARCHIVE | Criteria | Structured Finance | CDOs: Global Methodologies And Assumptions For Corporate Cash Flow And Synthetic CDOs

not to these corporate CDO criteria. If the structured finance assets in the corporate CDO arethemselves junior tranches of CDOs of structured finance assets, and if senior noteholders havecontrolling rights to cause the liquidation of the transaction collateral due to an event of defaultfrom a coverage test failure, then we deem all such tranches as having a zero recovery.
Debt issuance relative to asset value127. We believe that the market dislocation and liquidity squeeze in 2007-2009 made it more difficult
to differentiate between market discounted (but fundamentally attractive) assets and assets thatare distressed. When securitizing distressed debt assets the criteria limit the issuance of ratedCDO liabilities to what we believe to be the arm's-length purchase price of the assets, or to theamount of a third-party valuation. We believe this mitigates concerns about ratings arbitrage ormanagers attempting to exploit "loopholes." We do, however, have continuing concerns where:
- Deeply discounted collateral (of any type) is given par credit;
- Principal proceeds are recharacterized as interest proceeds;
- Structures allow large leakage of principal proceeds to equity investors; and
- Structures look to issue significantly more debt than the amount of money used to purchasethe assets.
128. For transactions that display any of those features, we consider the sources and uses for funds tobetter understand the economic benefit to all investors. If such information is not provided, or ifthere is more than a moderate difference between the proposed purchase price of the assets plusthe money retained in the transaction relative to the proposed amount of rated debt, then therating committee would likely cap (barring other mitigating factors) the amount of rated noteissuance to the economic value retained in the transaction. This analysis factors in the paymentpriorities of the transaction and the manner in which interest and principal proceeds can berecharacterized.
APPENDICES
A: Application Of Largest Obligor Test And Largest Industry Test
Largest obligor default test129. To demonstrate how we use this test, consider a hypothetical transaction (the "example CDO")
that has the capital structure shown in table 17 and a sequential-pay structure.
Table 17
Example CDO--Liability Structure
Class Rating Issuance ($)
A AAA 5,500
B A 1,000
C BB 1,000
www.spglobal.com/ratingsdirect August 8, 2016 31
ARCHIVE | Criteria | Structured Finance | CDOs: Global Methodologies And Assumptions For Corporate Cash Flow And Synthetic CDOs
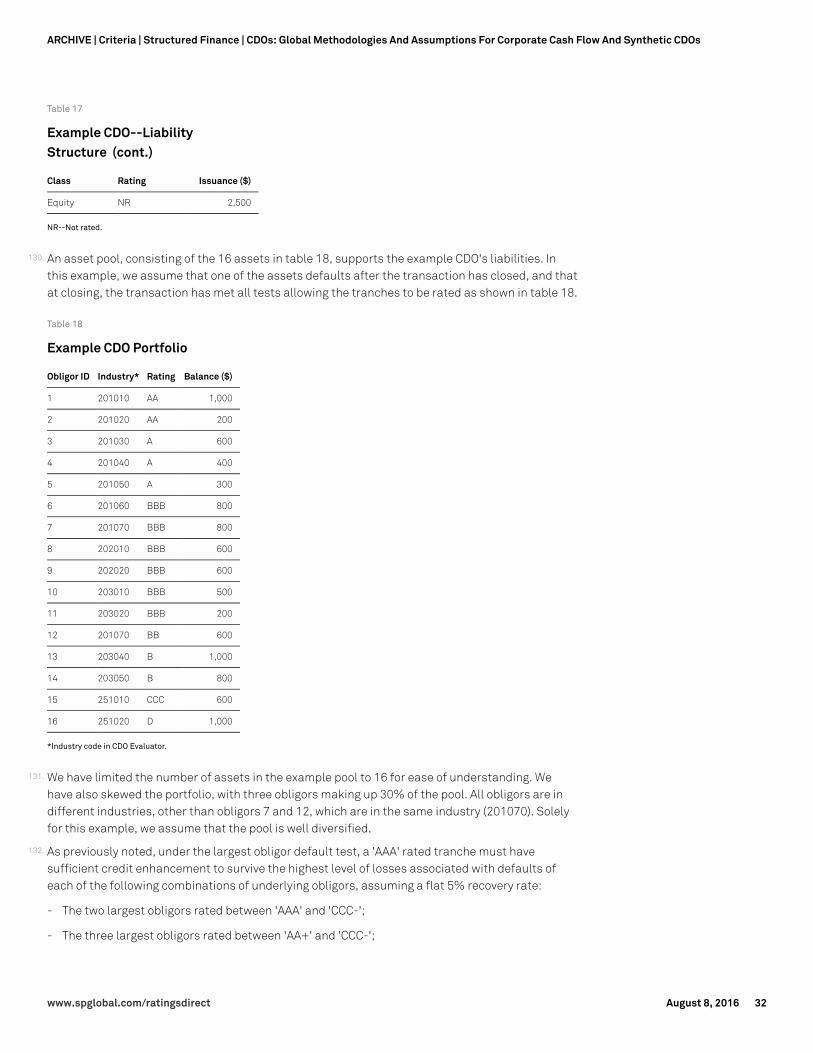
Table 17
Example CDO--LiabilityStructure (cont.)
Class Rating Issuance ($)
Equity NR 2,500
NR--Not rated.
130. An asset pool, consisting of the 16 assets in table 18, supports the example CDO's liabilities. Inthis example, we assume that one of the assets defaults after the transaction has closed, and thatat closing, the transaction has met all tests allowing the tranches to be rated as shown in table 18.
Table 18
Example CDO Portfolio
Obligor ID Industry* Rating Balance ($)
1 201010 AA 1,000
2 201020 AA 200
3 201030 A 600
4 201040 A 400
5 201050 A 300
6 201060 BBB 800
7 201070 BBB 800
8 202010 BBB 600
9 202020 BBB 600
10 203010 BBB 500
11 203020 BBB 200
12 201070 BB 600
13 203040 B 1,000
14 203050 B 800
15 251010 CCC 600
16 251020 D 1,000
*Industry code in CDO Evaluator.
131. We have limited the number of assets in the example pool to 16 for ease of understanding. Wehave also skewed the portfolio, with three obligors making up 30% of the pool. All obligors are indifferent industries, other than obligors 7 and 12, which are in the same industry (201070). Solelyfor this example, we assume that the pool is well diversified.
132. As previously noted, under the largest obligor default test, a 'AAA' rated tranche must havesufficient credit enhancement to survive the highest level of losses associated with defaults ofeach of the following combinations of underlying obligors, assuming a flat 5% recovery rate:
- The two largest obligors rated between 'AAA' and 'CCC-';
- The three largest obligors rated between 'AA+' and 'CCC-';
www.spglobal.com/ratingsdirect August 8, 2016 32
ARCHIVE | Criteria | Structured Finance | CDOs: Global Methodologies And Assumptions For Corporate Cash Flow And Synthetic CDOs
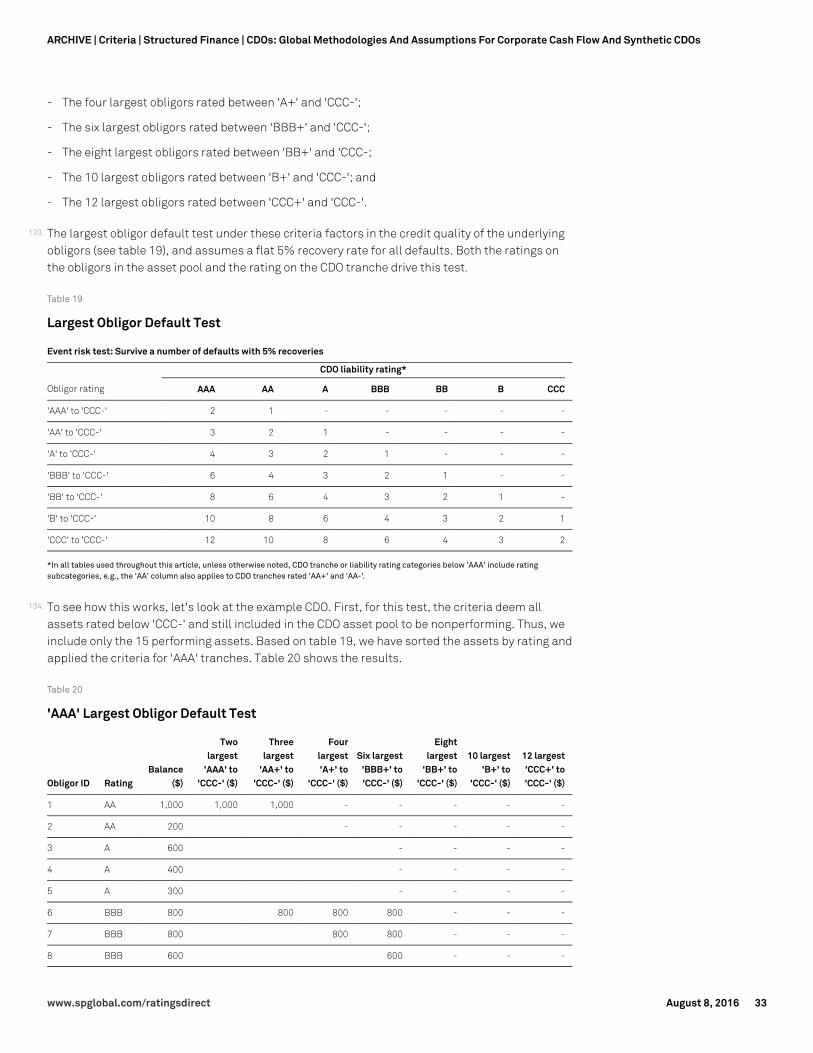
- The four largest obligors rated between 'A+' and 'CCC-';
- The six largest obligors rated between 'BBB+' and 'CCC-';
- The eight largest obligors rated between 'BB+' and 'CCC-;
- The 10 largest obligors rated between 'B+' and 'CCC-'; and
- The 12 largest obligors rated between 'CCC+' and 'CCC-'.
133. The largest obligor default test under these criteria factors in the credit quality of the underlyingobligors (see table 19), and assumes a flat 5% recovery rate for all defaults. Both the ratings onthe obligors in the asset pool and the rating on the CDO tranche drive this test.
Table 19
Largest Obligor Default Test
Event risk test: Survive a number of defaults with 5% recoveries
CDO liability rating*
Obligor rating AAA AA A BBB BB B CCC
'AAA' to 'CCC-' 2 1 - - - - -
'AA' to 'CCC-' 3 2 1 - - - -
'A' to 'CCC-' 4 3 2 1 - - -
'BBB' to 'CCC-' 6 4 3 2 1 - -
'BB' to 'CCC-' 8 6 4 3 2 1 -
'B' to 'CCC-' 10 8 6 4 3 2 1
'CCC' to 'CCC-' 12 10 8 6 4 3 2
*In all tables used throughout this article, unless otherwise noted, CDO tranche or liability rating categories below 'AAA' include ratingsubcategories, e.g., the 'AA' column also applies to CDO tranches rated 'AA+' and 'AA-'.
134. To see how this works, let's look at the example CDO. First, for this test, the criteria deem allassets rated below 'CCC-' and still included in the CDO asset pool to be nonperforming. Thus, weinclude only the 15 performing assets. Based on table 19, we have sorted the assets by rating andapplied the criteria for 'AAA' tranches. Table 20 shows the results.
Table 20
'AAA' Largest Obligor Default Test
Obligor ID RatingBalance
($)
Twolargest
'AAA' to'CCC-' ($)
Threelargest
'AA+' to'CCC-' ($)
Fourlargest'A+' to
'CCC-' ($)
Six largest'BBB+' to'CCC-' ($)
Eightlargest
'BB+' to'CCC-' ($)
10 largest'B+' to
'CCC-' ($)
12 largest'CCC+' to'CCC-' ($)
1 AA 1,000 1,000 1,000 - - - - -
2 AA 200 - - - - -
3 A 600 - - - -
4 A 400 - - - -
5 A 300 - - - -
6 BBB 800 800 800 800 - - -
7 BBB 800 800 800 - - -
8 BBB 600 600 - - -
www.spglobal.com/ratingsdirect August 8, 2016 33
ARCHIVE | Criteria | Structured Finance | CDOs: Global Methodologies And Assumptions For Corporate Cash Flow And Synthetic CDOs
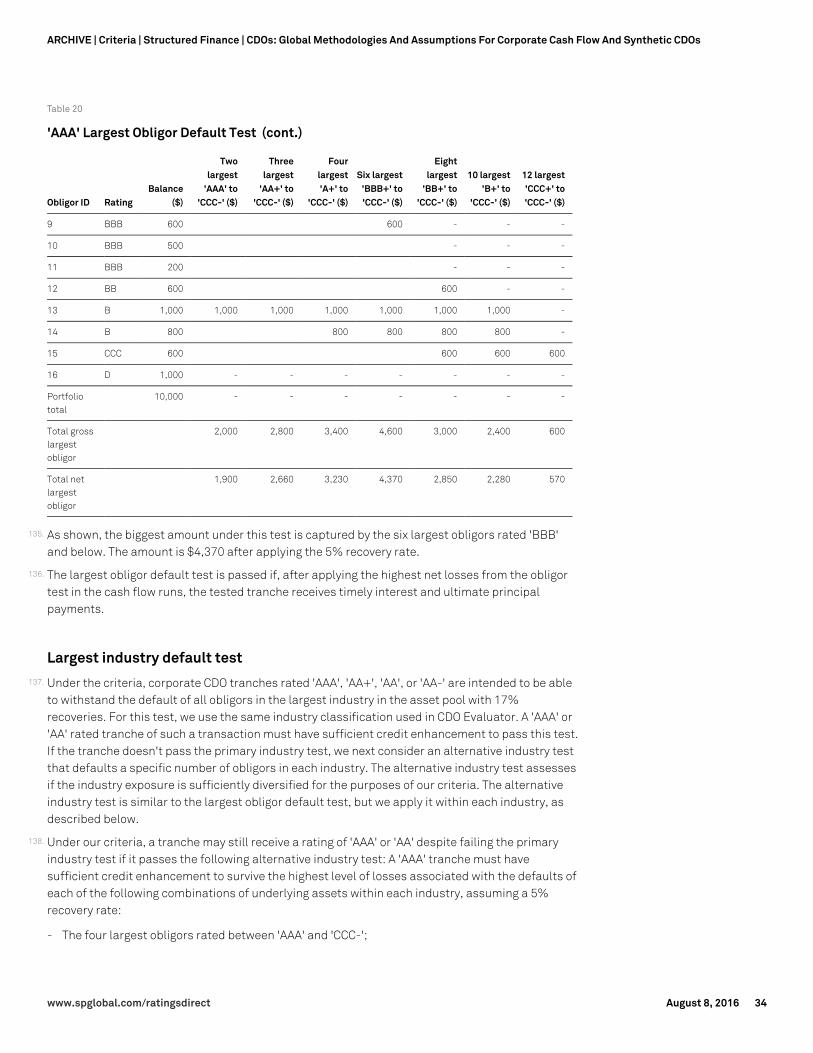
Table 20
'AAA' Largest Obligor Default Test (cont.)
Obligor ID RatingBalance
($)
Twolargest
'AAA' to'CCC-' ($)
Threelargest
'AA+' to'CCC-' ($)
Fourlargest'A+' to
'CCC-' ($)
Six largest'BBB+' to'CCC-' ($)
Eightlargest
'BB+' to'CCC-' ($)
10 largest'B+' to
'CCC-' ($)
12 largest'CCC+' to'CCC-' ($)
9 BBB 600 600 - - -
10 BBB 500 - - -
11 BBB 200 - - -
12 BB 600 600 - -
13 B 1,000 1,000 1,000 1,000 1,000 1,000 1,000 -
14 B 800 800 800 800 800 -
15 CCC 600 600 600 600
16 D 1,000 - - - - - - -
Portfoliototal
10,000 - - - - - - -
Total grosslargestobligor
2,000 2,800 3,400 4,600 3,000 2,400 600
Total netlargestobligor
1,900 2,660 3,230 4,370 2,850 2,280 570
135. As shown, the biggest amount under this test is captured by the six largest obligors rated 'BBB'and below. The amount is $4,370 after applying the 5% recovery rate.
136. The largest obligor default test is passed if, after applying the highest net losses from the obligortest in the cash flow runs, the tested tranche receives timely interest and ultimate principalpayments.
Largest industry default test137. Under the criteria, corporate CDO tranches rated 'AAA', 'AA+', 'AA', or 'AA-' are intended to be able
to withstand the default of all obligors in the largest industry in the asset pool with 17%recoveries. For this test, we use the same industry classification used in CDO Evaluator. A 'AAA' or'AA' rated tranche of such a transaction must have sufficient credit enhancement to pass this test.If the tranche doesn't pass the primary industry test, we next consider an alternative industry testthat defaults a specific number of obligors in each industry. The alternative industry test assessesif the industry exposure is sufficiently diversified for the purposes of our criteria. The alternativeindustry test is similar to the largest obligor default test, but we apply it within each industry, asdescribed below.
138. Under our criteria, a tranche may still receive a rating of 'AAA' or 'AA' despite failing the primaryindustry test if it passes the following alternative industry test: A 'AAA' tranche must havesufficient credit enhancement to survive the highest level of losses associated with the defaults ofeach of the following combinations of underlying assets within each industry, assuming a 5%recovery rate:
- The four largest obligors rated between 'AAA' and 'CCC-';
www.spglobal.com/ratingsdirect August 8, 2016 34
ARCHIVE | Criteria | Structured Finance | CDOs: Global Methodologies And Assumptions For Corporate Cash Flow And Synthetic CDOs
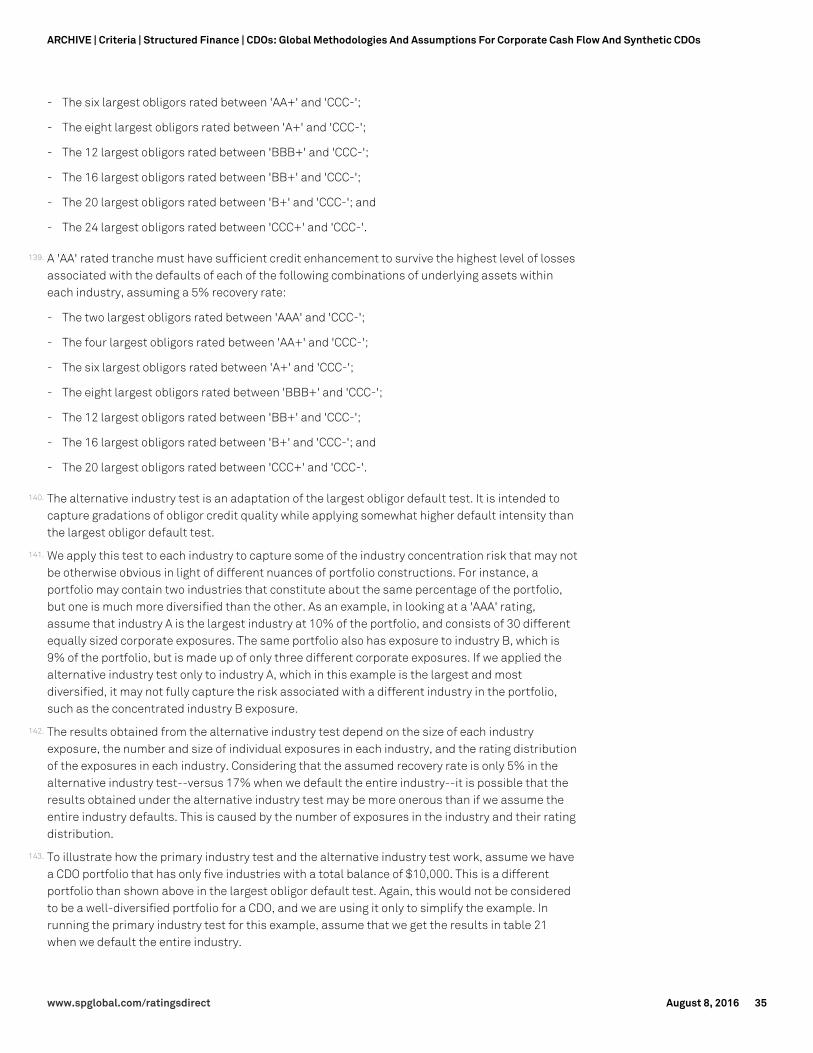
- The six largest obligors rated between 'AA+' and 'CCC-';
- The eight largest obligors rated between 'A+' and 'CCC-';
- The 12 largest obligors rated between 'BBB+' and 'CCC-';
- The 16 largest obligors rated between 'BB+' and 'CCC-';
- The 20 largest obligors rated between 'B+' and 'CCC-'; and
- The 24 largest obligors rated between 'CCC+' and 'CCC-'.
139. A 'AA' rated tranche must have sufficient credit enhancement to survive the highest level of lossesassociated with the defaults of each of the following combinations of underlying assets withineach industry, assuming a 5% recovery rate:
- The two largest obligors rated between 'AAA' and 'CCC-';
- The four largest obligors rated between 'AA+' and 'CCC-';
- The six largest obligors rated between 'A+' and 'CCC-';
- The eight largest obligors rated between 'BBB+' and 'CCC-';
- The 12 largest obligors rated between 'BB+' and 'CCC-';
- The 16 largest obligors rated between 'B+' and 'CCC-'; and
- The 20 largest obligors rated between 'CCC+' and 'CCC-'.
140. The alternative industry test is an adaptation of the largest obligor default test. It is intended tocapture gradations of obligor credit quality while applying somewhat higher default intensity thanthe largest obligor default test.
141. We apply this test to each industry to capture some of the industry concentration risk that may notbe otherwise obvious in light of different nuances of portfolio constructions. For instance, aportfolio may contain two industries that constitute about the same percentage of the portfolio,but one is much more diversified than the other. As an example, in looking at a 'AAA' rating,assume that industry A is the largest industry at 10% of the portfolio, and consists of 30 differentequally sized corporate exposures. The same portfolio also has exposure to industry B, which is9% of the portfolio, but is made up of only three different corporate exposures. If we applied thealternative industry test only to industry A, which in this example is the largest and mostdiversified, it may not fully capture the risk associated with a different industry in the portfolio,such as the concentrated industry B exposure.
142. The results obtained from the alternative industry test depend on the size of each industryexposure, the number and size of individual exposures in each industry, and the rating distributionof the exposures in each industry. Considering that the assumed recovery rate is only 5% in thealternative industry test--versus 17% when we default the entire industry--it is possible that theresults obtained under the alternative industry test may be more onerous than if we assume theentire industry defaults. This is caused by the number of exposures in the industry and their ratingdistribution.
143. To illustrate how the primary industry test and the alternative industry test work, assume we havea CDO portfolio that has only five industries with a total balance of $10,000. This is a differentportfolio than shown above in the largest obligor default test. Again, this would not be consideredto be a well-diversified portfolio for a CDO, and we are using it only to simplify the example. Inrunning the primary industry test for this example, assume that we get the results in table 21when we default the entire industry.
www.spglobal.com/ratingsdirect August 8, 2016 35
ARCHIVE | Criteria | Structured Finance | CDOs: Global Methodologies And Assumptions For Corporate Cash Flow And Synthetic CDOs
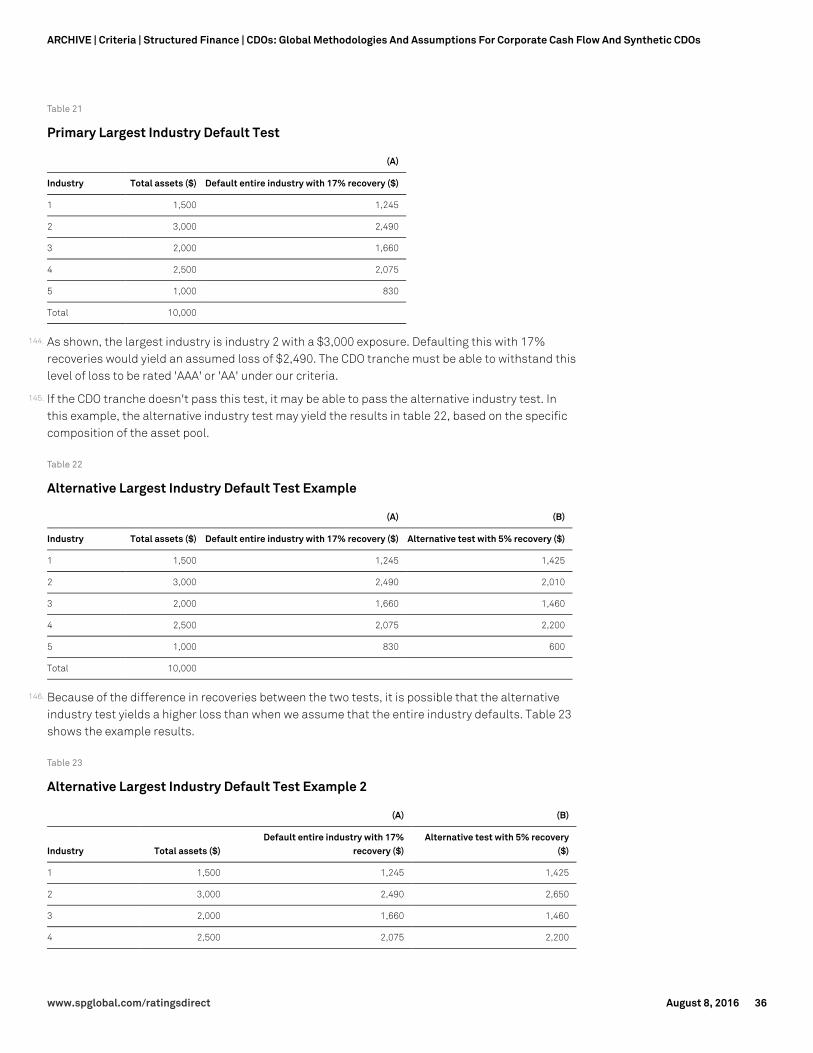
Table 21
Primary Largest Industry Default Test
(A)
Industry Total assets ($) Default entire industry with 17% recovery ($)
1 1,500 1,245
2 3,000 2,490
3 2,000 1,660
4 2,500 2,075
5 1,000 830
Total 10,000
144. As shown, the largest industry is industry 2 with a $3,000 exposure. Defaulting this with 17%recoveries would yield an assumed loss of $2,490. The CDO tranche must be able to withstand thislevel of loss to be rated 'AAA' or 'AA' under our criteria.
145. If the CDO tranche doesn't pass this test, it may be able to pass the alternative industry test. Inthis example, the alternative industry test may yield the results in table 22, based on the specificcomposition of the asset pool.
Table 22
Alternative Largest Industry Default Test Example
(A) (B)
Industry Total assets ($) Default entire industry with 17% recovery ($) Alternative test with 5% recovery ($)
1 1,500 1,245 1,425
2 3,000 2,490 2,010
3 2,000 1,660 1,460
4 2,500 2,075 2,200
5 1,000 830 600
Total 10,000
146. Because of the difference in recoveries between the two tests, it is possible that the alternativeindustry test yields a higher loss than when we assume that the entire industry defaults. Table 23shows the example results.
Table 23
Alternative Largest Industry Default Test Example 2
(A) (B)
Industry Total assets ($)Default entire industry with 17%
recovery ($)Alternative test with 5% recovery
($)
1 1,500 1,245 1,425
2 3,000 2,490 2,650
3 2,000 1,660 1,460
4 2,500 2,075 2,200
www.spglobal.com/ratingsdirect August 8, 2016 36
ARCHIVE | Criteria | Structured Finance | CDOs: Global Methodologies And Assumptions For Corporate Cash Flow And Synthetic CDOs
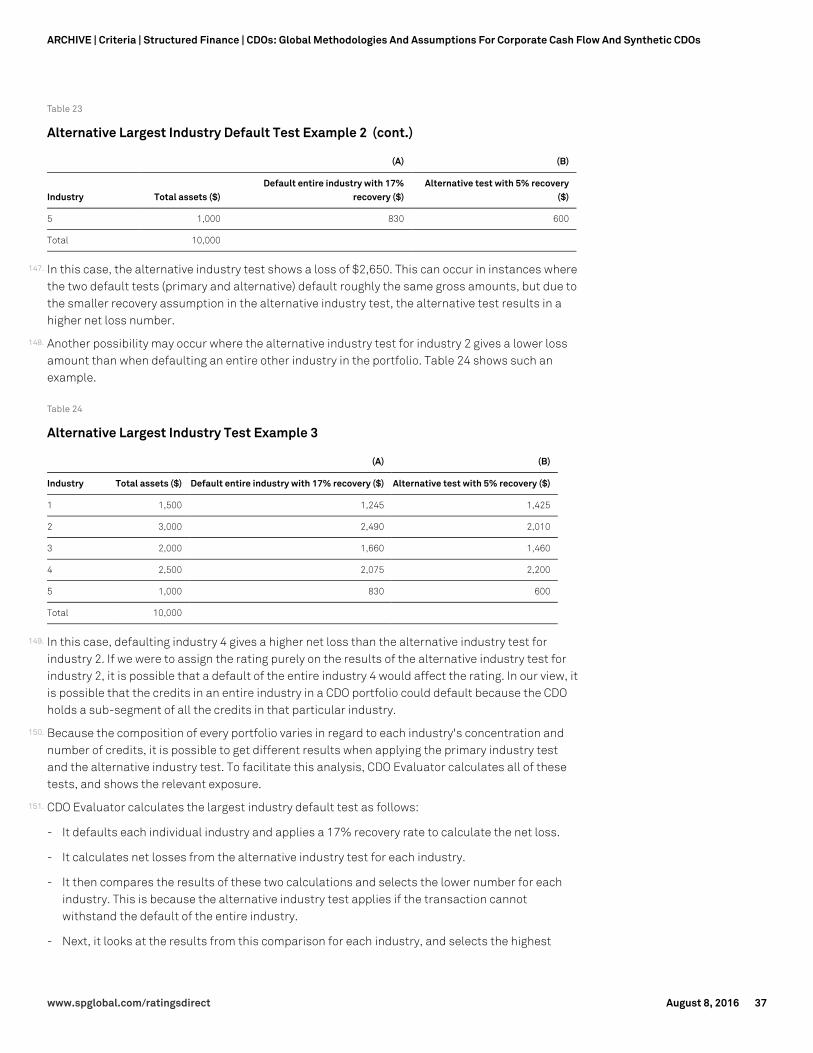
Table 23
Alternative Largest Industry Default Test Example 2 (cont.)
(A) (B)
Industry Total assets ($)Default entire industry with 17%
recovery ($)Alternative test with 5% recovery
($)
5 1,000 830 600
Total 10,000
147. In this case, the alternative industry test shows a loss of $2,650. This can occur in instances wherethe two default tests (primary and alternative) default roughly the same gross amounts, but due tothe smaller recovery assumption in the alternative industry test, the alternative test results in ahigher net loss number.
148. Another possibility may occur where the alternative industry test for industry 2 gives a lower lossamount than when defaulting an entire other industry in the portfolio. Table 24 shows such anexample.
Table 24
Alternative Largest Industry Test Example 3
(A) (B)
Industry Total assets ($) Default entire industry with 17% recovery ($) Alternative test with 5% recovery ($)
1 1,500 1,245 1,425
2 3,000 2,490 2,010
3 2,000 1,660 1,460
4 2,500 2,075 2,200
5 1,000 830 600
Total 10,000
149. In this case, defaulting industry 4 gives a higher net loss than the alternative industry test forindustry 2. If we were to assign the rating purely on the results of the alternative industry test forindustry 2, it is possible that a default of the entire industry 4 would affect the rating. In our view, itis possible that the credits in an entire industry in a CDO portfolio could default because the CDOholds a sub-segment of all the credits in that particular industry.
150. Because the composition of every portfolio varies in regard to each industry's concentration andnumber of credits, it is possible to get different results when applying the primary industry testand the alternative industry test. To facilitate this analysis, CDO Evaluator calculates all of thesetests, and shows the relevant exposure.
151. CDO Evaluator calculates the largest industry default test as follows:
- It defaults each individual industry and applies a 17% recovery rate to calculate the net loss.
- It calculates net losses from the alternative industry test for each industry.
- It then compares the results of these two calculations and selects the lower number for eachindustry. This is because the alternative industry test applies if the transaction cannotwithstand the default of the entire industry.
- Next, it looks at the results from this comparison for each industry, and selects the highest
www.spglobal.com/ratingsdirect August 8, 2016 37
ARCHIVE | Criteria | Structured Finance | CDOs: Global Methodologies And Assumptions For Corporate Cash Flow And Synthetic CDOs

amount for both the 'AAA' and 'AA' liability ratings.
152. Under our criteria, this is the minimum level of default the transaction must withstand for us toassign a 'AAA' or 'AA' rating. Based on each portfolio's composition, it is possible under our criteriathat any one of four outcomes can control the primary industry test and the alternative industrytest, as shown below.
153. Outcome 1. The default of the largest entire industry with 17% recoveries is the controlling test, asthe alternative industry test yields higher defaults (see table 25).
Table 25
Largest Industry Test Outcome 1
(A) (B) (C)
IndustryTotal assets
($)Default entire industry with
17% recovery ($)Alternative test with 5%
recovery ($)Lower of (A) or (B) for the all
industries ($)
1 1,500 1,245 1,425 1,245
2 3,000 2,490 2,650 2,490
3 2,000 1,660 1,460 1,460
4 2,500 2,075 2,200 2,075
5 1,000 830 600 600
Total 10,000 Max of (C)=> 2,490
154. Outcome 2. The alternative industry test for the largest industry in the portfolio yields the largestnet loss (see table 26).
Table 26
Largest Industry Test Outcome 2
(A) (B) (C)
IndustryTotal assets
($)Default entire industry with
17% recovery ($)Alternative test with 5%
recovery ($)Lower of (A) or (B) for the all
industries ($)
1 1,500 1,245 1,425 1,245
2 3,000 2,490 2,300 2,300
3 2,000 1,660 1,460 1,460
4 2,500 2,075 2,200 2,075
5 1,000 830 600 600
Total 10,000 Max of (C)=> 2,300
155. Outcome 3. The default of an entire industry smaller than the largest industry, with 17%recoveries, is the controlling test because the alternative industry test on the largest industryyields lower defaults (see table 27).
www.spglobal.com/ratingsdirect August 8, 2016 38
ARCHIVE | Criteria | Structured Finance | CDOs: Global Methodologies And Assumptions For Corporate Cash Flow And Synthetic CDOs
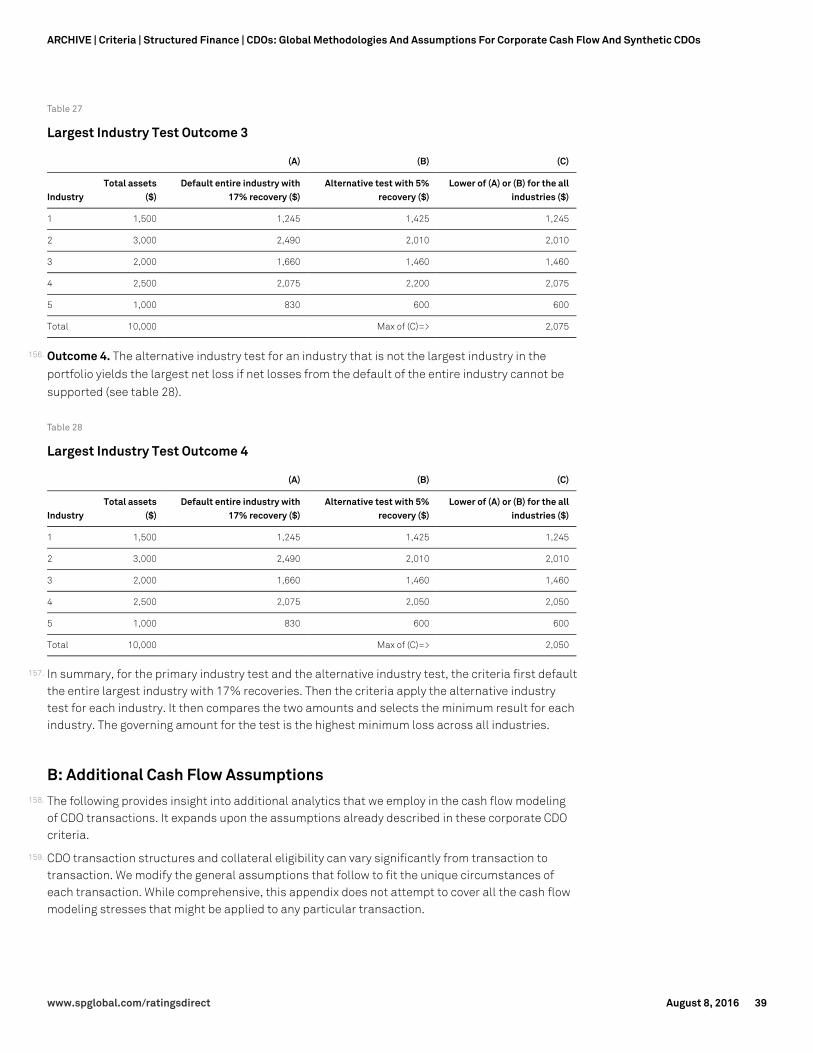
Table 27
Largest Industry Test Outcome 3
(A) (B) (C)
IndustryTotal assets
($)Default entire industry with
17% recovery ($)Alternative test with 5%
recovery ($)Lower of (A) or (B) for the all
industries ($)
1 1,500 1,245 1,425 1,245
2 3,000 2,490 2,010 2,010
3 2,000 1,660 1,460 1,460
4 2,500 2,075 2,200 2,075
5 1,000 830 600 600
Total 10,000 Max of (C)=> 2,075
156. Outcome 4. The alternative industry test for an industry that is not the largest industry in theportfolio yields the largest net loss if net losses from the default of the entire industry cannot besupported (see table 28).
Table 28
Largest Industry Test Outcome 4
(A) (B) (C)
IndustryTotal assets
($)Default entire industry with
17% recovery ($)Alternative test with 5%
recovery ($)Lower of (A) or (B) for the all
industries ($)
1 1,500 1,245 1,425 1,245
2 3,000 2,490 2,010 2,010
3 2,000 1,660 1,460 1,460
4 2,500 2,075 2,050 2,050
5 1,000 830 600 600
Total 10,000 Max of (C)=> 2,050
157. In summary, for the primary industry test and the alternative industry test, the criteria first defaultthe entire largest industry with 17% recoveries. Then the criteria apply the alternative industrytest for each industry. It then compares the two amounts and selects the minimum result for eachindustry. The governing amount for the test is the highest minimum loss across all industries.
B: Additional Cash Flow Assumptions158. The following provides insight into additional analytics that we employ in the cash flow modeling
of CDO transactions. It expands upon the assumptions already described in these corporate CDOcriteria.
159. CDO transaction structures and collateral eligibility can vary significantly from transaction totransaction. We modify the general assumptions that follow to fit the unique circumstances ofeach transaction. While comprehensive, this appendix does not attempt to cover all the cash flowmodeling stresses that might be applied to any particular transaction.
www.spglobal.com/ratingsdirect August 8, 2016 39
ARCHIVE | Criteria | Structured Finance | CDOs: Global Methodologies And Assumptions For Corporate Cash Flow And Synthetic CDOs
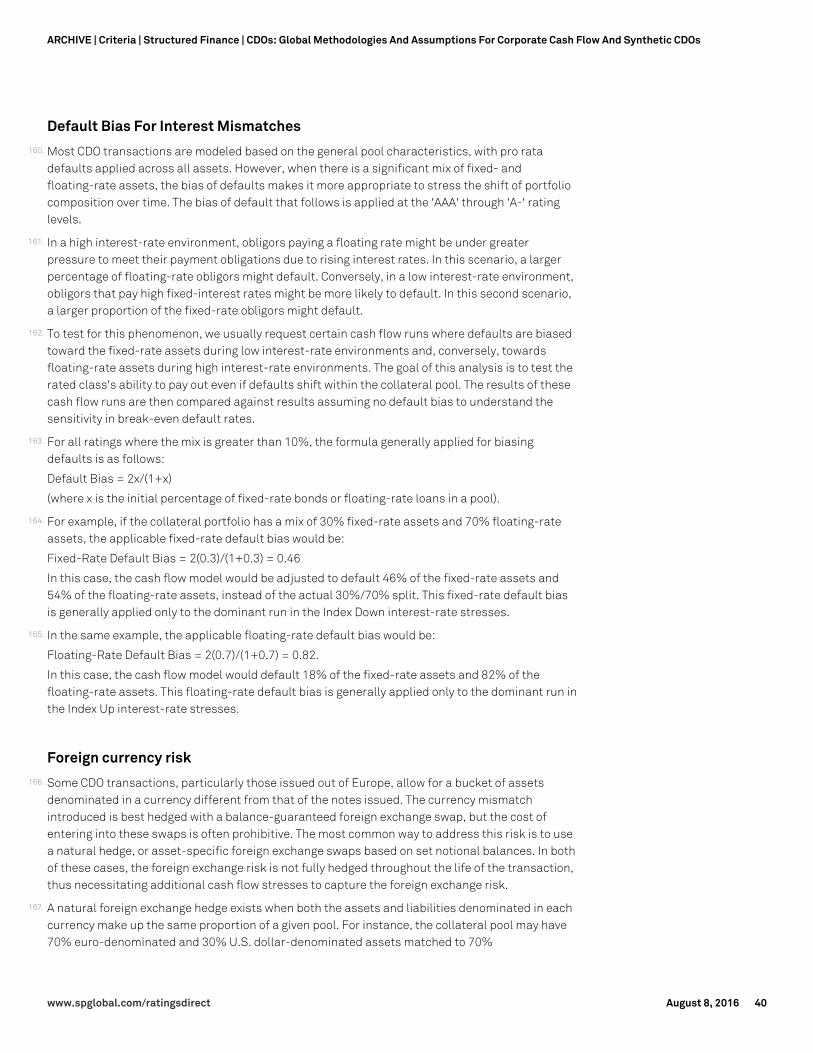
Default Bias For Interest Mismatches160. Most CDO transactions are modeled based on the general pool characteristics, with pro rata
defaults applied across all assets. However, when there is a significant mix of fixed- andfloating-rate assets, the bias of defaults makes it more appropriate to stress the shift of portfoliocomposition over time. The bias of default that follows is applied at the 'AAA' through 'A-' ratinglevels.
161. In a high interest-rate environment, obligors paying a floating rate might be under greaterpressure to meet their payment obligations due to rising interest rates. In this scenario, a largerpercentage of floating-rate obligors might default. Conversely, in a low interest-rate environment,obligors that pay high fixed-interest rates might be more likely to default. In this second scenario,a larger proportion of the fixed-rate obligors might default.
162. To test for this phenomenon, we usually request certain cash flow runs where defaults are biasedtoward the fixed-rate assets during low interest-rate environments and, conversely, towardsfloating-rate assets during high interest-rate environments. The goal of this analysis is to test therated class's ability to pay out even if defaults shift within the collateral pool. The results of thesecash flow runs are then compared against results assuming no default bias to understand thesensitivity in break-even default rates.
163. For all ratings where the mix is greater than 10%, the formula generally applied for biasingdefaults is as follows:
Default Bias = 2x/(1+x)
(where x is the initial percentage of fixed-rate bonds or floating-rate loans in a pool).
164. For example, if the collateral portfolio has a mix of 30% fixed-rate assets and 70% floating-rateassets, the applicable fixed-rate default bias would be:
Fixed-Rate Default Bias = 2(0.3)/(1+0.3) = 0.46
In this case, the cash flow model would be adjusted to default 46% of the fixed-rate assets and54% of the floating-rate assets, instead of the actual 30%/70% split. This fixed-rate default biasis generally applied only to the dominant run in the Index Down interest-rate stresses.
165. In the same example, the applicable floating-rate default bias would be:
Floating-Rate Default Bias = 2(0.7)/(1+0.7) = 0.82.
In this case, the cash flow model would default 18% of the fixed-rate assets and 82% of thefloating-rate assets. This floating-rate default bias is generally applied only to the dominant run inthe Index Up interest-rate stresses.
Foreign currency risk166. Some CDO transactions, particularly those issued out of Europe, allow for a bucket of assets
denominated in a currency different from that of the notes issued. The currency mismatchintroduced is best hedged with a balance-guaranteed foreign exchange swap, but the cost ofentering into these swaps is often prohibitive. The most common way to address this risk is to usea natural hedge, or asset-specific foreign exchange swaps based on set notional balances. In bothof these cases, the foreign exchange risk is not fully hedged throughout the life of the transaction,thus necessitating additional cash flow stresses to capture the foreign exchange risk.
167. A natural foreign exchange hedge exists when both the assets and liabilities denominated in eachcurrency make up the same proportion of a given pool. For instance, the collateral pool may have70% euro-denominated and 30% U.S. dollar-denominated assets matched to 70%
www.spglobal.com/ratingsdirect August 8, 2016 40
ARCHIVE | Criteria | Structured Finance | CDOs: Global Methodologies And Assumptions For Corporate Cash Flow And Synthetic CDOs

euro-denominated and 30% U.S. dollar-denominated liabilities, thereby creating a natural hedge.However, this natural hedge often does not immunize the CDO against foreign exchange risk. Thishedge remains perfectly balanced so long as defaults to the assets occur pro rata across thecurrency denominations. If defaults do not occur in proportion (the more likely scenario), theresultant imbalance would throw the natural hedge askew. The balance of the natural hedge couldalso be upset by prepayments on the assets or diversion of principal proceeds to pay downliabilities in a sequential pay structure triggered by the breach of a coverage test.
168. The effectiveness of a natural hedge is also dependent upon its position in the capital structure.Segregating the most senior class of notes across the currencies is more effective thansegregating a more junior class.
169. The other common strategy for addressing foreign exchange risk is to use asset-specific foreignexchange swaps. The issuer of the securities enters into a foreign exchange swap, often for a setnotional balance or a schedule of notional balances. This hedging strategy is likewise susceptibleto hedging imbalances due to the bias of defaults or prepayments on the asset balance.
170. In the absence of a strategy that adequately addresses foreign exchange risk over the life of thetransaction, we typically employ a two-part analysis to test for the potential effect of this risk.First, the cash flow is subjected to additional stresses that bias defaults toward each of thecurrency denominations. The magnitude of the bias is dictated by factors that include the positionof the natural hedge in the capital structure, the proportion of assets denominated in eachcurrency, and the disparity of the credit risk profiles between each currency-denominatedsub-portfolio. Currency devaluation factors, calculated using a currency devaluation model, arethen applied to the resultant hedge imbalance to size the extent of the currency mismatch.
171. The presence of different indices (e.g., LIBOR and EURIBOR) in transactions with multiplecurrencies might also necessitate additional analysis to capture the mismatch of indices. Theempirical relative movement of the indices and the magnitude of the mismatch determine thisneed.
172. We should be consulted for the default bias, currency devaluation stresses, and index mismatchstresses applicable to each particular transaction.
173. In addition to hedging the periodic payments, the foreign exchange strategy should remain inplace to cover the recoveries realized on defaulted securities. Automatic termination of theforeign-exchange swap upon default of an asset exposes the recoveries to foreign-exchange risk.We typically adjust the recovery rate assigned when the swap is required to terminate before thebase recovery delay assumptions. The magnitude of this adjustment is determined according tofactors such as the length of time the defaulted asset is exposed to foreign-exchange risk and theparticular currencies involved.
174. Foreign-exchange risk also arises when an asset is sold, but the asset-specific foreign-exchangeswap is not automatically retired or, conversely, the foreign-exchange swap terminates before theasset matures. In the first instance, the collateral manager is likely to include the economic effectof the swap in making its sell decision and, in the latter, the manager might sell the unhedgedasset to eliminate foreign-exchange concerns. In both cases, noncredit-based considerations arefactored into the decision process, and we consider adjusting the recovery rate assigned.
Interest income on eligible investments175. Proceeds received from assets in the form of scheduled principal and interest payments and
recovery proceeds are held in eligible investments before being reinvested in substitute collateralor being used to pay liabilities on a payment date.
www.spglobal.com/ratingsdirect August 8, 2016 41
ARCHIVE | Criteria | Structured Finance | CDOs: Global Methodologies And Assumptions For Corporate Cash Flow And Synthetic CDOs
176. In the cash flow model, the analysis assumes that scheduled principal and interest proceeds areheld in eligible investments for one-half of the payment period of the collection before it isreinvested in substitute collateral. Also, in the analysis, recoveries are assumed to occur at theend of a payment period. Therefore, interest is not earned on recovery proceeds held as eligibleinvestments during the period in which it is recovered.
177. Interest earned on the regular payments received from the eligible investments is modeled at theindex referenced minus 100 basis points with a floor of 0%. In instances where transactions mayuse proceeds to pay interest on eligible investments as a result of negative interest rates, we mayconsider applying additional stresses, absent any mitigants.
Payment timing mismatch178. It is common for transactions to include a bucket for assets that pay less frequently than the
payment terms of the liabilities. In many instances, the transaction uses an interest reservemechanism or enters into a basis swap to address this mismatch. In the absence of an adequatemitigant, the modeling should reflect the mismatches in payment timing as they actually occur, toallow for accurate testing of cash flows. There should be no "smoothing" of asset payments tomatch liability payments.
Pay-in-kind (PIK) assets179. When more than 5% of the assets in a portfolio by par balance have the ability to pay in kind, we
apply a PIK stress test to ensure that the liquidity facility can cover interest shortfalls from theassets. The PIK stress applied is determined after taking into account the transaction structureand targeted portfolio profile. This is typically done only for the most severe stress case to verify ifit can pass; BDRs may be set without this stress. For example, a transaction that allows for thepurchase of PIK assets up to 7.5% of the portfolio by par balance would only be subject to a PIKstress on 2.5%--the amount in excess of 5% and not the entire 7.5% permitted under thedocuments.
180. Some transactions treat assets that pay in kind for a defined time period as defaulted assets. Thedefaulted balance of the PIK assets are marked as the original par principal balance, not itsprincipal plus accrued interest balance.
Long-dated corporate assets181. The inclusion of corporate assets that mature on a date beyond the legal final maturity date of the
liabilities requires that the CDO transaction sell these assets before this date. This exposes thetransaction to the noncredit-related risk of loss of par and is particularly troublesome forcorporate bonds and other types of instruments that return all or substantially all of the parbalance at the asset's legal final maturity date.
182. We address this concern by limiting the concentration of assets in the long-dated bucket to 5%.When the allowance for this bucket exceeds 5%, the par credit for each long-dated asset in excessof the 5% is reduced by applying a 10% discount rate per year to each principal payment due onthe asset beyond the legal final maturity date of the transaction. This adjustment reflects apotential par loss incurred for the forced sale of the asset under less than ideal market conditions.We may also apply additional stresses depending upon the size of exposure to long-dated assets.For example, if a transaction had 20% exposure to long-dated assets, we might haircut the excessamount (15% in this example) by amounts consistent with those indicated in our market value
www.spglobal.com/ratingsdirect August 8, 2016 42
ARCHIVE | Criteria | Structured Finance | CDOs: Global Methodologies And Assumptions For Corporate Cash Flow And Synthetic CDOs
criteria (see "Methodology And Assumptions For Market Value Securities," published Sept. 17,2013), especially as the number of years remaining until the transaction's legal final maturitydecrease.
183. This approach applies only to corporate assets. Long-dated structured finance assets raisedifferent issues that are beyond the scope of this article.
Corporate mezzanine loans184. Corporate mezzanine loans are common to many European leveraged loan CDO transactions.
These loans have a junior secured position and typically have two components to their interestpayments--a current-pay coupon and a PIK coupon. The latter coupon is structured in the loandocuments to pay in kind from day 1 and accrues to principal; in effect, it behaves like a zerocoupon bond.
185. Although a mezzanine loan typically has a 10-year tenor, it is quite likely that it will be refinancedwithin two to three years. The ability of a CDO manager to reinvest in new mezzanine loansdepends on the length of the reinvestment period, the ability of the manager to reinvestunscheduled principal proceeds after the end of the reinvestment period, and any maturityrestriction imposed on each new loan. Given the current lack of a secondary market for Europeanmezzanine loans, it is unlikely that a manager will be able to maintain its desired/covenantedmezzanine loan balance throughout the transaction.
186. We give credit to the accrued portion of the PIK coupon component in the cash flow modeling,subject to the following conditions:
- Credit for the accrual of the PIK coupon is typically allowed for the reinvestment period plus anadditional 2.5 years. The amount of credit would have to be reduced if the maturity of the CDOnotes or the WAL test of the assets prevents reinvestment of mezzanine loans during thereinvestment period. Conversely, if the CDO transaction is structured with a long note maturityand unscheduled proceeds can be reinvested after the reinvestment period, then we considerextending the credit given to the PIK coupon.
- For the purpose of the coverage tests, credit is extended to the accrued PIK interest in theovercollateralization test so long as the accrued interest is treated as principal proceeds; creditis not given in the interest coverage test because no interest is received in cash during thepayment periods.
- The asset eligibility guidelines for the transaction should include covenants for a minimummezzanine loan bucket and a minimum PIK interest rate for the mezzanine loans. This isneeded to size aggregate credit to extend to the accrued PIK interest.
- For purposes of default and recovery, the defaulted balance is calculated as the product of thedefault probability and the par balance inclusive of the accrued PIK interest. The recoverybalance is calculated as the product of the recovery rate and the base par. Accrued PIK balanceis excluded.
187. The recovery range for corporate loans is used in the assignment of recovery rates to mezzanineloans.
Haircut for low-rated collateral188. While a certain concentration of 'CCC' rated assets is not necessarily bad, especially if factored
into the original class sizing of the transaction, 'CCC' rated assets have a tendency to be
www.spglobal.com/ratingsdirect August 8, 2016 43
ARCHIVE | Criteria | Structured Finance | CDOs: Global Methodologies And Assumptions For Corporate Cash Flow And Synthetic CDOs
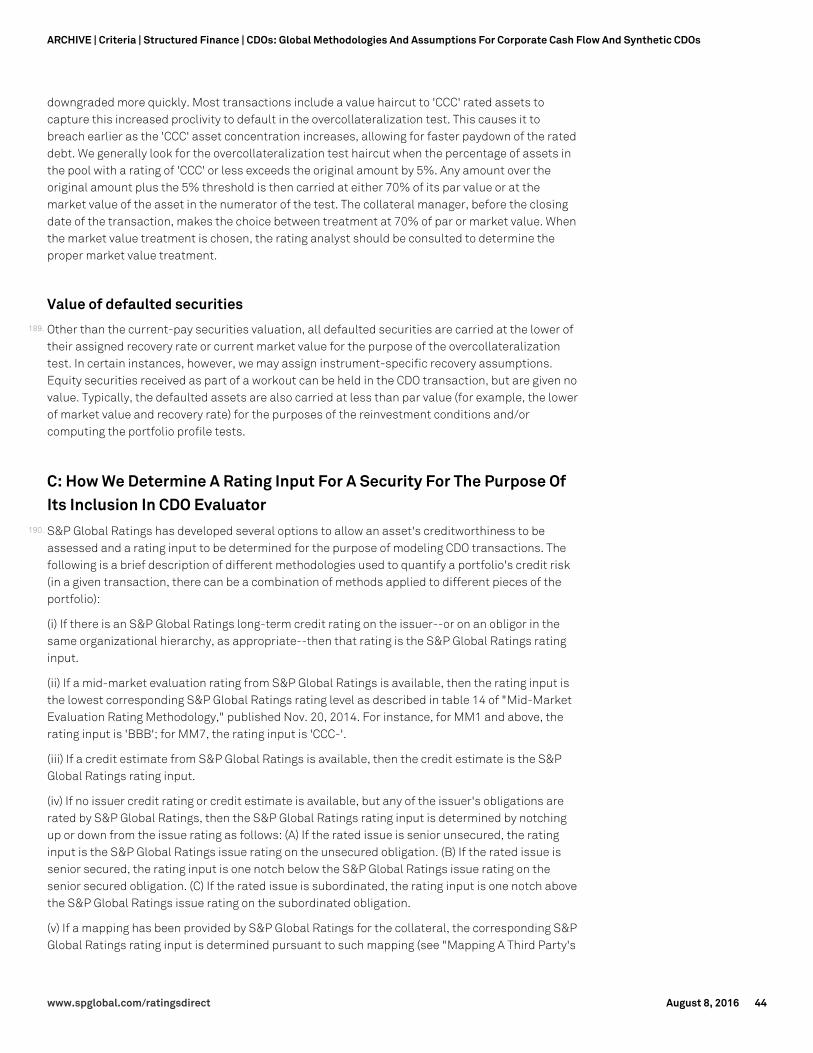
downgraded more quickly. Most transactions include a value haircut to 'CCC' rated assets tocapture this increased proclivity to default in the overcollateralization test. This causes it tobreach earlier as the 'CCC' asset concentration increases, allowing for faster paydown of the rateddebt. We generally look for the overcollateralization test haircut when the percentage of assets inthe pool with a rating of 'CCC' or less exceeds the original amount by 5%. Any amount over theoriginal amount plus the 5% threshold is then carried at either 70% of its par value or at themarket value of the asset in the numerator of the test. The collateral manager, before the closingdate of the transaction, makes the choice between treatment at 70% of par or market value. Whenthe market value treatment is chosen, the rating analyst should be consulted to determine theproper market value treatment.
Value of defaulted securities189. Other than the current-pay securities valuation, all defaulted securities are carried at the lower of
their assigned recovery rate or current market value for the purpose of the overcollateralizationtest. In certain instances, however, we may assign instrument-specific recovery assumptions.Equity securities received as part of a workout can be held in the CDO transaction, but are given novalue. Typically, the defaulted assets are also carried at less than par value (for example, the lowerof market value and recovery rate) for the purposes of the reinvestment conditions and/orcomputing the portfolio profile tests.
C: How We Determine A Rating Input For A Security For The Purpose OfIts Inclusion In CDO Evaluator
190. S&P Global Ratings has developed several options to allow an asset's creditworthiness to beassessed and a rating input to be determined for the purpose of modeling CDO transactions. Thefollowing is a brief description of different methodologies used to quantify a portfolio's credit risk(in a given transaction, there can be a combination of methods applied to different pieces of theportfolio):
(i) If there is an S&P Global Ratings long-term credit rating on the issuer--or on an obligor in thesame organizational hierarchy, as appropriate--then that rating is the S&P Global Ratings ratinginput.
(ii) If a mid-market evaluation rating from S&P Global Ratings is available, then the rating input isthe lowest corresponding S&P Global Ratings rating level as described in table 14 of "Mid-MarketEvaluation Rating Methodology," published Nov. 20, 2014. For instance, for MM1 and above, therating input is 'BBB'; for MM7, the rating input is 'CCC-'.
(iii) If a credit estimate from S&P Global Ratings is available, then the credit estimate is the S&PGlobal Ratings rating input.
(iv) If no issuer credit rating or credit estimate is available, but any of the issuer's obligations arerated by S&P Global Ratings, then the S&P Global Ratings rating input is determined by notchingup or down from the issue rating as follows: (A) If the rated issue is senior unsecured, the ratinginput is the S&P Global Ratings issue rating on the unsecured obligation. (B) If the rated issue issenior secured, the rating input is one notch below the S&P Global Ratings issue rating on thesenior secured obligation. (C) If the rated issue is subordinated, the rating input is one notch abovethe S&P Global Ratings issue rating on the subordinated obligation.
(v) If a mapping has been provided by S&P Global Ratings for the collateral, the corresponding S&PGlobal Ratings rating input is determined pursuant to such mapping (see "Mapping A Third Party's
www.spglobal.com/ratingsdirect August 8, 2016 44
ARCHIVE | Criteria | Structured Finance | CDOs: Global Methodologies And Assumptions For Corporate Cash Flow And Synthetic CDOs
Internal Credit Scoring System To Standard & Poor's Global Rating Scale," published May 8, 2014).
(vi) If there is another NRSRO rating on the issuer and (1) it is a public rating and (2) it isunqualified, then the corresponding S&P Global Ratings rating input is determined by applying thestatistical analysis described in step 3 of our mapping criteria to the credit rating scale of theother NRSRO. The output of the analysis ("notched rating") is used to derive an adjustment to theother NRSRO's credit ratings. When the issuer or issue has ratings from multiple NRSROs, thelowest of all the notched ratings is used. The portion of the principal balance of the collateral thathas S&P Global Ratings' equivalent rating inputs assigned in this way may not exceed 15%.
(vii) If (1) neither the issuer nor any of its affiliates is subject to reorganization, bankruptcy, orsimilar proceedings and (2) all the issuer's obligations are current and the collateral managerbelieves they will remain current, then the corresponding S&P Global Ratings rating input for suchan obligation is 'CCC-'.
(viii) With respect to collateral obligations whose rating input cannot be determined using any ofthe steps described in subparagraphs (i) through (vii) above, then the corresponding S&P GlobalRatings rating input is 'CC'.
(ix) For debtor-in-possession (DIP) financings, the issue level's point-in-time rating may be usedas the S&P Global Ratings rating input for a maximum of 12 months from its initial assignment.However, we may further limit the use of the point-in-time rating if we believe that the creditquality of the DIP loan has deteriorated since its assignment. In order to make this assessment,we may request the collateral manager to provide information related to the DIP loan, such asamortization modifications, extensions of maturity, reductions of its principal amount owed, ornonpayment of timely interest or principal due. The collateral manager will also provide any otherinformation that, in his or her reasonable business judgment, may have a material adverse impacton the credit quality of the DIP asset.
(x) For the purpose of determining the S&P Global Ratings rating input: (1) If the rating assigned byS&P Global Ratings to an obligor or its obligations is on CreditWatch positive, such rating input willbe treated as being one subcategory above the assigned rating. (2) If the applicable ratingassigned by S&P Global Ratings to an obligor or its obligations is on CreditWatch negative, suchrating input will be treated as being one subcategory below the assigned rating.
191. After applying the statistical analysis as described in (v) above, we believe that applying aone-notch downward adjustment for investment-grade and two-notch downward adjustment forspeculative-grade to Moody's and Fitch's corporate ratings is appropriate.
D: Explanation Of Cohort Methodology For Asset Defaults192. We conduct our default studies based on static pools or cohort groupings, and create static pools
by grouping corporate issuers by rating category at the beginning of each period covered by thestudy. We observe the default and rating transition behavior of each static pool from that pointforward. We assigned all corporate issuers included in the study to one or more static pools. Whenan issuer defaults, a default is realized in every cohort to which that obligor is included.
193. We use the static pool methodology to avoid certain pitfalls in estimating default rates. Thisenables default rates to account for rating migration and allows for default rates to be calculatedacross multi-period time horizons. Some methods for calculating default and rating transitionrates might assign defaults against only the initial rating on the corporate asset while ignoringmore recent rating changes that supply more current information. Other methods may calculatedefault rates using only the most recent year's default and rating data; however, this method mayyield comparatively low default rates during periods of high rating activity, as it ignores prior years'
www.spglobal.com/ratingsdirect August 8, 2016 45
ARCHIVE | Criteria | Structured Finance | CDOs: Global Methodologies And Assumptions For Corporate Cash Flow And Synthetic CDOs
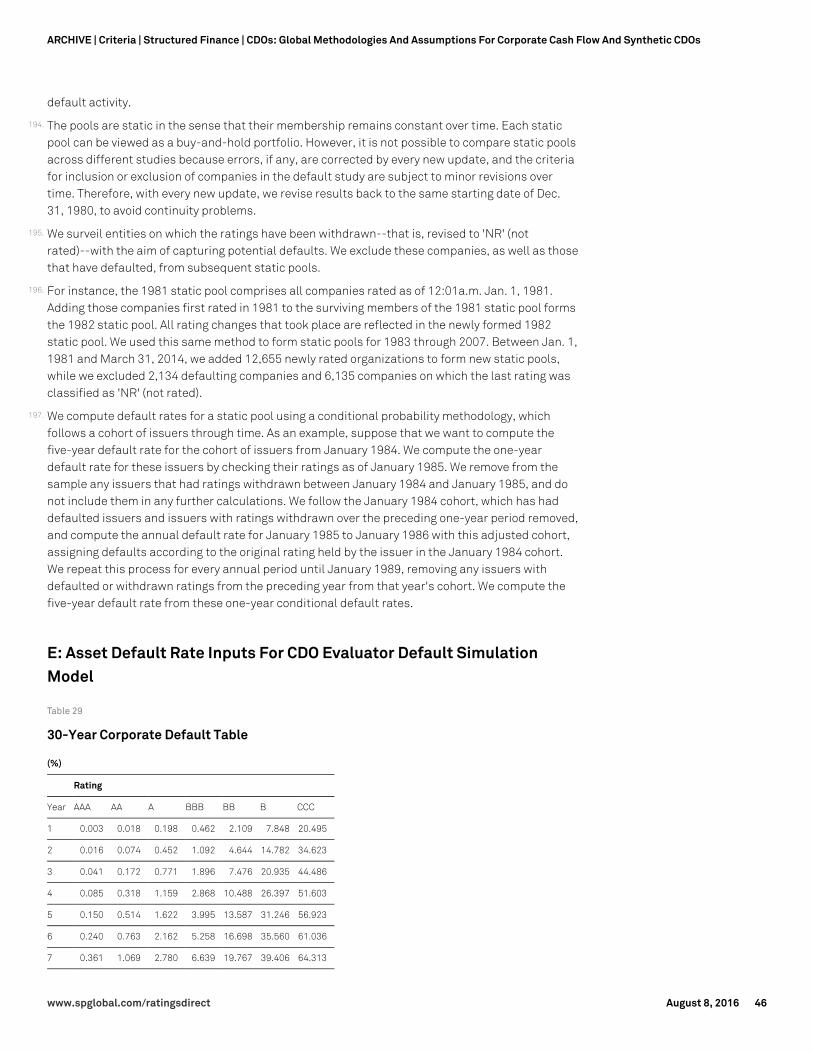
default activity.
194. The pools are static in the sense that their membership remains constant over time. Each staticpool can be viewed as a buy-and-hold portfolio. However, it is not possible to compare static poolsacross different studies because errors, if any, are corrected by every new update, and the criteriafor inclusion or exclusion of companies in the default study are subject to minor revisions overtime. Therefore, with every new update, we revise results back to the same starting date of Dec.31, 1980, to avoid continuity problems.
195. We surveil entities on which the ratings have been withdrawn--that is, revised to 'NR' (notrated)--with the aim of capturing potential defaults. We exclude these companies, as well as thosethat have defaulted, from subsequent static pools.
196. For instance, the 1981 static pool comprises all companies rated as of 12:01a.m. Jan. 1, 1981.Adding those companies first rated in 1981 to the surviving members of the 1981 static pool formsthe 1982 static pool. All rating changes that took place are reflected in the newly formed 1982static pool. We used this same method to form static pools for 1983 through 2007. Between Jan. 1,1981 and March 31, 2014, we added 12,655 newly rated organizations to form new static pools,while we excluded 2,134 defaulting companies and 6,135 companies on which the last rating wasclassified as 'NR' (not rated).
197. We compute default rates for a static pool using a conditional probability methodology, whichfollows a cohort of issuers through time. As an example, suppose that we want to compute thefive-year default rate for the cohort of issuers from January 1984. We compute the one-yeardefault rate for these issuers by checking their ratings as of January 1985. We remove from thesample any issuers that had ratings withdrawn between January 1984 and January 1985, and donot include them in any further calculations. We follow the January 1984 cohort, which has haddefaulted issuers and issuers with ratings withdrawn over the preceding one-year period removed,and compute the annual default rate for January 1985 to January 1986 with this adjusted cohort,assigning defaults according to the original rating held by the issuer in the January 1984 cohort.We repeat this process for every annual period until January 1989, removing any issuers withdefaulted or withdrawn ratings from the preceding year from that year's cohort. We compute thefive-year default rate from these one-year conditional default rates.
E: Asset Default Rate Inputs For CDO Evaluator Default SimulationModel
Table 29
30-Year Corporate Default Table
(%)
Rating
Year AAA AA A BBB BB B CCC
1 0.003 0.018 0.198 0.462 2.109 7.848 20.495
2 0.016 0.074 0.452 1.092 4.644 14.782 34.623
3 0.041 0.172 0.771 1.896 7.476 20.935 44.486
4 0.085 0.318 1.159 2.868 10.488 26.397 51.603
5 0.150 0.514 1.622 3.995 13.587 31.246 56.923
6 0.240 0.763 2.162 5.258 16.698 35.560 61.036
7 0.361 1.069 2.780 6.639 19.767 39.406 64.313
www.spglobal.com/ratingsdirect August 8, 2016 46
ARCHIVE | Criteria | Structured Finance | CDOs: Global Methodologies And Assumptions For Corporate Cash Flow And Synthetic CDOs

Table 29
30-Year Corporate Default Table (cont.)
(%)
Rating
8 0.514 1.433 3.476 8.116 22.758 42.850 66.996
9 0.704 1.856 4.246 9.669 25.645 45.945 69.243
10 0.933 2.339 5.088 11.281 28.413 48.740 71.164
11 1.204 2.881 5.997 12.935 31.054 51.274 72.832
12 1.519 3.482 6.968 14.616 33.567 53.583 74.302
13 1.879 4.140 7.996 16.312 35.952 55.696 75.612
14 2.286 4.854 9.076 18.013 38.213 57.635 76.789
15 2.741 5.621 10.202 19.710 40.354 59.423 77.857
16 3.245 6.440 11.368 21.396 42.382 61.077 78.832
17 3.796 7.307 12.569 23.066 44.304 62.612 79.727
18 4.394 8.219 13.799 24.714 46.125 64.040 80.551
19 5.040 9.173 15.055 26.338 47.851 65.372 81.315
20 5.732 10.166 16.331 27.935 49.491 66.619 82.025
21 6.468 11.195 17.623 29.503 51.048 67.788 82.687
22 7.247 12.256 18.927 31.040 52.529 68.886 83.306
23 8.067 13.346 20.240 32.546 53.939 69.921 83.886
24 8.926 14.463 21.558 34.019 55.283 70.897 84.431
25 9.822 15.602 22.878 35.461 56.565 71.820 84.945
26 10.753 16.761 24.198 36.870 57.790 72.695 85.430
27 11.716 17.938 25.515 38.247 58.962 73.524 85.889
28 12.709 19.128 26.827 39.593 60.083 74.312 86.323
29 13.730 20.330 28.132 40.907 61.157 75.062 86.736
30 14.776 21.541 29.428 42.190 62.188 75.777 87.128
Note: The above percentages are rounded to three decimal places.
F: Correlation Override Table For CDO Evaluator Default SimulationModel
198. Table 30 reflects the correlation assumptions used in CDO Evaluator.
www.spglobal.com/ratingsdirect August 8, 2016 47
ARCHIVE | Criteria | Structured Finance | CDOs: Global Methodologies And Assumptions For Corporate Cash Flow And Synthetic CDOs
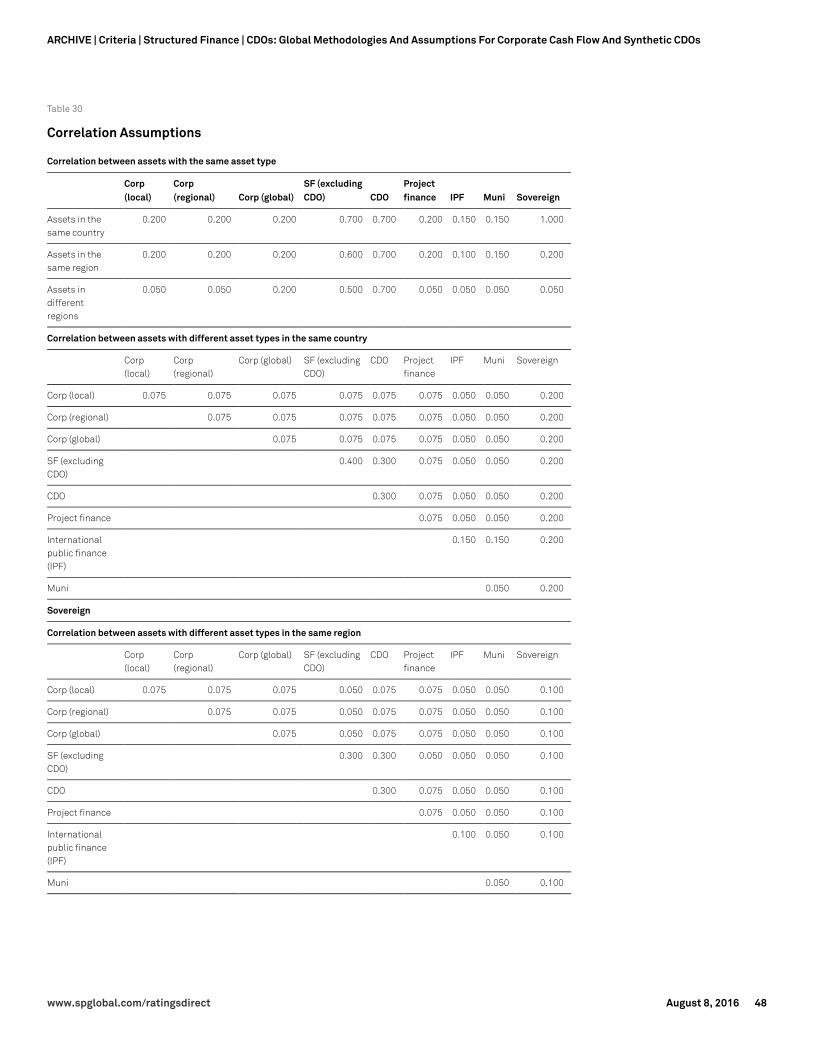
Table 30
Correlation Assumptions
Correlation between assets with the same asset type
Corp(local)
Corp(regional) Corp (global)
SF (excludingCDO) CDO
Projectfinance IPF Muni Sovereign
Assets in thesame country
0.200 0.200 0.200 0.700 0.700 0.200 0.150 0.150 1.000
Assets in thesame region
0.200 0.200 0.200 0.600 0.700 0.200 0.100 0.150 0.200
Assets indifferentregions
0.050 0.050 0.200 0.500 0.700 0.050 0.050 0.050 0.050
Correlation between assets with different asset types in the same country
Corp(local)
Corp(regional)
Corp (global) SF (excludingCDO)
CDO Projectfinance
IPF Muni Sovereign
Corp (local) 0.075 0.075 0.075 0.075 0.075 0.075 0.050 0.050 0.200
Corp (regional) 0.075 0.075 0.075 0.075 0.075 0.050 0.050 0.200
Corp (global) 0.075 0.075 0.075 0.075 0.050 0.050 0.200
SF (excludingCDO)
0.400 0.300 0.075 0.050 0.050 0.200
CDO 0.300 0.075 0.050 0.050 0.200
Project finance 0.075 0.050 0.050 0.200
Internationalpublic finance(IPF)
0.150 0.150 0.200
Muni 0.050 0.200
Sovereign
Correlation between assets with different asset types in the same region
Corp(local)
Corp(regional)
Corp (global) SF (excludingCDO)
CDO Projectfinance
IPF Muni Sovereign
Corp (local) 0.075 0.075 0.075 0.050 0.075 0.075 0.050 0.050 0.100
Corp (regional) 0.075 0.075 0.050 0.075 0.075 0.050 0.050 0.100
Corp (global) 0.075 0.050 0.075 0.075 0.050 0.050 0.100
SF (excludingCDO)
0.300 0.300 0.050 0.050 0.050 0.100
CDO 0.300 0.075 0.050 0.050 0.100
Project finance 0.075 0.050 0.050 0.100
Internationalpublic finance(IPF)
0.100 0.050 0.100
Muni 0.050 0.100
www.spglobal.com/ratingsdirect August 8, 2016 48
ARCHIVE | Criteria | Structured Finance | CDOs: Global Methodologies And Assumptions For Corporate Cash Flow And Synthetic CDOs
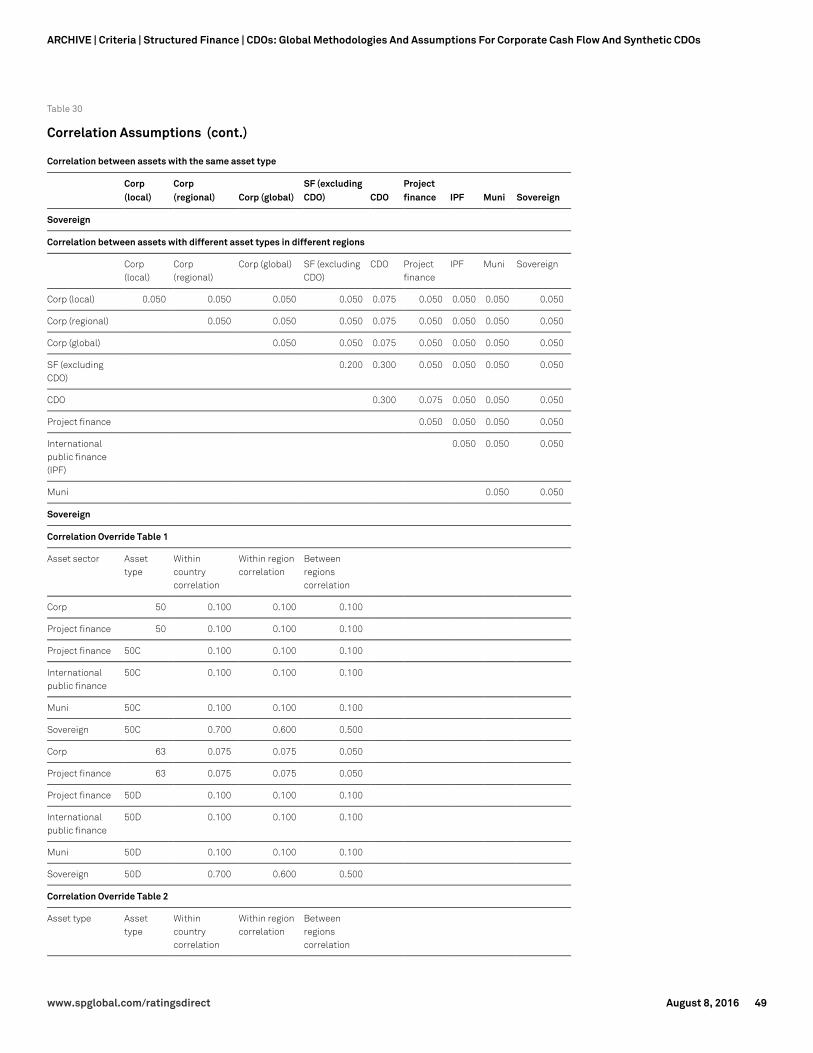
Table 30
Correlation Assumptions (cont.)
Correlation between assets with the same asset type
Corp(local)
Corp(regional) Corp (global)
SF (excludingCDO) CDO
Projectfinance IPF Muni Sovereign
Sovereign
Correlation between assets with different asset types in different regions
Corp(local)
Corp(regional)
Corp (global) SF (excludingCDO)
CDO Projectfinance
IPF Muni Sovereign
Corp (local) 0.050 0.050 0.050 0.050 0.075 0.050 0.050 0.050 0.050
Corp (regional) 0.050 0.050 0.050 0.075 0.050 0.050 0.050 0.050
Corp (global) 0.050 0.050 0.075 0.050 0.050 0.050 0.050
SF (excludingCDO)
0.200 0.300 0.050 0.050 0.050 0.050
CDO 0.300 0.075 0.050 0.050 0.050
Project finance 0.050 0.050 0.050 0.050
Internationalpublic finance(IPF)
0.050 0.050 0.050
Muni 0.050 0.050
Sovereign
Correlation Override Table 1
Asset sector Assettype
Withincountrycorrelation
Within regioncorrelation
Betweenregionscorrelation
Corp 50 0.100 0.100 0.100
Project finance 50 0.100 0.100 0.100
Project finance 50C 0.100 0.100 0.100
Internationalpublic finance
50C 0.100 0.100 0.100
Muni 50C 0.100 0.100 0.100
Sovereign 50C 0.700 0.600 0.500
Corp 63 0.075 0.075 0.050
Project finance 63 0.075 0.075 0.050
Project finance 50D 0.100 0.100 0.100
Internationalpublic finance
50D 0.100 0.100 0.100
Muni 50D 0.100 0.100 0.100
Sovereign 50D 0.700 0.600 0.500
Correlation Override Table 2
Asset type Assettype
Withincountrycorrelation
Within regioncorrelation
Betweenregionscorrelation
www.spglobal.com/ratingsdirect August 8, 2016 49
ARCHIVE | Criteria | Structured Finance | CDOs: Global Methodologies And Assumptions For Corporate Cash Flow And Synthetic CDOs
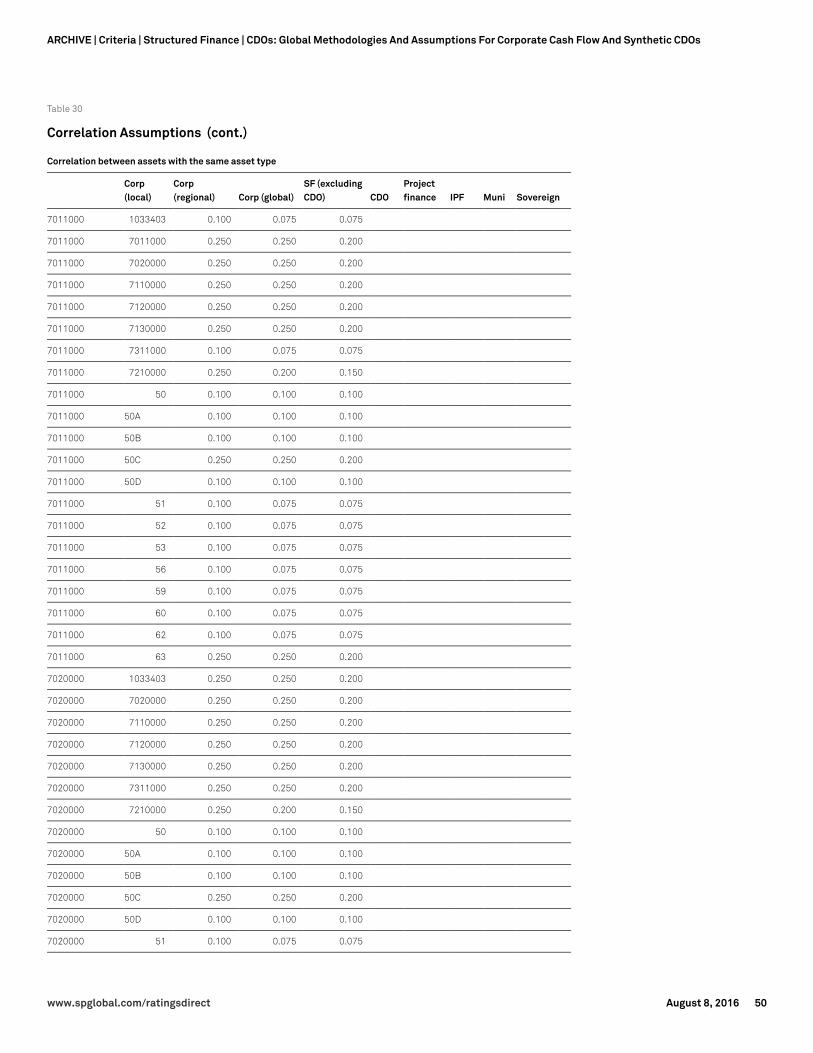
Table 30
Correlation Assumptions (cont.)
Correlation between assets with the same asset type
Corp(local)
Corp(regional) Corp (global)
SF (excludingCDO) CDO
Projectfinance IPF Muni Sovereign
7011000 1033403 0.100 0.075 0.075
7011000 7011000 0.250 0.250 0.200
7011000 7020000 0.250 0.250 0.200
7011000 7110000 0.250 0.250 0.200
7011000 7120000 0.250 0.250 0.200
7011000 7130000 0.250 0.250 0.200
7011000 7311000 0.100 0.075 0.075
7011000 7210000 0.250 0.200 0.150
7011000 50 0.100 0.100 0.100
7011000 50A 0.100 0.100 0.100
7011000 50B 0.100 0.100 0.100
7011000 50C 0.250 0.250 0.200
7011000 50D 0.100 0.100 0.100
7011000 51 0.100 0.075 0.075
7011000 52 0.100 0.075 0.075
7011000 53 0.100 0.075 0.075
7011000 56 0.100 0.075 0.075
7011000 59 0.100 0.075 0.075
7011000 60 0.100 0.075 0.075
7011000 62 0.100 0.075 0.075
7011000 63 0.250 0.250 0.200
7020000 1033403 0.250 0.250 0.200
7020000 7020000 0.250 0.250 0.200
7020000 7110000 0.250 0.250 0.200
7020000 7120000 0.250 0.250 0.200
7020000 7130000 0.250 0.250 0.200
7020000 7311000 0.250 0.250 0.200
7020000 7210000 0.250 0.200 0.150
7020000 50 0.100 0.100 0.100
7020000 50A 0.100 0.100 0.100
7020000 50B 0.100 0.100 0.100
7020000 50C 0.250 0.250 0.200
7020000 50D 0.100 0.100 0.100
7020000 51 0.100 0.075 0.075
www.spglobal.com/ratingsdirect August 8, 2016 50
ARCHIVE | Criteria | Structured Finance | CDOs: Global Methodologies And Assumptions For Corporate Cash Flow And Synthetic CDOs
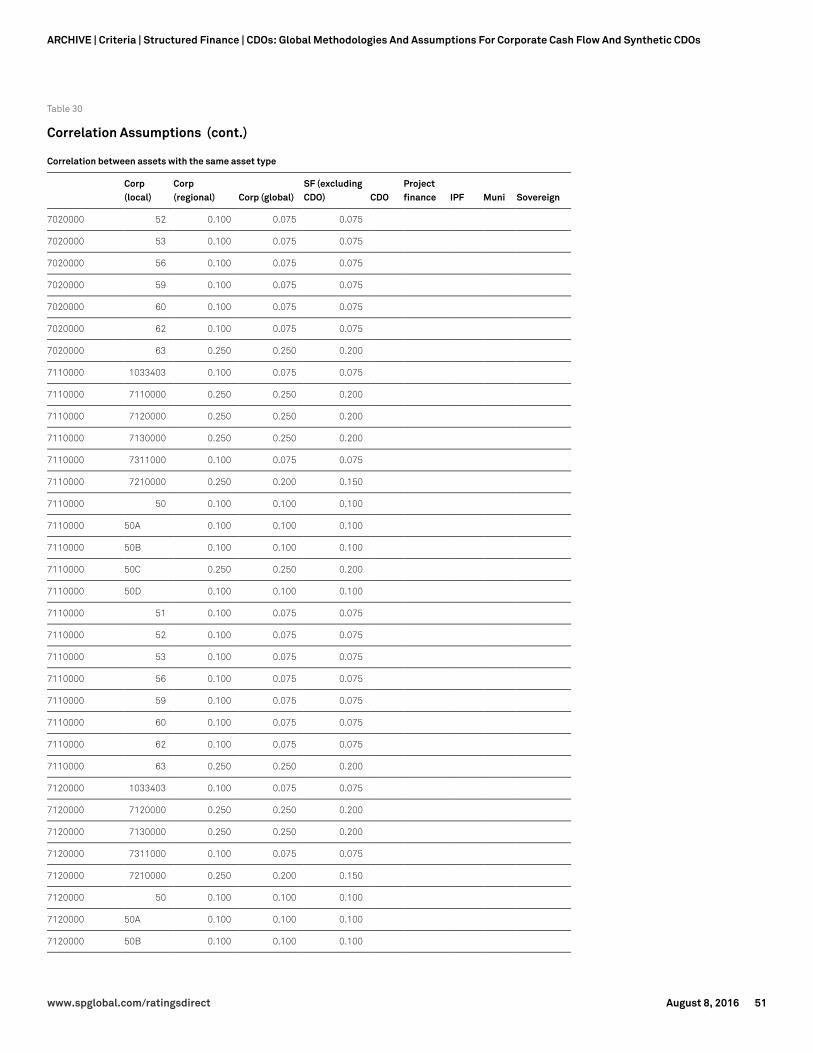
Table 30
Correlation Assumptions (cont.)
Correlation between assets with the same asset type
Corp(local)
Corp(regional) Corp (global)
SF (excludingCDO) CDO
Projectfinance IPF Muni Sovereign
7020000 52 0.100 0.075 0.075
7020000 53 0.100 0.075 0.075
7020000 56 0.100 0.075 0.075
7020000 59 0.100 0.075 0.075
7020000 60 0.100 0.075 0.075
7020000 62 0.100 0.075 0.075
7020000 63 0.250 0.250 0.200
7110000 1033403 0.100 0.075 0.075
7110000 7110000 0.250 0.250 0.200
7110000 7120000 0.250 0.250 0.200
7110000 7130000 0.250 0.250 0.200
7110000 7311000 0.100 0.075 0.075
7110000 7210000 0.250 0.200 0.150
7110000 50 0.100 0.100 0.100
7110000 50A 0.100 0.100 0.100
7110000 50B 0.100 0.100 0.100
7110000 50C 0.250 0.250 0.200
7110000 50D 0.100 0.100 0.100
7110000 51 0.100 0.075 0.075
7110000 52 0.100 0.075 0.075
7110000 53 0.100 0.075 0.075
7110000 56 0.100 0.075 0.075
7110000 59 0.100 0.075 0.075
7110000 60 0.100 0.075 0.075
7110000 62 0.100 0.075 0.075
7110000 63 0.250 0.250 0.200
7120000 1033403 0.100 0.075 0.075
7120000 7120000 0.250 0.250 0.200
7120000 7130000 0.250 0.250 0.200
7120000 7311000 0.100 0.075 0.075
7120000 7210000 0.250 0.200 0.150
7120000 50 0.100 0.100 0.100
7120000 50A 0.100 0.100 0.100
7120000 50B 0.100 0.100 0.100
www.spglobal.com/ratingsdirect August 8, 2016 51
ARCHIVE | Criteria | Structured Finance | CDOs: Global Methodologies And Assumptions For Corporate Cash Flow And Synthetic CDOs
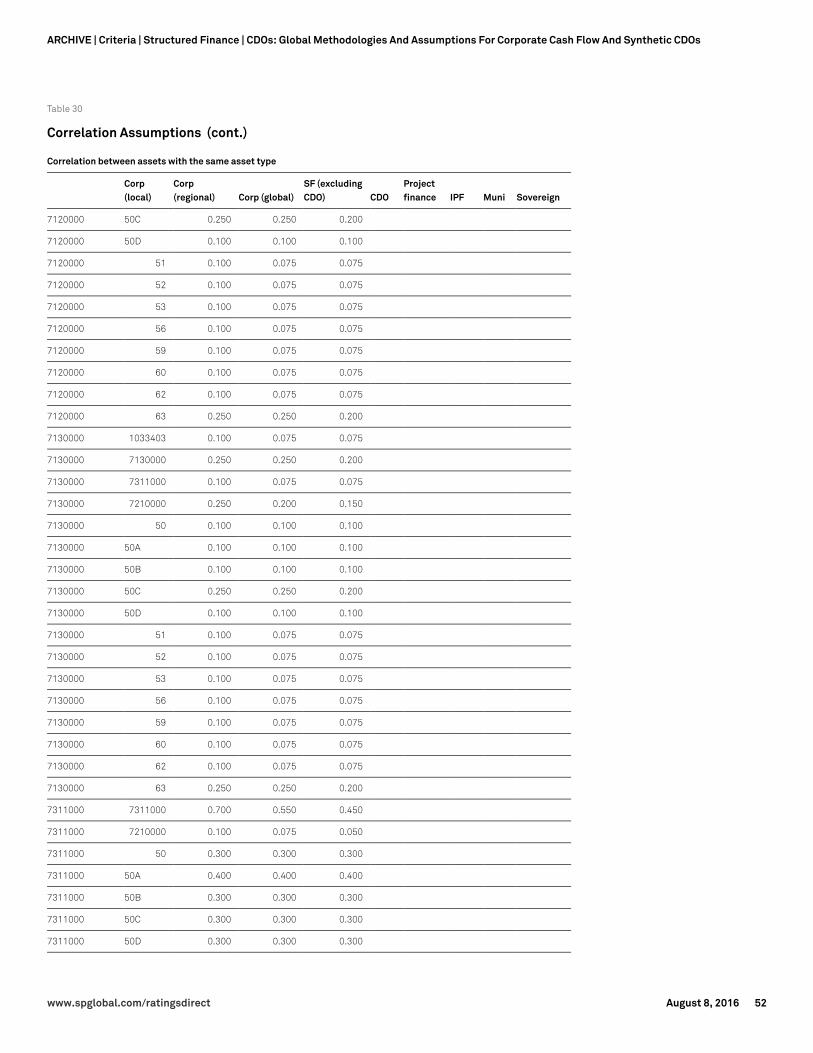
Table 30
Correlation Assumptions (cont.)
Correlation between assets with the same asset type
Corp(local)
Corp(regional) Corp (global)
SF (excludingCDO) CDO
Projectfinance IPF Muni Sovereign
7120000 50C 0.250 0.250 0.200
7120000 50D 0.100 0.100 0.100
7120000 51 0.100 0.075 0.075
7120000 52 0.100 0.075 0.075
7120000 53 0.100 0.075 0.075
7120000 56 0.100 0.075 0.075
7120000 59 0.100 0.075 0.075
7120000 60 0.100 0.075 0.075
7120000 62 0.100 0.075 0.075
7120000 63 0.250 0.250 0.200
7130000 1033403 0.100 0.075 0.075
7130000 7130000 0.250 0.250 0.200
7130000 7311000 0.100 0.075 0.075
7130000 7210000 0.250 0.200 0.150
7130000 50 0.100 0.100 0.100
7130000 50A 0.100 0.100 0.100
7130000 50B 0.100 0.100 0.100
7130000 50C 0.250 0.250 0.200
7130000 50D 0.100 0.100 0.100
7130000 51 0.100 0.075 0.075
7130000 52 0.100 0.075 0.075
7130000 53 0.100 0.075 0.075
7130000 56 0.100 0.075 0.075
7130000 59 0.100 0.075 0.075
7130000 60 0.100 0.075 0.075
7130000 62 0.100 0.075 0.075
7130000 63 0.250 0.250 0.200
7311000 7311000 0.700 0.550 0.450
7311000 7210000 0.100 0.075 0.050
7311000 50 0.300 0.300 0.300
7311000 50A 0.400 0.400 0.400
7311000 50B 0.300 0.300 0.300
7311000 50C 0.300 0.300 0.300
7311000 50D 0.300 0.300 0.300
www.spglobal.com/ratingsdirect August 8, 2016 52
ARCHIVE | Criteria | Structured Finance | CDOs: Global Methodologies And Assumptions For Corporate Cash Flow And Synthetic CDOs
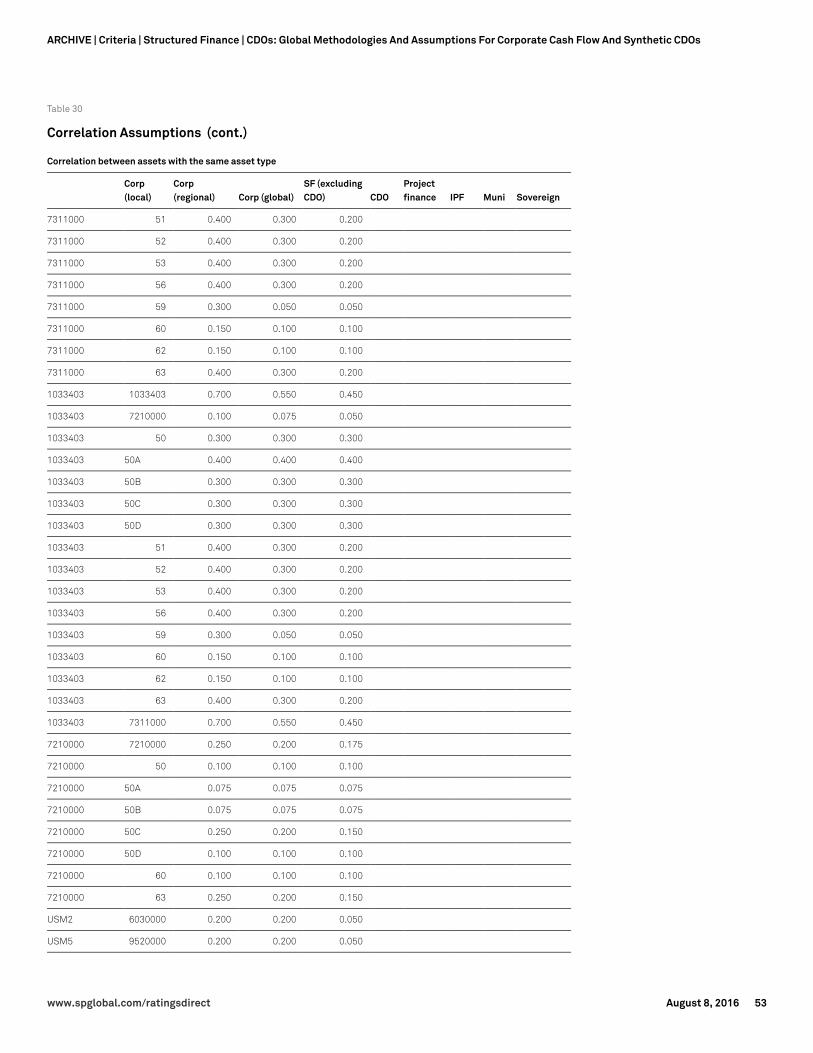
Table 30
Correlation Assumptions (cont.)
Correlation between assets with the same asset type
Corp(local)
Corp(regional) Corp (global)
SF (excludingCDO) CDO
Projectfinance IPF Muni Sovereign
7311000 51 0.400 0.300 0.200
7311000 52 0.400 0.300 0.200
7311000 53 0.400 0.300 0.200
7311000 56 0.400 0.300 0.200
7311000 59 0.300 0.050 0.050
7311000 60 0.150 0.100 0.100
7311000 62 0.150 0.100 0.100
7311000 63 0.400 0.300 0.200
1033403 1033403 0.700 0.550 0.450
1033403 7210000 0.100 0.075 0.050
1033403 50 0.300 0.300 0.300
1033403 50A 0.400 0.400 0.400
1033403 50B 0.300 0.300 0.300
1033403 50C 0.300 0.300 0.300
1033403 50D 0.300 0.300 0.300
1033403 51 0.400 0.300 0.200
1033403 52 0.400 0.300 0.200
1033403 53 0.400 0.300 0.200
1033403 56 0.400 0.300 0.200
1033403 59 0.300 0.050 0.050
1033403 60 0.150 0.100 0.100
1033403 62 0.150 0.100 0.100
1033403 63 0.400 0.300 0.200
1033403 7311000 0.700 0.550 0.450
7210000 7210000 0.250 0.200 0.175
7210000 50 0.100 0.100 0.100
7210000 50A 0.075 0.075 0.075
7210000 50B 0.075 0.075 0.075
7210000 50C 0.250 0.200 0.150
7210000 50D 0.100 0.100 0.100
7210000 60 0.100 0.100 0.100
7210000 63 0.250 0.200 0.150
USM2 6030000 0.200 0.200 0.050
USM5 9520000 0.200 0.200 0.050
www.spglobal.com/ratingsdirect August 8, 2016 53
ARCHIVE | Criteria | Structured Finance | CDOs: Global Methodologies And Assumptions For Corporate Cash Flow And Synthetic CDOs
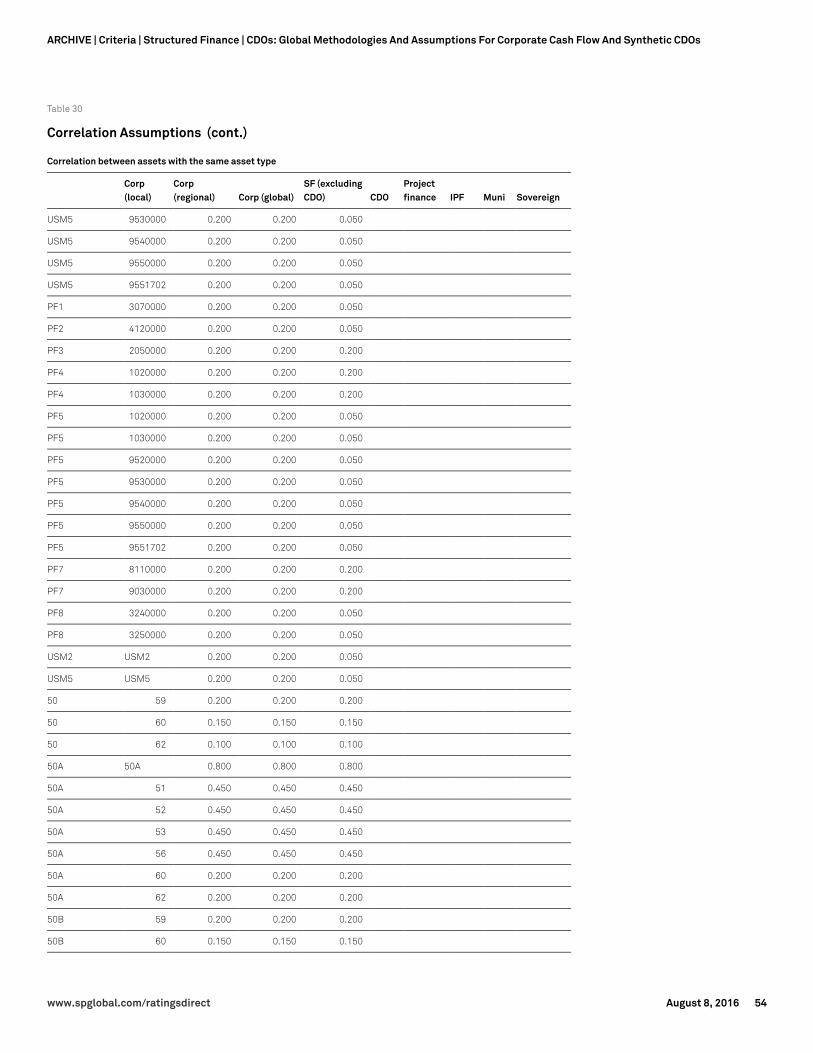
Table 30
Correlation Assumptions (cont.)
Correlation between assets with the same asset type
Corp(local)
Corp(regional) Corp (global)
SF (excludingCDO) CDO
Projectfinance IPF Muni Sovereign
USM5 9530000 0.200 0.200 0.050
USM5 9540000 0.200 0.200 0.050
USM5 9550000 0.200 0.200 0.050
USM5 9551702 0.200 0.200 0.050
PF1 3070000 0.200 0.200 0.050
PF2 4120000 0.200 0.200 0.050
PF3 2050000 0.200 0.200 0.200
PF4 1020000 0.200 0.200 0.200
PF4 1030000 0.200 0.200 0.200
PF5 1020000 0.200 0.200 0.050
PF5 1030000 0.200 0.200 0.050
PF5 9520000 0.200 0.200 0.050
PF5 9530000 0.200 0.200 0.050
PF5 9540000 0.200 0.200 0.050
PF5 9550000 0.200 0.200 0.050
PF5 9551702 0.200 0.200 0.050
PF7 8110000 0.200 0.200 0.200
PF7 9030000 0.200 0.200 0.200
PF8 3240000 0.200 0.200 0.050
PF8 3250000 0.200 0.200 0.050
USM2 USM2 0.200 0.200 0.050
USM5 USM5 0.200 0.200 0.050
50 59 0.200 0.200 0.200
50 60 0.150 0.150 0.150
50 62 0.100 0.100 0.100
50A 50A 0.800 0.800 0.800
50A 51 0.450 0.450 0.450
50A 52 0.450 0.450 0.450
50A 53 0.450 0.450 0.450
50A 56 0.450 0.450 0.450
50A 60 0.200 0.200 0.200
50A 62 0.200 0.200 0.200
50B 59 0.200 0.200 0.200
50B 60 0.150 0.150 0.150
www.spglobal.com/ratingsdirect August 8, 2016 54
ARCHIVE | Criteria | Structured Finance | CDOs: Global Methodologies And Assumptions For Corporate Cash Flow And Synthetic CDOs
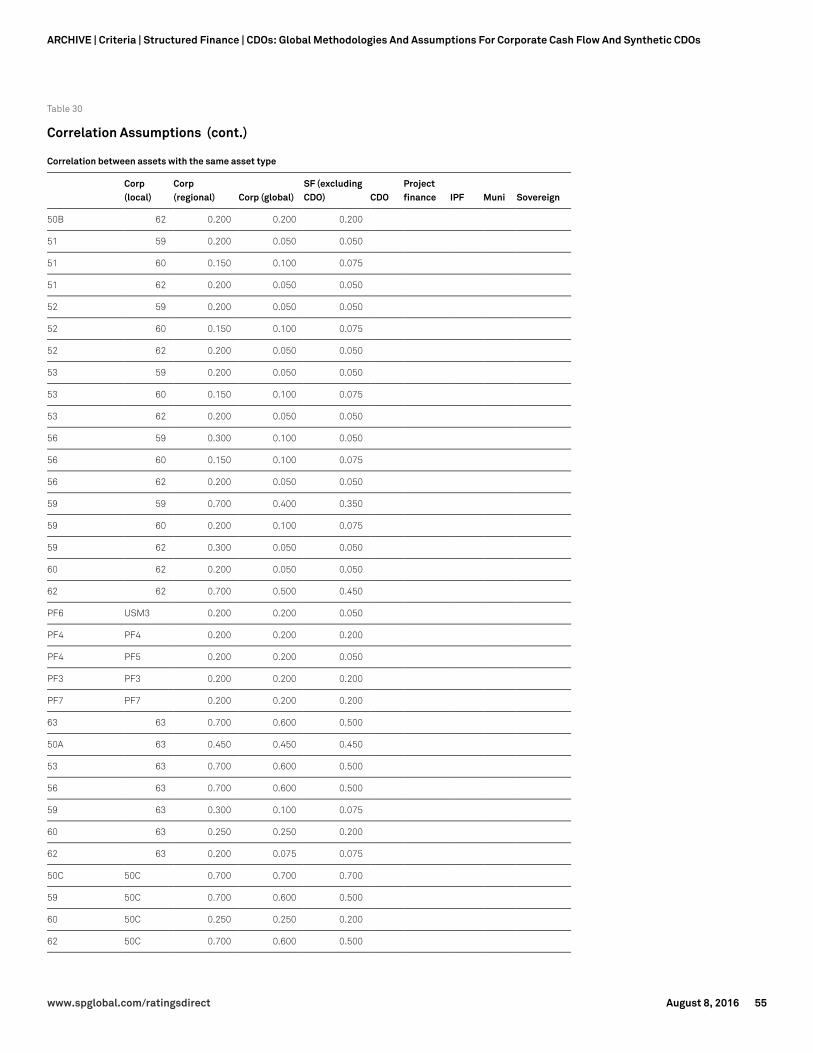
Table 30
Correlation Assumptions (cont.)
Correlation between assets with the same asset type
Corp(local)
Corp(regional) Corp (global)
SF (excludingCDO) CDO
Projectfinance IPF Muni Sovereign
50B 62 0.200 0.200 0.200
51 59 0.200 0.050 0.050
51 60 0.150 0.100 0.075
51 62 0.200 0.050 0.050
52 59 0.200 0.050 0.050
52 60 0.150 0.100 0.075
52 62 0.200 0.050 0.050
53 59 0.200 0.050 0.050
53 60 0.150 0.100 0.075
53 62 0.200 0.050 0.050
56 59 0.300 0.100 0.050
56 60 0.150 0.100 0.075
56 62 0.200 0.050 0.050
59 59 0.700 0.400 0.350
59 60 0.200 0.100 0.075
59 62 0.300 0.050 0.050
60 62 0.200 0.050 0.050
62 62 0.700 0.500 0.450
PF6 USM3 0.200 0.200 0.050
PF4 PF4 0.200 0.200 0.200
PF4 PF5 0.200 0.200 0.050
PF3 PF3 0.200 0.200 0.200
PF7 PF7 0.200 0.200 0.200
63 63 0.700 0.600 0.500
50A 63 0.450 0.450 0.450
53 63 0.700 0.600 0.500
56 63 0.700 0.600 0.500
59 63 0.300 0.100 0.075
60 63 0.250 0.250 0.200
62 63 0.200 0.075 0.075
50C 50C 0.700 0.700 0.700
59 50C 0.700 0.600 0.500
60 50C 0.250 0.250 0.200
62 50C 0.700 0.600 0.500
www.spglobal.com/ratingsdirect August 8, 2016 55
ARCHIVE | Criteria | Structured Finance | CDOs: Global Methodologies And Assumptions For Corporate Cash Flow And Synthetic CDOs

Table 30
Correlation Assumptions (cont.)
Correlation between assets with the same asset type
Corp(local)
Corp(regional) Corp (global)
SF (excludingCDO) CDO
Projectfinance IPF Muni Sovereign
50D 50D 0.700 0.700 0.700
50C 50D 0.700 0.700 0.700
59 50D 0.700 0.600 0.500
60 50D 0.150 0.150 0.150
62 50D 0.700 0.600 0.500
G: Tranche Rating Quantile For CDO Evaluator Default Simulation Model
Table 31
Tranche Rating Quantile For CDO Evaluator Simulation Model
(%)
Rating
Year AAA AA A BBB BB B CCC
1 0.001 0.018 0.248 0.692 2.637 8.633 21.520
2 0.006 0.074 0.566 1.638 5.805 16.260 36.354
3 0.017 0.172 0.963 2.844 9.345 23.028 46.710
4 0.034 0.318 1.449 4.302 13.110 29.036 54.183
5 0.060 0.514 2.027 5.992 16.984 34.371 59.769
6 0.096 0.763 2.703 7.888 20.872 39.116 64.087
7 0.144 1.069 3.476 9.959 24.709 43.347 67.529
8 0.206 1.433 4.345 12.174 28.447 47.135 70.345
9 0.281 1.856 5.308 14.504 32.056 50.540 72.705
10 0.373 2.339 6.360 16.922 35.516 53.614 74.722
11 0.481 2.881 7.496 19.402 38.818 56.402 76.474
12 0.607 3.482 8.710 21.924 41.959 58.942 78.017
13 0.752 4.140 9.995 24.468 44.940 61.265 79.392
14 0.915 4.854 11.345 27.019 47.766 63.399 80.629
15 1.097 5.621 12.752 29.565 50.443 65.366 81.750
16 1.298 6.440 14.210 32.094 52.978 67.185 82.774
17 1.518 7.307 15.711 34.598 55.380 68.873 83.713
18 1.758 8.219 17.249 37.071 57.656 70.444 84.579
19 2.016 9.173 18.819 39.507 59.814 71.909 85.381
20 2.293 10.166 20.414 41.903 61.863 73.281 86.126
21 2.587 11.195 22.029 44.254 63.810 74.566 86.821
www.spglobal.com/ratingsdirect August 8, 2016 56
ARCHIVE | Criteria | Structured Finance | CDOs: Global Methodologies And Assumptions For Corporate Cash Flow And Synthetic CDOs
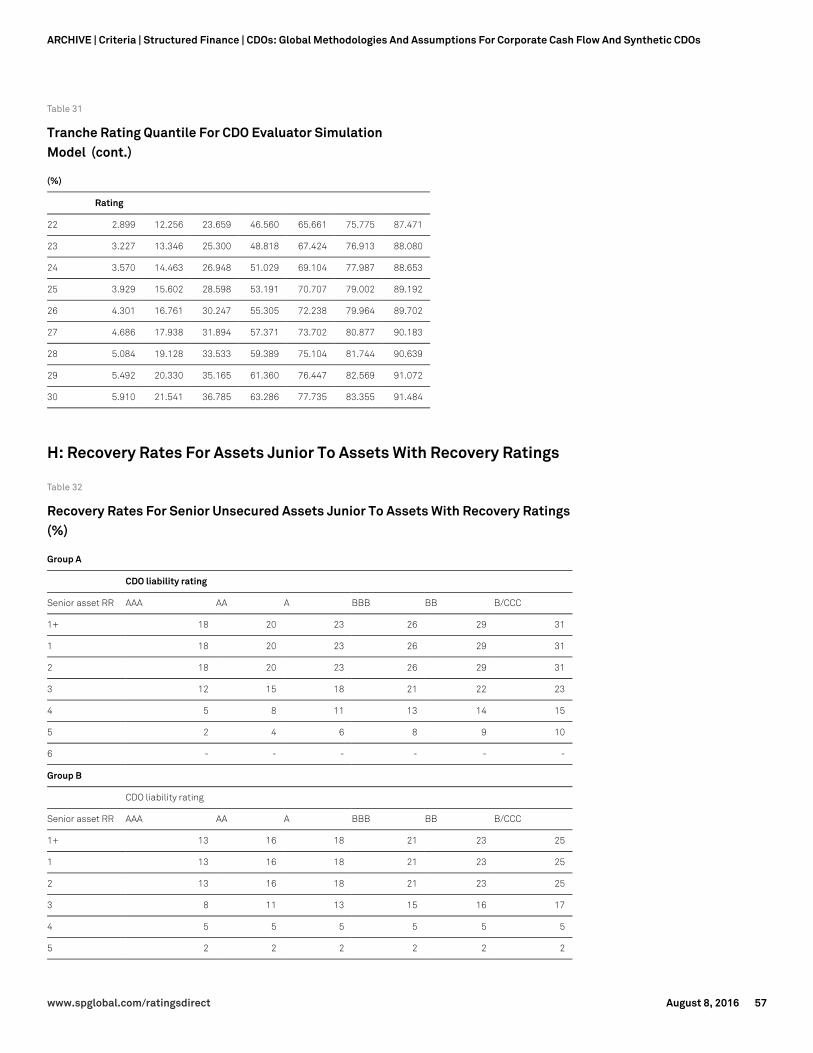
Table 31
Tranche Rating Quantile For CDO Evaluator SimulationModel (cont.)
(%)
Rating
22 2.899 12.256 23.659 46.560 65.661 75.775 87.471
23 3.227 13.346 25.300 48.818 67.424 76.913 88.080
24 3.570 14.463 26.948 51.029 69.104 77.987 88.653
25 3.929 15.602 28.598 53.191 70.707 79.002 89.192
26 4.301 16.761 30.247 55.305 72.238 79.964 89.702
27 4.686 17.938 31.894 57.371 73.702 80.877 90.183
28 5.084 19.128 33.533 59.389 75.104 81.744 90.639
29 5.492 20.330 35.165 61.360 76.447 82.569 91.072
30 5.910 21.541 36.785 63.286 77.735 83.355 91.484
H: Recovery Rates For Assets Junior To Assets With Recovery Ratings
Table 32
Recovery Rates For Senior Unsecured Assets Junior To Assets With Recovery Ratings(%)
Group A
CDO liability rating
Senior asset RR AAA AA A BBB BB B/CCC
1+ 18 20 23 26 29 31
1 18 20 23 26 29 31
2 18 20 23 26 29 31
3 12 15 18 21 22 23
4 5 8 11 13 14 15
5 2 4 6 8 9 10
6 - - - - - -
Group B
CDO liability rating
Senior asset RR AAA AA A BBB BB B/CCC
1+ 13 16 18 21 23 25
1 13 16 18 21 23 25
2 13 16 18 21 23 25
3 8 11 13 15 16 17
4 5 5 5 5 5 5
5 2 2 2 2 2 2
www.spglobal.com/ratingsdirect August 8, 2016 57
ARCHIVE | Criteria | Structured Finance | CDOs: Global Methodologies And Assumptions For Corporate Cash Flow And Synthetic CDOs

Table 32
Recovery Rates For Senior Unsecured Assets Junior To Assets With Recovery Ratings(%) (cont.)
Group A
CDO liability rating
6 - - - - - -
Group C
CDO liability rating
Senior asset RR AAA AA A BBB BB B/CCC
1+ 10 12 14 16 18 20
1 10 12 14 16 18 20
2 10 12 14 16 18 20
3 5 7 9 10 11 12
4 2 2 2 2 2 2
5 - - - - - -
6 - - - - - -
The adjustments to the ranges from published reports as shown in table 11 do not apply to this table. RR-Recovery rating.
Table 33
Recovery Rates For Subordinated Assets Junior To Assets With Recovery Ratings (%)
Groups A & B
CDO liability rating
Senior asset RR AAA AA A BBB BB B/CCC
1+ 8 8 8 8 8 8
1 8 8 8 8 8 8
2 8 8 8 8 8 8
3 5 5 5 5 5 5
4 2 2 2 2 2 2
5 - - - - - -
6 - - - - - -
Group C
CDO liability rating
Senior asset RR AAA AA A BBB BB B/CCC
1+ 5 5 5 5 5 5
1 5 5 5 5 5 5
2 5 5 5 5 5 5
3 2 2 2 2 2 2
4 - - - - - -
5 - - - - - -
www.spglobal.com/ratingsdirect August 8, 2016 58
ARCHIVE | Criteria | Structured Finance | CDOs: Global Methodologies And Assumptions For Corporate Cash Flow And Synthetic CDOs
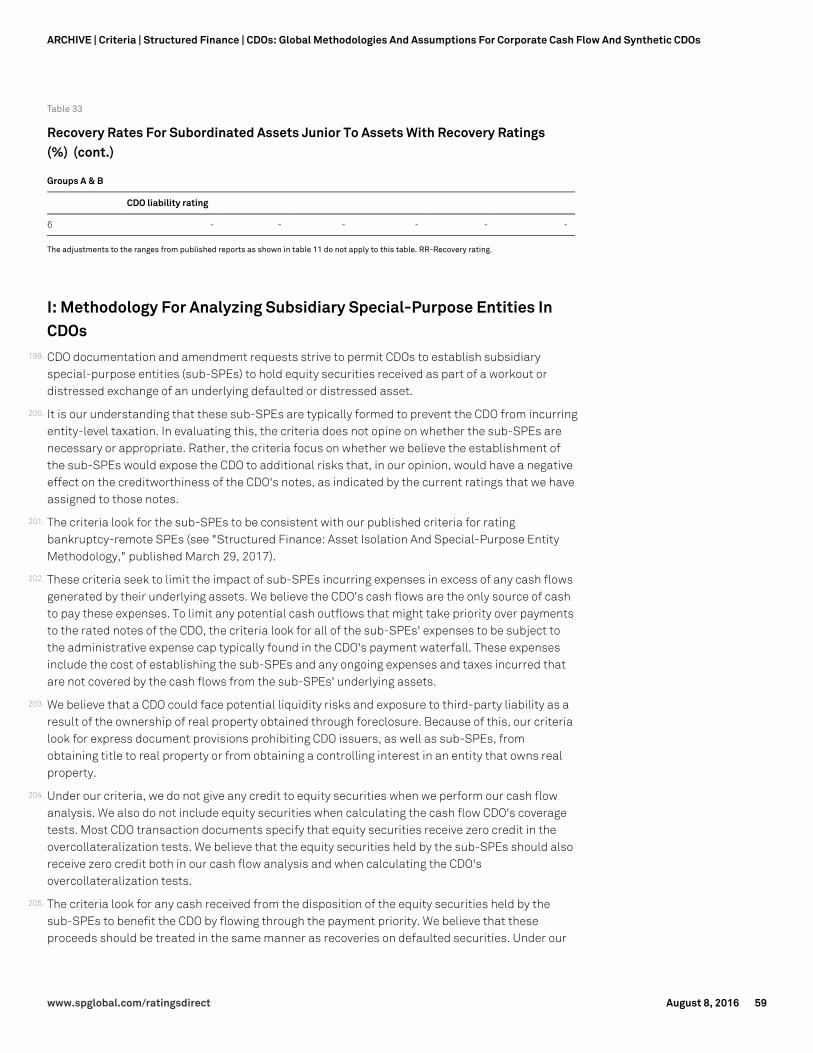
Table 33
Recovery Rates For Subordinated Assets Junior To Assets With Recovery Ratings(%) (cont.)
Groups A & B
CDO liability rating
6 - - - - - -
The adjustments to the ranges from published reports as shown in table 11 do not apply to this table. RR-Recovery rating.
I: Methodology For Analyzing Subsidiary Special-Purpose Entities InCDOs
199. CDO documentation and amendment requests strive to permit CDOs to establish subsidiaryspecial-purpose entities (sub-SPEs) to hold equity securities received as part of a workout ordistressed exchange of an underlying defaulted or distressed asset.
200. It is our understanding that these sub-SPEs are typically formed to prevent the CDO from incurringentity-level taxation. In evaluating this, the criteria does not opine on whether the sub-SPEs arenecessary or appropriate. Rather, the criteria focus on whether we believe the establishment ofthe sub-SPEs would expose the CDO to additional risks that, in our opinion, would have a negativeeffect on the creditworthiness of the CDO's notes, as indicated by the current ratings that we haveassigned to those notes.
201. The criteria look for the sub-SPEs to be consistent with our published criteria for ratingbankruptcy-remote SPEs (see "Structured Finance: Asset Isolation And Special-Purpose EntityMethodology," published March 29, 2017).
202. These criteria seek to limit the impact of sub-SPEs incurring expenses in excess of any cash flowsgenerated by their underlying assets. We believe the CDO's cash flows are the only source of cashto pay these expenses. To limit any potential cash outflows that might take priority over paymentsto the rated notes of the CDO, the criteria look for all of the sub-SPEs' expenses to be subject tothe administrative expense cap typically found in the CDO's payment waterfall. These expensesinclude the cost of establishing the sub-SPEs and any ongoing expenses and taxes incurred thatare not covered by the cash flows from the sub-SPEs' underlying assets.
203. We believe that a CDO could face potential liquidity risks and exposure to third-party liability as aresult of the ownership of real property obtained through foreclosure. Because of this, our criterialook for express document provisions prohibiting CDO issuers, as well as sub-SPEs, fromobtaining title to real property or from obtaining a controlling interest in an entity that owns realproperty.
204. Under our criteria, we do not give any credit to equity securities when we perform our cash flowanalysis. We also do not include equity securities when calculating the cash flow CDO's coveragetests. Most CDO transaction documents specify that equity securities receive zero credit in theovercollateralization tests. We believe that the equity securities held by the sub-SPEs should alsoreceive zero credit both in our cash flow analysis and when calculating the CDO'sovercollateralization tests.
205. The criteria look for any cash received from the disposition of the equity securities held by thesub-SPEs to benefit the CDO by flowing through the payment priority. We believe that theseproceeds should be treated in the same manner as recoveries on defaulted securities. Under our
www.spglobal.com/ratingsdirect August 8, 2016 59
ARCHIVE | Criteria | Structured Finance | CDOs: Global Methodologies And Assumptions For Corporate Cash Flow And Synthetic CDOs
criteria, recoveries on defaulted securities are treated as principal proceeds until the defaultedsecurities' full original par amounts are recovered. Accordingly, the criteria consider proceedsfrom the equity securities held by sub-SPEs to be treated as principal proceeds until the originaldefaulted securities' full par amounts are recovered in cash.
206. The criteria look for any assets held by the sub-SPEs to be liquidated on or before the CDO's legalfinal maturity date and paid out to the CDO's investors according to the final payment waterfall inthe transaction documents.
J. Combination Notes207. A combination note is a security that is generally structured by combining two or more different
tranches issued by a CDO transaction. It could also be structured by combining one or more ratedtranches with equity in a CDO transaction (CDO equity).
208. Generally, the methodology and assumptions applicable to the combination notes are the same asthose applicable for the underlying components as described in these criteria. However, when themodeling assumptions of the combination note give credit to cash flows derived from CDO equity,the criteria include additional conditions as described below.
209. These criteria do not contemplate rating the combination note to an implied "rated balance"where the combination note balance differs from the rated amount. Our ratings on combinationnotes address the entire balance of the combination note.
210. When a combination note is newly rated at the time of the transaction's origination, the balance ofcombination notes would generally be the aggregate of its components. The balance will declineafter taking into account pay downs on the combination notes on account of interest pay downs,equity distributions, principal pay downs on the underlying components.
211. It is possible that the notional balance for the combination note may be less than the sum of theprincipal balance remaining on each of the combination note components. This could happengenerally because of the following instances:
- Where the stated interest on the combination notes is lower than the stated interest on therated note components, and where the differential in interest received off the underlyingcomponent is applied towards the reduction in the balance of the combination notes.
- Where a CDO equity tranche is one of the components of the combination notes and where theappropriate portion of the equity distribution that goes towards the combination note reducesthe balance of the combination notes.
212. It is therefore possible that investors in combination notes can be potentially be paid out theirentire balance while the components still remain outstanding. A likely concern for investors insuch a scenario is that their ability to benefit from subsequent residual payments from equity maybe capped or limited.
213. To mitigate this risk, underlying documents have often required the notes to be written down whenany distributions that were relied upon under the rating scenario are made, but may also allow anominal amount of the notes (usually $1) to remain outstanding until the maturity of thetransaction. In doing so, any additional distributions that were not expected under the stressedrating scenario can be paid to the combination noteholders as residual upside. This is consistentwith our criteria; however, once the combination note balance has been paid off, the rating on thecombination note will be withdrawn (regardless of the balance still outstanding on itscomponents).
www.spglobal.com/ratingsdirect August 8, 2016 60
ARCHIVE | Criteria | Structured Finance | CDOs: Global Methodologies And Assumptions For Corporate Cash Flow And Synthetic CDOs

Optional redemptions when combination notes include equity securities.214. Cash flow CDO transactions may have provisions that allow the CDO, after a specified non-call
period, to call the transaction as long as the rated notes can be redeemed in full. However, forthose combination notes that are a combination of rated notes and equity notes, there is noguarantee that they will be redeemed for par because the underlying documents do not require forequity securities to be repaid in full for an optional redemption to occur. Often, in our cash flowanalysis, the combination note rating analysis may rely upon many years of cash flow from itsconstituent parts and, therefore, if the transaction is called early this might mean that not all ofthe initial investment is received. The redemption price of the subordinated notes may notcompensate for the loss of future cash flows.
215. S&P Global Ratings will rate combination securities that are composed of CDO equity, so long asthe combination noteholders are redeemed at par plus accrued interest upon an optionalredemption. Full repayment of interest and principal may not be a condition for an optionalredemption if the combination noteholders vote in favor of an optional redemption as a separateclass from the CDO equity holders.
Cash flow analysis and assumptions when combination notes include equitysecurities
216. When combination notes include components of CDO equity, Standard & Poor's needs to be ableto assess in its cash flow analysis all payments that must be made in the payment waterfallbefore the equity payments are disbursed. These payments include any fees, expenses, or otherdisbursements that do not have a stated amount or payment rate. Examples include uncappedadministrative fees and expenses, hedge termination payments, and subordinate, deferred, andincentive management fees.
217. Hedge termination payments are generally difficult to quantify, given that such payment is afunction of the interest rate environment, the strike rates, or the notional amount in the contract.Given, the uncertainty around such payments, S&P Global Ratings will assign a rating to thecombination notes that is the lower of the rating on the counterparties and the ratingcommensurate with the cash flow results.
218. To address the uncertainty around uncapped administrative expenses, S&P Global Ratings willuse multiples of the administrative expenses capped at the top of the waterfall to stress paymentsavailable for equity when generating cash flows for our rating analysis for combination notes. Forother uncapped expenses such as subordinated, deferred, and incentive management fees,Standard & Poor's would look for these amounts to be limited so that they can be modeled.
Refinancing of the underlying combination securities219. Transactions may include the option to refinance one or more classes of notes at a lower coupon
than at issuance. Generally, when classes of notes are refinanced the refinancing offer is eitheraccepted by the respective noteholders or if he/she does not accept the offer the note is paid off infull.
220. In a combination security, the refinancing of one or more of the underlying components canchange the coupon on the combination security. Additionally, if portions of the coupon of theunderlying components were used in our cash flow analysis to size the credit enhancement, adecline in the underlying components' coupon may cause a decline in credit quality of the
www.spglobal.com/ratingsdirect August 8, 2016 61
ARCHIVE | Criteria | Structured Finance | CDOs: Global Methodologies And Assumptions For Corporate Cash Flow And Synthetic CDOs
combination security. Due to the potential impact on the credit quality of the combination note, weexpect that the change in coupon is voted on and accepted by 100% of the combinationnoteholders (voting separately from the underlying noteholders). Should the combinationnoteholders decline to lower the coupon they receive on the note, the combination note will beunwound and the noteholders will receive the respective components. As a result, the rating onthe combination note will be withdrawn.
Principal-protected combination securities221. "Principal-protected" combination securities are securities that are usually backed by
notes/certificates CDO issued by a CDO and another type of security. These securities are typicallyfederal, state, or local government-issued bonds, notes, or strips. Due to this feature, the ratingassigned to these principal-protected combination notes would typically be linked to the rating onthe issuer of the supporting security. The criteria for rating principal-protected combinationsecurities include the following conditions:
- The underlying security matures on or before the stated maturity date of the combinationnotes;
- The underlying security has a stated principal amount at maturity that is at least equal to thebalance the combination note that it supports;
- The underlying security is denominated in the same currency as the combination notes, unlessthe currency risk is otherwise mitigated;
- The supporting security is held as collateral in the CDO transaction until its stated maturity,and if sold, the proceeds from the sale or liquidation of the supporting security are sufficient torepay the principal due and accrued interest on the combo notes. Those proceeds are first usedto pay the amounts due on the combination notes in full, before being used otherwise.
- In certain transactions, the combination noteholders may also elect to receive the supportingsecurity in full satisfaction of the balance of the combination note (physical delivery). Whenphysical delivery is elected, all additional costs to physically acquire the assets should havebeen prepaid.
Notes cancellation without repayment222. There are a limited number of transactions that have experienced notes cancellation without
payment. Cancellation of subordinate debt affects the payment structure and cash flowmechanics, as well as the level of credit support, in CLO or CDO transactions that contain coveragetests (overcollateralization (O/C) tests and/or interest coverage (I/C) tests) in their paymentwaterfall. Generally, the cancellation of subordinate debt without payment according to thepayment waterfall makes the subordinate coverage tests less sensitive to failing due to defaultsor decline in the credit quality of the collateral portfolio. When the subordinate coverage tests areless likely to fail, the senior-most notes in transactions with sequential payment orders are lesslikely to receive principal payments resulting from diversion of interest and/or principal proceedsto cure the test, even though the quality and par amount of the asset pool has not changed.
223. The decision to accept note cancellation without payment is, in our view, indicative of an increasedexposure to operational and administrative risk. Many existing transaction documents as well ascriteria are silent as to the permissibility of note cancellation, as transactions' participants did notcontemplate such actions when the transactions were originated. The decision by investors,collateral managers and/or their affiliates to initiate note cancellation, and by independent
www.spglobal.com/ratingsdirect August 8, 2016 62
ARCHIVE | Criteria | Structured Finance | CDOs: Global Methodologies And Assumptions For Corporate Cash Flow And Synthetic CDOs
directors and trustees to accept such action, raises the possibility that additional notecancellation may continue to occur in the future.
224. In order to address the risk for CLO and CDO transactions that have experienced cancellation ofsubordinate debt without payment or where we believe there is a higher likelihood of occurrence ofnotes' cancellation, we look at the following factors to assess the risk associated to the likelihoodof a note cancellation for each given transaction:
- For new transactions, the rating committee may apply additional stresses if the transactiondocuments do not contain language that either prohibits note cancellation without payment orisolates the calculation of the coverage tests from the impact of a note cancellation. Under thisstress, we do not give credit in the calculation of coverage tests, to any notes other than thesenior-most notes. As a result, in the cash flow analysis the senior-most notes will have lessprotection from asset defaults and deteriorating credit quality, than if the stress was notapplied.
- For outstanding transactions we may look at whether transaction parties have demonstrated awillingness to propose and accept note cancellations without payment according to theirtransaction's documents in the past. The rating committee may also take into considerationwhether these transaction parties have not included restrictive language in new transactiondocuments. This may show a propensity to cancel additional notes to keep the coverage testsfrom failing.
FREQUENTLY ASKED QUESTIONS
How should the amortization schedule for a pool of assets be calculated fornew issue and surveillance analyses of managed transactions where assetsmay be reinvested?
The time equal to the covenanted weighted-average life of the transaction at the end of thereinvestment period, as described in the transaction's documents, should be added to thematurity of each asset maturing before the end of the reinvestment period. If this exercise resultsin the maturity of the asset occurring before the end of the reinvestment period, the same exerciseshould be repeated until the maturity of each asset occurs after the end of the reinvestmentperiod. This assumes that the assets are reinvested in assets with the same rating and parbalance as the original assets, while accounting for the weighted-average life of the originalassets purchased, the covenanted weighted-average life, and the length of the reinvestmentperiod.
For transactions that do not covenant to a weighted-average life schedule after the reinvestmentperiod, we use our discretion to develop the appropriate methodology for the given transaction.
For transactions that are being reviewed during our surveillance process, we may also considerother factors that may impact the likelihood and the risk associated with the reinvestment intonew assets. For example, if a transaction is close to ending the reinvestment period, we mayconsider the manager's intentions to reinvest in new assets. We may also consider whether themanager's decision to reinvest in shorter-tenor assets should increase the SDR produced by CDOEvaluator, which therefore implies a riskier portfolio compared to the investment in longer-tenorassets.
Further, it would be appropriate to use this calculated weighted-average life for those aspects of
www.spglobal.com/ratingsdirect August 8, 2016 63
ARCHIVE | Criteria | Structured Finance | CDOs: Global Methodologies And Assumptions For Corporate Cash Flow And Synthetic CDOs
the criteria that refer to the portfolio's weighted-average life. For example, table 12 of the criteriastates that we use the portfolio's weighted-average life to determine default pattern start years.
REVISIONS AND UPDATES
This article was originally published on Aug. 8, 2016.
Changes introduced after original publication:
- On Feb. 14, 2017, we updated table 30 (the Correlation Assumptions table) to reflect currentindustry codes.
- On April 11, 2017, we corrected table 19 (the Largest Obligor Default Test table) to addinadvertently omitted columns.
- Following our periodic review completed on July 31, 2017, we updated the contact information,updated a reference to the related criteria article "Jurisdiction Ranking Assessments OfNational Insolvency Regimes," and deleted paragraph 14.
- On Jan. 11, 2018, we added the "Frequently Asked Questions" section and clarified paragraphs179 and 189. We also corrected the headings in table 3.
- On April 10, 2018, we updated table 11, revised the related text in paragraph 84, and updatedthe contact information.
- Following our periodic review completed on July 24, 2018, we updated certain criteria andresearch article references.
RELATED CRITERIA AND RESEARCH
Retired/Superseded Criteria
- Global Methodologies And Assumptions For Corporate Cash Flow And Synthetic CDOs, Sept. 17,2015
- Principles For Rating Debt Issues Based On Imputed Promises, Oct. 24, 2013
- Guarantee Criteria--Structured Finance, May 7, 2013
- Methodology For Analyzing Rating Confirmation Requests To Establish SubsidiarySpecial-Purpose Entities In CDOs, Dec. 9, 2009
- CDO Spotlight: Issues in Rating Combination Notes in Cash Flow CDOs, March 4, 2004
Related Criteria
- Structured Finance: Asset Isolation And Special-Purpose Entity Methodology, March 29, 2017
- Guarantee Criteria, Oct. 21, 2016
- Ratings Above The Sovereign - Structured Finance: Methodology And Assumptions, Aug. 8,2016
- Principles For Rating Debt Issues Based On Imputed Promises, Dec. 19, 2014
www.spglobal.com/ratingsdirect August 8, 2016 64
ARCHIVE | Criteria | Structured Finance | CDOs: Global Methodologies And Assumptions For Corporate Cash Flow And Synthetic CDOs

- Mapping A Third Party's Internal Credit Scoring System To Standard & Poor's Global RatingScale, May 8, 2014
- Counterparty Risk Framework Methodology And Assumptions, June 25, 2013
- Global Investment Criteria For Temporary Investments In Transaction Accounts, May 31, 2012
- Global CDOs Of Pooled Structured Finance Assets: Methodology And Assumptions, Feb. 21,2012
- Principles Of Credit Ratings, Feb. 16, 2011
- Methodology: Credit Stability Criteria," May 3, 2010
- Surveillance Methodology For Global Cash Flow And Hybrid CDOs Subject To Acceleration OrLiquidation After An EOD, Sept. 2, 2009
- Understanding Standard & Poor’s Rating Definitions, June 3, 2009
- Revised CDO Current-Pay Criteria Assumptions For Corporate Debt When Issuers Announce ADistressed Exchange Or Buyback, May 18, 2009
- The Use Of Rating-Based Haircuts In Event Of Default Overcollateralization Tests For CDOs,March 19, 2008
- Qualification And Treatment Of Current-Pay Obligations In Global Cash Flow CLOs, July 11,2007
- Legal Criteria For U.S. Structured Finance Transactions: Special-Purpose Entities, Oct. 1, 2006
- Structured Finance Criteria Introduced For Cayman Islands Special-Purpose Entities, July 18,2002
Related Research
- Jurisdiction Ranking Assessments Of National Insolvency Regimes Update: November 2017,Nov. 22, 2017
- New Version Of CDO Evaluator (7.0) Will Include Updated Corporate Industry Codes, Aug. 8,2016
This report does not constitute a rating action.
www.spglobal.com/ratingsdirect August 8, 2016 65
ARCHIVE | Criteria | Structured Finance | CDOs: Global Methodologies And Assumptions For Corporate Cash Flow And Synthetic CDOs

www.spglobal.com/ratingsdirect August 8, 2016 66
ARCHIVE | Criteria | Structured Finance | CDOs: Global Methodologies And Assumptions For Corporate Cash Flow And Synthetic CDOs
STANDARD & POOR’S, S&P and RATINGSDIRECT are registered trademarks of Standard & Poor’s Financial Services LLC.
S&P may receive compensation for its ratings and certain analyses, normally from issuers or underwriters of securities or from obligors.S&P reserves the right to disseminate its opinions and analyses. S&P's public ratings and analyses are made available on its Web sites,www.standardandpoors.com (free of charge), and www.ratingsdirect.com (subscription), and may be distributed through other means,including via S&P publications and third-party redistributors. Additional information about our ratings fees is available atwww.standardandpoors.com/usratingsfees.
S&P keeps certain activities of its business units separate from each other in order to preserve the independence and objectivity of theirrespective activities. As a result, certain business units of S&P may have information that is not available to other S&P business units. S&Phas established policies and procedures to maintain the confidentiality of certain non-public information received in connection with eachanalytical process.
To the extent that regulatory authorities allow a rating agency to acknowledge in one jurisdiction a rating issued in another jurisdiction forcertain regulatory purposes, S&P reserves the right to assign, withdraw or suspend such acknowledgment at any time and in its solediscretion. S&P Parties disclaim any duty whatsoever arising out of the assignment, withdrawal or suspension of an acknowledgment aswell as any liability for any damage alleged to have been suffered on account thereof.
Credit-related and other analyses, including ratings, and statements in the Content are statements of opinion as of the date they areexpressed and not statements of fact. S&P’s opinions, analyses and rating acknowledgment decisions (described below) are notrecommendations to purchase, hold, or sell any securities or to make any investment decisions, and do not address the suitability of anysecurity. S&P assumes no obligation to update the Content following publication in any form or format. The Content should not be relied onand is not a substitute for the skill, judgment and experience of the user, its management, employees, advisors and/or clients when makinginvestment and other business decisions. S&P does not act as a fiduciary or an investment advisor except where registered as such. WhileS&P has obtained information from sources it believes to be reliable, S&P does not perform an audit and undertakes no duty of duediligence or independent verification of any information it receives. Rating-related publications may be published for a variety of reasonsthat are not necessarily dependent on action by rating committees, including, but not limited to, the publication of a periodic update on acredit rating and related analyses.
No content (including ratings, credit-related analyses and data, valuations, model, software or other application or output therefrom) or anypart thereof (Content) may be modified, reverse engineered, reproduced or distributed in any form by any means, or stored in a database orretrieval system, without the prior written permission of Standard & Poor’s Financial Services LLC or its affiliates (collectively, S&P). TheContent shall not be used for any unlawful or unauthorized purposes. S&P and any third-party providers, as well as their directors, officers,shareholders, employees or agents (collectively S&P Parties) do not guarantee the accuracy, completeness, timeliness or availability of theContent. S&P Parties are not responsible for any errors or omissions (negligent or otherwise), regardless of the cause, for the resultsobtained from the use of the Content, or for the security or maintenance of any data input by the user. The Content is provided on an “as is”basis. S&P PARTIES DISCLAIM ANY AND ALL EXPRESS OR IMPLIED WARRANTIES, INCLUDING, BUT NOT LIMITED TO, ANY WARRANTIES OFMERCHANTABILITY OR FITNESS FOR A PARTICULAR PURPOSE OR USE, FREEDOM FROM BUGS, SOFTWARE ERRORS OR DEFECTS, THATTHE CONTENT’S FUNCTIONING WILL BE UNINTERRUPTED OR THAT THE CONTENT WILL OPERATE WITH ANY SOFTWARE OR HARDWARECONFIGURATION. In no event shall S&P Parties be liable to any party for any direct, indirect, incidental, exemplary, compensatory, punitive,special or consequential damages, costs, expenses, legal fees, or losses (including, without limitation, lost income or lost profits andopportunity costs or losses caused by negligence) in connection with any use of the Content even if advised of the possibility of suchdamages.
Copyright © 2019 by Standard & Poor’s Financial Services LLC. All rights reserved.