Embed Size (px)
Citation preview
1
August 2017
Global Steel Report
U.S. Department of Commerce | International Trade Administration
2
Global Steel Report
Introduction and Trends At a challenging time for the steel industry, the United States Government is committed to providing information to the public in an accessible and transparent manner. The Global Steel Report offers a straightforward interpretation of currently available statistical data concerning the global steel trade and the regions and countries that play a large role in it. Information in this report includes global export and import trends, production, capacity, and consumption data. This information will provide current, objective, and relevant global steel trade and industry data and will allow for new insights into the global steel marketplace. Steel is a critical industry worldwide, and steel products are a heavily traded commodity. In recent years, market changes, shifts in import and export levels, and weakness in the global demand for steel negatively impacted steel industries across the world. Along with shifting trade patterns, world benchmark steel prices began to downward in early 2011, and the financial outlook for many steel companies declined. In 2016, benchmark steel prices began to rise. Steel Business Briefing’s USA Domestic Hot Rolled Coil benchmark price increased 55 percent between 2015 and 2016. Notably, however, the 2016 benchmark price was still 16 percent lower than the Hot Rolled Coil Benchmark price in 2011. Furthermore, the financial outlook for many steel companies has remained weak. The 2008-2009 global financial crisis was particularly difficult for steel industries, and this period will feature prominently in the following discussion of global steel indicators. 2016 was also a period of decline for the steel industry, as weak global demand continued to cause stagnation and declines in other indicators.
3
Global Steel Report
Production
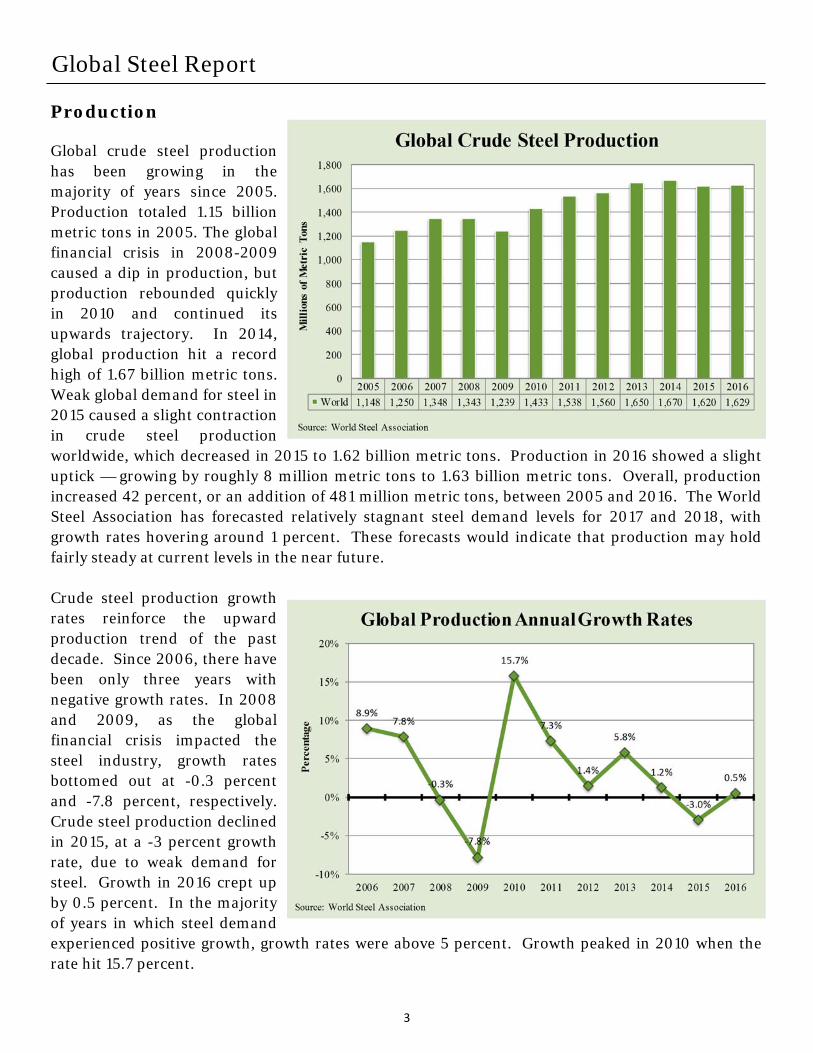
Global crude steel production has been growing in the majority of years since 2005. Production totaled 1.15 billion metric tons in 2005. The global financial crisis in 2008-2009 caused a dip in production, but production rebounded quickly in 2010 and continued its upwards trajectory. In 2014, global production hit a record high of 1.67 billion metric tons. Weak global demand for steel in 2015 caused a slight contraction in crude steel production worldwide, which decreased in 2015 to 1.62 billion metric tons. Production in 2016 showed a slight uptick — growing by roughly 8 million metric tons to 1.63 billion metric tons. Overall, production increased 42 percent, or an addition of 481 million metric tons, between 2005 and 2016. The World Steel Association has forecasted relatively stagnant steel demand levels for 2017 and 2018, with growth rates hovering around 1 percent. These forecasts would indicate that production may hold fairly steady at current levels in the near future. Crude steel production growth rates reinforce the upward production trend of the past decade. Since 2006, there have been only three years with negative growth rates. In 2008 and 2009, as the global financial crisis impacted the steel industry, growth rates bottomed out at -0.3 percent and -7.8 percent, respectively. Crude steel production declined in 2015, at a -3 percent growth rate, due to weak demand for steel. Growth in 2016 crept up by 0.5 percent. In the majority of years in which steel demand experienced positive growth, growth rates were above 5 percent. Growth peaked in 2010 when the rate hit 15.7 percent.
4
Global Steel Report
Production by Region
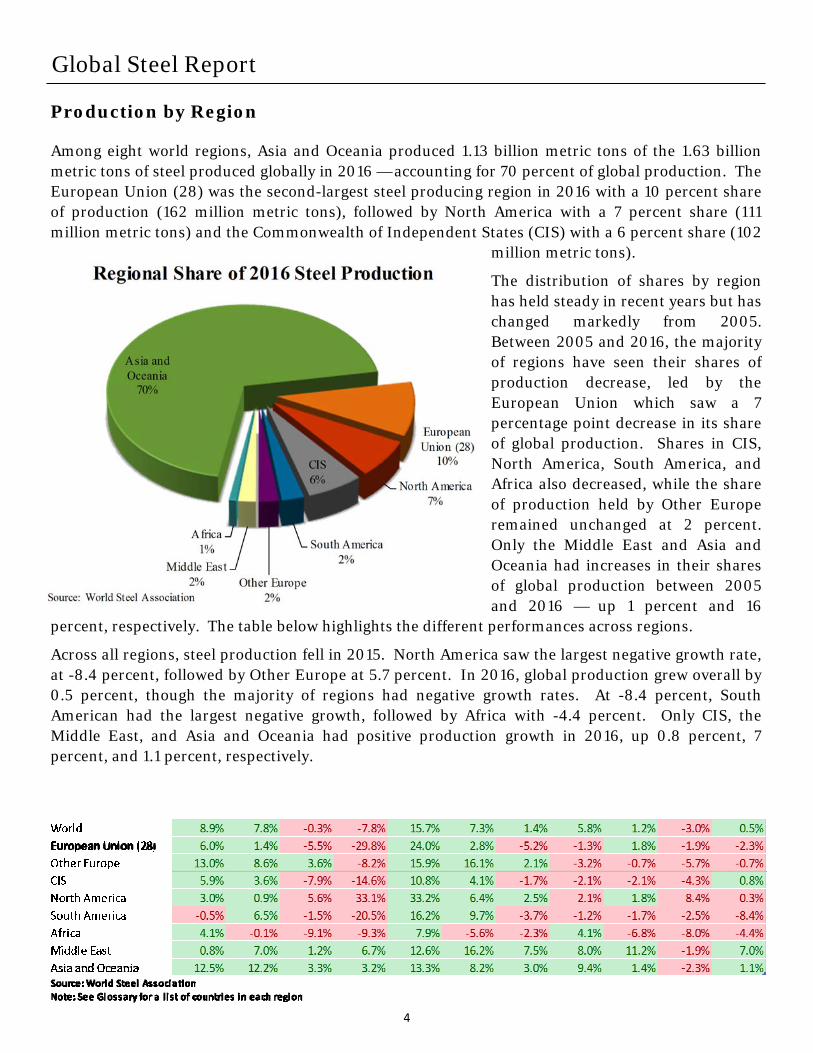
Among eight world regions, Asia and Oceania produced 1.13 billion metric tons of the 1.63 billion metric tons of steel produced globally in 2016 — accounting for 70 percent of global production. The European Union (28) was the second-largest steel producing region in 2016 with a 10 percent share of production (162 million metric tons), followed by North America with a 7 percent share (111 million metric tons) and the Commonwealth of Independent States (CIS) with a 6 percent share (102
million metric tons).
The distribution of shares by region has held steady in recent years but has changed markedly from 2005. Between 2005 and 2016, the majority of regions have seen their shares of production decrease, led by the European Union which saw a 7 percentage point decrease in its share of global production. Shares in CIS, North America, South America, and Africa also decreased, while the share of production held by Other Europe remained unchanged at 2 percent. Only the Middle East and Asia and Oceania had increases in their shares of global production between 2005 and 2016 — up 1 percent and 16
percent, respectively. The table below highlights the different performances across regions.
Across all regions, steel production fell in 2015. North America saw the largest negative growth rate, at -8.4 percent, followed by Other Europe at 5.7 percent. In 2016, global production grew overall by 0.5 percent, though the majority of regions had negative growth rates. At -8.4 percent, South American had the largest negative growth, followed by Africa with -4.4 percent. Only CIS, the Middle East, and Asia and Oceania had positive production growth in 2016, up 0.8 percent, 7 percent, and 1.1 percent, respectively.
5
Global Steel Report
Production by Country
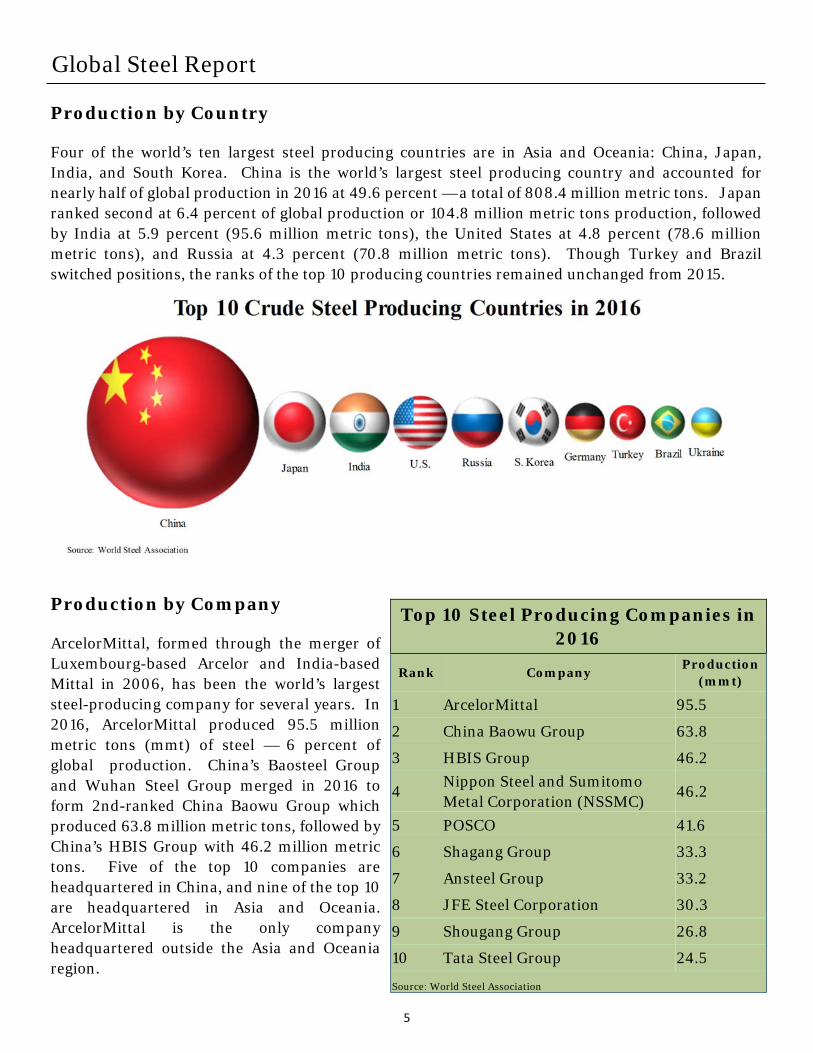
Four of the world’s ten largest steel producing countries are in Asia and Oceania: China, Japan, India, and South Korea. China is the world’s largest steel producing country and accounted for nearly half of global production in 2016 at 49.6 percent — a total of 808.4 million metric tons. Japan ranked second at 6.4 percent of global production or 104.8 million metric tons production, followed by India at 5.9 percent (95.6 million metric tons), the United States at 4.8 percent (78.6 million metric tons), and Russia at 4.3 percent (70.8 million metric tons). Though Turkey and Brazil switched positions, the ranks of the top 10 producing countries remained unchanged from 2015.
Production by Company
ArcelorMittal, formed through the merger of Luxembourg-based Arcelor and India-based Mittal in 2006, has been the world’s largest steel-producing company for several years. In 2016, ArcelorMittal produced 95.5 million metric tons (mmt) of steel — 6 percent of global production. China’s Baosteel Group and Wuhan Steel Group merged in 2016 to form 2nd-ranked China Baowu Group which produced 63.8 million metric tons, followed by China’s HBIS Group with 46.2 million metric tons. Five of the top 10 companies are headquartered in China, and nine of the top 10 are headquartered in Asia and Oceania. ArcelorMittal is the only company headquartered outside the Asia and Oceania region.
Top 10 Steel Producing Companies in 2016
Rank Company Production
(mmt)
1 ArcelorMittal 95.5
2 China Baowu Group 63.8
3 HBIS Group 46.2
4 Nippon Steel and Sumitomo Metal Corporation (NSSMC)
46.2
5 POSCO 41.6
6 Shagang Group 33.3
7 Ansteel Group 33.2
8 JFE Steel Corporation 30.3
9 Shougang Group 26.8
10 Tata Steel Group 24.5
Source: World Steel Association
6
Global Steel Report
Capacity
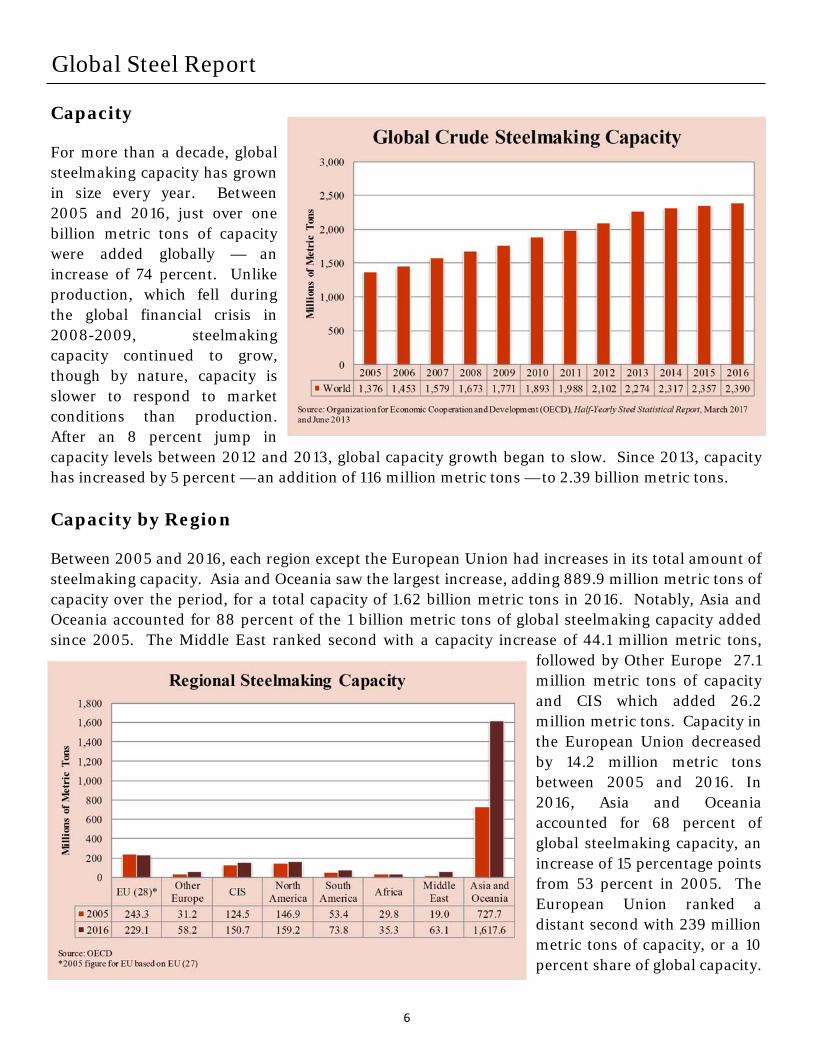
For more than a decade, global steelmaking capacity has grown in size every year. Between 2005 and 2016, just over one billion metric tons of capacity were added globally — an increase of 74 percent. Unlike production, which fell during the global financial crisis in 2008-2009, steelmaking capacity continued to grow, though by nature, capacity is slower to respond to market conditions than production. After an 8 percent jump in capacity levels between 2012 and 2013, global capacity growth began to slow. Since 2013, capacity has increased by 5 percent — an addition of 116 million metric tons — to 2.39 billion metric tons. Capacity by Region
Between 2005 and 2016, each region except the European Union had increases in its total amount of steelmaking capacity. Asia and Oceania saw the largest increase, adding 889.9 million metric tons of capacity over the period, for a total capacity of 1.62 billion metric tons in 2016. Notably, Asia and Oceania accounted for 88 percent of the 1 billion metric tons of global steelmaking capacity added since 2005. The Middle East ranked second with a capacity increase of 44.1 million metric tons,
followed by Other Europe 27.1 million metric tons of capacity and CIS which added 26.2 million metric tons. Capacity in the European Union decreased by 14.2 million metric tons between 2005 and 2016. In 2016, Asia and Oceania accounted for 68 percent of global steelmaking capacity, an increase of 15 percentage points from 53 percent in 2005. The European Union ranked a distant second with 239 million metric tons of capacity, or a 10 percent share of global capacity.
7
Global Steel Report
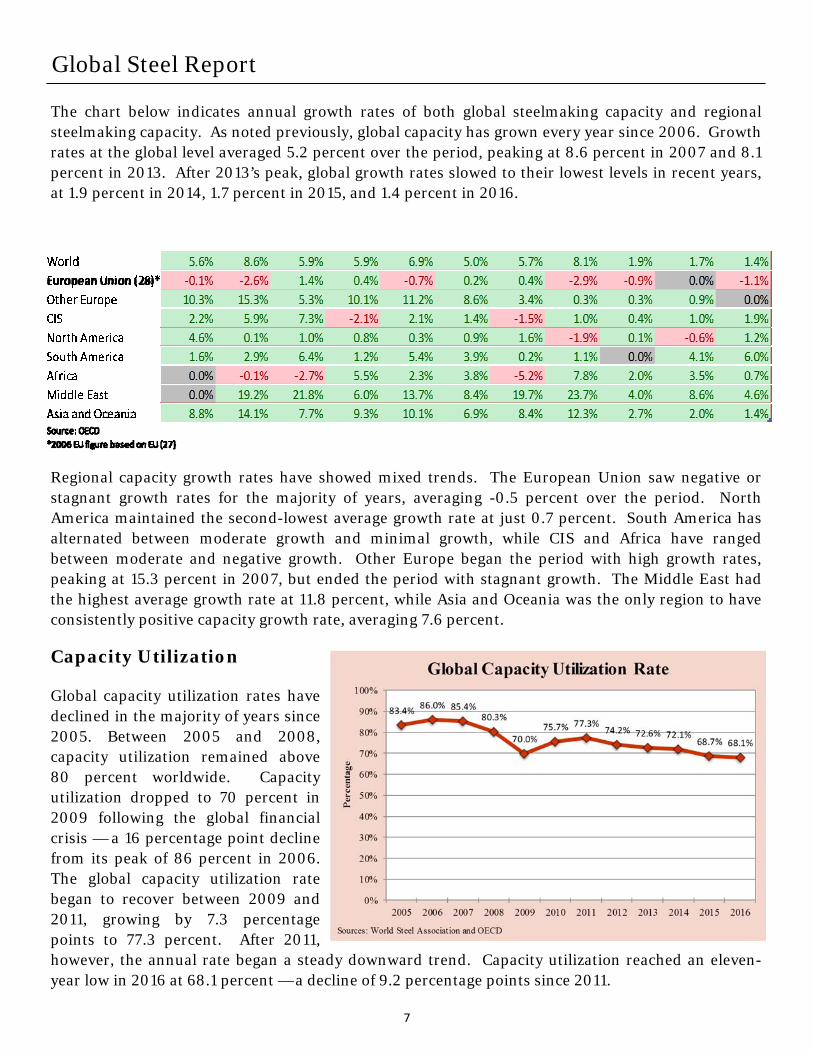
The chart below indicates annual growth rates of both global steelmaking capacity and regional steelmaking capacity. As noted previously, global capacity has grown every year since 2006. Growth rates at the global level averaged 5.2 percent over the period, peaking at 8.6 percent in 2007 and 8.1 percent in 2013. After 2013’s peak, global growth rates slowed to their lowest levels in recent years, at 1.9 percent in 2014, 1.7 percent in 2015, and 1.4 percent in 2016.
Regional capacity growth rates have showed mixed trends. The European Union saw negative or stagnant growth rates for the majority of years, averaging -0.5 percent over the period. North America maintained the second-lowest average growth rate at just 0.7 percent. South America has alternated between moderate growth and minimal growth, while CIS and Africa have ranged between moderate and negative growth. Other Europe began the period with high growth rates, peaking at 15.3 percent in 2007, but ended the period with stagnant growth. The Middle East had the highest average growth rate at 11.8 percent, while Asia and Oceania was the only region to have consistently positive capacity growth rate, averaging 7.6 percent.
Capacity Utilization
Global capacity utilization rates have declined in the majority of years since 2005. Between 2005 and 2008, capacity utilization remained above 80 percent worldwide. Capacity utilization dropped to 70 percent in 2009 following the global financial crisis — a 16 percentage point decline from its peak of 86 percent in 2006. The global capacity utilization rate began to recover between 2009 and 2011, growing by 7.3 percentage points to 77.3 percent. After 2011, however, the annual rate began a steady downward trend. Capacity utilization reached an eleven-year low in 2016 at 68.1 percent — a decline of 9.2 percentage points since 2011.
8
Global Steel Report
Capacity Utilization by Region
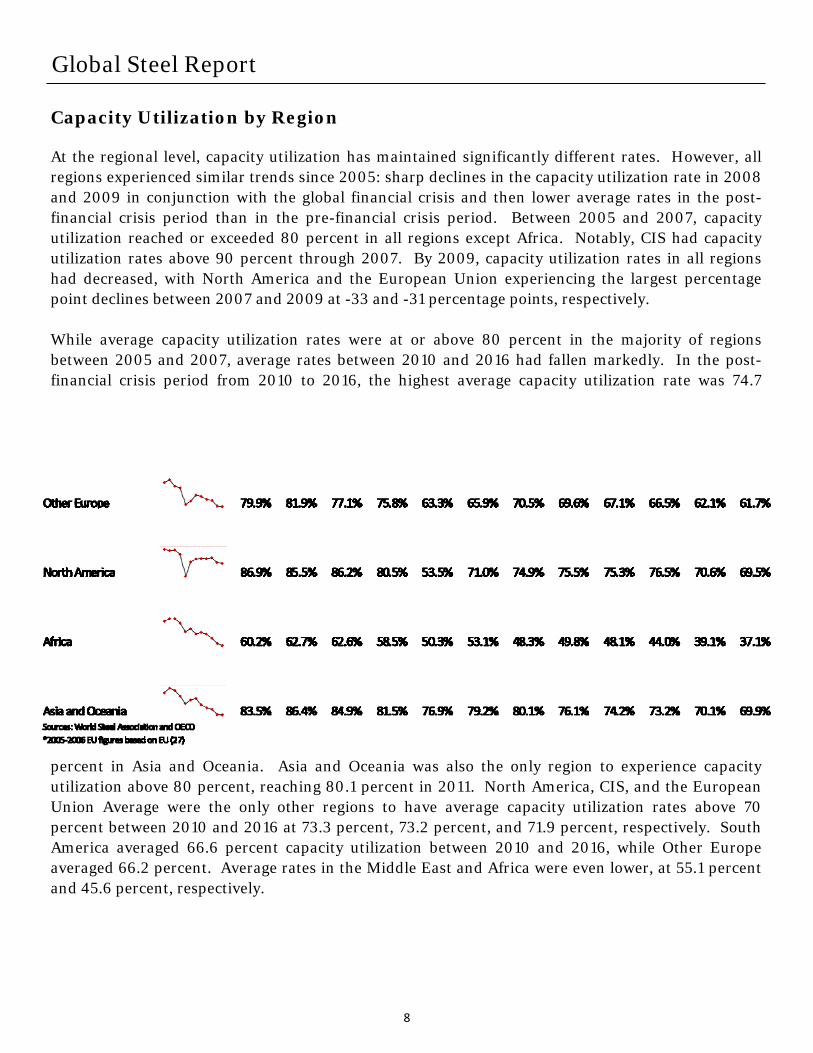
At the regional level, capacity utilization has maintained significantly different rates. However, all regions experienced similar trends since 2005: sharp declines in the capacity utilization rate in 2008 and 2009 in conjunction with the global financial crisis and then lower average rates in the post-financial crisis period than in the pre-financial crisis period. Between 2005 and 2007, capacity utilization reached or exceeded 80 percent in all regions except Africa. Notably, CIS had capacity utilization rates above 90 percent through 2007. By 2009, capacity utilization rates in all regions had decreased, with North America and the European Union experiencing the largest percentage point declines between 2007 and 2009 at -33 and -31 percentage points, respectively. While average capacity utilization rates were at or above 80 percent in the majority of regions between 2005 and 2007, average rates between 2010 and 2016 had fallen markedly. In the post-financial crisis period from 2010 to 2016, the highest average capacity utilization rate was 74.7
percent in Asia and Oceania. Asia and Oceania was also the only region to experience capacity utilization above 80 percent, reaching 80.1 percent in 2011. North America, CIS, and the European Union Average were the only other regions to have average capacity utilization rates above 70 percent between 2010 and 2016 at 73.3 percent, 73.2 percent, and 71.9 percent, respectively. South America averaged 66.6 percent capacity utilization between 2010 and 2016, while Other Europe averaged 66.2 percent. Average rates in the Middle East and Africa were even lower, at 55.1 percent and 45.6 percent, respectively.
9
Global Steel Report
Apparent Steel Use
Since 2005, global apparent steel use of finished products, also known as demand, has tracked relatively closely with production and maintained a similar trend line. After gaining through 2007, demand slowed in 2008 and then declined by 6 percent in 2009. As markets recovered from the global financial crisis, steel demand steadily increased — growing by 34 percent from 1.15 billion metric tons in 2009 to a peak of 1.55 billion metric tons in 2014. However, demand for steel was weak in 2015. Apparent steel use decreased by 3 percent worldwide in 2015 — the same percentage decline as production that year. Demand in 2016 showed a slight uptick, growing 1 percent to 1.52 billion metric tons. Despite the lower levels in 2015 and 2016, demand for steel grew by 45 percent between 2005 and 2016 — an increase of 468.6 million metric tons.
Apparent Steel Use by Region
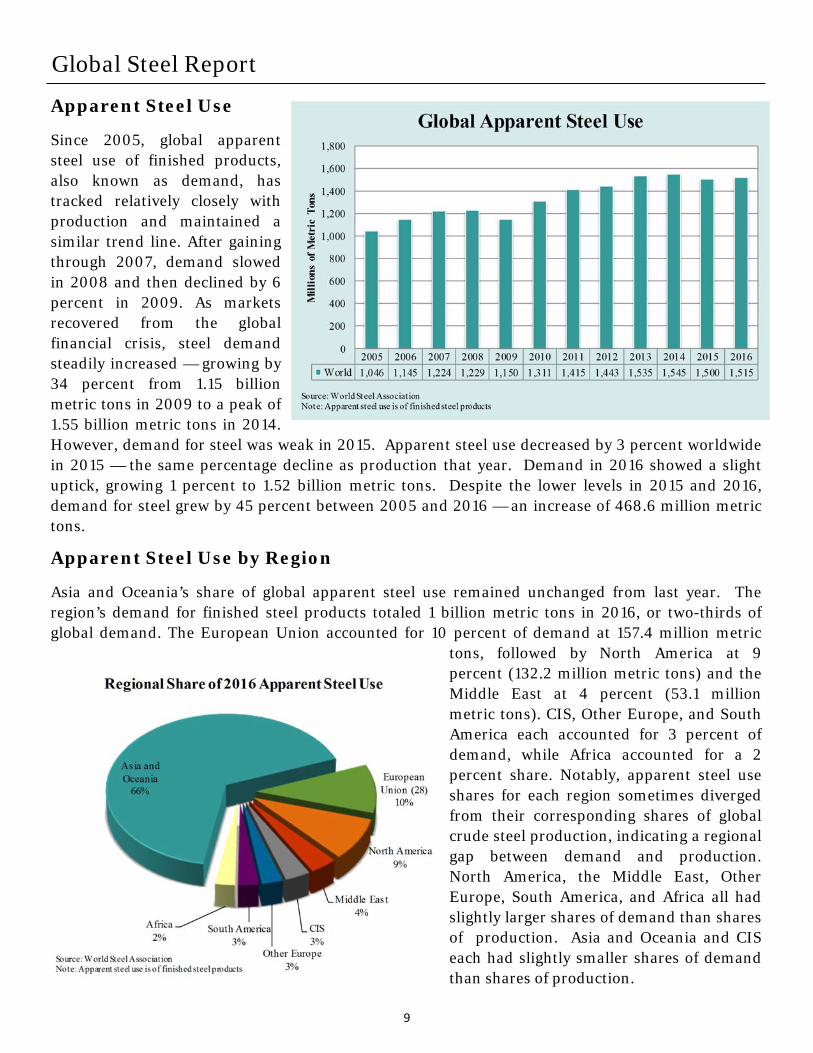
Asia and Oceania’s share of global apparent steel use remained unchanged from last year. The region’s demand for finished steel products totaled 1 billion metric tons in 2016, or two-thirds of global demand. The European Union accounted for 10 percent of demand at 157.4 million metric
tons, followed by North America at 9 percent (132.2 million metric tons) and the Middle East at 4 percent (53.1 million metric tons). CIS, Other Europe, and South America each accounted for 3 percent of demand, while Africa accounted for a 2 percent share. Notably, apparent steel use shares for each region sometimes diverged from their corresponding shares of global crude steel production, indicating a regional gap between demand and production. North America, the Middle East, Other Europe, South America, and Africa all had slightly larger shares of demand than shares of production. Asia and Oceania and CIS each had slightly smaller shares of demand than shares of production.
10
Global Steel Report
Apparent Steel Use, Production, and Capacity Comparison
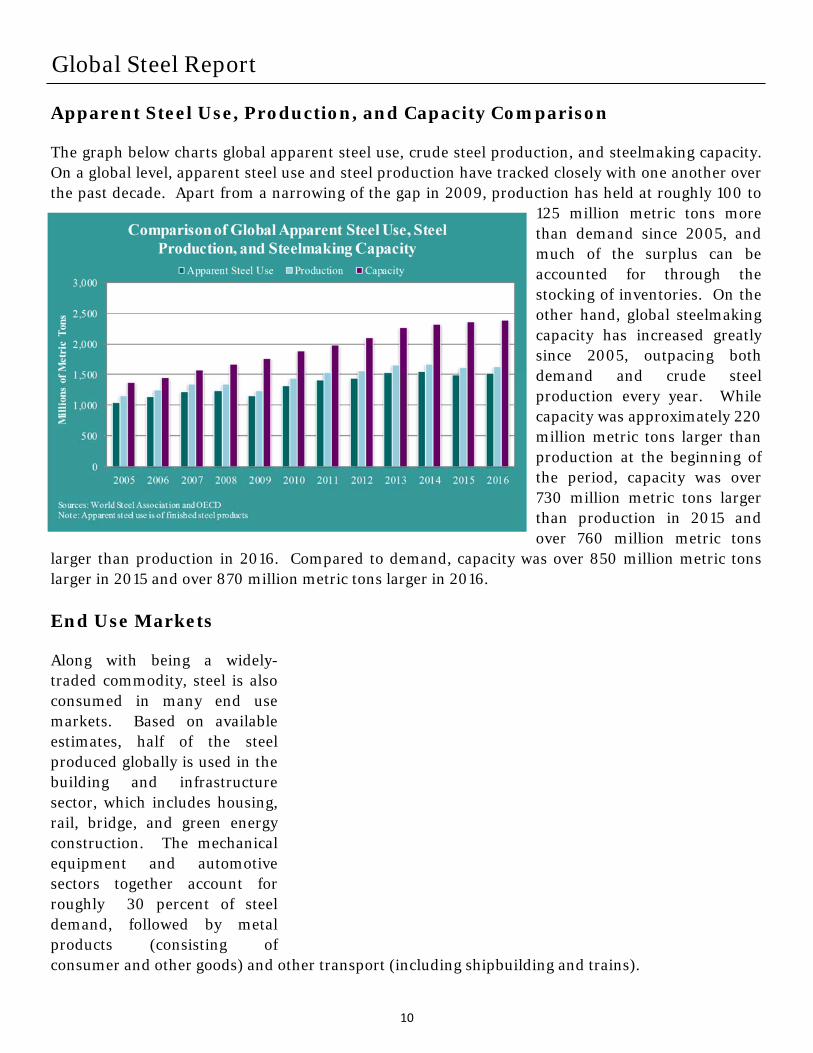
The graph below charts global apparent steel use, crude steel production, and steelmaking capacity. On a global level, apparent steel use and steel production have tracked closely with one another over the past decade. Apart from a narrowing of the gap in 2009, production has held at roughly 100 to
125 million metric tons more than demand since 2005, and much of the surplus can be accounted for through the stocking of inventories. On the other hand, global steelmaking capacity has increased greatly since 2005, outpacing both demand and crude steel production every year. While capacity was approximately 220 million metric tons larger than production at the beginning of the period, capacity was over 730 million metric tons larger than production in 2015 and over 760 million metric tons
larger than production in 2016. Compared to demand, capacity was over 850 million metric tons larger in 2015 and over 870 million metric tons larger in 2016. End Use Markets
Along with being a widely-traded commodity, steel is also consumed in many end use markets. Based on available estimates, half of the steel produced globally is used in the building and infrastructure sector, which includes housing, rail, bridge, and green energy construction. The mechanical equipment and automotive sectors together account for roughly 30 percent of steel demand, followed by metal products (consisting of consumer and other goods) and other transport (including shipbuilding and trains).
11
Global Steel Report
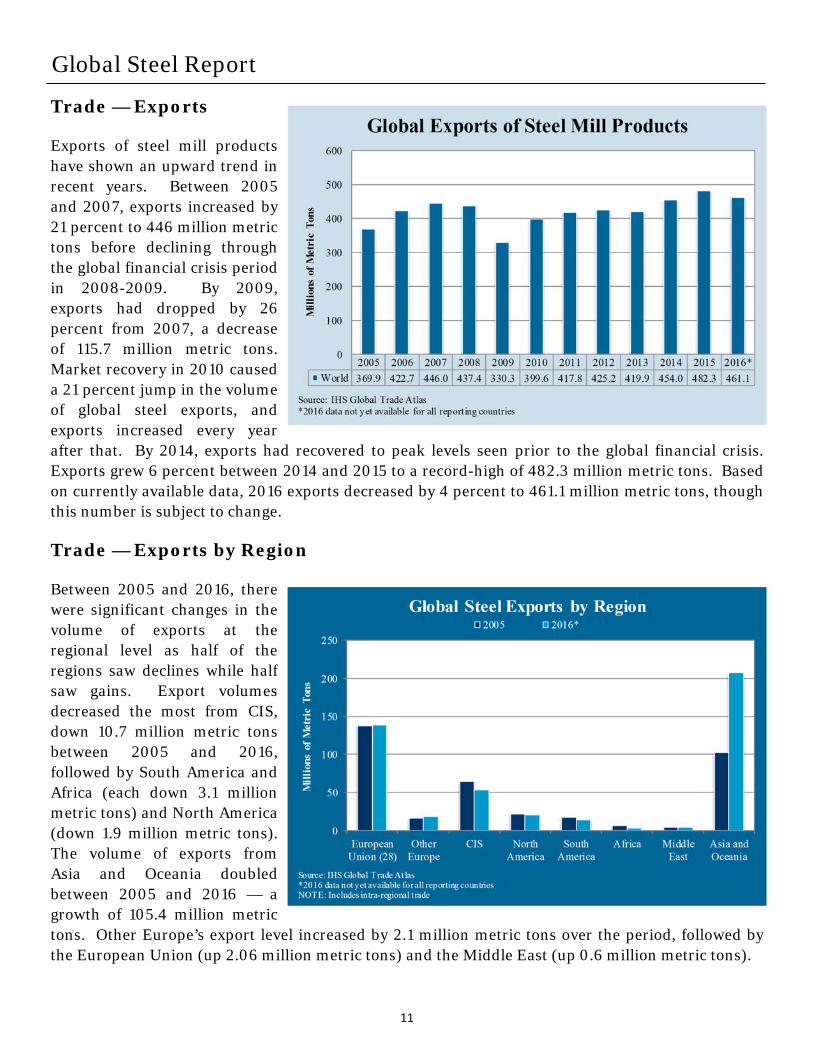
Trade — Exports
Exports of steel mill products have shown an upward trend in recent years. Between 2005 and 2007, exports increased by 21 percent to 446 million metric tons before declining through the global financial crisis period in 2008-2009. By 2009, exports had dropped by 26 percent from 2007, a decrease of 115.7 million metric tons. Market recovery in 2010 caused a 21 percent jump in the volume of global steel exports, and exports increased every year after that. By 2014, exports had recovered to peak levels seen prior to the global financial crisis. Exports grew 6 percent between 2014 and 2015 to a record-high of 482.3 million metric tons. Based on currently available data, 2016 exports decreased by 4 percent to 461.1 million metric tons, though this number is subject to change.
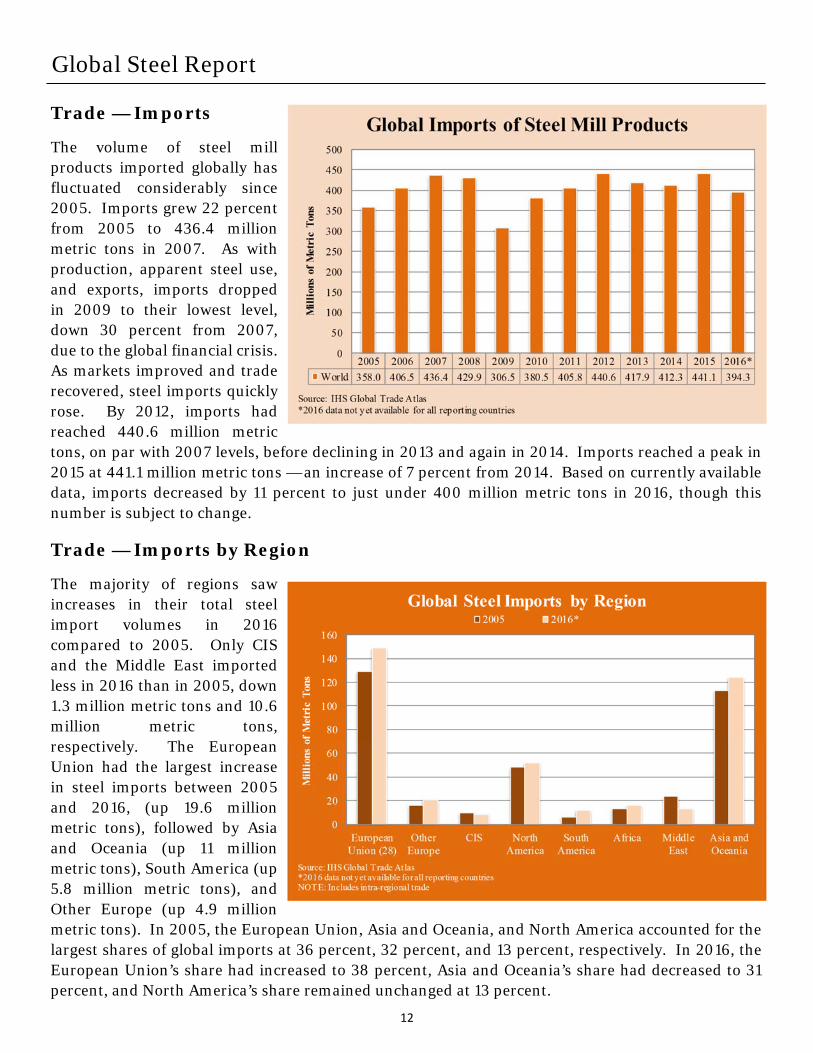
Trade — Exports by Region
Between 2005 and 2016, there were significant changes in the volume of exports at the regional level as half of the regions saw declines while half saw gains. Export volumes decreased the most from CIS, down 10.7 million metric tons between 2005 and 2016, followed by South America and Africa (each down 3.1 million metric tons) and North America (down 1.9 million metric tons). The volume of exports from Asia and Oceania doubled between 2005 and 2016 — a growth of 105.4 million metric tons. Other Europe’s export level increased by 2.1 million metric tons over the period, followed by the European Union (up 2.06 million metric tons) and the Middle East (up 0.6 million metric tons).
12
Global Steel Report
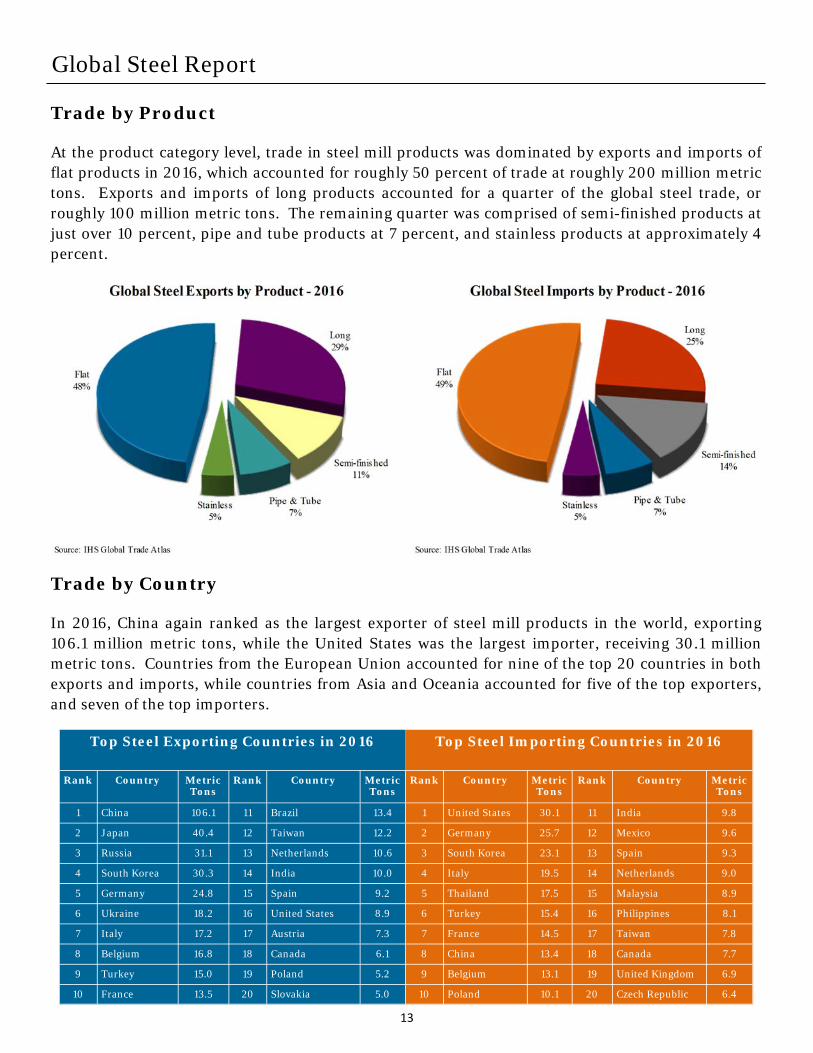
Trade — Imports
The volume of steel mill products imported globally has fluctuated considerably since 2005. Imports grew 22 percent from 2005 to 436.4 million metric tons in 2007. As with production, apparent steel use, and exports, imports dropped in 2009 to their lowest level, down 30 percent from 2007, due to the global financial crisis. As markets improved and trade recovered, steel imports quickly rose. By 2012, imports had reached 440.6 million metric tons, on par with 2007 levels, before declining in 2013 and again in 2014. Imports reached a peak in 2015 at 441.1 million metric tons — an increase of 7 percent from 2014. Based on currently available data, imports decreased by 11 percent to just under 400 million metric tons in 2016, though this number is subject to change.
Trade — Imports by Region
The majority of regions saw increases in their total steel import volumes in 2016 compared to 2005. Only CIS and the Middle East imported less in 2016 than in 2005, down 1.3 million metric tons and 10.6 million metric tons, respectively. The European Union had the largest increase in steel imports between 2005 and 2016, (up 19.6 million metric tons), followed by Asia and Oceania (up 11 million metric tons), South America (up 5.8 million metric tons), and Other Europe (up 4.9 million metric tons). In 2005, the European Union, Asia and Oceania, and North America accounted for the largest shares of global imports at 36 percent, 32 percent, and 13 percent, respectively. In 2016, the European Union’s share had increased to 38 percent, Asia and Oceania’s share had decreased to 31 percent, and North America’s share remained unchanged at 13 percent.
13
Global Steel Report
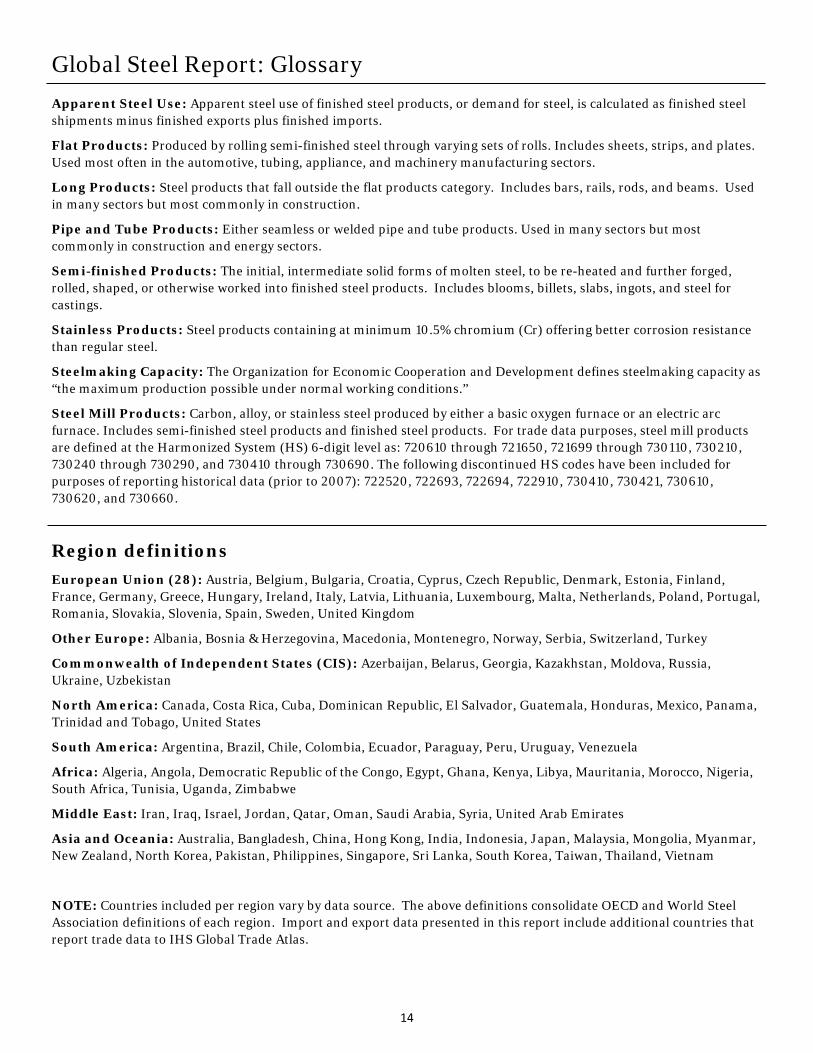
Trade by Product
At the product category level, trade in steel mill products was dominated by exports and imports of flat products in 2016, which accounted for roughly 50 percent of trade at roughly 200 million metric tons. Exports and imports of long products accounted for a quarter of the global steel trade, or roughly 100 million metric tons. The remaining quarter was comprised of semi-finished products at just over 10 percent, pipe and tube products at 7 percent, and stainless products at approximately 4 percent.
Trade by Country
In 2016, China again ranked as the largest exporter of steel mill products in the world, exporting 106.1 million metric tons, while the United States was the largest importer, receiving 30.1 million metric tons. Countries from the European Union accounted for nine of the top 20 countries in both exports and imports, while countries from Asia and Oceania accounted for five of the top exporters, and seven of the top importers.
Top Steel Exporting Countries in 2016 Top Steel Importing Countries in 2016
Rank Country Metric Tons
Rank Country Metric Tons
Rank Country Metric Tons
Rank Country Metric Tons
1 China 106.1 11 Brazil 13.4 1 United States 30.1 11 India 9.8
2 Japan 40.4 12 Taiwan 12.2 2 Germany 25.7 12 Mexico 9.6
3 Russia 31.1 13 Netherlands 10.6 3 South Korea 23.1 13 Spain 9.3
4 South Korea 30.3 14 India 10.0 4 Italy 19.5 14 Netherlands 9.0
5 Germany 24.8 15 Spain 9.2 5 Thailand 17.5 15 Malaysia 8.9
6 Ukraine 18.2 16 United States 8.9 6 Turkey 15.4 16 Philippines 8.1
7 Italy 17.2 17 Austria 7.3 7 France 14.5 17 Taiwan 7.8
8 Belgium 16.8 18 Canada 6.1 8 China 13.4 18 Canada 7.7
9 Turkey 15.0 19 Poland 5.2 9 Belgium 13.1 19 United Kingdom 6.9
10 France 13.5 20 Slovakia 5.0 10 Poland 10.1 20 Czech Republic 6.4
14
Global Steel Report: Glossary Apparent Steel Use: Apparent steel use of finished steel products, or demand for steel, is calculated as finished steel shipments minus finished exports plus finished imports.
Flat Products: Produced by rolling semi-finished steel through varying sets of rolls. Includes sheets, strips, and plates. Used most often in the automotive, tubing, appliance, and machinery manufacturing sectors.
Long Products: Steel products that fall outside the flat products category. Includes bars, rails, rods, and beams. Used in many sectors but most commonly in construction.
Pipe and Tube Products: Either seamless or welded pipe and tube products. Used in many sectors but most commonly in construction and energy sectors.
Semi-finished Products: The initial, intermediate solid forms of molten steel, to be re-heated and further forged, rolled, shaped, or otherwise worked into finished steel products. Includes blooms, billets, slabs, ingots, and steel for castings.
Stainless Products: Steel products containing at minimum 10.5% chromium (Cr) offering better corrosion resistance than regular steel.
Steelmaking Capacity: The Organization for Economic Cooperation and Development defines steelmaking capacity as “the maximum production possible under normal working conditions.”
Steel Mill Products: Carbon, alloy, or stainless steel produced by either a basic oxygen furnace or an electric arc furnace. Includes semi-finished steel products and finished steel products. For trade data purposes, steel mill products are defined at the Harmonized System (HS) 6-digit level as: 720610 through 721650, 721699 through 730110, 730210, 730240 through 730290, and 730410 through 730690. The following discontinued HS codes have been included for purposes of reporting historical data (prior to 2007): 722520, 722693, 722694, 722910, 730410, 730421, 730610, 730620, and 730660.
Region definitions
European Union (28): Austria, Belgium, Bulgaria, Croatia, Cyprus, Czech Republic, Denmark, Estonia, Finland, France, Germany, Greece, Hungary, Ireland, Italy, Latvia, Lithuania, Luxembourg, Malta, Netherlands, Poland, Portugal, Romania, Slovakia, Slovenia, Spain, Sweden, United Kingdom
Other Europe: Albania, Bosnia & Herzegovina, Macedonia, Montenegro, Norway, Serbia, Switzerland, Turkey
Commonwealth of Independent States (CIS): Azerbaijan, Belarus, Georgia, Kazakhstan, Moldova, Russia, Ukraine, Uzbekistan
North America: Canada, Costa Rica, Cuba, Dominican Republic, El Salvador, Guatemala, Honduras, Mexico, Panama, Trinidad and Tobago, United States
South America: Argentina, Brazil, Chile, Colombia, Ecuador, Paraguay, Peru, Uruguay, Venezuela
Africa: Algeria, Angola, Democratic Republic of the Congo, Egypt, Ghana, Kenya, Libya, Mauritania, Morocco, Nigeria, South Africa, Tunisia, Uganda, Zimbabwe
Middle East: Iran, Iraq, Israel, Jordan, Qatar, Oman, Saudi Arabia, Syria, United Arab Emirates
Asia and Oceania: Australia, Bangladesh, China, Hong Kong, India, Indonesia, Japan, Malaysia, Mongolia, Myanmar, New Zealand, North Korea, Pakistan, Philippines, Singapore, Sri Lanka, South Korea, Taiwan, Thailand, Vietnam
NOTE: Countries included per region vary by data source. The above definitions consolidate OECD and World Steel Association definitions of each region. Import and export data presented in this report include additional countries that report trade data to IHS Global Trade Atlas.
15
Global Steel Trade Monitor: The monitor provides global import and export trends for the top countries trading in steel products. The current reports expand upon the early release information already provided by the Steel Import Monitoring and Analysis (SIMA) system that collects and publishes data on U.S. imports of steel mill products. Complementing the SIMA data, these reports provide objective and current global steel industry information about the top countries that play an essential role in the global steel trade. Information in these reports includes global exports and import trends, production and consumption data and, where available, information regarding trade remedy actions taken on steel products. The reports will be updated quarterly.
Steel Import Monitoring and Analysis (SIMA) System: The Department of Commerce uses a steel import licensing program to collect and publish aggregate data on near real-time steel mill imports into the United States. SIMA incorporates information collected from steel license applications with publicly released data from the U.S. Census Bureau. By design, this information provides stakeholders with valuable information on the steel trade with the United States. For more information about SIMA, please go to http://enforcement.trade.gov/steel/license/.