Embed Size (px)
Citation preview

Many long-running economic and market trends (such as low inflation and slow growth, or bull markets in bonds and tech) appear extended in terms of duration, overvaluation and heavy positioning. It is likely that a new market regime, whose winners will be different, is afoot. The industrials sector is likely to be one of the winners. After a period of nearly 10 years of underperformance, we believe industrials are undervalued and stand to benefit from a strong industrial recovery in the near term, normalization of the virus-disrupted travel sector, a shift in fiscal spending towards infrastructure, and increased investment spending associated with the continued moderation in offshoring manufacturing capacity. We are overweight the industrials sector in our client portfolios and review the case for this investment below.
The recent collapse in the industrials sector (-25% underperformance vs. the U.S. equity market over the past three years and -10% this year) has been large even by the standards of a recessionary environment (Display 1).1 Industrials have underperformed on average by -11% in a typical recession over the past 50 years. This year the virus hit the travel sector (including aerospace and airlines), which underperformed particularly strongly, whereas the broader U.S. equity market has been lifted by the tech sector which actually benefited from COVID-19. As a result of this virus-aggravated recession, the recent bout of underperformance is on par with the worst on record (-25% from 1994-2000). Historically, as a recession ended, the industrials sector started to outperform and usually beat the market by +8% in each of the following one and two years.
A cyclical growth recovery is already underway, as signaled by numerous activity indicators and surveys. Given the atypical nature of this recession and the potential for lasting structural shifts, the natural question is how such
95
19951975 1980 1985 1990 2000 2005 2010 2015 2020 2025
100
105
110
115
125
130
135
140
145Index
120
U.S. Industrials vs. S&P500 Relative Price Index
-17%
-25%
-25%-20%
Global Multi-Asset Viewpoint
U.S. Industrials Poised to Outperform
SERGEI PARMENOVPortfolio ManagerGlobal Multi-Asset TeamManaging Director
CYRIL MOULLÉ-BERTEAUXPortfolio ManagerHead of Global Multi-Asset TeamManaging Director
AUTHORS
SOLUTIONS & MULTI-ASSET | GLOBAL MULTI-ASSET TEAM | MACRO INSIGHT | AUGUST 2020
Display 1: U.S. Industrials Underperformance vs. U.S. Equities on Par With Worst on Record
Source: MSCI, Factset, Bloomberg. Data as of September 18, 2020.The index performance is provided for illustrative purposes only and is not meant to depict the performance of a specific investment. Past performance is no guarantee of future results.See Disclosure section for index definitions.

2
MACRO INSIGHT
MORGAN STANLEY INVESTMENT MANAGEMENT | SOLUTIONS & MULTI-ASSET
shifts could affect the industrials sector. The aerospace and airlines companies represent nearly 20% of the sector’s market capitalization and have been particularly hard hit by restrictions on travel. A normalization not only of domestic air travel, which is already occurring in many large economies, but also of international flights, would be required for the sector’s earnings to normalize. As we mentioned in our last monthly letter, such a scenario is likely on a 12-month horizon as a combination of effective immunity in some countries and availability of a vaccine is likely to bring the virus under control. However, the industrials sector’s recovery does not depend solely on the recovery of aerospace. Many of its other sub-groups have turned out to be net beneficiaries of the nascent recovery. While spending on services was curtailed due to social distancing, despite largely resilient incomes cushioned by generous fiscal transfer payments, spending on the goods sector of the economy boomed. In July, nominal consumer spending on goods was 6% higher than the end of 2019 level, while spending on services was less than 1% higher. This is the opposite of what has tended to happen in prior recessions, during which services spending typically remains more resilient. The housing sector, which drives numerous related goods consumption items, has boomed, fueled by lower rates and urban flight. New home sales are running at a pace of nearly 800,000 units (annualized), a new cycle high.2 Anecdotal evidence abounds of low goods inventories, especially in the automotive and housing industries. Industrial production, a reliable indicator of the industrials sector’s earnings, has made only a partial recovery, retracing 50% of the decline since December 2019. With buoyant goods demand and low inventories, we expect a pronounced cyclical industrial recovery to continue to unfold.
A similar dynamic appears to be playing out in the commodities sector, where severe production cuts (whether because of the virus, prior low prices, or supply management agreements) have led to low inventories (e.g. copper and other metals) and balanced or deficit markets (oil, iron ore, copper). Given the underinvestment in many commodity segments over the past five to six years, especially in metals and mining, we expect investment activity to rebound, benefiting the mining industry supply chain within the industrials sector. Business-cycle moves aside, since the 1970s, the industrials sector has had longer periods of out- and underperformance.3 These cycles have tended to last between 8 and 14 years, or 11 on average. Two upcycles (1975-86 and 2000-08) lasted 10 and 8 years, respectively, and resulted in +43% average outperformance relative to the S&P 500 Index. Each was then followed by two downcycles (1986-2000 and 2008-20), which lasted 8 and 12 years, respectively, and resulted in similar underperformance of -25% each time (assuming we are right that industrials will begin to outperform this year). In addition to an attractive near-term cyclical outlook, we expect the sector’s outperformance to last beyond the near term cyclical recovery, as several secular drivers are likely to become lasting tailwinds.
We anticipate the industrials sector will be a major beneficiary of two potentially significant secular trends: fiscal spending on infrastructure and reshoring. Social and political attitudes toward fiscal spending appear to have undergone a radical transformation in recent years. In the current environment of low inflation, low bond yields and stable currencies, policymakers in many major economies, and in the U.S. most clearly, appear to have come to view fiscal spending as a major policy tool both during downturns to cushion the economy and during expansions in order to achieve social and political goals. In contrast to the past expansion, which saw fiscal consolidations in the U.S. and in Europe dampen growth for a number of years, we expect continued fiscal stimulus during the coming expansion. However, as the economy
and the labor market recover, we believe the emphasis of fiscal spending will shift from income support and assistance for businesses to investment. From 6.5% of GDP in the early 1960s, public sector investment in the U.S. fell to 3.3% of GDP in 2018, the lowest share in history (Display 2). The average age of U.S. infrastructure continues to reach new records. For example, public streets and highways are on average 29 years old, compared to 17 years in the 1950’s and 1960’s. Hypothetically, a $1 trillion fiscal infrastructure spending program over five years would lift total fixed investment by 27%. Assuming the infrastructure-exposed machinery manufacturers within industrials captures ~11% of this spending, this would represent an average 1-2% revenue uplift and 3-5% earnings uplift. The precise focus of any future fiscal stimulus is difficult to ascertain at this stage as plans tend to be vague. However, whether it is focused on green energy or traditional infrastructure, the industrials sector overall would be a prime beneficiary (though the impact on its subgroups such as for instance electrical equipment versus construction machinery may vary).
Display 2: Public Sector Investment in the U.S. To Rise from Historical Low
3.5
4.0
4.5
5.0
5.5
6.0
6.5
7.0Percent
1960 1970 19901980 2000 2010 2020
Public Sector Fixed Investment as a Percentage of GDP, 4QMA
Source: Haver, FRB, BEA. Data as of September 18, 2020.
Just like public infrastructure, domestic equipment investment has also been in a relative decline over the past few decades. Excluding technology, it peaked at near 6.5% of GDP in 1979 and has fallen to around 4.5% of GDP over the past decade. The prospect of reshoring of manufacturing supply chains appears more real than ever, as concerns about security of supply remain following disruptions during the early stages of the pandemic and as a result of unresolved trade tensions between the U.S. and China. There is a high chance that tax and regulatory incentives to accelerate reshoring will be implemented over the coming years. At present, many surveys of corporate decision-makers suggest greater willingness and planning around repatriation or relocation of production to bring it closer to the target market (as the case may be for foreign exporters to the U.S.). For example, in a recent survey of senior U.S. corporate executives, 77% of U.S. companies indicated that they have already repatriated, are in the process of repatriating, or are planning to repatriate some of their manufacturing capacity, with the U.S. being the top destination.4 We estimate that approximately $2.5 trillion of production capacity repatriated would result in close to $1 trillion additional investment over five years, with the automation and construction segments of the industrials sector poised to benefit the most.
3SOLUTIONS & MULTI-ASSET | MORGAN STANLEY INVESTMENT MANAGEMENT
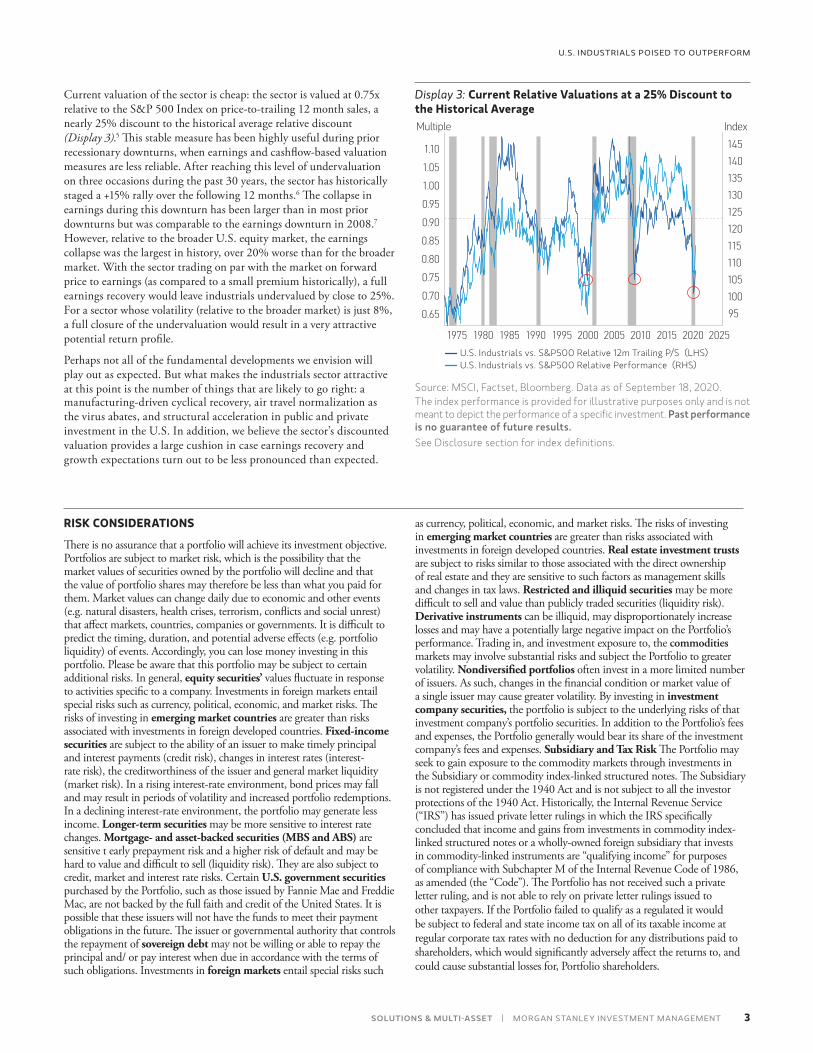
Current valuation of the sector is cheap: the sector is valued at 0.75x relative to the S&P 500 Index on price-to-trailing 12 month sales, a nearly 25% discount to the historical average relative discount (Display 3).5 This stable measure has been highly useful during prior recessionary downturns, when earnings and cashflow-based valuation measures are less reliable. After reaching this level of undervaluation on three occasions during the past 30 years, the sector has historically staged a +15% rally over the following 12 months.6 The collapse in earnings during this downturn has been larger than in most prior downturns but was comparable to the earnings downturn in 2008.7 However, relative to the broader U.S. equity market, the earnings collapse was the largest in history, over 20% worse than for the broader market. With the sector trading on par with the market on forward price to earnings (as compared to a small premium historically), a full earnings recovery would leave industrials undervalued by close to 25%. For a sector whose volatility (relative to the broader market) is just 8%, a full closure of the undervaluation would result in a very attractive potential return profile.
Perhaps not all of the fundamental developments we envision will play out as expected. But what makes the industrials sector attractive at this point is the number of things that are likely to go right: a manufacturing-driven cyclical recovery, air travel normalization as the virus abates, and structural acceleration in public and private investment in the U.S. In addition, we believe the sector’s discounted valuation provides a large cushion in case earnings recovery and growth expectations turn out to be less pronounced than expected.
Display 3: Current Relative Valuations at a 25% Discount to the Historical Average
1995 2000 2005 2010 2015 2020 2025
120
125
130
135
140
145
115
110
105
100
95
19901975 1980 1985
1.10
Multiple Index
0.95
0.90
0.85
0.80
0.75
0.70
0.65
1.00
1.05
U.S. Industrials vs. S&P500 Relative 12m Trailing P/S (LHS)U.S. Industrials vs. S&P500 Relative Performance (RHS)
Source: MSCI, Factset, Bloomberg. Data as of September 18, 2020.The index performance is provided for illustrative purposes only and is not meant to depict the performance of a specific investment. Past performance is no guarantee of future results. See Disclosure section for index definitions.
U.S. INDUSTRIALS POISED TO OUTPERFORM
RISK CONSIDERATIONS
There is no assurance that a portfolio will achieve its investment objective. Portfolios are subject to market risk, which is the possibility that the market values of securities owned by the portfolio will decline and that the value of portfolio shares may therefore be less than what you paid for them. Market values can change daily due to economic and other events (e.g. natural disasters, health crises, terrorism, conflicts and social unrest) that affect markets, countries, companies or governments. It is difficult to predict the timing, duration, and potential adverse effects (e.g. portfolio liquidity) of events. Accordingly, you can lose money investing in this portfolio. Please be aware that this portfolio may be subject to certain additional risks. In general, equity securities’ values fluctuate in response to activities specific to a company. Investments in foreign markets entail special risks such as currency, political, economic, and market risks. The risks of investing in emerging market countries are greater than risks associated with investments in foreign developed countries. Fixed-income securities are subject to the ability of an issuer to make timely principal and interest payments (credit risk), changes in interest rates (interest-rate risk), the creditworthiness of the issuer and general market liquidity (market risk). In a rising interest-rate environment, bond prices may fall and may result in periods of volatility and increased portfolio redemptions. In a declining interest-rate environment, the portfolio may generate less income. Longer-term securities may be more sensitive to interest rate changes. Mortgage- and asset-backed securities (MBS and ABS) are sensitive t early prepayment risk and a higher risk of default and may be hard to value and difficult to sell (liquidity risk). They are also subject to credit, market and interest rate risks. Certain U.S. government securities purchased by the Portfolio, such as those issued by Fannie Mae and Freddie Mac, are not backed by the full faith and credit of the United States. It is possible that these issuers will not have the funds to meet their payment obligations in the future. The issuer or governmental authority that controls the repayment of sovereign debt may not be willing or able to repay the principal and/ or pay interest when due in accordance with the terms of such obligations. Investments in foreign markets entail special risks such
as currency, political, economic, and market risks. The risks of investing in emerging market countries are greater than risks associated with investments in foreign developed countries. Real estate investment trusts are subject to risks similar to those associated with the direct ownership of real estate and they are sensitive to such factors as management skills and changes in tax laws. Restricted and illiquid securities may be more difficult to sell and value than publicly traded securities (liquidity risk). Derivative instruments can be illiquid, may disproportionately increase losses and may have a potentially large negative impact on the Portfolio’s performance. Trading in, and investment exposure to, the commodities markets may involve substantial risks and subject the Portfolio to greater volatility. Nondiversified portfolios often invest in a more limited number of issuers. As such, changes in the financial condition or market value of a single issuer may cause greater volatility. By investing in investment company securities, the portfolio is subject to the underlying risks of that investment company’s portfolio securities. In addition to the Portfolio’s fees and expenses, the Portfolio generally would bear its share of the investment company’s fees and expenses. Subsidiary and Tax Risk The Portfolio may seek to gain exposure to the commodity markets through investments in the Subsidiary or commodity index-linked structured notes. The Subsidiary is not registered under the 1940 Act and is not subject to all the investor protections of the 1940 Act. Historically, the Internal Revenue Service (“IRS”) has issued private letter rulings in which the IRS specifically concluded that income and gains from investments in commodity index-linked structured notes or a wholly-owned foreign subsidiary that invests in commodity-linked instruments are “qualifying income” for purposes of compliance with Subchapter M of the Internal Revenue Code of 1986, as amended (the “Code”). The Portfolio has not received such a private letter ruling, and is not able to rely on private letter rulings issued to other taxpayers. If the Portfolio failed to qualify as a regulated it would be subject to federal and state income tax on all of its taxable income at regular corporate tax rates with no deduction for any distributions paid to shareholders, which would significantly adversely affect the returns to, and could cause substantial losses for, Portfolio shareholders.

4
MACRO INSIGHT
MORGAN STANLEY INVESTMENT MANAGEMENT | SOLUTIONS & MULTI-ASSET
DEFINITIONSThe Russell 1000® Growth Index measures the performance of the large-cap growth segment of the U.S. equity universe. It includes those Russell 1000® Index companies with higher price-to-book ratios and higher forecasted growth values. The Russell 1000® Index is an index of approximately 1,000 of the largest U.S. companies based on a combination of market capitalization and current index membership. The Russell 1000® Value Index is an index that measures the performance of those Russell 1000 companies with lower price-to-book ratios and lower forecasted growth values. The S&P 500 Total Return Index is an index that consists of 500 stocks chosen for market size, liquidity and industry group representation. The S&P Index is a market value weighted index with each stock’s weight proportionate to its market value. The S&P Index is one of the most widely used benchmarks of U.S. equity performance. The performance of the S&P Index does not account for any management fees, incentive compensation, commissions or other expenses that would be incurred pursuing such strategy. Total return provides investors with a price-plus-gross cash dividend return. Gross cash dividends are applied on the ex-date of the dividend.The S&P GSCI® is a composite index of commodity sector returns representing an unleveraged, long-only investment in commodity futures that is broadly diversified across the spectrum of commodities. The returns are calculated on a fully collateralized basis with full reinvestment. The combination of these attributes provides investors with a representative and realistic picture of realizable returns attainable in the commodities markets. Individual components qualify for inclusion in the S&P GSCI® on the basis of liquidity and are weighted by their respective world production quantities. The Sharpe ratio was developed by Nobel laureate William F. Sharpe and is used to help investors understand the return of an investment compared to its risk. The ratio is the average return earned in excess of the risk-free rate per unit of volatility or total risk. Volatility is a measure of the price fluctuations of an asset or portfolio. The S&P U.S. Treasury Bond Current 10-Year Index is a one-security index comprising the most recently issued 10-year U.S. Treasury note or bond. The MSCI USA Energy Index is designed to capture the large and mid cap segments of the US equity universe. All securities in the index are classified in the Energy sector as per the Global Industry Classification Standard (GICS®). The MSCI USA Materials Index is designed to capture the large and mid cap segments of the US equity universe. All securities in the index are classified in the Materials sector as per the Global Industry Classification Standard (GICS®). The S&P GSCI Gold Index, a sub-index of the S&P GSCI, provides investors with a reliable and publicly available benchmark tracking the COMEX gold future. Treasury Inflation-Protected Securities, or TIPS, provide protection against inflation. The principal of a TIPS increases with inflation and decreases with deflation, as measured by the Consumer Price Index.
IMPORTANT DISCLOSURES The views and opinions are those of the author as of the date of publication and are subject to change at any time due to market or economic conditions and may not necessarily come to pass. Furthermore, the views will not be updated or otherwise revised to reflect information that subsequently becomes available or circumstances existing, or changes occurring, after the date of publication. The views expressed do not reflect the opinions of all portfolio managers at Morgan Stanley Investment Management (MSIM) or the views of the firm as a whole, and may not be reflected in all the strategies and products that the Firm offers.Forecasts and/or estimates provided herein are subject to change and may not actually come to pass. Information regarding expected market returns and market outlooks is based on the research, analysis and opinions of the authors. These conclusions are speculative in nature, may not come to pass and are not intended to predict the future performance of any specific Morgan Stanley Investment Management product.Certain information herein is based on data obtained from third party sources believed to be reliable. However, we have not verified this information, and we make no representations whatsoever as to its accuracy or completeness.This material is a general communication, which is not impartial and all information provided has been prepared solely for information purposes and does not constitute an offer or a recommendation to buy or sell any particular security or to adopt any specific investment strategy. The information herein has not been based on a consideration of any individual investor circumstances and is not investment advice, nor should it be construed in any way as tax, accounting, legal or regulatory advice. To that end, investors should seek independent legal and financial advice, including advice as to tax consequences, before making any investment decision.Charts and graphs provided herein are for illustrative purposes only.Past performance is no guarantee of future results.This communication is not a product of Morgan Stanley’s Research Department and should not be regarded as a research recommendation. The information contained herein has not been prepared in accordance with legal requirements designed to promote the independence of investment research and is not subject to any prohibition on dealing ahead of the dissemination of investment research.The indexes are unmanaged and do not include any expenses, fees or sales charges. It is not possible to invest directly in an index. Any index referred to herein is the intellectual property (including registered trademarks) of the applicable licensor. Any product based on an index is in no way sponsored, endorsed, sold or promoted by the applicable licensor and it shall not have any liability with respect thereto. There is no guarantee that any investment strategy will work under all market conditions, and each investor should evaluate their ability to invest for the long-term, especially during periods of downturn in the market. Prior to investing, investors should carefully review the strategy’s / product’s relevant offering document. There are important differences in how the strategy is carried out in each of the investment vehicles.
1 MSIM Global Multi-Asset Team Analysis; Factset; S&P 500 Industrials Index vs. S&P 500 Index.
2 MSIM Global Multi-Asset team estimates; using a 3-month moving average.3 MSIM Global Multi-Asset team estimates; using a 6-month moving average.4 MSIM Global Multi-Asset team; UBS Research.
5 MSIM Global Multi-Asset Team Analysis; Factset; S&P 500 Industrials Index vs. S&P 500 Index.
6 MSIM Global Multi-Asset Team Analysis; data from 1990 to 2020.7 MSIM Global Multi-Asset team estimates; using 12 month forward earnings.
FOOTNOTES
DISTRIBUTIONThis communication is only intended for and will be only distributed to persons resident in jurisdictions where such distribution or availability would not be contrary to local laws or regulations.United Kingdom: Morgan Stanley Investment Management Limited is authorised and regulated by the Financial Conduct Authority. Registered in England. Registered No. 1981121. Registered Office: 25 Cabot Square, Canary Wharf, London E14 4QA, authorised and regulated by the Financial Conduct Authority. Dubai: Morgan Stanley Investment Management Limited (Representative Office, Unit Precinct 3-7th Floor-Unit 701 and 702, Level 7, Gate Precinct Building 3, Dubai International Financial Centre, Dubai, 506501, United Arab Emirates. Telephone: +97 (0)14 709 7158). Germany: Morgan Stanley Investment Management Limited Niederlassung Deutschland, Grosse Gallusstrasse 18, 60312 Frankfurt am Main, Germany (Gattung: Zweigniederlassung (FDI) gem. § 53b KWG). Ireland: Morgan Stanley Investment Management (Ireland) Limited. Registered Office: The Observatory, 7-11 Sir John Rogerson’s, Quay, Dublin 2, Ireland. Registered in Ireland under company number 616662. Authorised and regulated by Central Bank of Ireland. Italy: Morgan Stanley Investment Management Limited, Milan Branch (Sede Secondaria di Milano) is a branch of Morgan Stanley Investment Management Limited, a company registered in the UK, authorised and regulated by the Financial Conduct Authority (FCA), and whose registered office is at 25 Cabot Square, Canary Wharf, London, E14 4QA. Morgan Stanley Investment Management Limited Milan Branch (Sede Secondaria di Milano) with seat in Palazzo Serbelloni Corso Venezia, 16 20121 Milano, Italy, is registered in Italy with company number and VAT number 08829360968. The Netherlands: Morgan Stanley Investment Management, Rembrandt Tower, 11th Floor Amstelplein 1 1096HA, Netherlands. Telephone: 31 2-0462-1300. Morgan Stanley Investment Management is a branch office of Morgan Stanley Investment Management Limited. Morgan Stanley Investment Management Limited is authorised and regulated by the Financial Conduct Authority in the United Kingdom. Switzerland: Morgan Stanley & Co. International plc, London, Zurich Branch Authorised and regulated by the Eidgenössische Finanzmarktaufsicht (“FINMA”). Registered with the Register of Commerce Zurich CHE-115.415.770. Registered Office: Beethovenstrasse 33, 8002 Zurich, Switzerland, Telephone +41 (0) 44 588 1000. Facsimile Fax: +41(0) 44 588 1074. Hong Kong: This document has been issued by Morgan Stanley Asia Limited for use in Hong Kong and shall only be made available to “professional investors” as defined under the Securities and Futures Ordinance of Hong Kong (Cap 571). The contents of this document have not been reviewed nor approved by any regulatory authority including the Securities and Futures Commission in Hong Kong. Accordingly, save where an exemption is available under the relevant law, this document shall not be issued, circulated, distributed, directed at, or made available to, the public in Hong Kong. Singapore: This document should not be considered to be the subject of an invitation for subscription or purchase, whether directly or indirectly, to the public or any member of the public in Singapore other than (i) to an institutional investor under section 304 of the Securities and Futures Act, Chapter 289 of Singapore (“SFA”); (ii) to a “relevant person” (which includes an accredited investor) pursuant to section 305 of the SFA, and such distribution is in accordance with the conditions specified in section 305 of the SFA; or (iii) otherwise pursuant to, and in accordance with the conditions of, any other applicable provision of the SFA. This publication has not been reviewed by the Monetary Authority of Singapore. Australia: This publication is disseminated in Australia by Morgan Stanley Investment Management (Australia) Pty Limited ACN: 122040037, AFSL No. 314182, which accept responsibility for its contents. This publication, and any access to it, is intended only for “wholesale clients” within the meaning of the Australian Corporations Act. Japan: For professional investors, this document is circulated or distributed for informational purposes only. For those who are not professional investors, this document is provided in relation to Morgan Stanley Investment Management (Japan) Co., Ltd. (“MSIMJ”)’s business with respect to discretionary investment management agreements (“IMA”) and investment advisory agreements (“IAA”). This is not for the purpose of a recommendation or solicitation of transactions or offers any particular financial instruments. Under an IMA, with respect to management of assets of a client, the client prescribes basic management policies in advance and commissions MSIMJ to make all investment decisions based on an analysis of
the value, etc. of the securities, and MSIMJ accepts such commission. The client shall delegate to MSIMJ the authorities necessary for making investment. MSIMJ exercises the delegated authorities based on investment decisions of MSIMJ, and the client shall not make individual instructions. All investment profits and losses belong to the clients; principal is not guaranteed. Please consider the investment objectives and nature of risks before investing. As an investment advisory fee for an IAA or an IMA, the amount of assets subject to the contract multiplied by a certain rate (the upper limit is 2.20% per annum (including tax)) shall be incurred in proportion to the contract period. For some strategies, a contingency fee may be incurred in addition to the fee mentioned above. Indirect charges also may be incurred, such as brokerage commissions for incorporated securities. Since these charges and expenses are different depending on a contract and other factors, MSIMJ cannot present the rates, upper limits, etc. in advance. All clients should read the Documents Provided Prior to the Conclusion of a Contract carefully before executing an agreement. This document is disseminated in Japan by MSIMJ, Registered No. 410 (Director of Kanto Local Finance Bureau (Financial Instruments Firms)), Membership: the Japan Securities Dealers Association, The Investment Trusts Association, Japan, the Japan Investment Advisers Association and the Type II Financial Instruments Firms Association.U.S.: A separately managed account may not be appropriate for all investors. Separate accounts managed according to the Strategy include a number of securities and will not necessarily track the performance of any index. Please consider the investment objectives, risks and fees of the Strategy carefully before investing. A minimum asset level is required. For important information about the investment manager, please refer to Form ADV Part 2.
Please consider the investment objectives, risks, charges and expenses of the funds carefully before investing. The prospectuses contain this and other information about the funds. To obtain a prospectus please download one at morganstanley.com/im or call 1-800-548-7786. Please read the prospectus carefully before investing.Morgan Stanley Distribution, Inc. serves as the distributor for Morgan Stanley funds.
NOT FDIC INSURED | OFFER NO BANK GUARANTEE | MAY LOSE VALUE | NOT INSURED BY ANY FEDERAL GOVERNMENT AGENCY | NOT A DEPOSITIMPORTANT INFORMATIONEMEA: This marketing communication has been issued by Morgan Stanley Investment Management Ireland Limited (“MSIM Ireland”). Authorised and regulated by the Financial Conduct Authority. Registered in England No. 1981121. Registered Office: 25 Cabot Square, Canary Wharf, London E14 4QA.The information contained in this communication is not a research recommendation or ‘investment research’ and is classified as a ‘Marketing Communication’ in accordance with the applicable European or Swiss regulation. This means that this marketing communication (a) has not been prepared in accordance with legal requirements designed to promote the independence of investment research (b) is not subject to any prohibition on dealing ahead of the dissemination of investment research.MSIM has not authorised financial intermediaries to use and to distribute this document, unless such use and distribution is made in accordance with applicable law and regulation. Additionally, financial intermediaries are required to satisfy themselves that the information in this document is appropriate for any person to whom they provide this document in view of that person’s circumstances and purpose. MSIM shall not be liable for, and accepts no liability for, the use or misuse of this document by any such financial intermediary.This document may be translated into other languages. Where such a translation is made this English version remains definitive. If there are any discrepancies between the English version and any version of this document in another language, the English version shall prevail.The whole or any part of this work may not be reproduced, copied or transmitted or any of its contents disclosed to third parties without MSIM’s express written consent.
© 2020 Morgan Stanley. All rights reserved. CRC 3259871 Exp. 09/20/2021 9905340_CH_0920
Explore our site at www.morganstanley.com/im