Embed Size (px)
Citation preview
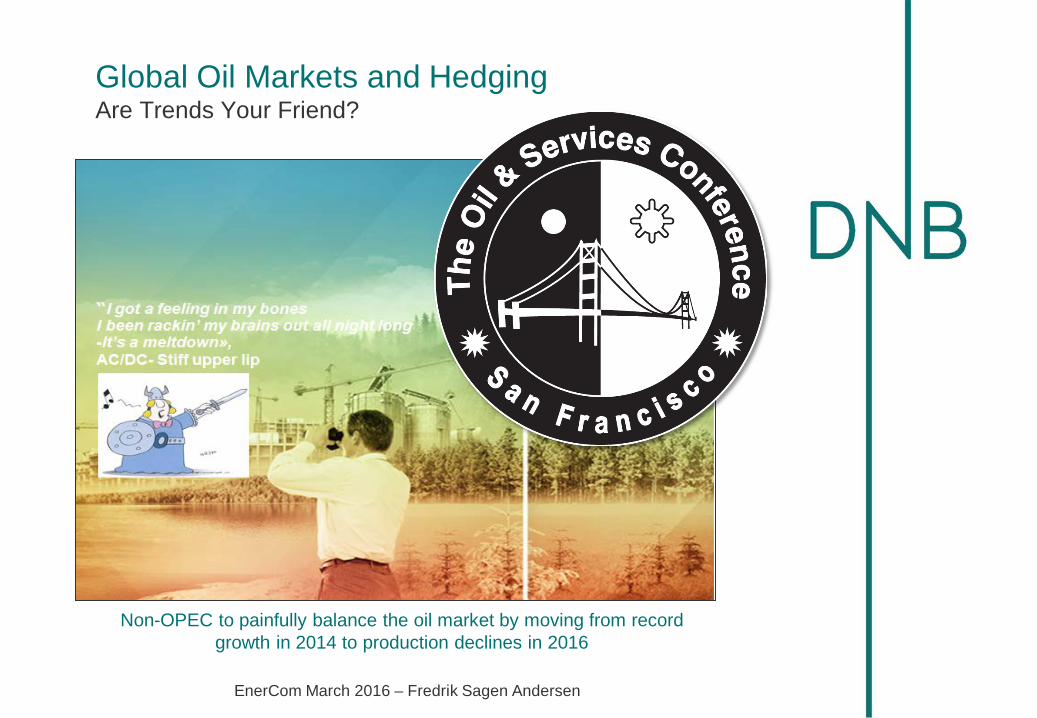
Global Oil Markets and Hedging Are Trends Your Friend?
EnerCom March 2016 – Fredrik Sagen Andersen
Non-OPEC to painfully balance the oil market by moving from record growth in 2014 to production declines in 2016

2
3
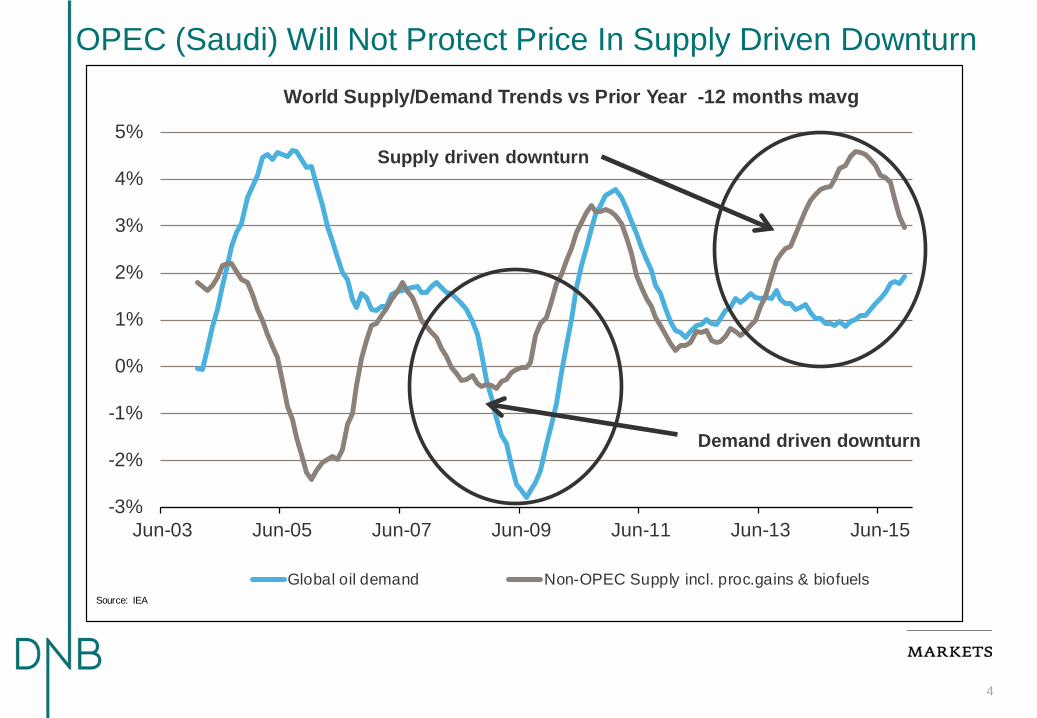
OPEC (Saudi) Will Not Protect Price In Supply Driven Downturn
4
-3%
-2%
-1%
0%
1%
2%
3%
4%
5%
Jun-03 Jun-05 Jun-07 Jun-09 Jun-11 Jun-13 Jun-15
World Supply/Demand Trends vs Prior Year -12 months mavg
Global oil demand Non-OPEC Supply incl. proc.gains & biofuelsSource: IEA
Supply driven downturn
Demand driven downturn
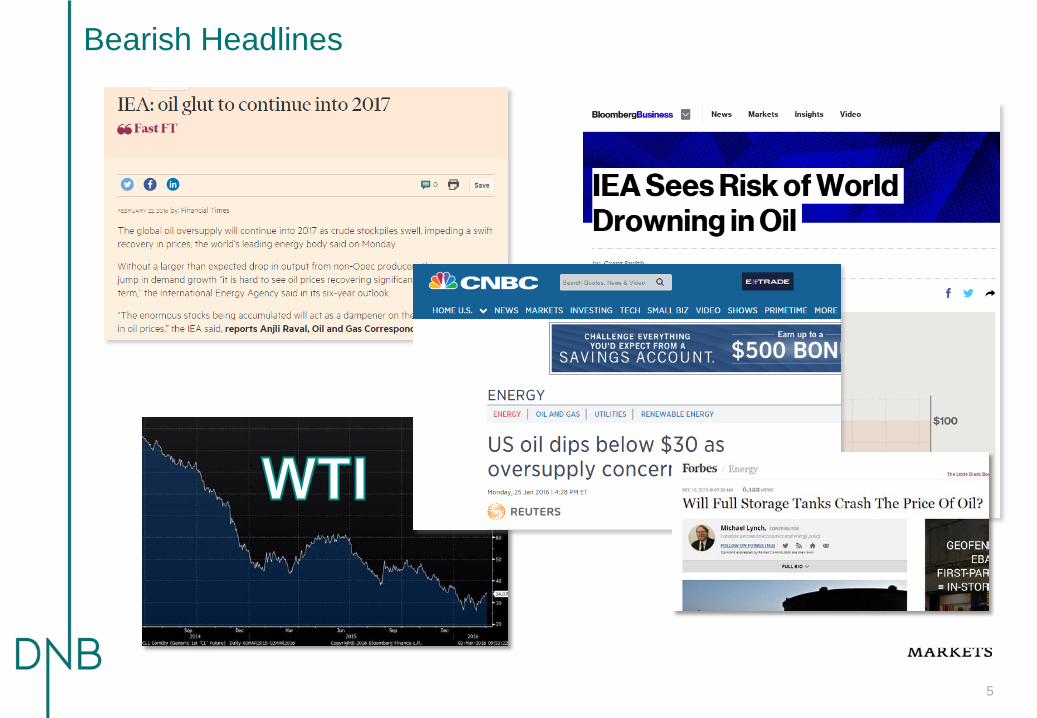
Bearish Headlines
5
6
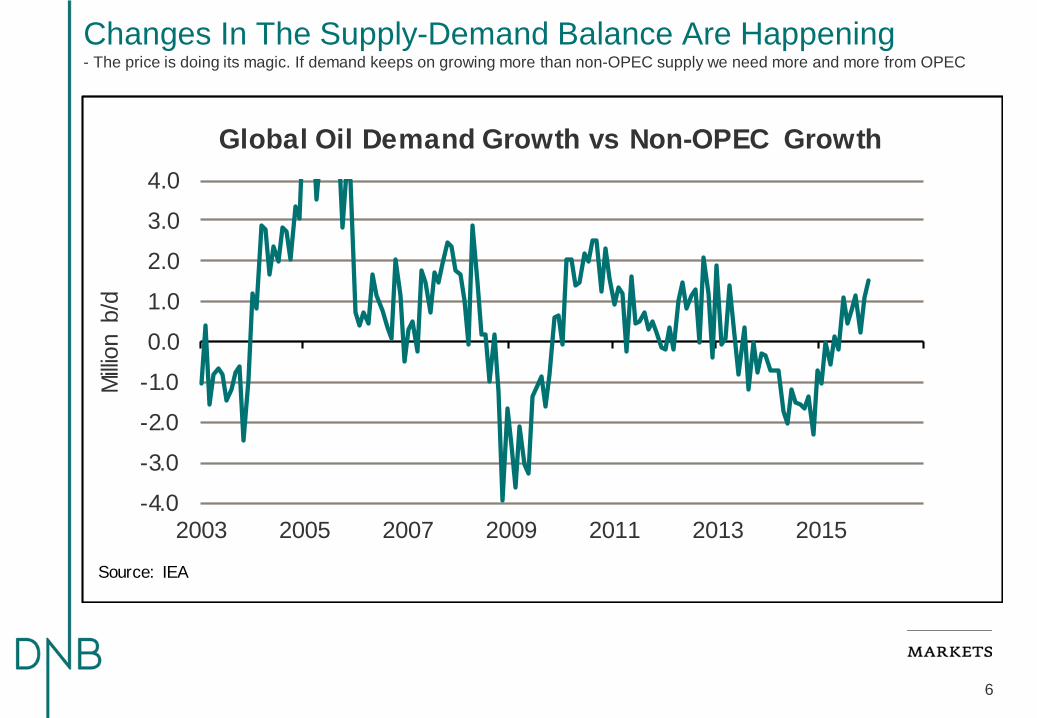
Changes In The Supply-Demand Balance Are Happening - The price is doing its magic. If demand keeps on growing more than non-OPEC supply we need more and more from OPEC
-4.0
-3.0
-2.0
-1.0
0.0
1.0
2.0
3.0
4.0
2003 2005 2007 2009 2011 2013 2015
Milli
on b
/dGlobal Oil Demand Growth vs Non-OPEC Growth
Source: IEA
7
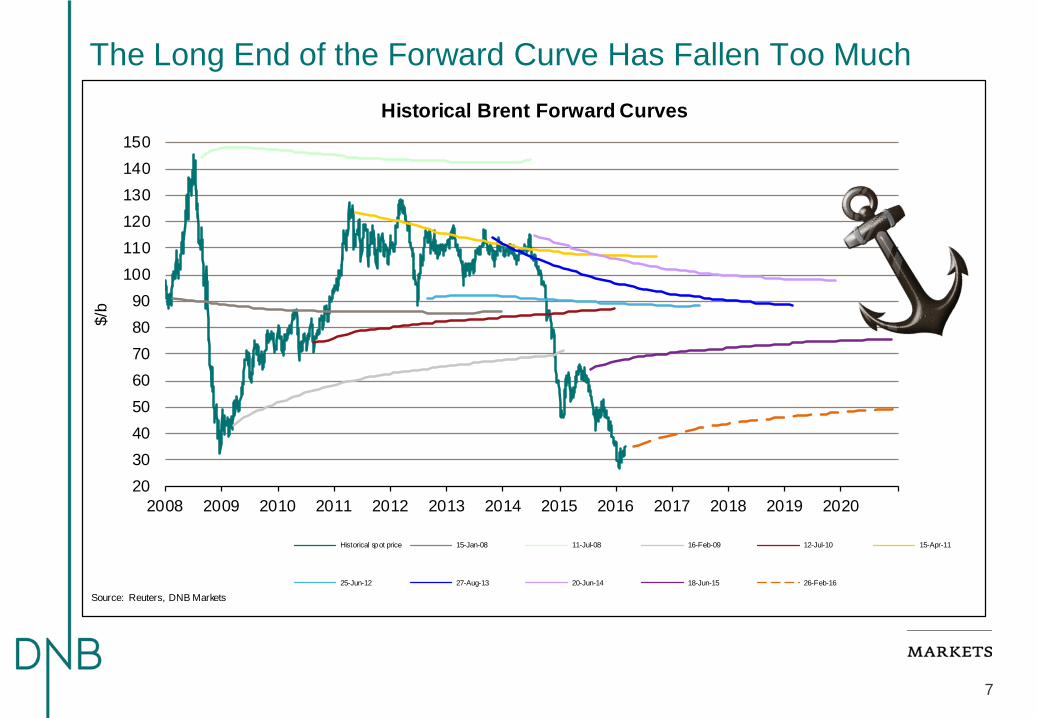
The Long End of the Forward Curve Has Fallen Too Much
2030405060708090
100110120130140150
2008 2009 2010 2011 2012 2013 2014 2015 2016 2017 2018 2019 2020
$/b
Historical Brent Forward Curves
Historical spot price 15-Jan-08 11-Jul-08 16-Feb-09 12-Jul-10 15-Apr-11
25-Jun-12 27-Aug-13 20-Jun-14 18-Jun-15 26-Feb-16
Source: Reuters, DNB Markets

8
The Headline Oversupply Not Visible In Time Spreads - The graph below suggest that the last drop in oil prices is sentiment driven and not fundamentally driven
20
30
40
50
60
70
80
90
100
110
120
130
Jan/2009 Jan/2010 Jan/2011 Jan/2012 Jan/2013 Jan/2014 Jan/2015 Jan/2016
$/b
Modelled Brent Price Based On Time Spread (1 vs 3)(Based on daily correlation since 2009)
Modeled Brent Price, 20 days rolling avg Real Brent Price
-5
-4
-3
-2
-1
0
1
2
3
4
5
25
45
65
85
105
125
145
165
Jan-2007 Jan-2009 Jan-2011 Jan-2013 Jan-2015
$/b
time
spre
ad
$/b
flat p
rice
Brent Price vs Structure of FWD-Curve(Brent 1-3 as leading indicator for Flat Price)
Real Brent Price Brent Fwd Structure

9
Short Sellers Have Been In Command the Last Year
20
25
30
35
40
45
50
55
60
65
70
-350
-300
-250
-200
-150
-100
-50
0
Jan-15 Jul-15 Jan-16
$/b
Mill
ion
barre
ls
Non-Commercial Short Positions vs WTI
Source: CFTC
10
-2.0
-1.5
-1.0
-0.5
0.0
0.5
1.0
1.5
2.0
2.5
3.0
1Q2012 1Q2013 1Q2014 1Q2015 1Q2016
MBD
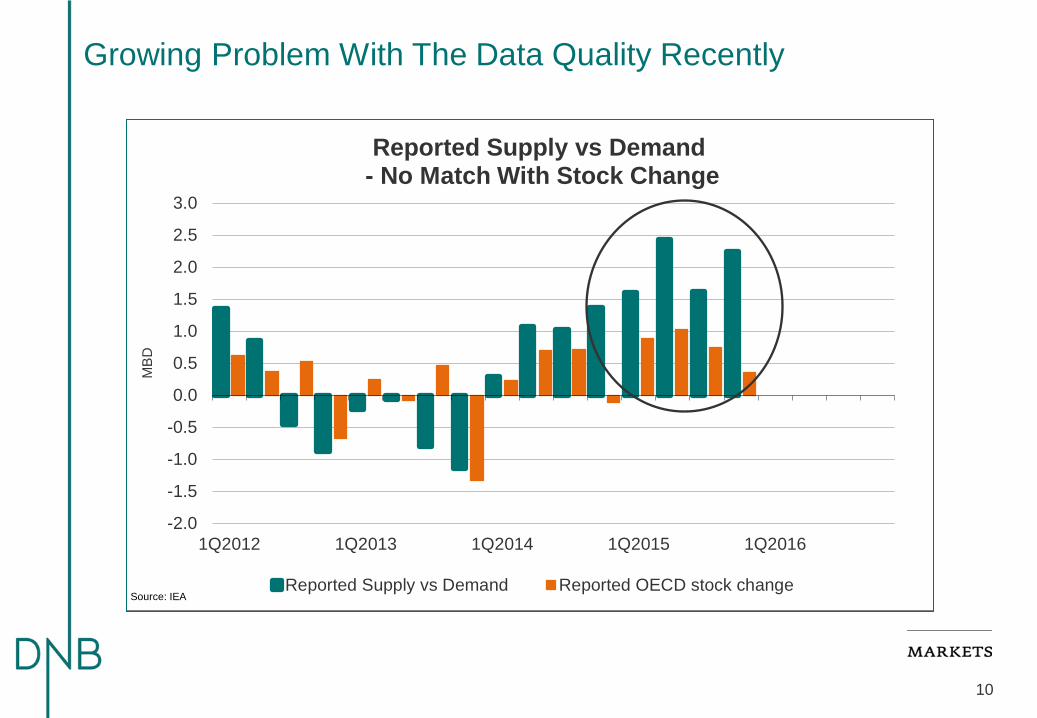
Reported Supply vs Demand- No Match With Stock Change
Reported Supply vs Demand Reported OECD stock changeSource: IEA
Growing Problem With The Data Quality Recently
11
2,5002,5502,6002,6502,7002,7502,8002,8502,9002,9503,000
Jan Feb Mar Apr May Jun Jul Aug Sep Oct Nov Dec
Milli
on b
arre
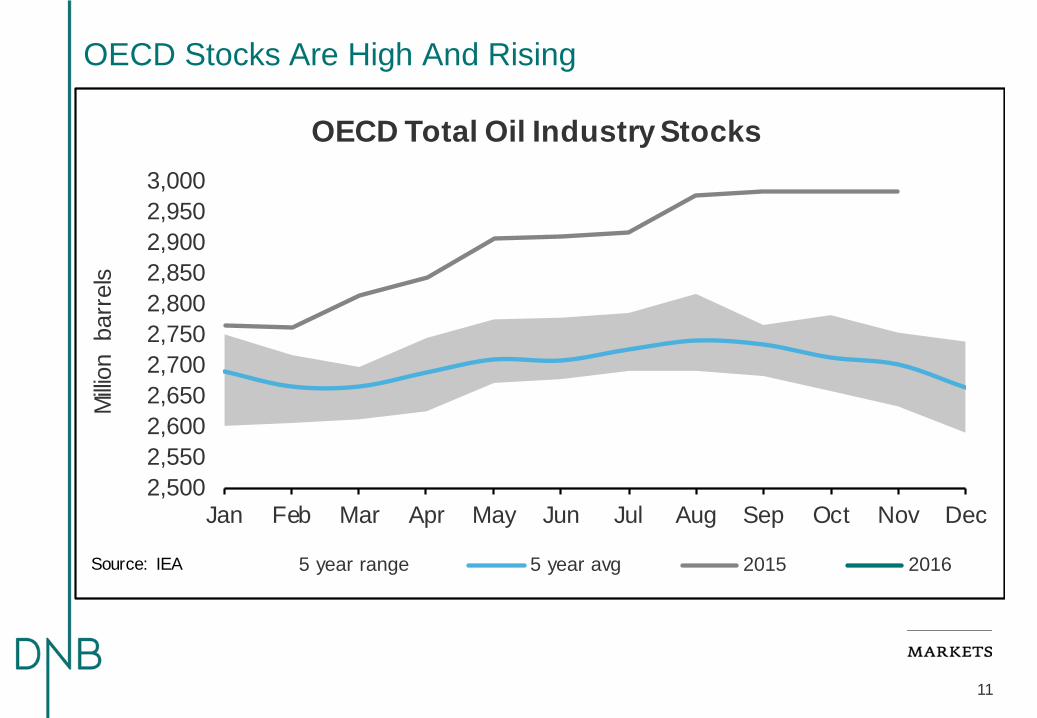
lsOECD Total Oil Industry Stocks
5 year range 5 year avg 2015 2016Source: IEA
OECD Stocks Are High And Rising
12
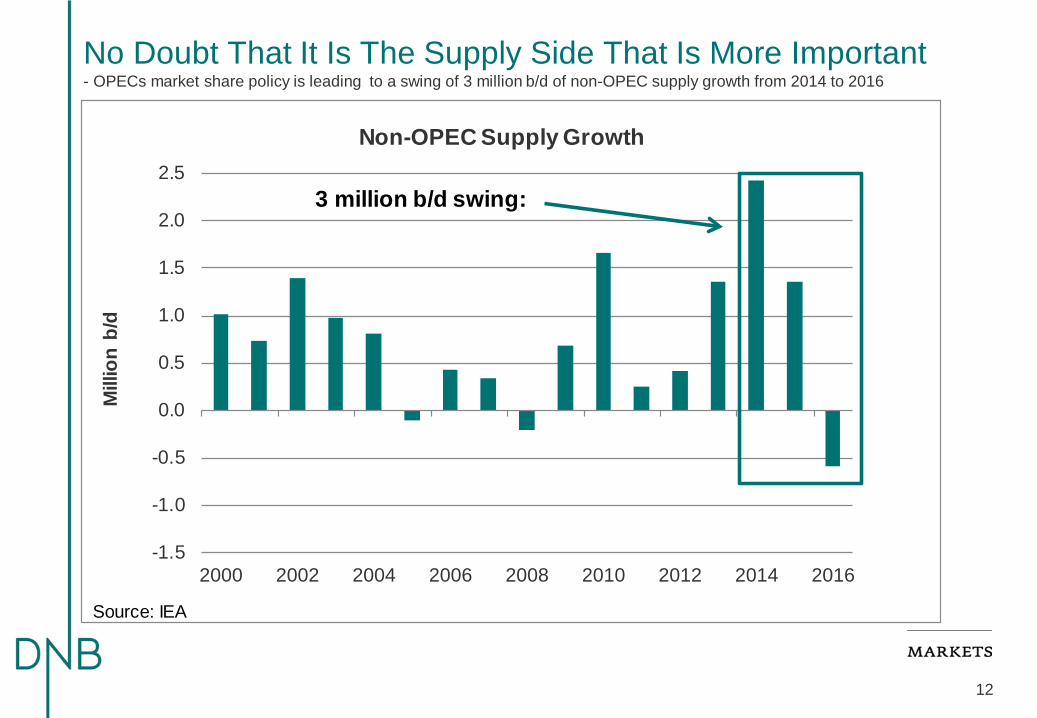
-1.5
-1.0
-0.5
0.0
0.5
1.0
1.5
2.0
2.5
2000 2002 2004 2006 2008 2010 2012 2014 2016
Mill
ion
b/d
Non-OPEC Supply Growth
Source: IEA
3 million b/d swing:
No Doubt That It Is The Supply Side That Is More Important - OPECs market share policy is leading to a swing of 3 million b/d of non-OPEC supply growth from 2014 to 2016
13
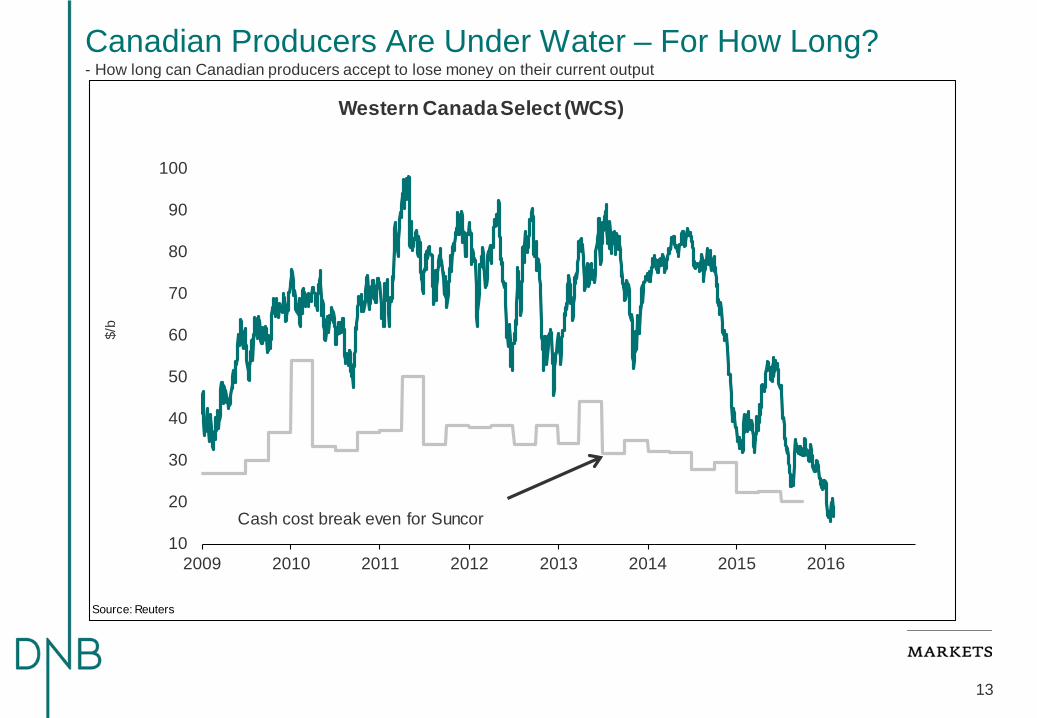
Canadian Producers Are Under Water – For How Long? - How long can Canadian producers accept to lose money on their current output
10
20
30
40
50
60
70
80
90
100
2009 2010 2011 2012 2013 2014 2015 2016
$/b
Western Canada Select (WCS)
Source: Reuters
Cash cost break even for Suncor
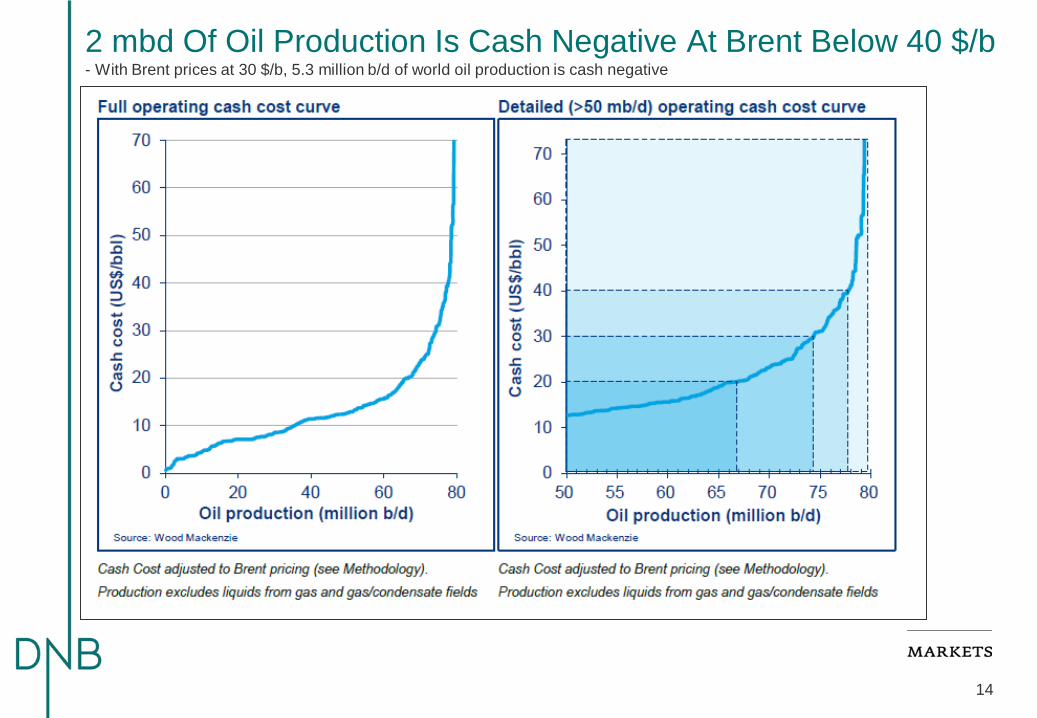
14
2 mbd Of Oil Production Is Cash Negative At Brent Below 40 $/b - With Brent prices at 30 $/b, 5.3 million b/d of world oil production is cash negative
15
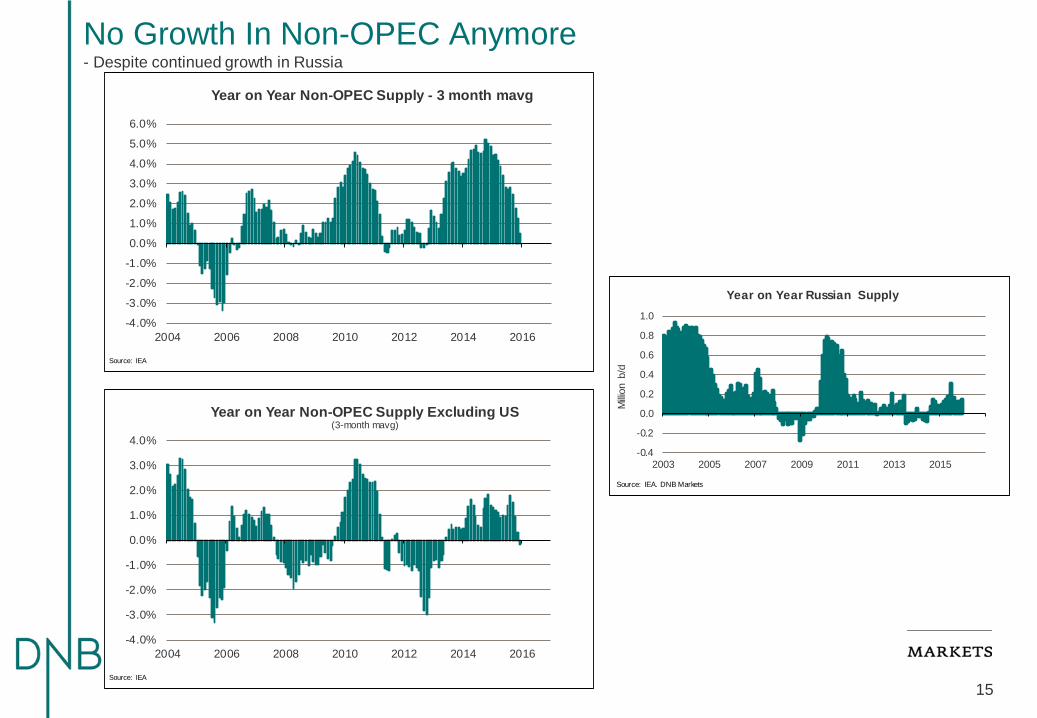
No Growth In Non-OPEC Anymore - Despite continued growth in Russia
-4.0%
-3.0%
-2.0%
-1.0%
0.0%
1.0%
2.0%
3.0%
4.0%
5.0%
6.0%
2004 2006 2008 2010 2012 2014 2016
Year on Year Non-OPEC Supply - 3 month mavg
Source: IEA
-4.0%
-3.0%
-2.0%
-1.0%
0.0%
1.0%
2.0%
3.0%
4.0%
2004 2006 2008 2010 2012 2014 2016
Year on Year Non-OPEC Supply Excluding US(3-month mavg)
Source: IEA
-0.4
-0.2
0.0
0.2
0.4
0.6
0.8
1.0
2003 2005 2007 2009 2011 2013 2015
Milli
on b
/d
Year on Year Russian Supply
Source: IEA, DNB Markets
16
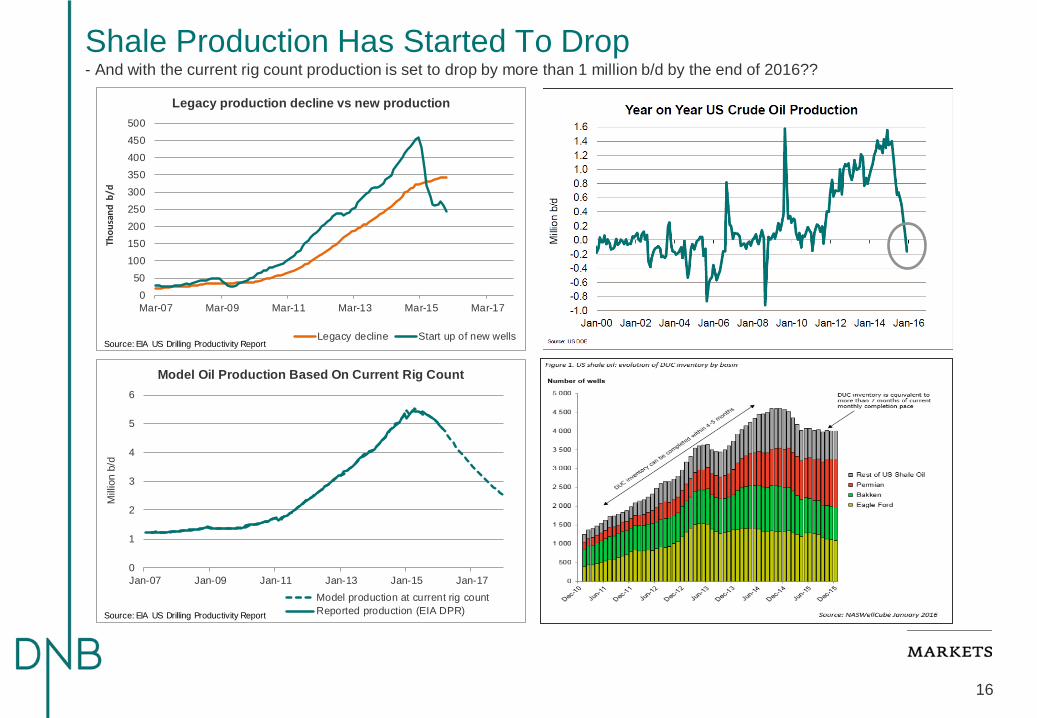
Shale Production Has Started To Drop - And with the current rig count production is set to drop by more than 1 million b/d by the end of 2016??
050
100150200250300350400450500
Mar-07 Mar-09 Mar-11 Mar-13 Mar-15 Mar-17
Thou
sand
b/d
Legacy production decline vs new production
Legacy decline Start up of new wellsSource: EIA US Drilling Productivity Report
0
1
2
3
4
5
6
Jan-07 Jan-09 Jan-11 Jan-13 Jan-15 Jan-17
Mill
ion
b/d
Model Oil Production Based On Current Rig Count
Model production at current rig countReported production (EIA DPR)Source: EIA US Drilling Productivity Report

17
Enormous Cuts In Global Oil Spending Will Continue in 2016 - This sets the stage for lower production/lower production growth in the future
18
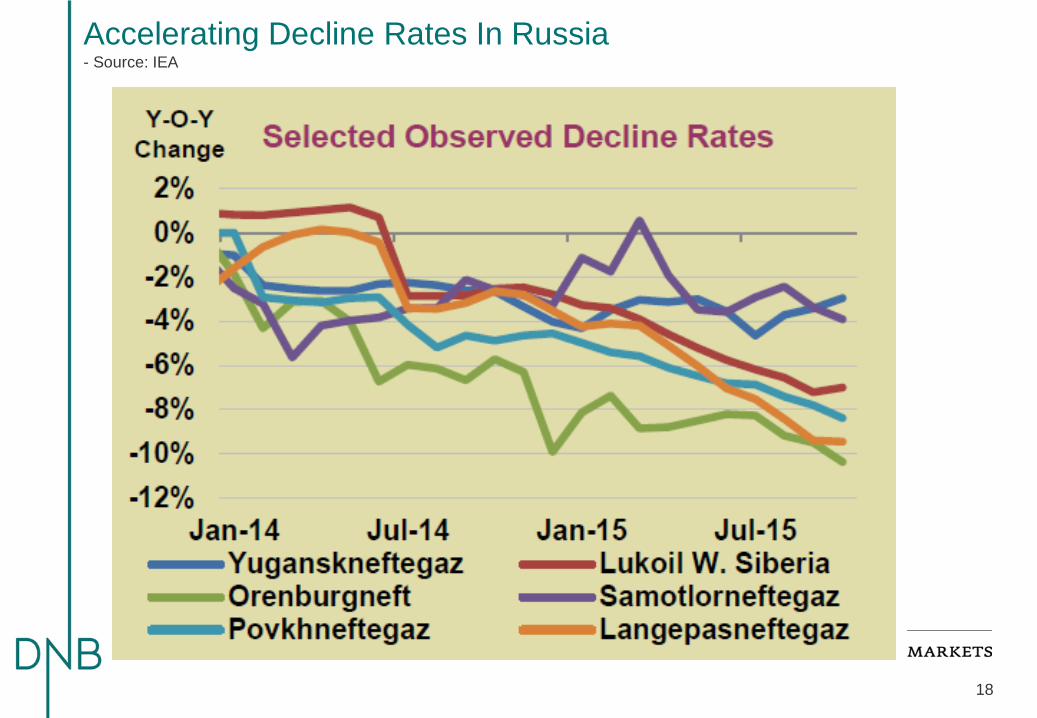
Accelerating Decline Rates In Russia - Source: IEA
19
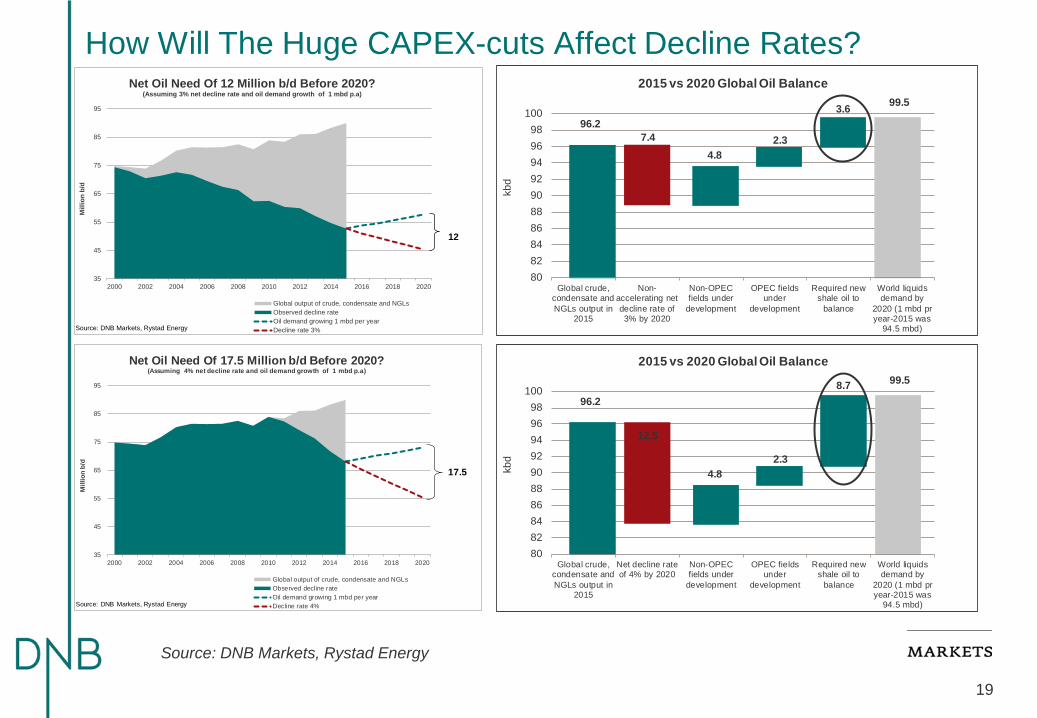
Source: DNB Markets, Rystad Energy
How Will The Huge CAPEX-cuts Affect Decline Rates?
35
45
55
65
75
85
95
2000 2002 2004 2006 2008 2010 2012 2014 2016 2018 2020
Mill
ion
b/d
Net Oil Need Of 12 Million b/d Before 2020?(Assuming 3% net decline rate and oil demand growth of 1 mbd p.a)
Global output of crude, condensate and NGLsObserved decline rateOil demand growing 1 mbd per yearDecline rate 3%
12
Source: DNB Markets, Rystad Energy
99.5
7.44.8
2.3
3.696.2
80828486889092949698
100
Global crude,condensate andNGLs output in
2015
Non-accelerating netdecline rate of3% by 2020
Non-OPECfields under
development
OPEC fieldsunder
development
Required newshale oil to
balance
World liquidsdemand by
2020 (1 mbd pryear-2015 was
94.5 mbd)
kbd
2015 vs 2020 Global Oil Balance
35
45
55
65
75
85
95
2000 2002 2004 2006 2008 2010 2012 2014 2016 2018 2020
Mill
ion
b/d
Net Oil Need Of 17.5 Million b/d Before 2020?(Assuming 4% net decline rate and oil demand growth of 1 mbd p.a)
Global output of crude, condensate and NGLsObserved decline rateOil demand growing 1 mbd per yearDecline rate 4%
17.5
Source: DNB Markets, Rystad Energy
99.5
12.5
4.82.3
8.796.2
80828486889092949698
100
Global crude,condensate andNGLs output in
2015
Net decline rateof 4% by 2020
Non-OPECfields under
development
OPEC fieldsunder
development
Required newshale oil to
balance
World liquidsdemand by
2020 (1 mbd pryear-2015 was
94.5 mbd)
kbd
2015 vs 2020 Global Oil Balance
20
-0.10
0.00
0.10
0.20
0.30
0.40
0.50
Jan-07 Jan-09 Jan-11 Jan-13 Jan-15
Milli
on b
/d
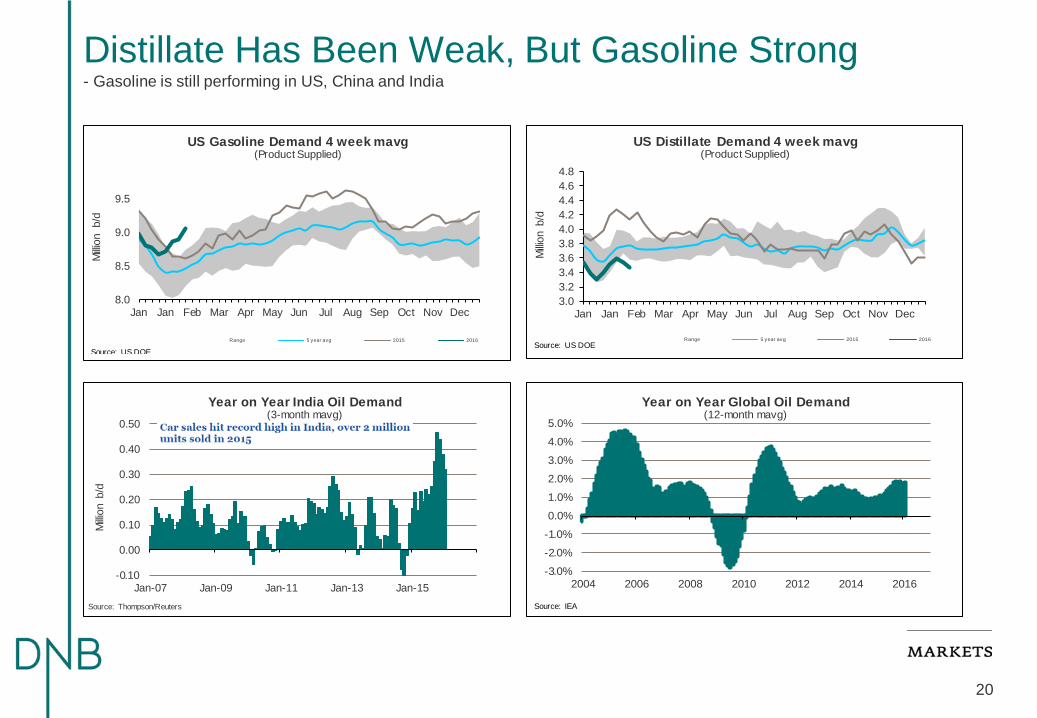
Year on Year India Oil Demand(3-month mavg)
Source: Thompson/Reuters
-3.0%-2.0%-1.0%0.0%1.0%2.0%3.0%4.0%5.0%
2004 2006 2008 2010 2012 2014 2016
Year on Year Global Oil Demand(12-month mavg)
Source: IEA
8.0
8.5
9.0
9.5
Jan Jan Feb Mar Apr May Jun Jul Aug Sep Oct Nov Dec
Milli
on b
/d
US Gasoline Demand 4 week mavg(Product Supplied)
Range 5 year avg 2015 2016
Source: US DOE
3.03.23.43.63.84.04.24.44.64.8
Jan Jan Feb Mar Apr May Jun Jul Aug Sep Oct Nov Dec
Milli
on b
/d
US Distillate Demand 4 week mavg(Product Supplied)
Range 5 year avg 2015 2016Source: US DOE
Distillate Has Been Weak, But Gasoline Strong - Gasoline is still performing in US, China and India
21
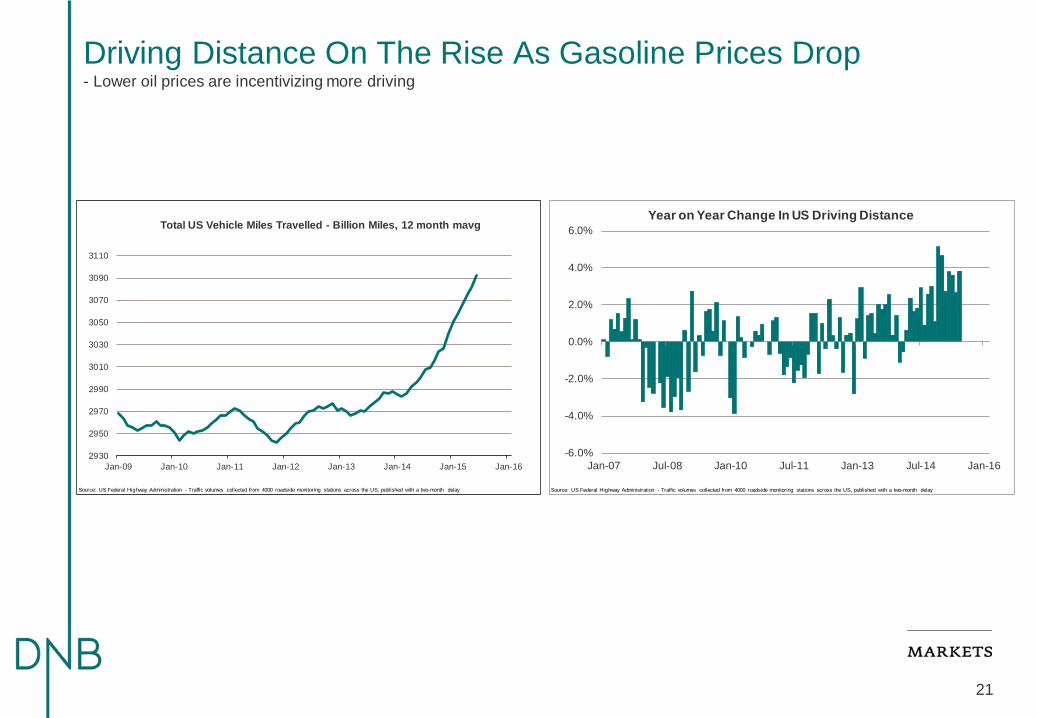
2930
2950
2970
2990
3010
3030
3050
3070
3090
3110
Jan-09 Jan-10 Jan-11 Jan-12 Jan-13 Jan-14 Jan-15 Jan-16
Total US Vehicle Miles Travelled - Billion Miles, 12 month mavg
Source: US Federal Highway Administration - Traffic volumes collected from 4000 roadside monitoring stations across the US, published with a two-month delay
-6.0%
-4.0%
-2.0%
0.0%
2.0%
4.0%
6.0%
Jan-07 Jul-08 Jan-10 Jul-11 Jan-13 Jul-14 Jan-16
Year on Year Change In US Driving Distance
Source: US Federal Highway Administration - Traffic volumes collected from 4000 roadside monitoring stations across the US, published with a two-month delay
Driving Distance On The Rise As Gasoline Prices Drop - Lower oil prices are incentivizing more driving
22
8
10
12
14
16
18
20
22
40%
42%
44%
46%
48%
50%
52%
54%
56%
58%
Jul-08 Jul-10 Jul-12 Jul-14
Annu
aliz
ed M
illion
Car
s So
ld
Ligh
t Tru
cks
Mar
ket S
hare
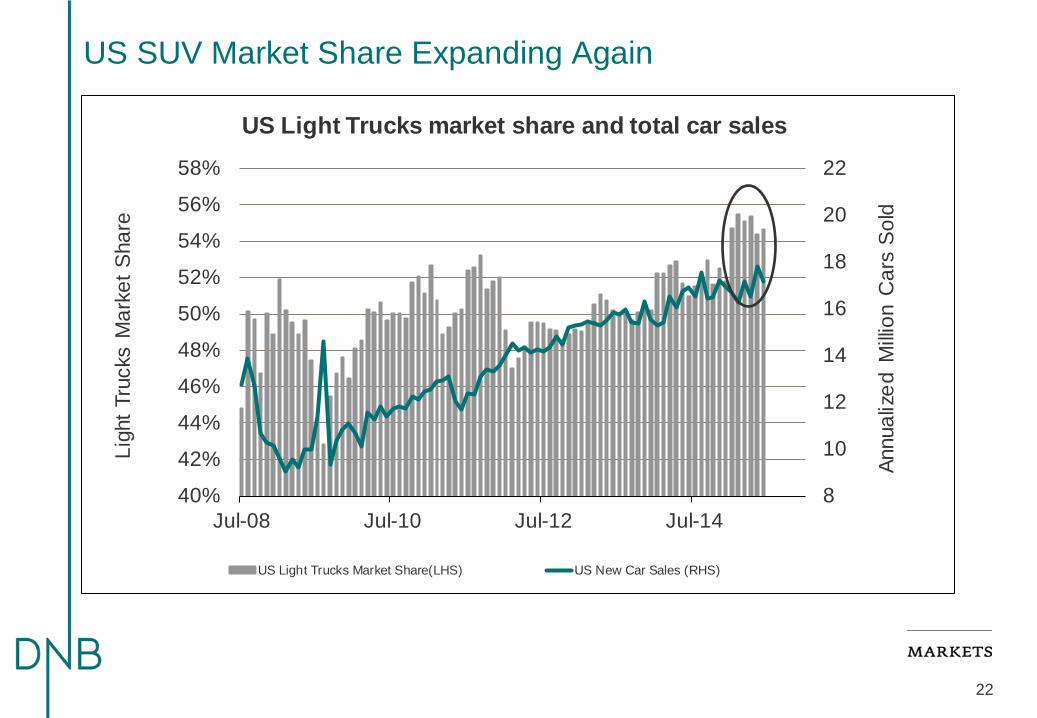
US Light Trucks market share and total car sales
US Light Trucks Market Share(LHS) US New Car Sales (RHS)
US SUV Market Share Expanding Again

23
How to Explain Chinese Gasoline Demand - With Chinese SUV sales up 58% in 2015 it is maybe not that strange that gasoline demand is performing strongly
0
100
200
300
400
500
600
700
Jan-05 Jan-08 Jan-11 Jan-14
Thou
sand
s of
SU
Vs s
old
per m
onth
Chinese SUV sales
Source: ThompsonReuters Datastream

The 2016 Oil Price Score Card
24
2016 Oil Price Scorecard Comments Oil Price Weight
Overall Outlook
The market still looks over supplied in 2016 but the call on OPEC is increasing by 1.6 million b/d according to IEA. The upside is capped by falling production costs, large US spare capacity in the form of available oil rigs/drilled uncompleted wells and OPECs market share strategy. But OPEC spare capacity is very low and non-OPEC supply growth will fade soon while geopolitical risk is high and rising.
Average price
55 $/b
Fundamentals
Global Fundamental BalanceThe global supply-demand balance is still looking over supplied for 2016, but much less over supplied than in 2015 as the call on OPEC is increasing by 1.6 million b/d in the latest IEA forecast. The problem is however that OPEC looks to produce more than the call.
BEARISH HIGH
Crude vs Product Balance (Margins)Refinery margins will probably be weaker in 2016 than in 2015 as particularly the Middle East is bringing on new capacity and as oil demand growth will be weaker in 2016 than in 2015. For the first and last quarter of 2016 the weak diesel market may lead to refinery run cuts, but we believe margins will be strong during the gasoline season.
BEARISH LOW
OECD Stock levels Stock levels are record high, but we do not believe the market will run out of storage capacity BEARISH MEDIUM
OPEC Spare CapacityCore OPEC spare capacity is low at only 2.3% of global oil demand according to IEA data. In reality the spare capacity is probably even lower since Saudi is probably producing close to capacity.
BULLISH HIGH
US Oil Statistics - Fundamentals US oil production growth which was 1.6 million b/d in 2014 and about 0.8 million b/d in 2015 is forecast to drop to negative in 2016 and US crude stocks will draw down in 2016. BULLISH HIGH
Global Demand GrowthGlobal oil demand growth is positively affected by the lower prices in 2015 but this effect is seen to fade in 2016. We have factored in weaker global demand growth for 2016, but the higher starting point of OECD oil demand next year means year on year growth will still be decent for OECD also in 2016.
NEUTRAL MEDIUM
OPEC SupplyOPEC (Saudi) is seen to contiunue its policy of targeting market share instead of price. And we estimate that Iran will increase its output from the current 2.9 million b/d to about 3.6 million b/d by the summer, starting the ramp up in Q1-2016.
BEARISH HIGH
Non-OPEC Supply Total non-OPEC supply growth is seen negative in 2016, down from a record growth of 2.2 million b/d in 2014 and 1.2 million b/d in 2015. BULLISH MEDIUM
Political Risk
Venezuela, Iraq, Iran, Saudi, Nigeria, Russia, Israel, MENA, Brazil, etc
Political risk is on the rise. Key risk is from countries like Venezuela, Iraq, Libya, Brazil. The Iran deal will probably bring meaningfully more OPEC barrels to the market, but generally the sunni-shiite conflict and IS has increased the total risk in the Middle East and weak economic conditions in countries like Venezuela and Brazil is threatening the social stability. There is a non-negligible risk related to conflict/power struggle inside the Saudi Royal family and the escalating tension between Iran and Saudi Arabia after Saudi executed an important Shia cleric.
BULLISH HIGH
Other Factors
Financial Money Flow
Total financial net oil length is significantly down since the peak. There is hence room room for a rebuild of positions if the sentiment should change. Triggers could be geopolitics, a strong gasoline season, accellerating decline rates, write downs of resources from shale oil companies, etc. A stronger USD has provided headwinds for the oil price since 2014, but this effect is probaly fading for 2016 as we do not believe in a further strengthening of the USD for the coming year.
BULLISH LOW

25
Long Term Oil Price Forecast – Current (The forecast is for the average of the rolling 1st month ICE Brent future contract)
Historical HistoricalNominal $/b Real (2015) $/b
2001 24.4 32.72002 25.0 32.92003 28.8 37.12004 38.3 48.02005 54.5 66.12006 65.1 76.52007 72.4 82.72008 97.3 106.92009 61.7 68.12010 79.5 86.32011 111.3 117.12012 111.7 115.12013 108.7 110.42014 99.5 101.52015 53.6 53.6
Price target ForecastNominal $/b Real (2015) $/b
3 months 456 months 55
12 months 6524 months 702019-2023 60-80
0
20
40
60
80
100
120
140
1996 1999 2002 2005 2008 2011 2014 2017 2020
$/b
Spot Brent History & FWD looking
New normalized price range in 2015 USD FWD (nominal)
Forecast nominal HistoricalSource: Reuters, DNB Markets
100-120 range gone (forever?)
26
“The time to repair the roof is when the sun is shining”
John F. Kennedy, SotU 1962
27
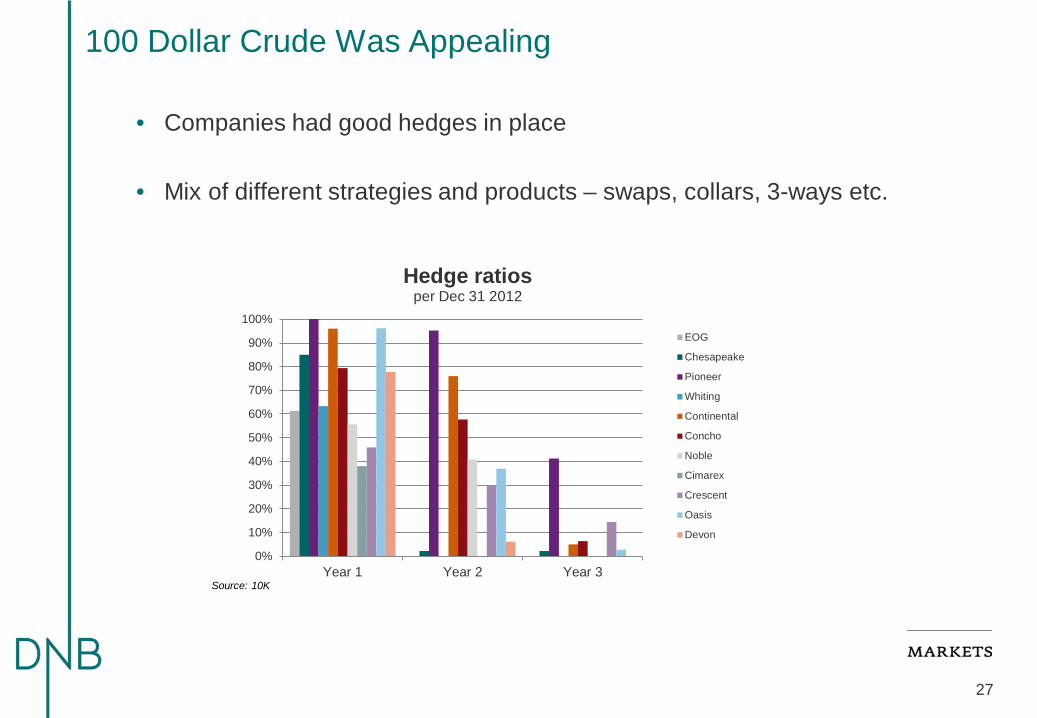
100 Dollar Crude Was Appealing
• Companies had good hedges in place
• Mix of different strategies and products – swaps, collars, 3-ways etc.
0%
10%
20%
30%
40%
50%
60%
70%
80%
90%
100%
Year 1 Year 2 Year 3
Hedge ratios per Dec 31 2012
EOG
Chesapeake
Pioneer
Whiting
Continental
Concho
Noble
Cimarex
Crescent
Oasis
Devon
Source: 10K

28
Hedge Ratios Dropped With Falling Prices
0%
10%
20%
30%
40%
50%
60%
70%
80%
Year 1 Year 2 Year 3
Hedge ratio 2013 2014 2015 2016
Source: 10K (EOG, CHK, PXD, WLL, CLR, CXO, NBL, XEC, CPG, OAS, DVN)
• Those same companies sharply reduced their hedged volume
• Hedge ratios lowest when hedges were needed the most?
29
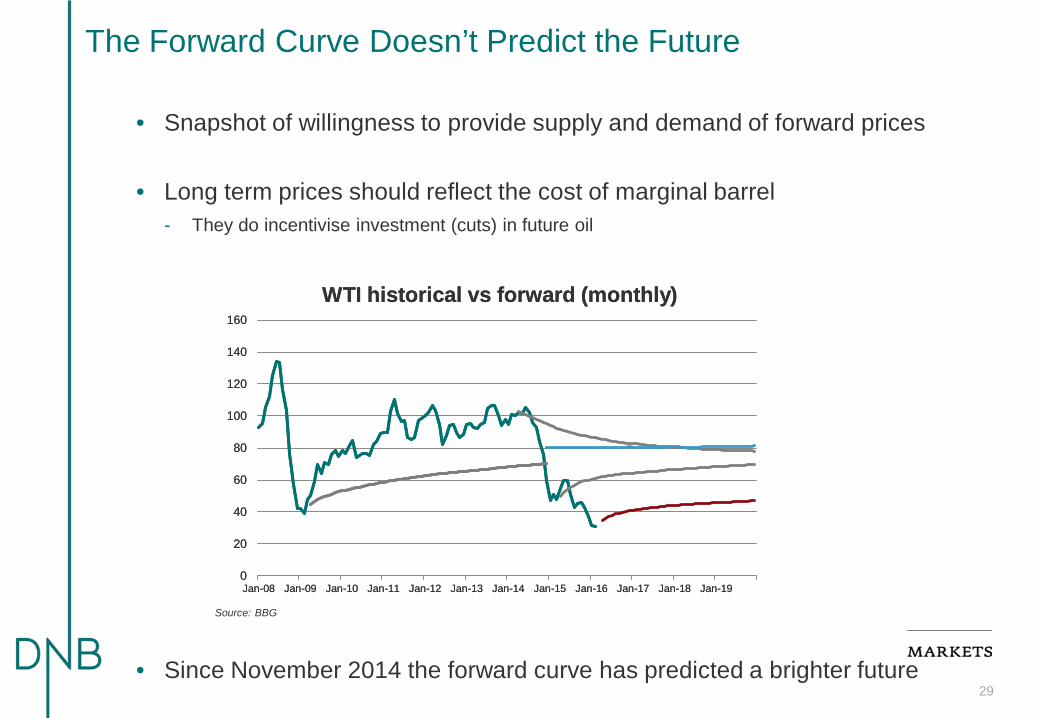
• Snapshot of willingness to provide supply and demand of forward prices
• Long term prices should reflect the cost of marginal barrel - They do incentivise investment (cuts) in future oil
• Since November 2014 the forward curve has predicted a brighter future
The Forward Curve Doesn’t Predict the Future
0
20
40
60
80
100
120
140
160
Jan-08 Jan-09 Jan-10 Jan-11 Jan-12 Jan-13 Jan-14 Jan-15 Jan-16 Jan-17 Jan-18 Jan-19
WTI historical vs forward (monthly)
0
20
40
60
80
100
120
140
160
Jan-08 Jan-09 Jan-10 Jan-11 Jan-12 Jan-13 Jan-14 Jan-15 Jan-16 Jan-17 Jan-18 Jan-19
WTI historical vs forward (monthly)
0
20
40
60
80
100
120
140
160
Jan-08 Jan-09 Jan-10 Jan-11 Jan-12 Jan-13 Jan-14 Jan-15 Jan-16 Jan-17 Jan-18 Jan-19
WTI historical vs forward (monthly)
0
20
40
60
80
100
120
140
160
Jan-08 Jan-09 Jan-10 Jan-11 Jan-12 Jan-13 Jan-14 Jan-15 Jan-16 Jan-17 Jan-18 Jan-19
WTI historical vs forward (monthly)
Source: BBG
30
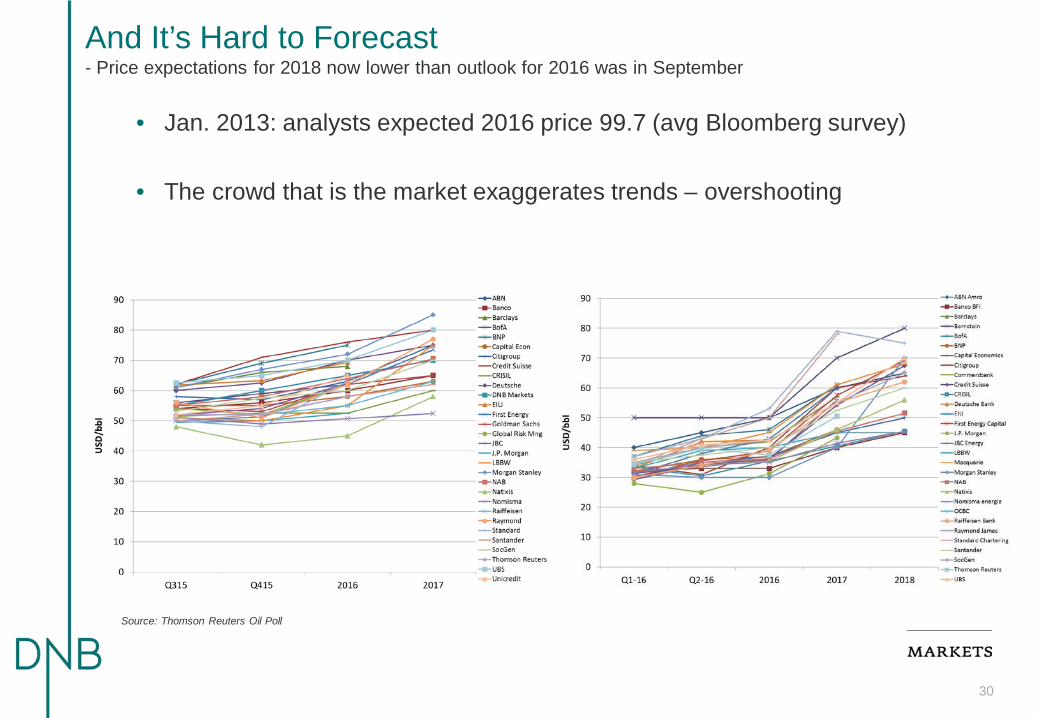
And It’s Hard to Forecast - Price expectations for 2018 now lower than outlook for 2016 was in September
Source: Thomson Reuters Oil Poll
• Jan. 2013: analysts expected 2016 price 99.7 (avg Bloomberg survey)
• The crowd that is the market exaggerates trends – overshooting
31
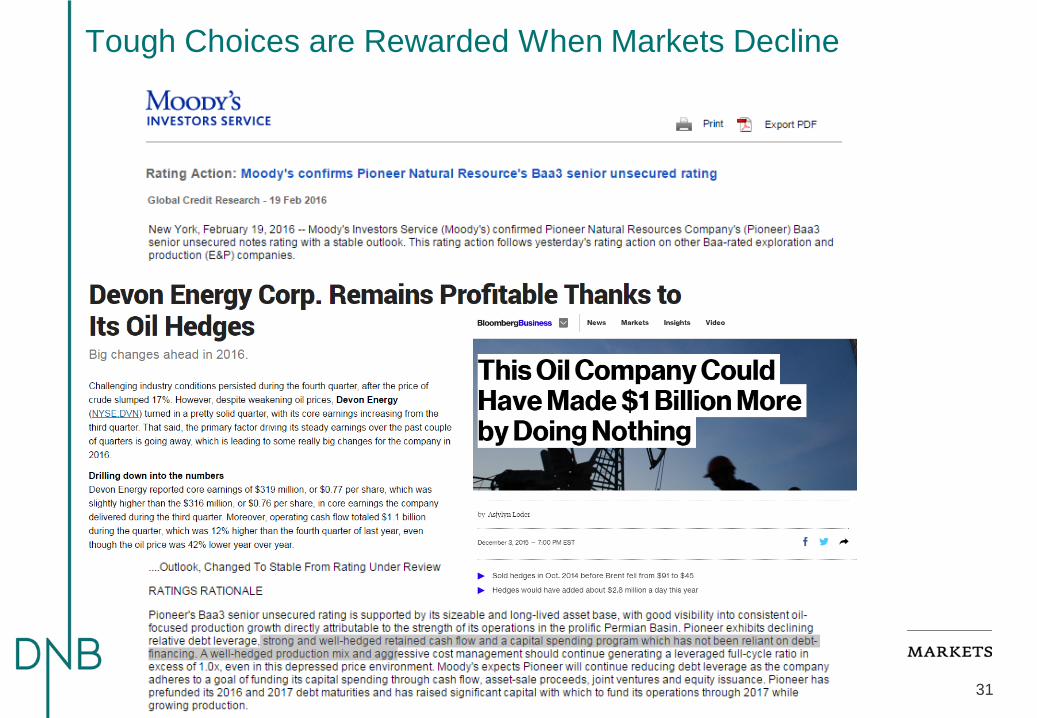
Tough Choices are Rewarded When Markets Decline

32
Opportunistic vs Apocalyptic Hedging
• Should not be about picking the tops and bottoms
• Markets are not rational, cash flow must be protected
• Consider risks of hedge losses in high price scenarios vs risk of bankruptcy in a weak market
• Cost of hedging rises considerably when it’s most crucial - 40 put for 2018 is 5.5 USD/bbl now - 40 put for 2016 was 10 cents/bbl two years ago
• Firm strategy – flexible execution
Normal hedge ratio
60 %40 %25 %15 %37-48 months
Hedging ratios50-70%30-50%0-40%0-30%
Time0-12 months
13-24 months25-36 months
33
• Trends typically overshoot in commodities – prepare to outlast them
• Hedges aren’t supposed to always be profitable
• Maintain financial flexibility through smoothing out revenue - Maintain capacity when times are tough - Avoid firesales - More time to adjust strategy, reorganise, negotiate with creditors - Solid hedging policy can reduce finance costs and increase debt capacity - Stability in financial ratios, rating and financing costs
Summary