Embed Size (px)
Citation preview

GLOBAL OUTLOOK
December 2017
ECONOMIC WATCH
Global Economic Watch | December 2017
The sustainability of the global growth is more evident
Official GDP growth figures are revised upwards in 3Q17 to 1.02% QoQ from 0.93% QoQ,
which implies slightly higher figures for 4Q17 than a month ago (BBVA-GAIN: 1.04% QoQ).
Strong confidence indicators, but hard data still fail to catch up. Further gains in manufacturing
surveys and steady service confidence up to November, but industrial output and retail sales
improved only slightly in October. Global trade recovery continues, but at a slower pace.
Solid economic momentum growth in developed markets (DM):
US: improving confidence and solid labour market support growth momentum in Q4. Upside
short-term bias from tax reform.
EZ: increasing global demand adds to strengthening domestic factors and reduced political
uncertainty, suggesting that strong momentum will be maintained in coming months.
Mixed signals from emerging markets (DM):
China: Growth moderation continues due to the authorities’ policy initiatives.
Latam: Activity recovery underway, supported by increasing demand, higher confidence and
better external environment.
Global headline inflation accelerated mildly in November driven by volatile components while
core pressures remained broadly unchanged and subdued.
2
Global Economic Watch | December 2017
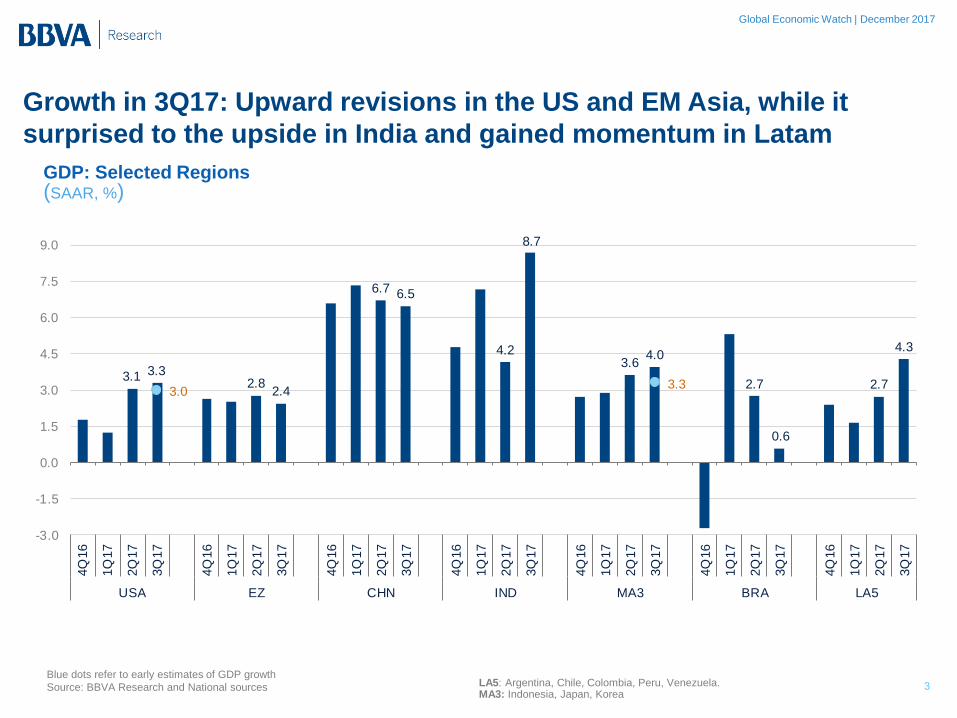
GDP: Selected Regions (SAAR, %)
Blue dots refer to early estimates of GDP growth
Source: BBVA Research and National sources
3
3.1 3.32.8
2.4
6.7 6.5
4.2
8.7
3.64.0
2.7
0.6
2.7
4.3
3.03.3
-3.0
-1.5
0.0
1.5
3.0
4.5
6.0
7.5
9.0
4Q
16
1Q
17
2Q
17
3Q
17
4Q
16
1Q
17
2Q
17
3Q
17
4Q
16
1Q
17
2Q
17
3Q
17
4Q
16
1Q
17
2Q
17
3Q
17
4Q
16
1Q
17
2Q
17
3Q
17
4Q
16
1Q
17
2Q
17
3Q
17
4Q
16
1Q
17
2Q
17
3Q
17
USA EZ CHN IND MA3 BRA LA5
Growth in 3Q17: Upward revisions in the US and EM Asia, while it
surprised to the upside in India and gained momentum in Latam
LA5: Argentina, Chile, Colombia, Peru, Venezuela. MA3: Indonesia, Japan, Korea

Global Economic Watch | December 2017
Global GDP growth momentum to continue in the Q4 (around 1% QoQ)
World GDP Growth
Forecast based on BBVA-GAIN (%, QoQ) World GDP Growth: Change in forecast
QoQ, %
Source: BBVA Research and CPB 4
* Forecast and nowcast based on BBVA-GAIN
0.4
0.6
0.8
1.0
1.2
Dec-1
2
Jun-1
3
Dec-1
3
Jun-1
4
Dec-1
4
Jun-1
5
Dec-1
5
Jun-1
6
Dec-1
6
Jun-1
7
Dec-1
7
CI 20% CI 40% CI 60%
Point Estimates Period average
0.80
0.981.04 1.02
0.931.04
0.96
Off
icia
l da
ta
Last
mon
th
Cu
rre
nt
Est.
Last
mon
th
4Q16 1Q17 2Q17 3Q17 4Q17
Nowcast
Global Economic Watch | December 2017
-1.0
-0.5
0.0
0.5
1.0
1.5
2.0
2.5
4Q
11
2Q
12
4Q
12
2Q
13
4Q
13
2Q
14
4Q
14
2Q
15
4Q
15
2Q
16
4Q
16
2Q
17
4Q
17
WLD DM EM
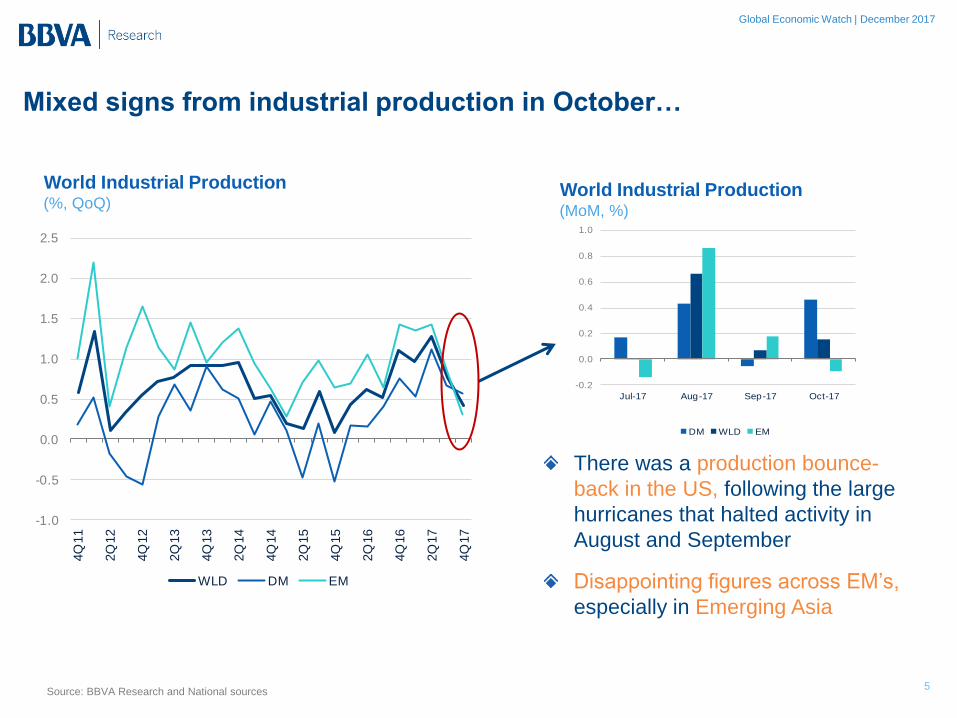
Mixed signs from industrial production in October…
World Industrial Production
(%, QoQ) World Industrial Production (MoM, %)
Source: BBVA Research and National sources 5
-0.2
0.0
0.2
0.4
0.6
0.8
1.0
Jul-17 Aug-17 Sep-17 Oct-17
DM WLD EM
There was a production bounce-
back in the US, following the large
hurricanes that halted activity in
August and September
Disappointing figures across EM’s,
especially in Emerging Asia
Global Economic Watch | December 2017
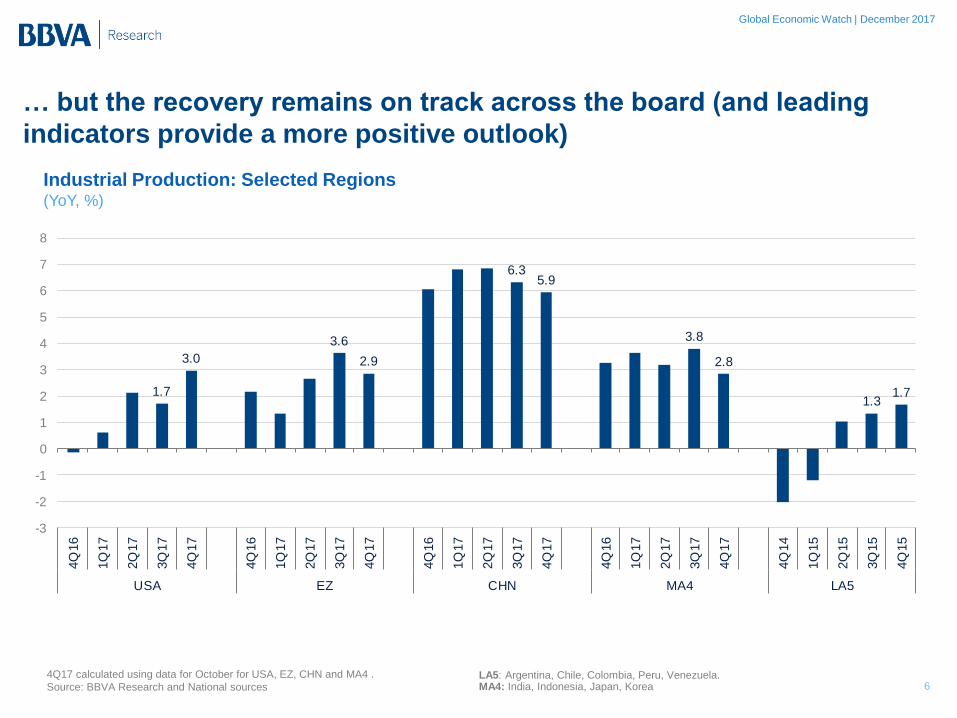
… but the recovery remains on track across the board (and leading
indicators provide a more positive outlook)
Industrial Production: Selected Regions (YoY, %)
6 4Q17 calculated using data for October for USA, EZ, CHN and MA4 .
Source: BBVA Research and National sources LA5: Argentina, Chile, Colombia, Peru, Venezuela. MA4: India, Indonesia, Japan, Korea
1.7
3.0
3.6
2.9
6.35.9
3.8
2.8
1.31.7
-3
-2
-1
0
1
2
3
4
5
6
7
8
4Q
16
1Q
17
2Q
17
3Q
17
4Q
17
4Q
16
1Q
17
2Q
17
3Q
17
4Q
17
4Q
16
1Q
17
2Q
17
3Q
17
4Q
17
4Q
16
1Q
17
2Q
17
3Q
17
4Q
17
4Q
14
1Q
15
2Q
15
3Q
15
4Q
15
USA EZ CHN MA4 LA5
Global Economic Watch | December 2017
48
49
50
51
52
53
54
55
56
4Q
12
2Q
13
4Q
13
2Q
14
4Q
14
2Q
15
4Q
15
2Q
16
4Q
16
2Q
17
4Q
17
DM WLD EM
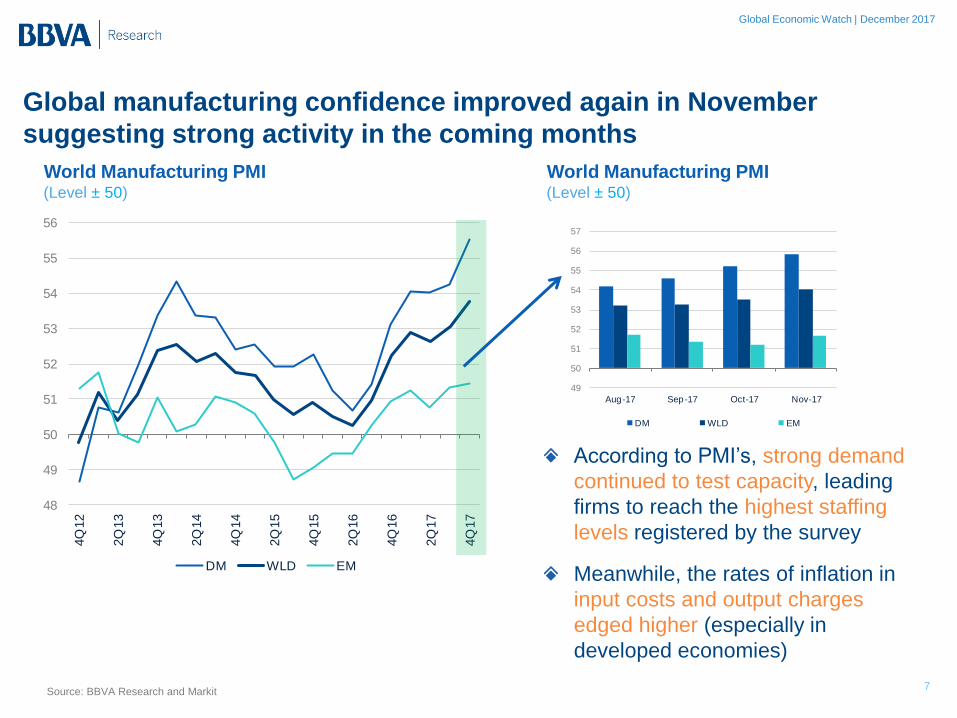
Global manufacturing confidence improved again in November
suggesting strong activity in the coming months
World Manufacturing PMI
(Level ± 50)
World Manufacturing PMI (Level ± 50)
Source: BBVA Research and Markit 7
According to PMI’s, strong demand
continued to test capacity, leading
firms to reach the highest staffing
levels registered by the survey
Meanwhile, the rates of inflation in
input costs and output charges
edged higher (especially in
developed economies)
49
50
51
52
53
54
55
56
57
Aug-17 Sep-17 Oct-17 Nov-17
DM WLD EM
Global Economic Watch | December 2017
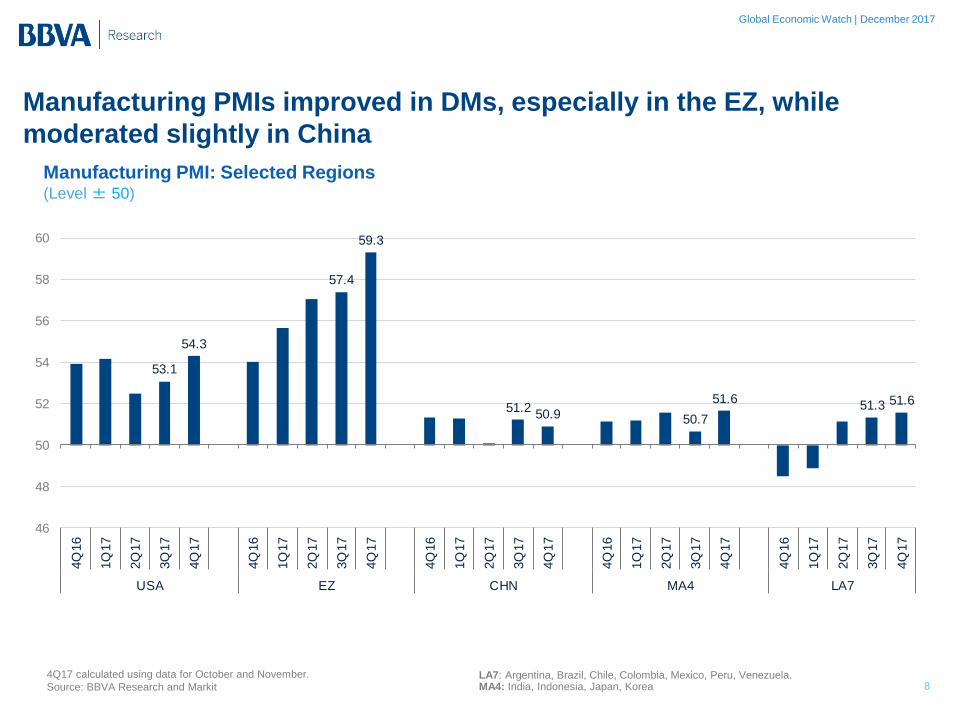
Manufacturing PMIs improved in DMs, especially in the EZ, while
moderated slightly in China
Manufacturing PMI: Selected Regions (Level ± 50)
8 LA7: Argentina, Brazil, Chile, Colombia, Mexico, Peru, Venezuela. MA4: India, Indonesia, Japan, Korea
4Q17 calculated using data for October and November.
Source: BBVA Research and Markit
53.1
54.3
57.4
59.3
51.250.9 50.7
51.651.3 51.6
46
48
50
52
54
56
58
60
4Q
16
1Q
17
2Q
17
3Q
17
4Q
17
4Q
16
1Q
17
2Q
17
3Q
17
4Q
17
4Q
16
1Q
17
2Q
17
3Q
17
4Q
17
4Q
16
1Q
17
2Q
17
3Q
17
4Q
17
4Q
16
1Q
17
2Q
17
3Q
17
4Q
17
USA EZ CHN MA4 LA7

Global Economic Watch | December 2017
Global services PMIs fell mildly in November, but consolidated the
gains over the quarter…
World Services PMI
(Level ± 50)
World Services PMI (Level ± 50)
Source: BBVA Research and Markit 9
November services confidence
continue to show an expansion at a
solid and stable pace underpinned
by rising new orders
Price pressures also intensified
during November as input costs
and output charges rates
accelerated
49
50
51
52
53
54
55
56
Aug-17 Sep-17 Oct-17 Nov-17
DM WLD EM
48
49
50
51
52
53
54
55
56
57
4Q
12
2Q
13
4Q
13
2Q
14
4Q
14
2Q
15
4Q
15
2Q
16
4Q
16
2Q
17
4Q
17
DM WLD EM
Global Economic Watch | December 2017
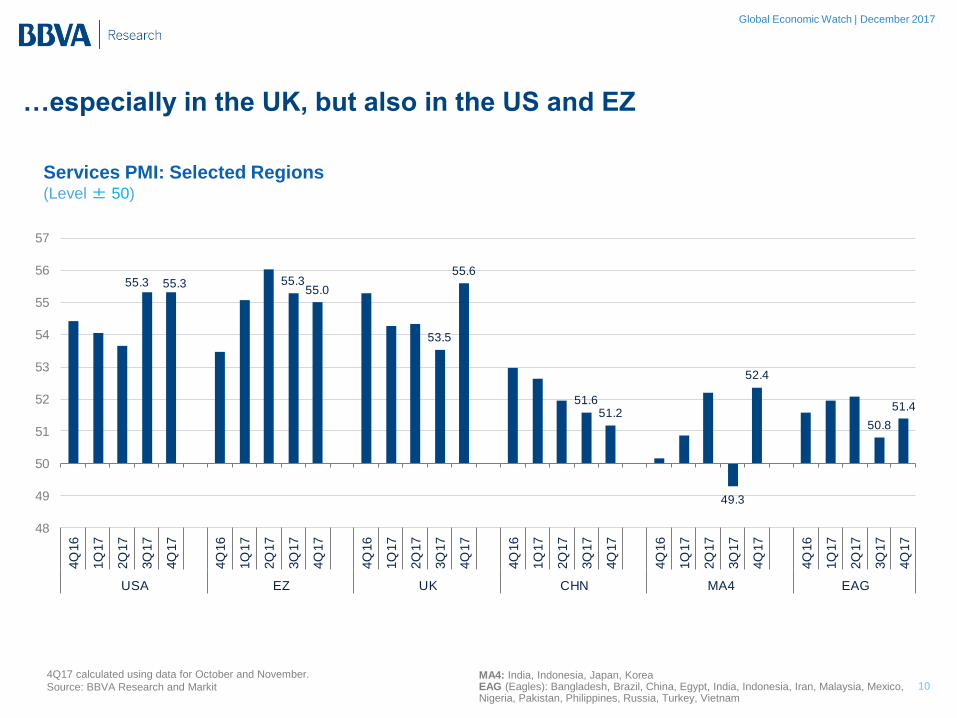
…especially in the UK, but also in the US and EZ
Services PMI: Selected Regions (Level ± 50)
10 MA4: India, Indonesia, Japan, Korea EAG (Eagles): Bangladesh, Brazil, China, Egypt, India, Indonesia, Iran, Malaysia, Mexico, Nigeria, Pakistan, Philippines, Russia, Turkey, Vietnam
4Q17 calculated using data for October and November.
Source: BBVA Research and Markit
55.3 55.3 55.355.0
53.5
55.6
51.651.2
49.3
52.4
50.8
51.4
48
49
50
51
52
53
54
55
56
57
4Q
16
1Q
17
2Q
17
3Q
17
4Q
17
4Q
16
1Q
17
2Q
17
3Q
17
4Q
17
4Q
16
1Q
17
2Q
17
3Q
17
4Q
17
4Q
16
1Q
17
2Q
17
3Q
17
4Q
17
4Q
16
1Q
17
2Q
17
3Q
17
4Q
17
4Q
16
1Q
17
2Q
17
3Q
17
4Q
17
USA EZ UK CHN MA4 EAG
Global Economic Watch | December 2017
-0.5
0.0
0.5
1.0
1.5
2.0
2.5
3.0
3.5
4Q
11
2Q
12
4Q
12
2Q
13
4Q
13
2Q
14
4Q
14
2Q
15
4Q
15
2Q
16
4Q
16
2Q
17
4Q
17
DM WLD EM
DM: Avg 2000-16
EM: Avg 2000-16
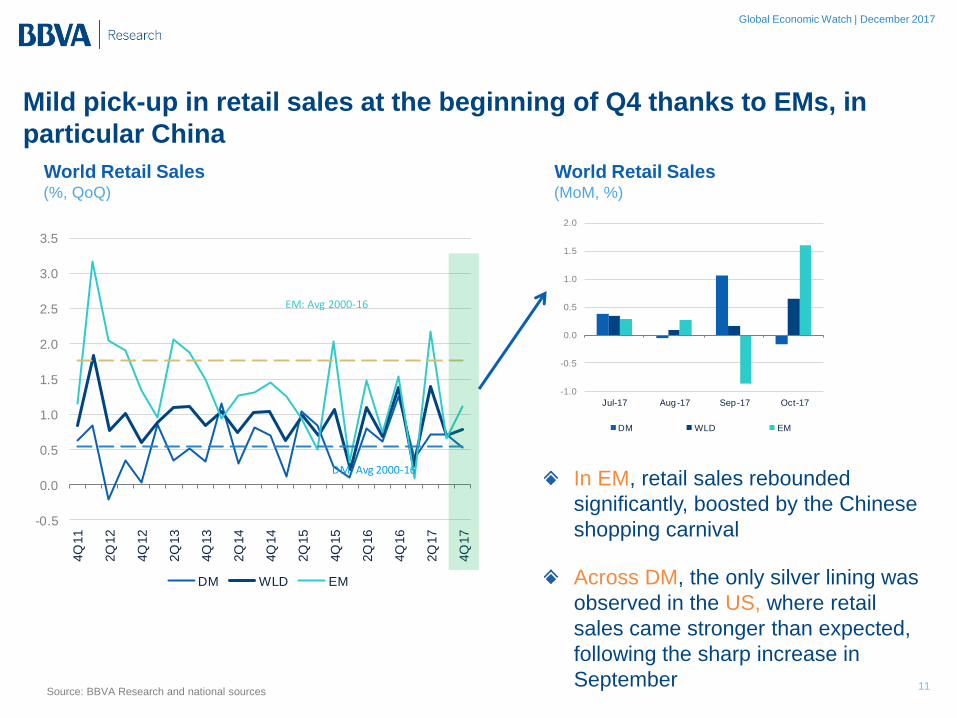
Mild pick-up in retail sales at the beginning of Q4 thanks to EMs, in
particular China
World Retail Sales
(%, QoQ)
World Retail Sales (MoM, %)
Source: BBVA Research and national sources 11
In EM, retail sales rebounded
significantly, boosted by the Chinese
shopping carnival
Across DM, the only silver lining was
observed in the US, where retail
sales came stronger than expected,
following the sharp increase in
September
-1.0
-0.5
0.0
0.5
1.0
1.5
2.0
Jul-17 Aug-17 Sep-17 Oct-17
DM WLD EM
Global Economic Watch | December 2017
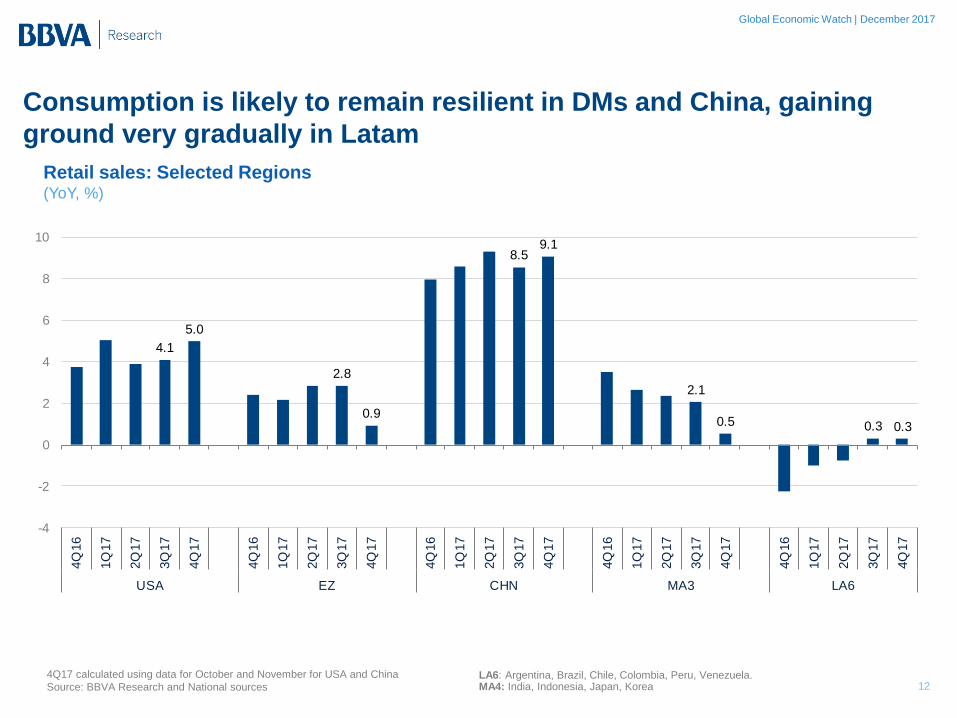
Consumption is likely to remain resilient in DMs and China, gaining
ground very gradually in Latam
Retail sales: Selected Regions (YoY, %)
12 4Q17 calculated using data for October and November for USA and China
Source: BBVA Research and National sources LA6: Argentina, Brazil, Chile, Colombia, Peru, Venezuela. MA4: India, Indonesia, Japan, Korea
4.1
5.0
2.8
0.9
8.59.1
2.1
0.5 0.3 0.3
-4
-2
0
2
4
6
8
10
4Q
16
1Q
17
2Q
17
3Q
17
4Q
17
4Q
16
1Q
17
2Q
17
3Q
17
4Q
17
4Q
16
1Q
17
2Q
17
3Q
17
4Q
17
4Q
16
1Q
17
2Q
17
3Q
17
4Q
17
4Q
16
1Q
17
2Q
17
3Q
17
4Q
17
USA EZ CHN MA3 LA6
Global Economic Watch | December 2017
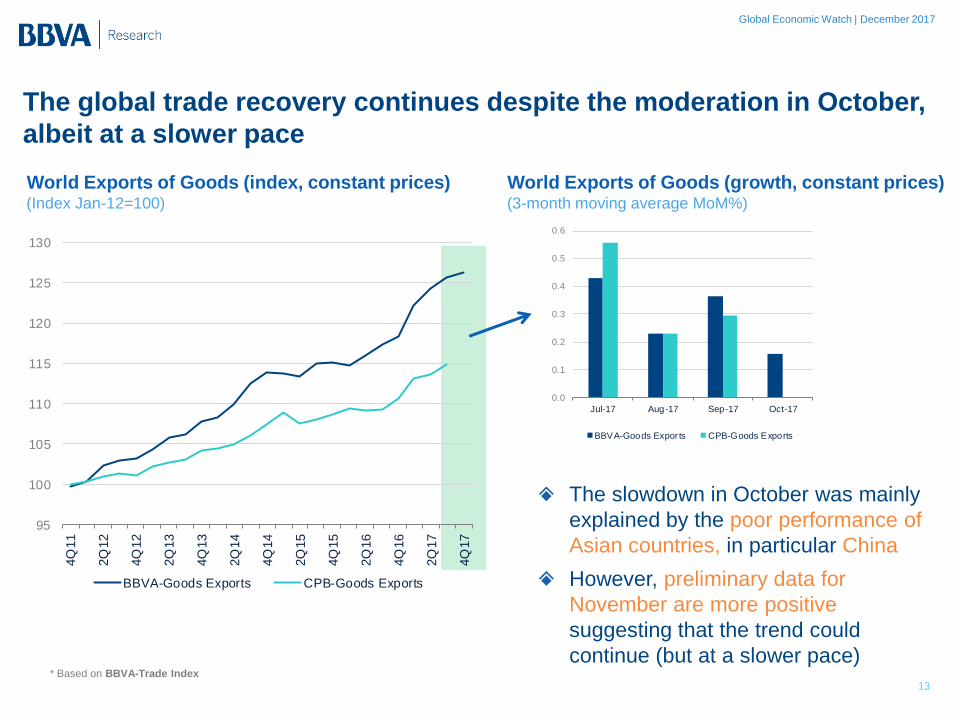
The global trade recovery continues despite the moderation in October,
albeit at a slower pace
World Exports of Goods (index, constant prices) (Index Jan-12=100)
13
* Based on BBVA-Trade Index
0.0
0.1
0.2
0.3
0.4
0.5
0.6
Jul-17 Aug-17 Sep-17 Oct-17
BBVA-Goods Expor ts CPB-Goods Exports
The slowdown in October was mainly
explained by the poor performance of
Asian countries, in particular China
However, preliminary data for
November are more positive
suggesting that the trend could
continue (but at a slower pace)
World Exports of Goods (growth, constant prices) (3-month moving average MoM%)
95
100
105
110
115
120
125
130
4Q
11
2Q
12
4Q
12
2Q
13
4Q
13
2Q
14
4Q
14
2Q
15
4Q
15
2Q
16
4Q
16
2Q
17
4Q
17
BBVA-Goods Exports CPB-Goods Exports
Global Economic Watch | December 2017
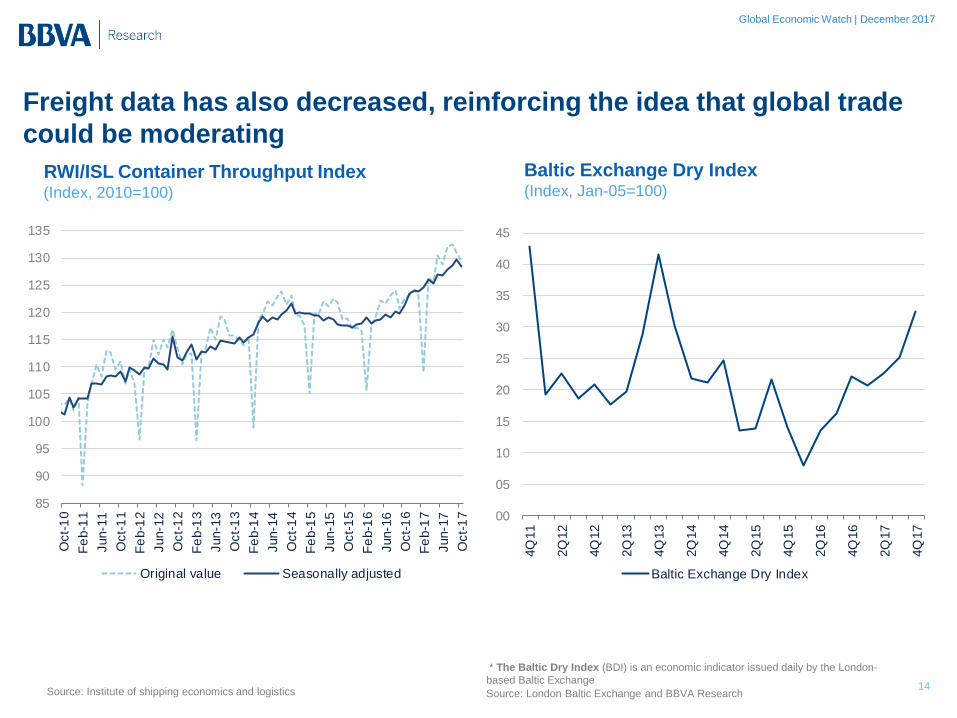
Freight data has also decreased, reinforcing the idea that global trade
could be moderating
RWI/ISL Container Throughput Index
(Index, 2010=100)
Baltic Exchange Dry Index (Index, Jan-05=100)
Source: Institute of shipping economics and logistics 14
* The Baltic Dry Index (BDI) is an economic indicator issued daily by the London-
based Baltic Exchange
Source: London Baltic Exchange and BBVA Research
85
90
95
100
105
110
115
120
125
130
135
Oct-
10
Fe
b-1
1
Jun-1
1
Oct-
11
Fe
b-1
2
Jun-1
2
Oct-
12
Fe
b-1
3
Jun-1
3
Oct-
13
Fe
b-1
4
Jun-1
4
Oct-
14
Fe
b-1
5
Jun-1
5
Oct-
15
Fe
b-1
6
Jun-1
6
Oct-
16
Fe
b-1
7
Jun-1
7
Oct-
17
Original value Seasonally adjusted
00
05
10
15
20
25
30
35
40
45
4Q
11
2Q
12
4Q
12
2Q
13
4Q
13
2Q
14
4Q
14
2Q
15
4Q
15
2Q
16
4Q
16
2Q
17
4Q
17
Baltic Exchange Dry Index
Global Economic Watch | December 2017
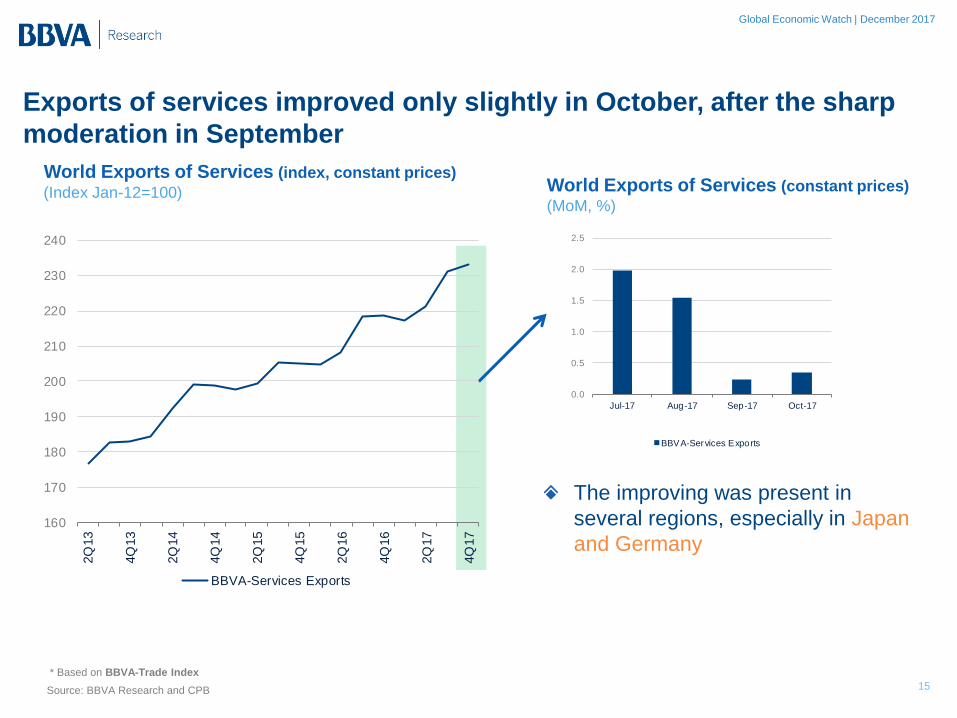
Exports of services improved only slightly in October, after the sharp
moderation in September
World Exports of Services (index, constant prices)
(Index Jan-12=100) World Exports of Services (constant prices) (MoM, %)
15
The improving was present in
several regions, especially in Japan
and Germany
Source: BBVA Research and CPB
* Based on BBVA-Trade Index
0.0
0.5
1.0
1.5
2.0
2.5
Jul-17 Aug-17 Sep-17 Oct-17
BBVA-Services Exports
160
170
180
190
200
210
220
230
240
2Q
13
4Q
13
2Q
14
4Q
14
2Q
15
4Q
15
2Q
16
4Q
16
2Q
17
4Q
17
BBVA-Services Exports
Global Economic Watch | December 2017
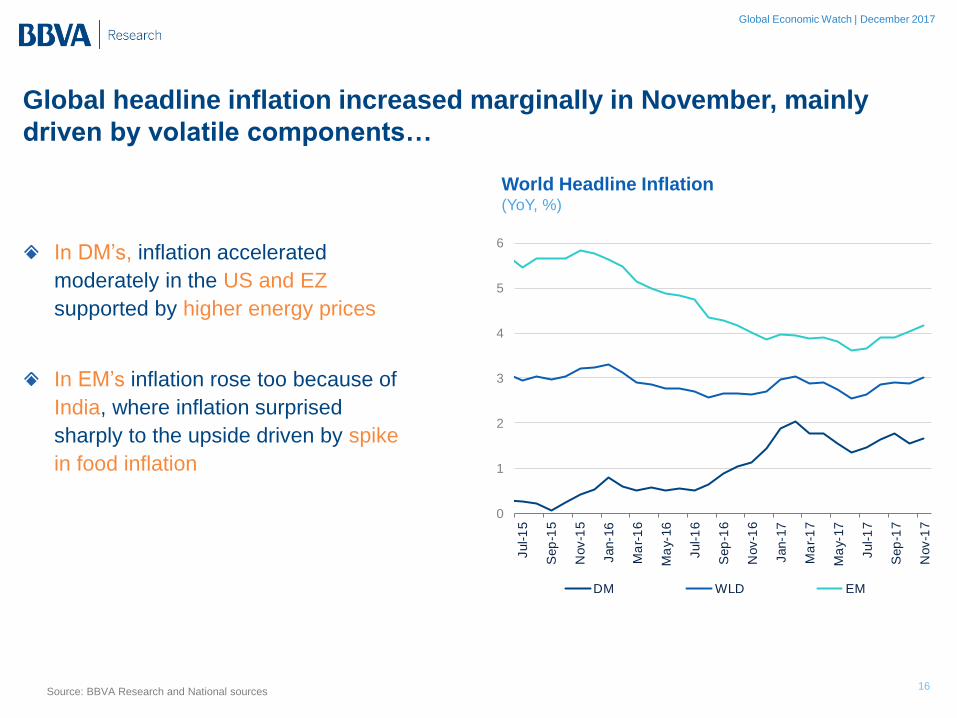
Global headline inflation increased marginally in November, mainly
driven by volatile components…
World Headline Inflation (YoY, %)
Source: BBVA Research and National sources 16
0
1
2
3
4
5
6
Jul-1
5
Sep
-15
Nov-1
5
Jan-1
6
Ma
r-1
6
Ma
y-16
Jul-1
6
Sep
-16
Nov-1
6
Jan-1
7
Ma
r-1
7
Ma
y-17
Jul-1
7
Sep
-17
Nov-1
7
DM WLD EM
In DM’s, inflation accelerated
moderately in the US and EZ
supported by higher energy prices
In EM’s inflation rose too because of
India, where inflation surprised
sharply to the upside driven by spike
in food inflation
Global Economic Watch | December 2017
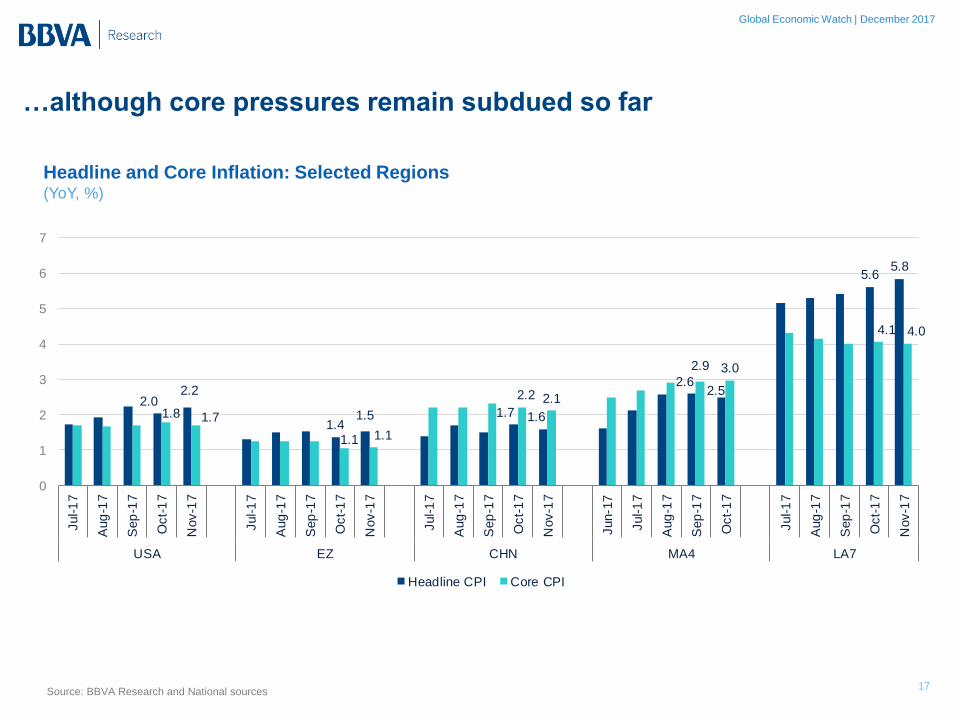
…although core pressures remain subdued so far
Headline and Core Inflation: Selected Regions (YoY, %)
Source: BBVA Research and National sources 17
2.02.2
1.41.5 1.7 1.6
2.62.5
5.65.8
1.8 1.7
1.1 1.1
2.2 2.1
2.9 3.0
4.1 4.0
0
1
2
3
4
5
6
7
Jul-1
7
Aug
-17
Sep
-17
Oct-
17
Nov-1
7
Jul-1
7
Aug
-17
Sep
-17
Oct-
17
Nov-1
7
Jul-1
7
Aug
-17
Sep
-17
Oct-
17
Nov-1
7
Jun-1
7
Jul-1
7
Aug
-17
Sep
-17
Oct-
17
Jul-1
7
Aug
-17
Sep
-17
Oct-
17
Nov-1
7
USA EZ CHN MA4 LA7
Headline CPI Core CPI

GLOBAL OUTLOOK
December 2017
ECONOMIC WATCH