Embed Size (px)
Citation preview

Global Overview of Petroleum Resources
Thomas AhlbrandtUSGS World Energy Project Chief
Global Overview of Petroleum Resources
Thomas AhlbrandtUSGS World Energy Project Chief
NRC Workshop, Washington D.C.October 20-21, 2005
WORLD ENERGY PROJECTWORLD ENERGY PROJECT
USGS 2000 — New estimate of future world oil and gas resources-30 year time frame (1995-2025)—Not Ultimate, 1st time, 32,000 pages, documentationUndiscovered Resource Estimates are Geologically Based using Total Petroleum Systems (Fluids not just rocks)—1st timeReserve (Field) Growth are Statistically Based Estimates for the World (30 Year Forecast)-1st TimeExtensive Methodology Review and Endorsement (AAPG, NAS) 5 year project (1995-2000), 41 Employees (100 man year), transparency of methodologyWorld Energy Consortium—38 organizationsIt is a benchmark—used by the IEA, DOE (EIA); Climate Modelers (Stanford, MIT, PEW); Individuals (Cavallo, 2002; Edwards, 2002;Greene, 2004) All Information is Digital (DDS-60, 4 CDs, 13 other CDs on regional geology– 115,000 distributed), 346 publicationsWebsite (http://energy.usgs.gov)~1.2 million downloads/yr

USGS World Petroleum Assessment 2000
USGS World Petroleum Assessment 2000
Undiscovered Resources (TPS) and Reserve Growth Components
Natural Gas Revolution (the missing 0.5 TBOE of natural gas)
Calibration of USGS 2000 World Assessment
Arctic—the New Frontier
Unconventional Resources—the Barnett--Texas
Summary

THE VOCABULARY OF RESOURCE ASSESSMENT:
THE VOCABULARY OF RESOURCE ASSESSMENT:
Cumulative productionReservesReserve growthUndiscovered resources
ConventionalUnconventional (continuous)

Total Petroleum System Processes(Includes Undiscovered Resources)Total Petroleum System ProcessesTotal Petroleum System Processes(Includes Undiscovered Resources)(Includes Undiscovered Resources)
Armentrout, 20012480
120° F120° F
350° F350° FGenerationGeneration
MigrationMigration
Seal RockSeal Rock
ReservoirRockReservoirRock
OilOil
WaterWater
Gas CapGas Cap
EntrapmentEntrapment
Source Source RockRock


The Wild Card: Reserve GrowthThe Wild Card: Reserve Growth
Definition: Reserve growth is the observed increase inreserves for a particular field over time. That is, the initialestimates of reserves in many fields is lower than the ultimate volume of oil produced from that field.
Causes of reserve growth:Conservative initial estimates (SEC requirements, corporate psychology)Exploration technology (e.g., 3-D, 4-D seismic)Drilling technology (horizontal, multilateral, directional)Production technology (enhanced oil recovery)
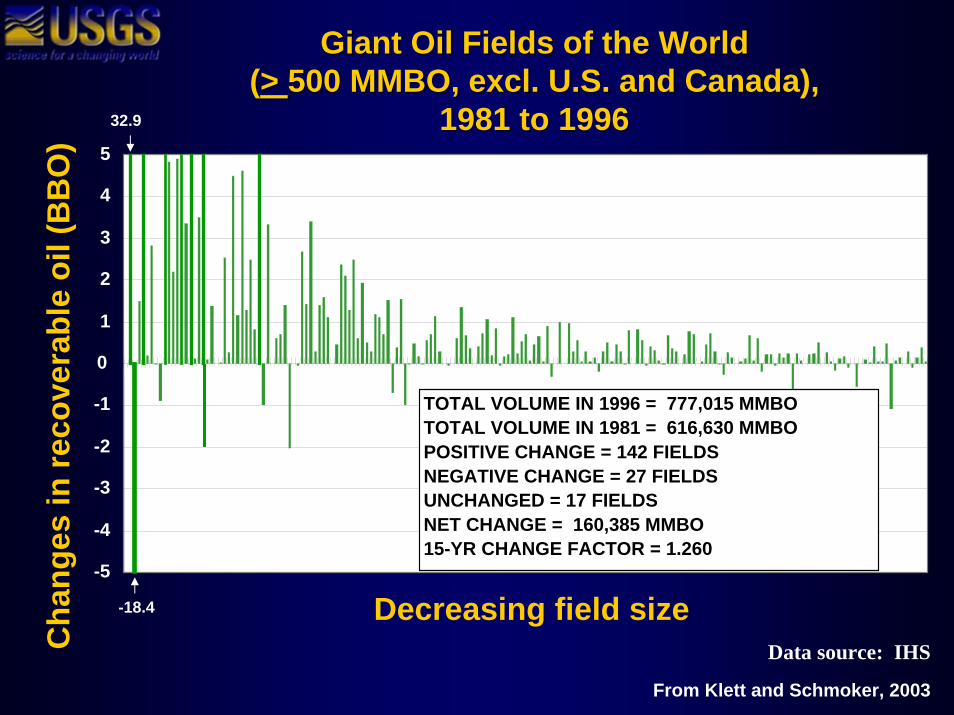
Giant Oil Fields of the World (> 500 MMBO, excl. U.S. and Canada),
1981 to 1996
Giant Oil Fields of the World (> 500 MMBO, excl. U.S. and Canada),
1981 to 1996
-5
-4
-3
-2
-1
0
1
2
3
4
5
Decreasing field size
Cha
nges
in re
cove
rabl
e oi
l (B
BO
)
32.9
-18.4
TOTAL VOLUME IN 1996 = 777,015 MMBOTOTAL VOLUME IN 1981 = 616,630 MMBOPOSITIVE CHANGE = 142 FIELDSNEGATIVE CHANGE = 27 FIELDSUNCHANGED = 17 FIELDSNET CHANGE = 160,385 MMBO15-YR CHANGE FACTOR = 1.260
Data source: IHS
From Klett and Schmoker, 2003

Relative Amount of Field Growth in Giant Oil Fields (excl. U.S. and Canada)
Relative Amount of Field Growth in Giant Oil Fields (excl. U.S. and Canada)
0
10
20
30
40
50
60
70
PER
CEN
T IN
CR
EASE
IN O
IL V
OLU
ME
1981 -1986
1986-1991
1981 -1986
1986 -1991
1991 -1996
1991 -1996
OPEC
Non-OPEC
13
28
11692
10
118
43
1981 -1996
1981 -1996
Data source: IHS (1981 through 1996)

Reserve Growth SummaryReserve Growth SummaryIn U.S. has accounted for 85% of all reserve additions in last 15 years
First time assessed for world by USGS, known for 30 years (Odell, 1973)
In USGS 2000, we estimated it to be as much as Undiscovered conventional resources (World & U.S.)– Oil Reserve Growth (688 BB)– Natural Gas Reserve Growth (3660 TCF; 610 BBOE)– NGL Reserve Growth (42 BB)

USGS 2000 Oil Endowment (graduated green color)
of assessed provinces superimposed on “Earth by Night” image

Former Soviet UnionMiddle East and North AfricaAsia PacificEuropeNorth AmericaCentral and South AmericaSub-Saharan Africa and AntarcticaSouth Asia
12345678
Conventional Oil Endowment in Billions of BarrelsLess than 1 BBO1 - 20 BBO20 - 40 BBO40 - 80 BBO80 - 160 BBOGreater than 160 BBO
Conventional Oil Endowment of the WorldConventional Oil Endowment of the World
5 1
3
76
24
8
World Petroleum Assessment 2000

USGS World Petroleum Assessment 2000 Oil (128 World Provinces & U.S., Means Billion barrels)
EFF. 1/1/96

Conventional Liquid (Oil and Natural Gas Liquids) Endowment for the Eight Regions of the World, USGS 2000
Conventional Liquid (Oil and Natural Gas Liquids) Endowment for the Eight Regions of the World, USGS 2000

USGS 2000 Natural Gas Endowment (graduated red color) of assessed provinces superimposed over “Earth at Night” Image

Conventional gas endowment
5 1
3
76
24
8
Conventional Natural Gas Endowment in Trillions of Cubic FeetLess than 6 TCF
6 - 120 TCF120 - 240 TCF240 - 480 TCF480 - 960 TCFGreater than 960 TCF
World Petroleum Assessment 2000World Petroleum Assessment 2000
Conventional Natural Gas Endowment of the WorldConventional Natural Gas Endowment of the WorldFormer Soviet UnionMiddle East and North AfricaAsia PacificEuropeNorth AmericaCentral and South AmericaSub-Saharan Africa and AntarcticaSouth Asia
12345678

USGS World Petroleum Assessment 2000 Natural Gas (128 World Provinces & U.S.,
Means Billion barrels oil equivalent [BBOE]) EFF. 1/1/96

Conventional Natural Gas Endowment for the Eight Regions of the World, USGS 2000
Conventional Natural Gas Endowment for the Eight Regions of the World, USGS 2000

USGS 2000 World Petroleum Endowment (128 World Provinces & U.S.)
(Conventional Oil, Natural Gas, NGL, Means in Billion Barrels, EFF. 1/1/96)
BB
OE
5,912
Ahlbrandt, 2002

The Coming Oil Crisis?The Coming Oil Crisis?
“..the peak of production will soon be passed—possibly within three years—Dave White, Chief Geologist, USGS, 1919
“the peak of production will be reached in 1989, Campbell, 1989; prior to 2000”—Campbell, 1994; Duncan, 1997;“in 2004”—Campbell, 1997; “in 2010”, Campbell, 2000--subsequently very dire consequences—most people die, we return to caves-- “OlduvaiTheory”
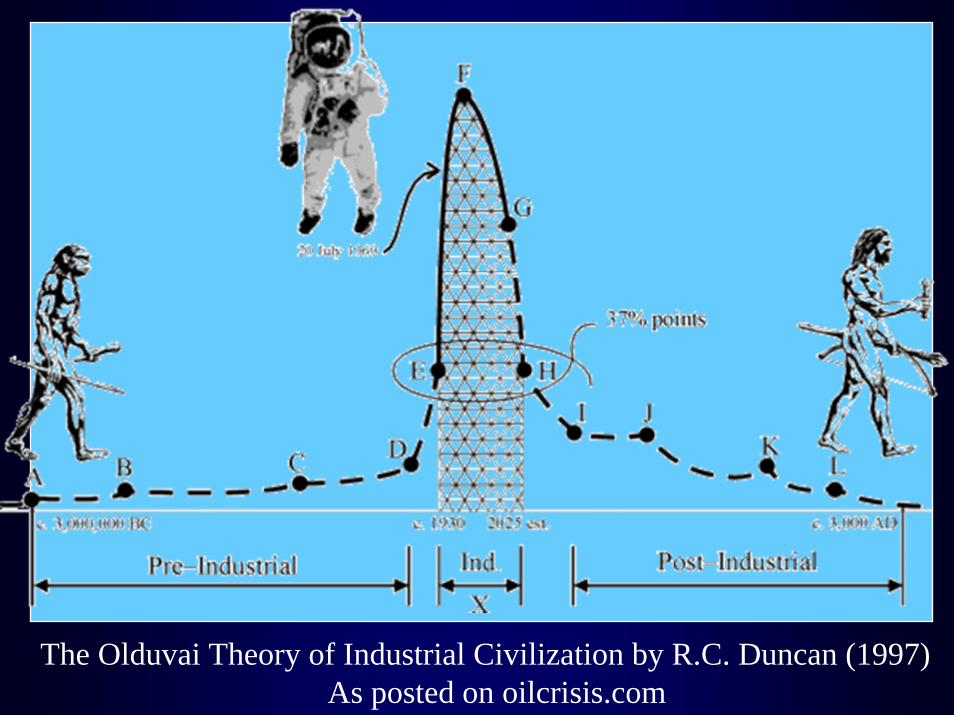
The Olduvai Theory of Industrial Civilization by R.C. Duncan (1997)As posted on oilcrisis.com


World Oil SupplyWorld Oil Supply
Hubbert, 19691 x 109 bbls - 1 BBO

Logistic growth curves of cumulative production and their derivatives which give the rates of production
Logistic growth curves of cumulative production and their derivatives which give the rates of production
Hubbert, 1959
(b) multiple-cycle curve(b) multiple-cycle curve(a) single-cycle curve(a) single-cycle curve


Recent Oil and Natural Gas Reserve EstimatesRecent Oil and Natural Gas Reserve Estimates
Oil & Gas Journal, 2003
700
800
900
1000
1100
1200
1300
1994 1995 1996 1997 1998 1999 2000 2001 2002 2003
YEARS
BB
OE
World gas in BBOE
World oil in BBO
OPEC oil in BBO

Published Estimates of World Oil Ultimate RecoveryPublished Estimates of World Oil Ultimate Recovery
0 0.5 1 1.5 2 2.5 3 3.5 4
Trillions of Barrels
USGS 5% 2000USGS Mean 2000USGS 95% 2000Campbell 1995Masters 1994Campbell 1992Bookout 1989Masters 1987Martin 1984Nehring 1982Halbouty 1981Meyerhoff 1979Nehring 1978Nelson 1977Folinsbee 1976Adams & Kirby 1975Linden 1973Moody 1972Moody 1970Shell 1968Weeks 1959MacNaughton 1953Weeks 1948Pratt 1942
Source: Campbell, EIA

Comparison of World Oil and Natural Gas Resource Endowment Estimates
Comparison of World Oil and Natural Gas Resource Endowment Estimates
Ahlbrandt et al., 2005

World OilWorld OilWorld Petroleum Reserves are at all time high about 5 times larger than reserves at end of WWII (1945)
Remaining Reserves ~891 BBO (1/1/96), 1,100 BBO (1/1/2001)—Increase of 15% using IHS Data
Increase of 36% using 2003 O&J Data (includes 175 BBO from Canadian tar sands)
Currently Consuming about 28 BBO / Year
Oil and Natural Gas Reserve Additions Are Increasing

64.352.9
28.636.7
7.2
10.4
0%
10%
20%
30%
40%
50%
60%
70%
80%
90%
100%
Reserves Reserves + Undiscovered
PER
CEN
T O
F O
IL R
ESO
UR
CES
other
OECD
OPEC
Possible Changes in Organization Share of OilPossible Changes in Organization Share of Oil

OR is it Natural Gas?OR is it Natural Gas?
Much less utilized worldwide than oil (11% produced vs. 23% for oil)
LNG and GTL technology make it increasingly viable—The Natural Gas Revolution
Environmental benefits or detriments
The conventional / unconventional linkage
Where is the missing half trillion BOE of gas?

USGS 2000 CalibrationUSGS 2000 CalibrationIn seven years, 23% of oil and and 31% of natural gas USGS 2000 estimates (whole world) have been realized
18% of estimated oil and 27% of estimated natural gas have been added (Only provinces assessed)
Reserve growth added three times the volumes of new field discoveries– 26% of estimated oil volume – 52% of estimated natural gas volume
USGS 2000 estimates seem reasonable assuming linear rated of reserve additions

Calibration of USGS Oil and Natural Gas Estimates1st 7 Years of 30 year forecast
Calibration of USGS Oil and Natural Gas Estimates1st 7 Years of 30 year forecast
Klett et al., in press

Oil Reserve Additions: Reserve Growth vs. Undiscovered
Oil Reserve Additions: Reserve Growth vs. Undiscovered
Klett et al., in press

Natural Gas Reserve Additions: Reserve Growth vs. Undiscovered
Klett et al., in press
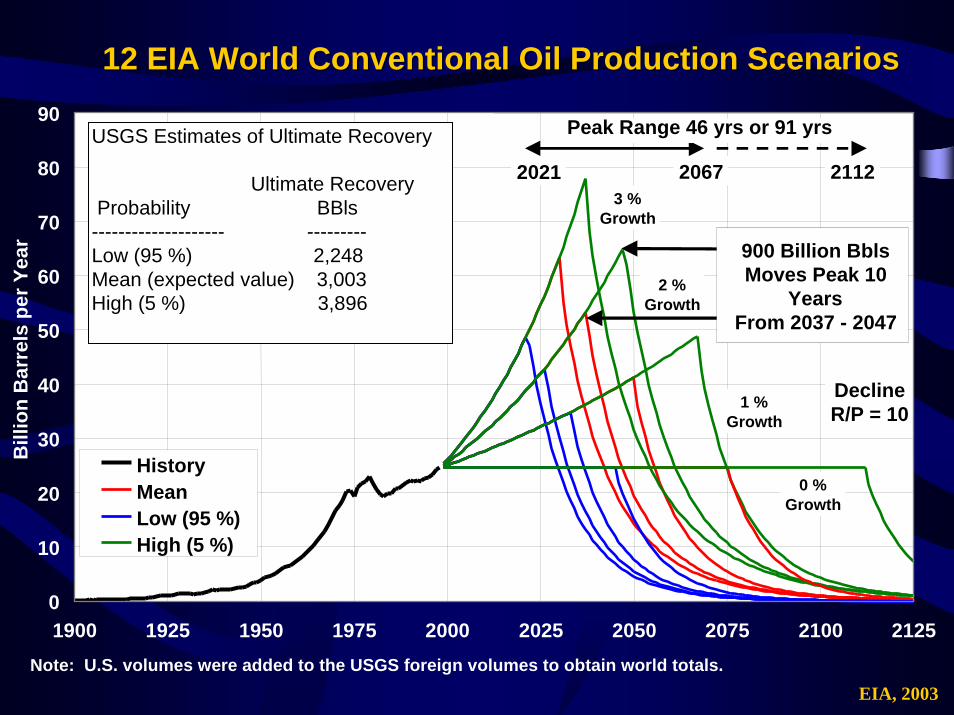
12 EIA World Conventional Oil Production Scenarios12 EIA World Conventional Oil Production Scenarios
0
10
20
30
40
50
60
70
80
90
1900 1925 1950 1975 2000 2025 2050 2075 2100 2125
Bill
ion
Bar
rels
per
Yea
r
HistoryMeanLow (95 %)High (5 %)
3 %Growth
1 %Growth
Peak Range 46 yrs or 91 yrs
2021 2067
USGS Estimates of Ultimate Recovery
Ultimate RecoveryProbability BBls-------------------- ---------Low (95 %) 2,248Mean (expected value) 3,003High (5 %) 3,896
2 %Growth
0 %Growth
DeclineR/P = 10
2112
Note: U.S. volumes were added to the USGS foreign volumes to obtain world totals.
900 Billion BblsMoves Peak 10
YearsFrom 2037 - 2047
EIA, 2003
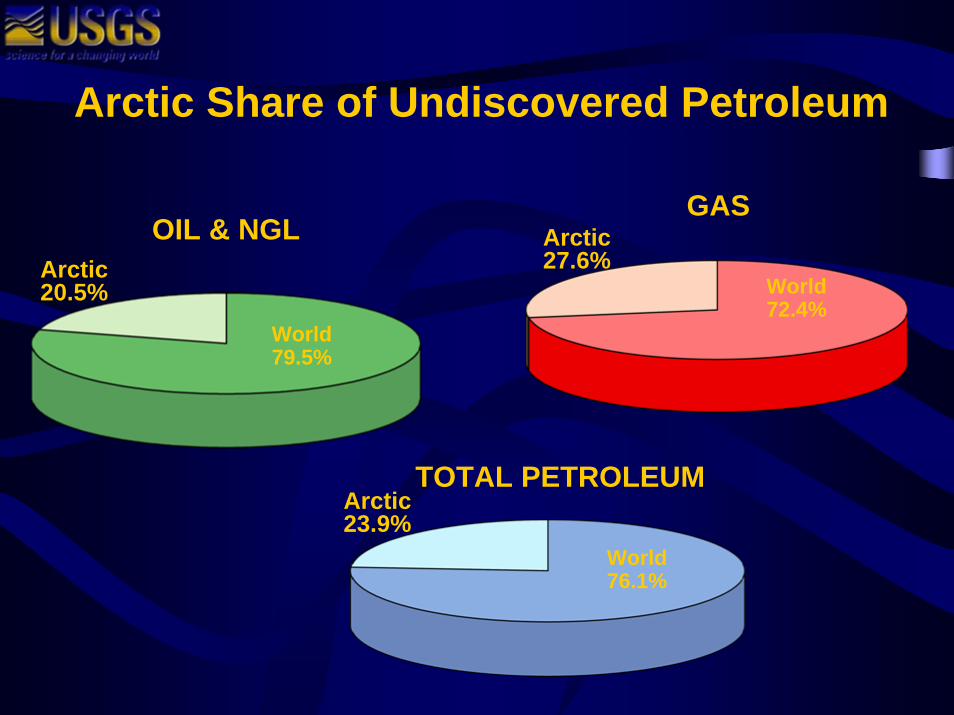
Arctic Share of Undiscovered Petroleum
OIL & NGLGAS
TOTAL PETROLEUM
Arctic20.5%
World79.5%
Arctic27.6%
World72.4%
Arctic23.9%
World76.1%

Arctic Provinces for Study in 2002Arctic Provinces for Study in 2002
Pacific Ocean

Open File Report 97-470-J
Open File Report 97-470-J

The Barnett Shale is a Continuous (Unconventional) Type Accumulation
The Barnett Shale is a Continuous The Barnett Shale is a Continuous (Unconventional) Type Accumulation(Unconventional) Type Accumulation
From Pollastro and others (2003)From Pollastro and others (2003)
Barnett Shale continuous
accumulation
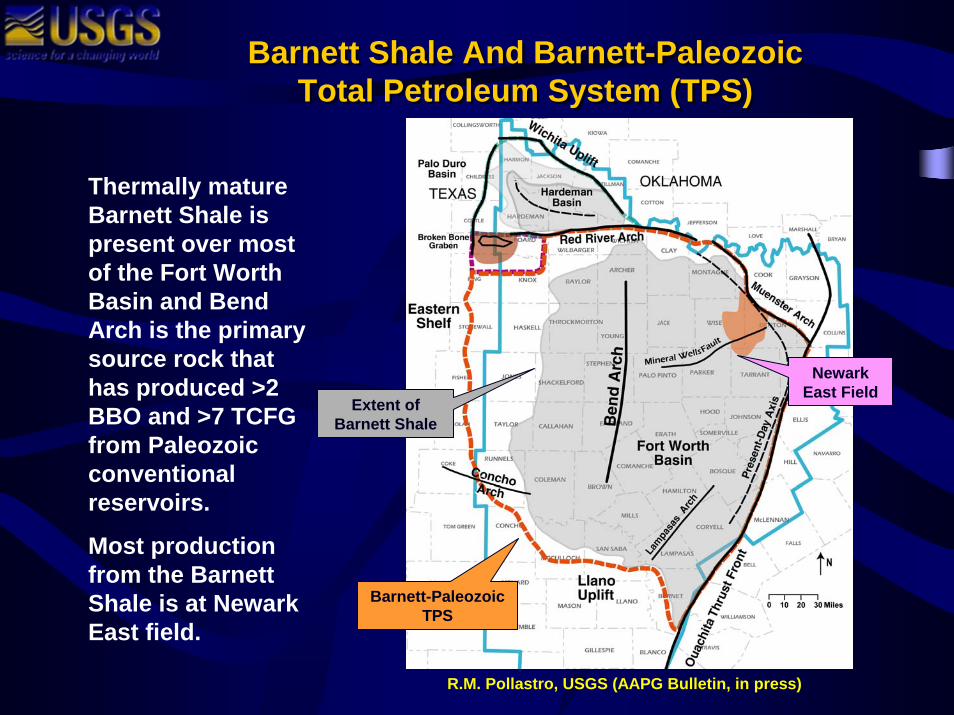
Barnett Shale And Barnett-PaleozoicTotal Petroleum System (TPS)
Barnett Shale And Barnett-PaleozoicTotal Petroleum System (TPS)
Thermally mature Barnett Shale is present over most of the Fort Worth Basin and Bend Arch is the primary source rock that has produced >2 BBO and >7 TCFG from Paleozoic conventional reservoirs.
Most production from the Barnett Shale is at Newark East field.
R.M. Pollastro, USGS (AAPG Bulletin, in press)
Newark East Field
Extent of Barnett Shale
Barnett-Paleozoic TPS

Stratigraphic Perspective Of Barnett-Paleozoic TPS
Stratigraphic Perspective Of Barnett-Paleozoic TPS
The Barnett Shale is The Barnett Shale is the source rock for the source rock for both indigenous gas both indigenous gas and most and most conventional conventional oiloil and and naturalnatural gasgas produced produced from Ordovician to from Ordovician to Permian age Permian age carbonatecarbonate-- and and clasticclastic--rock rock reservoirs in the Fort reservoirs in the Fort Worth BasinWorth Basin--Bend Bend Arch area and thus, Arch area and thus, defines a Barnettdefines a Barnett--Paleozoic TPS.Paleozoic TPS.
From Pollastro (2003)

USGS Barnett Shale – Assessment ResultsUSGS Barnett Shale – Assessment Results
Greater Newark East Barnett AU: 14.6 TCFGExtended Barnett Shale AU: 11.6 TCFG
Total Mean Undiscovered Resource: 26.2 TCFG
(from Pollastro and others, 2004)

A Prospective Depletion Curve for the World's Conventional and Non-Conventional Oil to 2080A Prospective Depletion Curve for the World's
Conventional and Non-Conventional Oil to 2080
Odell, 1998

Arthur Green / ExxonMobil, 2004
An Energy ScenarioAn Energy ScenarioA Complex Story of Interacting Variables and Uncertain Reserve FiguresA Complex Story of Interacting Variables and Uncertain Reserve Figures

(TPS) Estimates of Future Oil and Gas Resources made by USGS in 2000 are reasonable and on trend
is three times more significant than new field discoveries. Large potential in Middle East, Volga Urals, West Siberia, Algeria, North Sea– USGS detailed studies2015-2020 Oil Peak for Non-OPEC oil using USGS 2000?OPEC undiscovered largely onshore, OECD and others
largely offshore and undiscovered resources less concentrated in OPEC compared to previous estimates. The Arctic is the next frontier (21 new provinces)Transition to natural gas is occurring, is the missing half Trillion BOE of natural gas in the Arctic?Increasing Emphasis on Unconventional Resources
Summary Summary