Embed Size (px)
Citation preview
Ocean Systems Engineering, Vol. 5, No. 3 (2015) 139-160
DOI: http://dx.doi.org/10.12989/ose.2015.5.3.139 139
Copyright © 2015 Techno-Press, Ltd.
http://www.techno-press.org/?journal=ose&subpage=7 ISSN: 2093-6702 (Print), 2093-677X (Online)
Global performances of a semi-submersible 5 MW wind-turbine including second-order wave-diffraction effects
H.C. Kim1 and M.H. Kim2
1Texas A&M University, College Station, TX 77843, USA
2Civil Engineering, Texas A&M University, College Station, TX 77843, USA
(Received May 17, 2015, Revised August 19, 2015, Accepted August 27, 2015)
Abstract. The global performance of the 5 MW OC4 semisubmersible floating wind turbine in random waves was numerically simulated by using the turbine-floater-mooring fully coupled and time-domain dynamic analysis program FAST-CHARM3D. There have been many papers regarding floating offshore wind turbines but the effects of second-order wave-body interactions on their global performance have rarely been studied. The second-order wave forces are actually small compared to the first-order wave forces, but its effect cannot be ignored when the natural frequencies of a floating system are outside the wave-frequency range. In the case of semi-submersible platform, second-order difference-frequency wave-diffraction forces and moments become important since surge/sway and pitch/roll natural frequencies are lower than those of typical incident waves. The computational effort related to the full second-order diffraction calculation is typically very heavy, so in many cases, the simplified approach called Newman‟s approximation or first-order-wave-force-only are used. However, it needs to be justified against more complete solutions with full QTF (quadratic transfer function), which is a main subject of the present study. The numerically simulated results for the 5 MW OC4 semisubmersible floating wind turbine by FAST-CHARM3D are also extensively compared with the DeepCWind model test results by Technip/NREL/UMaine. The predicted motions and mooring tensions for two white-noise input-wave spectra agree well against the measure values. In this paper, the numerical static-offset and free-decay tests are also conducted to verify the system stiffness, damping, and natural frequencies against the experimental results. They also agree well to verify that the dynamic system modeling is correct to the details. The performance of the simplified approaches instead of using the full QTF are also tested.
Keywords: wind energy; FOWT (Floating Offshore Wind Turbine); OC4 semi-submersible; dynamic
coupling; mooring tension; second order wave diffraction effect; QTF; FAST-CHARM3D; 5 MW
wind-turbine; viscous drag
1. Introduction
The importance of more clean renewable energy has been underscored to secure new energy
source and protect environments. Especially, wind energy is appealing since it is economically
competitive, technologically proven, infinitely renewable, and does not make any waste or carbon
Corresponding author, Ph.D. Student, E-mail: [email protected] a Professor, E-mail: [email protected]

H.C. Kim and M.H. Kim
emission. Recently, several countries installed offshore floating wind turbines (Dominique et al.,
2010). Although they are considered to be more difficult to design than fixed offshore wind
turbines, floating wind turbines have many advantages compared to onshore or bottom fixed
offshore wind turbines. In general, they are less restricted by regulation, with higher-quality wind,
and less sensitive to space/size/noise/visual/foundation restrictions. In this regard, if the
technology is completely developed, floating offshore wind turbines are expected to be more
popular to generate considerable amounts of clean renewable energy at competitive prices
compared to other energy sources (Henderson et al. 2002, Henderson et al. 2004, Musial et al.
2004, Tong 1998, Wayman et al. 2006).
One of the challenging issues on the floating offshore wind turbine is the coupled dynamics
analysis among the mooring system, floating platform, and wind turbine. Therefore, for reliable
design, it is necessary to develop the integrated tool to accurately analyze the fully coupled
dynamics including control. Some efforts are in progress toward this direction for several selected
types of floating offshore wind turbines. In this paper, the global performance analysis of the OC4
5-MW semi-submersible floating wind turbine was conducted by the fully coupled dynamic
analysis tool, the combination of FAST (e.g., Jonkman 2004) and CHARM3D (e.g., Yang and Kim
2010, Kang and Kim 2012), developed by the second author‟s research group (e.g., Bae and Kim
2011, 2014). Previously, NREL organized the Offshore Code Comparison Collaboration (OC4)
(Robertson et al. 2012) in order to verify the accuracy of offshore wind turbine dynamics
simulation codes by comparing results among various numerical tools and against systematically
obtained experimental results.
For the OC4 semi-submersible case, Masciola et al. (2013) analyzed the system by including
only linear wave force and using quasi-static or lumped-mass methods for mooring model. Also,
Coulling et al. (2013a, b) performed the validation for the semi-submersible platform including
second-order wave-diffraction forces based on Newman‟s approximation. However, the mooring
model in the analysis was also quasi-static, so the true dynamic coupling with mooring lines was
missing in the study. Besides, the second-order wave-diffraction force was approximated by
Newman‟s approximation method, and thus, there is a need to check the results by using the actual
second
-order wave-diffraction forces. Recently, Koo et al. (2014a) analyzed the OC4
semisubmersible wind turbine and compared their numerical predictions by their own code,
MLTSIM-FAST against DeepCWind model test results. Moreover, the second-order
wave-diffraction effects were briefly introduced and discussed in their work (Koo et al. 2014b).
On the other hand, Zhao and Wan carried out motion simulations of the OC4 semi-submersible
platform in waves by using their own CFD code, naoe-FOAM-SJTU. (Zhao and Wan 2015).
In this paper, the fully coupled wind-turbine/hull/mooring dynamics of the OC4
semi-submersible model are calculated by including viscous and second-order
difference-frequency wave effects with FE(finite element)-based mooring dynamics module. Also,
the complete second-order results (Kim and Yue 1989, 1990, 1991) are compared with
first-order-wave-force-only results, Newman‟s approximation results, and DeepCWind model test
results (Coulling et al. 2013b). The numerically modeled dynamic system was fully identified
through the static-offset and free-decay tests. The system was further analyzed for irregular waves
represented by white-noise input-wave spectra and the results were validated against experimental
results. For the numerical examples shown in this paper, wind and current are not included to
reduce the factors of uncertainties in the comparisons between numerical prediction and model test.
The turbine-floater-mooring fully coupled dynamic analysis including blade control and
wind-wave-current will be the subject of the next study after this kind of initial validation done in
140

Global performances of a semi-submersible 5 MW wind-turbine including second-order…
this paper.
2. Numerical simulation in time domain
In order to solve a wind turbine on a single floating platform, FAST (e.g., Jonkman and Buhl Jr.
2004), developed by National Renewable Energy Laboratory (NREL), was modified and extended
so that it can calculate the full coupled dynamics among wind turbine, floating platform, and
mooring lines. The coupled dynamic response between the turbine and floater can be derived from
the full-DOF matrix equation including floater 6-DOFs and additional multi-wind-turbine DOFs
with proper platform-turbine coupling terms. The combined left-hand-side matrix with the given
forcing functions in the right-hand side is solved at each time step. Assuming that every degree of
freedom for a three-bladed turbine in FAST is turned on, the total DOFs can be expressed as 6 (for
floater) +19 (for turbine)=25. The coupled terms between the floating platform and turbine in the
coefficient matrix can be derived by accounting for every effect of generalized inertia and active
forces from both bodies. The detailed theory and equations are given in Bae and Kim (2014)
Between the floater and mooring line dynamics, the necessary data exchange is also done at
each time step for their dynamic coupling. The hydro-dynamic loadings and instantaneous tensions
for mooring lines are obtained from CHARM3D (e.g., Kim et al. 2001, Tahar and Kim 2003, Yang
and Kim 2010) along with viscous forces on Morison members and convolution-integral forces for
floater. They are fed to FAST at each time step. The transferred external forces include first-order
and second-order wave forces. Then FAST fills out the forcing function of the platform DOFs
using those transferred forces, and solves displacements, velocities, and accelerations of all the
degrees of freedom including elastic responses of towers and blades. The obtained platform
displacement and velocity data are then fed into CHARM3D side to update the external forces.
The instantaneous velocites of the platform are used for the next-time-step convolution–integral
term. The instantaneous positions of the platform‟s Morison members are used for viscous drag
forces with instantaneous incident-wave kinematics. The transferred instantaneous positions of the
mooring-connection points are used as an input for the next-time-step mooring dynamics. The
basic concept of rotor-floater coupling is schematically shown in Fig. 1.
3. Second-order wave loads and convolution integral in time domain
In this section, the time-domain realization of the first- and second-order wave forces/moments
in a random sea environment is explained. The first- and second-order hydrodynamic
forces/moments on a body caused by stationary Gaussian random seas can be written as a
two-term Volterra series in the time domain as follows
Fig. 1 Basic concept of FAST-CHARM3D coupling
141

H.C. Kim and M.H. Kim
𝐹(1)(𝑡) + 𝐹(2)(𝑡) = ∫ ℎ1(𝜏)𝜂(𝑡 − 𝜏)𝑑𝜏∞
−∞+ ∫ ∫ ℎ2(𝜏1, 𝜏2)𝜂(𝑡 − 𝜏1)𝜂(𝑡 − 𝜏2)𝑑𝜏1𝑑𝜏2
∞
−∞
∞
−∞ (1)
Where 𝜂(𝑡) is the ambient wave free surface elevation at a reference position, ℎ1(𝑡) is the
linear impulse response function, and ℎ2(𝜏1, 𝜏2) is the quadratic impulse response function. The
above equation can be expressed in the form of the summation of N frequency component waves
as below
𝐹𝐼(1)(𝑡) = 𝑅𝑒[∑ 𝐴𝑗𝐿(𝜔𝑗)𝑒
𝑖𝜔𝑡𝑁𝑗=1 ] (2)
𝐹𝐼(2)(𝑡) = 𝑅𝑒[∑ ∑ 𝐴𝑗𝐴𝑘
∗𝐷(𝜔𝑗, −𝜔𝑘)𝑒𝑖𝜔−𝑡𝑁
𝑘=1𝑁𝑗=1 ] (3)
Where 𝐿(𝜔𝑗) represents the linear force transfer function (LTF), A is wave amplitude, and
𝐷(𝜔𝑗, −𝜔𝑘) is the difference-frequency quadratic transfer functions (QTF). The sum-frequency
second-order forces/moments are not included in (3) since they play little role for the overall
dynamics of semisubmersible platform. On the other hand, 𝐹𝐼(2)(𝑡) can be rewritten by
Newman‟s approximation as following equation.
𝐹𝐼(2)(𝑡) = 𝑅𝑒 *∑ ∑ 𝐴𝑗𝐴𝑘
∗𝐷 (𝜔𝑗+𝜔𝑘
2,𝜔𝑗+𝜔𝑘
2) 𝑒𝑖𝜔
−𝑡𝑁𝑘=1
𝑁𝑗=1 + (4)
The radiation-potential-induced force/moment in time domain can be expressed as follows
𝐹𝑅(𝑡) = −𝑀𝑎 (∞) 𝜁̈(𝑡) − ∫ 𝑅(𝑡 − 𝜏)𝜁̇(𝜏)𝑑𝜏
𝑡
−∞ (5)
Where ζ is platform motion, upper dot is time derivative, 𝑀𝑎(∞) is the added mass of
platform at infinite frequency, and 𝑅(𝑡) is retardation function or time-memory function, which is
related to the frequency-domain solutions of the radiation problem as follows
𝑅(𝑡) =2
𝜋∫ 𝐶(𝜔)∞
0
𝑠𝑖𝑛𝜔𝑡
𝜔𝑑𝜔 (6)
Where 𝐶(𝜔) is the radiation-wave-induced damping coefficient at frequency 𝜔.
The total wave loads in time domain can then be written by summing all the force components
as below.
𝐹𝑡𝑜𝑡𝑎𝑙(𝑡) = 𝐹𝐼(𝑡) + 𝐹𝑅(𝑡) (7)
where the total wave exciting force 𝐹𝐼(𝑡) = 𝐹𝐼(1)(𝑡) + 𝐹𝐼
(2)(𝑡).
4. DeepCWind semisubmersible wind-turbine model description
Table 1 and Fig. 2 show the floating platform properties and DeepCwind offshore wind-turbine
geometry, respectively. (Coulling et al. 2013) The property in Table 1 is about only the floating
platform, and the wind turbine part is not included. The wind turbine is based on NREL 5 MW
baseline turbine (Jonkman et al. 2007), but it is modified for a 1/50th scale model test. (Coulling et
al. 2013).
142

Global performances of a semi-submersible 5 MW wind-turbine including second-order…
Fig. 2 DeepCwind Semisubmersible platform geometry front view (left) and Top view (right) (Coulling et
al. 2013)
Table 1 offshore floating platform property
ITEM Unit Value
Platform Center of Mass m -14.4
Platform Mass ton 1.3444E+04
Platform Inertia Ixx, Iyy kg-m2 8.0110E+09
Platform Inertia Izz kg-m2 1.3910E+10
Nacelle and blade Mass ton 397.1
Tower Mass ton 302.2
5. Numerical modeling
The x-axis symmetry is used and the half domain is discretized by 3600 panels. Panels near the
free surface are more finely modeled as shown in Fig. 3. The convergence test with a finer model
was carried out and it was checked that the added mass, radiation damping, and linear- and
second-order wave forces were converged satisfactorily for the present application. The
potential-based hydrodynamic coefficients and excitations are calculated by WAMIT in a
frequency domain, and they are subsequently used for time-domain simulations for
FAST-CHARM3D. Also, the viscous force is added using drag-force formula for Morison
members i.e., the braces that connect between columns and pontoons are modeled as Morison
members. Since the crossflow drag forces are proportional to relative velocities squared, they can
contribute both for excitation and damping. The viscous drag forces on members above MWL are
143

H.C. Kim and M.H. Kim
also evaluated at each time step by using the instantaneous wave kinematics extrapolated from the
values at MWL. In this study, uniform extrapolation is used for that purpose. The nonlinear
viscous drag forces evaluated at instantaneous platform positions also contribute to nonlinear
motion components with higher harmonics.
6. Added mass and radiation damping
The added mass and radiation damping can be calculated with the body-surface panels of Fig. 3
by using the first-order WAMIT program. The mooring stiffness matrix is obtained from the static
offset test. The viscous damping matrix for the hull can also be obtained from the free-decay test.
The total mass matrix is obtained by combining platform and wind-turbine weights. Then, the
WAMIT is executed again with the new mooring-stiffness matrix and hull viscous damping matrix
to obtain platform motions. The second-order wave forces depend on the first-order motions, and
in this manner, the second-order difference-frequency wave forces can be calculated more
accurately. The hydrodynamic added mass and radiation damping values for the six DOFs of the
platform are shown in Fig, 4. As expected, toward the high wave frequency, the added mass
converges to a constant value, while radiation damping becomes negligibly small.
7. Wind turbine modeling
The adopted model of 5 MW turbine is the „National Renewable Energy Laboratory (NREL)
offshore 5 MW baseline wind turbine‟. The flexibility of tower is included by using a linear modal
representation as suggested in ARTP. Two fore-aft and two side-to-side mode shapes of tower and
two flap-wise modes and one edgewise mode of blades are used for coupled dynamic analysis. The
natural frequencies of those elastic modes are much higher than the wave and floater-motion
frequencies. Tower base is located at the 10 m height from the MWL, so the flexibility of tower
begins from that height. The details of the tower-blade-control models can be found in Bae and
Kim (2014). It is well known that in the case of semisubmersible-type floater, the flexibility of
tower does not play a significant role in overall dynamics especially in the absence of wind.
8. Mooring modeling
The mooring system is composed of equally-spread three catenary lines. The mooring modeling
is done by a pre-processor HARP of CHARM3D code. To satisfy the static equilibrium, the total
buoyancy of the platform should be the same as the sum of the total structure weight and the
vertical-component tension of the mooring system, as shown in Table 3. The high-order finite
rod-element method was used for the mooring dynamics modeling, the details of which are given
in Kim et al. (2001) and Tahar & Kim (2003). The drag coefficient used for the chain mooring was
2.4. The mooring line property is tabulated at Table 2, and the anchor points are tabulated in Table
4.
144

Global performances of a semi-submersible 5 MW wind-turbine including second-order…
Fig. 3 Numerical Model for potential-flow calculation for OC4 platform
Table 2 Mooring properties
Mooring Type Chain
Mooring Axial Stiffness MN 753.6
Unstretched Mooring Line Length m 835.5
Mooring Mass Density (Dry) kg/m 113.35
Mooring Mass Density (Wet) Kg/m 108.63
Seabed Friction Coefficient 1
Mooring Drag Coefficient 2.4
Mooring Added-Mass Coefficient 1
Table 3 vertical-plane static equilibrium
Platform + Tower Weight(N) 1.38703E+08
Buoyancy(N) 1.40589E+08
Total Vertical Tension(N) 1.88612e+06
Table 4 Anchor points
#1 Anchor Point : (418.8, 725.4, -200)
#2 Anchor Point : (-837.6, 0, -200)
#3 Anchor Point : (418.8, -725.4, -200)
145

H.C. Kim and M.H. Kim
Fig. 4 Hydrodynamic added mass and radiation damping
9. Static offset test
To find the system stiffness, the static offset test for the mooring is numerically done by using
FAST-CHARM3D and the relationships between loads and displacements of 6DOFs are shown in
Figs. 7-9. The slopes of the curves for heave, roll, and pitch are almost constants because their
hydro-static restoring forces are dominant over mooring contributions. However, the slopes for
surge and sway increase with displacements showing highly nonlinear hardening behaviors, since
it is mostly given by mooring line. The stiffness matrix for small displacements obtained from the
static offset is used for WAMIT calculation as an external stiffness in the frequency domain
calculations. The total restoring forces in Figs. 7-9 include both hydrostatic and mooring restoring
forces. Also, the stiffness of surge and taut/slack side mooring top-tension in the numerical
simulation are compared to the model test results in Fig. 6, and they agree very well.
146

Global performances of a semi-submersible 5 MW wind-turbine including second-order…
Fig. 5 mooring system modeling by HARP (left) and the mooring arrangement (right)
Fig. 6 Comparison of the static offset (Top), taut side line tension (Middle), and slack side line
tension(Bottom) between numerical result and measurement data
147

H.C. Kim and M.H. Kim
Fig. 7 Load-displacement relationships for the mooring system for surge(left) and sway(right)
Fig. 8 Load-displacement relationships for the mooring system for Heave (left) and roll (right)
Fig. 9 Load-displacement relationships for the mooring system for pitch (left) and yaw (right)
148

Global performances of a semi-submersible 5 MW wind-turbine including second-order…
10. Free-decay test
System natural frequency and damping can be found from free-decay tests. The free-decay test
was numerically simulated by FAST-CHARM3D. Various drag coefficients are used to find the
appropriate values against experiments. Hull viscous damping for surge mostly comes from the
columns. When the column‟s drag coefficient is 1.6, the simulation results match well against the
experimental results. When Cd is zero, only potential-based radiation damping contributes. The
majority of heave damping comes from the footings of each column. When its drag coefficient is
3.2, the simulation results agree well with the measurement. The inertia and drag forces on braces
are calculated by Morison equation, and added mass coefficient=1.0 and drag coefficient=1.6 are
used. The empirical values used in the numerical simulations are tabulated in Table 5. The natural
frequencies of the surge and heave simulations are almost the same as the experimental results, as
can be seen in Table 6 and Fig. 10. The pitch natural periods of simulation are slightly off
compared to the measurements but the difference is small. It may be caused by the slight mismatch
of mass distribution and center of gravity, which can easily be produced by inaccurate model
fabrication or additional cables in experiment, between the prediction and measurement. It should
also be reminded that the added mass can be slightly altered too in the real fluid due to viscous
effect. The comparisons of free-decay results between simulation and measurement are plotted in
Fig. 10 and the natural frequencies are tabulated in Table 6.
From the free-decay test, system damping ratio can also be obtained. The total-damping ratios
are obtained using the concept of logarithmic decrement. The radiation damping ratios are
calculated from the same method when drag coefficients are zeros. The viscous damping is
obtained by subtracting the radiation damping from the total damping. The respective values are
tabulated in Table 7. It is seen that the hull viscous damping plays more important role than the
radiation damping and should be included in the motion simulation.
Table 5 Coefficients for Morison member
Drag Coefficient Added Mass Coefficient
Column 1.6 N/A (included in radiation model)
Footing 3.2 N/A (included in radiation model)
Brace 1.6 1
Table 6 Natural frequencies
Natural frequencies(rad/sec)
DOF FAST-CHARM3D Model Test
Surge 0.0556 0.0555
Heave 0.3605 0.3641
Pitch 0.2381 0.2277
149

H.C. Kim and M.H. Kim
Table 7 Damping ratio
Total Damping Viscous Damping Radiation Damping
Surge 12.11% 8.30% 3.81%
Heave 6.66% 5.91% 0.75%
Pitch 6.43% 4.49% 1.94%
Yaw 8.94% 6.91% 2.03%
Fig. 10 Surge (Top), Heave (Middle), and Pitch (Bottom) Free decay results
150

Global performances of a semi-submersible 5 MW wind-turbine including second-order…
Fig. 11 Free-surface panels for the calculation of second-order wave-force QTFs
11. Second-order diffraction/radiation effects
Since the surge-pitch natural frequencies of the semi-submersible are lower than typical wave
frequencies, the second-order difference-frequency wave loadings may play an appreciable role. In
this regard, the second-order difference-frequency wave force QTFs (quadratic transfer functions)
are calculated by the second-order WAMIT program (e.g., Lee et al. 1991). For this, additional
free-surface panels are needed. A total of 4888 panels were used for the free surface up to the
truncation radius, as can be seen in Fig. 11. The truncation radius of the free-surface circular
region is 80 m. The convergence check was also carried out with the increased number of
free-surface panels.
Fig. 12 contour plot (left) and 3d graph (right) of the surge QTF
151
H.C. Kim and M.H. Kim
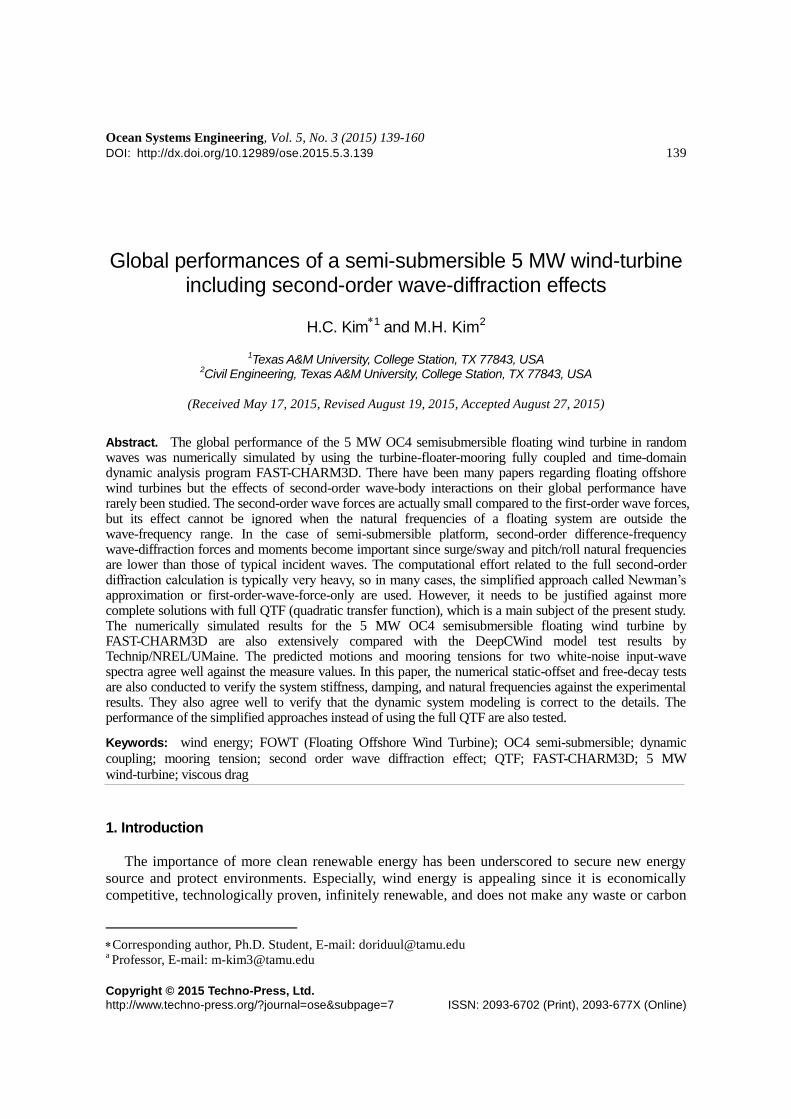
Fig. 13 contour plot (left) and 3d graph (right) of the Heave QTF
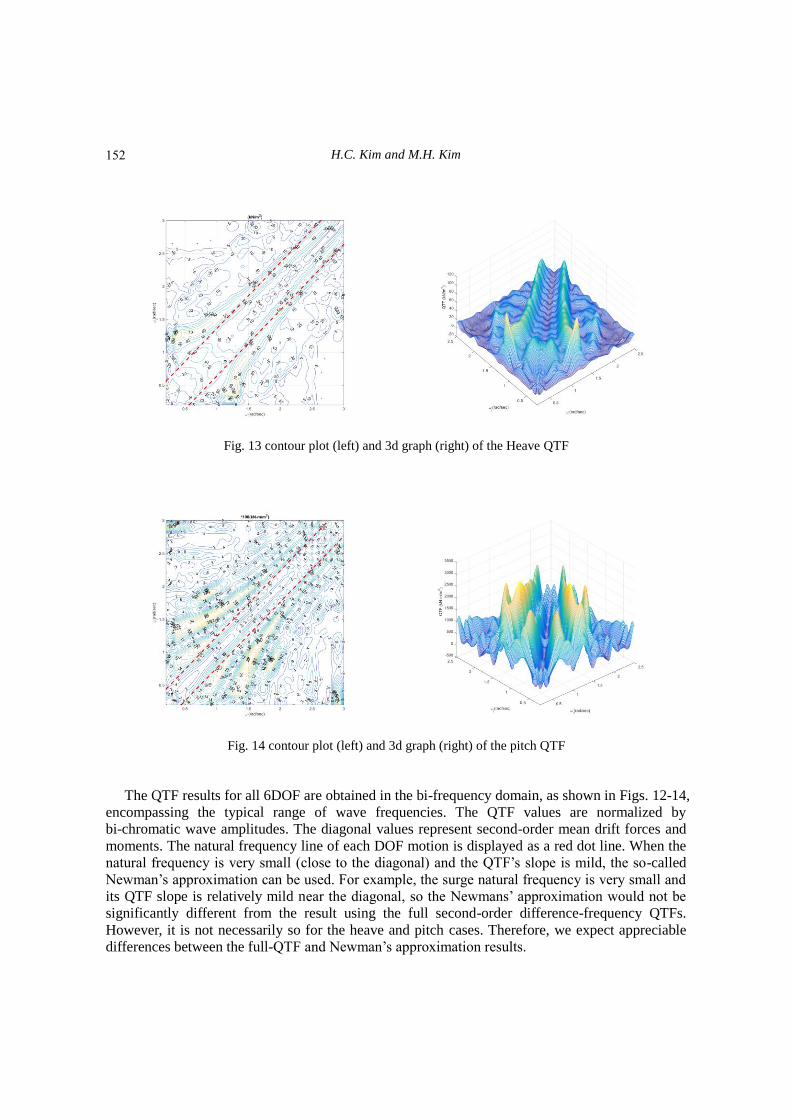
Fig. 14 contour plot (left) and 3d graph (right) of the pitch QTF
The QTF results for all 6DOF are obtained in the bi-frequency domain, as shown in Figs. 12-14,
encompassing the typical range of wave frequencies. The QTF values are normalized by
bi-chromatic wave amplitudes. The diagonal values represent second-order mean drift forces and
moments. The natural frequency line of each DOF motion is displayed as a red dot line. When the
natural frequency is very small (close to the diagonal) and the QTF‟s slope is mild, the so-called
Newman‟s approximation can be used. For example, the surge natural frequency is very small and
its QTF slope is relatively mild near the diagonal, so the Newmans‟ approximation would not be
significantly different from the result using the full second-order difference-frequency QTFs.
However, it is not necessarily so for the heave and pitch cases. Therefore, we expect appreciable
differences between the full-QTF and Newman‟s approximation results.
152
Global performances of a semi-submersible 5 MW wind-turbine including second-order…
12. Case studies
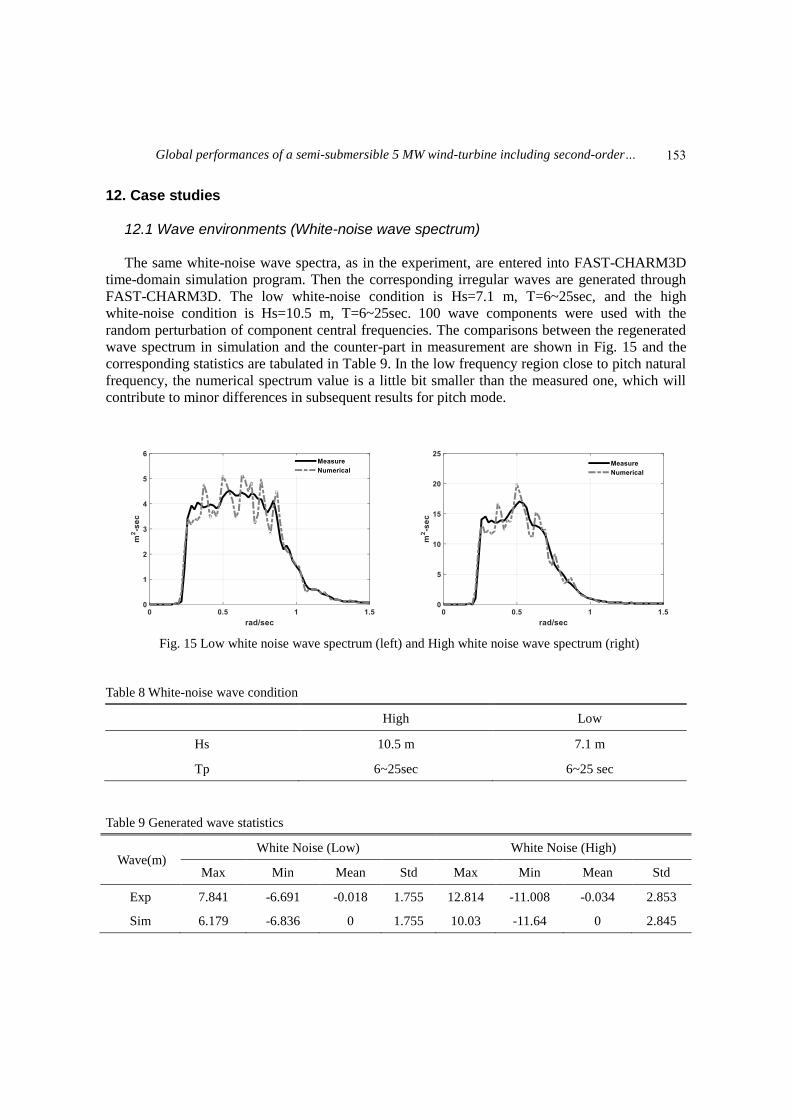
12.1 Wave environments (White-noise wave spectrum) The same white-noise wave spectra, as in the experiment, are entered into FAST-CHARM3D
time-domain simulation program. Then the corresponding irregular waves are generated through
FAST-CHARM3D. The low white-noise condition is Hs=7.1 m, T=6~25sec, and the high
white-noise condition is Hs=10.5 m, T=6~25sec. 100 wave components were used with the
random perturbation of component central frequencies. The comparisons between the regenerated
wave spectrum in simulation and the counter-part in measurement are shown in Fig. 15 and the
corresponding statistics are tabulated in Table 9. In the low frequency region close to pitch natural
frequency, the numerical spectrum value is a little bit smaller than the measured one, which will
contribute to minor differences in subsequent results for pitch mode.
Fig. 15 Low white noise wave spectrum (left) and High white noise wave spectrum (right)
Table 8 White-noise wave condition
High Low
Hs 10.5 m 7.1 m
Tp 6~25sec 6~25 sec
Table 9 Generated wave statistics
Wave(m) White Noise (Low) White Noise (High)
Max Min Mean Std Max Min Mean Std
Exp 7.841 -6.691 -0.018 1.755 12.814 -11.008 -0.034 2.853
Sim 6.179 -6.836 0 1.755 10.03 -11.64 0 2.845
153

H.C. Kim and M.H. Kim
13. Simulation results and discussions
So far, we checked that all the dynamic system characteristics and wave environments are
modeled correctly so that we can produce various kinds of performance simulation results. We
first selected two white-noise wave conditions as shown in Fig. 15. The white-noise wave
spectrum is a kind of artificial one but it is more useful in checking the correct modeling of a
dynamic system since the input energy is uniformly distributed for relevant frequency range. As
discussed earlier, the drag coefficient of 1.6 for columns and 3.2 for footings were selected from
the free-decay test in calm water. In the wave environments, the drag coefficients may be slightly
altered. The forces on Morison members are evaluated at the instantaneous body position and up to
the instantaneous free-surface elevation with the Morison‟s formula for a moving body. The wave
particle kinematics above MWL are generated by using a uniform extrapolation technique. As
discussed earlier, to include the second-order wave diffraction effect, both Newman‟s
approximation and full-QTF method are used. The results are also compared against a separate
result excluding the second-order diffraction effects i.e. with including only the first-order wave
forces and moments.
The surge, heave, pitch, and mooring top tension time-series and their spectra are shown in Figs.
16-23 for both high and low white-noise input wave spectra. When the full second-order wave
force is added, the numerical results best match against the experimental results. When only
first-order wave forces are used, surge and pitch slowly varying motions are significantly
underestimated, while there is no appreciable difference in heave motion. The underestimation of
surge and pitch slowly varying motions directly affects the same trend for mooring-line tension.
In case of surge, the slowly varying motions are dominant over the wave-frequency motions. The
overall trend is very similar between low and high input spectrum cases. If the range of input
white-noise spectra does not include the pitch natural frequency, the error associated with the
linear-wave-force-only case is to be greatly increased. The Newman‟s approximation is generally
good for slowly varying surge motions, but less accurate for slowly varying pitch motions due to
the reason discussed earlier. In case of heave mode, the first-order wave forces are dominant over
second-order contributions, so all the 3 cases give almost identical numerical results. The overall
reproduceability of the experimental results by the present numerical method is significantly
improved compared to prior attempts (e.g., Masciola et al. 2013, Coulling et al. 2013a, b).
To more clearly explain the above phenomena, the second-order difference-frequency
wave-force spectra are plotted in Fig. 24 for both Newman‟s approximation and full QTF cases.
The numerically regenerated spectra are also compared with theoretical ones by using the
following formulas for full QTF (Eq. (8)) (Kim and Yue 1990) and for Newman‟s approximation
(Eq. (9)) (Pinkster 1975, Faltisen 2012).
( ) = ∫ (𝜔 + ) (𝜔)| 𝑗𝑘(𝜔 + ,𝜔)|2𝑑𝜔
0 (8)
( )𝑛 𝑚𝑎𝑛 = ∫ (𝜔 + ) (𝜔)| 𝑗𝑗(𝜔 + )|2𝑑𝜔
∞
0 (9)
Where (𝜔) is the input wave spectrum, 𝑗𝑘 , 𝑗𝑗 are the QTF components.
The numerically regenerated second-order difference-frequency wave-force spectra agree well
with the theoretical ones, which double checks that all the simulated results are correct. In case of
surge mode, there is significant difference between the Newman‟s approximation and full-QTF
cases in higher frequencies but they are close near the location of surge natural frequency. It is the
154

Global performances of a semi-submersible 5 MW wind-turbine including second-order…
reason why the Newman‟s approximation does pretty good job for predicting slowly varying surge
motions. In case of pitch mode, there is significant difference between the Newman‟s
approximation and full-QTF cases even near the pitch natural frequency, so the Newman‟s
approximation method does worse job compared to the surge case. The overall trend is similar
between the low and high input spectra.
Fig. 16 surge time series (left) and spectrum (right) in the low white noise spectrum
Fig. 17 heave time series (left) and spectrum (right) in the low white noise spectrum
Fig. 18 pitch time series (left) and spectrum (right) in the low white noise spectrum
155

H.C. Kim and M.H. Kim
In the case of time series, only the full-QTF case is compared against experimental data to
avoid the confusion of too many lines co-existing. The initial transient parts of the time series were
eliminated for more accurate steady-state statistical values. The numerical simulations generally
reproduce the key trends of physical experiments even for the mooring-line dynamics. The
statistics of those responses in high and low input-wave-spectrum cases are tabulated in Table 10.
Fig. 19 mooring top tension time series (left) and spectrum (right) in the low white noise spectrum
Fig. 20 surge time series (left) and spectrum (right) in the high white noise spectrum
Fig. 21 heave time series (left) and spectrum (right) in the high white noise spectrum
156

Global performances of a semi-submersible 5 MW wind-turbine including second-order…
Fig. 22 pitch time series (left) and spectrum (right) in the high white noise spectrum
Table 10 Surge, Heave, Pitch and Top tension statistics of high and low white noise spectra
WhiteNoise (High) WhiteNoise (Low)
Max Min Mean Std Max Min Mean Std
Surge
(m)
Exp 17.878 -5.008 3.402 3.034 11.420 -4.918 2.169 1.900
second 14.631 -4.793 4.496 2.828 10.424 -3.752 2.547 1.769
Newman 15.408 -5.001 4.544 2.859 10.376 -3.829 2.579 1.797
Linear 12.321 -5.182 2.893 2.529 6.893 -3.211 1.234 1.313
Heave
(m)
Exp 5.993 -6.399 0.043 1.739 3.396 -3.445 -0.044 1.002
second 5.825 -5.697 0.169 1.788 3.394 -3.363 0.121 1.036
Newman 5.845 -5.802 0.165 1.780 3.389 -3.413 0.119 1.034
Linear 5.415 -6.005 0.073 1.770 3.232 -3.474 0.079 1.031
Pitch
(deg)
Exp 6.465 -7.243 0.060 1.594 3.819 -5.106 -0.069 0.984
second 5.185 -5.957 0.120 1.406 3.130 -3.043 0.071 0.772
Newman 4.624 -4.578 0.113 1.165 2.630 -2.347 0.067 0.635
Linear 4.192 -4.448 -0.016 1.106 1.995 -2.340 0.005 0.579
Top
Tension
(MN)
Exp 5.867 0.039 1.348 0.488 2.445 0.429 1.267 0.185
second 4.032 -0.039 1.352 0.445 2.497 0.388 1.233 0.166
Newman 4.077 -0.050 1.357 0.447 2.560 0.432 1.236 0.167
Linear 3.391 -0.064 1.248 0.385 2.133 0.336 1.160 0.133
157

H.C. Kim and M.H. Kim
Fig. 23 mooring top tension time series (left) and spectrum (right) in the high white noise spectrum
Fig. 24 Comparison of second-order-diffraction force/moment spectra between numerical and theoretical
results in low (left) and high (right) white noise spectrum
14. Conclusions
The global performance of the 5 MW OC4 semisubmersible floating wind turbine was
numerically simulated by using the turbine-floater-mooring fully coupled dynamic analysis
program FAST-CHARM3D in time domain. The numerical static-offset and free-decay tests were
conducted after dynamic-system modeling to verify the system stiffness, damping, and natural
frequencies compared with DeepCWind experimental results. The potential-theory-based first- and
second-order hydrodynamics results including complete QTFs were calculated through WAMIT in
the frequency domain, which were subsequently used in the time-domain simulations. In the case
of random waves, two white-noise input spectra representing high and low seas were used. To
158

Global performances of a semi-submersible 5 MW wind-turbine including second-order…
investigate second-order wave diffraction effects, both Newman‟s approximation and full-QTF
method were used for comparison. The results were also compared against the corresponding
experiments and a separate simulation result excluding all the second-order diffraction effects i.e.
with including only the first-order wave forces and moments.
If the second-order difference-frequency force/moment is excluded, the surge, pitch, and
mooring top tension are significantly under-estimated compared to the experimental results but
heave is not much affected by the second-order wave-diffraction effects. When the complete
second-order full QTF is used, the simulated time series and spectra for surge-heave-pitch motions
and mooring tensions best match against the corresponding experimental results. For the given
case, Newman‟s approximation works well for slowly varying surge motions but appreciably
underestimates the slowly varying pitch motions since the pitch natural frequency is not so small.
The regenerated second-order slowly varying force/moment spectra from the corresponding time
series data also agree well with the theoretical values, which confirms that all the simulation
results including second-order diffraction effects are done in a reliable manner. The corresponding
statistical values for floater motions and mooring tensions also correlate well against experimental
values, which clearly demonstrates that the present simulation method with full QTF can be a
useful tool for the design of semi-submersible-type floating wind turbine.
Acknowledgments
The present work is a result of the project “Development of the design technologies for a
10MW class wave and offshore wind hybrid power generation system” granted by the Korea
Ministry of Oceans and Fisheries. It is also partially supported by POSCO and ABS.
References
Bae, Y.H. and Kim, M.H. (2011), “Rotor-floater-mooring coupled dynamic analysis of
mono-column-TLP-type FOWT (Floating Offshore Wind Turbine)”, Ocean Syst. Eng., 1(1), 93-109.
Bae, Y.H. and Kim, M.H. (2014), “Coupled dynamic analysis of multiple wind turbines on a large single
floater”, J. Ocean Eng., 92, 175-187.
Coulling, A.J., Goupee, A.J., Robertson, A.N., Jonkman, J.M. and Dagher, H.J. (2013), “Validation of a
FAST semi-submersible floating wind turbine numerical model with DeepCwind test data”, J. Renew.
Sust. Energy, 5(2).
Bae, Y.H. and Kim, M.H. (2014), “Influence of control strategy to FOWT global performance by
aero-elastic-control-floater-mooring coupled dynamic analysis”, J. Ocean Wind Energy, 1(1), 50-58.
Coulling, A.J., Goupee, A.J., Robertson, A.N. and Jonkman, J.M. (2013), “Importance of second-order
difference-frequency wave-diffraction forces in the validation of a fast semi-submersible floating wind
turbine model”, Proceedings of the 32th (2013) International Conference on Ocean, Offshore and Arctic
Engineering Nantes, France.
Dominique, R., Christian, C., Alexia, A. and Alla, W. (2010), “WindFloat: A floating foundation for
offshore wind turbines”, J. Renew. Sust. Energy, 2(3),
Faltisen, O.M. (2012), Sea loads on ships and offshore structures, Cambridge University Press, 158-159.
Henderson, A.R., Leutz, R. and Fujii, T. (2002), “Potential for floating offshore wind energy in Japanese
waters”, Proceedings of the 12th (2002) International Offshore and Polar Engineering Conference,
Kitakyushu, Japan.
Henderson, A.R., Zaaijer, M., Bulder, B., Pierik, J., Huijsmans, R., Van Hees, M., Snijders, E., Wijnants,
159

H.C. Kim and M.H. Kim
G.H. and Wolf, M.J. (2004), “Floating windfarms for shallow offshore sites”, Proceedings of the 14th
(2004) International Offshore and Polar Engineering Conference, Toulon, France.
Jonkman, J.M. and Buhl Jr, M.L. (2004), FAST user’s guide. National Renewable Energy Laboratory, Rept.
NREL/EL-500–29798, Golden, Colorado.
Jonkman, J.M., Butterfield, S., Musial, W. and Scott, G. (2007), Definition of a 5-MW Reference Wind
Turbine for Offshore System Development, NREL Technical Report No. TP-500-38060.
Kang, H.Y. and Kim, M.H. (2012), “Hydrodynamic interactions and coupled dynamics between a container
ship and multiple mobile harbors”, Ocean Syst. Eng., 2(3), 217-228.
Kim, M.H. and Yue, D.K.P. (1991), “Sum- and difference-frequency wave loads on a body in unidirectional
Gaussian seas”, J. Ship Res., 35, 127-140.
Kim, M.H. and Yue, D.K.P. (1989), “The complete second-order diffraction solution for an axisymmetric
body. Part 1. Monochromatic incident waves”, J. Fluid Mech., 200, 235-264.
Kim, M.H. and Yue, D.K.P. (1990), “The complete second-order diffraction solution for an axisymmetric
body. Part 2. Bichromatic incident waves and body motions”, J. Fluid Mech., 211, 557-593, 1990.
Kim, M.H., Ran, Z. and Zheng, W. (2001), “Hull/mooring coupled dynamic analysis of a truss spar in time
domain”, Int. J. Offshore Polar, 11(1), 42-54.
Koo, B.J., Goupee, A.J., Kimball, R.W. and Lambrakos, K.F. (2014a), “Model tests for a floating wind
turbine on three different floaters”, J. Offshore Mech. Arct., 136(2), 021904.
Koo, B.J., Goupee, A.J., Lambrakos, K. and Lim, H.J. (2014b), “Model test data correlations with fully
coupled hull/mooring analysis for a floating wind turbine on a semi-submersible platform”, Proceedings
of the 33th (2014) International Conference on Ocean, Offshore and Arctic Engineering, San Francisco,
USA.
Lee, C.H., Newman, J.N., Kim, M.H. and Yue, D.K.P. (1991), “The computation of second-order wave
loads”, Proceedings of the 10th Offshore Mechanics and Artic Eng. Conference, Stavanger, Norway.
Masciola, M., Robertson, A.N., Jonkman, J.M., Alexander Coulling, A.J. and Goupee, A.J. (2013),
“Assessment of the importance of mooring dynamics on the global response of the DeepCWind floating
semisubmersible offshore wind turbine”, The International Society of Offshore and Polar Engineers.
Musial, W.D., Butterfield, S. and Boone, A. (2004), “Feasibility of floating platform systems for wind
turbines”, Paper presented at the 4second AIAA Aerospace Sciences Meeting and Exhibit, Reno, NV.
Pinkster, J.A. (1975), “Low-frequency phenomena associated with vessels moored at sea”, Soc. Petroleum
Engineers J., December, 487-494.
Tahar, A. and Kim, M.H. (2003), “Hull/mooring/riser coupled dynamic analysis and sensitivity study of a
tanker-based FPSO”, J. Appl. Ocean Res., 25(6), 367-382.
Tong, K.C. (1998), “Technical and economic aspects of a floating offshore wind farm”, J. Wind Eng. Ind.
Aerod., 74-76, 399-410.
Wayman, E.N., Sclavounos, P.D., Butterfield, S., Jonkman, J. and Musial, W. (2006), “Coupled dynamic
modeling of floating wind turbine systems”, Proceedings of the Offshore Technology Conference,
Houston, TX.
Wenchao, Z. and Deeheng, W. (2015), “Numerical study of interactions between phase II of OC4 wind
turbine and its semi-submersible floating support system”, J. Ocean Wind Energy, 2(1), 45-53.
Yang, C.K. and Kim, M.H. (2010), “Transient effects of tendon disconnection of a TLP by hull-tendon-riser
coupled dynamic analysis”, J. Ocean Eng., 8-9, 667-677.
160