Embed Size (px)
Citation preview

November 4, 2009 Global: Portfolio Strategy
Goldman Sachs Global Economics, Commodities and Strategy Research 1
November 4, 2009
Global Portfolio Strategy
The BRICs Nifty 50: The EM & DM winners
The new BRICs Nifty 50 – EM and DM baskets The credit crunch has acted as a catalyst for global economic
rebalancing by accelerating the increase in US savings and the
simultaneous rise in consumption in the BRICs. We estimate that two
billion people could join the global middle class by 2030, mainly from
BRICs. China and India are also set to dominate infrastructure demand
over the next decade. These trends provide excellent opportunities for
the best positioned companies from both the DM and EM markets. We
have identified two new ‘BRICs Nifty 50’ baskets to help access this
opportunity: 50 potential winners from the emerging markets
(Bloomberg ticker GSSTEM50) and 50 developed market companies
with BRICs exposure (GSSTDM50).
Comparing the two The baskets offer an opportunity to benefit from the BRICs theme both
for dedicated DM and for global investors who can invest in EM
directly. In addition, the advantage of two baskets is that investors can
switch between the two as relative valuation and growth opportunities
present themselves. On balance, while we expect both baskets to do
well over the long run, we think that GSSTDM50 currently offers the
best mix of liquidity, value and premium growth.
BRIC Nifty 50 baskets relative performance (Bloomberg tickers:
GSSTDM50 and GSSTEM50)
0
50
100
150
200
250
300
Oct-06 Jun-07 Feb-08 Oct-08 Jun-09
MSCI EM MSCI World DM Nif ty 50 basket EM Nif ty 50 basket
Worldscope, I/B/E/S, MSCI, Goldman Sachs Global ECS Research.
GOLDMAN SACHS GLOBAL ECS RESEARCH
Peter Oppenheimer
+44(20)7552-5782 | [email protected] Goldman Sachs International
Jim O'Neill
+44(20)7774-2699 | [email protected] Goldman Sachs International
Timothy Moe, CFA
+852-2978-1328 | [email protected] Goldman Sachs (Asia) L.L.C.
Kathy Matsui
+81(3)6437-9950 | [email protected] Goldman Sachs Japan Co., Ltd.
David J. Kostin
(212) 902-6781 | [email protected] Goldman, Sachs & Co.
Gerald Moser
+44(20)7774-5725 | [email protected] Goldman Sachs International
GS SUSTAIN
Anthony Ling
+44(20)7774-6776 | [email protected] Goldman Sachs International
Sarah Forrest, CFA
+65-6889-2472 | [email protected] Goldman Sachs (Singapore) Pte
Andrew Howard
+44(20)7552-5987 | [email protected] Goldman Sachs International
The Goldman Sachs Group, Inc. does and seeks to do business with companies covered in its research reports. As a result, investors should be aware that the firm may have a conflict of interest that could affect the objectivity of this report. Investors should consider this report as only a single factor in making their investment decision. For Reg AC certification, see the end of the text. Other important disclosures follow the Reg AC certification, or go to www.gs.com/research/hedge.html. Analysts employed by non-US affiliates are not registered/qualified as research analysts with FINRA in the U.S.
The Goldman Sachs Group, Inc. Goldman Sachs Global Economics, Commodities and Strategy Research

November 4, 2009 Global: Portfolio Strategy
Goldman Sachs Global Economics, Commodities and Strategy Research 2
Table of contents
Identifying winners from the BRICs story 3
The BRICs in the global economy 8
BRIC consumption: an increasing source of growth 12
BRICs infrastructure remains a key theme 18
BRICs equity markets have not yet reached a critical mass 21
Investing in EMs: a developed market viewpoint 28
Other disclosures 35
Disclosures 35
Analyst Contributors
Europe Porfolio Strategy
Peter Oppenheimer
+44(20)7552-5782 | [email protected]
Goldman Sachs International
Sharon Bell, CFA
+44(20)7552-1341 | [email protected]
Goldman Sachs International
Gerald Moser
+44(20)7774-5725 | [email protected]
Goldman Sachs International
Anders Nielsen
+44(20)7552-3000 | [email protected]
Goldman Sachs International
Christian Mueller-Glissmann, CFA
+44(20)7774-1714 | christian.mueller-
Goldman Sachs International
US Portfolio Strategy
David J. Kostin
(212) 902-6781 | [email protected]
Goldman, Sachs & Co.
Caesar Maasry
(212) 902-9693 | [email protected]
Goldman, Sachs & Co.
Asia Portfolio Strategy
Timothy Moe, CFA
+852-2978-1328 | [email protected]
Goldman Sachs (Asia) L.L.C.
Kenneth Kok, CFA
+852-2978-0960 | [email protected]
Goldman Sachs (Asia) L.L.C.
GS SUSTAIN
Sarah Forrest, CFA
+65-6889-2472 | [email protected]
Goldman Sachs (Singapore) Pte
Andrew Howard
+44(20)7552-5987 | [email protected]
Goldman Sachs International
EMEA Research
Sergei Arsenyev
+7(495)645-4018 | [email protected]
OOO Goldman Sachs
Latin America Research
Stephen Graham
+55(11)3371-0831 | [email protected]
Goldman Sachs Brasil Bco Múlt S.A.

November 4, 2009 Global: Portfolio Strategy
Goldman Sachs Global Economics, Commodities and Strategy Research 3
Identifying winners from the BRICs story
Since 2001, we have focused on the increasing importance of BRICs countries in the
global economy; we believe they remain on a trajectory that will see their combined
output reach 50% of the G7 level by 2020 and parity between 2030 and 2050. The
economic downturn of the last 24 months has accelerated that realignment of the
global economy; while growth slowed in all major regions, it has rebounded most
quickly in emerging economies, widening the disparity between emerging market
growth and that of developed markets. In this paper, we outline how continued
strength in emerging economies is driving growth in consumer classes as well as
continued infrastructure investment in the BRICs. We identify two groups of
companies that can help investors own this theme – one from the developed markets,
the other within the emerging markets.
Exposure to those fast growing economies is increasingly becoming a sine qua non of
global portfolios. Investment opportunities exist in both emerging market equities and
through developed market equities with significant exposure to those economies.
We have developed two new baskets to help identify the potential winners in this exciting
realignment of global growth opportunities. We describe both as a New Nifty 50. The
concept harks back to the so called 'Nifty 50' US stocks – the leading group of global
multinationals that dominated the US markets in the 1960s and early 1970s. This new Nifty
50 offers a vision of 50 companies from the developed markets that we believe are best
placed to benefit from the BRICs super cycle, as well as a Nifty 50 of BRICs companies that
are likely to emerge as the new winners in the global markets.
This piece is a joint analysis between the Goldman Sachs’ regional strategists in Global
ECS together with the Goldman Sachs Global SUSTAIN team. The GS SUSTAIN framework
identifies long-term industry leaders that are well positioned to benefit from structural
trends within their industry, including global economic realignment. Leaders are identified
through analysis of objective, quantifiable measures of performance across the key drivers
of corporate performance: 1) returns on capital, 2) industry positioning and 3)
management quality (with respect to environmental, social and governance issues). The
developed market basket includes 12 GS SUSTAIN focus list leaders and the emerging
market basket includes nine focus list leaders.
The emerging market listed basket is likely to benefit from continued growth in capital
markets and the increasing international competitiveness of companies in those countries
as well as from the tailwind of rising domestic demand, particularly in those sectors where
international competition is limited.
The developed market basket provides less focused but more stable exposure through
well placed developed market companies.
There are two reasons why we identify both EM and DM Nifty 50 BRICs baskets.
• Over time the two groups of companies may diverge in valuation and growth,
providing a useful hedge or switch opportunity between one basket and the other.
• Many investors may be limited regionally to an investment area. US or European fund
managers, for example, may not be able to buy into the EM growth story directly, but
could outperform their domestic indices by buying these companies. We find that our
DM BRIC basket (GSSTDM50) has a very high correlation with the MSCI EM indices, so
investors who are not able to buy EM stocks directly might find this an attractive
alternative.

November 4, 2009 Global: Portfolio Strategy
Goldman Sachs Global Economics, Commodities and Strategy Research 4
Both baskets currently look attractive
In terms of attractions of these baskets currently:
• The EM Nifty 50 (GSSTEM50) trades at a similar 2011E earnings multiple to the MSCI
EM but offers stronger growth. Although the Price to Book is higher than for MSCI EM
(2.0 vs. 1.6 using 2011E data), this is matched by a meaningfully better ROE (20% vs.
16% using 2011E data). The basket also has a high EBIT margin, above 20%, which is
twice the margin analysts forecast for the MSCI EM in 2011.
• The DM Nifty 50 BRICs basket (GSSTDM50) has performed in line with the MSCI
Emerging Markets and tracks this index closely. Over the last three years, investing in
these companies would have returned 16% in US dollar terms. This compares very
well with a broad developed index like the MSCI World, which over the same period
lost some 20%. We think this outperformance reflects the diverging economic paths
between emerging and advanced economies. Investing in the global BRIC basket
provides investors an emerging market-like return with possibly less corporate
governance risk and less political risk.
• In terms of valuation, GSSTDM50 is cheaper on an EV/EBITDA basis than MSCI EM
and has a higher EBIT margin than either MSCI World or MSCI EM for both next year
and the year after. While the P/B is higher than for the other main indices, the basket
has a premium 2011E ROE of over 16%. Revisions have also been higher for our
basket over the last month than for MSCI EM or MSCI World.
• The DM Nifty 50 basket offers an EM-like return with a lower volatility. Although it has
a higher volatility than the MSCI World developed, the 3-month realized volatility has
been on average 1.2 vol points below the MSCI EM realized volatility over the last
three years (Exhibit 52).
• We believe that our DM Nifty 50 basket offers a liquid vehicle through which to gain
exposure to Emerging Markets. This differs meaningfully from some Emerging
Markets where the fluctuation of liquidity could provide a significant hurdle for
investors. The median market cap in our DM Nifty 50 basket is $18 bn and the median
liquidity, measured as the last six months’ average daily liquidity, is $112 mn.
• To investors whose investment universe is limited to developed markets, we
recommend a long position in our DM Nifty 50 basket (GSSTDM50) that could
potentially be paired against a short position in the MSCI World index.
• For global investors with a strong positive view on emerging markets, we believe a
long position in our EM Nifty 50 basket (GSSTEM50) paired against the MSCI World
index offers a high-beta implementation of that view.
• On balance, while we expect both baskets to do well over the long run, we think that
GSSTDM50 currently offers the best mix of liquidity, value and premium growth.
Exhibit 1: Annualized volatility and beta for our baskets and MSCI indices
Beta VolatilityEM Nifty 50 1.45 38.39DM Nifty 50 1.26 29.32MSCI EM 1.25 30.08
MSCI World 1 24.00
Source: Goldman Sachs Research estimates, Goldman Sachs Global ECS Research.

November 4, 2009 Global: Portfolio Strategy
Goldman Sachs Global Economics, Commodities and Strategy Research 5
Exhibit 2: Our DM & EM Nifty 50 baskets offer attractive growth and value characteristics
Consensus data
Metric Period BRIC DM 50 (GSSTDM50)
BRIC EM 50 (GSSTEM50) MSCI EM MSCI World
2009E 17.7 19.1 16.4 17.0
2010E 14.2 13.7 12.5 13.0
2011E 11.8 10.7 10.5 10.8
2009E 10.2 10.9 12.4 8.2
2010E 8.7 8.2 9.7 7.1
2011E 7.7 6.9 8.2 6.1
2009E 2.2 2.6 1.9 1.6
2010E 2.1 2.3 1.8 1.5
2011E 1.8 2.0 1.6 1.4
2009E 12.9 0.5 NM 9.9
2010E 15.0 17.9 15.0 12.1
2011E 16.3 20.1 15.9 13.5
2009E 2.1 1.8 2.2 2.6
2010E 2.3 2.2 2.6 2.8
2011E 2.6 2.7 3.0 3.1
2009E -15.5 -13.4 -6.0 -12.6
2010E 24.2 39.8 31.1 30.6
2011E 20.7 27.9 19.4 20.4
2009E 14.8 15.6 9.5 10.1
2010E 14.1 19.1 10.5 11.3
2011E 15.3 21.4 10.8 12.2
1 week 11.3 1.6 4.9 8.1
4 weeks 23.5 7.0 10.0 16.5
P/E
(x)
EP
S g
row
th
(%)
EB
IT m
argi
n(%
)
12-m
th
EP
S re
v.
(%)
EV
/EB
ITD
A
(x)
P/B
(x)
RO
E (%
)D
Y (%
)
Source: Factset, I/B/E/S, Goldman Sachs Global ECS Research.
Exhibit 3: Compared volatility of our nifty 50 baskets, MSCI EM and MSC World
0
10
20
30
40
50
60
70
80
90
100
Oct-06 Apr-07 Oct-07 Apr-08 Oct-08 Apr-09
MSCI EM MSCI World EM Nifty 50 DM Nifty 50
Source: Datastream, Goldman Sachs Global ECS Research.

November 4, 2009 Global: Portfolio Strategy
Goldman Sachs Global Economics, Commodities and Strategy Research 6
Exhibit 4: Global DM BRIC exposure basket (GSSTDM50) constituents
Company name Country
Weights (%)
Exposure to EM
6M ADVT (US$ mn)
Current market cap
($Bn)2010E 2011E 2010E 2011E 2010E 2011E 2010E 2011E 2010E 2011E 2010E 2011E
Automobiles & PartsSuzuki Motor Japan 1.4% 46% 47.7 13.0 26.6 19.5 49.5 36.2 1.4 1.3 0.7 0.7 7.0 6.3 5.2 6.8Hyundai Motor Co. Korea 2.3% 30% 124.4 21.2 11.4 10.3 6.2 10.1 1.4 1.2 0.9 0.9 19.5 18.8 12.1 11.9Hankook Tire Korea 0.5% 25% 17.4 3.0 10.4 9.5 -0.3 9.8 1.6 1.4 0.8 1.1 11.8 11.3 15.0 14.3
BanksBBVA Europe 3.7% NM 798.7 71.0 9.5 8.1 -3.6 16.5 1.4 1.3 4.0 5.6 - - 14.9 15.8HSBC Europe 3.5% NM 402.0 196.3 18.5 11.8 27.9 56.7 1.6 1.5 3.4 3.9 - - 8.8 12.9Standard Chartered Europe 2.9% NM 118.2 51.4 13.8 11.4 1.7 20.8 1.9 1.7 2.8 3.2 - - 13.8 15.2
Basic ResourcesNewmont Mining Corp. (Hldg. Co.) US 2.9% 48% 305.5 20.7 16.0 13.7 27.9 16.7 1.9 1.8 0.9 0.9 7.3 6.9 12.1 12.9Vedanta Resources Europe 1.4% 73% 61.8 10.0 11.9 7.3 82.3 64.0 2.3 1.7 1.2 1.2 4.7 3.1 19.4 22.9BHP Billiton Plc Europe 3.1% 23% 305.4 62.9 13.5 10.8 6.3 25.0 3.3 2.7 3.1 3.2 7.4 6.2 24.2 25.4Xstrata plc Europe 2.7% 21% 194.6 46.0 10.8 8.7 43.0 24.2 1.3 1.1 0.6 1.0 7.5 6.0 11.6 12.4Posco Korea 2.1% 15% 123.5 36.3 9.0 8.5 49.5 5.6 1.2 1.1 2.0 2.0 6.7 6.3 13.9 13.0Fortescue Metals Group Ltd. Australia 1.0% 90% 29.3 10.5 25.3 14.8 7.9 71.0 7.8 5.2 0.0 0.0 13.6 9.0 30.8 35.5Equinox Minerals Ltd. Australia 0.7% 75% 6.1 2.4 10.2 5.0 NM NM 2.0 1.3 0.0 0.0 - - 19.3 26.2Macarthur Coal Ltd. Australia 0.4% 35% 10.0 2.0 16.7 11.2 -13.5 49.6 1.9 1.7 2.7 4.0 11.6 7.9 11.2 15.3
ChemicalsAvery Dennison Corp. US 0.8% 23% 41.1 3.8 12.5 12.2 33.3 2.6 2.7 2.9 2.2 2.3 8.6 8.6 21.6 24.1
Construction & MaterialsFLSmidth & Co. A/S Europe 0.8% 47% 24.5 2.9 11.7 13.4 -23.7 -13.1 1.9 1.7 2.6 2.6 7.9 8.6 16.4 13.0Holcim Europe 1.8% 34% 84.2 21.8 15.1 11.8 8.1 28.1 1.1 1.0 2.4 2.9 8.6 7.9 7.4 8.8
Food & BeveragesCarlsberg Europe 1.5% 54% 56.1 8.4 11.1 9.4 21.4 18.2 0.9 0.8 1.1 1.3 7.7 7.2 7.8 8.6Anheuser-Busch InBev Europe 2.2% 35% 114.7 77.7 15.5 13.6 15.9 14.4 2.5 2.2 1.4 1.7 10.3 9.7 16.1 16.1Unilever (NV) Europe 2.9% 25% 160.1 54.4 15.0 13.9 12.0 8.3 4.8 4.2 3.8 4.0 9.6 9.1 32.1 30.5Diageo Europe 2.0% 13% 89.0 40.8 13.0 12.0 9.0 8.9 5.4 4.5 3.9 4.1 10.4 9.8 41.8 37.5Coca-Cola Co. US 3.5% 14% 545.0 125.4 15.9 14.6 10.6 9.1 5.2 4.9 3.3 3.6 11.8 10.9 32.9 34.0
HealthcareMylan Laboratories US 1.5% 24% 112.7 5.0 11.0 9.3 28.2 18.0 1.3 1.1 0.0 0.0 7.4 6.6 12.2 12.2Pfizer, Inc. US 3.6% 19% 792.7 141.5 7.8 7.3 11.7 6.7 1.4 1.3 4.3 7.3 3.7 3.7 18.5 18.0Waters Corporation US 1.1% 17% 47.1 5.5 15.3 14.0 10.5 9.5 5.2 4.6 0.0 0.0 11.2 10.4 34.3 32.9
Industrial Goods & ServicesExpeditors Int'l US 1.7% 58% 77.3 7.1 26.9 23.0 10.3 17.4 4.7 4.2 1.3 1.3 13.3 11.7 17.3 18.4Boeing Company US 2.8% 23% 308.5 35.5 11.3 11.5 NM -1.7 30.3 14.7 3.4 3.5 6.2 6.6 NM NMEmerson Electric US 2.7% 21% 185.0 29.6 18.7 15.6 -2.3 20.4 3.3 3.4 3.4 3.5 9.9 9.1 17.5 21.9ABB Ltd Europe 2.7% 34% 162.0 45.5 18.6 15.7 -15.3 18.2 3.2 2.9 2.3 2.4 10.9 9.3 17.1 18.4EADS Europe 1.0% 29% 42.9 15.5 11.8 9.7 0.9 22.0 0.8 0.8 1.6 1.6 1.0 0.9 7.1 8.3Komatsu Japan 2.4% 39% 120.2 19.1 29.6 18.9 25.2 56.3 2.0 1.8 1.1 1.4 11.2 9.1 6.7 9.7Hitachi Construction Machinery Japan 1.1% 52% 39.6 5.1 44.7 18.3 34.4 NM 1.5 1.4 0.7 1.0 11.6 9.7 3.3 7.6Daikin Industries Japan 1.3% 40% 46.6 10.0 32.0 17.8 97.5 79.5 1.8 1.7 1.2 1.2 12.5 9.8 5.7 9.4Kawasaki Kisen Japan 0.6% 24% 31.6 2.4 NM 39.3 NM NM 0.7 0.7 0.0 1.1 16.2 8.9 NA 1.9
Oil & GasSchlumberger Ltd. US 3.1% 14% 540.7 77.8 23.4 17.6 1.6 33.0 3.6 3.2 1.3 1.3 11.5 9.4 15.5 17.9
Personal & Household GoodsPhilip Morris Intl US 3.4% 30% 355.6 94.8 12.9 11.5 16.2 11.7 33.6 NM 4.8 5.6 9.0 8.5 NM NAAvon Products US 2.3% 52% 112.1 13.9 15.1 13.6 28.6 11.1 9.8 5.6 2.7 2.9 9.7 8.9 65.3 41.6Nike US 1.8% 29% 214.3 25.0 16.5 14.8 3.7 11.5 3.0 2.7 1.8 1.9 9.8 8.8 18.0 18.3British American Tobacco Europe 2.6% 41% 105.8 64.1 11.8 10.9 8.0 8.1 4.3 3.9 5.5 5.9 9.6 9.0 36.2 35.8LVMH Moet-Hennessy Louis Vuitton Europe 2.2% 26% 103.0 51.6 17.5 15.4 8.0 13.5 2.3 2.1 2.3 2.5 10.0 9.1 13.0 13.6Richemont Europe 1.4% 25% 56.4 15.1 17.9 15.7 -11.4 14.1 2.0 1.8 1.5 1.7 NM 18.4 11.1 11.6Shiseido Japan 1.0% 25% 34.7 7.4 22.7 21.6 3.3 5.1 1.9 1.8 3.0 3.0 8.0 7.4 8.3 8.4Unicharm Japan 0.6% 15% 23.0 6.5 24.0 21.9 12.6 9.5 2.8 2.5 0.8 0.9 8.3 7.7 11.5 11.3
Real EstateProLogis US 1.7% 12% 117.8 5.6 NM NM NM NM 1.0 0.7 5.1 5.1 NM NM NA NA
TechnologyNVIDIA Corp. US 2.5% 62% 209.3 6.9 20.1 16.7 NM 20.6 2.6 2.6 0.0 0.0 9.7 - 13.2 15.6Novellus Systems US 1.3% 59% 78.4 2.1 15.2 11.2 NM 35.7 1.7 1.5 0.0 0.0 8.2 6.4 10.9 13.6Ericsson Europe 2.8% 39% 157.2 31.7 13.7 11.3 36.8 20.7 1.5 1.4 2.7 3.0 6.2 5.5 11.2 12.6Samsung Electronics Korea 3.0% 25% 262.9 88.4 10.2 9.6 29.5 5.9 1.6 1.3 0.8 1.0 6.9 6.4 15.3 14.0LG Electronics Korea 1.7% 18% 126.9 13.7 7.1 6.7 15.8 5.5 1.5 1.2 0.7 0.9 11.4 10.5 20.5 18.0
UtilitiesAES Corp. US 1.9% 68% 89.6 9.0 10.9 10.0 13.8 9.3 NA NA 0.0 0.0 6.5 6.2 NA NA
Median 29% 112 17 15.1 12.0 11.1 15.5 1.9 1.7 1.5 1.7 9.6 8.7 14.9 14.7* Sales for US, Europe, Korea and Australia, Operating Income for Japan
GLOBAL BRIC EXPOSURE BASKET (GSSTDM50)P/E (x) P/B (x) Dividend Yield (%) EV / EBITDA (x) Return on Equity (%)Earnings growth (%)
Source: Factset, I/B/E/S, Goldman Sachs Global ECS Research.

November 4, 2009 Global: Portfolio Strategy
Goldman Sachs Global Economics, Commodities and Strategy Research 7
Exhibit 5: EM NIFTY 50 basket (GSSTEM50) constituents
Company name Country Weights (%) Rating Liquidity
($mn)
Current market cap
($bn)2010E 2011E 2010E 2011E 2010E 2011E 2010E 2011E 2010E 2011E 2010E 2011E
Automobiles & PartsHero Honda Motors India 1.2 B 19 6.5 14.5 12.8 18.1 12.6 4.9 3.9 1.5 1.7 0.1 0.1 34.0 30.0
BanksChina Constr Bank (H) China 2.9 B* 297 191.6 10.4 8.6 21.6 20.8 2.2 1.9 3.6 4.5 NM NM 21.3 22.2ICBC (H) China 2.8 B* 253 65.2 11.5 9.7 22.9 18.5 2.4 2.1 3.5 4.3 NM NM 20.5 21.2Itau Unibanco Holding Brazil 2.7 N 168 46.3 13.2 10.8 32.9 21.4 2.8 2.5 1.9 2.3 NM NM 21.1 23.0Sberbank Russia 3.3 B 889 50.0 18.5 8.3 NM NM 1.9 1.5 0.0 0.6 NM NM 10.1 18.3State Bank of India India 2.2 B 115 29.5 12.6 9.8 13.6 27.9 1.9 1.7 1.4 1.5 NM NM 15.5 17.5
Basic ResourcesAngang Steel (H) China 1.9 B 40 2.0 15.8 11.8 NM 34.2 1.6 1.5 1.1 2.6 8.3 6.9 10.1 12.4China Shenhua Energy (H) China 2.3 B 79 15.3 17.2 16.2 10.9 6.4 3.2 2.8 1.8 1.9 5.3 4.9 18.3 17.0Companhia Siderurgica Nacional Brazil 3.0 B 86 27.5 17.0 10.9 40.0 56.0 4.6 2.8 5.2 1.7 4.9 3.0 26.9 25.9Jiangxi Copper (H) China 2.0 N 65 3.2 11.6 9.2 56.8 26.7 1.8 1.5 1.0 NM 7.6 6.3 15.2 16.2JSW Steel India 2.5 B 48 2.8 7.6 5.6 42.1 36.1 1.4 1.0 1.1 1.8 0.1 0.1 17.8 18.4NLMK Russia 1.3 N 12 16.2 13.0 9.2 NM 42.5 1.5 1.4 0.0 1.8 NM NM 11.7 14.9Sterlite Ind India India 2.1 B* 61 13.3 11.7 9.9 42.1 18.5 1.5 1.5 0.5 0.5 0.2 0.1 13.2 14.8Vale Brazil 2.7 B 552 86.9 16.0 13.9 59.0 15.0 2.5 2.2 1.8 1.8 4.4 3.7 15.5 15.8Votorantim Celulose e Papel Brazil 1.4 B 17 5.7 11.9 11.3 45.3 4.9 1.4 1.4 0.0 0.0 2.3 2.0 12.1 12.7
Construction & MaterialsChina National Building Mat China 1.7 B 31 2.6 11.8 10.7 31.5 10.8 2.3 1.9 0.5 0.7 5.9 5.2 19.2 17.6Jaiprakash Associates India 2.1 B 97 6.3 21.1 15.6 15.8 35.8 3.4 2.9 0.4 0.4 0.8 0.7 16.0 18.6Larsen & Toubro India 1.8 N 91 20.0 22.5 18.0 19.8 25.2 4.6 3.9 0.8 0.8 0.2 0.1 20.5 21.5
Financial ServicesVisanet Brazil 2.1 B 85 13.4 13.5 11.9 15.6 13.5 NM NM 6.0 7.4 9.8 9.1 NM NMHousing Dev Finance India 1.5 N 56 16.2 25.2 20.8 17.7 21.1 4.6 4.0 1.2 1.4 0.1 0.1 18.3 19.4
Food & BeverageChina Mengniu Dairy China 1.0 B* 22 4.7 20.4 16.9 19.2 20.7 3.3 2.8 0.8 1.1 10.0 8.2 16.2 16.8Want Want China China 0.7 B 9 7.7 19.4 15.8 30.2 23.0 6.3 5.3 2.2 2.9 NM NM 32.3 33.7
Health CareMindray Medical Intl (ADR) China 1.3 N 22 2.4 22.3 17.0 27.3 31.1 4.8 3.8 0.7 0.9 10.1 8.0 21.5 22.3
Industrial Goods & ServicesChina Shipping Dev (H) China 1.8 B 19 1.8 14.0 10.8 72.2 29.1 1.3 1.2 0.8 1.4 13.5 11.0 9.6 11.2
InsuranceChina Life Insurance (H) China 2.4 N 231 34.8 25.2 21.5 15.0 17.4 3.7 3.2 1.0 1.2 NM NM 14.6 14.7
Oil & GasCairn India India 1.8 B 28 10.7 11.8 7.9 NM 49.3 1.4 1.3 0.0 0.7 0.6 0.4 11.7 16.0China High Speed Transmission Equi China 1.1 B 15 2.6 15.6 12.5 37.9 24.4 3.4 2.9 1.5 1.9 13.4 10.6 21.8 23.0CNOOC China 3.1 B* 138 66.3 12.1 10.7 35.0 12.8 2.2 1.9 2.5 3.0 11.7 10.4 18.4 18.0Gazprom Russia 3.2 B 263 149.9 6.5 4.6 14.8 41.9 0.8 0.7 1.0 1.2 NM NM 12.2 15.3Novatek Russia 2.1 B 23 15.8 13.7 11.5 57.0 19.1 3.6 2.8 1.4 2.1 NM NM 26.2 24.2Petrobras Brazil 3.5 B 649 122.9 25.8 25.3 28.5 1.9 4.8 4.8 1.0 0.8 1.4 1.3 18.8 19.0Reliance Ind India 2.8 B* 220 69.8 13.4 11.1 26.5 20.9 2.2 1.9 NM 0.8 0.1 0.1 16.4 17.1
Personal & Household GoodsBelle Intl China 1.1 B* 13 8.3 19.6 16.8 19.0 16.4 3.3 2.8 1.1 1.4 NM NM 16.6 16.6ITC (IN) India 1.4 N 32 20.8 22.3 18.9 16.8 17.6 5.5 4.8 1.6 1.9 1.1 1.0 24.8 25.2
Real EstateChina Overseas Land & Inv China 1.8 N 60 17.2 16.2 12.8 29.2 26.7 2.8 2.4 1.0 1.3 10.1 8.5 17.5 19.0PDG Realty Brazil 1.6 B 17 3.2 10.8 8.7 44.1 24.9 1.0 2.0 0.9 2.5 10.6 8.8 9.1 22.7Unitech India 2.3 B* 158 4.1 18.1 13.0 -7.6 39.2 1.7 1.6 0.1 0.2 2.4 1.9 9.6 11.9
RetailChina Dongxiang China 1.1 B 14 3.4 13.5 11.3 17.8 18.8 2.7 2.4 NM 4.1 NM NM 20.1 21.0Localiza Rent A Car S/A Brazil 1.2 B 8 2.2 16.9 13.5 93.2 25.4 4.2 3.3 0.7 1.4 6.7 5.6 24.9 24.7Magnit Russia 0.4 B 4 5.5 16.5 11.7 31.6 41.0 3.8 2.9 0.2 0.2 NM NM 23.3 25.1X5 Retail Russia 1.1 B 8 6.8 20.8 15.2 100.0 36.7 3.1 2.6 0.0 0.0 5.6 4.3 14.7 16.9
TechnologyBaidu.com (ADR) China 3.2 B* 668 10.3 43.0 30.7 48.5 40.2 NM 9.4 0.0 0.0 1.2 0.8 31.5 30.8Lenovo China 2.0 B* 23 5.4 25.0 16.6 NM 50.7 3.5 3.1 NM 0.9 NM NM 13.9 18.7Tencent China 2.0 B 58 31.3 31.0 25.3 38.8 22.6 NM 8.5 0.4 0.5 3.6 2.8 39.4 33.5
TelecommunicationsChina Mobile China 2.7 B 303 191.0 11.3 10.7 1.4 5.3 2.3 2.0 3.8 4.0 1.5 1.4 20.0 18.7Mobile TeleSystems (ADS) Russia 2.8 B 96 19.0 9.4 8.2 23.2 14.9 3.4 3.1 5.1 7.2 1.8 1.6 36.3 38.0Vimpel Communications (ADS) Russia 2.9 B 96 19.2 10.0 8.6 48.8 16.8 2.8 2.4 2.9 4.8 4.0 3.7 27.7 27.7Vivo Brazil 1.6 B 13 6.9 14.4 10.0 52.1 43.0 1.8 1.6 2.9 3.7 1.4 1.3 12.6 15.7
UtilitiesChina Resources Power China 1.1 B* 22 9.8 12.9 11.1 19.0 16.4 1.8 1.7 2.0 2.4 6.7 5.6 14.3 14.9CPFL Energia S.A. Brazil 1.4 B 11 8.7 10.2 8.8 21.7 16.9 2.9 2.9 7.6 9.2 2.9 2.5 28.7 32.8
Median 56.7 12.0 14.4 11.4 28.5 21.4 2.8 2.4 1.1 1.5 3.8 2.9 18.3 18.7
Price to Book Dividend Yield EV / EBITDA Return on EquityEM NIFTY 50 (GSSTEM50)
Price to Earnings Earnings Growth
Source: Factset, I/B/E/S, Goldman Sachs Global ECS Research.
November 4, 2009 Global: Portfolio Strategy
Goldman Sachs Global Economics, Commodities and Strategy Research 8
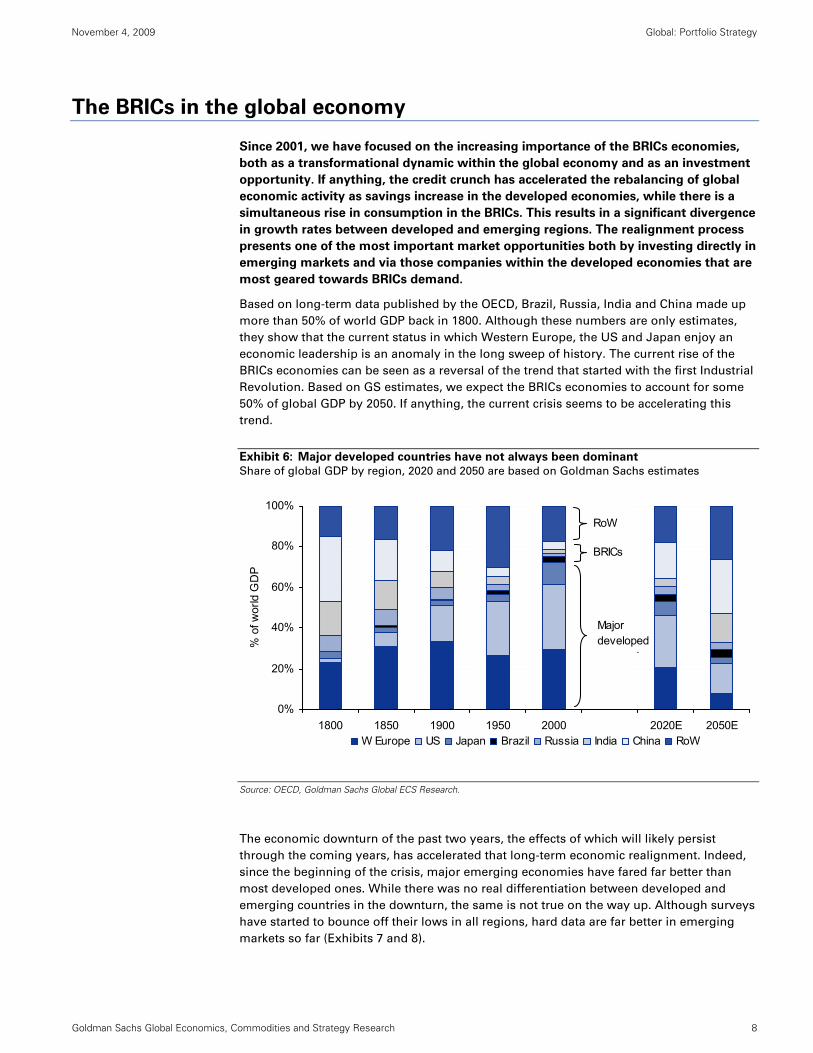
The BRICs in the global economy
Since 2001, we have focused on the increasing importance of the BRICs economies,
both as a transformational dynamic within the global economy and as an investment
opportunity. If anything, the credit crunch has accelerated the rebalancing of global
economic activity as savings increase in the developed economies, while there is a
simultaneous rise in consumption in the BRICs. This results in a significant divergence
in growth rates between developed and emerging regions. The realignment process
presents one of the most important market opportunities both by investing directly in
emerging markets and via those companies within the developed economies that are
most geared towards BRICs demand.
Based on long-term data published by the OECD, Brazil, Russia, India and China made up
more than 50% of world GDP back in 1800. Although these numbers are only estimates,
they show that the current status in which Western Europe, the US and Japan enjoy an
economic leadership is an anomaly in the long sweep of history. The current rise of the
BRICs economies can be seen as a reversal of the trend that started with the first Industrial
Revolution. Based on GS estimates, we expect the BRICs economies to account for some
50% of global GDP by 2050. If anything, the current crisis seems to be accelerating this
trend.
Exhibit 6: Major developed countries have not always been dominant
Share of global GDP by region, 2020 and 2050 are based on Goldman Sachs estimates
0%
20%
40%
60%
80%
100%
1800 1850 1900 1950 2000 2020E 2050E
% o
f wor
ld G
DP
W Europe US Japan Brazil Russia India China RoW
RoW
BRICs
Major developed
i
Source: OECD, Goldman Sachs Global ECS Research.
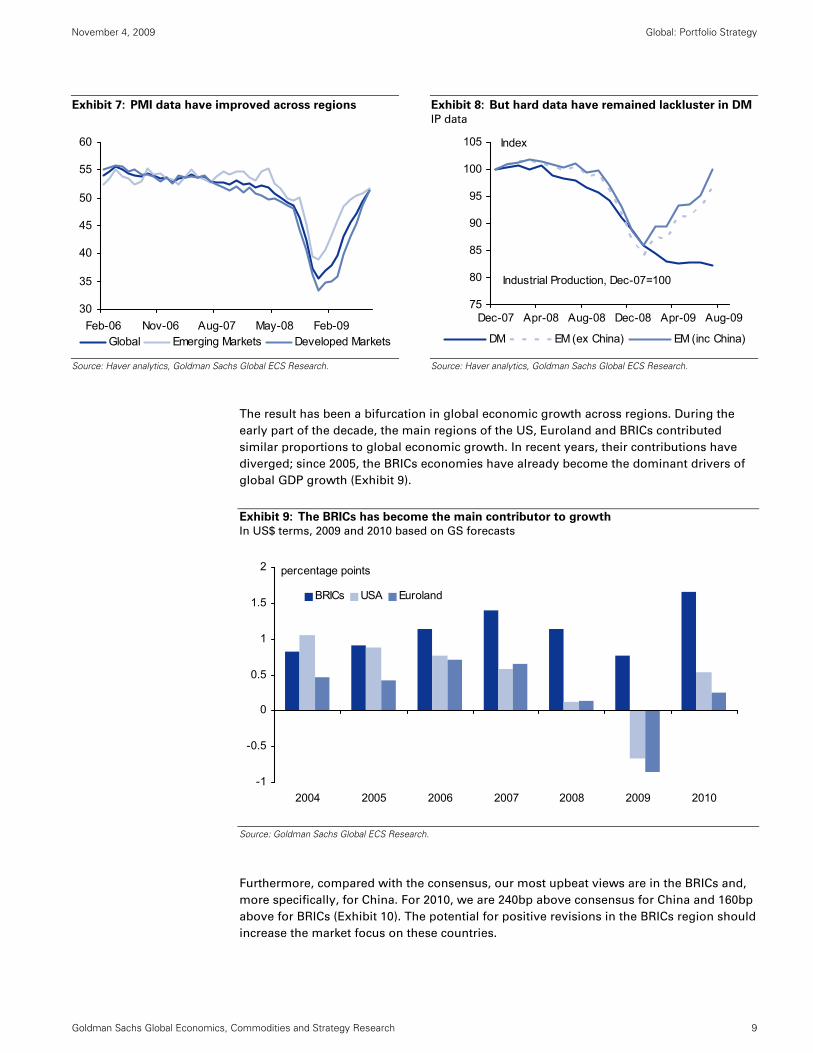
The economic downturn of the past two years, the effects of which will likely persist
through the coming years, has accelerated that long-term economic realignment. Indeed,
since the beginning of the crisis, major emerging economies have fared far better than
most developed ones. While there was no real differentiation between developed and
emerging countries in the downturn, the same is not true on the way up. Although surveys
have started to bounce off their lows in all regions, hard data are far better in emerging
markets so far (Exhibits 7 and 8).
November 4, 2009 Global: Portfolio Strategy
Goldman Sachs Global Economics, Commodities and Strategy Research 9
Exhibit 7: PMI data have improved across regions Exhibit 8: But hard data have remained lackluster in DM
IP data
30
35
40
45
50
55
60
Feb-06 Nov-06 Aug-07 May-08 Feb-09Global Emerging Markets Developed Markets
75
80
85
90
95
100
105
Dec-07 Apr-08 Aug-08 Dec-08 Apr-09 Aug-09
Index
DM EM (ex China) EM (inc China)
Industrial Production, Dec-07=100
Source: Haver analytics, Goldman Sachs Global ECS Research.
Source: Haver analytics, Goldman Sachs Global ECS Research.
The result has been a bifurcation in global economic growth across regions. During the
early part of the decade, the main regions of the US, Euroland and BRICs contributed
similar proportions to global economic growth. In recent years, their contributions have
diverged; since 2005, the BRICs economies have already become the dominant drivers of
global GDP growth (Exhibit 9).
Exhibit 9: The BRICs has become the main contributor to growth
In US$ terms, 2009 and 2010 based on GS forecasts
-1
-0.5
0
0.5
1
1.5
2
2004 2005 2006 2007 2008 2009 2010
BRICs USA Euroland
percentage points
Source: Goldman Sachs Global ECS Research.
Furthermore, compared with the consensus, our most upbeat views are in the BRICs and,
more specifically, for China. For 2010, we are 240bp above consensus for China and 160bp
above for BRICs (Exhibit 10). The potential for positive revisions in the BRICs region should
increase the market focus on these countries.

November 4, 2009 Global: Portfolio Strategy
Goldman Sachs Global Economics, Commodities and Strategy Research 10
Exhibit 10: Goldman Sachs and consensus GDP forecasts
Goldman Sachs Consensus
GS vs. consensus
Goldman Sachs Consensus
GS vs. consensus
China 9.4 8.4 100 bps 11.9 9.5 240 bpsBRICs 5.1 4.8 30 9 7.4 160UK -4.2 -4.3 10 1.9 1.3 60Europe -3.7 -4.0 30 1.4 0.9 50World -0.8 -0.9 10 4.1 3.7 40India 5.8 6.1 -30 7.8 7.5 30Euroland -3.9 -3.9 0 1.2 1.1 10Japan -5.7 -5.7 0 1.4 1.5 -10USA -2.5 -2.5 0 2 2.6 -60
2009E 2010E
Source: Goldman Sachs Global ECS Research, Consensus Economics October 2009.
This tangible improvement in emerging economies, especially in India and in China, has
already been reflected in trade data. For example, the latest figures for Germany show how
exports to these two countries have picked up and are now close to or above 2007 levels
(Exhibit 11). But the trend is evident across all the major regions (Exhibit 12).
Exhibit 11: German exports to China are back to pre-
Lehman level
Exhibit 12: The rise in exports to BRICs
Steady growth over the past decade
80
180
280
380
480
580
680
00 01 02 03 04 05 06 07 08 09
India
Brazil
China
RussiaIndex Jan 2000 = 100, 3 mth-average
Share of Total Exports to BRICs
0%
5%
10%
15%
20%
25%
Dec-93 Dec-96 Dec-99 Dec-02 Dec-05 Dec-08
USEurolandJapan
Source: Bundesbank, Goldman Sachs Global ECS Research.
Source: IMF, Goldman Sachs Global ECS Research.

November 4, 2009 Global: Portfolio Strategy
Goldman Sachs Global Economics, Commodities and Strategy Research 11
The global rebalancing in consumption is evident in the Chinese trade data too. While
export growth has remained very subdued, imports are growing from a very low base
(Exhibit 13). What is particularly striking about this is that it is not just commodities that
are responsible for rising imports but manufactured and consumer goods too.
Exhibit 13: Chinese Exports and Imports
Imports of non commodities are rising sharply
-40
-30
-20
-10
0
10
20
30
40
05 06 07 08 09
3MMA, %yoy
Total Exports Total Imports Non-Commodity Imports
Source: Haver analytics, CEIC, Goldman Sachs Global ECS Research.

November 4, 2009 Global: Portfolio Strategy
Goldman Sachs Global Economics, Commodities and Strategy Research 12
BRIC consumption: an increasing source of growth
While the economic growth story is well understood, we are constantly challenged by
investors who argue that the rise in BRICs consumption is a nice theory but is not yet a
reality. The dominance of the US consumer, they argue, means that any rise in BRICs
consumption is insufficient to support global growth. But as Jim O’Neill has emphasized,
the rise in Chinese retail sales alone, in dollar terms, has more than offset the contraction
of US retail sales since the start of 2007 (Exhibit 14).
Exhibit 14: Recent trend in real retail sales
Non-cumulative monthly change since January in real retail sales (in January 2007, US$ mn)
-50000
-30000
-10000
10000
30000
50000
70000
Jan-07 May-07 Sep-07 Jan-08 May-08 Sep-08 Jan-09 May-09
China US
Source: Haver analytics, Goldman Sachs Global ECS Research.
The emerging middle class: a structural story
Our Economists expect consumer spending in EM to keep on growing. After growth of
2.8% in 2009, they forecast EM consumer spending to grow 6.5% in 2010. This compares
with a flat consumer spending figure (+0.2% on average) for advanced economies (Exhibit
16). We expect China, India and Brazil consumption to increase by 10.5%, 6% and 4%,
respectively, in 2010. For this reason, we expect companies in the US, Japan and Europe
that can sell into the BRICs to perform very well.

November 4, 2009 Global: Portfolio Strategy
Goldman Sachs Global Economics, Commodities and Strategy Research 13
Exhibit 15: Growth in EM retail sales has offset weak
sales elsewhere
Exhibit 16: EM consumption should be strong in 2010
-60
-40
-20
0
20
40
60
80
Jan-07 Jul-07 Jan-08 Jul-08 Jan-09 Jul-09
AdvancedEmergingWorld
Cum. Change, Bn$ FX=Jan07
-4-202468
1012
Chi
na
Indi
aEM
Braz
ilW
orld
Ger
man
yFr
ance
Japa
nAd
v. E
con
USA Ita
lyM
exic
o
UK
Rus
sia
Spai
n
Average grow th 2009-2010 (%)
Source: National sources, Goldman Sachs Global ECS Research.
Source: Goldman Sachs Global ECS Research.
This exciting story is not just a short-term opportunity but rather a prolonged and
sustainable theme. This growth of the middle class in emerging economies (defined as
those with incomes between $6,000 and $30,000 in PPP terms) is set to continue, if not
accelerate, over the next two decades and is likely to be critical to how the world is
changing. As Dominic Wilson and Raluca Dragusanu, argued in Global Economic Paper
170 of July 7, 2008, The Expanding Middle: The Exploding World Middle Class and Falling
Global Inequality, the pace of expansion in the emerging middle class is likely to continue
growing until a peak in about a decade. As a result, two billion people could join the
global middle class by 2030, or around 30% of the world’s population.
Exhibit 17: BRICs income per capita expected to continue to rise
0
10
20
30
40
50
60
70
80
2000 2005 2010 2015 2020 2025 2030 2035 2040 2045 2050
Brazil ChinaIndia Russia
2007 Thousands of USD
Source: Goldman Sachs Global ECS Research.

November 4, 2009 Global: Portfolio Strategy
Goldman Sachs Global Economics, Commodities and Strategy Research 14
Furthermore, savings rates remain very high across Emerging economies (Exhibit 18). As a
consequence, currently EM consumption as a share of income is higher in essential goods
relative to the developed economies (Exhibit 19). This is likely to shift as more safety nets,
such as healthcare, become more available through state schemes.
Exhibit 18: Persistently high savings rates have been the
BRIC norm
Personal savings rate
Exhibit 19: EM consumption is tilted towards
necessities
Spending as a % of all personal consumption
0
10
20
30
40
50
60
1970 1974 1978 1982 1986 1990 1994 1998 2002 2006
Brazil China India
%
-20
-15
-10
-5
0
5
10
Educ
atio
n
Food
Hea
lth
Com
m.
Clo
thes
Alco
hol/T
obac
Furn
ishi
ngs
Hou
se/F
uel/U
til.
Res
t./H
otel
s
Tran
spor
t
Rec
reat
ion
DM minus EM (ppt)
Source: CEIC, Haver, Goldman Sachs Global ECS Research.
Source: World Bank, Goldman Sachs Global ECS Research.
Ranking the national accounts of around 100 large economies according to their wealth
levels, shows the same conclusions. The very poor countries have a very high share of
consumption as a % of GDP, as the industrial and housing sectors are almost non-existent.
As countries pass through industrialization and GDP per capita rises to around US$1,000-
3,000, savings and investments typically rise and a fall in the share of consumption within
total GDP is typically observed. Beyond that level of wealth, the share of consumption in
total GDP starts to rise as domestic demand becomes a more important engine of growth
(Exhibit 20).
China and India are close to the nadir of that trajectory, within the US$1,000-3,000 per
capita range mentioned above. Brazil and Russia already have higher levels of GDP per
capita and commensurately higher dependence on consumption and lower savings rates.
This evolution in the savings pattern is also accompanied with a shift towards more
discretionary product categories. The richer people get, the more they invest in
discretionary goods (Exhibit 21)

November 4, 2009 Global: Portfolio Strategy
Goldman Sachs Global Economics, Commodities and Strategy Research 15
Exhibit 20: Emerging economies will become more
consumer oriented as they develop …
Share of consumption into total GDP, average of countries in
each wealth band
Exhibit 21: …and consumption will become more
discretionary
Share of consumption directed to major categories, averages
of countries in each wealth band
40
45
50
55
60
65
70
75
80
800- 1,000 1,000-1,500
1,500-2,000
2,000-3 ,500
3,500-7 ,500
7,500-20,000
20,000-35,000
>35,000
GDP/Capita (2000 US$)
% o
f to
tal G
DP
0%
10%
20%
30%
40%
50%
60%
70%
80%
90%
100%
800-1,000
1,500-2 ,000
3,500-7,500
20,000-35,000
Restaur ants & hotels
Educ ation
Recreation & culture
Communication
Transport
Health
Furn ishings, householdequipment & main tenanc e
Housing, water, elec trici ty &other fuelsCloth ing & footw ear
A lcohol ic bever ages &tobacc o
Food & non- alc oho licbeverages
Source: National Accounts, World Bank.
Source: National Accounts, World Bank.
This acceleration in demand potential is reflected in the penetration of different goods
(number of goods per 100 people) in the BRICs economies. With the exception of Russia,
this remains very low for most non essential consumer durables. Among the BRICs, Russia
is the most mature consumer market, followed by Brazil, reflecting their higher wealth
levels.
Exhibit 22: Penetration of goods is still low in BRIC, except for Russia
Most recently available data
0
20
40
60
80
100
120
140
160
BroadbandSubscribers
PersonalComputers
TV set** Telephone &Mobile
Subscribers
Automobiles
Item per 100 People
Brazil China Russia India High-Income OECD
Source: National Sources, World Bank.
The changes that these trends imply in domestic consumption patterns in BRICs
economies have significant implications for the types of products that the BRICs import,
with the import share of low valued added goods falling. The import share of agricultural
products has already fallen across the board from 1995 to 2007, as BRICs consumers

November 4, 2009 Global: Portfolio Strategy
Goldman Sachs Global Economics, Commodities and Strategy Research 16
slowly increased their imports of higher value added goods, such as cars and office and
telecom equipment.
Russia’s composition of imports has changed the most, with the import share of cars
rising sharply from 5% in 1990 to 15% in 2007 and the share of agricultural products falling
from 12% to 6% over the same period. In China, the import share of office & telecom
equipment has increased dramatically since the late 1990s. China’s import share of
automotive products remains low at 2.5%, compared with 6.8% in Brazil and 14.7% in
Russia, but is changing fast. In August, China took over the US as the world’s single
biggest car market. In September, China’s auto sales reached one million units, up
83.6%yoy and 42% over the first nine months of 2009.
This should benefit both global multinational companies as well as local players. The
extent to which increases in BRICs demand results in market growth for developed market
vs. domestic companies will vary across sectors. In sectors where companies compete in
global markets, well positioned developed market players will benefit, whereas in more
regionally segregated markets, domestic players are likely to be better placed to benefit
from that growth. Exhibit 23 assesses the level of international competition in different
sectors through comparison of the share of total industry sales generated outside
companies’ home markets.
For instance, a few major companies dominate the auto sector. As can be seen on Exhibit
23, a majority of autos sales are generated outside companies’ domestic markets and we
expect established autos companies to benefit from strong demand in emerging markets.
A similar case can be made for personal household goods and, more particularly, luxury
goods. These companies have a worldwide market and enjoy strong brands that make
them attractive to the growing emerging markets middle class. In sectors like banks, retail,
real estate or travel & leisure, where most of the sales tend to be domestic, local
companies should emerge as the main beneficiaries.
Exhibit 23: Consumer oriented sectors are less international than industrial sectors
% of global industry sales generated outside companies’ domestic markets
0%
10%
20%
30%
40%
50%
60%
70%
Auto
mob
iles
& P
arts
Tech
nolo
gy
Per
s &
Hou
sehl
d G
oods
Che
mic
als
Ind.
Goo
ds &
Ser
vice
s
Con
stru
ct. &
Mat
eria
l
Food
& B
ever
age
Basi
c R
esou
rces
Oil &
Gas
Insu
ranc
e
Hea
lthca
re
Tra
vel &
Lei
sure
Med
ia
Tele
com
mun
icat
ions
Util
ities
Rea
l Est
ate
Ret
ail
Ban
ks
% o
f glo
bal in
dust
ry s
ales
gen
erat
ed o
utsi
de d
omes
tic m
arke
t
Source: Datastream.

November 4, 2009 Global: Portfolio Strategy
Goldman Sachs Global Economics, Commodities and Strategy Research 17
Exhibit 24: Consumer-oriented companies in our baskets
DM Nifty 50 (GSSTDM50) EM Nifty 50 (GSSTEM50)Automobiles & Parts
Suzuki Motor Hero Honda MotorsHyundai Motor Co.
Hankook TireFood & Beverages
Carlsberg China Mengniu DairyAnheuser-Busch InBev Want Want China
Unilever (NV)Diageo
Coca-Cola Co.Healthcare
Mylan Laboratories Mindray Medical Intl (ADR)Pfizer, Inc.
Waters CorporationPersonal & Household Goods
Philip Morris Intl Belle IntlAvon Products ITC (IN)
NikeBritish American Tobacco
LVMH Moet-Hennessy Louis VuittonRichemontShiseidoUnicharm
RetailChina Dongxiang
Localiza Rent A Car S/AMagnit
X5 RetailTechnology
NVIDIA Corp. Baidu.com (ADR)Novellus Systems Lenovo
Ericsson TencentSamsung Electronics
LG ElectronicsTelecommunications
China MobileMobile TeleSystems (ADS)
Vimpel Communications (ADS)Vivo
Source: Datastream, Goldman Sachs Global ECS Research.

November 4, 2009 Global: Portfolio Strategy
Goldman Sachs Global Economics, Commodities and Strategy Research 18
BRICs infrastructure remains a key theme
While domestic consumption is likely to become an increasingly important element of the
“BRICs story”, infrastructure investment in those countries will continue to grow quickly.
Indeed, continued investment in infrastructure will be necessary to support that growth in
consumption.
India’s steel demand is now higher than that of Japan and our Economists estimate that
India requires US$1.7 tn investment over the next decade to meet its infrastructure needs
(see Global Economics Paper 187: India Can Afford Its Massive Infrastructure Needs,
September 16, 2009). This sum includes not just power, roads and telecom but all
infrastructure needs, taking into account ports, airports, irrigation, railways and water
supply and sanitation. These investments are key for India to keep pace with economic
growth and urbanization. The major categories of spending will be roads (US$427 bn),
power (US$287 bn), railways (US$281 bn) and irrigation (US$272 bn).
China and India are set to dominate infrastructure demand over the next decade. However,
Brazil is also investing significantly in power transmission, pipelines, hydropower and
telecoms to reduce infrastructure bottlenecks and take full profit from its potential.
Rising investment in infrastructure is underpinned by continued rapid growth in urban
populations in emerging economies. The UN population division forecasts over one billion
new urban dwellers by 2020, under 10% of which will be located in the developed
economies of the US, Japan or Europe. Infrastructure investment is rising in parallel.
Exhibit 25: Rapid urban population growth in emerging
economies…
Urban population by region
Exhibit 26: …driving increased infrastructure spending
Gross fixed capital investment by region
0.0
1.0
2.0
3.0
4.0
5.0
6.0
7.0
1950 1960 1970 1980 1990 2000 2010 2020 2030 2040 2050
Bn
peop
le
US Europe Japan China India Brazil Russia RoW
0. 0
2. 0
4. 0
6. 0
8. 0
10. 0
12. 0
14. 0
1990 1992 1994 1996 1998 2000 2002 2004 2006
Cur
rent
US
$ (1
0^12
)
US EU3 Japan China India Brazil Russia RoW
Source: UN Population Division.
Source: World Bank, Goldman Sachs Research estimates.
That growth is driving continued demand for resources and infrastructure equipment, to
the benefit of global capital goods and basic resources players. These companies, based in
developed markets, are obvious potential beneficiaries from this boom in investment.
Their knowledge and expertise are particularly necessary in technically demanding
projects.
However, local players are also emerging in many industrial sectors. A combination of
advances in technology among companies in those countries, the strength of relationships

November 4, 2009 Global: Portfolio Strategy
Goldman Sachs Global Economics, Commodities and Strategy Research 19
many companies have with governments and their increasing scale and ability to compete
for major projects are leading to the emergence of domestic players in many infrastructure
and industrial markets, crowding out multinationals that are unable to bring technology or
other leadership. For instance, having been a growth market for developed market
companies in the early part of this decade, the Chinese market for power generation
equipment is now almost entirely dominated by three domestic companies: Dongfang
Electrical Machinery, Shanghai Electric Group and Harbin Power Equipment.
Exhibit 27: BRICs have become the major steel
consumers
Apparent steel consumption by region
Exhibit 28: …and consumers of primary energy
Total primary energy consumption
0
200
400
600
800
1000
1200
1400
2002 2003 2004 2005 2006 2007 2008
Mn
met
ric t
onne
s
US EU Japan China India Brazil Russia RoW
0
100
200
300
400
500
600
700
800
1990 2005 2010E 2015E 2020E 2025E 2030E
Qua
drill
ion
Btu
US OECD Europe Japan China India Brazil Russia RoW
Source: IISI.
Source: EIA.
Infrastructure investment in BRICs economies has far further to run. Penetration of
infrastructure indicators (Exhibit 29) demonstrates the differences between emerging and
developed economy levels across a range of measures. As populations in those
economies expand, urbanize and become wealthier, that investment is likely to continue
apace.
Exhibit 29: BRICs economies still require significant infrastructure investment
Penetration of infrastructure indicators in developed and BRICs economies, most recent reported
year
0
10
20
30
40
50
60
70
80
90
100
Vehicles (per 1,000 people ) Roads , tot al network (km/capita) ICT expenditure per c apit a(current US$)
Air t ransport , passengerscarried/capita
US
= 1
00
US
E U3 ave
Japan
China
India
B razil
Russia
Source: World Bank, Goldman Sachs Research estimates.

November 4, 2009 Global: Portfolio Strategy
Goldman Sachs Global Economics, Commodities and Strategy Research 20
Exhibit 30: Infrastructure-oriented companies in our baskets
DM Nifty 50 (GSSTDM50) EM Nifty 50 (GSSTEM50)Basic Resources
Newmont Mining Corp. (Hldg. Co.) Angang Steel (H)Vedanta Resources China Shenhua Energy (H)
BHP Billiton Plc Companhia Siderurgica NacionalXstrata plc Jiangxi Copper (H)
Posco JSW SteelFortescue Metals Group Ltd. NLMK
Equinox Minerals Ltd. Sterlite Ind IndiaMacarthur Coal Ltd. Vale
Votorantim Celulose e PapelChemicals
Avery Dennison Corp.Construction & Materials
FLSmidth & Co. A/S China National Building MatHolcim Jaiprakash Associates
Larsen & ToubroIndustrial Goods & Services
Expeditors Int'l China Shipping Dev (H)Boeing CompanyEmerson Electric
ABB LtdEADS
KomatsuHitachi Construction Machinery
Daikin IndustriesKawasaki Kisen
Oil & GasSchlumberger Ltd. Cairn India
China High Speed Transmission EquipCNOOCGazpromNovatek
PetrobrasReliance Ind
UtilitiesAES Corp. China Resources Power
CPFL Energia S.A.
Source: Datastream, Goldman Sachs Global ECS Research

November 4, 2009 Global: Portfolio Strategy
Goldman Sachs Global Economics, Commodities and Strategy Research 21
BRICs equity markets have not yet reached a critical mass
BRICs equity markets have expanded rapidly since the mid-1990s but remain relatively
immature compared to the sizes of their economies. With the tailwind of rising domestic
demand, increasing reliance on capital markets as a source of funding and increasing
competitiveness, we expect the equity markets of those countries to deepen further.
Exhibit 31: BRICs equity markets will deepen significantly in coming years
Market cap/GDP across BRICs and major developed economies
0
20
40
60
80
100
120
140
160
180
US UK Japan China Russia India Brazil
Mar
ket c
ap o
f lis
ted
com
pani
es a
s %
GD
P
1995-00 2000-05 2005-08
Source: World Bank, Datastream.
Across a range of sectors, BRICs equities remain under-represented in global equity
markets, relative to the importance of demand from those countries. Exhibit 32 plots the
share of BRICs-listed equities in global equity indices against the importance of demand
from those countries, in representative product categories. The values of BRICs companies
in the global Oil & Gas and Banks sectors exceed the importance of their domestic markets
to underlying demand but in every other sector, BRICs companies remain under-
represented in global indices.

November 4, 2009 Global: Portfolio Strategy
Goldman Sachs Global Economics, Commodities and Strategy Research 22
Exhibit 32: BRICs listed companies are under-represented relative to their importance to
demand
BRICs share of global market capitalization and indicative measures of demand
Utilitie s (electricity generation)
Te lecommunications (telecom s pending)
Te chnology (ICT spending)
Oil & Gas (oil & gas consumption)
Ind. Go ods & Services (manufac turing output)
Healthcare (healthc are spending)
Basic Resources (s teel demand)
Food & Beverage (grocery spending)
Banks (banking assets )
Automobiles & Parts (vehic le registrations)
0%
5%
10%
15%
20%
25%
30%
35%
40%
0% 5% 10% 15% 20% 25% 30% 35% 40% 45% 50%
Share of global demand
Shar
e of
glo
bal m
arke
t cap
.
Source: DataStream, World Bank, World Development Indicators, Global Insight, Euromonitor, World Steel, BP Statistical Review of World Energy, Bankscope, OECD, Goldman Sachs Research estimates.
This anomaly should disappear over time as BRICs-based companies become increasingly
competitive domestically and internationally in many industries. Operating margins of
BRICs-listed companies are already higher than the averages of their global peers in many
major industries (Exhibit 33).

November 4, 2009 Global: Portfolio Strategy
Goldman Sachs Global Economics, Commodities and Strategy Research 23
Exhibit 33: Operating cost differences are significant in many sectors
Average operating margin of BRICs companies vs. World Averages
0.0x
0.2x
0.4x
0.6x
0.8x
1.0x
1.2x
1.4x
1.6x
Che
mic
als
Ret
ail
Tech
nolo
gy
Food
& B
ever
age
Basi
c R
esou
rces
Ind.
Goo
ds &
Ser
vice
s
Utili
ties
Auto
mob
iles
& Pa
rts
Med
ia
Tele
com
mun
icat
ions
Oil &
Gas
Pers
& H
ouse
hld
Goo
ds
Hea
lthca
re
Con
stru
ct. &
Mat
eria
l
Rat
io o
f BR
ICs
oper
atin
g m
argi
n to
Wor
ld o
pera
ting
mar
gin
Source: Datastream.
Beyond a cost advantage, BRICs companies are also becoming increasingly internationally
competitive on factors other than cost. Investment in research and development in many
of these countries has increased substantially in recent years, typically focused on a
narrow range of industries. As a result, BRICs companies have become increasingly
internationally competitive, reflected in relatively high levels of international sales in many
sectors.
Exhibit 34: Domestically owned technology is
developing quickly
Ratio of patents registered by residents to registrations by
non-residents in China
Exhibit 35: BRICs companies in many sectors are
internationally competitive
% of sales generated outside domestic markets by BRICs
companies
0%
20%
40%
60%
80%
100%
120%
140%
160%
180%
2000 2001 2002 2003 2004 2005 2006 2007
0%
10%
20%
30%
40%
50%
60%
70%
Tech
nolo
gy
Con
stru
ct. &
Mat
eria
l
Ind.
Goo
ds &
Ser
vice
s
Hea
lthca
re
Bas
ic R
esou
rces
Food
& B
ever
age
Pers
& H
ouse
hld
Goo
ds
Oil
& G
as
Che
mic
als
% o
f sal
es g
ener
ated
out
side
thei
r dom
estic
mar
kets
Source: World Bank.
Source: Datastream.

November 4, 2009 Global: Portfolio Strategy
Goldman Sachs Global Economics, Commodities and Strategy Research 24
EM Nifty 50: Identifying the key companies in EM (GSSTEM50)
We have developed a basket of 50 BRICs-listed companies bringing together companies
well positioned to benefit from the demand growth we expect in BRICs markets. We have
included companies covered by our regional analysts with market capitalizations over
US$1 bn and screened that universe of around 400 large cap companies. We selected
companies based on their 3-year 2009E-12E EPS CAGR, their P/E, EV/EBITDA and ROE in
2010E. We also asked our regional analysts to highlight the companies that in their view
could be potential leaders in their industry. Overlaying these two lists, we highlight 50
structurally well placed large cap companies offering rapid growth in coming years.
Exhibit 36: We have included nine companies identified as structurally well placed under the GS EM NIFTY 50 basket
(GSSTEM50) constituents
Company name Country Weights (%) Rating Liquidity
($mn)
Current market cap
($bn)2010E 2011E 2010E 2011E 2010E 2011E 2010E 2011E 2010E 2011E 2010E 2011E
Automobiles & PartsHero Honda Motors India 1.2 B 19 6.5 14.5 12.8 18.1 12.6 4.9 3.9 1.5 1.7 0.1 0.1 34.0 30.0
BanksChina Constr Bank (H) China 2.9 B* 297 191.6 10.4 8.6 21.6 20.8 2.2 1.9 3.6 4.5 NM NM 21.3 22.2ICBC (H) China 2.8 B* 253 65.2 11.5 9.7 22.9 18.5 2.4 2.1 3.5 4.3 NM NM 20.5 21.2Itau Unibanco Holding Brazil 2.7 N 168 46.3 13.2 10.8 32.9 21.4 2.8 2.5 1.9 2.3 NM NM 21.1 23.0Sberbank Russia 3.3 B 889 50.0 18.5 8.3 NM NM 1.9 1.5 0.0 0.6 NM NM 10.1 18.3State Bank of India India 2.2 B 115 29.5 12.6 9.8 13.6 27.9 1.9 1.7 1.4 1.5 NM NM 15.5 17.5
Basic ResourcesAngang Steel (H) China 1.9 B 40 2.0 15.8 11.8 NM 34.2 1.6 1.5 1.1 2.6 8.3 6.9 10.1 12.4China Shenhua Energy (H) China 2.3 B 79 15.3 17.2 16.2 10.9 6.4 3.2 2.8 1.8 1.9 5.3 4.9 18.3 17.0Companhia Siderurgica Nacional Brazil 3.0 B 86 27.5 17.0 10.9 40.0 56.0 4.6 2.8 5.2 1.7 4.9 3.0 26.9 25.9Jiangxi Copper (H) China 2.0 N 65 3.2 11.6 9.2 56.8 26.7 1.8 1.5 1.0 NM 7.6 6.3 15.2 16.2JSW Steel India 2.5 B 48 2.8 7.6 5.6 42.1 36.1 1.4 1.0 1.1 1.8 0.1 0.1 17.8 18.4NLMK Russia 1.3 N 12 16.2 13.0 9.2 NM 42.5 1.5 1.4 0.0 1.8 NM NM 11.7 14.9Sterlite Ind India India 2.1 B* 61 13.3 11.7 9.9 42.1 18.5 1.5 1.5 0.5 0.5 0.2 0.1 13.2 14.8Vale Brazil 2.7 B 552 86.9 16.0 13.9 59.0 15.0 2.5 2.2 1.8 1.8 4.4 3.7 15.5 15.8Votorantim Celulose e Papel Brazil 1.4 B 17 5.7 11.9 11.3 45.3 4.9 1.4 1.4 0.0 0.0 2.3 2.0 12.1 12.7
Construction & MaterialsChina National Building Mat China 1.7 B 31 2.6 11.8 10.7 31.5 10.8 2.3 1.9 0.5 0.7 5.9 5.2 19.2 17.6Jaiprakash Associates India 2.1 B 97 6.3 21.1 15.6 15.8 35.8 3.4 2.9 0.4 0.4 0.8 0.7 16.0 18.6Larsen & Toubro India 1.8 N 91 20.0 22.5 18.0 19.8 25.2 4.6 3.9 0.8 0.8 0.2 0.1 20.5 21.5
Financial ServicesVisanet Brazil 2.1 B 85 13.4 13.5 11.9 15.6 13.5 NM NM 6.0 7.4 9.8 9.1 NM NMHousing Dev Finance India 1.5 N 56 16.2 25.2 20.8 17.7 21.1 4.6 4.0 1.2 1.4 0.1 0.1 18.3 19.4
Food & BeverageChina Mengniu Dairy China 1.0 B* 22 4.7 20.4 16.9 19.2 20.7 3.3 2.8 0.8 1.1 10.0 8.2 16.2 16.8Want Want China China 0.7 B 9 7.7 19.4 15.8 30.2 23.0 6.3 5.3 2.2 2.9 NM NM 32.3 33.7
Health CareMindray Medical Intl (ADR) China 1.3 N 22 2.4 22.3 17.0 27.3 31.1 4.8 3.8 0.7 0.9 10.1 8.0 21.5 22.3
Industrial Goods & ServicesChina Shipping Dev (H) China 1.8 B 19 1.8 14.0 10.8 72.2 29.1 1.3 1.2 0.8 1.4 13.5 11.0 9.6 11.2
InsuranceChina Life Insurance (H) China 2.4 N 231 34.8 25.2 21.5 15.0 17.4 3.7 3.2 1.0 1.2 NM NM 14.6 14.7
Oil & GasCairn India India 1.8 B 28 10.7 11.8 7.9 NM 49.3 1.4 1.3 0.0 0.7 0.6 0.4 11.7 16.0China High Speed Transmission Equi China 1.1 B 15 2.6 15.6 12.5 37.9 24.4 3.4 2.9 1.5 1.9 13.4 10.6 21.8 23.0CNOOC China 3.1 B* 138 66.3 12.1 10.7 35.0 12.8 2.2 1.9 2.5 3.0 11.7 10.4 18.4 18.0Gazprom Russia 3.2 B 263 149.9 6.5 4.6 14.8 41.9 0.8 0.7 1.0 1.2 NM NM 12.2 15.3Novatek Russia 2.1 B 23 15.8 13.7 11.5 57.0 19.1 3.6 2.8 1.4 2.1 NM NM 26.2 24.2Petrobras Brazil 3.5 B 649 122.9 25.8 25.3 28.5 1.9 4.8 4.8 1.0 0.8 1.4 1.3 18.8 19.0Reliance Ind India 2.8 B* 220 69.8 13.4 11.1 26.5 20.9 2.2 1.9 NM 0.8 0.1 0.1 16.4 17.1
Personal & Household GoodsBelle Intl China 1.1 B* 13 8.3 19.6 16.8 19.0 16.4 3.3 2.8 1.1 1.4 NM NM 16.6 16.6ITC (IN) India 1.4 N 32 20.8 22.3 18.9 16.8 17.6 5.5 4.8 1.6 1.9 1.1 1.0 24.8 25.2
Real EstateChina Overseas Land & Inv China 1.8 N 60 17.2 16.2 12.8 29.2 26.7 2.8 2.4 1.0 1.3 10.1 8.5 17.5 19.0PDG Realty Brazil 1.6 B 17 3.2 10.8 8.7 44.1 24.9 1.0 2.0 0.9 2.5 10.6 8.8 9.1 22.7Unitech India 2.3 B* 158 4.1 18.1 13.0 -7.6 39.2 1.7 1.6 0.1 0.2 2.4 1.9 9.6 11.9
RetailChina Dongxiang China 1.1 B 14 3.4 13.5 11.3 17.8 18.8 2.7 2.4 NM 4.1 NM NM 20.1 21.0Localiza Rent A Car S/A Brazil 1.2 B 8 2.2 16.9 13.5 93.2 25.4 4.2 3.3 0.7 1.4 6.7 5.6 24.9 24.7Magnit Russia 0.4 B 4 5.5 16.5 11.7 31.6 41.0 3.8 2.9 0.2 0.2 NM NM 23.3 25.1X5 Retail Russia 1.1 B 8 6.8 20.8 15.2 100.0 36.7 3.1 2.6 0.0 0.0 5.6 4.3 14.7 16.9
TechnologyBaidu.com (ADR) China 3.2 B* 668 10.3 43.0 30.7 48.5 40.2 NM 9.4 0.0 0.0 1.2 0.8 31.5 30.8Lenovo China 2.0 B* 23 5.4 25.0 16.6 NM 50.7 3.5 3.1 NM 0.9 NM NM 13.9 18.7Tencent China 2.0 B 58 31.3 31.0 25.3 38.8 22.6 NM 8.5 0.4 0.5 3.6 2.8 39.4 33.5
TelecommunicationsChina Mobile China 2.7 B 303 191.0 11.3 10.7 1.4 5.3 2.3 2.0 3.8 4.0 1.5 1.4 20.0 18.7Mobile TeleSystems (ADS) Russia 2.8 B 96 19.0 9.4 8.2 23.2 14.9 3.4 3.1 5.1 7.2 1.8 1.6 36.3 38.0Vimpel Communications (ADS) Russia 2.9 B 96 19.2 10.0 8.6 48.8 16.8 2.8 2.4 2.9 4.8 4.0 3.7 27.7 27.7Vivo Brazil 1.6 B 13 6.9 14.4 10.0 52.1 43.0 1.8 1.6 2.9 3.7 1.4 1.3 12.6 15.7
UtilitiesChina Resources Power China 1.1 B* 22 9.8 12.9 11.1 19.0 16.4 1.8 1.7 2.0 2.4 6.7 5.6 14.3 14.9CPFL Energia S.A. Brazil 1.4 B 11 8.7 10.2 8.8 21.7 16.9 2.9 2.9 7.6 9.2 2.9 2.5 28.7 32.8
Median 56.7 12.0 14.4 11.4 28.5 21.4 2.8 2.4 1.1 1.5 3.8 2.9 18.3 18.7
Price to Book Dividend Yield EV / EBITDA Return on EquityEM NIFTY 50 (GSSTEM50)
Price to Earnings Earnings Growth
Source: Factset, I/B/E/S, Goldman Sachs Global ECS Research.

November 4, 2009 Global: Portfolio Strategy
Goldman Sachs Global Economics, Commodities and Strategy Research 25
SUSTAIN framework within that list. The GS SUSTAIN framework identifies the companies
in each global industry best positioned to sustain competitive advantage and superior
returns on capital in each global industry over the long term (3-5 years). That framework
integrates the analysis of objective, quantifiable measures of the key drivers of corporate
performance: 1) returns on capital, 2) industry positioning and 3) management quality with
respect to environmental, social and governance issues.
Our basket includes companies from all four BRIC countries (Brazil, Russia, India and
China). We have built the basket to reflect the size of each country and market in the BRIC
universe. Therefore, there is a bias towards Chinese companies (21 stocks), whereas the
other countries are fairly equally represented in the basket (Exhibit 38).
The companies are weighted according to their free float market capitalization and their
daily liquidity. To avoid being exposed to one particular company, the maximum weight
for any single stock is 3.5%. At the other end of the spectrum, the lowest weight is 0.7%.
We deliberately kept weights in a tight range to be as close as possible to an equal weight,
but moved away from that last option to improve the liquidity of our basket.
Nine of those companies are highlighted on the GS SUSTAIN focus list, which brings
together leaders identified across global industries through objective, quantifiable analysis
of the key drivers of corporate performance. Those companies are: ICBC, Itau Unibanco,
Novolipetsk, Vale, Want Want China, Mindray Medical, CNOOC, Petrobras, China Mobile.
Exhibit 37: Market capitalization of the BRIC Exhibit 38: Geographical origin of our EM Nifty 50
basket (GSSTEM50)
India16%
Russia11%
China55%
Brazil18%
Brazil 21%
India22%
China40%
Russia17%
Source: Datastream, Goldman Sachs Global ECS Research. Source: Goldman Sachs Global ECS Research.
Our EM Nifty 50 basket (GSSTEM50) comprises a broad spread of sectors (14 out of 19).
The sector bias in our basket reflects the two themes we highlighted previously, i.e. the
infrastructure build and the emerging middle class. Whereas basic resources and oil & gas
are the two biggest sectors, banks, retail, real estate, technology and telecommunications
also have significant weights (Exhibit 39).

November 4, 2009 Global: Portfolio Strategy
Goldman Sachs Global Economics, Commodities and Strategy Research 26
Exhibit 39: Our EM Nifty 50 basket comprises a wide range of sectors
Oil & Gas14%
Banks10%
Autos2%
Healthcare2%
Indus Gds Serv2%
Construct. & Mat6%
Real Estate6%
Technology6%
Utilities4%
Pers & Hhold Gds4%
Food & Beverage4%
Financial Services4%
Insurance2%
Basic Resources18%
Telecoms8%
Retail8%
Source: Goldman Sachs Global ECS Research.
Performance
The EM Nifty 50 basket has significantly outperformed the MSCI Emerging Markets. It fell a
lot in the bear market but it has recovered sharply since then (+170%). Although this
performance seems extreme, the basket is still off the highs it reached in 2007, displaying
a very similar pattern to what we see for the MSCI EM.
Exhibit 40: Our EM Nifty 50 basket has outperformed the MSCI EM
Backtest over the last three years
0
50
100
150
200
250
300
Oct-06 Jun-07 Feb-08 Oct-08 Jun-09
MSCI EM MSCI World EM Nifty 50 basket
Source: Goldman Sachs Global ECS Research.

November 4, 2009 Global: Portfolio Strategy
Goldman Sachs Global Economics, Commodities and Strategy Research 27
Valuation
Despite this strong performance, the basket remains attractive on almost every metric we
look at. Using consensus data, the EM Nifty 50 trades at a similar 2011E earnings multiple
as MSCI EM but offers stronger growth. Although the P/B is higher than for MSCI EM (2.0
vs. 1.6 using 2011E data), this is matched by a meaningfully better ROE (20% vs. 16% using
2011E data). The basket also has high EBIT margin, above 20%, which is twice the margin
analysts expect for the MSCI EM in 2011.
Exhibit 41: Our EM Nifty 50 basket shows attractive valuation and growth data
Consensus data
Metric Period BRIC DM 50 (GSSTDM50)
BRIC EM 50 (GSSTEM50) MSCI EM MSCI World
2009E 17.7 19.1 16.4 17.0
2010E 14.2 13.7 12.5 13.0
2011E 11.8 10.7 10.5 10.8
2009E 10.2 10.9 12.4 8.2
2010E 8.7 8.2 9.7 7.1
2011E 7.7 6.9 8.2 6.1
2009E 2.2 2.6 1.9 1.6
2010E 2.1 2.3 1.8 1.5
2011E 1.8 2.0 1.6 1.4
2009E 12.9 0.5 NM 9.9
2010E 15.0 17.9 15.0 12.1
2011E 16.3 20.1 15.9 13.5
2009E 2.1 1.8 2.2 2.6
2010E 2.3 2.2 2.6 2.8
2011E 2.6 2.7 3.0 3.1
2009E -15.5 -13.4 -6.0 -12.6
2010E 24.2 39.8 31.1 30.6
2011E 20.7 27.9 19.4 20.4
2009E 14.8 15.6 9.5 10.1
2010E 14.1 19.1 10.5 11.3
2011E 15.3 21.4 10.8 12.2
1 week 11.3 1.6 4.9 8.1
4 weeks 23.5 7.0 10.0 16.5
P/E
(x)
EP
S g
row
th
(%)
EB
IT m
argi
n(%
)
12-m
th
EP
S re
v.
(%)
EV
/EB
ITD
A
(x)
P/B
(x)
RO
E (%
)D
Y (%
)
Source: Factset, I/B/E/S, Goldman Sachs Global ECS Research.
Exhibit 42: Annualized volatility and Beta for our baskets and MSCI indices
Beta VolatilityEM Nifty 50 1.45 38.39DM Nifty 50 1.26 29.32MSCI EM 1.25 30.08
MSCI World 1 24.00
Source: Goldman Sachs Research estimates, Goldman Sachs Global ECS Research.

November 4, 2009 Global: Portfolio Strategy
Goldman Sachs Global Economics, Commodities and Strategy Research 28
Investing in EMs: a developed market viewpoint
While the prospects for investments directly in the BRICs and N-11 may well provide excellent opportunities over the long run, there are also increasing opportunities to gain access to this theme within the developed markets themselves.
Indeed, the corporate sectors in many economies are generating an increasing proportion
of their revenue outside their domestic markets and are therefore only partly limited by
weaker domestic demand. As Exhibit 12 shows, the proportion of European exports, for
example, going to BRICs economies has risen sharply.
This trend is also reflected in the quoted corporate sector. Again, taking Europe as an
example, using our analysts’ estimates of geographical exposure (for close to 950
companies) and the sales for each company, we aggregate a total exposure breakdown for
our European Research coverage excluding oil companies. We then weight the GS real
GDP growth forecast for each region by the exposure of the European market in this region,
hence we derive the relevant growth rate for European companies. We apply the world
real GDP growth rate to sales not categorised to any country. Column 4 then, shows the
weighted contribution to European company sales from each region (based on sales
exposure) for 2009, while the final column shows the weighted contribution for 2010.
In our view, the relevant growth rate when thinking of European equities (and this is true
for the US and Japan), is not the -3.8% for 2009 and the +1.2% for 2010 we forecast for
domestic GDP, but the -2.0% and +2.9% that we forecast based on the exposure that
European companies have to revenue growth in each region. Moreover, as emerging
markets are growing faster than developed Europe, the future weight of this area is
increasing thus also increasing the composite growth rate relevant for European equities.
Exhibit 43: European market exposure weighted real GDP growth
GS universe; ‘Other’ sales are assumed to be growing at world GDP
Exposure2009 GDP Forecasts
2010 GDP Forecasts
2009 growth contribution
2010 growth contribution
UK 13.4 -4.1 1.9 -0.6 0.3Europe ex-UK 49.5 -3.8 1.2 -1.9 0.6US 14.3 -2.6 2.0 -0.4 0.3Emerging markets 16.6 5.1 8.9 0.8 1.5Others 7.0 -0.9 4.1 -0.1 0.3Total -2.0 2.9
Source: Goldman Sachs Research estimates, Goldman Sachs Global ECS Research.
It is difficult to identify the exposure of each company to a precise geographical end
market. The end market for a sector like oil & gas is not particularly relevant as energy
companies sell a global product at a global price. However, interpreting reported data by
companies, we estimate that operating income exposure of European companies to
emerging markets has doubled since 1998 (Exhibit 44).

November 4, 2009 Global: Portfolio Strategy
Goldman Sachs Global Economics, Commodities and Strategy Research 29
Exhibit 44: Emerging markets exposure has increased meaningfully over the last decade
European companies operating income exposure
70%
72%
74%
76%
78%
80%
82%
84%
86%
1990 1992 1994 1996 1998 2000 2002 2004 20067%
9%
11%
13%
15%
17%
19%
21%
Developed Emerging (RHS)
DJ Stoxx 600 companies operating Income
Source: Goldman Sachs Global ECS Research, Worldscope.
This increase in operating income is also a reflection of higher investment from European
companies in emerging markets. Faced with limited growth opportunities in mature
markets, many European and other mature economy companies have tried to increase
their presence in fast growing markets, either through M&A or through aggressive organic
growth. This is reflected in the data we have collected from Worldscope. In Exhibit 45, we
show the percentage of capex invested and operating income generated in emerging
markets by European companies. Although companies reduced capex to emerging
countries between 1998 and 2002, probably a reflection of higher technology spending in
the developed world and fears of an EM crisis after Asia and Russia tailspins, they have
since rapidly increased their investment into emerging economies. We expect this trend to
continue.
Exhibit 45: Operating income and capex exposures of European companies have grown
together over the last ten years
0%
5%
10%
15%
20%
25%
Jan-90 Jan-93 Jan-96 Jan-99 Jan-02 Jan-05 Jan-08
Operating Income Exposure
Capex Exposure
Source: Worldscope, Goldman Sachs Global ECS Research.

November 4, 2009 Global: Portfolio Strategy
Goldman Sachs Global Economics, Commodities and Strategy Research 30
In the US as well, we found that companies exposed to the BRICs have better top-line
growth. These companies have posted better sales growth than the S&P500 over each of
the past 10 quarters and have posted positive revenue surprises for nine of the past 10
quarters. The superior revenue performance is consistent with faster GDP growth in the
BRICs economies relative to the US (Exhibits 46 and 47).
Exhibit 46: GSTHBRIC has higher sales growth Exhibit 47: GSSTHBRIC has better sales surprise
(15)%
(10)%
(5)%
0 %
5 %
10 %
15 %
20 %
25 %
Mar-07 Dec-07 Sep-08 Jun-09 Mar-10 Dec-10
Sale
s G
row
th (y
oy %
)
Median Sales Growth
GSTHBRIC
S&P 500
ConsensusForecasts
Q3 TD
0 %
10 %
20 %
30 %
40 %
50 %
60 %
70 %
Mar-07 Dec-07 Sep-08 Jun-09Po
sitiv
e Sa
les
Surp
rises
(%)
% of companiesbeating Sales estimate
GSTHBRIC
S&P 500
Source: Compustat, I/B/E/S, Goldman Sachs Global ECS Research.
Source: Compustat, I/B/E/S, Goldman Sachs Global ECS Research.
Creating a global DM BRIC Basket (GSSTDM50)
Over the past year or so, each of our regional portfolio strategy teams have been
recommending baskets of companies that have significant exposure to the BRICs and
other emerging economies.
• In Europe, we recommend investing in our BRIC basket (GSSTBRIC). Using our
analysts’ estimates, we screen for companies with the highest sales and operating
income exposures. The median company in the basket generates 50% of its operating
income from emerging markets. For more details, please see Strategy Matters:
Emerging markets exposure: the passport to growth, September 25, 2009.
• In the US, we recommend buying our US BRIC basket (GSTHBRIC), either as an
absolute long or as a sector-neutral pair trade versus S&P 500. The basket identifies 50
stocks in the Russell 1000 index across ten sectors with the highest sales exposure to
the BRICs countries and regions. The median stock in the basket derives 23% of its
sales from the BRICs regions vs. 0% for median S&P 500 stock. For more details,
please see Strategy Baskets: Focus on degree of operating leverage and BRICs
revenue exposure, August 19, 2009.
• In Japan, we highlight 28 Japanese companies (GSSZCIND) which our analysts
believe are well positioned to benefit from secular domestic demand growth in China,
India and Indonesia (“Chindonesia”). Investors can invest in certain Japanese
companies that offer similar, if not superior, returns at significant valuation discounts
to their Asian peers. For more details, please see Japan: Portfolio Strategy: Buying
Chindonesia via Japan, July 23, 2009.
We have now created one global basket that gathers companies in the developed world
with high exposure to emerging markets. Mixing stocks from Europe, the US, Japan, Korea
(now in the FTSE developed market indices) and Australia, we identify companies we
believe will benefit from our structural positive views on emerging markets in general, and
on BRICs in particular (Exhibit 48).

November 4, 2009 Global: Portfolio Strategy
Goldman Sachs Global Economics, Commodities and Strategy Research 31
Exhibit 48: Global DM BRIC exposure basket (GSSTDM50) constituents
Company name Country
Weights (%)
Exposure to EM
6M ADVT (US$ mn)
Current market cap
($Bn)2010E 2011E 2010E 2011E 2010E 2011E 2010E 2011E 2010E 2011E 2010E 2011E
Automobiles & PartsSuzuki Motor Japan 1.4% 46% 47.7 13.0 26.6 19.5 49.5 36.2 1.4 1.3 0.7 0.7 7.0 6.3 5.2 6.8Hyundai Motor Co. Korea 2.3% 30% 124.4 21.2 11.4 10.3 6.2 10.1 1.4 1.2 0.9 0.9 19.5 18.8 12.1 11.9Hankook Tire Korea 0.5% 25% 17.4 3.0 10.4 9.5 -0.3 9.8 1.6 1.4 0.8 1.1 11.8 11.3 15.0 14.3
BanksBBVA Europe 3.7% NM 798.7 71.0 9.5 8.1 -3.6 16.5 1.4 1.3 4.0 5.6 - - 14.9 15.8HSBC Europe 3.5% NM 402.0 196.3 18.5 11.8 27.9 56.7 1.6 1.5 3.4 3.9 - - 8.8 12.9Standard Chartered Europe 2.9% NM 118.2 51.4 13.8 11.4 1.7 20.8 1.9 1.7 2.8 3.2 - - 13.8 15.2
Basic ResourcesNewmont Mining Corp. (Hldg. Co.) US 2.9% 48% 305.5 20.7 16.0 13.7 27.9 16.7 1.9 1.8 0.9 0.9 7.3 6.9 12.1 12.9Vedanta Resources Europe 1.4% 73% 61.8 10.0 11.9 7.3 82.3 64.0 2.3 1.7 1.2 1.2 4.7 3.1 19.4 22.9BHP Billiton Plc Europe 3.1% 23% 305.4 62.9 13.5 10.8 6.3 25.0 3.3 2.7 3.1 3.2 7.4 6.2 24.2 25.4Xstrata plc Europe 2.7% 21% 194.6 46.0 10.8 8.7 43.0 24.2 1.3 1.1 0.6 1.0 7.5 6.0 11.6 12.4Posco Korea 2.1% 15% 123.5 36.3 9.0 8.5 49.5 5.6 1.2 1.1 2.0 2.0 6.7 6.3 13.9 13.0Fortescue Metals Group Ltd. Australia 1.0% 90% 29.3 10.5 25.3 14.8 7.9 71.0 7.8 5.2 0.0 0.0 13.6 9.0 30.8 35.5Equinox Minerals Ltd. Australia 0.7% 75% 6.1 2.4 10.2 5.0 NM NM 2.0 1.3 0.0 0.0 - - 19.3 26.2Macarthur Coal Ltd. Australia 0.4% 35% 10.0 2.0 16.7 11.2 -13.5 49.6 1.9 1.7 2.7 4.0 11.6 7.9 11.2 15.3
ChemicalsAvery Dennison Corp. US 0.8% 23% 41.1 3.8 12.5 12.2 33.3 2.6 2.7 2.9 2.2 2.3 8.6 8.6 21.6 24.1
Construction & MaterialsFLSmidth & Co. A/S Europe 0.8% 47% 24.5 2.9 11.7 13.4 -23.7 -13.1 1.9 1.7 2.6 2.6 7.9 8.6 16.4 13.0Holcim Europe 1.8% 34% 84.2 21.8 15.1 11.8 8.1 28.1 1.1 1.0 2.4 2.9 8.6 7.9 7.4 8.8
Food & BeveragesCarlsberg Europe 1.5% 54% 56.1 8.4 11.1 9.4 21.4 18.2 0.9 0.8 1.1 1.3 7.7 7.2 7.8 8.6Anheuser-Busch InBev Europe 2.2% 35% 114.7 77.7 15.5 13.6 15.9 14.4 2.5 2.2 1.4 1.7 10.3 9.7 16.1 16.1Unilever (NV) Europe 2.9% 25% 160.1 54.4 15.0 13.9 12.0 8.3 4.8 4.2 3.8 4.0 9.6 9.1 32.1 30.5Diageo Europe 2.0% 13% 89.0 40.8 13.0 12.0 9.0 8.9 5.4 4.5 3.9 4.1 10.4 9.8 41.8 37.5Coca-Cola Co. US 3.5% 14% 545.0 125.4 15.9 14.6 10.6 9.1 5.2 4.9 3.3 3.6 11.8 10.9 32.9 34.0
HealthcareMylan Laboratories US 1.5% 24% 112.7 5.0 11.0 9.3 28.2 18.0 1.3 1.1 0.0 0.0 7.4 6.6 12.2 12.2Pfizer, Inc. US 3.6% 19% 792.7 141.5 7.8 7.3 11.7 6.7 1.4 1.3 4.3 7.3 3.7 3.7 18.5 18.0Waters Corporation US 1.1% 17% 47.1 5.5 15.3 14.0 10.5 9.5 5.2 4.6 0.0 0.0 11.2 10.4 34.3 32.9
Industrial Goods & ServicesExpeditors Int'l US 1.7% 58% 77.3 7.1 26.9 23.0 10.3 17.4 4.7 4.2 1.3 1.3 13.3 11.7 17.3 18.4Boeing Company US 2.8% 23% 308.5 35.5 11.3 11.5 NM -1.7 30.3 14.7 3.4 3.5 6.2 6.6 NM NMEmerson Electric US 2.7% 21% 185.0 29.6 18.7 15.6 -2.3 20.4 3.3 3.4 3.4 3.5 9.9 9.1 17.5 21.9ABB Ltd Europe 2.7% 34% 162.0 45.5 18.6 15.7 -15.3 18.2 3.2 2.9 2.3 2.4 10.9 9.3 17.1 18.4EADS Europe 1.0% 29% 42.9 15.5 11.8 9.7 0.9 22.0 0.8 0.8 1.6 1.6 1.0 0.9 7.1 8.3Komatsu Japan 2.4% 39% 120.2 19.1 29.6 18.9 25.2 56.3 2.0 1.8 1.1 1.4 11.2 9.1 6.7 9.7Hitachi Construction Machinery Japan 1.1% 52% 39.6 5.1 44.7 18.3 34.4 NM 1.5 1.4 0.7 1.0 11.6 9.7 3.3 7.6Daikin Industries Japan 1.3% 40% 46.6 10.0 32.0 17.8 97.5 79.5 1.8 1.7 1.2 1.2 12.5 9.8 5.7 9.4Kawasaki Kisen Japan 0.6% 24% 31.6 2.4 NM 39.3 NM NM 0.7 0.7 0.0 1.1 16.2 8.9 NA 1.9
Oil & GasSchlumberger Ltd. US 3.1% 14% 540.7 77.8 23.4 17.6 1.6 33.0 3.6 3.2 1.3 1.3 11.5 9.4 15.5 17.9
Personal & Household GoodsPhilip Morris Intl US 3.4% 30% 355.6 94.8 12.9 11.5 16.2 11.7 33.6 NM 4.8 5.6 9.0 8.5 NM NAAvon Products US 2.3% 52% 112.1 13.9 15.1 13.6 28.6 11.1 9.8 5.6 2.7 2.9 9.7 8.9 65.3 41.6Nike US 1.8% 29% 214.3 25.0 16.5 14.8 3.7 11.5 3.0 2.7 1.8 1.9 9.8 8.8 18.0 18.3British American Tobacco Europe 2.6% 41% 105.8 64.1 11.8 10.9 8.0 8.1 4.3 3.9 5.5 5.9 9.6 9.0 36.2 35.8LVMH Moet-Hennessy Louis Vuitton Europe 2.2% 26% 103.0 51.6 17.5 15.4 8.0 13.5 2.3 2.1 2.3 2.5 10.0 9.1 13.0 13.6Richemont Europe 1.4% 25% 56.4 15.1 17.9 15.7 -11.4 14.1 2.0 1.8 1.5 1.7 NM 18.4 11.1 11.6Shiseido Japan 1.0% 25% 34.7 7.4 22.7 21.6 3.3 5.1 1.9 1.8 3.0 3.0 8.0 7.4 8.3 8.4Unicharm Japan 0.6% 15% 23.0 6.5 24.0 21.9 12.6 9.5 2.8 2.5 0.8 0.9 8.3 7.7 11.5 11.3
Real EstateProLogis US 1.7% 12% 117.8 5.6 NM NM NM NM 1.0 0.7 5.1 5.1 NM NM NA NA
TechnologyNVIDIA Corp. US 2.5% 62% 209.3 6.9 20.1 16.7 NM 20.6 2.6 2.6 0.0 0.0 9.7 - 13.2 15.6Novellus Systems US 1.3% 59% 78.4 2.1 15.2 11.2 NM 35.7 1.7 1.5 0.0 0.0 8.2 6.4 10.9 13.6Ericsson Europe 2.8% 39% 157.2 31.7 13.7 11.3 36.8 20.7 1.5 1.4 2.7 3.0 6.2 5.5 11.2 12.6Samsung Electronics Korea 3.0% 25% 262.9 88.4 10.2 9.6 29.5 5.9 1.6 1.3 0.8 1.0 6.9 6.4 15.3 14.0LG Electronics Korea 1.7% 18% 126.9 13.7 7.1 6.7 15.8 5.5 1.5 1.2 0.7 0.9 11.4 10.5 20.5 18.0
UtilitiesAES Corp. US 1.9% 68% 89.6 9.0 10.9 10.0 13.8 9.3 NA NA 0.0 0.0 6.5 6.2 NA NA
Median 29% 112 17 15.1 12.0 11.1 15.5 1.9 1.7 1.5 1.7 9.6 8.7 14.9 14.7* Sales for US, Europe, Korea and Australia, Operating Income for Japan
GLOBAL BRIC EXPOSURE BASKET (GSSTDM50)P/E (x) P/B (x) Dividend Yield (%) EV / EBITDA (x) Return on Equity (%)Earnings growth (%)
Source: Factset, I/B/E/S, Goldman Sachs Global ECS Research.
Our basket includes companies from the main developed regions. Europe provides more
than one-third of the companies. As outlined previously, we believe that European
companies are increasingly exposed to EM growth. However, the US, Japan, Korea and
Australia also have companies with significant exposure to EMs and we include
companies with significant emerging market exposure in our global BRIC basket.
This developed market basket includes 12 companies included in the GS SUSTAIN focus
list of long-term industry leaders. Those companies are BBVA, HSBC, Standard Chartered,
BHP Billiton, Unilever, Diageo, Coca-Cola, Emerson Electric, ABB, Schlumberger, Nike and
Richemont. While the GS SUSTAIN framework integrates analysis of all key drivers of
competitive advantage in each sector, exposure to growing regions is an important driver
of sustained industry leadership in many sectors.

November 4, 2009 Global: Portfolio Strategy
Goldman Sachs Global Economics, Commodities and Strategy Research 32
The companies are weighted according to their exposure to EMs, their free float market
capitalization and their daily liquidity. However, we have also kept any single stock weight
below 4% to avoid idiosyncratic risks. Although the basket is not strictly equally weighted,
the standard deviation of weight is only 0.9%.
We have optimized the liquidity in order to increase the tradability of this basket. The DM
Nifty 50 basket offers EM-like return with an increased liquidity. Liquidity can indeed
quickly dry out in emerging markets. The majority of companies in our global BRIC basket
are large caps with stable liquidity. The median company has a market cap of $18 bn and a
6-month daily average liquidity of $112 mn.
Exhibit 49: Our DM Nifty 50 basket performed in line
with the MSCI EM
Backtest over the last three years
Exhibit 50: Geographical origin of our DM Nifty 50
basket
0
20
40
60
80
100
120
140
160
180
Oct-06 Jun-07 Feb-08 Oct-08 Jun-09M SCI EM M SCI World DM Nifty 50 basket
Australia 2%
US 21%
Korea 10%
Europe 41%
Japan 10%
y
Source: Goldman Sachs Global ECS Research.
Source: Goldman Sachs Global ECS Research.
Our DM Nifty 50 basket comprises a broad selection of sectors (14 out of 19). But there is
an understandable bias towards industrial, basic resources and consumer stocks. The
infrastructure growth story highlighted above should be particularly beneficial for
industrial and commodity related stocks. But the emerging consumer theme in BRICs
should increasingly benefit branded consumer stocks.

November 4, 2009 Global: Portfolio Strategy
Goldman Sachs Global Economics, Commodities and Strategy Research 33
Exhibit 51: Our DM Nifty 50 basket comprises a wide range of sectors
Basic Resources16%
Food & Beverage10%
Health Care6%
Technology10%
Industrial Goods & Services
18%
Utilities2%
Oil & Gas2%
Chemicals2%
Real Estate2%
Banks6%
Construction & Materials
4%Automobiles & Parts
6%
Personal & Household Goods16%
Source: Goldman Sachs Global ECS Research.
Performance
In terms of performance, the DM Nifty 50 BRICs basket has performed in line with the
MSCI Emerging Markets and tracks this index closely. Over the last three years, investing
in these companies would have returned 16% in US dollar terms. This compares very well
with a broad developed index like the MSCI World, which over the same period lost c.20%
(Exhibit 49). We think this outperformance reflects the diverging economic paths between
emerging and advanced economies. Investing in the global BRIC basket provides investors
an emerging market-like return with possibly less corporate governance and political risks.
Valuation, volatility and liquidity
Given that the performance of this basket is very close to the performance of the emerging
markets themselves, there are four reasons why investors might want to buy the DM Nifty
50.
1) To hedge against the domestic benchmarks of the markets that the companies are in.
Given that we think these companies offer better growth prospects, we expect them to
outperform the broader equity indices.
2) Because they offer better value than their emerging market counterparts (Exhibit 41).
In terms of valuation, GSSTDM50 is cheaper on an EV/EBITDA basis than MSCI EM and
has a higher EBIT margin than either MSCI World or MSCI EM for both next year and the
year after. While the P/B is higher than the other main indices, the basket has a premium
ROE of over 16% for 2011. Revisions have also been higher for our basket over the last
month than for MSCI EM or MSCI World.
The DM Nifty 50 basket offers an EM-like return with a lower volatility. Although it has a
higher volatility than the MSCI World developed, the 3-month realized volatility has been
on average 1.2 vol points below the MSCI EM realized volatility over the last three years
(Exhibit 52).

November 4, 2009 Global: Portfolio Strategy
Goldman Sachs Global Economics, Commodities and Strategy Research 34
Exhibit 52: Volatiliy is lower for our DM Nifty 50 basket than for MSCI EM
Daily 3-mth realized volatility
-6
-4
-2
0
2
4
6
8
Oct-06 Apr-07 Oct-07 Apr-08 Oct-08 Apr-09
Difference betw een MSCI EM andGlobal BRIC Nifty 50 3-mth realizedvolatility
Average = 1.2
Source: Datastream, Goldman Sachs Global ECS Research.
4) Finally, we believe that our DM Nifty 50 basket offers a liquid vehicle through which to
get exposure to emerging markets. This differs meaningfully from some emerging markets
where the fluctuation of liquidity could provide a significant hurdle for investors. The
median market cap in our DM Nifty 50 basket is $18 bn and the median liquidity, measured
as the last six months’ average daily liquidity, is $112 mn.

November 4, 2009 Global: Portfolio Strategy
Goldman Sachs Global Economics, Commodities and Strategy Research 35
Other disclosures
The Equities Division of the firm has previously introduced the basket of securities discussed in this report. The Equity Analyst may have been
consulted as to the composition of the basket prior to its launch. However, the views expressed in this research and its timing were not shared with
the Equities Division. Note: The ability to trade this basket will depend upon market conditions, including liquidity and borrow constraints at the time
of trade.
RegAC
We, Peter Oppenheimer and Andrew Howard, hereby certify that all of the views expressed in this report accurately reflect our personal views about
the subject company or companies and its or their securities. We also certify that no part of our compensation was, is or will be, directly or indirectly,
related to the specific recommendations or views expressed in this report.
Disclosures
Disclosures required by United States laws and regulations
See company-specific regulatory disclosures above for any of the following disclosures required as to companies referred to in this report: manager
or co-manager in a pending transaction; 1% or other ownership; compensation for certain services; types of client relationships; managed/co-
managed public offerings in prior periods; directorships; for equity securities, market making and/or specialist role. Goldman Sachs usually makes a
market in fixed income securities of issuers discussed in this report and usually deals as a principal in these securities.
The following are additional required disclosures: Ownership and material conflicts of interest: Goldman Sachs policy prohibits its analysts,
professionals reporting to analysts and members of their households from owning securities of any company in the analyst's area of coverage.
Analyst compensation: Analysts are paid in part based on the profitability of Goldman Sachs, which includes investment banking revenues. Analyst as officer or director: Goldman Sachs policy prohibits its analysts, persons reporting to analysts or members of their households from serving as
an officer, director, advisory board member or employee of any company in the analyst's area of coverage. Non-U.S. Analysts: Non-U.S. analysts
may not be associated persons of Goldman, Sachs & Co. and therefore may not be subject to NASD Rule 2711/NYSE Rules 472 restrictions on
communications with subject company, public appearances and trading securities held by the analysts.
Additional disclosures required under the laws and regulations of jurisdictions other than the United States
The following disclosures are those required by the jurisdiction indicated, except to the extent already made above pursuant to United States laws
and regulations. Australia: This research, and any access to it, is intended only for "wholesale clients" within the meaning of the Australian
Corporations Act. Canada: Goldman Sachs Canada Inc. has approved of, and agreed to take responsibility for, this research in Canada if and to the
extent it relates to equity securities of Canadian issuers. Analysts may conduct site visits but are prohibited from accepting payment or
reimbursement by the company of travel expenses for such visits. Hong Kong: Further information on the securities of covered companies referred
to in this research may be obtained on request from Goldman Sachs (Asia) L.L.C. India: Further information on the subject company or companies
referred to in this research may be obtained from Goldman Sachs (India) Securities Private Limited; Japan: See below. Korea: Further information
on the subject company or companies referred to in this research may be obtained from Goldman Sachs (Asia) L.L.C., Seoul Branch. Russia: Research reports distributed in the Russian Federation are not advertising as defined in the Russian legislation, but are information and analysis not
having product promotion as their main purpose and do not provide appraisal within the meaning of the Russian legislation on appraisal activity.
Singapore: Further information on the covered companies referred to in this research may be obtained from Goldman Sachs (Singapore) Pte.
(Company Number: 198602165W). Taiwan: This material is for reference only and must not be reprinted without permission. Investors should
carefully consider their own investment risk. Investment results are the responsibility of the individual investor. United Kingdom: Persons who
would be categorized as retail clients in the United Kingdom, as such term is defined in the rules of the Financial Services Authority, should read this
research in conjunction with prior Goldman Sachs research on the covered companies referred to herein and should refer to the risk warnings that
have been sent to them by Goldman Sachs International. A copy of these risks warnings, and a glossary of certain financial terms used in this report,
are available from Goldman Sachs International on request.
European Union: Disclosure information in relation to Article 4 (1) (d) and Article 6 (2) of the European Commission Directive 2003/126/EC is
available at http://www.gs.com/client_services/global_investment_research/europeanpolicy.html which states the European Policy for Managing
Conflicts of Interest in Connection with Investment Research.
Japan: Goldman Sachs Japan Co., Ltd. is a Financial Instrument Dealer under the Financial Instrument and Exchange Law, registered with the Kanto Financial Bureau (Registration No. 69), and is a member of Japan Securities Dealers Association (JSDA) and Financial Futures Association of Japan (FFAJ). Sales and purchase of equities are subject to commission pre-determined with clients plus consumption tax. See company-specific disclosures as to any applicable disclosures required by Japanese stock exchanges, the
Japanese Securities Dealers Association or the Japanese Securities Finance Company.
Ratings, coverage groups and views and related definitions
Buy (B), Neutral (N), Sell (S) -Analysts recommend stocks as Buys or Sells for inclusion on various regional Investment Lists. Being assigned a Buy
or Sell on an Investment List is determined by a stock's return potential relative to its coverage group as described below. Any stock not assigned as
a Buy or a Sell on an Investment List is deemed Neutral. Each regional Investment Review Committee manages various regional Investment Lists to
a global guideline of 25%-35% of stocks as Buy and 10%-15% of stocks as Sell; however, the distribution of Buys and Sells in any particular coverage

November 4, 2009 Global: Portfolio Strategy
Goldman Sachs Global Economics, Commodities and Strategy Research 36
group may vary as determined by the regional Investment Review Committee. Regional Conviction Buy and Sell lists represent investment
recommendations focused on either the size of the potential return or the likelihood of the realization of the return.
Return potential represents the price differential between the current share price and the price target expected during the time horizon associated
with the price target. Price targets are required for all covered stocks. The return potential, price target and associated time horizon are stated in
each report adding or reiterating an Investment List membership.
Coverage groups and views: A list of all stocks in each coverage group is available by primary analyst, stock and coverage group at
http://www.gs.com/research/hedge.html. The analyst assigns one of the following coverage views which represents the analyst's investment outlook
on the coverage group relative to the group's historical fundamentals and/or valuation. Attractive (A). The investment outlook over the following 12
months is favorable relative to the coverage group's historical fundamentals and/or valuation. Neutral (N). The investment outlook over the
following 12 months is neutral relative to the coverage group's historical fundamentals and/or valuation. Cautious (C). The investment outlook over
the following 12 months is unfavorable relative to the coverage group's historical fundamentals and/or valuation.
Not Rated (NR). The investment rating and target price have been removed pursuant to Goldman Sachs policy when Goldman Sachs is acting in an
advisory capacity in a merger or strategic transaction involving this company and in certain other circumstances. Rating Suspended (RS). Goldman
Sachs Research has suspended the investment rating and price target for this stock, because there is not a sufficient fundamental basis for
determining an investment rating or target. The previous investment rating and price target, if any, are no longer in effect for this stock and should
not be relied upon. Coverage Suspended (CS). Goldman Sachs has suspended coverage of this company. Not Covered (NC). Goldman Sachs does
not cover this company. Not Available or Not Applicable (NA). The information is not available for display or is not applicable. Not Meaningful (NM). The information is not meaningful and is therefore excluded.
Global product; distributing entities
The Global Investment Research Division of Goldman Sachs produces and distributes research products for clients of Goldman Sachs, and pursuant
to certain contractual arrangements, on a global basis. Analysts based in Goldman Sachs offices around the world produce equity research on
industries and companies, and research on macroeconomics, currencies, commodities and portfolio strategy. This research is disseminated in
Australia by Goldman Sachs JBWere Pty Ltd (ABN 21 006 797 897) on behalf of Goldman Sachs; in Canada by Goldman Sachs Canada Inc. regarding
Canadian equities and by Goldman Sachs & Co. (all other research); in Hong Kong by Goldman Sachs (Asia) L.L.C.; in India by Goldman Sachs
(India) Securities Private Ltd.; in Japan by Goldman Sachs Japan Co., Ltd.; in the Republic of Korea by Goldman Sachs (Asia) L.L.C., Seoul Branch; in
New Zealand by Goldman Sachs JBWere (NZ) Limited on behalf of Goldman Sachs; in Russia by OOO Goldman Sachs; in Singapore by Goldman
Sachs (Singapore) Pte. (Company Number: 198602165W); and in the United States of America by Goldman, Sachs & Co. Goldman Sachs
International has approved this research in connection with its distribution in the United Kingdom and European Union.
European Union: Goldman Sachs International, authorized and regulated by the Financial Services Authority, has approved this research in
connection with its distribution in the European Union and United Kingdom; Goldman, Sachs & Co. oHG, regulated by the Bundesanstalt für
Finanzdienstleistungsaufsicht, may also distribute research in Germany.
General disclosures
This research is for our clients only. Other than disclosures relating to Goldman Sachs, this research is based on current public information that we
consider reliable, but we do not represent it is accurate or complete, and it should not be relied on as such. We seek to update our research as
appropriate, but various regulations may prevent us from doing so. Other than certain industry reports published on a periodic basis, the large
majority of reports are published at irregular intervals as appropriate in the analyst's judgment.
Goldman Sachs conducts a global full-service, integrated investment banking, investment management, and brokerage business. We have
investment banking and other business relationships with a substantial percentage of the companies covered by our Global Investment Research
Division. SIPC: Goldman, Sachs & Co., the United States broker dealer, is a member of SIPC (http://www.sipc.org).
Our salespeople, traders, and other professionals may provide oral or written market commentary or trading strategies to our clients and our
proprietary trading desks that reflect opinions that are contrary to the opinions expressed in this research. Our asset management area, our
proprietary trading desks and investing businesses may make investment decisions that are inconsistent with the recommendations or views
expressed in this research.
We and our affiliates, officers, directors, and employees, excluding equity and credit analysts, will from time to time have long or short positions in,
act as principal in, and buy or sell, the securities or derivatives, if any, referred to in this research.
This research is not an offer to sell or the solicitation of an offer to buy any security in any jurisdiction where such an offer or solicitation would be
illegal. It does not constitute a personal recommendation or take into account the particular investment objectives, financial situations, or needs of
individual clients. Clients should consider whether any advice or recommendation in this research is suitable for their particular circumstances and,
if appropriate, seek professional advice, including tax advice. The price and value of investments referred to in this research and the income from
them may fluctuate. Past performance is not a guide to future performance, future returns are not guaranteed, and a loss of original capital may
occur. Fluctuations in exchange rates could have adverse effects on the value or price of, or income derived from, certain investments.
Certain transactions, including those involving futures, options, and other derivatives, give rise to substantial risk and are not suitable for all
investors. Investors should review current options disclosure documents which are available from Goldman Sachs sales representatives or at
http://www.theocc.com/publications/risks/riskchap1.jsp. Transactions cost may be significant in option strategies calling for multiple purchase and
sales of options such as spreads. Supporting documentation will be supplied upon request.
Our research is disseminated primarily electronically, and, in some cases, in printed form. Electronic research is simultaneously available to all
clients.
Disclosure information is also available at http://www.gs.com/research/hedge.html or from Research Compliance, One New York Plaza, New York,
NY 10004.
Copyright 2009 The Goldman Sachs Group, Inc.
No part of this material may be (i) copied, photocopied or duplicated in any form by any means or (ii) redistributed without the prior written consent of The Goldman Sachs Group, Inc.