Embed Size (px)
Citation preview
Global Powers of Retailing 2019
Contents
Top 250 quick statistics 4
Global economic outlook 5
Top 10 highlights 8
Global Powers of Retailing Top 250 11
Geographic analysis 19
Product sector analysis 23
New entrants 27
Fastest 50 30
Study methodology and data sources 35
Endnotes 39
Contacts 41

Welcome to the 22nd edition of Global Powers of
Retailing. The report identifies the 250 largest retailers
around the world based on publicly available data for
FY2017 (fiscal years ended through June 2018), and
analyzes their performance across geographies and
product sectors. It also provides a global economic
outlook, looks at the 50 fastest-growing retailers, and
highlights new entrants to the Top 250.
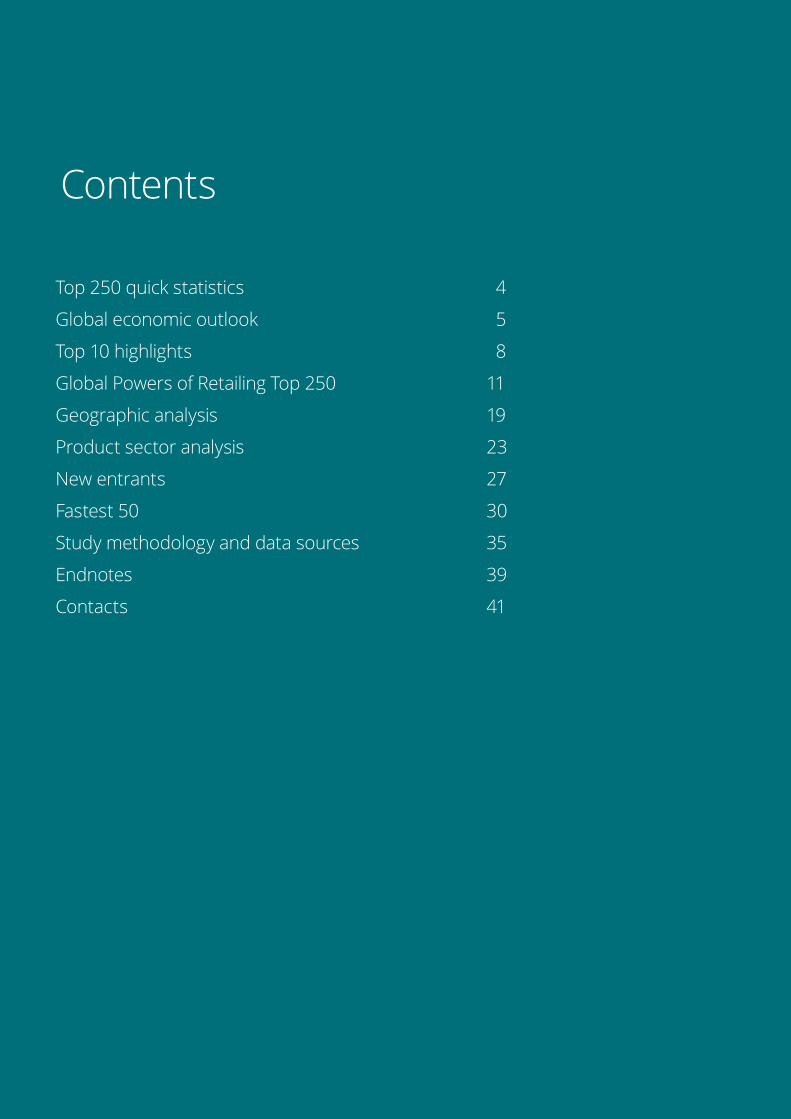
Source: Deloitte Touche Tohmatsu Limited. Global Powers of Retailing 2019. Analysis of financial performance and operations for fiscal years ended through June 2018 using company annual reports, Supermarket News, Forbes America’s largest private companies and other sources.
5.7%
23.6% 10
US$18.1 billion
Composite net profit margin
Composite year-over-year retail
revenue growth
Share of Top 250 aggregate retail revenue
from foreign operations
Average number of countries where
companies have retail operations
Average size of Top 250
(retail revenue)
Composite return on assets
Minimum retail revenue required to be
among Top 250
Aggregate retail revenue
of Top 250
2.3%
US$4.53 trillion
5.0%
Top 250 quick statistics, FY2017
US$3.7 billion
Top 250 retailers with foreign
operations
65.6%
3.3%
5-year retail revenue growth
(CAGR from FY2012-201
4

Global economic outlook
5
Major economic trends
Protectionism hinders investment and trade
In 2018, the US government embarked on a dramatic transformation of their trade policy, in order to cut the trade deficit. The policy is based on a review of existing trade partnerships and the application of trade tariffs. The US withdrew from the Trans-Pacific Partnership (TPP), imposed tariffs on the imports of steel and aluminum from the European Union (EU), Canada and Mexico, and imposed a substantial array of tariffs on imports from China. In addition, the US completed a renegotiation of North American Free Trade Agreement (NAFTA). Finally, the US threatened to impose tariffs on all automotive imports. Tariffs are a tax imposed on imports or exports as a measure to control competition and generate revenue. They raise prices and, thereby, reduce consumer purchasing power; they add to the cost of production for companies that import components; they invite retaliation, which has already taken place, thereby hurting export competitiveness; and they disrupt established global supply chains. By the end of 2018, the tariffs had not been in place long enough to significantly influence consumer spending. That will come later. Rather, the tariffs and the uncertainty about their future had a chilling effect on business investment. In addition, new orders for exports fell as businesses worried about the future impact of tariffs and other trade restrictions. Finally, major producers of consumer goods began to seek new locations for final assembly in order to avoid tariffs.
US monetary policy shakes global asset markets
With an overheated economy leading to expectations of higher inflation, the US Federal Reserve has been raising short-term interest rates. The main impact in 2018 was to boost the value of the US dollar, which suppressed emerging market currencies, thereby compelling their central banks to raise interest rates and to cause a decline in equity prices around the world. Further fiscal tightening is expected in 2019, leading to stress in credit markets and, potentially, further stress in emerging markets.
Growth slows in Europe and China, peaks in the US
In 2018, economic growth slowed in key markets. In Europe, a combination of higher energy prices, a higher valued euro, and trade uncertainty contributed to the slowdown. In China, excess capacity suppressed investment, an overvalued currency hurt exports, and trade uncertainty hurt both. In the US, growth strengthened in 2018 owing to the tax cut, but by the end of the year, there were signs of deceleration. There is widespread expectation that global growth will slow down further in 2019.
Energy and commodity prices reverse course
Until mid-2018, energy and other commodity prices were rising quickly. This was due to strong global demand. In the case of oil, it was also due to efforts by major producers to limit production. In addition, the withdrawal of the US from the Iran nuclear deal led to the expectation that a large amount of production of crude would be withdrawn from the market. However, by late 2018, prices were falling quickly. Among the reasons were decelerating global demand, the expectation of a slowdown in the US, a surge in US crude output, and the rising value of the US dollar. Other commodity prices started to fall for similar reasons. If in 2019 this trend continues, it will mean added purchasing power for consumers in commodity consuming nations, disinflationary pressure in those countries, and financial stress in commodity producing countries – especially those in the emerging world.
Major markets
United States
The US economy received a boost from fiscal policy in 2018, with a combination of tax cuts and spending increases,
which fueled increased demand and caused a temporary acceleration of growth. Yet fiscal policy also led to bottlenecks and wage acceleration, given that the economy was already at
The global economy is currently at a turning point. Until early 2018, there had been a confluence of positive events including relatively strong global economic growth, low inflation, low borrowing costs, easy monetary policy in major markets, recovery in troubled emerging markets, and rising asset prices. Yet something changed in 2018. Growth decelerated in Europe, China, and Japan; inflation accelerated in major markets; borrowing costs increased as major governments embarked on a shift in monetary and fiscal policies; global equity and commodity prices fell; and major emerging markets experienced significant currency depreciation. The shift in the global economy was, in part, brought on by a change in policy in the United States (US). There, a combination of easier fiscal policy, tighter monetary policy, and restrictive trade policy contributed to a change in the direction of the global economy. For retailers, this change will mean slower consumer spending growth, higher consumer prices, and disrupted global supply chains. In what follows, we will examine how the global economy is likely to unfold, and the potential implications this will have on the retailing industry.
6
Global Powers of Retailing 2019 | Global economic outlook
full employment. The Federal Reserve responded by raising interest rates, a process which is likely to continue in 2019. Ultimately, tight monetary policy combined with trade wars and a potential reversal of fiscal policy will cause the economy to slow down and, possibly, go into recession within two to three years. With weak investment and exports, consumer spending has fueled growth. Yet spending has mostly risen faster than income, as households dipped into savings and took on more debt. This situation is not sustainable indefinitely. Unless there is a significant acceleration in wages, it is likely that growth in consumer spending will slow down in 2019. Moreover, after tariffs have been fully implemented, this too could negatively affect consumer spending.
Eurozone
In 2018, after very strong growth, the Eurozone economy decelerated considerably owing to higher energy prices, a high valued euro, trade uncertainty, and weakening global
demand. Yet the Eurozone is not at risk of recession. Inflation remains low owing to high unemployment in many Eurozone countries. This is likely to result in continued easy monetary policy. In addition, fiscal policy is easing in several countries, energy prices are declining, and the euro is falling in value. Thus, growth is likely to stabilize at a slower pace than in 2017. The biggest risk to the Eurozone is political. That is, high unemployment has fueled a populist backlash against European integration. In elections, non-traditional parties have increased their share of the vote, making it more difficult to form coalitions and to govern. The risk of conflict between the EU and member countries has risen, weakening its ability to respond to future crises. As of late 2018, a conflict was already under way between Italy and the EU over the size of Italy’s planned budget deficit. The outcome of this dispute remains uncertain.
China
China’s economy decelerated in 2018, despite an easing of monetary policy meant to offset the potential impact of worsening trade relations with the US.
The deceleration was due to weak export demand (itself the result of an overvalued currency); and a weakening of fixed asset investment, partly owing to excess capacity, and partly owing to trade concerns. Longer term, onerous demographics are boosting labor costs and weakening consumer spending growth. A debate now rages within China as to the future direction of policy, especially in an environment where globalization is threatened. China could go down the road towards market liberalization and freer trade with countries other than the US or it could turn inward and focus on state-run companies and a state managed economy. Meanwhile, the government has sought to fill the gap left by the US pivoting away from Asia. It is seeking to lead a free trade regime within the Asia Pacific region, and has used its vast surplus to fund infrastructure investment in friendly countries through the Belt and Road Initiative.
Japan
Japan’s economy faces a conundrum. For some time, growth has stemmed disproportionately from exports. Yet with a slowdown in the global economy, a threat to China-based supply chains
and with the protectionist policies of the US government, Japan cannot depend on exports exclusively for growth. Although the government has encouraged a shift toward growth based on domestic demand, its efforts have not yet been successful. A tight labor market has generated higher wages, but consumer spending has not responded commensurately. Meanwhile, at the time of this writing the government intends to boost the national sales tax in 2019 in order to assure future fiscal integrity. Yet the last time this tax was raised, it led to a recession. The central bank has indicated that it will not tighten monetary policy until the tax is implemented, but it has shied away from further easing of policy, despite the failure to bring inflation to the central bank’s target rate.
Others
The fastest growing large economy in the world is India. Growth revived after the temporary negative effects of a currency reform and the implementation of a national sales tax. Investment has been strong, partly due to confidence in the reform agenda of the government. However, a shift toward trade restrictions bodes poorly for further market liberalization. In addition, India has faced financial contagion stemming from the rapid rise in the value of the US dollar. Downward pressure on the rupee has tied the hands of the central bank, potentially slowing growth. Longer term, however, India’s favorable demographics bode well for strong growth and a rising middle class.
Brazil is at a crossroads. The economy has recovered slowly from its worst recession of the modern era. A newly elected government promises change, but the direction of change remains uncertain. The new government is led by a president from the right, who in the past has favored statist, protectionist, and isolationist policies. Yet his top economic advisor favors market liberalization similar to what transpired in Chile in the 1970s and 1980s. Which direction the government takes will determine the economic future.
Likewise, Mexico is at a crossroads. Having negotiated a successor agreement to NAFTA, Mexico can now turn to domestic concerns (providing that the new trade deal is approved by US Congress – which is not guaranteed). Mexico, like Brazil, has a new president. He comes from the left, but in the past has governed regionally as a centrist. He promises to make big changes, but also promises to honor past commitments. The direction of policy, therefore, remains uncertain. Meanwhile, the economy has already been weakened by the trade uncertainty of the past two years.
Across the emerging world, there are headwinds that could cause a further slowdown in growth in 2019. These include the necessity of boosting interest rates in order to stabilize currencies that are being pummeled by the rising US dollar. The decline in commodity prices will hurt export revenue and create financial market stress; and the trade tensions between the US and its trading partners, which is creating uncertainty about future trading rules and has already led to weakened export demand. It is likely that economic growth in 2019 will be slower than in 2018 in most major emerging economies.
7
Global Powers of Retailing 2019 | Global economic outlook

Top 10 highlights

Top 250 rank
Change in rank Name of company
Country of origin
FY2017 Retail
revenue (US$M)
FY2017 Retail
revenue growth
FY2017 Net
profit margin
FY2017 Return
on assets
FY2012-2017
Retail revenue
CAGR*# Countries
of operation
% Retail revenue
from foreign operations
1 Wal-Mart Stores, Inc. US 500,343 3.0% 2.1% 5.1% 1.3% 29 23.9%
2 Costco Wholesale Corporation US 129,025 8.7% 2.1% 7.5% 5.4% 12 27.2%
3 The Kroger Co. US 118,982 3.2% 1.5% 5.1% 4.2% 1 0.0%
4 +2 Amazon.com, Inc. US 118,573 25.3% 1.7% 2.3% 18.0% 14 36.8%
5 -1 Schwarz Group Germany 111,766 7.4% n/a n/a 7.5% 30 58.9%
6 +1 The Home Depot, Inc. US 100,904 6.7% 8.6% 19.4% 6.2% 4 8.4%
7 -2 Walgreens Boots Alliance, Inc. US 99,115 2.1% 3.5% 6.2% 6.7% 10 11.9%
8 Aldi Einkauf GmbH & Co. oHG Germany 98,287 e 7.7% n/a n/a 7.2% 18 65.1%
9 +1 CVS Health Corporation US 79,398 -2.1% n/a n/a 4.5% 3 0.8%
10 +1 Tesco PLC UK 73,961 2.8% 1.5% 1.9% -2.4% 8 20.7%
Top 101 1,430,353 6.1% 2.0% 5.5% 3.7% 12.9² 25.1%
Top 2501 4,530,059 5.7% 2.3% 5.0% 3.3% 9.5² 23.6%
Top 10 share of Top 250 retail revenue 31.6%
*Compound annual growth rate¹ Sales-weighted, currency-adjusted composites² Average
Top 10 retailers, FY2017
No change to the Top 10 list, while Amazon jumps two spots
The world’s Top 10 retailers contributed 31.6 percent share to the Top 250’s total retail revenue in FY2017, an increase of 0.9 percentage point year-on-year. The top three retailers maintained their positions, while Amazon jumped up two positions to No. 4 with the highest retail revenue growth of 25.3 percent.
Walmart retained its position as the world’s largest retailer, with an improvement in its retail revenue growth of 3.0 percent in FY2017. Major growth drivers have been the acquisition of e-commerce websites such as Jet.com, ModCloth, Shoes.com, Moosejaw, and Bonobos; greater investments in store remodeling to integrate its store and digital businesses;1 and investment in store wages. Walmart’s recent initiatives include the acquisition of Indian retailer, Flipkart, and its partnership with Japanese retailer Rakuten.2
Costco maintained its No. 2 ranking in the Top 10 list, showing an improvement of 8.7 percent in its retail revenue compared to 2.2 percent in FY2016. This was primarily due to a 4.0 percent increase in comparable sales, changes in gasoline prices which positively impacted net sales, and the opening of new warehouses between FY2016 and FY2017, including expanding operations into France and Iceland.3
Solely operating in the US, Kroger’s revenue grew following its merger with Modern HC Holdings. Supermarket sales increased because of the company’s launch of the “Restock Kroger” initiative in 2017. This focuses on data-driven marketing strategy around pricing, personalized communications with customers, and a massive revamp of product assortment in company stores across the country.4 In February 2018, the company entered into a definitive agreement for the sale of its convenience store business unit to EG Group for US$2.15 billion.
Amazon’s 33 percent increase in its North America region’s sales contributed to its strong revenue growth in FY2017. In addition, unit sales increased, largely because of the company’s continued efforts to reduce prices for customers, including shipping offers through its Prime delivery service, increasing its inventory availability, and the surge in holiday season shopping especially towards the last three months of 2017. The acquisition of Whole Foods also contributed to the high revenue growth, partly driven by the high sales of fresh seafood and other perishable items.5
Schwarz Group slipped to fifth position despite a higher retail revenue growth of 7.4 percent in FY2017, compared to 5.3 percent in FY2016. Strong performance of its Lidl stores in countries such as Austria, Spain, and the Czech Republic contributed to the high sales growth. However, the company’s
e = estimaten/a = not available
Source: Deloitte Touche Tohmatsu Limited. Global Powers of Retailing 2019. Analysis of financial performance and operations for fiscal years ended through June 2018 using company annual reports, Supermarket News, Forbes America’s largest private companies and other sources.
Carrefour S.A. has been excluded from this year’s report at the company’s request.
9
Global Powers of Retailing 2019 | Top 10 highlights
recent entrance into the US was marked by the opening of only 50 stores by the end of FY2017, less than the number initially planned.6
Atlanta-based home-improvement retail giant, The Home Depot, ranked sixth, joining the 100-billion-dollar retail club with US$100.9 billion sales in FY2017 and an increase in comparable store sales by 6.8 percent year-on-year. The company is focusing efforts on an interconnected retail experience through its own e-commerce site.7
Walgreens Boots Alliance completed its acquisition of 1,932 stores and three distribution centers from Rite Aid at the end of 2018.8 The remaining stores were sold to grocery giant Albertsons. Walgreens Boots Alliance and Prime Therapeutics closed a merger in March 2017 to form a combined central specialty pharmacy and mail services company, AllianceRx Walgreens Prime, as part of their strategic alliance.9 Amid various restructuring activities, the company slipped two positions to now become the seventh-largest retailer in the world despite higher comparable store sales (up 2.8 percent in FY2017).
A strong store expansion strategy helped Aldi to post a high revenue growth of 7.7 percent in FY2017 compared to 4.8 percent in FY2016, and retain its position in eighth place in the Top 10 list. Following its closest competitor’s entry into the US market, Aldi plans to invest US$3.4 billion to open 2,500 stores by the end of 2022 and become the third-largest retailer by count serving more than 100 million customers a month.10
CVS Health’s Retail/LTC Segment net revenue for year ended December 31, 2017 declined 2.1% as compared to FY2016 with Pharmacy representing 75% of net revenues. Nearly flat same store prescription volumes, along with reimbursement pressure and generic introductions as well as restrictions from participating in some networks, led to a 2.6 percent decline in CVS Pharmacy same store sales in 2017. In December 2017, CVS Health Corporation entered into a definitive merger agreement to acquire all of the outstanding shares of healthcare company Aetna Inc., for US$69 billion.13 This combines the local presence and clinical capabilities of CVS Health with Aetna’s leading health care benefits and services.14
Tesco, the UK retail giant, entered the Top 10 retailer list with US$74 billion sales, ranking it in tenth position in FY2017. The company registered a year-on-year revenue growth of 2.8%. This was largely driven by the company’s growing focus on fresh food and the re-launch of over 10,000 private label products, which fueled strong sales performance in the UK. Operations in other countries were affected by in-country changes, such as in Poland where legislation restricted trading on Sundays; and in Thailand, where Tesco decided to exit the non-profitable cash and carry sales format.11 In March 2018, the Group completed a merger with Booker Group PLC, one of the UK’s largest food wholesaler. In addition, Tesco and Carrefour announced a strategic partnership in 2018, whereby both companies will pool their combined spend on groceries to enter into a collaborative procurement program, with the goal of lower prices across private-label brands owned by Tesco and Carrefour.12
Stacking up: Top 10 versus Top 250
The world’s Top 10 retailers are much more globally focused, with operations on average in 13 countries versus 10 for the overall Top 250. Kroger remains the only Top 10 retailer not operating internationally at this point. Retail revenue from foreign operations for the top ten retailers declined to 25.1 percent in 2017 as compared to 27.3 percent in 2016. Companies like Costco, Schwarz Group, and Aldi continue to expand their global retail footprint.
On a sales-weighted, currency-adjusted composite basis, growth of the Top 10 outpaced that for the Top 250 retailers, at 6.1 percent and 5.7 percent respectively. This was mainly driven by the high revenue growth from retailers like Walmart, Costco, Amazon, and Schwarz Group. However, the net profit margin composite for the Top 10 was weaker than the previous year and when compared to the Top 250. This is in large part because eight of the Top 10 retailers operate in the low-margin Fast Moving Consumer Goods (FMCG) sector (the exceptions are Amazon and The Home Depot), where margins are increasingly under pressure from rising costs, lower pricing power due to increased competition and transparency, and the need to invest in digital transformation of the businesses.
Higher efficiency of business operations and inventory control by the Top 10 retailers earned them a 0.5 percentage point lead in terms of Return on Assets (ROA) performance over the Top 250.
10
Global Powers of Retailing 2019 | Top 10 highlights

Global Powers of Retailing Top 250
11
Global Powers of Retailing Top 250Record growth of retail revenue in FY2017
The Global Powers of Retailing Top 250 companies achieved strong growth in FY2017. Retail revenue increased for nearly 83.2 percent of the world’s 250 largest retailers (208 companies), resulting in a currency-adjusted composite growth rate of 5.7 percent, much higher than the previous year’s 4.1 percent growth. Ninety two percent of the companies that disclosed their bottom-line results (168 of 183 companies) operated profitably.
In aggregate, retail revenue for the Top 250 companies was US$4.53 trillion in FY2017, which roughly translates to an average size of US$18.1 billion per company. Although both the cumulative retail revenue for the Top 250 and the average retail revenue per company was higher in FY2017 than FY2016, fewer than a quarter (55 of 250 companies) posted FY2017 higher than average sales.
On a composite basis, the reporting companies posted a net profit margin of 2.3 percent in FY2017, lower than the 3.2 percent in FY2016, thereby indicating more focus on top
line growth. The return on assets of 5.0 percent was better in FY2017 than the 3.3 percent reported in FY2016.
In order to be a part of the Top 250 in FY2017, companies required retail revenue of at least US$3.7 billion, up slightly from the prior year’s US$3.6 billion. This was due in part to increased M&A activity, the opening of new stores (both in the local markets and an increasing number of countries of operation) and sales uplift resulting from competitive pricing. Eighteen of the Top 250 companies exceeded US$50 billion in retail revenue in FY2017, while 55 companies posted retail revenue below US$5.0 billion, which was seven fewer than the previous year.
The level of retail globalization has remained similar to FY2016, with companies now focused on improving economies of scale, operational efficiency and generating revenue from e-commerce channels. About two-thirds of the Top 250 (164 of 250) operated outside their home country. On average, they had retail operations in 10 countries and derived 23.6 percent of their composite retail revenue from foreign operations.
Top 250 companies that do not derive the majority of their revenue from retail operations are excluded from the composite net profit margin and return on assets calculations. Because these companies are not primarily retailers, their consolidated profits and assets mostly reflect their non-retail activities.
The average number of countries with retail operations includes the location of franchised, licensed, and joint venture operations in addition to corporate-owned channels of distribution. Where information was available, the number of countries reflects non-store sales channels, such as localized, consumer-oriented e-commerce sites; catalogs and TV shopping programs; as well as store locations. However, for some retailers, specific information about non-store activity was not available.
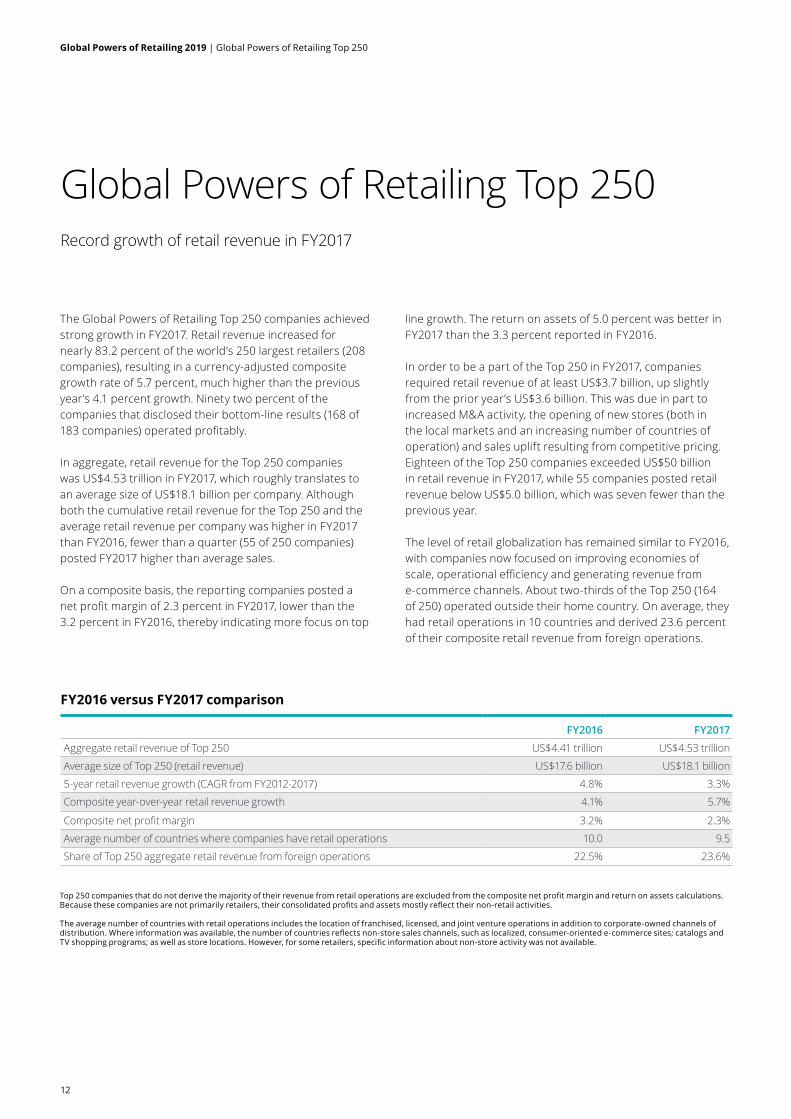
FY2016 FY2017
Aggregate retail revenue of Top 250 US$4.41 trillion US$4.53 trillion
Average size of Top 250 (retail revenue) US$17.6 billion US$18.1 billion
5-year retail revenue growth (CAGR from FY2012-2017) 4.8% 3.3%
Composite year-over-year retail revenue growth 4.1% 5.7%
Composite net profit margin 3.2% 2.3%
Average number of countries where companies have retail operations 10.0 9.5
Share of Top 250 aggregate retail revenue from foreign operations 22.5% 23.6%
FY2016 versus FY2017 comparison
12
Global Powers of Retailing 2019 | Global Powers of Retailing Top 250
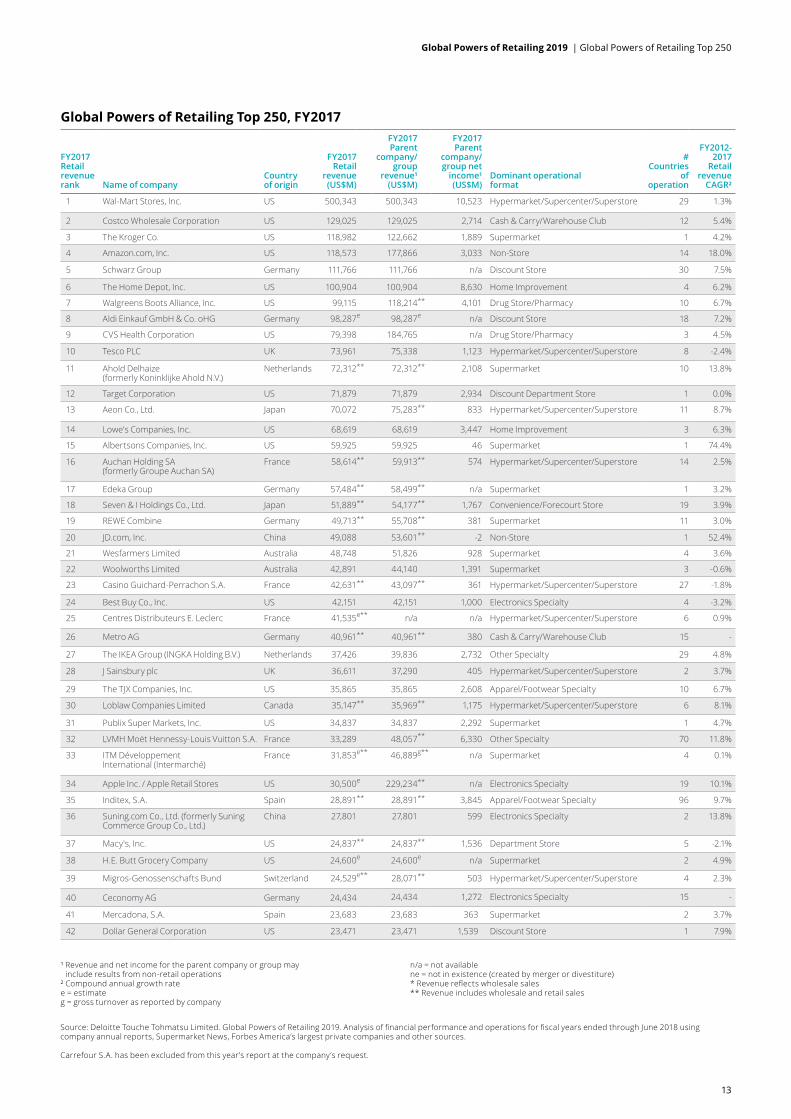
FY2017 Retail revenue rank Name of company
Country of origin
FY2017 Retail
revenue (US$M)
FY2017 Parent
company/ group
revenue¹ (US$M)
FY2017 Parent
company/group net
income¹ (US$M)
Dominant operational format
# Countries
of operation
FY2012-2017
Retail revenue
CAGR²
1 Wal-Mart Stores, Inc. US 500,343 500,343 10,523 Hypermarket/Supercenter/Superstore 29 1.3%
2 Costco Wholesale Corporation US 129,025 129,025 2,714 Cash & Carry/Warehouse Club 12 5.4%
3 The Kroger Co. US 118,982 122,662 1,889 Supermarket 1 4.2%
4 Amazon.com, Inc. US 118,573 177,866 3,033 Non-Store 14 18.0%
5 Schwarz Group Germany 111,766 111,766 n/a Discount Store 30 7.5%
6 The Home Depot, Inc. US 100,904 100,904 8,630 Home Improvement 4 6.2%
7 Walgreens Boots Alliance, Inc. US 99,115 118,214** 4,101 Drug Store/Pharmacy 10 6.7%
8 Aldi Einkauf GmbH & Co. oHG Germany 98,287e 98,287e n/a Discount Store 18 7.2%
9 CVS Health Corporation US 79,398 184,765 n/a Drug Store/Pharmacy 3 4.5%
10 Tesco PLC UK 73,961 75,338 1,123 Hypermarket/Supercenter/Superstore 8 -2.4%
11 Ahold Delhaize (formerly Koninklijke Ahold N.V.)
Netherlands 72,312** 72,312** 2,108 Supermarket 10 13.8%
12 Target Corporation US 71,879 71,879 2,934 Discount Department Store 1 0.0%
13 Aeon Co., Ltd. Japan 70,072 75,283** 833 Hypermarket/Supercenter/Superstore 11 8.7%
14 Lowe's Companies, Inc. US 68,619 68,619 3,447 Home Improvement 3 6.3%
15 Albertsons Companies, Inc. US 59,925 59,925 46 Supermarket 1 74.4%
16 Auchan Holding SA (formerly Groupe Auchan SA)
France 58,614** 59,913** 574 Hypermarket/Supercenter/Superstore 14 2.5%
17 Edeka Group Germany 57,484** 58,499** n/a Supermarket 1 3.2%
18 Seven & I Holdings Co., Ltd. Japan 51,889** 54,177** 1,767 Convenience/Forecourt Store 19 3.9%
19 REWE Combine Germany 49,713** 55,708** 381 Supermarket 11 3.0%
20 JD.com, Inc. China 49,088 53,601** -2 Non-Store 1 52.4%
21 Wesfarmers Limited Australia 48,748 51,826 928 Supermarket 4 3.6%
22 Woolworths Limited Australia 42,891 44,140 1,391 Supermarket 3 -0.6%
23 Casino Guichard-Perrachon S.A. France 42,631** 43,097** 361 Hypermarket/Supercenter/Superstore 27 -1.8%
24 Best Buy Co., Inc. US 42,151 42,151 1,000 Electronics Specialty 4 -3.2%
25 Centres Distributeurs E. Leclerc France 41,535e** n/a n/a Hypermarket/Supercenter/Superstore 6 0.9%
26 Metro AG Germany 40,961** 40,961** 380 Cash & Carry/Warehouse Club 15 -
27 The IKEA Group (INGKA Holding B.V.) Netherlands 37,426 39,836 2,732 Other Specialty 29 4.8%
28 J Sainsbury plc UK 36,611 37,290 405 Hypermarket/Supercenter/Superstore 2 3.7%
29 The TJX Companies, Inc. US 35,865 35,865 2,608 Apparel/Footwear Specialty 10 6.7%
30 Loblaw Companies Limited Canada 35,147** 35,969** 1,175 Hypermarket/Supercenter/Superstore 6 8.1%
31 Publix Super Markets, Inc. US 34,837 34,837 2,292 Supermarket 1 4.7%
32 LVMH Moët Hennessy-Louis Vuitton S.A. France 33,289 48,057** 6,330 Other Specialty 70 11.8%
33 ITM Développement International (Intermarché)
France 31,853e** 46,889g** n/a Supermarket 4 0.1%
34 Apple Inc. / Apple Retail Stores US 30,500e 229,234** n/a Electronics Specialty 19 10.1%
35 Inditex, S.A. Spain 28,891** 28,891** 3,845 Apparel/Footwear Specialty 96 9.7%
36 Suning.com Co., Ltd. (formerly Suning Commerce Group Co., Ltd.)
China 27,801 27,801 599 Electronics Specialty 2 13.8%
37 Macy's, Inc. US 24,837** 24,837** 1,536 Department Store 5 -2.1%
38 H.E. Butt Grocery Company US 24,600e 24,600e n/a Supermarket 2 4.9%
39 Migros-Genossenschafts Bund Switzerland 24,529e** 28,071** 503 Hypermarket/Supercenter/Superstore 4 2.3%
40 Ceconomy AG Germany 24,434 24,434 1,272 Electronics Specialty 15 -
41 Mercadona, S.A. Spain 23,683 23,683 363 Supermarket 2 3.7%
42 Dollar General Corporation US 23,471 23,471 1,539 Discount Store 1 7.9%
Global Powers of Retailing Top 250, FY2017
¹ Revenue and net income for the parent company or group may include results from non-retail operations
² Compound annual growth ratee = estimate g = gross turnover as reported by company
Source: Deloitte Touche Tohmatsu Limited. Global Powers of Retailing 2019. Analysis of financial performance and operations for fiscal years ended through June 2018 using company annual reports, Supermarket News, Forbes America’s largest private companies and other sources.
Carrefour S.A. has been excluded from this year’s report at the company’s request.
n/a = not availablene = not in existence (created by merger or divestiture)* Revenue reflects wholesale sales** Revenue includes wholesale and retail sales
13
Global Powers of Retailing 2019 | Global Powers of Retailing Top 250
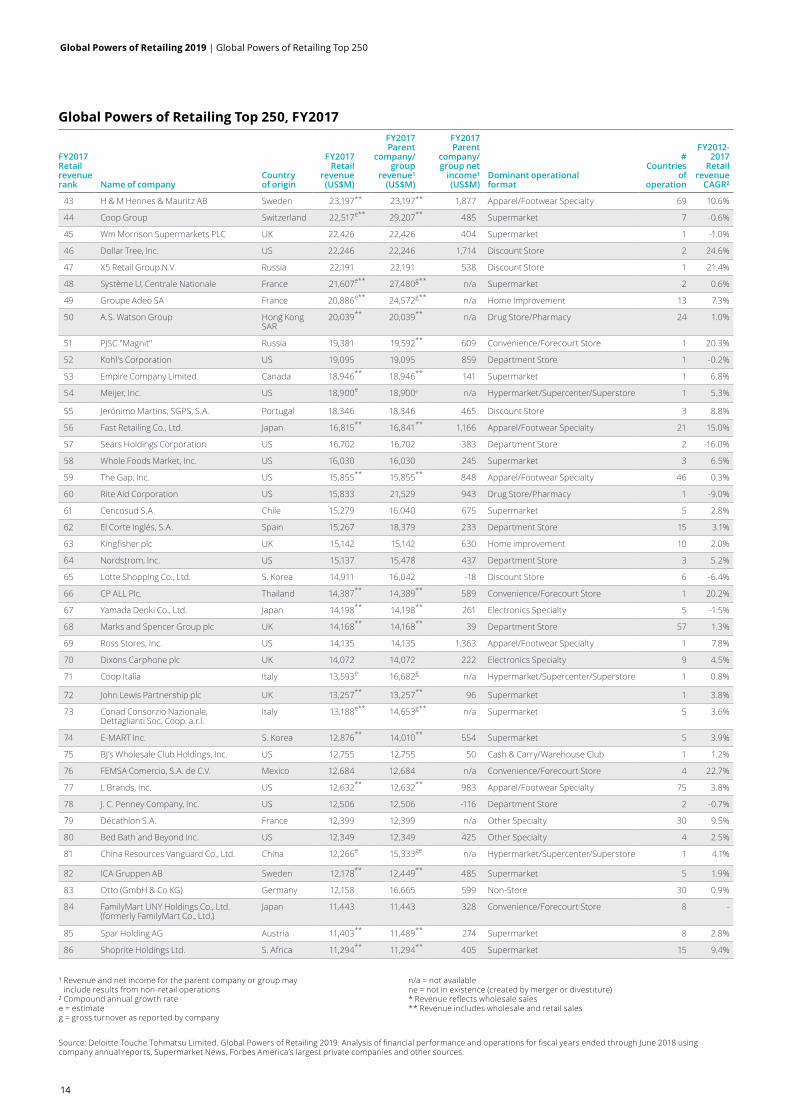
FY2017 Retail revenue rank Name of company
Country of origin
FY2017 Retail
revenue (US$M)
FY2017 Parent
company/ group
revenue¹ (US$M)
FY2017 Parent
company/group net
income¹ (US$M)
Dominant operational format
# Countries
of operation
FY2012-2017
Retail revenue
CAGR²
43 H & M Hennes & Mauritz AB Sweden 23,197** 23,197** 1,877 Apparel/Footwear Specialty 69 10.6%
44 Coop Group Switzerland 22,517e** 29,207** 485 Supermarket 7 -0.6%
45 Wm Morrison Supermarkets PLC UK 22,426 22,426 404 Supermarket 1 -1.0%
46 Dollar Tree, Inc. US 22,246 22,246 1,714 Discount Store 2 24.6%
47 X5 Retail Group N.V. Russia 22,191 22,191 538 Discount Store 1 21.4%
48 Système U, Centrale Nationale France 21,607e** 27,480g** n/a Supermarket 2 0.6%
49 Groupe Adeo SA France 20,886e** 24,572g** n/a Home Improvement 13 7.3%
50 A.S. Watson Group Hong Kong SAR
20,039** 20,039** n/a Drug Store/Pharmacy 24 1.0%
51 PJSC "Magnit" Russia 19,381 19,592** 609 Convenience/Forecourt Store 1 20.3%
52 Kohl's Corporation US 19,095 19,095 859 Department Store 1 -0.2%
53 Empire Company Limited Canada 18,946** 18,946** 141 Supermarket 1 6.8%
54 Meijer, Inc. US 18,900e 18,900e n/a Hypermarket/Supercenter/Superstore 1 5.3%
55 Jerónimo Martins, SGPS, S.A. Portugal 18,346 18,346 465 Discount Store 3 8.8%
56 Fast Retailing Co., Ltd. Japan 16,815** 16,841** 1,166 Apparel/Footwear Specialty 21 15.0%
57 Sears Holdings Corporation US 16,702 16,702 -383 Department Store 2 -16.0%
58 Whole Foods Market, Inc. US 16,030 16,030 245 Supermarket 3 6.5%
59 The Gap, Inc. US 15,855** 15,855** 848 Apparel/Footwear Specialty 46 0.3%
60 Rite Aid Corporation US 15,833 21,529 943 Drug Store/Pharmacy 1 -9.0%
61 Cencosud S.A. Chile 15,279 16,040 675 Supermarket 5 2.8%
62 El Corte Inglés, S.A. Spain 15,267 18,379 233 Department Store 15 3.1%
63 Kingfisher plc UK 15,142 15,142 630 Home improvement 10 2.0%
64 Nordstrom, Inc. US 15,137 15,478 437 Department Store 3 5.2%
65 Lotte Shopping Co., Ltd. S. Korea 14,911 16,042 -18 Discount Store 6 -6.4%
66 CP ALL Plc. Thailand 14,387** 14,389** 589 Convenience/Forecourt Store 1 20.2%
67 Yamada Denki Co., Ltd. Japan 14,198** 14,198** 261 Electronics Specialty 5 -1.5%
68 Marks and Spencer Group plc UK 14,168** 14,168** 39 Department Store 57 1.3%
69 Ross Stores, Inc. US 14,135 14,135 1,363 Apparel/Footwear Specialty 1 7.8%
70 Dixons Carphone plc UK 14,072 14,072 222 Electronics Specialty 9 4.5%
71 Coop Italia Italy 13,593e 16,682g n/a Hypermarket/Supercenter/Superstore 1 0.8%
72 John Lewis Partnership plc UK 13,257** 13,257** 96 Supermarket 1 3.8%
73 Conad Consorzio Nazionale, Dettaglianti Soc. Coop. a.r.l.
Italy 13,188e** 14,653g** n/a Supermarket 5 3.6%
74 E-MART Inc. S. Korea 12,876** 14,010** 554 Supermarket 5 3.9%
75 BJ’s Wholesale Club Holdings, Inc. US 12,755 12,755 50 Cash & Carry/Warehouse Club 1 1.2%
76 FEMSA Comercio, S.A. de C.V. Mexico 12,684 12,684 n/a Convenience/Forecourt Store 4 22.7%
77 L Brands, Inc. US 12,632** 12,632** 983 Apparel/Footwear Specialty 75 3.8%
78 J. C. Penney Company, Inc. US 12,506 12,506 -116 Department Store 2 -0.7%
79 Décathlon S.A. France 12,399 12,399 n/a Other Specialty 30 9.5%
80 Bed Bath and Beyond Inc. US 12,349 12,349 425 Other Specialty 4 2.5%
81 China Resources Vanguard Co., Ltd. China 12,266e 15,333ge n/a Hypermarket/Supercenter/Superstore 1 4.1%
82 ICA Gruppen AB Sweden 12,178** 12,449** 485 Supermarket 5 1.9%
83 Otto (GmbH & Co KG) Germany 12,158 16,665 599 Non-Store 30 0.9%
84 FamilyMart UNY Holdings Co., Ltd. (formerly FamilyMart Co., Ltd.)
Japan 11,443 11,443 328 Convenience/Forecourt Store 8 -
85 Spar Holding AG Austria 11,403** 11,489** 274 Supermarket 8 2.8%
86 Shoprite Holdings Ltd. S. Africa 11,294** 11,294** 405 Supermarket 15 9.4%
Global Powers of Retailing Top 250, FY2017
¹ Revenue and net income for the parent company or group may include results from non-retail operations
² Compound annual growth ratee = estimate g = gross turnover as reported by company
Source: Deloitte Touche Tohmatsu Limited. Global Powers of Retailing 2019. Analysis of financial performance and operations for fiscal years ended through June 2018 using company annual reports, Supermarket News, Forbes America’s largest private companies and other sources.
n/a = not availablene = not in existence (created by merger or divestiture)* Revenue reflects wholesale sales** Revenue includes wholesale and retail sales
14
Global Powers of Retailing 2019 | Global Powers of Retailing Top 250
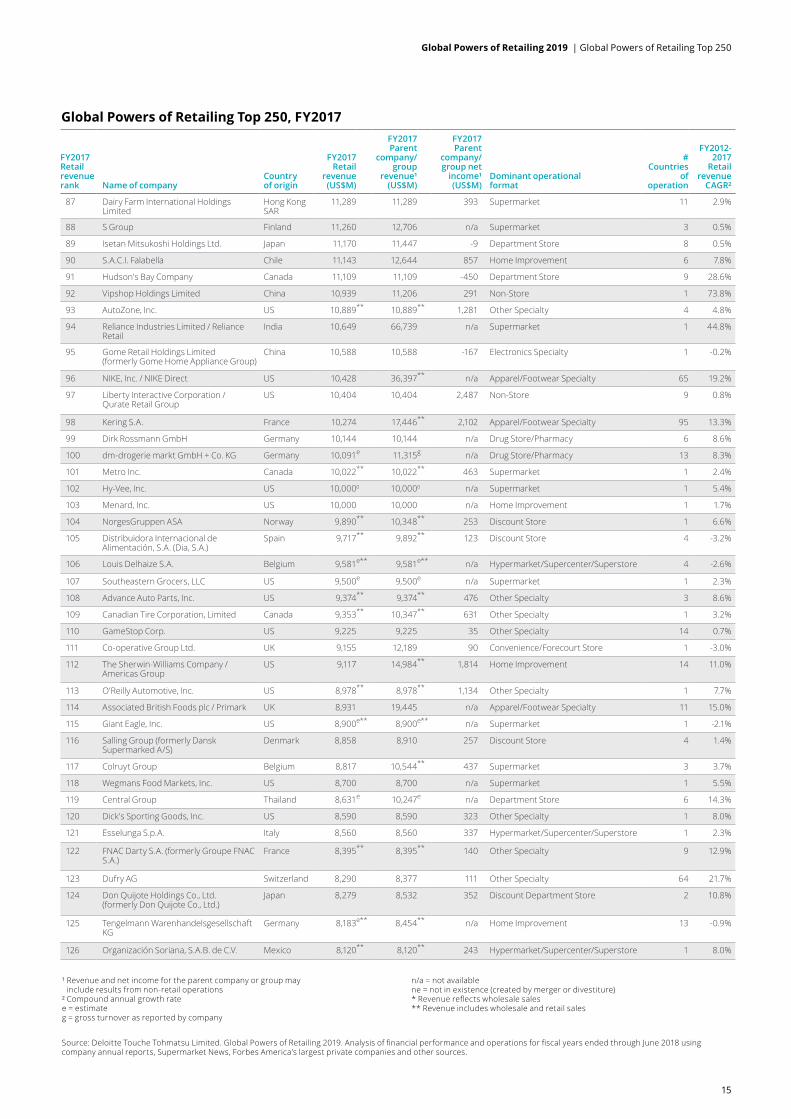
FY2017 Retail revenue rank Name of company
Country of origin
FY2017 Retail
revenue (US$M)
FY2017 Parent
company/ group
revenue¹ (US$M)
FY2017 Parent
company/group net
income¹ (US$M)
Dominant operational format
# Countries
of operation
FY2012-2017
Retail revenue
CAGR²
87 Dairy Farm International Holdings Limited
Hong Kong SAR
11,289 11,289 393 Supermarket 11 2.9%
88 S Group Finland 11,260 12,706 n/a Supermarket 3 0.5%
89 Isetan Mitsukoshi Holdings Ltd. Japan 11,170 11,447 -9 Department Store 8 0.5%
90 S.A.C.I. Falabella Chile 11,143 12,644 857 Home Improvement 6 7.8%
91 Hudson's Bay Company Canada 11,109 11,109 -450 Department Store 9 28.6%
92 Vipshop Holdings Limited China 10,939 11,206 291 Non-Store 1 73.8%
93 AutoZone, Inc. US 10,889** 10,889** 1,281 Other Specialty 4 4.8%
94 Reliance Industries Limited / Reliance Retail
India 10,649 66,739 n/a Supermarket 1 44.8%
95 Gome Retail Holdings Limited (formerly Gome Home Appliance Group)
China 10,588 10,588 -167 Electronics Specialty 1 -0.2%
96 NIKE, Inc. / NIKE Direct US 10,428 36,397** n/a Apparel/Footwear Specialty 65 19.2%
97 Liberty Interactive Corporation / Qurate Retail Group
US 10,404 10,404 2,487 Non-Store 9 0.8%
98 Kering S.A. France 10,274 17,446** 2,102 Apparel/Footwear Specialty 95 13.3%
99 Dirk Rossmann GmbH Germany 10,144 10,144 n/a Drug Store/Pharmacy 6 8.6%
100 dm-drogerie markt GmbH + Co. KG Germany 10,091e 11,315g n/a Drug Store/Pharmacy 13 8.3%
101 Metro Inc. Canada 10,022** 10,022** 463 Supermarket 1 2.4%
102 Hy-Vee, Inc. US 10,0000 10,0000 n/a Supermarket 1 5.4%
103 Menard, Inc. US 10,000 10,000 n/a Home Improvement 1 1.7%
104 NorgesGruppen ASA Norway 9,890** 10,348** 253 Discount Store 1 6.6%
105 Distribuidora Internacional de Alimentación, S.A. (Dia, S.A.)
Spain 9,717** 9,892** 123 Discount Store 4 -3.2%
106 Louis Delhaize S.A. Belgium 9,581e** 9,581e** n/a Hypermarket/Supercenter/Superstore 4 -2.6%
107 Southeastern Grocers, LLC US 9,500e 9,500e n/a Supermarket 1 2.3%
108 Advance Auto Parts, Inc. US 9,374** 9,374** 476 Other Specialty 3 8.6%
109 Canadian Tire Corporation, Limited Canada 9,353** 10,347** 631 Other Specialty 1 3.2%
110 GameStop Corp. US 9,225 9,225 35 Other Specialty 14 0.7%
111 Co-operative Group Ltd. UK 9,155 12,189 90 Convenience/Forecourt Store 1 -3.0%
112 The Sherwin-Williams Company / Americas Group
US 9,117 14,984** 1,814 Home Improvement 14 11.0%
113 O'Reilly Automotive, Inc. US 8,978** 8,978** 1,134 Other Specialty 1 7.7%
114 Associated British Foods plc / Primark UK 8,931 19,445 n/a Apparel/Footwear Specialty 11 15.0%
115 Giant Eagle, Inc. US 8,900e** 8,900e** n/a Supermarket 1 -2.1%
116 Salling Group (formerly Dansk Supermarked A/S)
Denmark 8,858 8,910 257 Discount Store 4 1.4%
117 Colruyt Group Belgium 8,817 10,544** 437 Supermarket 3 3.7%
118 Wegmans Food Markets, Inc. US 8,700 8,700 n/a Supermarket 1 5.5%
119 Central Group Thailand 8,631e 10,247e n/a Department Store 6 14.3%
120 Dick's Sporting Goods, Inc. US 8,590 8,590 323 Other Specialty 1 8.0%
121 Esselunga S.p.A. Italy 8,560 8,560 337 Hypermarket/Supercenter/Superstore 1 2.3%
122 FNAC Darty S.A. (formerly Groupe FNAC S.A.)
France 8,395** 8,395** 140 Other Specialty 9 12.9%
123 Dufry AG Switzerland 8,290 8,377 111 Other Specialty 64 21.7%
124 Don Quijote Holdings Co., Ltd. (formerly Don Quijote Co., Ltd.)
Japan 8,279 8,532 352 Discount Department Store 2 10.8%
125 Tengelmann Warenhandelsgesellschaft KG
Germany 8,183e** 8,454** n/a Home Improvement 13 -0.9%
126 Organización Soriana, S.A.B. de C.V. Mexico 8,120** 8,120** 243 Hypermarket/Supercenter/Superstore 1 8.0%
¹ Revenue and net income for the parent company or group may include results from non-retail operations
² Compound annual growth ratee = estimate g = gross turnover as reported by company
Source: Deloitte Touche Tohmatsu Limited. Global Powers of Retailing 2019. Analysis of financial performance and operations for fiscal years ended through June 2018 using company annual reports, Supermarket News, Forbes America’s largest private companies and other sources.
n/a = not availablene = not in existence (created by merger or divestiture)* Revenue reflects wholesale sales** Revenue includes wholesale and retail sales
Global Powers of Retailing Top 250, FY2017
15
Global Powers of Retailing 2019 | Global Powers of Retailing Top 250
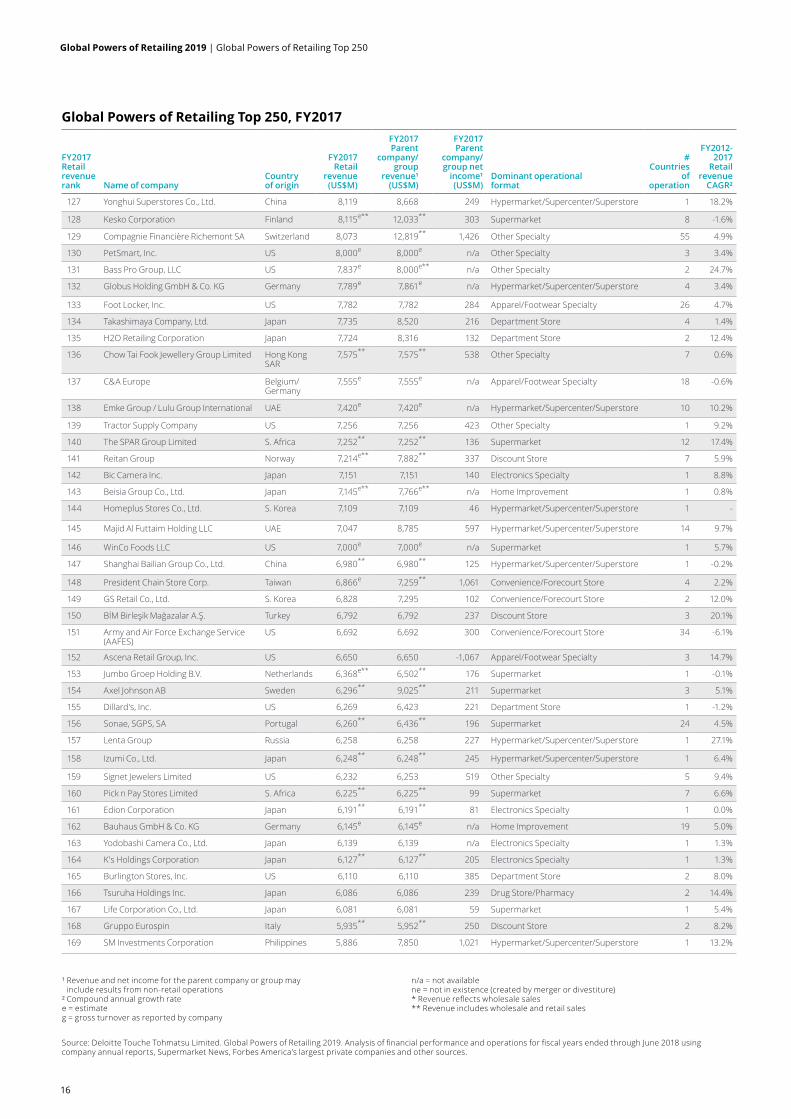
FY2017 Retail revenue rank Name of company
Country of origin
FY2017 Retail
revenue (US$M)
FY2017 Parent
company/ group
revenue¹ (US$M)
FY2017 Parent
company/group net
income¹ (US$M)
Dominant operational format
# Countries
of operation
FY2012-2017
Retail revenue
CAGR²
127 Yonghui Superstores Co., Ltd. China 8,119 8,668 249 Hypermarket/Supercenter/Superstore 1 18.2%
128 Kesko Corporation Finland 8,115e** 12,033** 303 Supermarket 8 -1.6%
129 Compagnie Financière Richemont SA Switzerland 8,073 12,819** 1,426 Other Specialty 55 4.9%
130 PetSmart, Inc. US 8,000e 8,000e n/a Other Specialty 3 3.4%
131 Bass Pro Group, LLC US 7,837e 8,000e** n/a Other Specialty 2 24.7%
132 Globus Holding GmbH & Co. KG Germany 7,789e 7,861e n/a Hypermarket/Supercenter/Superstore 4 3.4%
133 Foot Locker, Inc. US 7,782 7,782 284 Apparel/Footwear Specialty 26 4.7%
134 Takashimaya Company, Ltd. Japan 7,735 8,520 216 Department Store 4 1.4%
135 H2O Retailing Corporation Japan 7,724 8,316 132 Department Store 2 12.4%
136 Chow Tai Fook Jewellery Group Limited Hong Kong SAR
7,575** 7,575** 538 Other Specialty 7 0.6%
137 C&A Europe Belgium/ Germany
7,555e 7,555e n/a Apparel/Footwear Specialty 18 -0.6%
138 Emke Group / Lulu Group International UAE 7,420e 7,420e n/a Hypermarket/Supercenter/Superstore 10 10.2%
139 Tractor Supply Company US 7,256 7,256 423 Other Specialty 1 9.2%
140 The SPAR Group Limited S. Africa 7,252** 7,252** 136 Supermarket 12 17.4%
141 Reitan Group Norway 7,214e** 7,882** 337 Discount Store 7 5.9%
142 Bic Camera Inc. Japan 7,151 7,151 140 Electronics Specialty 1 8.8%
143 Beisia Group Co., Ltd. Japan 7,145e** 7,766e** n/a Home Improvement 1 0.8%
144 Homeplus Stores Co., Ltd. S. Korea 7,109 7,109 46 Hypermarket/Supercenter/Superstore 1 -
145 Majid Al Futtaim Holding LLC UAE 7,047 8,785 597 Hypermarket/Supercenter/Superstore 14 9.7%
146 WinCo Foods LLC US 7,000e 7,000e n/a Supermarket 1 5.7%
147 Shanghai Bailian Group Co., Ltd. China 6,980** 6,980** 125 Hypermarket/Supercenter/Superstore 1 -0.2%
148 President Chain Store Corp. Taiwan 6,866e 7,259** 1,061 Convenience/Forecourt Store 4 2.2%
149 GS Retail Co., Ltd. S. Korea 6,828 7,295 102 Convenience/Forecourt Store 2 12.0%
150 BİM Birleşik Mağazalar A.Ş. Turkey 6,792 6,792 237 Discount Store 3 20.1%
151 Army and Air Force Exchange Service (AAFES)
US 6,692 6,692 300 Convenience/Forecourt Store 34 -6.1%
152 Ascena Retail Group, Inc. US 6,650 6,650 -1,067 Apparel/Footwear Specialty 3 14.7%
153 Jumbo Groep Holding B.V. Netherlands 6,368e** 6,502** 176 Supermarket 1 -0.1%
154 Axel Johnson AB Sweden 6,296** 9,025** 211 Supermarket 3 5.1%
155 Dillard's, Inc. US 6,269 6,423 221 Department Store 1 -1.2%
156 Sonae, SGPS, SA Portugal 6,260** 6,436** 196 Supermarket 24 4.5%
157 Lenta Group Russia 6,258 6,258 227 Hypermarket/Supercenter/Superstore 1 27.1%
158 Izumi Co., Ltd. Japan 6,248** 6,248** 245 Hypermarket/Supercenter/Superstore 1 6.4%
159 Signet Jewelers Limited US 6,232 6,253 519 Other Specialty 5 9.4%
160 Pick n Pay Stores Limited S. Africa 6,225** 6,225** 99 Supermarket 7 6.6%
161 Edion Corporation Japan 6,191** 6,191** 81 Electronics Specialty 1 0.0%
162 Bauhaus GmbH & Co. KG Germany 6,145e 6,145e n/a Home Improvement 19 5.0%
163 Yodobashi Camera Co., Ltd. Japan 6,139 6,139 n/a Electronics Specialty 1 1.3%
164 K's Holdings Corporation Japan 6,127** 6,127** 205 Electronics Specialty 1 1.3%
165 Burlington Stores, Inc. US 6,110 6,110 385 Department Store 2 8.0%
166 Tsuruha Holdings Inc. Japan 6,086 6,086 239 Drug Store/Pharmacy 2 14.4%
167 Life Corporation Co., Ltd. Japan 6,081 6,081 59 Supermarket 1 5.4%
168 Gruppo Eurospin Italy 5,935** 5,952** 250 Discount Store 2 8.2%
169 SM Investments Corporation Philippines 5,886 7,850 1,021 Hypermarket/Supercenter/Superstore 1 13.2%
¹ Revenue and net income for the parent company or group may include results from non-retail operations
² Compound annual growth ratee = estimate g = gross turnover as reported by company
Source: Deloitte Touche Tohmatsu Limited. Global Powers of Retailing 2019. Analysis of financial performance and operations for fiscal years ended through June 2018 using company annual reports, Supermarket News, Forbes America’s largest private companies and other sources.
n/a = not availablene = not in existence (created by merger or divestiture)* Revenue reflects wholesale sales** Revenue includes wholesale and retail sales
Global Powers of Retailing Top 250, FY2017
16
Global Powers of Retailing 2019 | Global Powers of Retailing Top 250
FY2017 Retail revenue rank Name of company
Country of origin
FY2017 Retail
revenue (US$M)
FY2017 Parent
company/ group
revenue¹ (US$M)
FY2017 Parent
company/group net
income¹ (US$M)
Dominant operational format
# Countries
of operation
FY2012-2017
Retail revenue
CAGR²
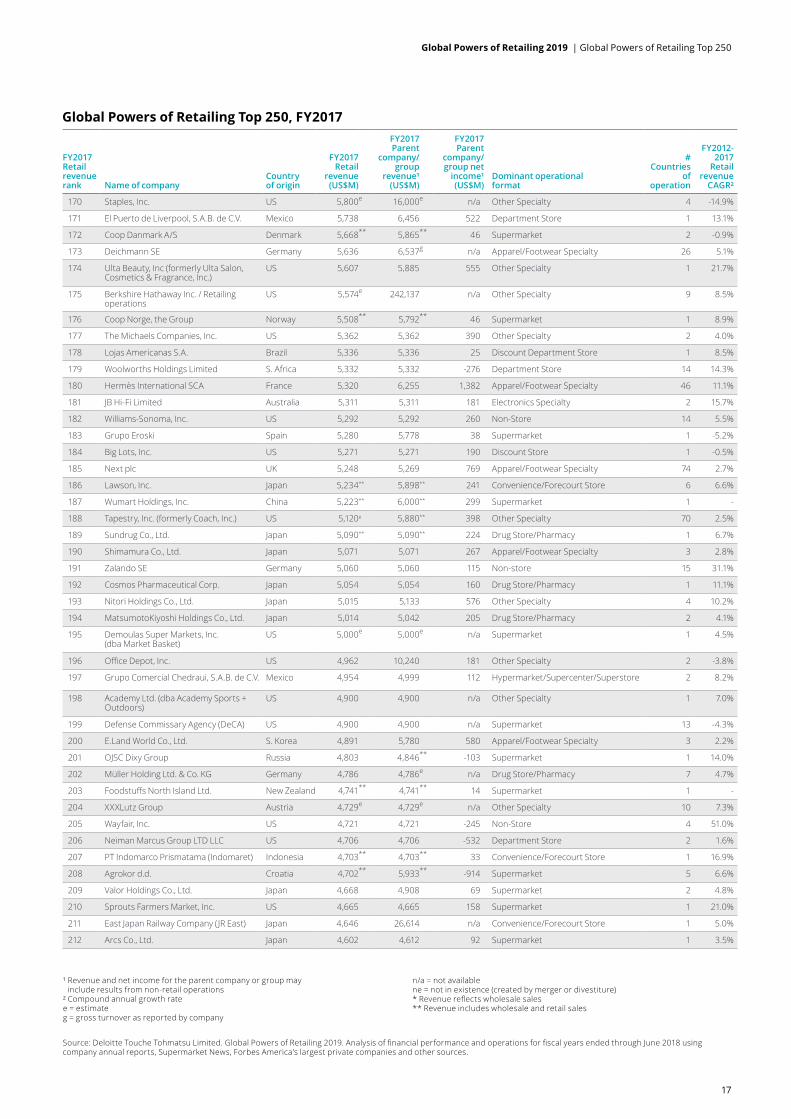
170 Staples, Inc. US 5,800e 16,000e n/a Other Specialty 4 -14.9%
171 El Puerto de Liverpool, S.A.B. de C.V. Mexico 5,738 6,456 522 Department Store 1 13.1%
172 Coop Danmark A/S Denmark 5,668** 5,865** 46 Supermarket 2 -0.9%
173 Deichmann SE Germany 5,636 6,537g n/a Apparel/Footwear Specialty 26 5.1%
174 Ulta Beauty, Inc (formerly Ulta Salon, Cosmetics & Fragrance, Inc.)
US 5,607 5,885 555 Other Specialty 1 21.7%
175 Berkshire Hathaway Inc. / Retailing operations
US 5,574e 242,137 n/a Other Specialty 9 8.5%
176 Coop Norge, the Group Norway 5,508** 5,792** 46 Supermarket 1 8.9%
177 The Michaels Companies, Inc. US 5,362 5,362 390 Other Specialty 2 4.0%
178 Lojas Americanas S.A. Brazil 5,336 5,336 25 Discount Department Store 1 8.5%
179 Woolworths Holdings Limited S. Africa 5,332 5,332 -276 Department Store 14 14.3%
180 Hermès International SCA France 5,320 6,255 1,382 Apparel/Footwear Specialty 46 11.1%
181 JB Hi-Fi Limited Australia 5,311 5,311 181 Electronics Specialty 2 15.7%
182 Williams-Sonoma, Inc. US 5,292 5,292 260 Non-Store 14 5.5%
183 Grupo Eroski Spain 5,280 5,778 38 Supermarket 1 -5.2%
184 Big Lots, Inc. US 5,271 5,271 190 Discount Store 1 -0.5%
185 Next plc UK 5,248 5,269 769 Apparel/Footwear Specialty 74 2.7%
186 Lawson, Inc. Japan 5,234** 5,898** 241 Convenience/Forecourt Store 6 6.6%
187 Wumart Holdings, Inc. China 5,223** 6,000** 299 Supermarket 1 -
188 Tapestry, Inc. (formerly Coach, Inc.) US 5,120e 5,880** 398 Other Specialty 70 2.5%
189 Sundrug Co., Ltd. Japan 5,090** 5,090** 224 Drug Store/Pharmacy 1 6.7%
190 Shimamura Co., Ltd. Japan 5,071 5,071 267 Apparel/Footwear Specialty 3 2.8%
191 Zalando SE Germany 5,060 5,060 115 Non-store 15 31.1%
192 Cosmos Pharmaceutical Corp. Japan 5,054 5,054 160 Drug Store/Pharmacy 1 11.1%
193 Nitori Holdings Co., Ltd. Japan 5,015 5,133 576 Other Specialty 4 10.2%
194 MatsumotoKiyoshi Holdings Co., Ltd. Japan 5,014 5,042 205 Drug Store/Pharmacy 2 4.1%
195 Demoulas Super Markets, Inc. (dba Market Basket)
US 5,000e 5,000e n/a Supermarket 1 4.5%
196 Office Depot, Inc. US 4,962 10,240 181 Other Specialty 2 -3.8%
197 Grupo Comercial Chedraui, S.A.B. de C.V. Mexico 4,954 4,999 112 Hypermarket/Supercenter/Superstore 2 8.2%
198 Academy Ltd. (dba Academy Sports + Outdoors)
US 4,900 4,900 n/a Other Specialty 1 7.0%
199 Defense Commissary Agency (DeCA) US 4,900 4,900 n/a Supermarket 13 -4.3%
200 E.Land World Co., Ltd. S. Korea 4,891 5,780 580 Apparel/Footwear Specialty 3 2.2%
201 OJSC Dixy Group Russia 4,803 4,846** -103 Supermarket 1 14.0%
202 Müller Holding Ltd. & Co. KG Germany 4,786 4,786e n/a Drug Store/Pharmacy 7 4.7%
203 Foodstuffs North Island Ltd. New Zealand 4,741** 4,741** 14 Supermarket 1 -
204 XXXLutz Group Austria 4,729e 4,729e n/a Other Specialty 10 7.3%
205 Wayfair, Inc. US 4,721 4,721 -245 Non-Store 4 51.0%
206 Neiman Marcus Group LTD LLC US 4,706 4,706 -532 Department Store 2 1.6%
207 PT Indomarco Prismatama (Indomaret) Indonesia 4,703** 4,703** 33 Convenience/Forecourt Store 1 16.9%
208 Agrokor d.d. Croatia 4,702** 5,933** -914 Supermarket 5 6.6%
209 Valor Holdings Co., Ltd. Japan 4,668 4,908 69 Supermarket 2 4.8%
210 Sprouts Farmers Market, Inc. US 4,665 4,665 158 Supermarket 1 21.0%
211 East Japan Railway Company (JR East) Japan 4,646 26,614 n/a Convenience/Forecourt Store 1 5.0%
212 Arcs Co., Ltd. Japan 4,602 4,612 92 Supermarket 1 3.5%
¹ Revenue and net income for the parent company or group may include results from non-retail operations
² Compound annual growth ratee = estimate g = gross turnover as reported by company
Source: Deloitte Touche Tohmatsu Limited. Global Powers of Retailing 2019. Analysis of financial performance and operations for fiscal years ended through June 2018 using company annual reports, Supermarket News, Forbes America’s largest private companies and other sources.
n/a = not availablene = not in existence (created by merger or divestiture)* Revenue reflects wholesale sales** Revenue includes wholesale and retail sales
Global Powers of Retailing Top 250, FY2017
17
Global Powers of Retailing 2019 | Global Powers of Retailing Top 250

FY2017 Retail revenue rank Name of company
Country of origin
FY2017 Retail
revenue (US$M)
FY2017 Parent
company/ group
revenue¹ (US$M)
FY2017 Parent
company/group net
income¹ (US$M)
Dominant operational format
# Countries
of operation
FY2012-2017
Retail revenue
CAGR²
213 Hobby Lobby Stores, Inc. US 4,600e 4,600e n/a Other Specialty 1 6.9%
214 PT Sumber Alfaria Trijaya Tbk (Alfamart) Indonesia 4,579** 4,579** 19 Convenience/Forecourt Store 1 17.7%
215 Smart & Final Stores, Inc. US 4,571** 4,571** -139 Cash & Carry/Warehouse Club 2 8.5%
216 McKesson Europe AG (formerly Celesio AG)
Germany 4,561 24,625** n/a Drug Store/Pharmacy 9 2.4%
217 PETCO Animal Supplies, Inc. US 4,550e 4,550e n/a Other Specialty 3 5.2%
218 The Save Mart Companies (formerly Save Mart Supermarkets)
US 4,500e 4,500e n/a Supermarket 1 0.0%
219 HORNBACH Baumarkt AG Group Germany 4,488 4,488 68 Home Improvement 9 5.2%
220 Save-A-Lot Food Stores Ltd. US 4,470e** 4,470e** n/a Discount Store 2 -
221 Reinalt-Thomas Corporation (dba Discount Tire/America's Tire)
US 4,400e 4,400e n/a Other Specialty 1 3.5%
222 Stater Bros. Holdings Inc. US 4,340e 4,340e n/a Supermarket 1 2.3%
223 RaiaDrogasil S.A. Brazil 4,337 4,337 160 Drug Store/Pharmacy 1 19.9%
224 Sports Direct International plc UK 4,240 4,730** 37 Other Specialty 24 10.9%
225 Migros Ticaret A.Ş. Turkey 4,206** 4,206** 140 Supermarket 3 18.8%
226 Belk, Inc. US 4,200e 4,200e n/a Department Store 1 1.2%
227 Sugi Holdings Co., Ltd. Japan 4,079** 4,101** 147 Drug Store/Pharmacy 1 5.9%
228 Tiffany & Co. US 4,045** 4,170** 370 Other Specialty 27 2.3%
229 B&M European Value Retail S.A. UK 4,012 4,012 246 Discount Store 2 26.5%
230 Nojima Corporation Japan 4,006 4,528 123 Electronics Specialty 1 17.3%
231 Save On Foods (formerly Overwaitea Food Group)
Canada 4,005e 4,005e n/a Supermarket 1 8.2%
232 Iceland Topco Limited UK 3,995** 3,995** -59 Supermarket 6 2.7%
233 SHV Holdings N.V. / Makro Netherlands 3,979e 22,397 n/a Cash & Carry/Warehouse Club 5 -14.1%
234 JD Sports Fashion Plc UK 3,943e 4,107** 307 Other Specialty 14 21.7%
235 Chongqing Department Store Co., Ltd. China 3,941 4,869 96 Department Store 1 -0.5%
236 Tokyu Corporation Japan 3,903 10,272 n/a Department Store 2 -0.9%
237 A101 Yeni Mağazacılık A.S Turkey 3,892e 3,892e n/a Discount Store 1 46.4%
238 Grandvision N.V. Netherlands 3,888** 3,888** 281 Other Specialty 44 6.5%
239 NORMA Unternehmens Stiftung Germany 3,877e 3,877e n/a Discount Store 4 2.7%
240 Ingles Markets, Inc. US 3,861 4,003** 54 Supermarket 1 1.5%
241 Wangfujing Group Co., Ltd. China 3,859 3,859 138 Department Store 1 7.4%
242 Action Nederland BV Netherlands 3,853 3,853 n/a Discount department store 7 31.4%
243 Lagardère Travel Retail SAS France 3,834 3,846** n/a Other Specialty 34 3.7%
244 Intersport Deutschland eG Germany 3,821e** 4,103g** n/a Other Specialty 6 5.7%
245 Daiso Industries Co., Ltd. (previously Daiso Sangyo Inc.)
Japan 3,816e** 4,103g** n/a Discount Department Store 27 5.3%
246 American Eagle Outfitters, Inc. US 3,796** 3,796** 204 Apparel/Footwear Specialty 31 1.8%
247 Coop Sverige AB Sweden 3,764** 3,764** 2 Supermarket 1 -
248 Heiwado Co., Ltd. Japan 3,743 3,931 86 Hypermarket/Supercenter/Superstore 2 2.3%
249 Magazine Luiza S.A. Brazil 3,735 3,752 122 Other Specialty 1 11.1%
250 The Golub Corporation US 3,700 3,700 n/a Supermarket 1 1.2%
Global Powers of Retailing Top 250, FY2017
¹ Revenue and net income for the parent company or group may include results from non-retail operations
² Compound annual growth ratee = estimate g = gross turnover as reported by company
Source: Deloitte Touche Tohmatsu Limited. Global Powers of Retailing 2019. Analysis of financial performance and operations for fiscal years ended through June 2018 using company annual reports, Supermarket News, Forbes America’s largest private companies and other sources.
n/a = not availablene = not in existence (created by merger or divestiture)* Revenue reflects wholesale sales** Revenue includes wholesale and retail sales
18
Global Powers of Retailing 2019 | Global Powers of Retailing Top 250

Geographic analysis
19
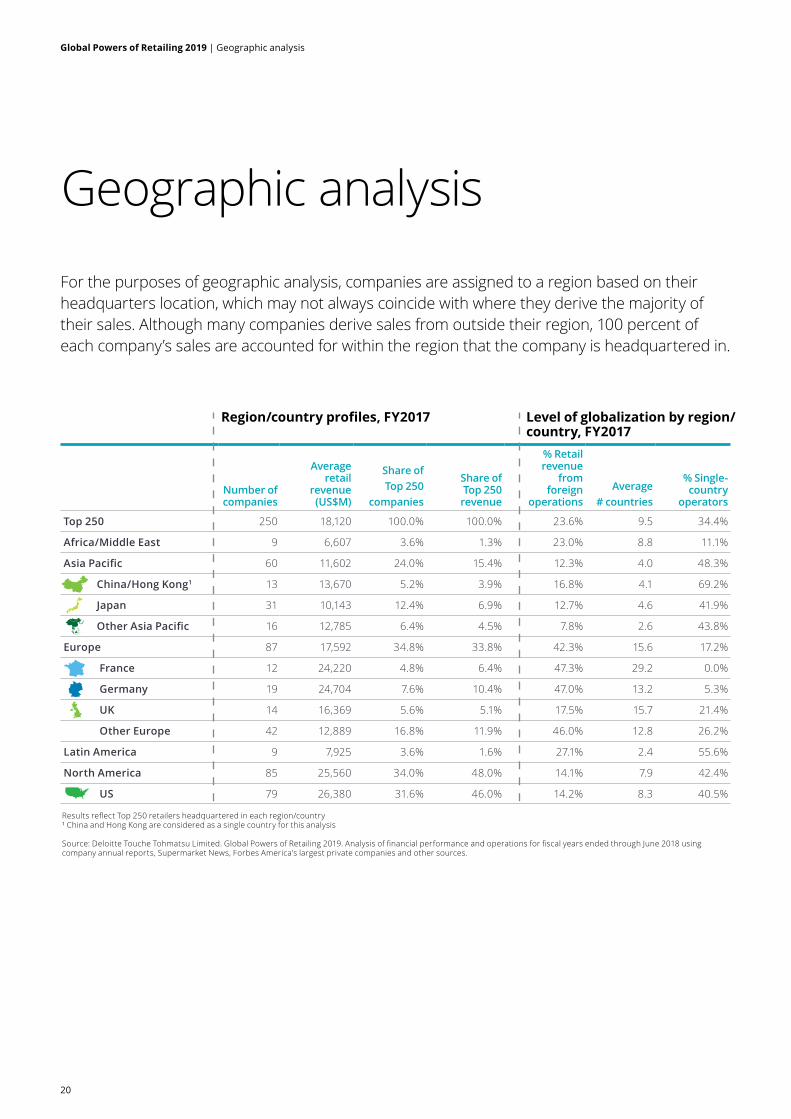
Number of companies
Average retail
revenue (US$M)
Share of Top 250
companies
Share of Top 250 revenue
% Retail revenue
from foreign
operationsAverage
# countries
% Single-country
operators
Top 250 250 18,120 100.0% 100.0% 23.6% 9.5 34.4%
Africa/Middle East 9 6,607 3.6% 1.3% 23.0% 8.8 11.1%
Asia Pacific 60 11,602 24.0% 15.4% 12.3% 4.0 48.3%
China/Hong Kong1 13 13,670 5.2% 3.9% 16.8% 4.1 69.2%
Japan 31 10,143 12.4% 6.9% 12.7% 4.6 41.9%
Other Asia Pacific 16 12,785 6.4% 4.5% 7.8% 2.6 43.8%
Europe 87 17,592 34.8% 33.8% 42.3% 15.6 17.2%
France 12 24,220 4.8% 6.4% 47.3% 29.2 0.0%
Germany 19 24,704 7.6% 10.4% 47.0% 13.2 5.3%
UK 14 16,369 5.6% 5.1% 17.5% 15.7 21.4%
Other Europe 42 12,889 16.8% 11.9% 46.0% 12.8 26.2%
Latin America 9 7,925 3.6% 1.6% 27.1% 2.4 55.6%
North America 85 25,560 34.0% 48.0% 14.1% 7.9 42.4%
US 79 26,380 31.6% 46.0% 14.2% 8.3 40.5%
Geographic analysis
Region/country profiles, FY2017
Results reflect Top 250 retailers headquartered in each region/country¹ China and Hong Kong are considered as a single country for this analysis
Source: Deloitte Touche Tohmatsu Limited. Global Powers of Retailing 2019. Analysis of financial performance and operations for fiscal years ended through June 2018 using company annual reports, Supermarket News, Forbes America’s largest private companies and other sources.
For the purposes of geographic analysis, companies are assigned to a region based on their headquarters location, which may not always coincide with where they derive the majority of their sales. Although many companies derive sales from outside their region, 100 percent of each company’s sales are accounted for within the region that the company is headquartered in.
Level of globalization by region/country, FY2017
20
Global Powers of Retailing 2019 | Geographic analysis
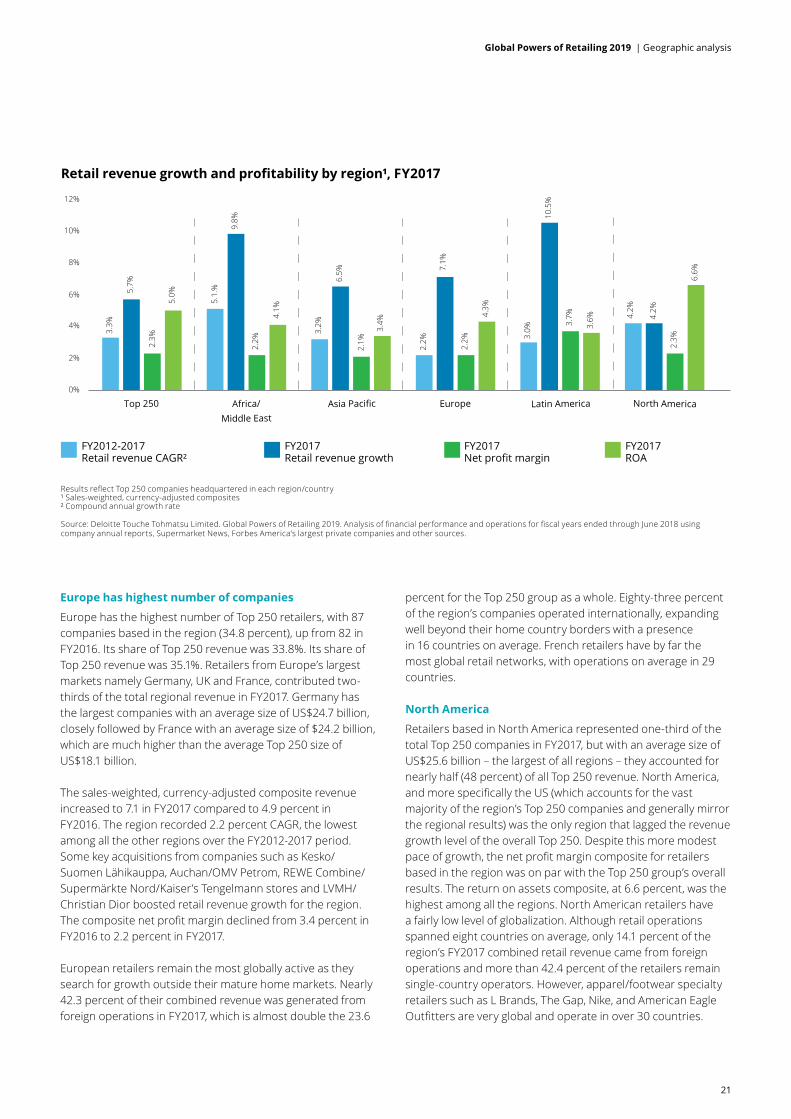
Retail revenue growth and profitability by region¹, FY2017
Results reflect Top 250 companies headquartered in each region/country¹ Sales-weighted, currency-adjusted composites² Compound annual growth rate Source: Deloitte Touche Tohmatsu Limited. Global Powers of Retailing 2019. Analysis of financial performance and operations for fiscal years ended through June 2018 using company annual reports, Supermarket News, Forbes America’s largest private companies and other sources.
5.1.
%
3.3%
3.2%
2.2% 3.
0%
4.2%
9.8%
5.7% 6.
5% 7.1%
10.5
%
4.2%
2.2%2.3%
2.1%
2.2%
3.7%
2.3%
4.1%
5.0%
3.4%
4.3%
3.6%
6.6%
FY2012-2017 Retail revenue CAGR²
FY2017 Retail revenue growth
FY2017 Net profit margin
FY2017 ROA
12%
4%
2%
8%
6%
10%
0%
Top 250 Latin AmericaEuropeAfrica/ Middle East
Asia Pacific North America
Europe has highest number of companies
Europe has the highest number of Top 250 retailers, with 87 companies based in the region (34.8 percent), up from 82 in FY2016. Its share of Top 250 revenue was 33.8%. Its share of Top 250 revenue was 35.1%. Retailers from Europe’s largest markets namely Germany, UK and France, contributed two-thirds of the total regional revenue in FY2017. Germany has the largest companies with an average size of US$24.7 billion, closely followed by France with an average size of $24.2 billion, which are much higher than the average Top 250 size of US$18.1 billion.
The sales-weighted, currency-adjusted composite revenue increased to 7.1 in FY2017 compared to 4.9 percent in FY2016. The region recorded 2.2 percent CAGR, the lowest among all the other regions over the FY2012-2017 period. Some key acquisitions from companies such as Kesko/Suomen Lähikauppa, Auchan/OMV Petrom, REWE Combine/Supermärkte Nord/Kaiser’s Tengelmann stores and LVMH/Christian Dior boosted retail revenue growth for the region. The composite net profit margin declined from 3.4 percent in FY2016 to 2.2 percent in FY2017.
European retailers remain the most globally active as they search for growth outside their mature home markets. Nearly 42.3 percent of their combined revenue was generated from foreign operations in FY2017, which is almost double the 23.6
percent for the Top 250 group as a whole. Eighty-three percent of the region’s companies operated internationally, expanding well beyond their home country borders with a presence in 16 countries on average. French retailers have by far the most global retail networks, with operations on average in 29 countries.
North America
Retailers based in North America represented one-third of the total Top 250 companies in FY2017, but with an average size of US$25.6 billion – the largest of all regions – they accounted for nearly half (48 percent) of all Top 250 revenue. North America, and more specifically the US (which accounts for the vast majority of the region’s Top 250 companies and generally mirror the regional results) was the only region that lagged the revenue growth level of the overall Top 250. Despite this more modest pace of growth, the net profit margin composite for retailers based in the region was on par with the Top 250 group’s overall results. The return on assets composite, at 6.6 percent, was the highest among all the regions. North American retailers have a fairly low level of globalization. Although retail operations spanned eight countries on average, only 14.1 percent of the region’s FY2017 combined retail revenue came from foreign operations and more than 42.4 percent of the retailers remain single-country operators. However, apparel/footwear specialty retailers such as L Brands, The Gap, Nike, and American Eagle Outfitters are very global and operate in over 30 countries.
21
Global Powers of Retailing 2019 | Geographic analysis

Asia Pacific
Nearly a quarter of the companies from the Top 250 retailers were from the Asia Pacific region. Two new Chinese retailers, namely, Wumart Holdings, and Wangfujing Group entered the Top 250 list in FY2017. The majority (73 percent) of the retailers in the region were concentrated in China/Hong Kong (considered as a single country for this analysis) and Japan, while the remaining retailers from the “other” Asia Pacific nations came from Australia, Indonesia, India, South Korea, Taiwan, Philippines, and New Zealand.
Retail revenue growth in FY2017 increased to 6.5 percent from 4.6 percent in FY2016, while on a longer-term basis, the region’s retailers recorded a 3.2 percent CAGR between FY2012-2017. Rising urbanization, growing single households, increasing disposable income and favorable exchange rates versus the US dollar have been the major growth drivers. The Chinese yuan rose 7 percent against the US dollar reversing the previous three consecutive years of depreciation.
Retailers in the Asia Pacific region have been relatively slow to invest in international operations. On average, they operated in just 4.0 countries, compared with 9.5 countries for the entire Top 250 group. Nearly half of the companies operated only within their home country of operations. Eighty-eight percent of the composite revenue for the region’s 60 retailers in the Top 250 was generated domestically in FY2017.
Vipshop Holdings from China recorded the fastest CAGR growth in the region, 73.8 percent over the FY2012-2017 period. Its retail revenue in FY2017 increased to US$10.9 billion from US$7.9 billion in FY2016, which also helped the retailer jump from No. 121 to No. 92 during the same period. JD.com recorded the second-fastest growth, with 52.4 percent CAGR over FY2012-FY2017, also posting a huge increase in retail revenue year-on-year from US$35.7 billion to US$49.0 billion in 2017. Aeon Co. and Seven & I Holdings were the largest contributors to Japan’s 45 percent share of the region’s revenue.
Africa/Middle East
The Africa/Middle East region has nine retailers represented in the Top 250, which is the same number as the Latin America region. The Africa/Middle East region’s 9.8 percent growth rate was the second highest of the five geographic regions, while its 2.2 percent net profit margin composite in
FY2017 was on par with other regions.
With improvements in economic growth and growing foreign investments, an increasing influx of international brands and retailers is changing the retail scene in Africa. The rising middle class has contributed to the modernization of the retailing sector, and many African economies continue to transition toward consumption-driven markets.
The Middle East continues to be an attractive destination for retailers. They are adapting to the rapidly changing consumer demand for luxury and premium items, and a more convenient, less time-consuming retail experience.
Top 250 retailers based in the region have a large geographic footprint – eight of the nine companies operated internationally in FY2017 in an average of 8.8 countries, and 23 percent of their combined retail revenue was generated outside their home countries. Shoprite Holdings was one of the biggest retailers in terms of revenue in the region, with operations in more than 15 countries; it plans to expand its reach to the Kenya market by FY2019.
Latin America
Along with the Africa/Middle East region, the Latin American region has the fewest retailers, with nine companies represented in the Top 250. However, they continue to enjoy strong growth and above-average profitability. They showed the highest year-on-year revenue growth (10.5 percent) and also the highest net profit margin performance (3.7 percent).
Retailers operating in this region are mainly focused on regional operations, which is evident from the fact that on average, they have operations in only 2.4 countries, the lowest among all the regions in FY2017.
Cencosud and S.A.C.I were a few of the largest retailers in the region in terms of retail revenue who saw their Top 250 ranking improve from No. 64 to No. 61 and from No. 95 to No. 90 respectively between FY2016 and FY2017. In addition, FEMSA was one of the strongest performers in the region, with an improved ranking from No. 100 to No. 76. This was achieved on the back of high growth in sales from new store openings and various acquisitions such as convenience store operator Big John, drugstore operator Farmacias Acuña and Farmacias Generix, and Specialty’s Café and Bakery Inc in FY2016.
22
Global Powers of Retailing 2019 | Geographic analysis

Product sector analysis
23
Product sector analysis
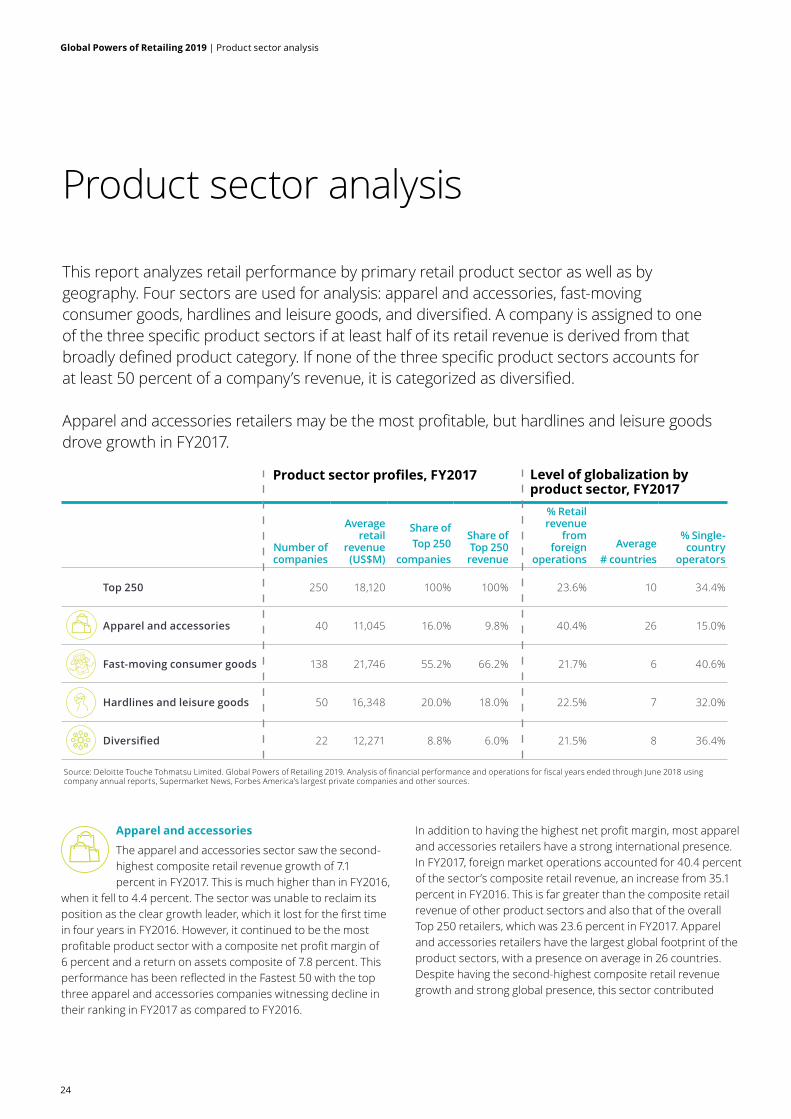
Number of companies
Average retail
revenue (US$M)
Share of Top 250
companies
Share of Top 250 revenue
% Retail revenue
from foreign
operationsAverage
# countries
% Single-country
operators
Top 250 250 18,120 100% 100% 23.6% 10 34.4%
Apparel and accessories 40 11,045 16.0% 9.8% 40.4% 26 15.0%
Fast-moving consumer goods 138 21,746 55.2% 66.2% 21.7% 6 40.6%
Hardlines and leisure goods 50 16,348 20.0% 18.0% 22.5% 7 32.0%
Diversified 22 12,271 8.8% 6.0% 21.5% 8 36.4%
In addition to having the highest net profit margin, most apparel and accessories retailers have a strong international presence. In FY2017, foreign market operations accounted for 40.4 percent of the sector’s composite retail revenue, an increase from 35.1 percent in FY2016. This is far greater than the composite retail revenue of other product sectors and also that of the overall Top 250 retailers, which was 23.6 percent in FY2017. Apparel and accessories retailers have the largest global footprint of the product sectors, with a presence on average in 26 countries. Despite having the second-highest composite retail revenue growth and strong global presence, this sector contributed
This report analyzes retail performance by primary retail product sector as well as by geography. Four sectors are used for analysis: apparel and accessories, fast-moving consumer goods, hardlines and leisure goods, and diversified. A company is assigned to one of the three specific product sectors if at least half of its retail revenue is derived from that broadly defined product category. If none of the three specific product sectors accounts for at least 50 percent of a company’s revenue, it is categorized as diversified.
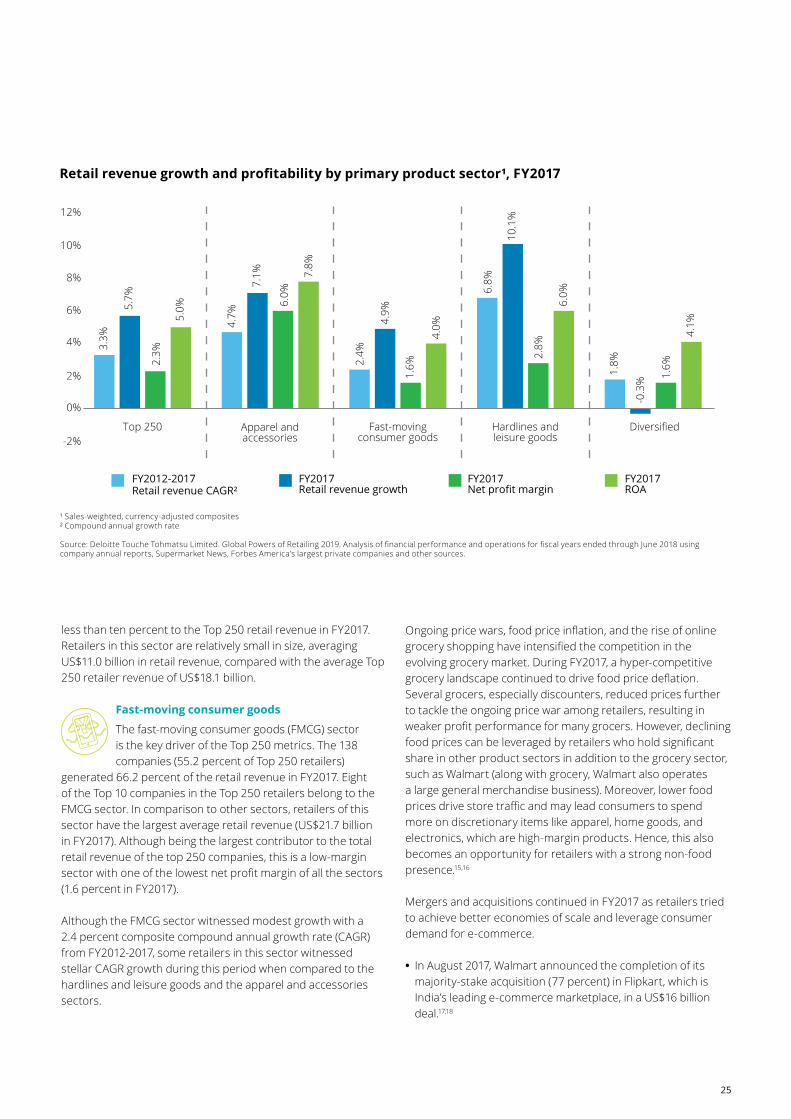
Apparel and accessories retailers may be the most profitable, but hardlines and leisure goods drove growth in FY2017.
Apparel and accessories
The apparel and accessories sector saw the second-highest composite retail revenue growth of 7.1 percent in FY2017. This is much higher than in FY2016,
when it fell to 4.4 percent. The sector was unable to reclaim its position as the clear growth leader, which it lost for the first time in four years in FY2016. However, it continued to be the most profitable product sector with a composite net profit margin of 6 percent and a return on assets composite of 7.8 percent. This performance has been reflected in the Fastest 50 with the top three apparel and accessories companies witnessing decline in their ranking in FY2017 as compared to FY2016.
Product sector profiles, FY2017 Level of globalization by product sector, FY2017
Source: Deloitte Touche Tohmatsu Limited. Global Powers of Retailing 2019. Analysis of financial performance and operations for fiscal years ended through June 2018 using company annual reports, Supermarket News, Forbes America’s largest private companies and other sources.
24
Global Powers of Retailing 2019 | Product sector analysis
Retail revenue growth and profitability by primary product sector¹, FY2017
¹ Sales-weighted, currency-adjusted composites² Compound annual growth rate Source: Deloitte Touche Tohmatsu Limited. Global Powers of Retailing 2019. Analysis of financial performance and operations for fiscal years ended through June 2018 using company annual reports, Supermarket News, Forbes America’s largest private companies and other sources.
12%
10%
4%
0%
8%
6%
2%
-2%
FY2012-2017 Retail revenue CAGR²
FY2017 Retail revenue growth
FY2017 ROA
FY2017 Net profit margin
Top 250 Apparel and accessories
Hardlines and leisure goods
DiversifiedFast-moving consumer goods
3.3%
4.7%
2.4%
6.8%
1.8%2.
3%
6.0%
1.6%
2.8%
1.6%
5.7%
7.1%
4.9%
10.1
%
-0.3
%
5.0%
7.8%
4.0%
6.0%
4.1%
less than ten percent to the Top 250 retail revenue in FY2017. Retailers in this sector are relatively small in size, averaging US$11.0 billion in retail revenue, compared with the average Top 250 retailer revenue of US$18.1 billion.
Fast-moving consumer goods
The fast-moving consumer goods (FMCG) sector is the key driver of the Top 250 metrics. The 138 companies (55.2 percent of Top 250 retailers)
generated 66.2 percent of the retail revenue in FY2017. Eight of the Top 10 companies in the Top 250 retailers belong to the FMCG sector. In comparison to other sectors, retailers of this sector have the largest average retail revenue (US$21.7 billion in FY2017). Although being the largest contributor to the total retail revenue of the top 250 companies, this is a low-margin sector with one of the lowest net profit margin of all the sectors (1.6 percent in FY2017).
Although the FMCG sector witnessed modest growth with a 2.4 percent composite compound annual growth rate (CAGR) from FY2012-2017, some retailers in this sector witnessed stellar CAGR growth during this period when compared to the hardlines and leisure goods and the apparel and accessories sectors.
Ongoing price wars, food price inflation, and the rise of online grocery shopping have intensified the competition in the evolving grocery market. During FY2017, a hyper-competitive grocery landscape continued to drive food price deflation. Several grocers, especially discounters, reduced prices further to tackle the ongoing price war among retailers, resulting in weaker profit performance for many grocers. However, declining food prices can be leveraged by retailers who hold significant share in other product sectors in addition to the grocery sector, such as Walmart (along with grocery, Walmart also operates a large general merchandise business). Moreover, lower food prices drive store traffic and may lead consumers to spend more on discretionary items like apparel, home goods, and electronics, which are high-margin products. Hence, this also becomes an opportunity for retailers with a strong non-food presence.15,16
Mergers and acquisitions continued in FY2017 as retailers tried to achieve better economies of scale and leverage consumer demand for e-commerce.
• In August 2017, Walmart announced the completion of its majority-stake acquisition (77 percent) in Flipkart, which is India’s leading e-commerce marketplace, in a US$16 billion deal.17,18
25
• In January 2018, 7-Eleven, Inc., a subsidiary of Seven & I Holdings Co., Ltd.., completed the acquisition of almost 1,030 Sunoco convenience stores located in 17 US states. As part of this deal, Seven & I Holdings Co., Ltd. agreed to sell and divest some of its stores. This was provided as a remedy by the U.S. Federal Trade Commission to avoid monopoly in some markets and preserve competition.19,20
• In March 2018, Walgreens Boots Alliance completed the purchase of 1,932 stores and three distribution centers from Rite Aid for nearly US$4.4 billion in cash.21
Hardlines and leisure goods
The hardlines and leisure goods sector continued to lead the way in FY2017 and surpassed other product sectors with a retail revenue growth rate
of 10.1 percent and a solid retail revenue CAGR of 6.8 percent from FY2012-2017. Hardlines and leisure goods only represent 20 percent (50 companies) of the Top 250, but this strong growth helped to sustain the Top 250’s continued FY2017 retail revenue growth rate of 5.7 percent.
Despite this strong growth, hardlines and leisure goods were unable to shield the net profit margins of the Top 250 companies from the overall challenges of the retail sector and hence a slight decline from 3.2 percent in FY2016 to 2.3 percent in FY2017. Ten hardlines and leisure retailers were ranked in the Fastest 50, including online retailers JD.com, Inc. and Wayfair, Inc., which boosted the rapid growth of this product sector. However, seven retailers in this sector reported year-on-year revenue decline in FY2017 in local currency, including Staples, Inc., who reported a significant decline in its retail revenue CAGR of -12.9 percent, a continuation of the store closures experienced in FY2016.
Overall, the hardlines and leisure good sector outperformed the overall Top 250 company’s performance in every category including achieving a solid net profit margin composite of 2.8 percent and a return on assets composite of 6.0 percent. (Note: Apple Inc. is excluded from the profitability ratios).
Diversified
The diversified group persistently experiences slow growth and FY2017 is no different. A retailer is considered “diversified” when none of the three
specific product-oriented sectors accounts for at least 50 percent of its retail revenue. This sector witnessed a composite retail revenue decrease of -0.3 percent, which represented an actual improvement from the -1.3 percent achieved in FY2016, but is still well below the Top 250 overall performance of 5.7 percent. The retail revenue CAGR for the twenty-two retailers in this sector was 1.8 percent from FY2012-2017, which reinforced the lack of growth in the group compared to the 3.3 percent achieved by the Top 250 companies.
Total sales at Sears Holdings, one of the top five diversified companies shrunk for the 11th consecutive year, falling by 24.6 percent in FY2017. Decline in total revenue from FY2016 to FY2017 was mainly driven by the decline in merchandise sales of US$4.8 billion. This resulted in a decrease of approximately US$3.2 billion owing to fewer Kmart and Sears Full-line stores being in operation.22
Meanwhile, the main reasons for the big drop in sales of Lotte Shopping Co., Ltd are K-IFRS adoption and discontinued operations following spin-off as part of a major company reorganization in 2017. In April 2017, the Group’s Board of Directors approved the spin-off of the respective investment divisions of Lotte Shopping Co., Ltd., Lotte Chilung Beverage Co., Ltd., and Lotte Food Co., Ltd., which merged into the investment division of Lotte Confectionery Co., Ltd.23
26
Global Powers of Retailing 2019 | Product sector analysis

New entrants
27
Top 250 rank Name of company
Country of origin Dominant operational format
FY2017 Retail revenue growth
26 Metro AG Germany Cash & Carry/Warehouse Club 1.6%
40 Ceconomy AG Germany Electronics Specialty 1.3%
187 Wumart Holdings, Inc. China Supermarket 10.5%
205 Wayfair, Inc. US Non-Store 39.7%
223 RaiaDrogasil S.A. Brazil Drug Store/Pharmacy 23.1%
229 B&M European Value Retail S.A. UK Discount Store 24.6%
234 JD Sports Fashion Plc UK Other Specialty 37.2%
237 A101 Yeni Mağazacılık A.S Turkey Discount Store 32.7%
239 NORMA Unternehmens Stiftung Germany Discount Store 4.4%
241 Wangfujing Group Co., Ltd. China Department Store 46.6%
242 Action Nederland BV Netherlands Discount department store 27.8%
243 Lagardère Travel Retail SAS France Other Specialty 8.6%
245 Daiso Industries Co., Ltd. (previously Daiso Sangyo Inc.)
Japan Discount Department Store 8.3%
246 American Eagle Outfitters, Inc. US Apparel/Footwear Specialty 5.1%
249 Magazine Luiza S.A. Brazil Other Specialty 26.1%
250 The Golub Corporation US Supermarket 5.7%
ne = not in existence (created by merger or divestiture)
Source: Deloitte Touche Tohmatsu Limited. Global Powers of Retailing 2019. Analysis of financial performance and operations for fiscal years ended through June 2018 using company annual reports, Supermarket News, Forbes America’s largest private companies and other sources.
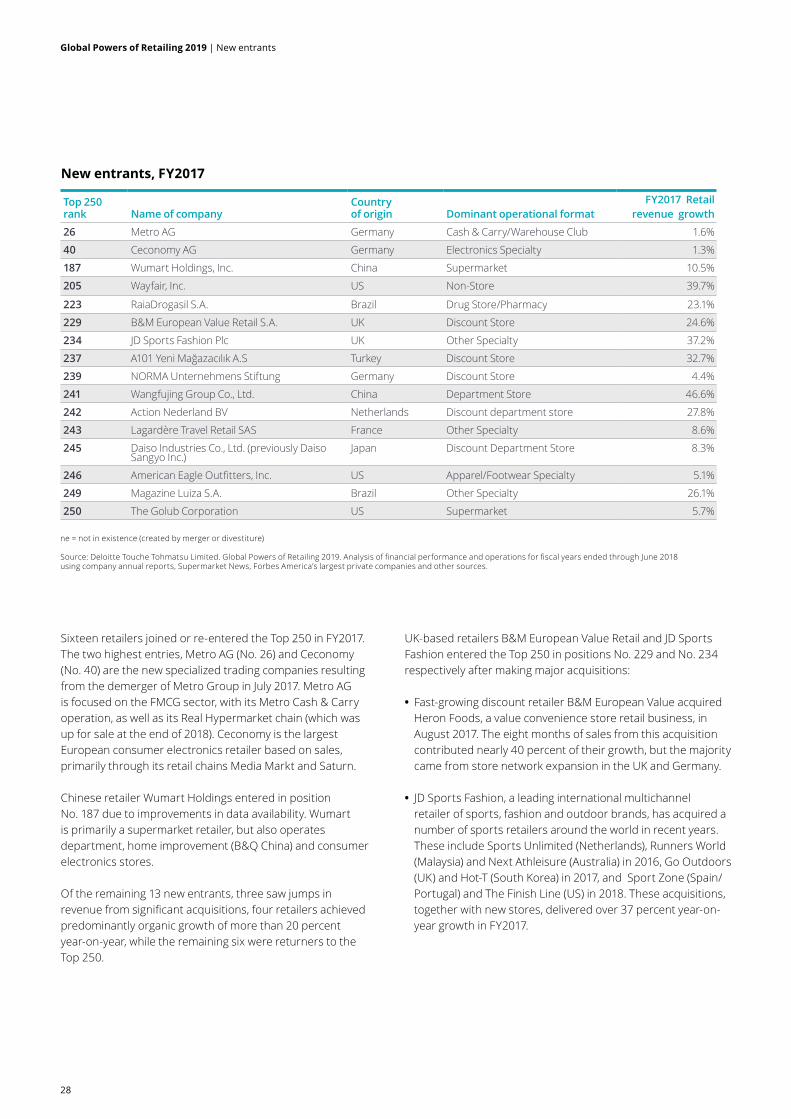
New entrants, FY2017
Sixteen retailers joined or re-entered the Top 250 in FY2017. The two highest entries, Metro AG (No. 26) and Ceconomy (No. 40) are the new specialized trading companies resulting from the demerger of Metro Group in July 2017. Metro AG is focused on the FMCG sector, with its Metro Cash & Carry operation, as well as its Real Hypermarket chain (which was up for sale at the end of 2018). Ceconomy is the largest European consumer electronics retailer based on sales, primarily through its retail chains Media Markt and Saturn.
Chinese retailer Wumart Holdings entered in position No. 187 due to improvements in data availability. Wumart is primarily a supermarket retailer, but also operates department, home improvement (B&Q China) and consumer electronics stores.
Of the remaining 13 new entrants, three saw jumps in revenue from significant acquisitions, four retailers achieved predominantly organic growth of more than 20 percent year-on-year, while the remaining six were returners to the Top 250.
UK-based retailers B&M European Value Retail and JD Sports Fashion entered the Top 250 in positions No. 229 and No. 234 respectively after making major acquisitions:
• Fast-growing discount retailer B&M European Value acquired Heron Foods, a value convenience store retail business, in August 2017. The eight months of sales from this acquisition contributed nearly 40 percent of their growth, but the majority came from store network expansion in the UK and Germany.
• JD Sports Fashion, a leading international multichannel retailer of sports, fashion and outdoor brands, has acquired a number of sports retailers around the world in recent years. These include Sports Unlimited (Netherlands), Runners World (Malaysia) and Next Athleisure (Australia) in 2016, Go Outdoors (UK) and Hot-T (South Korea) in 2017, and Sport Zone (Spain/Portugal) and The Finish Line (US) in 2018. These acquisitions, together with new stores, delivered over 37 percent year-on-year growth in FY2017.
28
Global Powers of Retailing 2019 | New entrants

Chinese department store and supermarket operator Wangfujing Group entered the Top 250 in position No. 241 after seeing nearly 46.6 percent year-on-year FY2017 growth, mainly due to its acquisition of Belmont Hong Kong in April 2017.
The four retailers who gained their place in the Top 250 through organic growth were:
• Wayfair describes itself as “one of the world’s largest online destinations for the home”. They jumped into the Top 250 in position No. 205 after achieving spectacular 39.7 percent year-on-year organic growth from their core US market, up 33.5 percent, and more than doubling their revenue from their international business in Canada, the UK and Germany.
• RaiaDrogasil, the leading drugstore chain in Brazil, saw 23.1 percent local currency year-on-year revenue growth from over 200 new stores and same store sales growth. Their entry to the Top 250 at position No. 223 was also boosted by the 9.3 percent gain in the value of the Brazilian real against the US dollar in 2017.
• Turkish discount retailer A101 continued its recent rapid growth in FY2017, opening nearly 700 new stores throughout Turkey. They entered the Top 250 in position No. 237 despite the 17 percent drop in the value of the Turkish lira against the US dollar.
• Action Nederland is the fastest-growing international non-food discounter, with over 1,100 stores in the Netherlands, Belgium, France, Germany, Luxembourg, Austria, and Poland. Their 28 percent year-on-year organic growth took them into the Top 250 in position No. 242.
The remaining new entrants (Norma, Lagardère Travel Retail, Daiso, American Eagle, Magazine Luiza and Golub) have all appeared in the Top 250 in previous years. They returned in FY2017 within positions No. 239 to No. 250. The first four all achieved single digit growth (in local currency), while Brazil’s Magazine Luiza returned after a two year absence, following 26.1 percent year-on-year growth from new store openings, existing store maturation and online sales. Japan’s Daiso and US supermarket operator Golub, both returned for the first time since FY2012.
29
Global Powers of Retailing 2019 | New entrants

Fastest 50
30
The calculation of the Fastest 50 list is based on compound annual revenue growth over the five-year period from FY2012 to FY2017. Fastest 50 companies that were also among the 50 fastest-growing retailers in FY2016 make up an even more elite group. These retailers are designated in bold type on the list.
New store openings, acquisitions and e-commerce drive Fastest 50
The Fastest 50 retailers grew revenue on average five times faster than that of the Top 250 group as a whole, recording a 17.1 percent composite compound annual growth rate (CAGR) from FY2012-FY2017. This significant growth was the result of new store openings, M&A activity, and growing e-commerce sales. Two thirds of this year’s Fastest 50 (34 companies) also featured in the FY2016 rankings, although there was a notable change with Vipshop dropping down one place behind Albertsons, as its very rapid growth decelerated. E-tailers Vipshop Holdings and JD.com both achieved an increase in their FY2017 revenue growth of almost 40 percent while Albertsons’ revenue was 0.4% up on FY2016.
LVMH leads Fastest 50 net profit margin
The Fastest 50 also achieved a higher composite net profit margin than the Top 250, at 2.5 per cent. The most profitable company, luxury group LVMH, contributed more than a quarter of the Fastest 50 total net profit, with a 13.2 per cent net profit margin. SM Investment (13.0 per cent) and fellow luxury group Kering (12.1 per cent) also achieved double digit net profit margins. Of the 42 companies reporting net income, only six made a loss. These included the rapidly-growing online retailers JD.com and Wayfair Inc.
Three of the top four fastest-growing retailers focus exclusively on e-commerce, namely Chinese e-tailers Vipshop Holdings Limited, JD.com, Inc. and Wayfair, Inc.
The number of countries of operation is not a determinant for increased ranking in the Fastest 50 with the top three companies all having single countries of operation, highlighting that growth can be achieved in local markets. By contrast, both Kering SA (France) and LVMH Moët Hennessy (France) ranked highest for the number of countries of operations, listing 95 and 70 countries respectively.
Half of the Fastest 50 are FMCGs, which contradicts the modest growth rate of that product sector (composite CAGR of 2.4 percent from FY2012-2017). The Fastest 50 top position is held by an FMCG and 11 other FMCG retailers are ranked amongst the top 20 of the Fastest 50.
Amazon is a consistent performer in the Fastest 50, having featured in the Fastest 50 since FY2004, when Deloitte first started tracking the group. FY2017 is no exception with Amazon experiencing retail sales increase of 25.3 percent year-on-year. As mentioned in Global Powers of Retailing 2017, the acquisition of Whole Foods positioned Amazon for continued growth. The increase in unit sales was mainly a result of Amazon’s efforts to reduce prices for customers, shipping offers, increased in-stock inventory availability, and more product variety.24
Migros Ticaret A.Ş. continued to experience rapid revenue growth with a 38.7 percent year-on-year increase. This growth saw Migros increase its ranking in both the Fastest 50 from No. 37 to No. 25, and from No. 247 to No. 225 in the Top 250. This growth was a result of opening 193 stores in FY2017 and acquiring a 96.25 percent stake in Kipa, a modern retailing chain with a presence in Turkey’s Aegean region.25
Magazine Luiza S.A as a new entrant to the Fastest 50 and the Top 250 reinforces the revenue growth experienced in Latin America in FY2017. This growth was derived from the opening of 60 new stores in FY2017 resulting in 26.1 percent retail revenue growth.
Reliance Industries Limited/Reliance Retail was a new entrant in the Fastest 50 list FY2016 and continued its rapid growth by nearly doubling its retail revenue (in local currency) in FY2017. This was also reflected in its climb of 95 places to No. 94 in the Top 250. Reliance’s retail segment witnessed robust operating performance, driven by major growth across its grocery, consumer electronics, and fashion and lifestyle businesses. This was supported by a combination of store expansion and same store sales growth across its store concepts.26,27
31
Global Powers of Retailing 2019 | Fastest 50
Several retailers in the Fastest 50 list benefited from new store openings and M&A activity
Among the more significant deals:
• Lenta opened 40 new hypermarkets and 49 new supermarkets, and acquired 22 supermarkets from Holiday, thereby helping Lenta Group achieve an immediate, sizeable presence in Siberia.28
• New entrant B&M European Value Retail S.A. entered the Fastest 50 and Top 250 through opening 39 new stores in the UK, 11 in Germany, and acquiring Heron Foods resulting in an additional 265 stores predominantly based in the North of England.29
Case study 1
Founded in 2002, Wayfair, Inc. is an e-commerce retailer that sells furniture, home furnishings, décor and other home goods. Its retail revenue increased by 39.7 percent year-on-year to US$4.7 billion in FY2017, driven by strong growth in the domestic market as well as internationally. The e-tailer has witnessed strong growth in the last few years with a 51.0 percent composite CAGR from FY2012 to FY2017. However, Wayfair realized a net loss of US$244.6 million in FY2017, which it attributes to its investments aimed at expansion of its international business in Canada, the UK and Germany. It is focused on building its international infrastructure, enhancing country specific knowledge, increasing its international supplier networks, and building strong brand presence in select countries.32,33
Case Study 2
Albertsons’ leading position in the Fastest 50 FY2012-2017 CAGR is due to two very large acquisitions in 2013 and 2015. Albertsons posted more than a five times increase in revenue in 2013, when Albertson’s LLC brought all of the Albertsons stores back together again by purchasing the assets from SUPERVALU that they had acquired in 2006 from the former Albertson’s, Inc. In 2015, revenue more than doubled again, when Albertsons acquired Safeway, Inc. Some recent acquisitions include a 45 percent equity interest in each of Mexico Foods Parent LLC and La Fabrica Parent LLC (“El Rancho”), a Texas-based specialty grocer, in November 2017, and the acquisition of MedCart Specialty Pharmacy in May 2017. The merger of Albertsons Companies and Rite Aid was announced in February 2018, but in August 2018, the companies stated that they mutually agreed to terminate this merger agreement.34,35
Case Study 3
China based e-commerce retailers, Vipshop Holdings Limited and JD.com, Inc., are among the top three Fastest 50 retailers in FY2017. Vipshop’s retail revenue increased by 73.8 percent composite CAGR from FY2012-2017 and JD.com’s by 52.4 percent. These two e-tailers were also among the top three Fastest 50 retailers in FY2016, with Vipshop being the fastest-growing retailer that year.
• JD.com witnessed very rapid growth with close to 40 percent year-on-year retail revenue growth, mainly driven by growth in customers. JD.com’s active customer accounts increased from 226.6 million in FY2016 to 292.5 million in FY2017. This increase was primarily driven by its success in attracting new active customer accounts, as well as by its success in generating repeat purchases from existing customer accounts.36
• Vipshop which started its operations in 2008, has also recorded significant growth, with the retailer delivering close to 335 million customer orders in 2017. This has increased dramatically from approximately 193.1 million orders in 2015, and 269.8 million in 2016. In December 2017, Vipshop entered into a strategic cooperation framework agreement with a Tencent subsidiary and JD.com, providing it with entry on the interface of Weixin Wallet, the main page of JD.com’s mobile application, and also the main page of JD.com’s Weixin Discovery shopping entry.37
• JD Sports Fashion Plc has continued its M&A activity in Australia, Malaysia and the Netherlands in FY2016 with further acquisitions in FY2017, increasing its presence in the UK, South Korea, Spain, and Portugal, resulting in a 37.2 percent increase in its retail revenue in FY2017. There was further M&A activity in the US in FY2018.30
• X5 Retail Group N.V. witnessed a spike in retail revenue of 25.3 percent year-on-year, benefiting from the acquisition of a number of stores from both Sedmov Kontinent and Monetka retail chains. In addition, in December 2017, X5 Retail Group acquired a number of stores from the O’KEY retail chain in St Petersburg and Moscow, however, this acquisition did not contribute any revenue to the retailer in FY2017.31
32
Global Powers of Retailing 2019 | Fastest 50
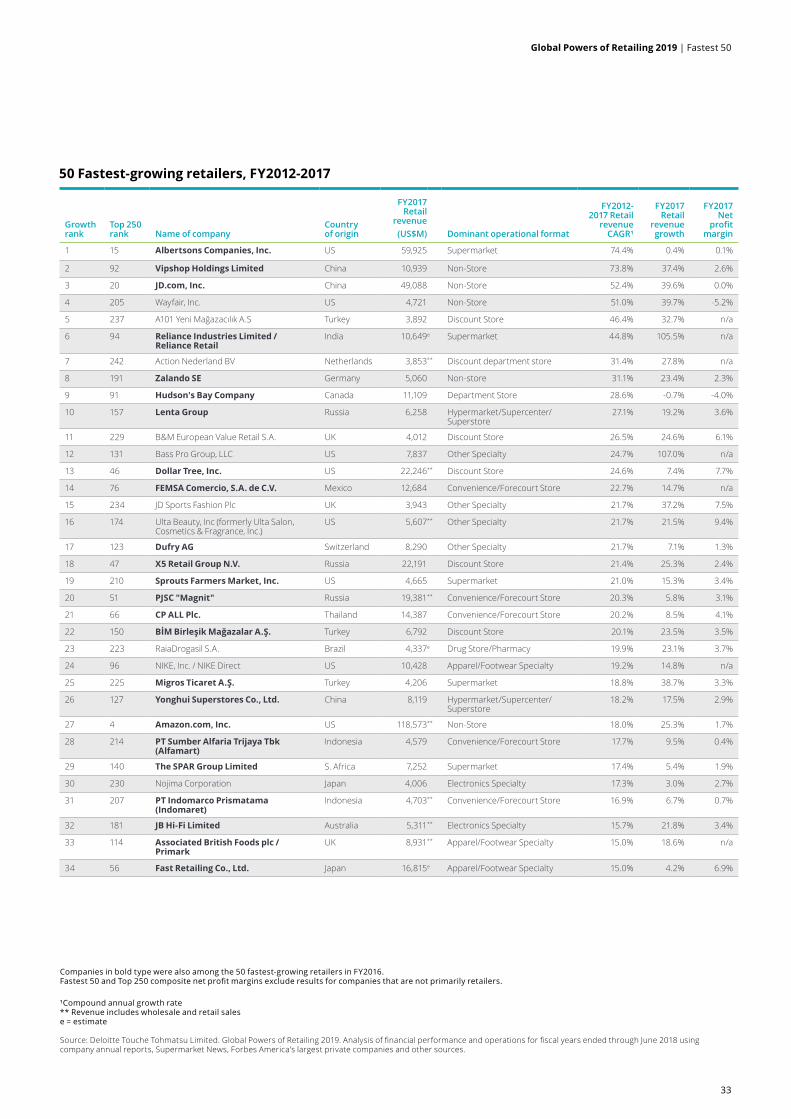
Growth rank
Top 250 rank Name of company
Country of origin
FY2017 Retail
revenue (US$M) Dominant operational format
FY2012-2017 Retail
revenue CAGR¹
FY2017 Retail
revenue growth
FY2017 Net
profit margin
1 15 Albertsons Companies, Inc. US 59,925 Supermarket 74.4% 0.4% 0.1%
2 92 Vipshop Holdings Limited China 10,939 Non-Store 73.8% 37.4% 2.6%
3 20 JD.com, Inc. China 49,088 Non-Store 52.4% 39.6% 0.0%
4 205 Wayfair, Inc. US 4,721 Non-Store 51.0% 39.7% -5.2%
5 237 A101 Yeni Mağazacılık A.S Turkey 3,892 Discount Store 46.4% 32.7% n/a
6 94 Reliance Industries Limited / Reliance Retail
India 10,649e Supermarket 44.8% 105.5% n/a
7 242 Action Nederland BV Netherlands 3,853** Discount department store 31.4% 27.8% n/a
8 191 Zalando SE Germany 5,060 Non-store 31.1% 23.4% 2.3%
9 91 Hudson's Bay Company Canada 11,109 Department Store 28.6% -0.7% -4.0%
10 157 Lenta Group Russia 6,258 Hypermarket/Supercenter/Superstore
27.1% 19.2% 3.6%
11 229 B&M European Value Retail S.A. UK 4,012 Discount Store 26.5% 24.6% 6.1%
12 131 Bass Pro Group, LLC US 7,837 Other Specialty 24.7% 107.0% n/a
13 46 Dollar Tree, Inc. US 22,246** Discount Store 24.6% 7.4% 7.7%
14 76 FEMSA Comercio, S.A. de C.V. Mexico 12,684 Convenience/Forecourt Store 22.7% 14.7% n/a
15 234 JD Sports Fashion Plc UK 3,943 Other Specialty 21.7% 37.2% 7.5%
16 174 Ulta Beauty, Inc (formerly Ulta Salon, Cosmetics & Fragrance, Inc.)
US 5,607** Other Specialty 21.7% 21.5% 9.4%
17 123 Dufry AG Switzerland 8,290 Other Specialty 21.7% 7.1% 1.3%
18 47 X5 Retail Group N.V. Russia 22,191 Discount Store 21.4% 25.3% 2.4%
19 210 Sprouts Farmers Market, Inc. US 4,665 Supermarket 21.0% 15.3% 3.4%
20 51 PJSC "Magnit" Russia 19,381** Convenience/Forecourt Store 20.3% 5.8% 3.1%
21 66 CP ALL Plc. Thailand 14,387 Convenience/Forecourt Store 20.2% 8.5% 4.1%
22 150 BİM Birleşik Mağazalar A.Ş. Turkey 6,792 Discount Store 20.1% 23.5% 3.5%
23 223 RaiaDrogasil S.A. Brazil 4,337e Drug Store/Pharmacy 19.9% 23.1% 3.7%
24 96 NIKE, Inc. / NIKE Direct US 10,428 Apparel/Footwear Specialty 19.2% 14.8% n/a
25 225 Migros Ticaret A.Ş. Turkey 4,206 Supermarket 18.8% 38.7% 3.3%
26 127 Yonghui Superstores Co., Ltd. China 8,119 Hypermarket/Supercenter/Superstore
18.2% 17.5% 2.9%
27 4 Amazon.com, Inc. US 118,573** Non-Store 18.0% 25.3% 1.7%
28 214 PT Sumber Alfaria Trijaya Tbk (Alfamart)
Indonesia 4,579 Convenience/Forecourt Store 17.7% 9.5% 0.4%
29 140 The SPAR Group Limited S. Africa 7,252 Supermarket 17.4% 5.4% 1.9%
30 230 Nojima Corporation Japan 4,006 Electronics Specialty 17.3% 3.0% 2.7%
31 207 PT Indomarco Prismatama (Indomaret)
Indonesia 4,703** Convenience/Forecourt Store 16.9% 6.7% 0.7%
32 181 JB Hi-Fi Limited Australia 5,311** Electronics Specialty 15.7% 21.8% 3.4%
33 114 Associated British Foods plc / Primark
UK 8,931** Apparel/Footwear Specialty 15.0% 18.6% n/a
34 56 Fast Retailing Co., Ltd. Japan 16,815e Apparel/Footwear Specialty 15.0% 4.2% 6.9%
Companies in bold type were also among the 50 fastest-growing retailers in FY2016. Fastest 50 and Top 250 composite net profit margins exclude results for companies that are not primarily retailers. ¹Compound annual growth rate** Revenue includes wholesale and retail salese = estimate
Source: Deloitte Touche Tohmatsu Limited. Global Powers of Retailing 2019. Analysis of financial performance and operations for fiscal years ended through June 2018 using company annual reports, Supermarket News, Forbes America’s largest private companies and other sources.
50 Fastest-growing retailers, FY2012-2017
33
Global Powers of Retailing 2019 | Fastest 50

Growth rank
Top 250 rank Name of company
Country of origin
FY2017 Retail
revenue (US$M) Dominant operational format
FY2012-2017 Retail
revenue CAGR¹
FY2017 Retail
revenue growth
FY2017 Net
profit margin
35 152 Ascena Retail Group, Inc. US 6,650 Apparel/Footwear Specialty 14.7% -4.9% -16.1%
36 166 Tsuruha Holdings Inc. Japan 6,086 Drug Store/Pharmacy 14.4% 16.7% 3.9%
37 119 Central Group Thailand 8,631** Department Store 14.3% 3.0% n/a
38 179 Woolworths Holdings Limited S. Africa 5,332e Department Store 14.3% 1.8% -5.2%
39 201 OJSC Dixy Group Russia 4,803 Supermarket 14.0% -9.4% -2.1%
40 36 Suning.com Co., Ltd. (formerly Suning Commerce Group Co., Ltd.)
China 27,801 Electronics Specialty 13.8% 26.5% 2.2%
41 11 Ahold Delhaize (formerly Koninklijke Ahold N.V.)
Netherlands 72,312 Supermarket 13.8% 0.6% 2.9%
42 98 Kering S.A. France 10,274 Apparel/Footwear Specialty 13.3% 30.5% 12.1%
43 169 SM Investments Corporation Philippines 5,886 Hypermarket/Supercenter/Superstore
13.2% 7.6% 13.0%
44 171 El Puerto de Liverpool, S.A.B. de C.V. Mexico 5,738 Department Store 13.1% 23.5% 8.1%
45 122 FNAC Darty S.A. (formerly Groupe FNAC S.A.)
France 8,395 Other Specialty 12.9% 0.4% 1.7%
46 135 H2O Retailing Corporation Japan 7,724e Department Store 12.4% 2.3% 1.6%
47 149 GS Retail Co., Ltd. S. Korea 6,828** Convenience/Forecourt Store 12.0% 10.1% 1.4%
48 32 LVMH Moët Hennessy- Louis Vuitton S.A.
France 33,289 Other Specialty 11.8% 21.4% 13.2%
49 192 Cosmos Pharmaceutical Corp. Japan 5,054e Drug Store/Pharmacy 11.1% 11.0% 3.2%
50 249 Magazine Luiza S.A. Brazil 3,735** Other Specialty 11.1% 26.1% 3.2%
Fastest 50 sales-weighted, currency-adjusted composite 17.1% 17.4% 2.5%
Top 250 sales-weighted, currency-adjusted composite 3.3% 5.7% 2.3%
Companies in bold type were also among the 50 fastest-growing retailers in FY2016. Fastest 50 and Top 250 composite net profit margins exclude results for companies that are not primarily retailers. ¹Compound annual growth rate** Revenue includes wholesale and retail salese = estimate
Source: Deloitte Touche Tohmatsu Limited. Global Powers of Retailing 2019. Analysis of financial performance and operations for fiscal years ended through June 2018 using company annual reports, Supermarket News, Forbes America’s largest private companies and other sources.
34
Global Powers of Retailing 2019 | Fastest 50

Study methodology and data sources
35

Study methodology and data sources
Companies were included in the Global Powers of Retailing Top 250 based on their non-auto retail revenue for FY2017 (encompassing companies’ fiscal years ended through June 2018). To be included on the list, a company does not have to derive the majority of its revenue from retailing so long as its retailing activity is large enough to qualify. Private equity and other investment firms are not considered as retail entities in this report – only their individual operating companies.
A number of sources are consulted to develop the Top 250 list. The principal data sources for financial and other company information are annual reports, SEC filings, and information found in company press releases and fact sheets or on company websites. If company-issued information is not available, other public-domain sources are used, including trade journal estimates, industry analyst reports, and press interviews. Each year a small number of privately-owned retailers cannot be included in the ranking, because there is insufficient data from any source to make a reasonable estimate of their retail revenue. Carrefour S.A. has been excluded from this year’s report at the company’s request.
Group revenue reflects the consolidated net revenue of a retailer’s parent company, whether or not that company itself is primarily a retailer. Similarly, the income/loss and total assets figures also reflect the consolidated results of the parent organization. However, where retail revenue is less than 50 percent of group revenue, income/loss and total assets are not used. If a privately held company reports gross turnover only, this figure is reported as group revenue and footnoted as “g.” Revenue figures do not include operations in which a company has only a minority interest.
The retail revenue figures in this report reflect only the retail portion of the company’s consolidated net revenue. As a result, they may reflect adjustments to reported revenue figures to exclude non-retail operations. Retail revenue includes foodservice sales if foodservice is sold as one of the merchandise offerings inside the retail store or if restaurants are located within the company’s stores, but excludes separate foodservice/restaurant operations where it is possible to break them out. Retail revenue also includes sales of services related to the company’s retail activities, such as alterations, repair, maintenance, installation, etc.; fuel sales; and membership fees. However, retailers that derive the majority of their retail revenue from the sale of motor fuel are considered to be primarily gas stations and are excluded from Top 250 consideration. Retail revenue includes B2B sales made from retail stores, such as warehouse clubs, cash-and-carry operations, DIY warehouses, automotive parts stores, etc.
Revenue figures do not include the retail banner sales of franchised, licensed, or independent cooperative member stores; however, they do include royalties and franchising or licensing fees. Group revenue includes wholesale sales to such networked operations as well as to unaffiliated stores. Retail revenue includes wholesale sales to affiliated/member stores but excludes traditional wholesale or other business-to-business revenue (except where such revenue is derived from retail stores), where it is possible to break them out. For vertically integrated companies, the combination of retail sales, controlled wholesale space sales (i.e., sales to franchise stores, leased in-store shops/concessions), and other retail-related revenue (e.g., franchise/license fees, royalties, commissions) are included in the retail revenue figure. For e-commerce companies, retail revenue includes only direct B2C sales where the company is the seller of record. It excludes the sales of third-party sellers as well as third-party seller fees and commissions (“marketplace” activity sales).
In order to provide a common base from which to rank companies by their retail revenue results, revenues for non-US companies are converted to US dollars. Exchange rates, therefore, have an impact on the results. OANDA.com is the source for the exchange rates. The average daily exchange rate corresponding to each company’s fiscal year is used to convert that company’s results to US dollars. Individual companies’ FY2017 year-over-year growth rate and FY2012-2017 compound annual growth rate (CAGR), however, are calculated in each company’s local currency.
Group financial results are based only on companies with data. Not all data elements are available for all companies. It should also be noted that the financial information used for each company in a given year is accurate as of the date the financial report was originally issued. Although a company may have restated prior-year results to reflect a change in its operations or as a result of an accounting change, such restatements are not reflected in this data, except in special circumstances.
This study is not an accounting report. It is intended to provide a reflection of market dynamics and the impact on the retailing industry over a period of time. As a result of these factors, growth rates for individual companies may not correspond to other published results.
36
Global Powers of Retailing 2019 | Study methodology and data sources
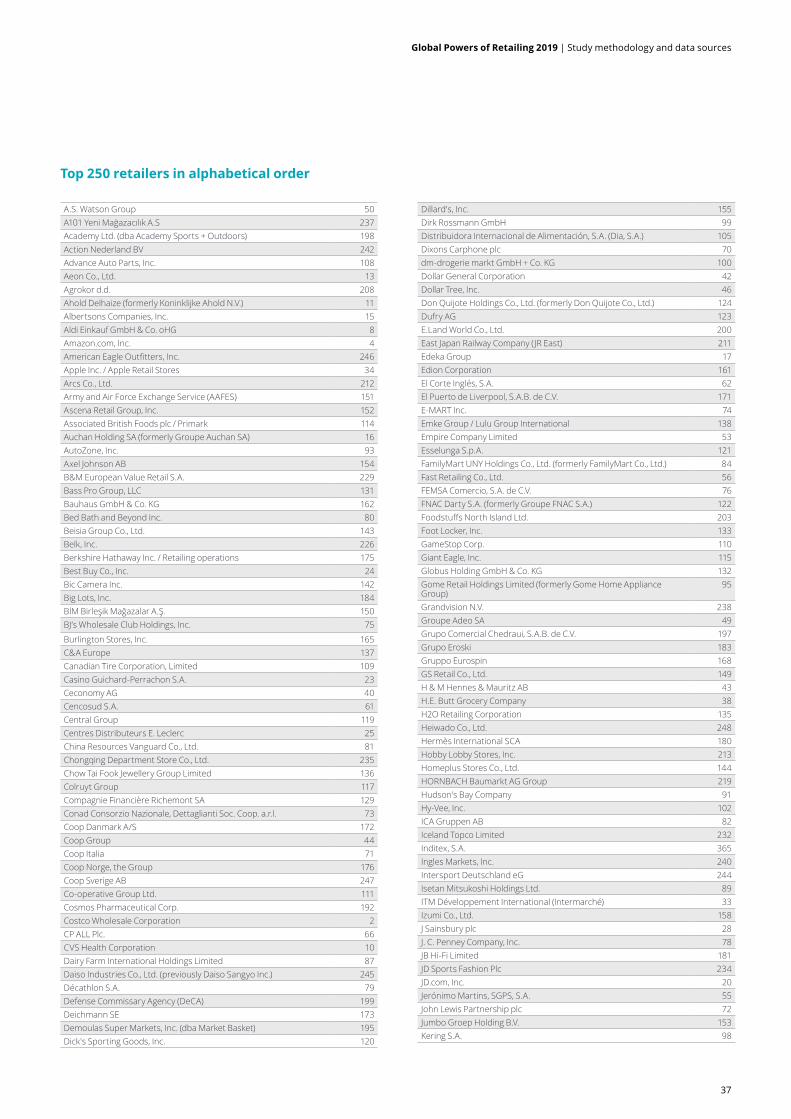
A.S. Watson Group 50A101 Yeni Mağazacılık A.S 237Academy Ltd. (dba Academy Sports + Outdoors) 198Action Nederland BV 242Advance Auto Parts, Inc. 108Aeon Co., Ltd. 13Agrokor d.d. 208Ahold Delhaize (formerly Koninklijke Ahold N.V.) 11Albertsons Companies, Inc. 15Aldi Einkauf GmbH & Co. oHG 8Amazon.com, Inc. 4American Eagle Outfitters, Inc. 246Apple Inc. / Apple Retail Stores 34Arcs Co., Ltd. 212Army and Air Force Exchange Service (AAFES) 151Ascena Retail Group, Inc. 152Associated British Foods plc / Primark 114Auchan Holding SA (formerly Groupe Auchan SA) 16AutoZone, Inc. 93Axel Johnson AB 154B&M European Value Retail S.A. 229Bass Pro Group, LLC 131Bauhaus GmbH & Co. KG 162Bed Bath and Beyond Inc. 80Beisia Group Co., Ltd. 143Belk, Inc. 226Berkshire Hathaway Inc. / Retailing operations 175Best Buy Co., Inc. 24Bic Camera Inc. 142Big Lots, Inc. 184BİM Birleşik Mağazalar A.Ş. 150BJ’s Wholesale Club Holdings, Inc. 75
Burlington Stores, Inc. 165C&A Europe 137Canadian Tire Corporation, Limited 109Casino Guichard-Perrachon S.A. 23Ceconomy AG 40Cencosud S.A. 61Central Group 119Centres Distributeurs E. Leclerc 25China Resources Vanguard Co., Ltd. 81Chongqing Department Store Co., Ltd. 235Chow Tai Fook Jewellery Group Limited 136Colruyt Group 117Compagnie Financière Richemont SA 129Conad Consorzio Nazionale, Dettaglianti Soc. Coop. a.r.l. 73Coop Danmark A/S 172Coop Group 44Coop Italia 71Coop Norge, the Group 176Coop Sverige AB 247Co-operative Group Ltd. 111Cosmos Pharmaceutical Corp. 192Costco Wholesale Corporation 2CP ALL Plc. 66CVS Health Corporation 10Dairy Farm International Holdings Limited 87Daiso Industries Co., Ltd. (previously Daiso Sangyo Inc.) 245Décathlon S.A. 79Defense Commissary Agency (DeCA) 199Deichmann SE 173Demoulas Super Markets, Inc. (dba Market Basket) 195Dick's Sporting Goods, Inc. 120
Dillard's, Inc. 155Dirk Rossmann GmbH 99Distribuidora Internacional de Alimentación, S.A. (Dia, S.A.) 105Dixons Carphone plc 70dm-drogerie markt GmbH + Co. KG 100Dollar General Corporation 42Dollar Tree, Inc. 46Don Quijote Holdings Co., Ltd. (formerly Don Quijote Co., Ltd.) 124Dufry AG 123E.Land World Co., Ltd. 200East Japan Railway Company (JR East) 211Edeka Group 17Edion Corporation 161El Corte Inglés, S.A. 62El Puerto de Liverpool, S.A.B. de C.V. 171E-MART Inc. 74Emke Group / Lulu Group International 138Empire Company Limited 53Esselunga S.p.A. 121FamilyMart UNY Holdings Co., Ltd. (formerly FamilyMart Co., Ltd.) 84Fast Retailing Co., Ltd. 56FEMSA Comercio, S.A. de C.V. 76FNAC Darty S.A. (formerly Groupe FNAC S.A.) 122Foodstuffs North Island Ltd. 203Foot Locker, Inc. 133GameStop Corp. 110Giant Eagle, Inc. 115Globus Holding GmbH & Co. KG 132Gome Retail Holdings Limited (formerly Gome Home Appliance Group)
95
Grandvision N.V. 238Groupe Adeo SA 49Grupo Comercial Chedraui, S.A.B. de C.V. 197Grupo Eroski 183Gruppo Eurospin 168GS Retail Co., Ltd. 149H & M Hennes & Mauritz AB 43H.E. Butt Grocery Company 38H2O Retailing Corporation 135Heiwado Co., Ltd. 248Hermès International SCA 180Hobby Lobby Stores, Inc. 213Homeplus Stores Co., Ltd. 144HORNBACH Baumarkt AG Group 219Hudson's Bay Company 91Hy-Vee, Inc. 102ICA Gruppen AB 82Iceland Topco Limited 232Inditex, S.A. 365Ingles Markets, Inc. 240Intersport Deutschland eG 244Isetan Mitsukoshi Holdings Ltd. 89ITM Développement International (Intermarché) 33Izumi Co., Ltd. 158J Sainsbury plc 28J. C. Penney Company, Inc. 78JB Hi-Fi Limited 181JD Sports Fashion Plc 234JD.com, Inc. 20Jerónimo Martins, SGPS, S.A. 55John Lewis Partnership plc 72Jumbo Groep Holding B.V. 153Kering S.A. 98
Top 250 retailers in alphabetical order
37
Global Powers of Retailing 2019 | Study methodology and data sources
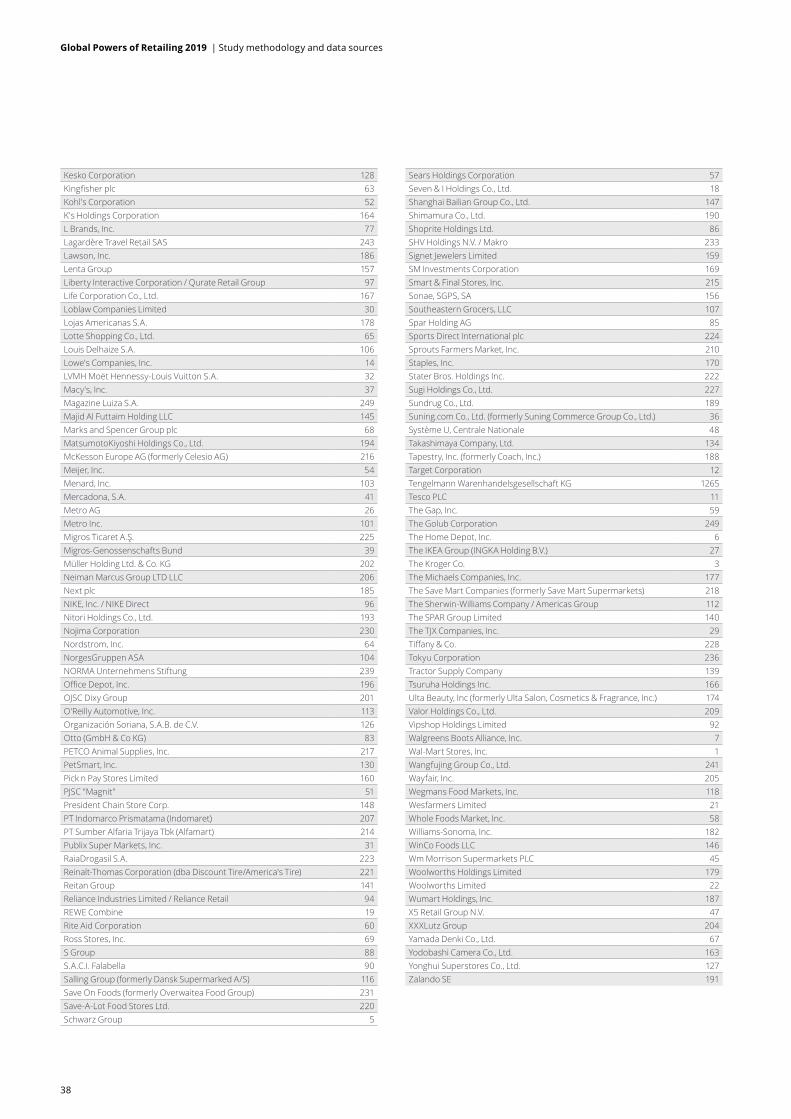
Kesko Corporation 128Kingfisher plc 63Kohl's Corporation 52K's Holdings Corporation 164L Brands, Inc. 77Lagardère Travel Retail SAS 243Lawson, Inc. 186Lenta Group 157Liberty Interactive Corporation / Qurate Retail Group 97Life Corporation Co., Ltd. 167Loblaw Companies Limited 30Lojas Americanas S.A. 178Lotte Shopping Co., Ltd. 65Louis Delhaize S.A. 106Lowe's Companies, Inc. 14LVMH Moët Hennessy-Louis Vuitton S.A. 32Macy's, Inc. 37Magazine Luiza S.A. 249Majid Al Futtaim Holding LLC 145Marks and Spencer Group plc 68MatsumotoKiyoshi Holdings Co., Ltd. 194McKesson Europe AG (formerly Celesio AG) 216Meijer, Inc. 54Menard, Inc. 103Mercadona, S.A. 41Metro AG 26Metro Inc. 101Migros Ticaret A.Ş. 225Migros-Genossenschafts Bund 39Müller Holding Ltd. & Co. KG 202Neiman Marcus Group LTD LLC 206Next plc 185NIKE, Inc. / NIKE Direct 96Nitori Holdings Co., Ltd. 193Nojima Corporation 230Nordstrom, Inc. 64NorgesGruppen ASA 104NORMA Unternehmens Stiftung 239Office Depot, Inc. 196OJSC Dixy Group 201O'Reilly Automotive, Inc. 113Organización Soriana, S.A.B. de C.V. 126Otto (GmbH & Co KG) 83PETCO Animal Supplies, Inc. 217PetSmart, Inc. 130Pick n Pay Stores Limited 160PJSC "Magnit" 51President Chain Store Corp. 148PT Indomarco Prismatama (Indomaret) 207PT Sumber Alfaria Trijaya Tbk (Alfamart) 214Publix Super Markets, Inc. 31RaiaDrogasil S.A. 223Reinalt-Thomas Corporation (dba Discount Tire/America's Tire) 221Reitan Group 141Reliance Industries Limited / Reliance Retail 94REWE Combine 19Rite Aid Corporation 60Ross Stores, Inc. 69S Group 88S.A.C.I. Falabella 90Salling Group (formerly Dansk Supermarked A/S) 116Save On Foods (formerly Overwaitea Food Group) 231Save-A-Lot Food Stores Ltd. 220Schwarz Group 5
Sears Holdings Corporation 57Seven & I Holdings Co., Ltd. 18Shanghai Bailian Group Co., Ltd. 147Shimamura Co., Ltd. 190Shoprite Holdings Ltd. 86SHV Holdings N.V. / Makro 233Signet Jewelers Limited 159SM Investments Corporation 169Smart & Final Stores, Inc. 215Sonae, SGPS, SA 156Southeastern Grocers, LLC 107Spar Holding AG 85Sports Direct International plc 224Sprouts Farmers Market, Inc. 210Staples, Inc. 170Stater Bros. Holdings Inc. 222Sugi Holdings Co., Ltd. 227Sundrug Co., Ltd. 189Suning.com Co., Ltd. (formerly Suning Commerce Group Co., Ltd.) 36Système U, Centrale Nationale 48Takashimaya Company, Ltd. 134Tapestry, Inc. (formerly Coach, Inc.) 188Target Corporation 12Tengelmann Warenhandelsgesellschaft KG 1265Tesco PLC 11The Gap, Inc. 59The Golub Corporation 249The Home Depot, Inc. 6The IKEA Group (INGKA Holding B.V.) 27The Kroger Co. 3The Michaels Companies, Inc. 177The Save Mart Companies (formerly Save Mart Supermarkets) 218The Sherwin-Williams Company / Americas Group 112The SPAR Group Limited 140The TJX Companies, Inc. 29Tiffany & Co. 228Tokyu Corporation 236Tractor Supply Company 139Tsuruha Holdings Inc. 166Ulta Beauty, Inc (formerly Ulta Salon, Cosmetics & Fragrance, Inc.) 174Valor Holdings Co., Ltd. 209Vipshop Holdings Limited 92Walgreens Boots Alliance, Inc. 7Wal-Mart Stores, Inc. 1Wangfujing Group Co., Ltd. 241Wayfair, Inc. 205Wegmans Food Markets, Inc. 118Wesfarmers Limited 21Whole Foods Market, Inc. 58Williams-Sonoma, Inc. 182WinCo Foods LLC 146Wm Morrison Supermarkets PLC 45Woolworths Holdings Limited 179Woolworths Limited 22Wumart Holdings, Inc. 187X5 Retail Group N.V. 47XXXLutz Group 204Yamada Denki Co., Ltd. 67Yodobashi Camera Co., Ltd. 163Yonghui Superstores Co., Ltd. 127Zalando SE 191
38
Global Powers of Retailing 2019 | Study methodology and data sources

Endnotes1. Walmart’s U.S. Online Sales Rise 63%. 18 May 2017. Retrieved
from http://fortune.com/2017/05/18/walmart-online/
2. How Walmart, the Big Seller, Is Shopping for a Fight With Amazon. May 2018. Retrieved from http://www.nytimes.com/interactive/2018/05/09/business/dealbook/walmart-acquisitions-flipkart.html
3. Costco opens in Iceland and France. 14 December 2017. Retrieved from http://www.annualreports.com/HostedData/AnnualReports/PDF/NASDAQ_COST_2017.pdf
4. Kroger unveils plan to invest in technology, store resets. 11 Oct 2017. https://www.supermarketnews.com/news/kroger-unveils-plan-invest-technology-store-resets
5. Amazon sales surge after Whole Foods acquisition, busy Prime Day. 26 October 2017. Retrieved from https://www.reuters.com/article/us-amazon-com-results/amazon-sales-surge-after-whole-foods-acquisition-busy-prime-day-idUSKBN1CV28U
6. Lidl and Kaufland 2017 financial results. 04 May 2018.https://retailanalysis.igd.com/markets/austria/news/-news-article/t/lidl-and-kaufland-2017-financial-results/i/18894
7. The Home Depot announces quarterly and annual results. 20 February 2018. http://ir.homedepot.com/news-releases/2018/02-20-2018-110229467
8. Rite Aid Says All 1,932 Stores Transferred To Walgreens. 28 March 2018. https://www.forbes.com/sites/brucejapsen/2018/03/28/rite-aid-says-all-1932-stores-transferred-to-walgreens/#bf4039217d05
9. Walgreens and Prime Therapeutics complete formation of AllianceRx Walgreens Prime, a combined central specialty pharmacy and mail services company. 3 April 2017. https://www.primetherapeutics.com/en/news/pressreleases/2017/alliancerx-walgreens-prime-release.html
10. ALDI Ramps Up US Expansion with Goal of 2,500 Stores by End of 2022. 12 June 2017.https://www.prnewswire.com/news-releases/aldi-ramps-up-us-expansion-with-goal-of-2500-stores-by-end-of-2022-300471829.html
11. Tesco’s profit held back by Thailand and Poland. 3 October 2018. Retrieved from https://www.euronews.com/2018/10/03/tesco-profit-hit-by-weak-sales-in-europe-and-asia
12. Tesco says ‘strategic partnership’ will cut prices. 2 July 2018. Retrieved from https://www.bbc.co.uk/news/business-44679884
13. CVS Health Corporation 10-K Annual Report, page 103. 14 February 2018. http://investors.cvshealth.com/~/media/Files/C/CVS-IR-v3/documents/02-08-2018/Q4%202017%20Form%2010K%20Final%20v2b.pdf
14. CVS Health press release. 3 December 2017. https://cvshealth.com/newsroom/press-releases/cvs-health-acquire-aetna-combination-provide-consumers-better-experience
15. Food prices fall again at the supermarket. 23 October 2017. Retrieved from https://www.grocerydive.com/news/grocery--food-prices-fall-again-at-the-supermarket/534573/
16. Sticker shock: Price war battles intensify among large grocers. 7 June 2018. Retrieved from https://www.grocerydive.com/news/grocery--sticker-shock-price-war-battles-intensify-among-large-grocers/533956/
17. Walmart completes acquisition of majority stake in Flipkart for $16 bn. 19 August 2018. Retrieved from https://www.business-standard.com/article/companies/walmart-completes-acquisition-of-majority-stake-in-flipkart-for-16-bn-118081800684_1.htmll
18. Walmart and Flipkart Announce Completion of Walmart Investment in Flipkart, India’s Leading Marketplace eCommerce Platform. 18 August 2018. Retrieved from https://news.walmart.com/2018/08/18/walmart-and-flipkart-announce-completion-of-walmart-investment-in-flipkart-indias-leading-marketplace-ecommerce-platform
19. 7-Eleven, Inc. Completes Acquisition of 1,030 Sunoco Stores. 23 January 2018. Retrieved from https://corp.7-eleven.com/corp-press-releases/01-23-2018-7-eleven-inc-completes-acquisition-of-1-030-sunoco-stores
20. Parent company of 7-Eleven agrees to divest some U.S. stores in Sunoco deal. 20 January 2018. Retrieved from https://www.reuters.com/article/us-sunoco-lp-m-a-seven-i-hldg/parent-company-of-7-eleven-agrees-to-divest-some-us-stores-in-sunoco-deal-idUSKBN1F82P3
21. Rite Aid Says All 1,932 Stores Transferred To Walgreens. 28 March 2018. Retrieved from https://www.forbes.com/sites/brucejapsen/2018/03/28/rite-aid-says-all-1932-stores-transferred-to-walgreens/#1073c28d17d0
22. Sears Holdings annual report: https://www.sec.gov/Archives/edgar/data/1310067/000131006718000006/shld201710k.htm
23. Lotte shopping annual report: http://www.lotteshoppingir.com/eng/data/data_02.jsp
24. Amazon.com, Inc. annual report: https://sec.report/Document/0001018724-18-000005/amzn-20171231x10k.htm
25. Migros Ticaret A.Ş. annual report: https://www.migroskurumsal.com/userfiles/image/pdf/migros-ticaret-annual-report-2017.pdf
26. Reliance annual report: http://www.ril.com/DownloadFiles/CorporateAnnReg/RELIANCE_RD2018.pdf
27. Reliance Retail sales cross $10 bn mark.28 April 2018. Retrieved from https://economictimes.indiatimes.com/industry/services/retail/reliance-retail-sales-cross-10-bn-mark/articleshow/63948867.cms
39
Global Powers of Retailing 2019 | Endnotes
28. 4Q and FY2017 sales and operating results. 25 January 2018. Retrieved from http://www.lentainvestor.com/en/media-centre/news-article/id/1795
29. B&M European Value Retail S.A. annual report: http://www.bandmretail.com/~/media/Files/B/BM-Stores/reports-and-presentations/financial-reports/announcement-of-2017-18-full-year-results.pdf
30. JD Sports Fashion Plc annual report: https://www.jdplc.com/~/media/Files/J/Jd-Sports-Fashion-Plc/reports-and-presentations/2018-annual-report-v1.pdf
31. X5 Retail Group N.V. annual report: https://www.x5.ru/en/PublishingImages/Pages/Investors/ResultCenter/X5_Annual_Report_2017_ENG.pdf
32. Wayfair company website. Retrieved from https://www.wayfair.com/v/about/our_story?red=Q4IR
33. Wayfair annual report: http://d18rn0p25nwr6d.cloudfront.net/CIK-0001616707/5672961b-2fb4-4056-ba3d-f6dae734916a.pdf
34. Albertsons Companies annual report: https://www.sec.gov/Archives/edgar/data/1646972/000164697218000017/acify1710-k.htm#sF0446E14193C565BA166AF1A9E33BA44
35. Albertsons Companies and Rite Aid Mutually Agree to Terminate Merger Agreement. 8 August 2018. Retrieved from https://www.cnbc.com/2018/08/08/globe-newswire-albertsons-companies-and-rite-aid-mutually-agree-to-terminate-merger-agreement.html
36. JD.com’s annual report: https://www.sec.gov/Archives/edgar/data/1549802/000110465918027777/a18-5116_120f.htm
37. Vipshop Holdings Limited’s annual report: https://www.sec.gov/Archives/edgar/data/1529192/000104746918002945/a2235296z20-f.htm
40
Global Powers of Retailing 2019 | Endnotes
Contacts
Global
Global Consumer Industry LeaderVicky [email protected]
Chief Global EconomistIra [email protected]
North America
CanadaStephen [email protected]
Deloitte United States (Deloitte Consulting LLP)Rod [email protected]
Europe, Middle East and Africa (EMEA)
AustriaOrsolya Hegedüs [email protected]
BelgiumJoris van Malderen [email protected]
Czech RepublicMartin Tesař[email protected]
East AfricaRodger [email protected]
FranceAvak Der [email protected]
Benedicte [email protected]
GermanyKarsten Hollasch [email protected]
IrelandDavid [email protected]
IsraelIsrael [email protected]
ItalyPatrizia Arienti [email protected]
NetherlandsAdgild [email protected]
NordicsJoakim [email protected]
PolandJakub [email protected]
PortugalMiguel [email protected]
Russia/CISVladimir [email protected]
South AfricaAndre [email protected]
SpainFernando [email protected]
SwitzerlandKonstantin von [email protected]
Turkey Hakan Gö[email protected]
United KingdomIan [email protected]
Latin America
Argentina and LATCOSergio [email protected]
BrazilReynaldo [email protected]
ChileOmar [email protected]
MexicoErick Calvillo [email protected]
Omar [email protected]
Asia Pacific
AustraliaDavid White [email protected]
ChinaTian Bing [email protected]
IndiaAnil [email protected]
IndonesiaXenia [email protected]
JapanJun Matsuo [email protected]
KoreaSang Keun [email protected]
MalaysiaKavita [email protected]
PhilippinesMelissa [email protected]
Southeast Asia and Singapore Eugene [email protected]
TaiwanJason [email protected]
ThailandManoon [email protected]
Vietnam Nguyen Vu Duc [email protected]
Retail contacts for Deloitte Touche Tohmatsu Limited (DTTL) and its member firms
41
Global Powers of Retailing 2019 | Contacts

Notes
42

Notes
43

Deloitte refers to one or more of Deloitte Touche Tohmatsu Limited (“DTTL”), its global network of member firms, and their related entities. DTTL (also referred to as “Deloitte Global”) and each of its member firms are legally separate and independent entities. DTTL does not provide services to clients. Please see http://www.deloitte.com/about to learn more.
Deloitte is a leading global provider of audit and assurance, consulting, financial advisory, risk advisory, tax and related services. Our network of member firms in more than 150 countries and territories serves four out of five Fortune Global 500® companies. Learn how Deloitte’s approximately 286,000 people make an impact that matters at www.deloitte.com.
This communication contains general information only, and none of Deloitte Touche Tohmatsu Limited, its member firms or their related entities (collectively, the “Deloitte network”) is, by means of this communication, rendering professional advice or services. Before making any decision or taking any action that may affect your finances or your business, you should consult a qualified professional adviser. No entity in the Deloitte network shall be responsible for any loss whatsoever sustained by any person who relies on this communication.
© 2019. For information, contact Deloitte Touche Tohmatsu Limited.