Embed Size (px)
Citation preview

July 2021
Global Private Equity Fact Book – Q2 2021
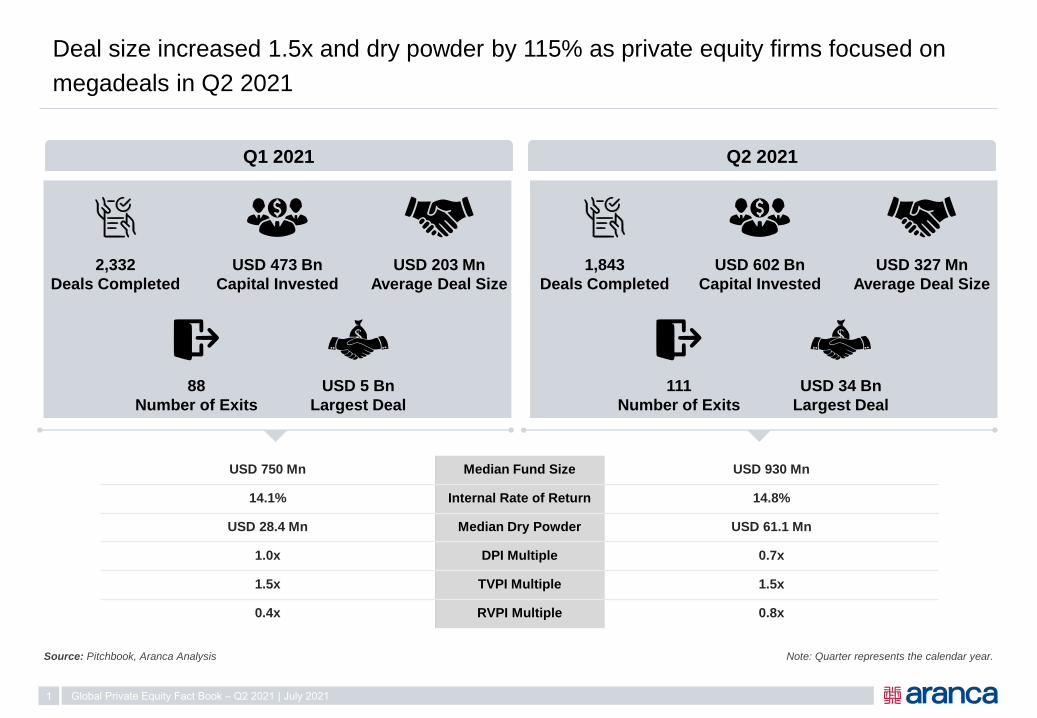
Deal size increased 1.5x and dry powder by 115% as private equity firms focused on
megadeals in Q2 2021
Global Private Equity Fact Book – Q2 2021 | July 20211
Source: Pitchbook, Aranca Analysis
Q1 2021 Q2 2021
2,332
Deals Completed
USD 473 Bn
Capital Invested
USD 203 Mn
Average Deal Size
88
Number of Exits
USD 5 Bn
Largest Deal
1,843
Deals Completed
USD 602 Bn
Capital Invested
USD 327 Mn
Average Deal Size
111
Number of Exits
USD 34 Bn
Largest Deal
Note: Quarter represents the calendar year.
USD 750 Mn Median Fund Size USD 930 Mn
14.1% Internal Rate of Return 14.8%
USD 28.4 Mn Median Dry Powder USD 61.1 Mn
1.0x DPI Multiple 0.7x
1.5x TVPI Multiple 1.5x
0.4x RVPI Multiple 0.8x

64
1610
1 2 1
58
1912
2 2 2
PIPE* Growth/Expansion Buyout/LBO Secondary Buyout CorporateDivesture
Public to Private
Q1 2021 Q2 2021
1,376 1,492
1,848
1,303 1,366
2,332
1,565 1,652 1,5621,284
1,4901,843
1,4821,638
1,433 1,354
1,7741,515
2,003
1,3321,502
2,030
2016 2017 2018 2019 2020 2021
Q1 Q2 Q3 Q4
Note: *PIPE: Private Investment in Public EquitySource: Pitchbook, Aranca Analysis
Number of deals completed down 21%, with more than 58% deals being PIPE
transactions
2
Figures in Units
5,938 6,785 5,443 4,1756,660
Global Private Equity Fact Book – Q2 2021 | July 2021
Indicates annual/YTD deals completed
Number of Deals
Figures in Percentages
Type of Deals – 2021
6,175
“Dry powder held by sophisticated
private equity firms is at record
highs, which provides for
meaningful buyer interest in target
companies.”
– Asset Management &
Investment Banking Firm

23
9
33
7 10 615
6
47
9 415
PIPE* Growth/Expansion Buyout/LBO Secondary Buyout CorporateDivesture
Public to Private
Q1 2021 Q2 2021
Note: *PIPE: Private Investment in Public EquitySource: Pitchbook, Aranca Analysis
Despite lower deal volume, capital invested rose 27% primarily driven by big-ticket
leveraged buyouts
3
Figures in USD Bn
Global Private Equity Fact Book – Q2 2021 | July 2021
Indicates annual/YTD capital invested
Capital Invested
Figures in Percentages
Type of Deals – 2021
329 351 367 392438 433
489
356407
327
489424
365 334382
421346
211302
532473
602
239 224 247 259293
262299
178221 209
341 318
280 260 282 280253
141170
262203
327
0
100
200
300
400
500
600
700
Average Ticket Size (USD Mn)
202120202016 2018 2019
Q1 Q2 Q3 Q4
2017
1,439 1,716 1,502 1,0751,3911,647
“The ongoing COVID-19
vaccination rollout and gradual
easing of lockdown measures have
boosted economic growth and
encouraged deal activity in the first
half of 2021.”
– Accounting and
Business Services Firm
Source: Pitchbook, Aranca Analysis
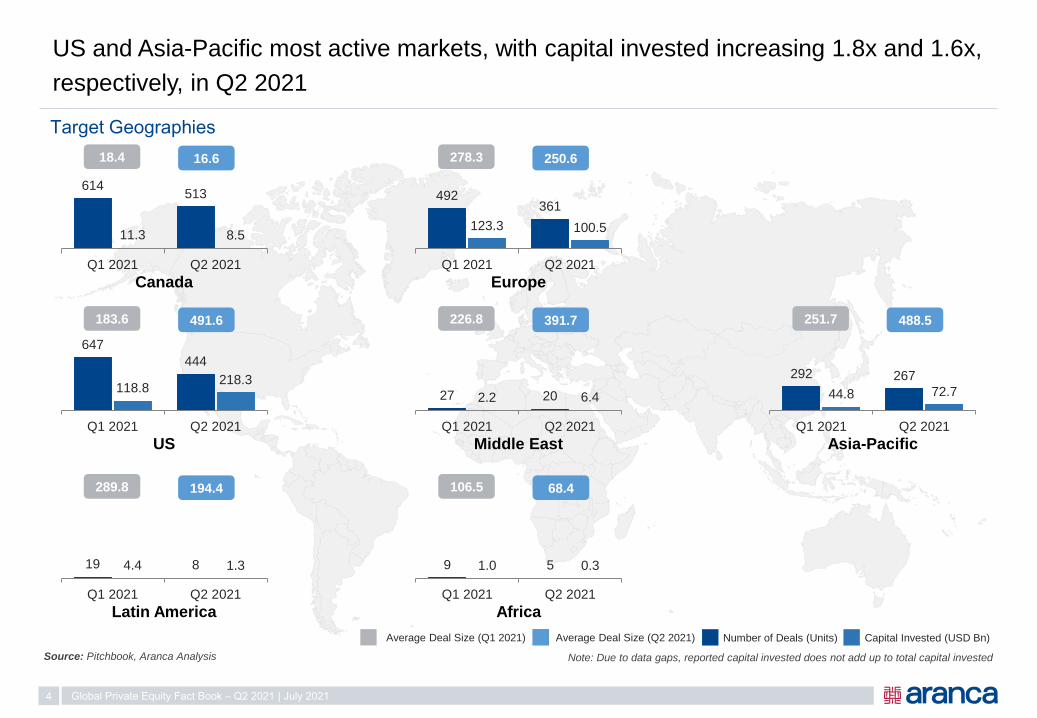
US and Asia-Pacific most active markets, with capital invested increasing 1.8x and 1.6x,
respectively, in Q2 2021
4 Global Private Equity Fact Book – Q2 2021 | July 2021
Number of Deals (Units) Capital Invested (USD Bn)
Target Geographies
Average Deal Size (Q1 2021) Average Deal Size (Q2 2021)
614513
11.3 8.5
Q1 2021 Q2 2021
Canada
16.618.4
647
444
118.8218.3
Q1 2021 Q2 2021
US
491.6183.6
19 84.4 1.3
Q1 2021 Q2 2021
Latin America
194.4289.8
492361
123.3 100.5
Q1 2021 Q2 2021
Europe
250.6278.3
27 202.2 6.4
Q1 2021 Q2 2021
Middle East
391.7226.8
9 51.0 0.3
Q1 2021 Q2 2021
Africa
68.4106.5
292 267
44.8 72.7
Q1 2021 Q2 2021
Asia-Pacific
488.5251.7
Note: Due to data gaps, reported capital invested does not add up to total capital invested
Source: Pitchbook, Aranca Analysis
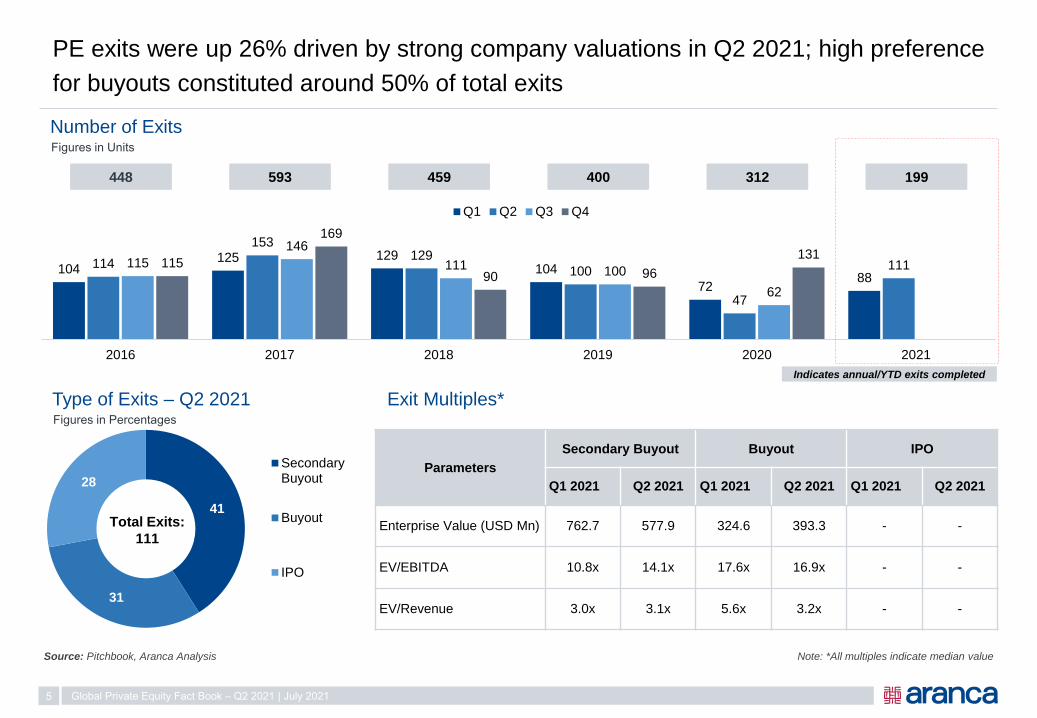
PE exits were up 26% driven by strong company valuations in Q2 2021; high preference
for buyouts constituted around 50% of total exits
5 Global Private Equity Fact Book – Q2 2021 | July 2021
41
31
28
SecondaryBuyout
Buyout
IPO
Parameters
Secondary Buyout Buyout IPO
Q1 2021 Q2 2021 Q1 2021 Q2 2021 Q1 2021 Q2 2021
Enterprise Value (USD Mn) 762.7 577.9 324.6 393.3 - -
EV/EBITDA 10.8x 14.1x 17.6x 16.9x - -
EV/Revenue 3.0x 3.1x 5.6x 3.2x - -
104125 129
104
7288
114
153129
100
47
111115
146
111 100
62
115
169
90 96
131
2016 2017 2018 2019 2020 2021
Q1 Q2 Q3 Q4
Figures in Units
448 593 400 199312
Indicates annual/YTD exits completed
459
Number of Exits
Figures in Percentages
Type of Exits – Q2 2021 Exit Multiples*
Note: *All multiples indicate median value
Total Exits:
111

Source: Pitchbook, Aranca Analysis
IT, Healthcare, Transportation, and Financial Services attracted about 55% of total
capital invested by PE firms in Q2 2021
6 Global Private Equity Fact Book – Q2 2021 | July 2021
85.7 59.441.7 37.5
14.1 13.7 14.025.7 5.7 304.5
271196
46
193
3490
414
947
283
-150
-50
50
150
250
350
450
550
0358
101315182023252830333538404345485053555860636568707375788083858890939598
100103105108110113115118120123125128130133135138140143145148150153155158160163165168170173175178180183185188190193195198200203205208210213215218220223225228230233235238240243245248250253255258260263265268270273275278280283285288290293295298300303305308310
InformationTechnology
Healthcare Transportation FinancialServices
Retail Energy Materials ConsumerProducts and
Services
Utilities Others
Capital Invested (USD Bn) Deal Count (Units)
Top Sectors – Q2 2021
Primary
IndustryCompany Name Deal Date
Deal Size
(USD Mn)
%
Acquired
Deal
TypeInvestors
Deal Size/
EBITDA
Deal Size/
Revenue
EV/
EBITDA
EV/
Revenue
Healthcare Medline Industries Jun-2021 34,000 100Buyout/
LBO
Govt of Singapore Investment Corp,
Hellman & Friedman, and Others- 1.9x - 1.9x
B2B ServicesAutostrade per
l'ItaliaJun-2021 11,325 88
Buyout/
LBO
Cassa Depositi e Prestiti, Macquarie Asset
Management, The Blackstone Group- - - -
Information
Technology
RealPage Apr-2021 10,200 100Buyout/
LBOThoma Bravo 39.8x 8.8x 37.5x 8.3x
Proofpoint Apr-2021 10,100 82Buyout/
LBOThoma Bravo -119.5x 9.3x - 10.5x
Financial
ServicesBlue Owl Capital May-2021 8,300 - PIPE
CH Investment Partners, Federated
Kaufmann Fund, and Others- - - -
Materials Hitachi Metals Apr-2021 7,309 53Buyout/
LBO
Bain Capital, Japan Industrial, Japan
Industrial Partners619.1x 1.0x 1,090.9x 1.8x
Median 39.8x 5.4x 564.2x 5.1x
Top Deals – Q2 2021
Note: Deals include completed and announced
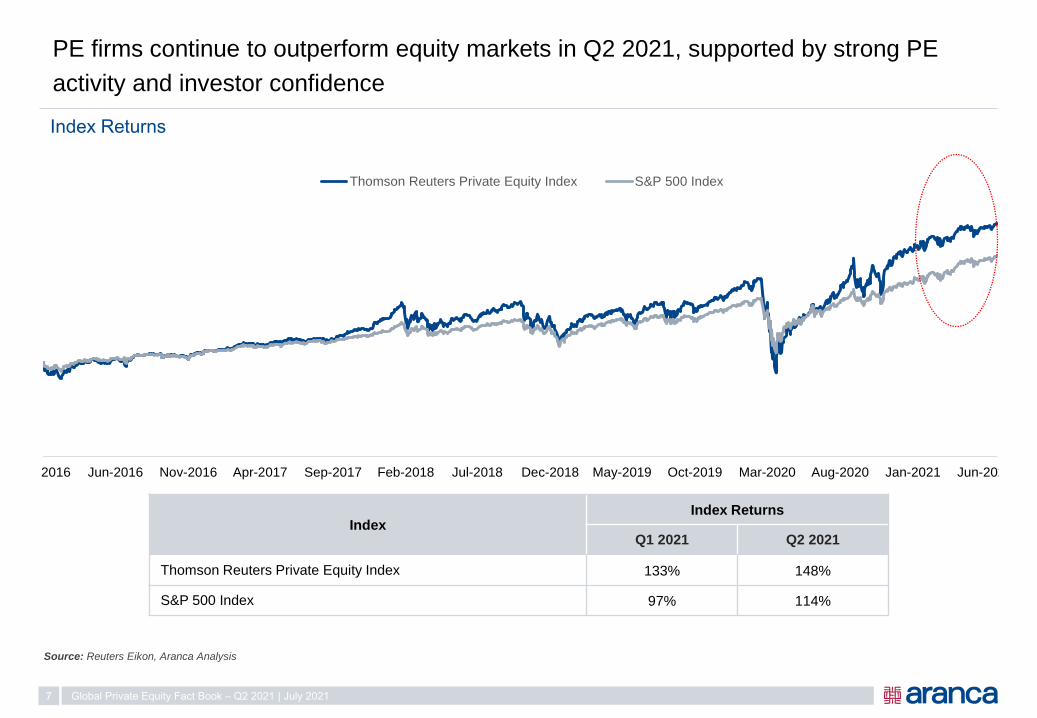
Jan-2016 Jun-2016 Nov-2016 Apr-2017 Sep-2017 Feb-2018 Jul-2018 Dec-2018 May-2019 Oct-2019 Mar-2020 Aug-2020 Jan-2021 Jun-2021
Thomson Reuters Private Equity Index S&P 500 Index
IndexIndex Returns
Q1 2021 Q2 2021
Thomson Reuters Private Equity Index 133% 148%
S&P 500 Index 97% 114%
Source: Reuters Eikon, Aranca Analysis
PE firms continue to outperform equity markets in Q2 2021, supported by strong PE
activity and investor confidence
7 Global Private Equity Fact Book – Q2 2021 | July 2021
Index Returns
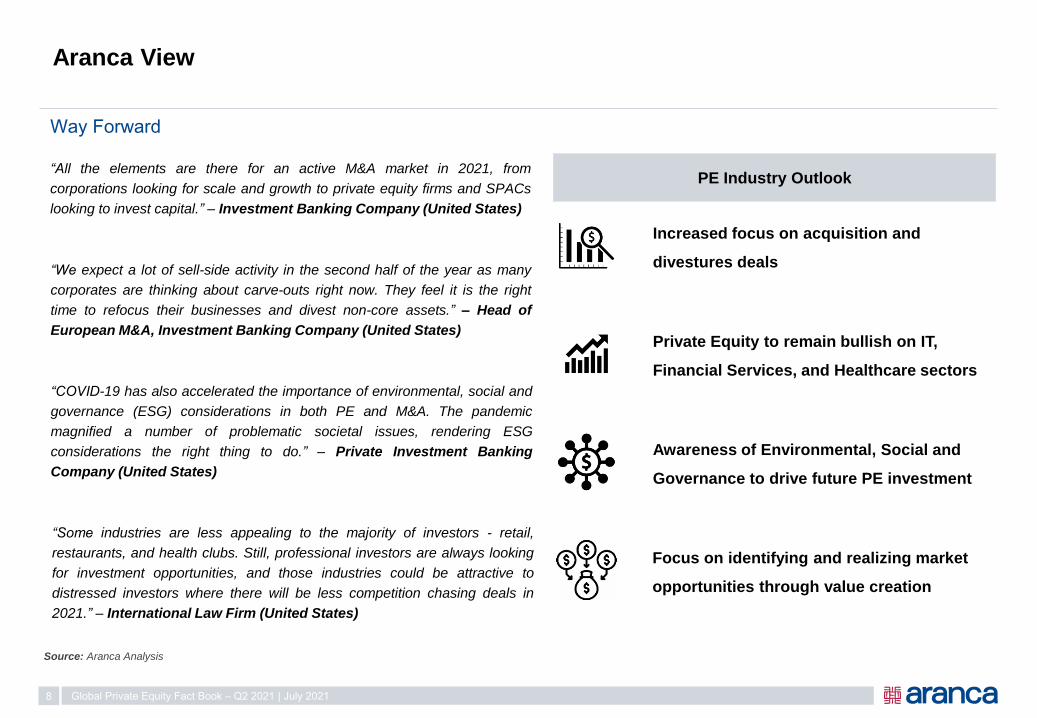
PE Industry Outlook
Source: Aranca Analysis
Aranca View
8 Global Private Equity Fact Book – Q2 2021 | July 2021
Way Forward
Increased focus on acquisition and
divestures deals
Private Equity to remain bullish on IT,
Financial Services, and Healthcare sectors
Awareness of Environmental, Social and
Governance to drive future PE investment
“All the elements are there for an active M&A market in 2021, from
corporations looking for scale and growth to private equity firms and SPACs
looking to invest capital.” – Investment Banking Company (United States)
“We expect a lot of sell-side activity in the second half of the year as many
corporates are thinking about carve-outs right now. They feel it is the right
time to refocus their businesses and divest non-core assets.” – Head of
European M&A, Investment Banking Company (United States)
“COVID-19 has also accelerated the importance of environmental, social and
governance (ESG) considerations in both PE and M&A. The pandemic
magnified a number of problematic societal issues, rendering ESG
considerations the right thing to do.” – Private Investment Banking
Company (United States)
Focus on identifying and realizing market
opportunities through value creation
“Some industries are less appealing to the majority of investors - retail,
restaurants, and health clubs. Still, professional investors are always looking
for investment opportunities, and those industries could be attractive to
distressed investors where there will be less competition chasing deals in
2021.” – International Law Firm (United States)

2
Business Research & Advisory
CXOs in Strategy, SBUs, Sales, Marketing, CI/MI, Innovation
Valuation & Financial Advisory
CFOs in Startups, PE/VC Firms, Corporate M&A Teams, Mid-market
Companies
Investment Research & Analytics
Brokerage, Hedge Funds, IRPs, I-Banks, AMCs, Investor Relations
Technology | IP Research & Advisory
R&D, Tech Scouting, Open Innovation, IP Teams, Product Development
ABOUT ARANCA
2500+Global clients
120+ Sectors and sub-sectors
researched by our analysts
80+ Countries where we have
delivered projects
500+Strong team of professionals
across multi-disciplinary domains
9 Global Private Equity Fact Book – Q2 2021 | July 2021
www.aranca.com
From startups to the Fortune 500, private equity and global financial firms, Aranca is the
trusted research and advisory partner for over 2500 companies.
Decide Fearlessly
This material is an exclusive property of Aranca. No part of this presentation may be
used, shared, modified, and/or disseminated without permission.
All rights reserved.
For additional details, please contact:
Email : [email protected]