Embed Size (px)
DESCRIPTION
Global projections of ground-level ozone in 2050. David Stevenson Guang Zeng, Oliver Wild, Twan van Noije, Mike Sanderson, Veronica Montenaro. Royal Society Workshop 23 May 2007. Bullet points for report. Future global surface O 3 strongly influenced by: - PowerPoint PPT Presentation
Citation preview
Global projections of ground-level ozone in 2050
David StevensonGuang Zeng, Oliver Wild,
Twan van Noije, Mike Sanderson, Veronica Montenaro
Royal Society Workshop 23 May 2007

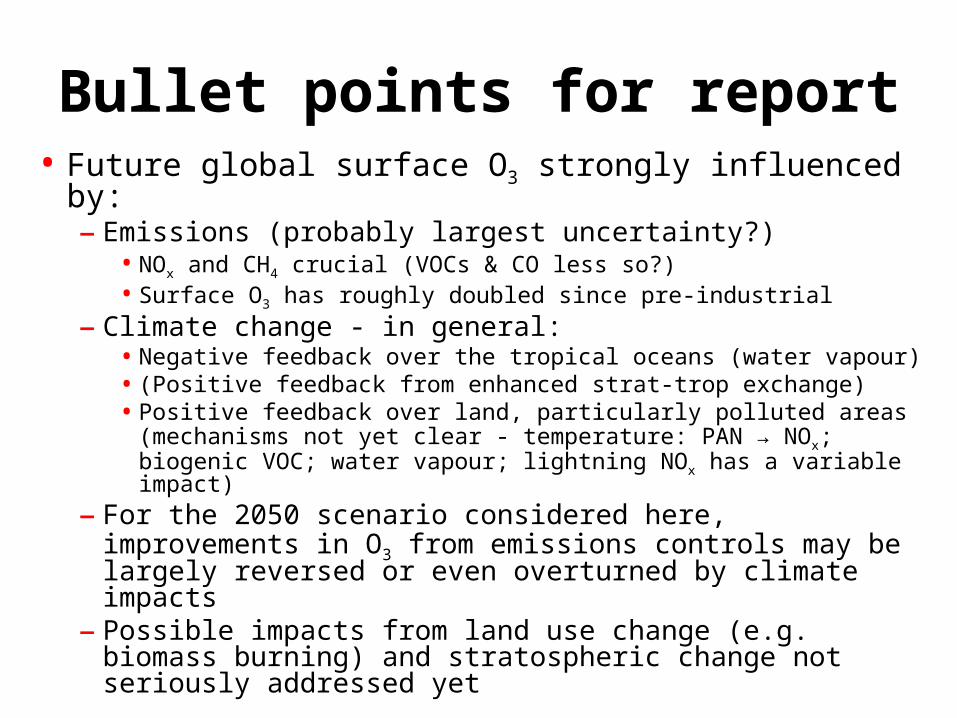
Bullet points for report• Future global surface O3 strongly influenced by:
– Emissions (probably largest uncertainty?)• NOx and CH4 crucial (VOCs & CO less so?)• Surface O3 has roughly doubled since pre-industrial
– Climate change - in general:• Negative feedback over the tropical oceans (water vapour)• (Positive feedback from enhanced strat-trop exchange)• Positive feedback over land, particularly polluted areas
(mechanisms not yet clear - temperature: PAN → NOx; biogenic VOC; water vapour; lightning NOx has a variable impact)
– For the 2050 scenario considered here, improvements in O3 from emissions controls may be largely reversed or even overturned by climate impacts
– Possible impacts from land use change (e.g. biomass burning) and stratospheric change not seriously addressed yet
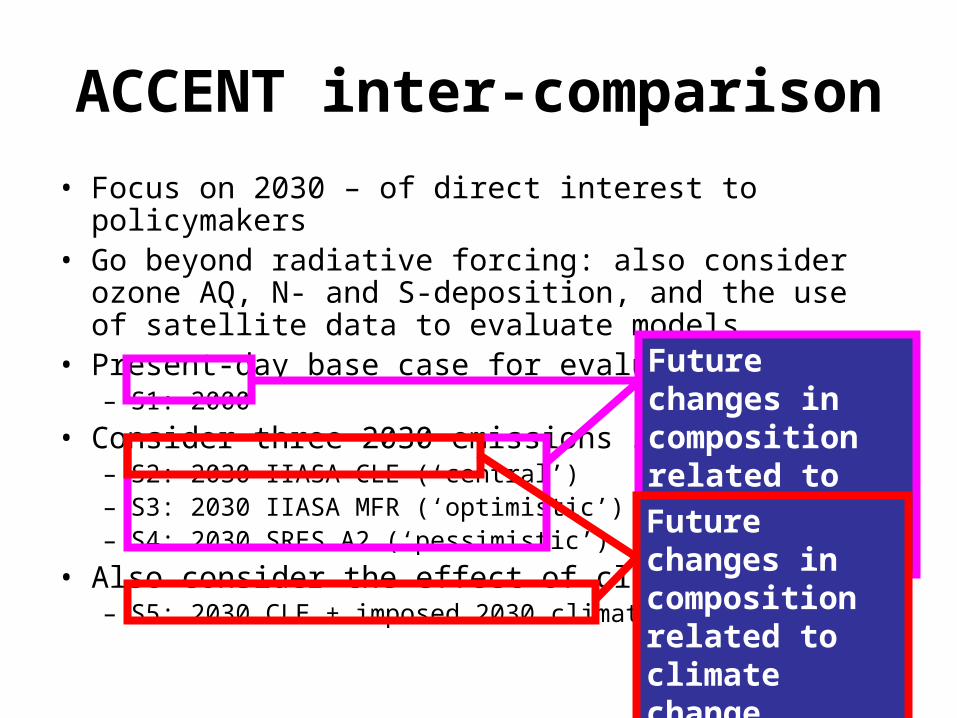
ACCENT inter-comparison
• Focus on 2030 – of direct interest to policymakers• Go beyond radiative forcing: also consider ozone AQ, N-
and S-deposition, and the use of satellite data to evaluate models
• Present-day base case for evaluation:– S1: 2000
• Consider three 2030 emissions scenarios:– S2: 2030 IIASA CLE (‘central’)– S3: 2030 IIASA MFR (‘optimistic’)– S4: 2030 SRES A2 (‘pessimistic’)
• Also consider the effect of climate change:– S5: 2030 CLE + imposed 2030 climate
Future changes in composition related to emissions1 year runsFuture changes in composition related to climate change5-10 year runs
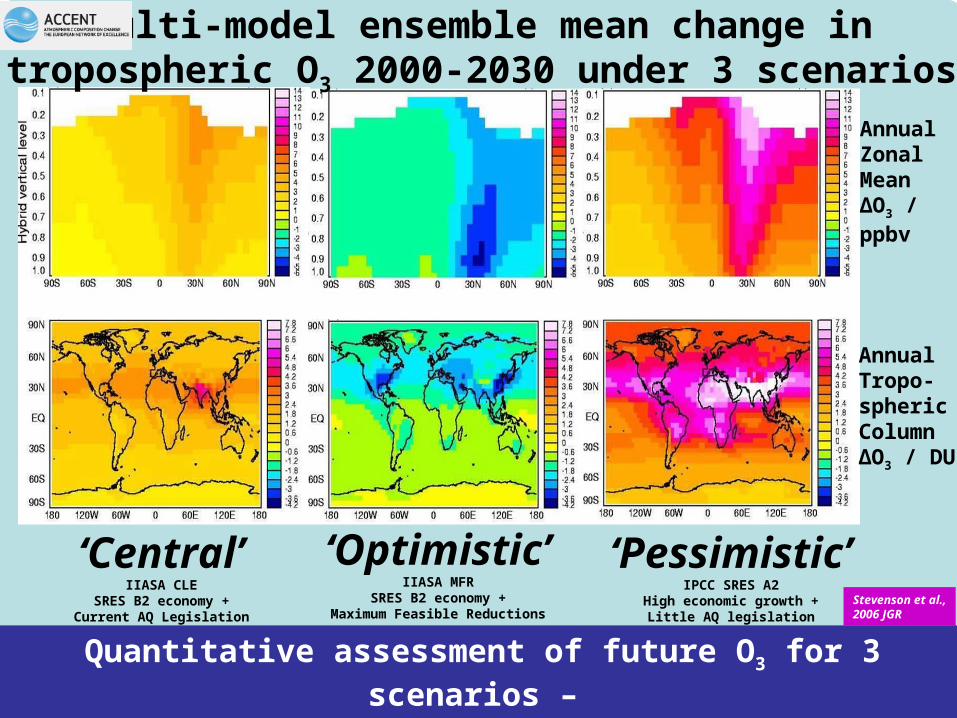
Annual Zonal MeanΔO3 / ppbv
Annual Tropo-spheric ColumnΔO3 / DU
‘Central’IIASA CLE
SRES B2 economy +Current AQ Legislation
‘Optimistic’IIASA MFR
SRES B2 economy +Maximum Feasible Reductions
‘Pessimistic’IPCC SRES A2
High economic growth +Little AQ legislation
Multi-model ensemble mean change intropospheric O3 2000-2030 under 3 scenarios
Quantitative assessment of future O3 for 3 scenarios – allows economic and environmental costing of policy options
Stevenson et al.,2006 JGR
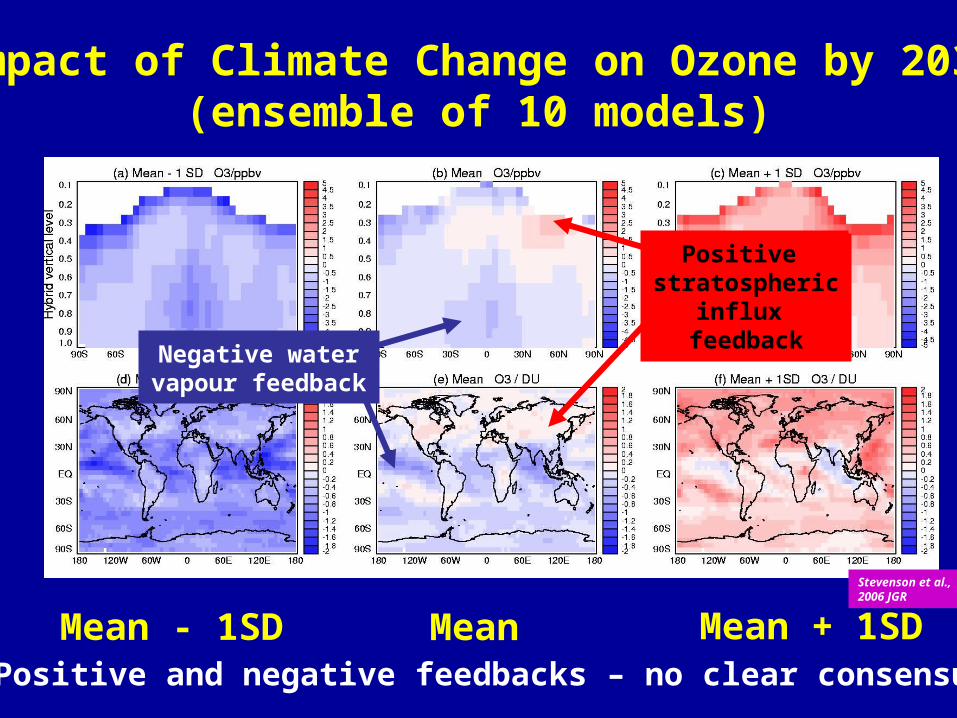
Impact of Climate Change on Ozone by 2030(ensemble of 10 models)
MeanMean - 1SD Mean + 1SD
Negative watervapour feedback
Positive stratospheric
influx feedback
Positive and negative feedbacks – no clear consensus
Stevenson et al.,2006 JGR
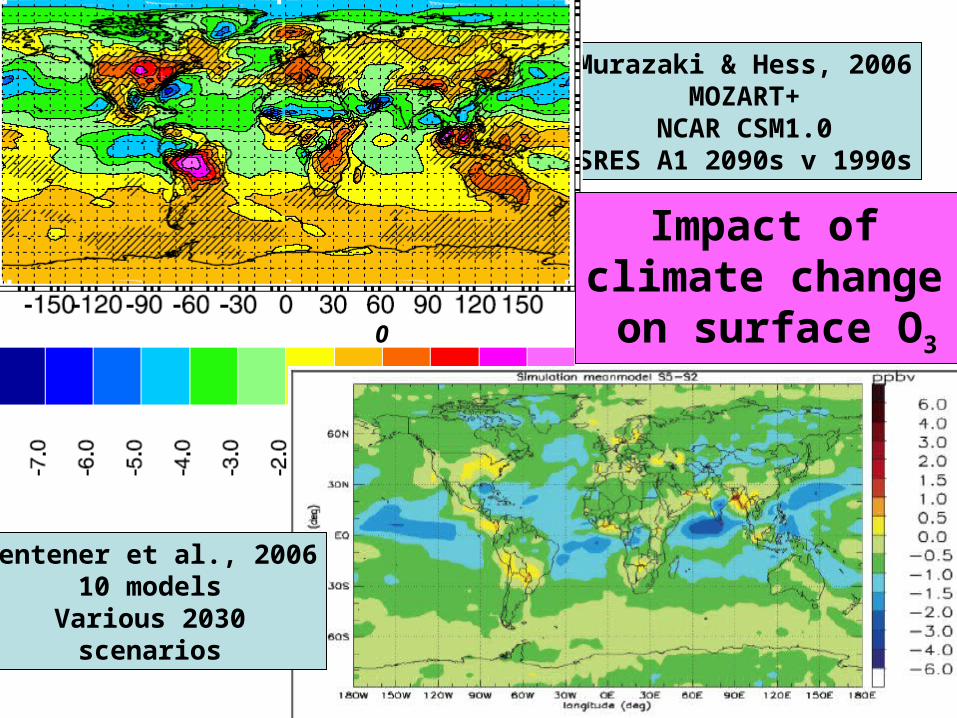
Murazaki & Hess, 2006MOZART+
NCAR CSM1.0SRES A1 2090s v 1990s
0
Dentener et al., 200610 models
Various 2030scenarios
Impact of climate change on surface O3
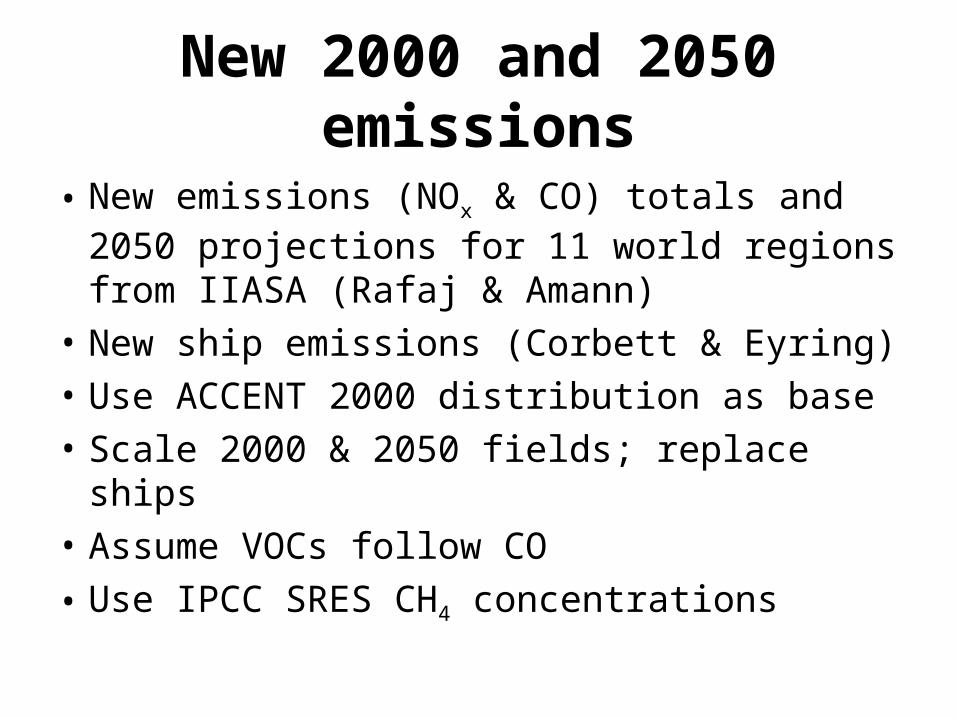
New 2000 and 2050 emissions
• New emissions (NOx & CO) totals and 2050 projections for 11 world regions from IIASA (Rafaj & Amann)
• New ship emissions (Corbett & Eyring)
• Use ACCENT 2000 distribution as base
• Scale 2000 & 2050 fields; replace ships
• Assume VOCs follow CO
• Use IPCC SRES CH4 concentrations
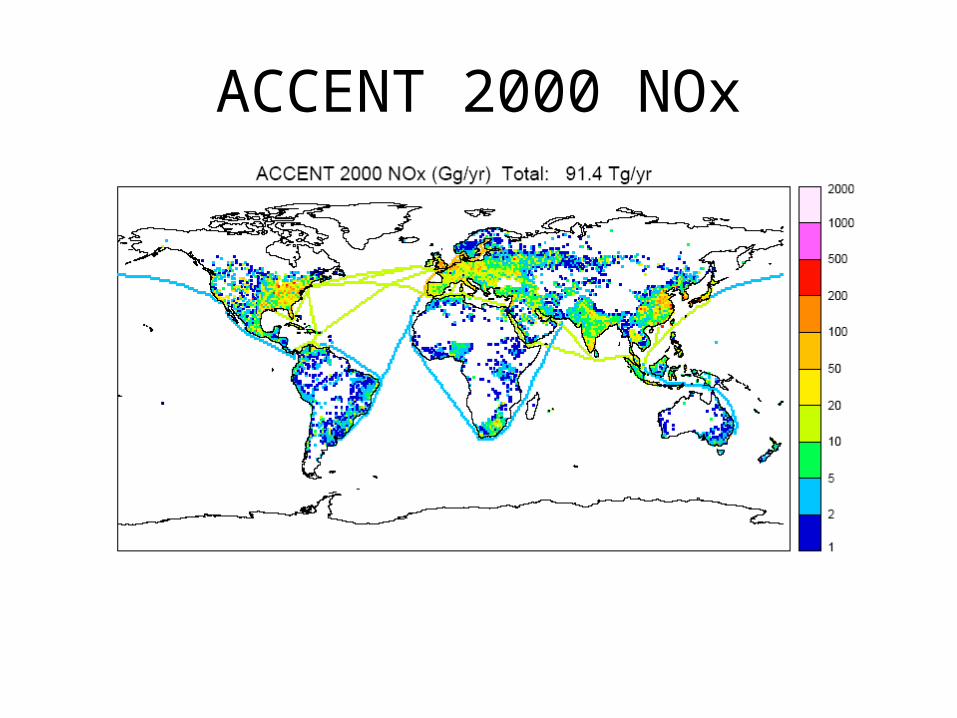
ACCENT 2000 NOx
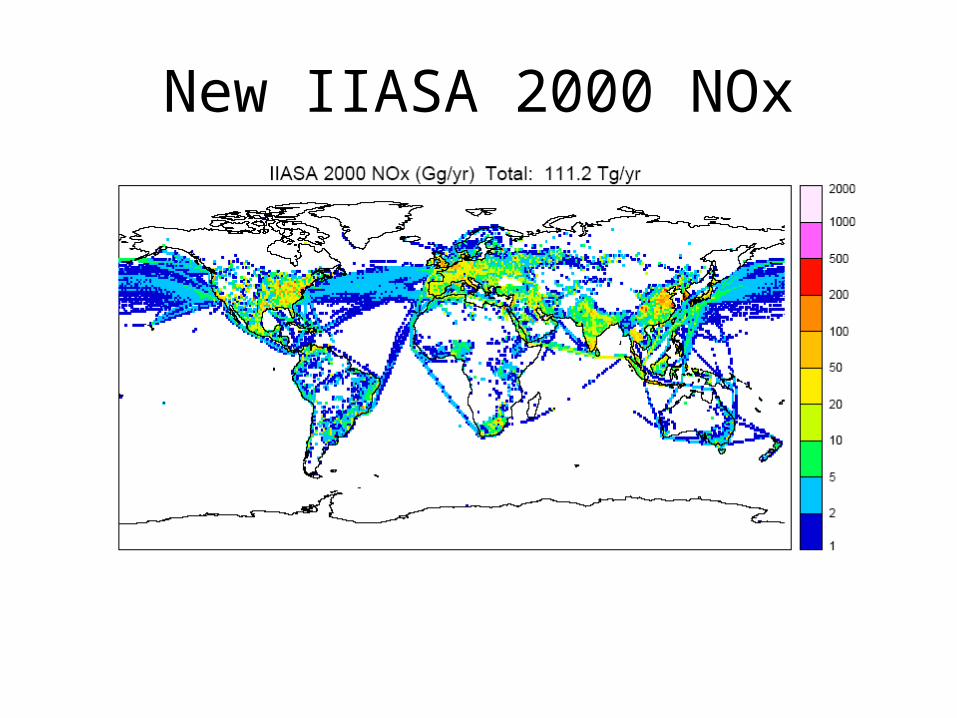
New IIASA 2000 NOx
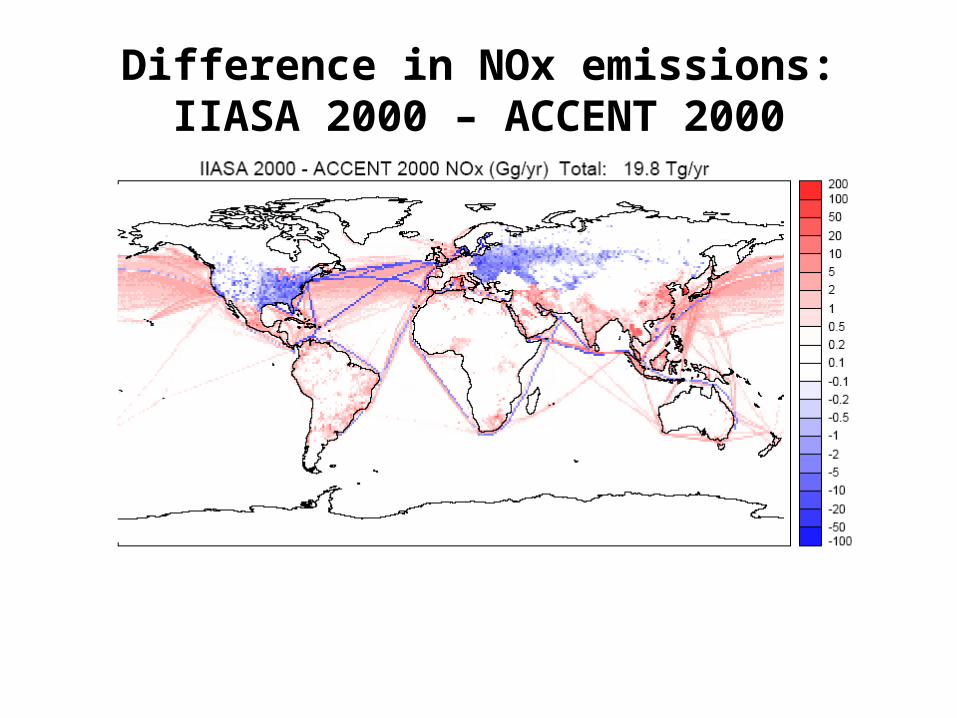
Difference in NOx emissions:IIASA 2000 – ACCENT 2000
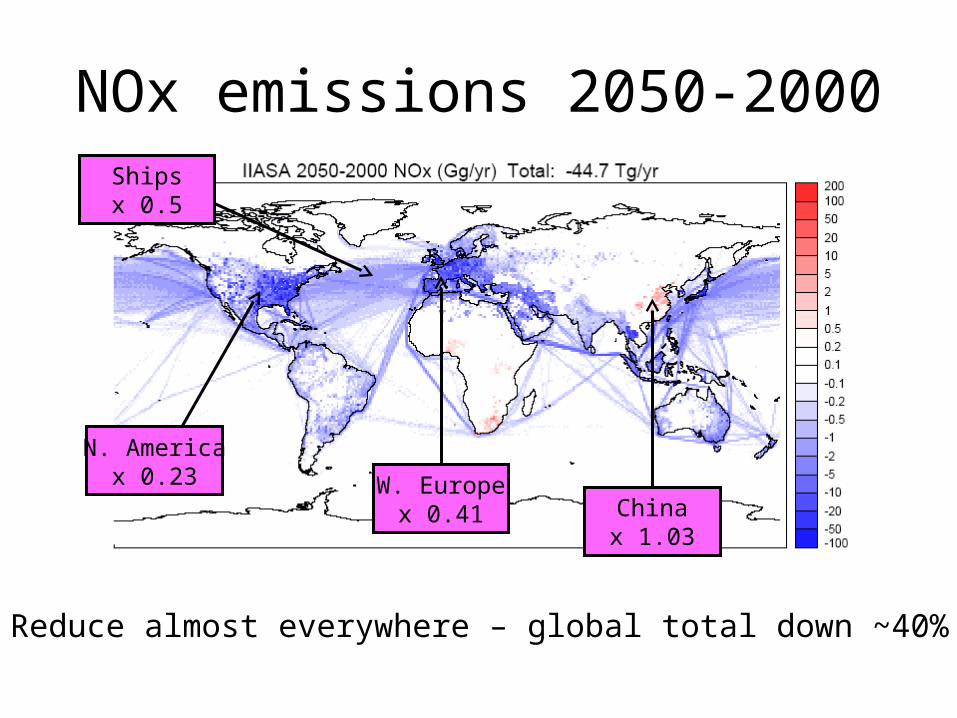
NOx emissions 2050-2000
Reduce almost everywhere – global total down ~40%
N. Americax 0.23 W. Europe
x 0.41 Chinax 1.03
Shipsx 0.5
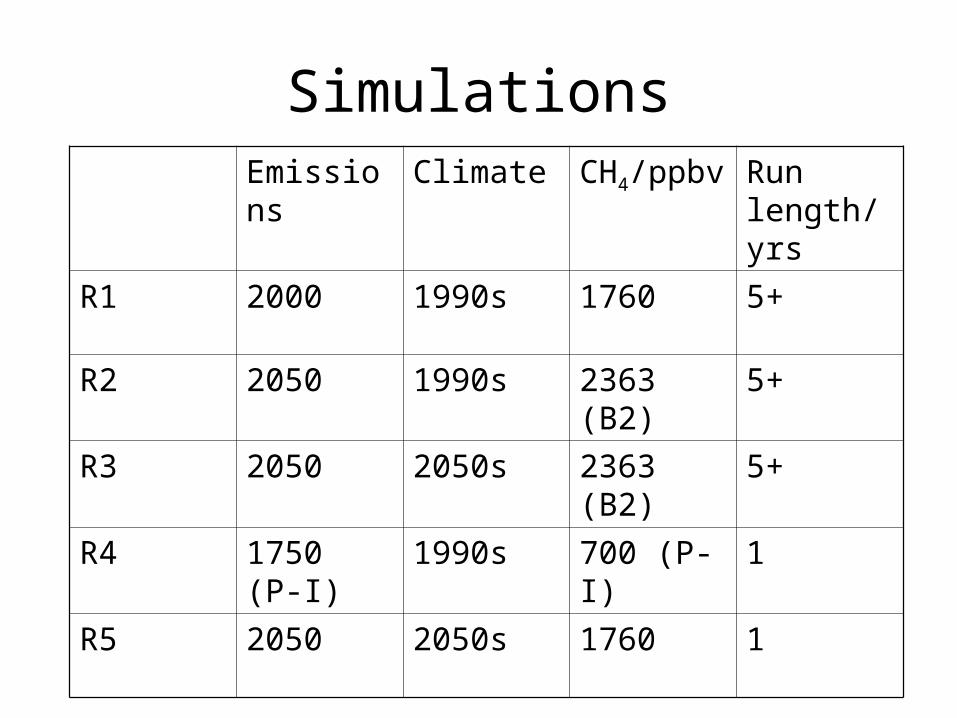
SimulationsEmissions Climate CH4/ppbv Run
length/yrs
R1 2000 1990s 1760 5+
R2 2050 1990s 2363 (B2) 5+
R3 2050 2050s 2363 (B2) 5+
R4 1750 (P-I) 1990s 700 (P-I) 1
R5 2050 2050s 1760 1
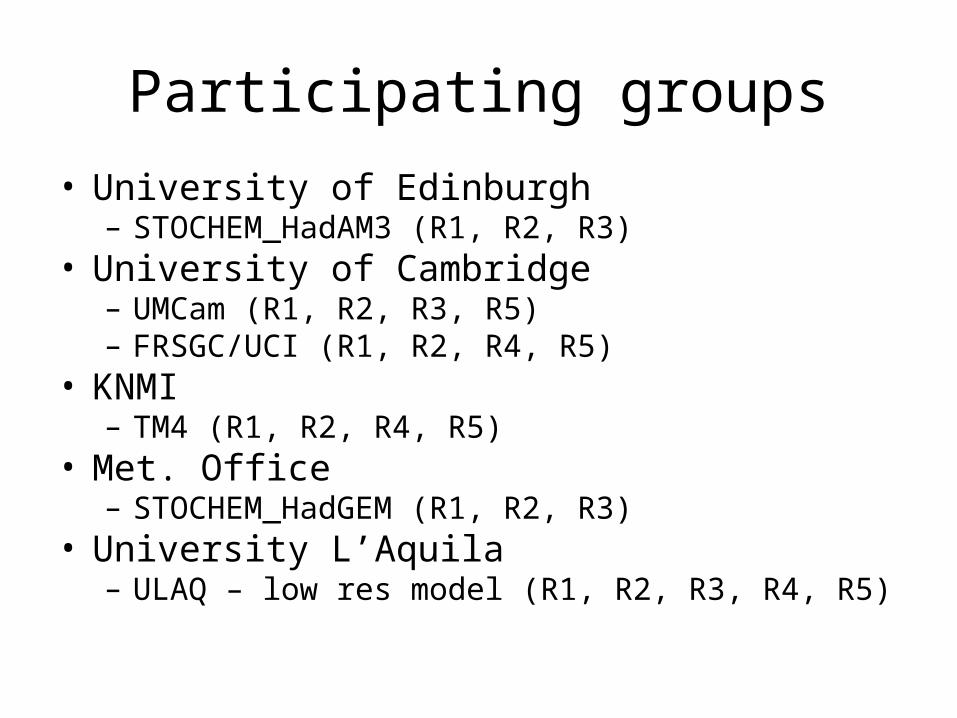
Participating groups
• University of Edinburgh– STOCHEM_HadAM3 (R1, R2, R3)
• University of Cambridge– UMCam (R1, R2, R3, R5)– FRSGC/UCI (R1, R2, R4, R5)
• KNMI– TM4 (R1, R2, R4, R5)
• Met. Office– STOCHEM_HadGEM (R1, R2, R3)
• University L’Aquila– ULAQ – low res model (R1, R2, R3, R4, R5)
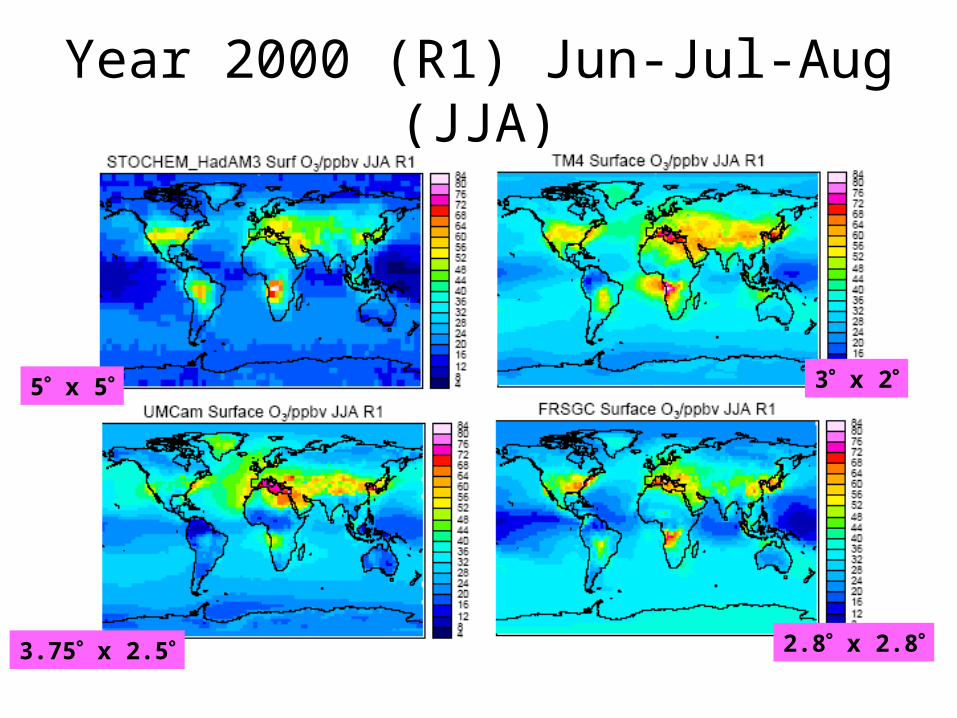
Year 2000 (R1) Jun-Jul-Aug (JJA)
3 x 2
3.75 x 2.5
5 x 5
2.8 x 2.8
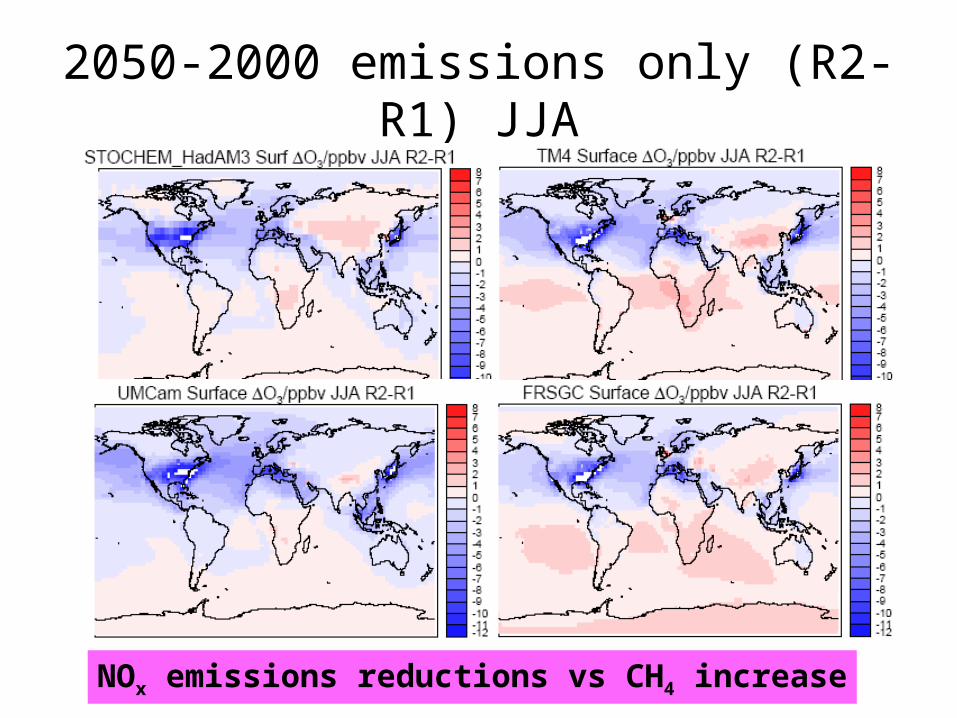
2050-2000 emissions only (R2-R1) JJA
NOx emissions reductions vs CH4 increase
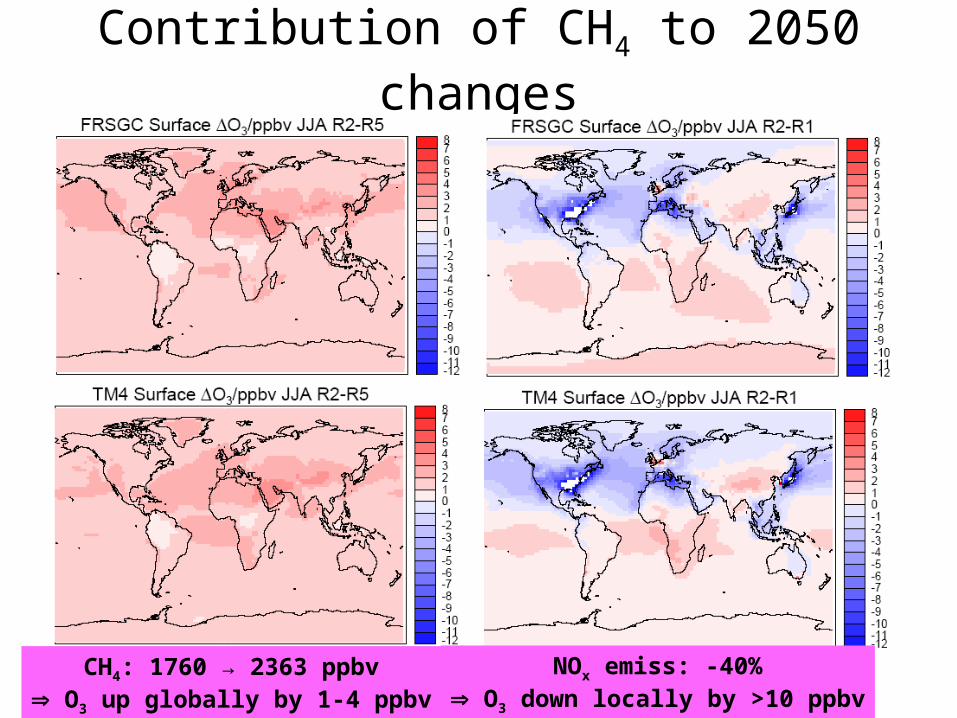
Contribution of CH4 to 2050 changes
CH4: 1760 → 2363 ppbv O3 up globally by 1-4 ppbv
NOx emiss: -40% O3 down locally by >10 ppbv
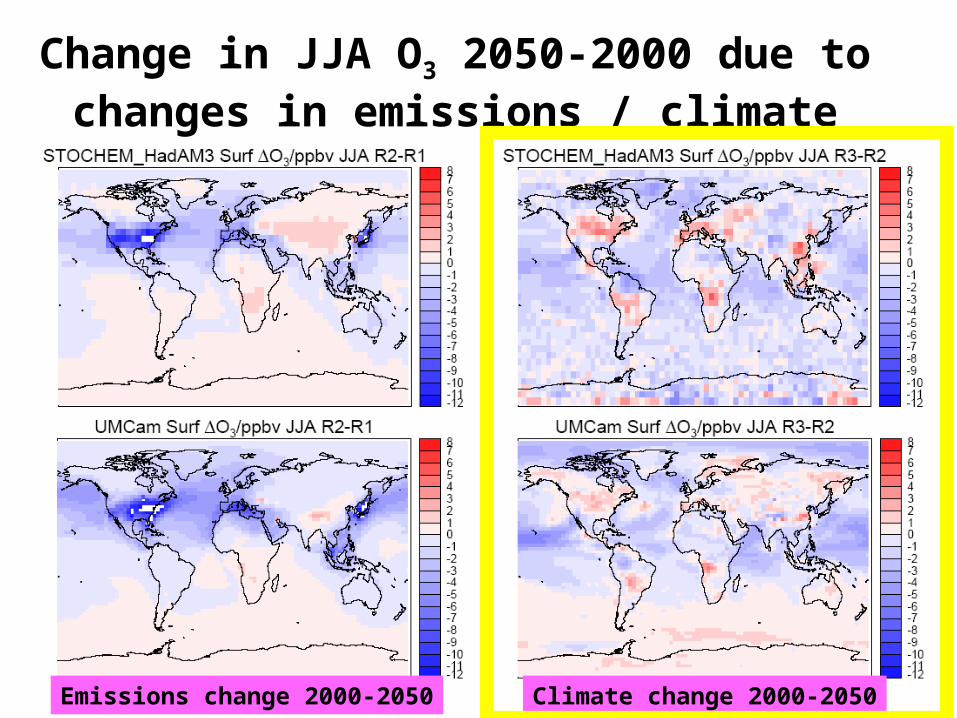
Change in JJA O3 2050-2000 due to changes in emissions / climate
Emissions change 2000-2050 Climate change 2000-2050
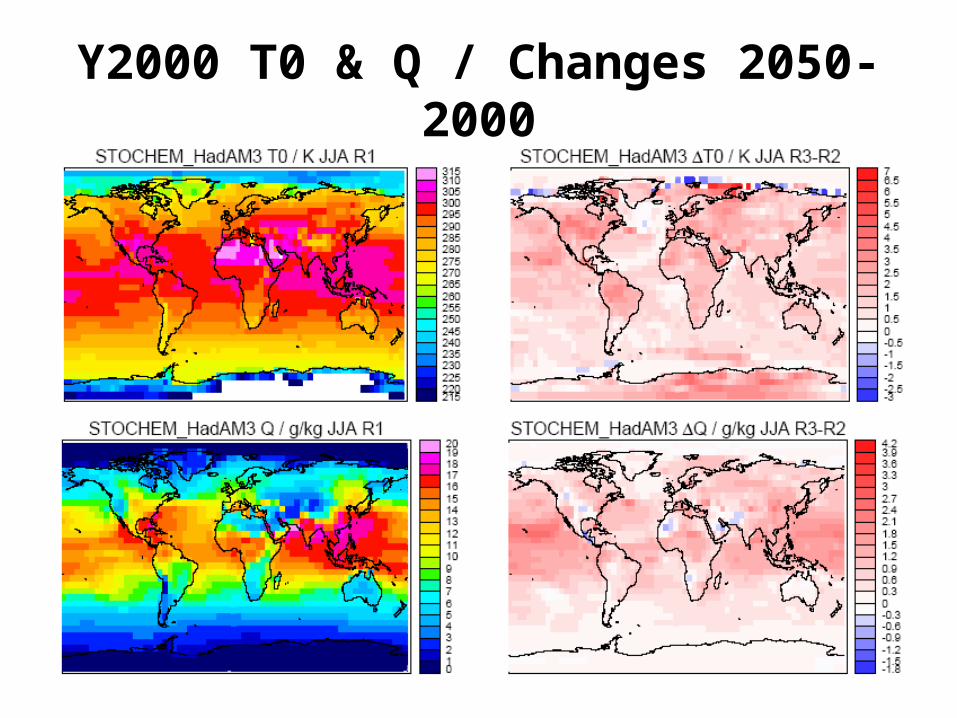
Y2000 T0 & Q / Changes 2050-2000
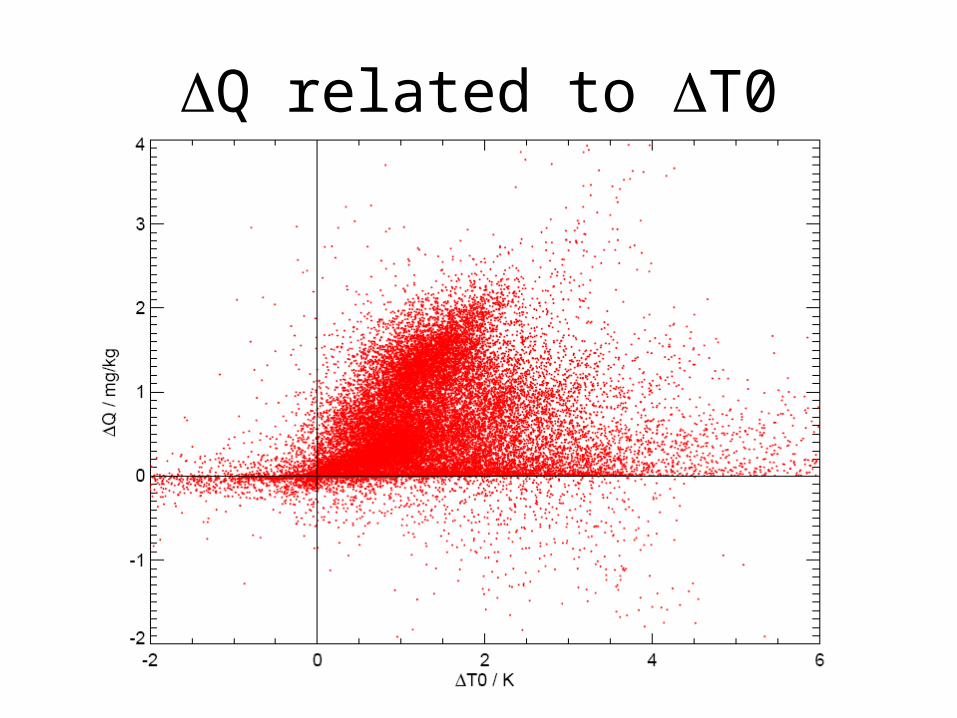
Q related to T0
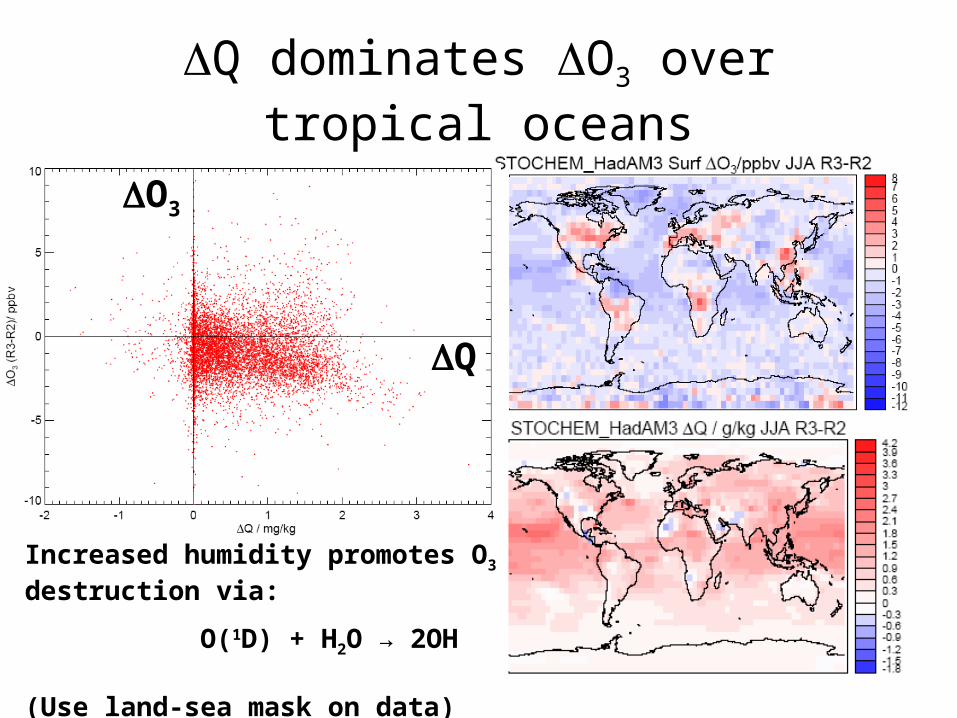
Q dominates O3 over tropical oceans
Q
O3
Increased humidity promotes O3
destruction via:
O(1D) + H2O → 2OH
(Use land-sea mask on data)
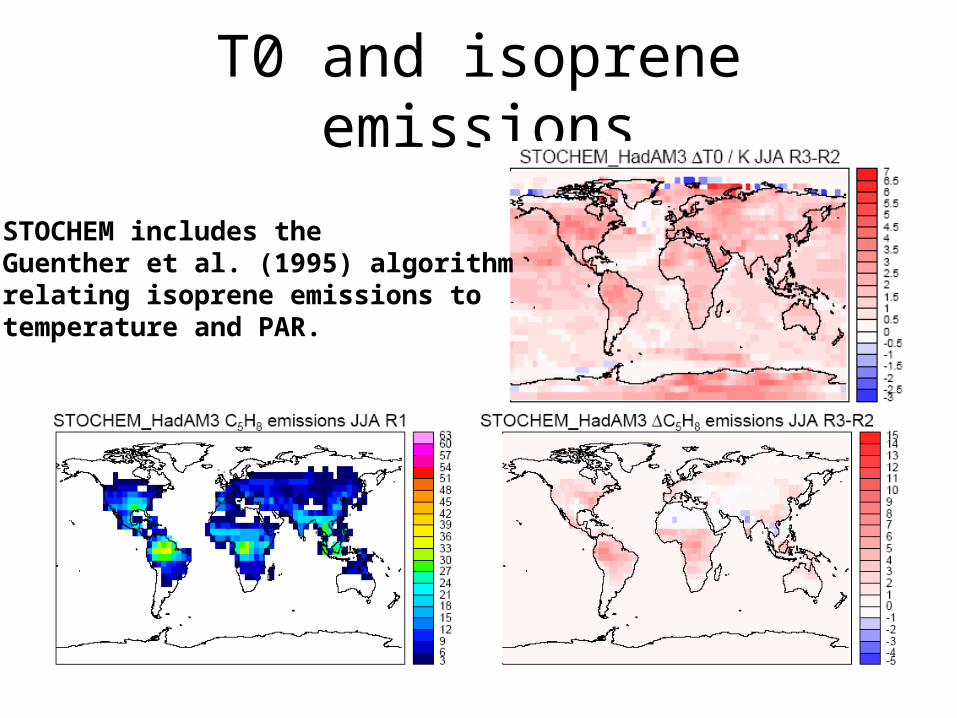
T0 and isoprene emissions
STOCHEM includes the Guenther et al. (1995) algorithmrelating isoprene emissions to temperature and PAR.
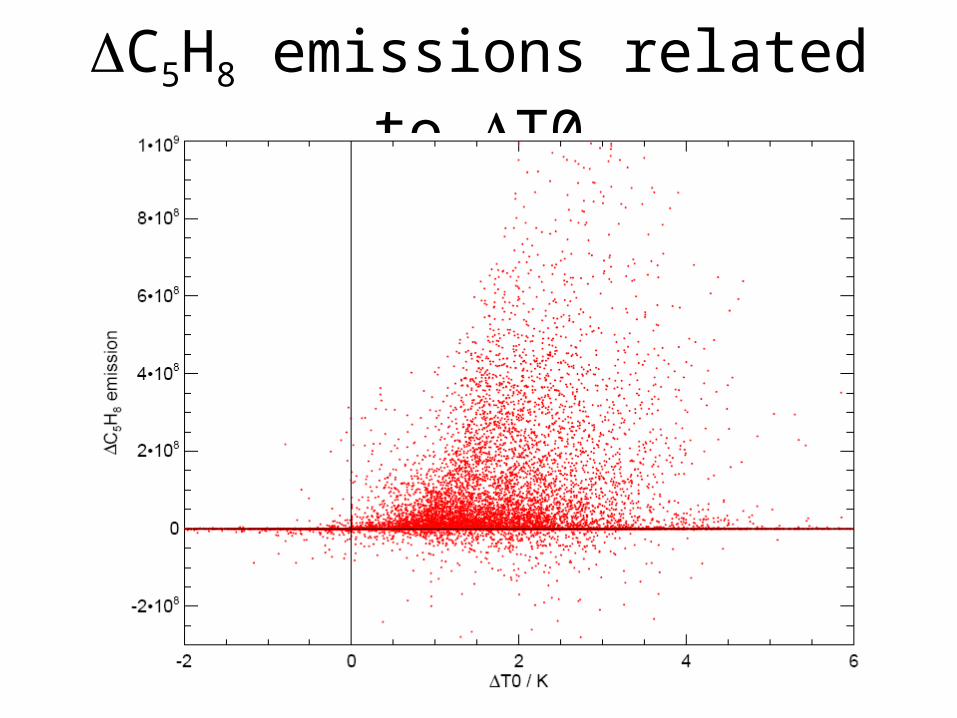
C5H8 emissions related to T0
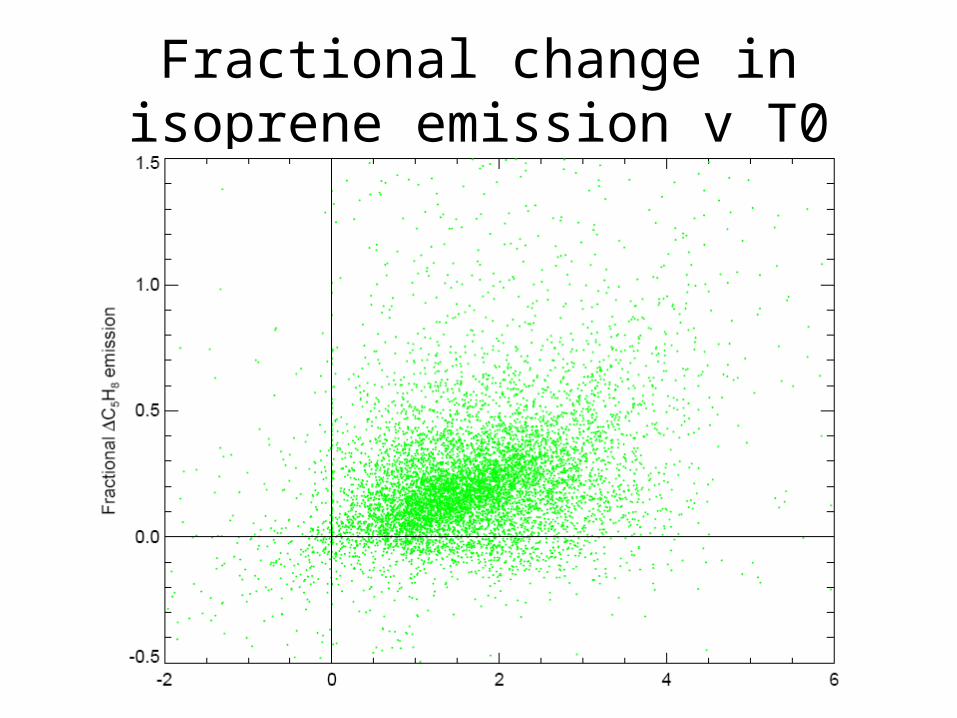
Fractional change in isoprene emission v T0
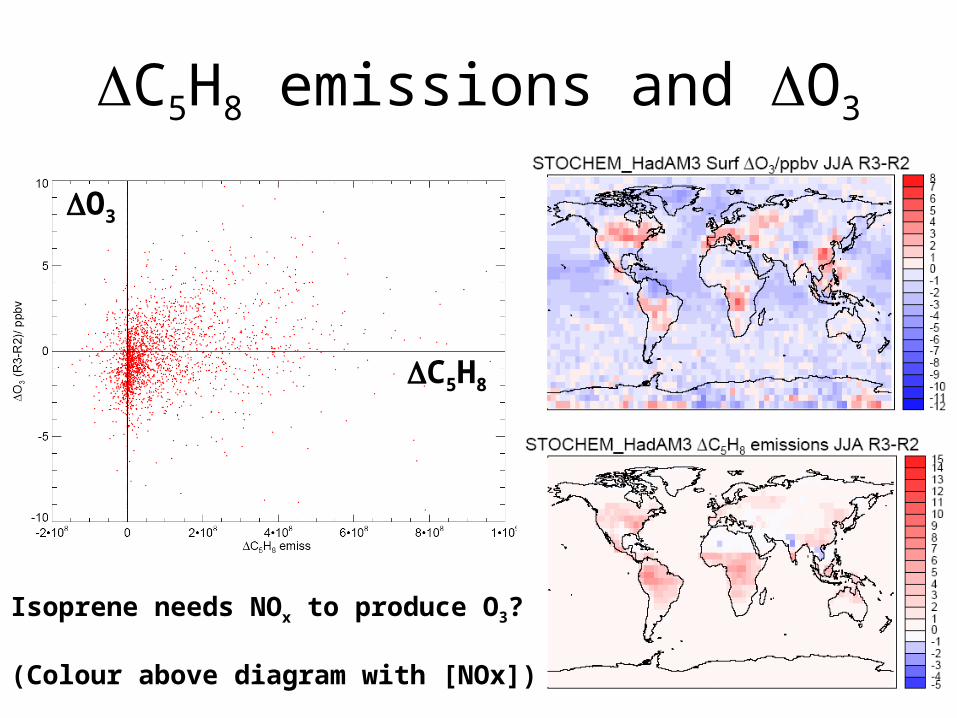
C5H8 emissions and O3
C5H8
O3
Isoprene needs NOx to produce O3?
(Colour above diagram with [NOx])
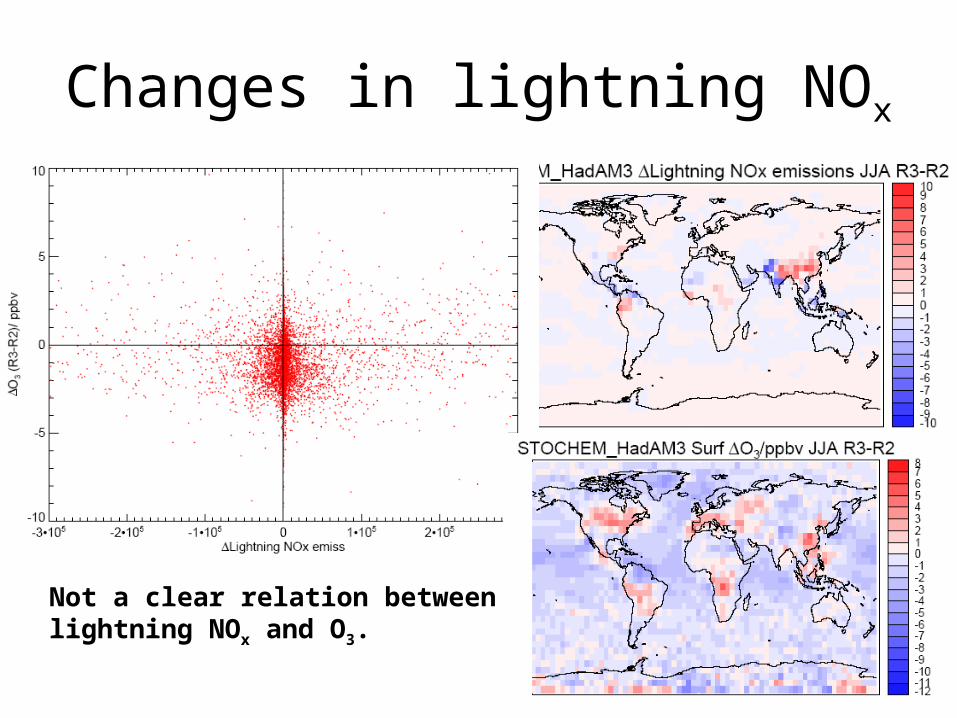
Changes in lightning NOx
Not a clear relation betweenlightning NOx and O3.
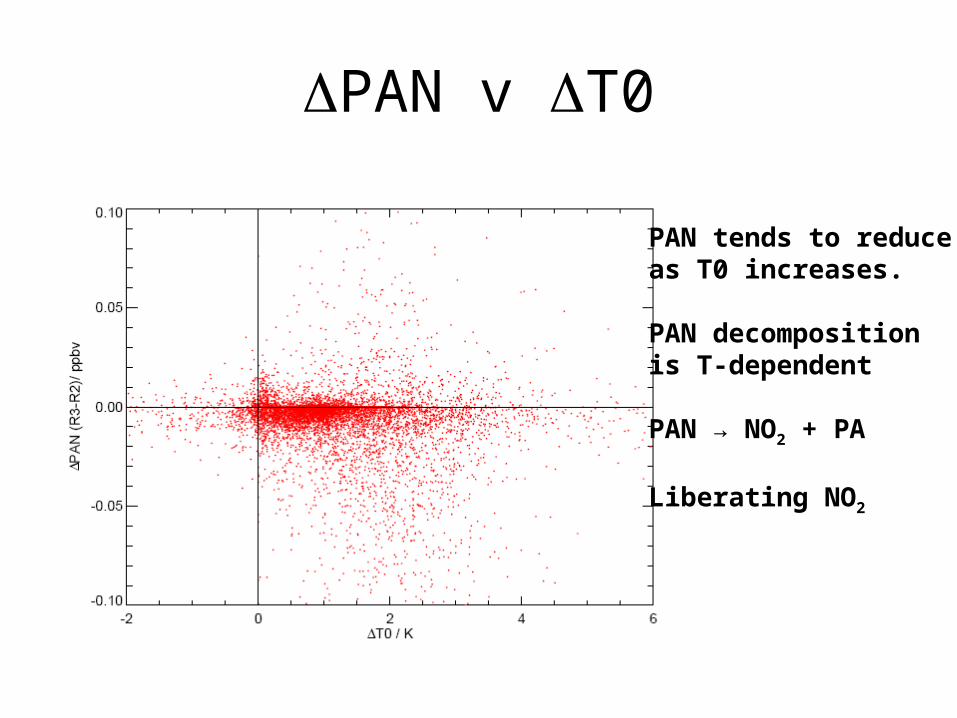
PAN v T0
PAN tends to reduceas T0 increases.
PAN decompositionis T-dependent
PAN → NO2 + PA
Liberating NO2
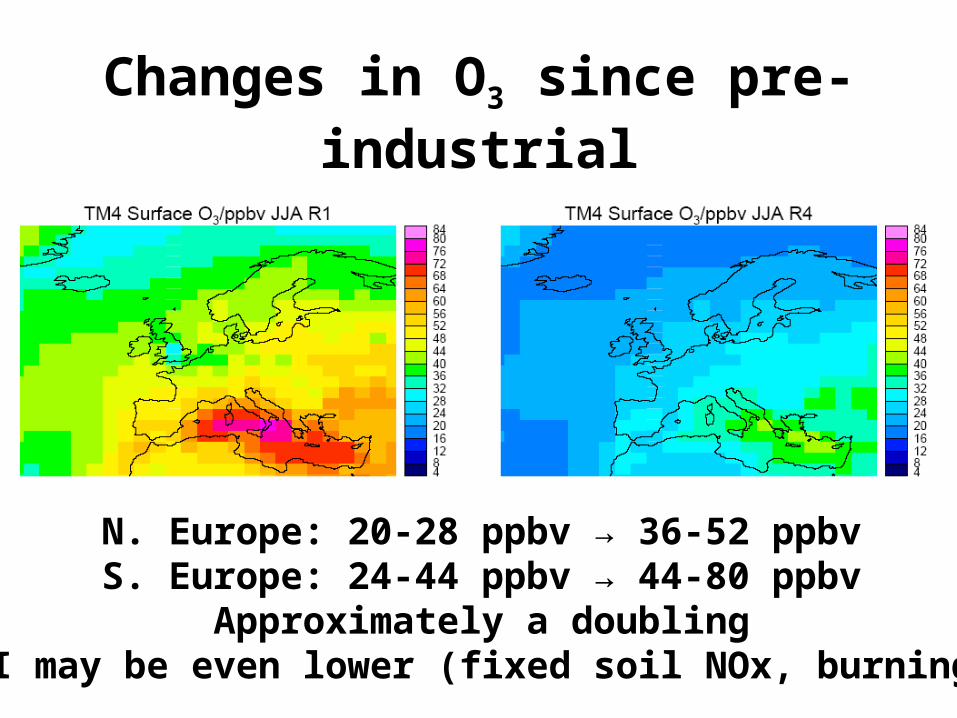
Changes in O3 since pre-industrial
N. Europe: 20-28 ppbv → 36-52 ppbvS. Europe: 24-44 ppbv → 44-80 ppbv
Approximately a doublingPI may be even lower (fixed soil NOx, burning)
Bullet points for report• Future global surface O3 strongly influenced by:
– Emissions (probably largest uncertainty?)• NOx and CH4 crucial (VOCs & CO less so?)• Surface O3 has roughly doubled since pre-industrial
– Climate change - in general:• Negative feedback over the tropical oceans (water vapour)• (Positive feedback from enhanced strat-trop exchange)• Positive feedback over land, particularly polluted areas
(mechanisms not yet clear - temperature: PAN → NOx; biogenic VOC; water vapour; lightning NOx has a variable impact)
– For the 2050 scenario considered here, improvements in O3 from emissions controls may be largely reversed or even overturned by climate impacts
– Possible impacts from land use change (e.g. biomass burning) and stratospheric change not seriously addressed yet

Change in JJA O3 2050-2000 due to changes in emissions / climate
Emissions change 2000-2050 Climate change 2000-2050