Embed Size (px)
Citation preview
© 2014 IHS, Inc. No portion of this presentation may be reproduced,
reused, or otherwise distributed in any form without prior written consent.
Global Propylene Market
Motivated to Change
Chuck Carr, IHS Senior Director - Propylene
September, 2014
IHS Asia Chemical Conference
Singapore
© 2014 IHS, Inc. No portion of this presentation may be reproduced,
reused, or otherwise distributed in any form without prior written consent.
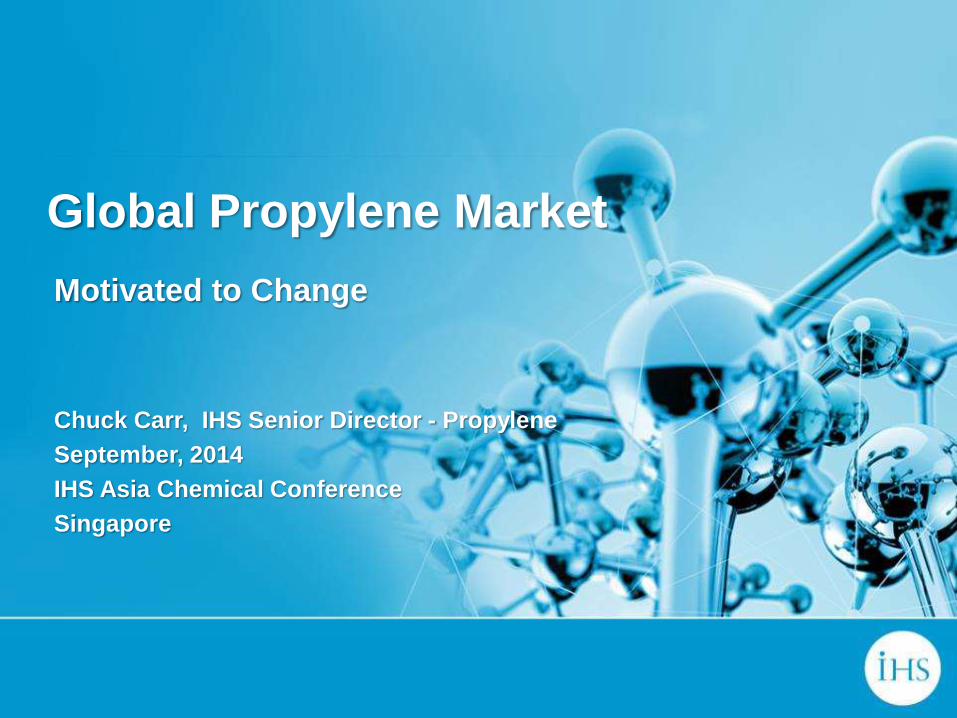
Global Propylene Market
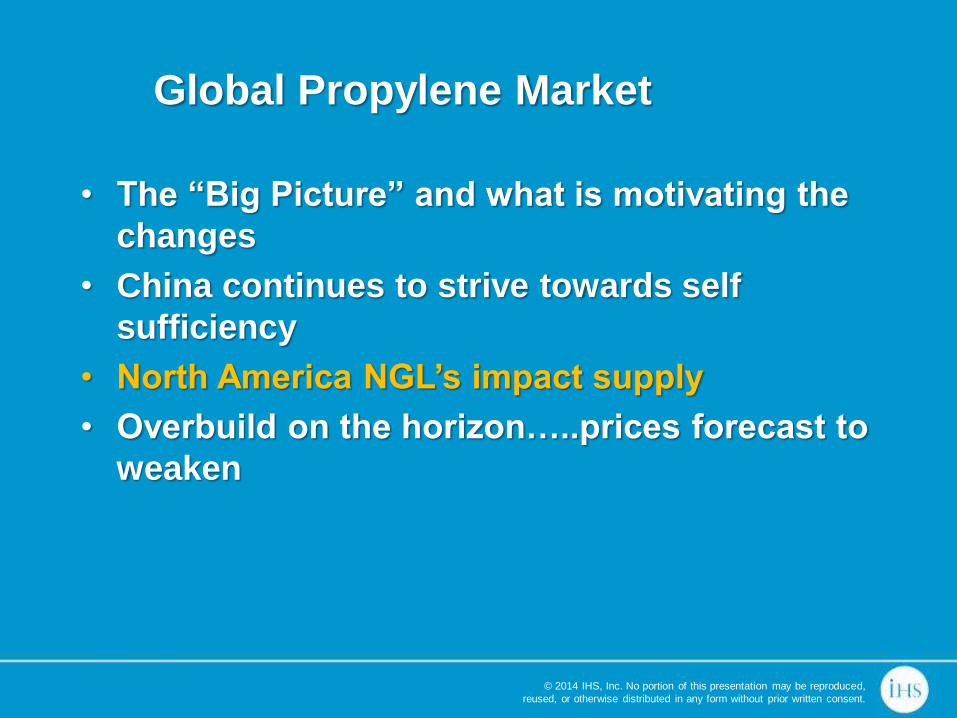
• The “Big Picture” and what is motivating the
changes
• China continues to strive towards self
sufficiency
• North America NGL’s impact supply
• Overbuild on the horizon…..prices forecast to
weaken
© 2014 IHS, Inc. No portion of this presentation may be reproduced,
reused, or otherwise distributed in any form without prior written consent.
Global Propylene Market
• The “Big Picture” and what is motivating the
changes
• China continues to strive towards self
sufficiency
• North America NGL’s impact supply
• Overbuild on the horizon…..prices forecast to
weaken
© 2014 IHS, Inc. No portion of this presentation may be reproduced,
reused, or otherwise distributed in any form without prior written consent.
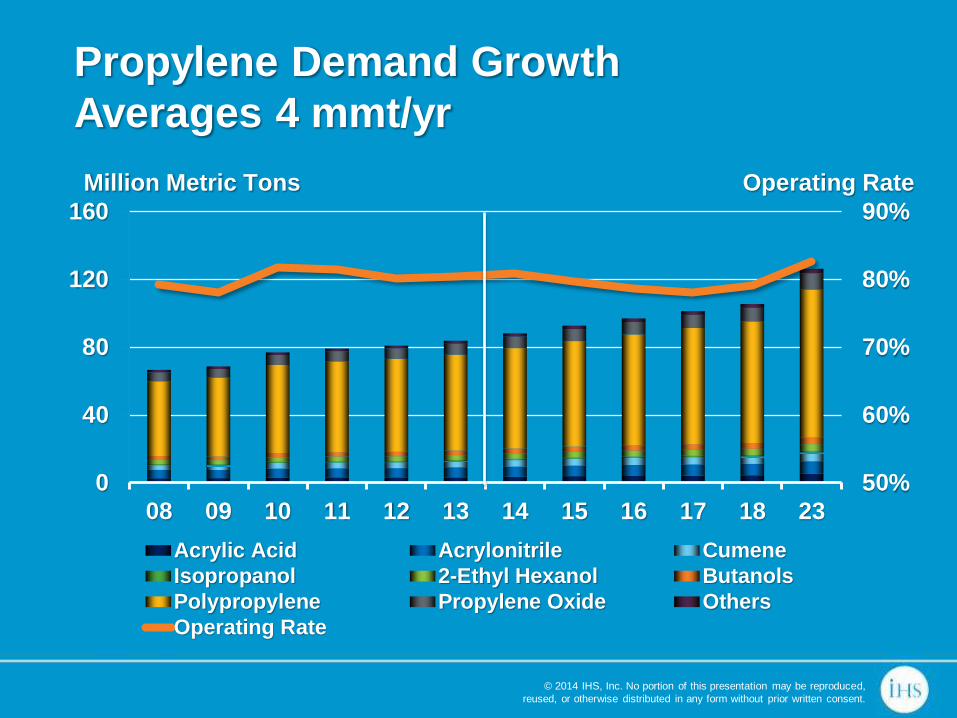
Propylene Demand Growth
Averages 4 mmt/yr
50%
60%
70%
80%
90%
0
40
80
120
160
08 09 10 11 12 13 14 15 16 17 18 23
Acrylic Acid Acrylonitrile Cumene
Isopropanol 2-Ethyl Hexanol Butanols
Polypropylene Propylene Oxide Others
Operating Rate
Operating Rate Million Metric Tons
© 2014 IHS, Inc. No portion of this presentation may be reproduced,
reused, or otherwise distributed in any form without prior written consent.
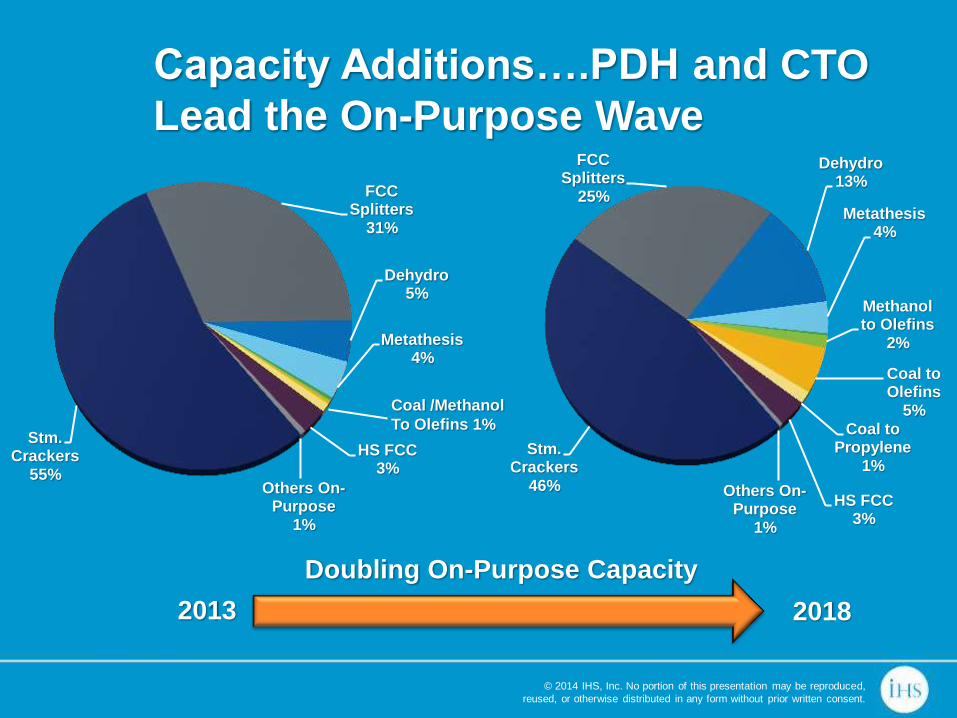
Stm. Crackers
55%
FCC Splitters
31%
Dehydro 5%
Metathesis 4%
HS FCC 3%
Others On-Purpose
1%
Coal /Methanol
To Olefins 1%
Stm. Crackers
46%
FCC Splitters
25%
Dehydro 13%
Metathesis 4%
Methanol to Olefins
2%
Coal to Olefins
5% Coal to
Propylene 1%
HS FCC 3%
Others On-Purpose
1%
Capacity Additions….PDH and CTO
Lead the On-Purpose Wave
2013 2018
Doubling On-Purpose Capacity
© 2014 IHS, Inc. No portion of this presentation may be reproduced,
reused, or otherwise distributed in any form without prior written consent.
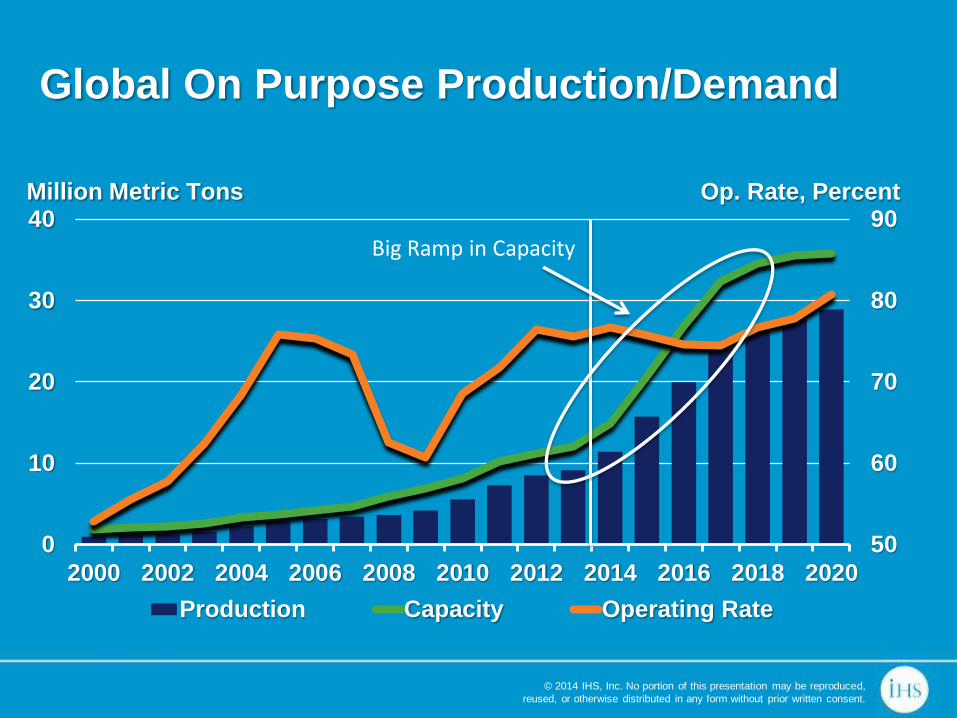
50
60
70
80
90
0
10
20
30
40
2000 2002 2004 2006 2008 2010 2012 2014 2016 2018 2020
Production Capacity Operating Rate
Million Metric Tons Op. Rate, Percent
Global On Purpose Production/Demand
Big Ramp in Capacity
© 2014 IHS, Inc. No portion of this presentation may be reproduced,
reused, or otherwise distributed in any form without prior written consent.
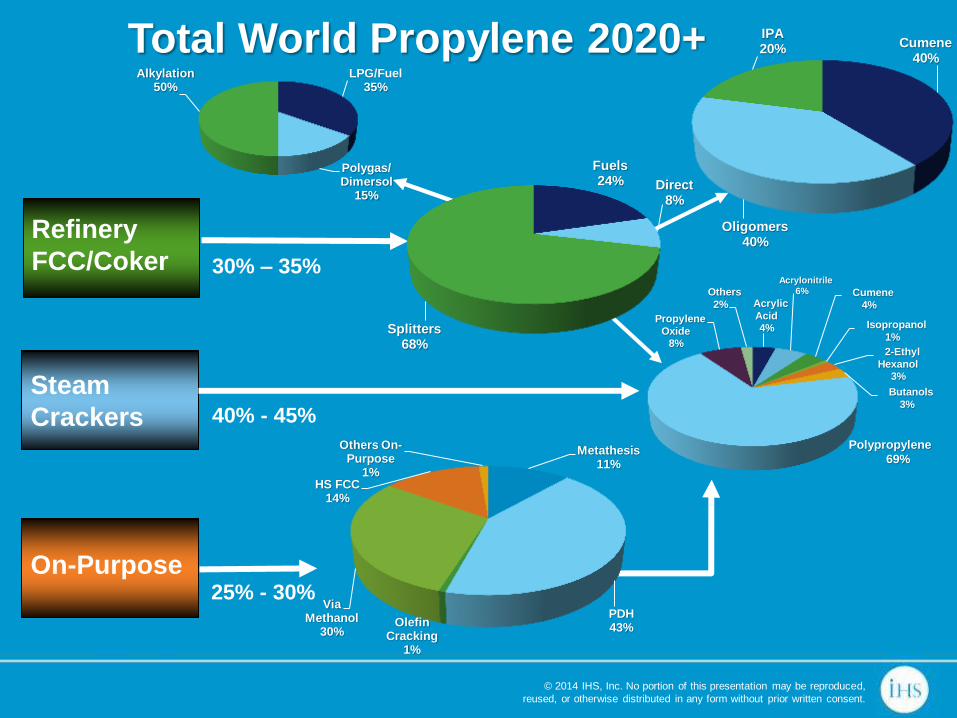
Cumene 40%
Oligomers 40%
IPA 20% Total World Propylene 2020+
Refinery
FCC/Coker
Steam
Crackers
On-Purpose
30% – 35%
40% - 45%
25% - 30%
LPG/Fuel 35%
Polygas/ Dimersol
15%
Alkylation 50%
Metathesis 11%
PDH 43% Olefin
Cracking 1%
Via Methanol
30%
HS FCC 14%
Others On-Purpose
1%
Fuels 24% Direct
8%
Splitters 68%
Acrylic
Acid 4%
Acrylonitrile 6% Cumene
4%
Isopropanol
1%
2-Ethyl
Hexanol 3%
Butanols
3%
Propylene
Oxide 8%
Others
2%
Polypropylene
69%
© 2014 IHS, Inc. No portion of this presentation may be reproduced,
reused, or otherwise distributed in any form without prior written consent.
Global Propylene Market
• The “Big Picture” and what is motivating the
changes
• China continues to strive towards self
sufficiency
• North America NGL’s impact supply
• Overbuild on the horizon…..prices forecast to
weaken
© 2014 IHS, Inc. No portion of this presentation may be reproduced,
reused, or otherwise distributed in any form without prior written consent.
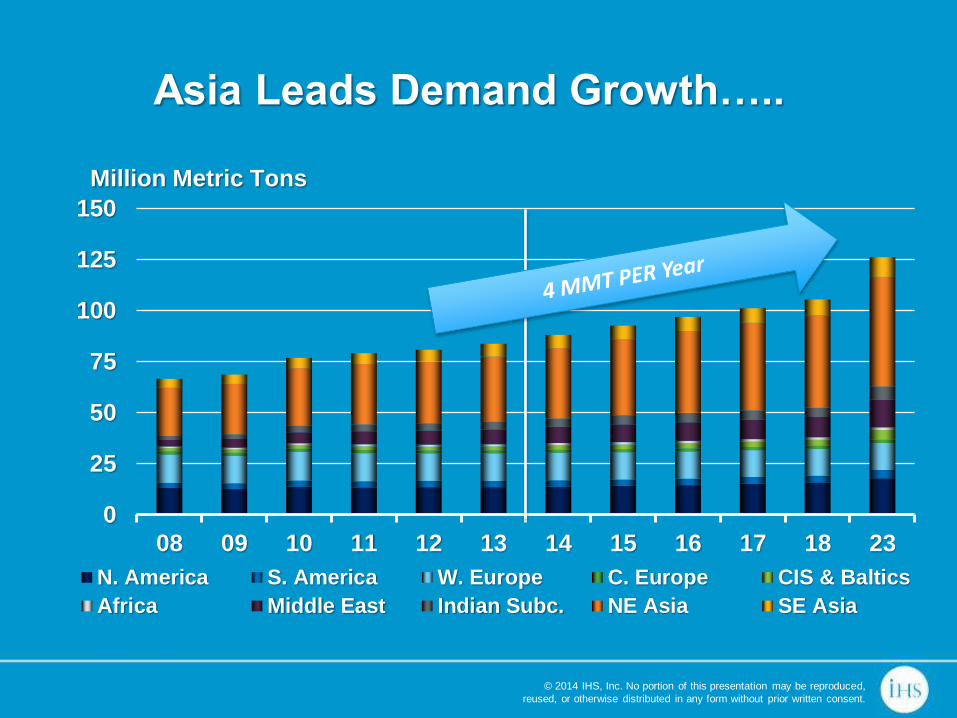
0
25
50
75
100
125
150
08 09 10 11 12 13 14 15 16 17 18 23
N. America S. America W. Europe C. Europe CIS & Baltics
Africa Middle East Indian Subc. NE Asia SE Asia
Million Metric Tons
Asia Leads Demand Growth…..
© 2014 IHS, Inc. No portion of this presentation may be reproduced,
reused, or otherwise distributed in any form without prior written consent.
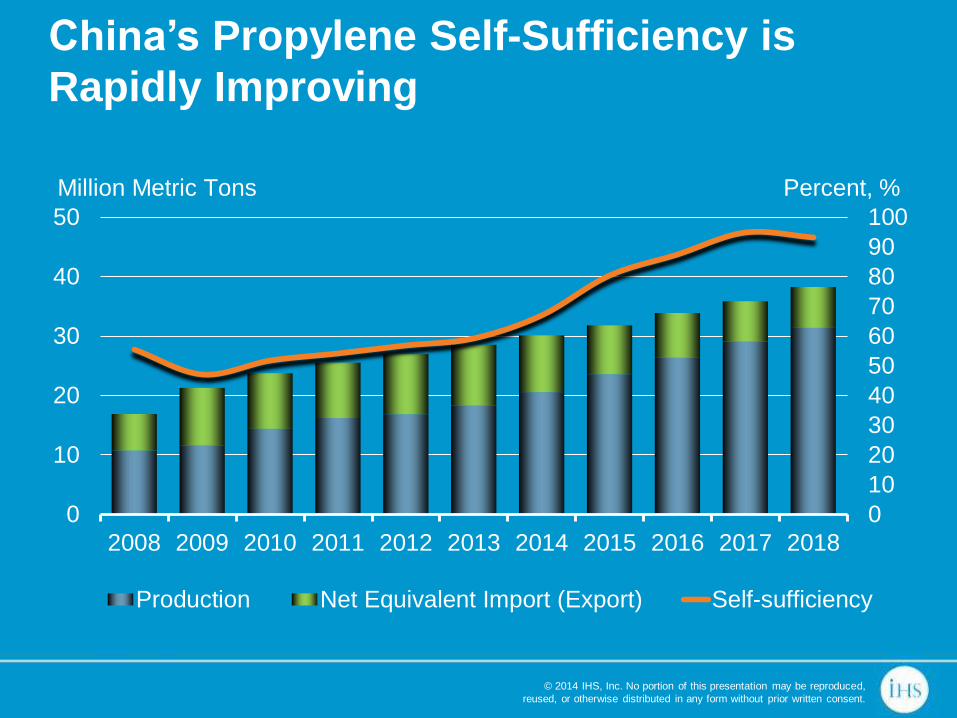
China’s Propylene Self-Sufficiency is
Rapidly Improving
0
10
20
30
40
50
60
70
80
90
100
0
10
20
30
40
50
2008 2009 2010 2011 2012 2013 2014 2015 2016 2017 2018
Production Net Equivalent Import (Export) Self-sufficiency
Million Metric Tons Percent, %
© 2014 IHS, Inc. No portion of this presentation may be reproduced,
reused, or otherwise distributed in any form without prior written consent.
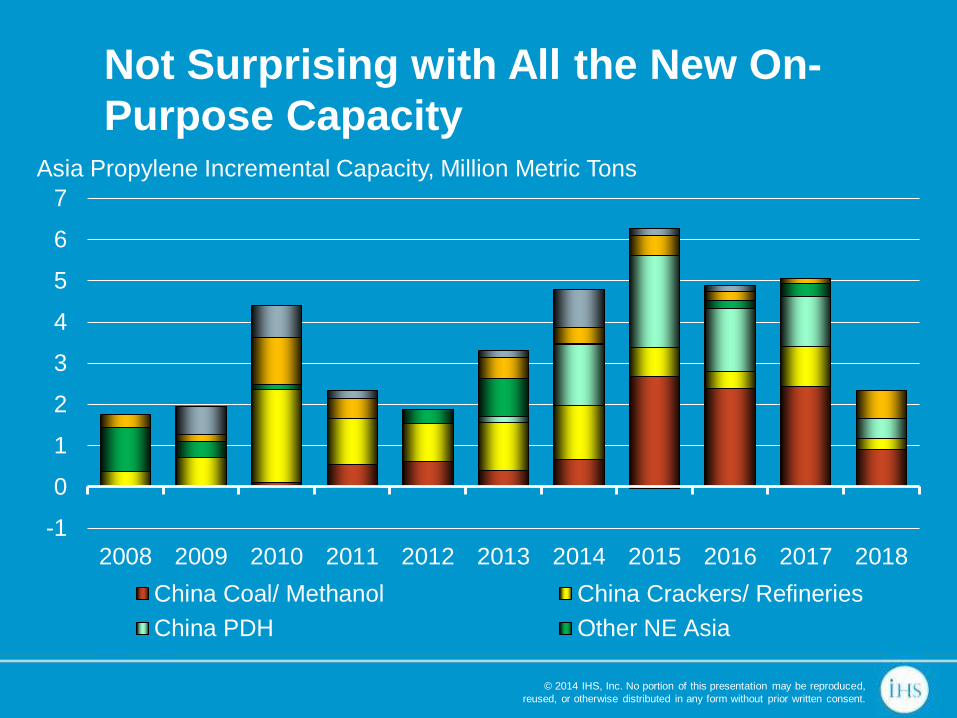
Not Surprising with All the New On-
Purpose Capacity
-1
0
1
2
3
4
5
6
7
2008 2009 2010 2011 2012 2013 2014 2015 2016 2017 2018
China Coal/ Methanol China Crackers/ Refineries
China PDH Other NE Asia
Asia Propylene Incremental Capacity, Million Metric Tons
© 2014 IHS, Inc. No portion of this presentation may be reproduced,
reused, or otherwise distributed in any form without prior written consent.
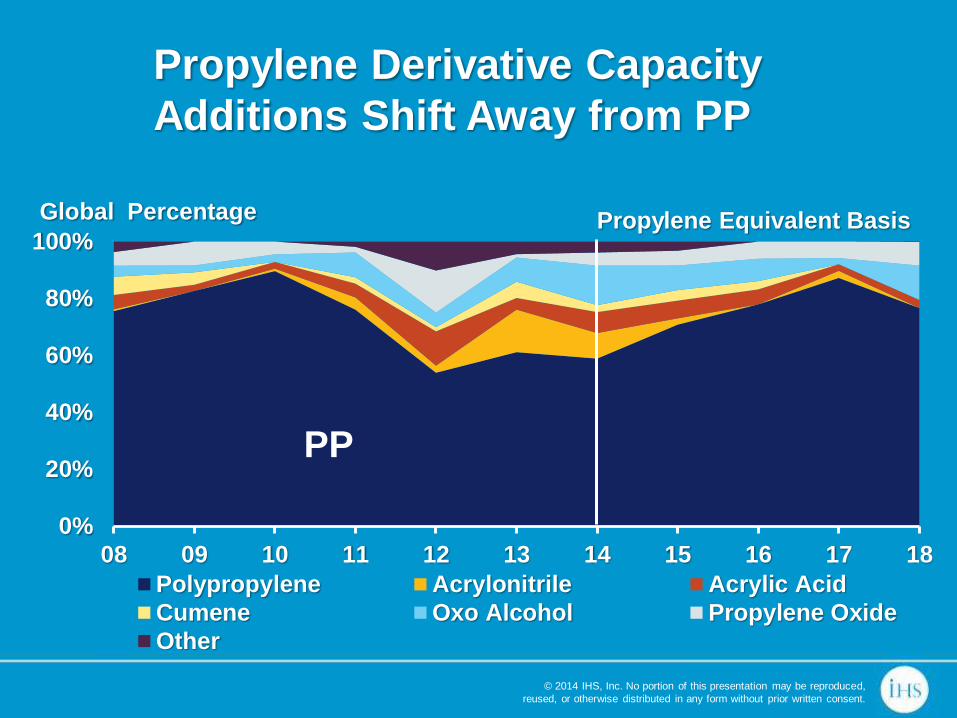
Propylene Equivalent Basis
Propylene Derivative Capacity
Additions Shift Away from PP
0%
20%
40%
60%
80%
100%
08 09 10 11 12 13 14 15 16 17 18
Polypropylene Acrylonitrile Acrylic Acid
Cumene Oxo Alcohol Propylene Oxide
Other
PP
Global Percentage
© 2014 IHS, Inc. No portion of this presentation may be reproduced,
reused, or otherwise distributed in any form without prior written consent.
0.0
1.0
2.0
3.0
4.0
5.0
6.0
7.0
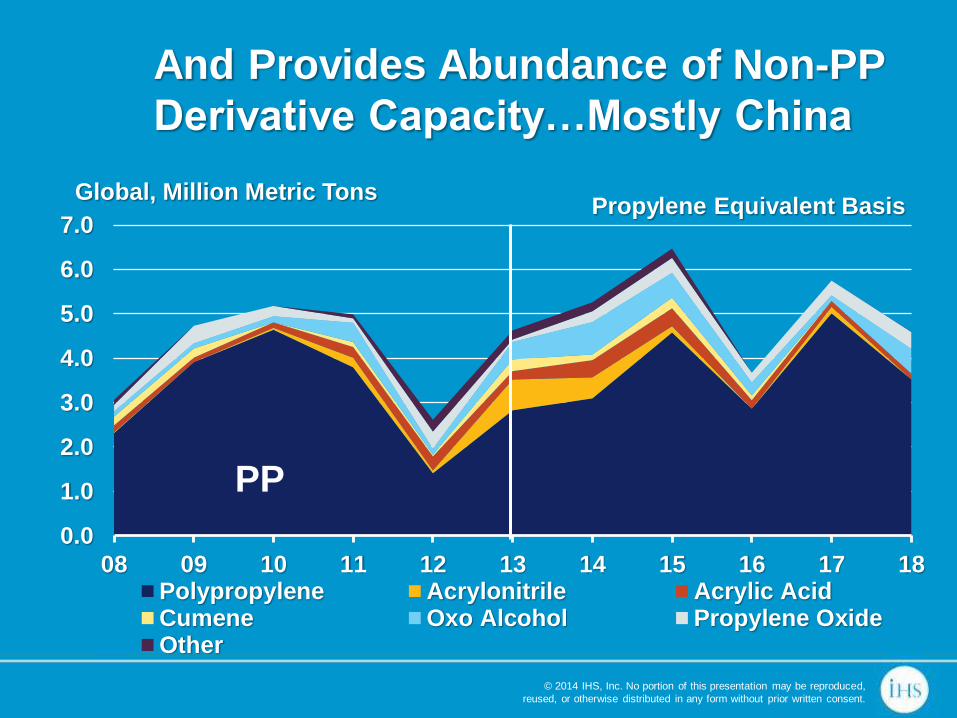
08 09 10 11 12 13 14 15 16 17 18Polypropylene Acrylonitrile Acrylic AcidCumene Oxo Alcohol Propylene OxideOther
PP
Propylene Equivalent Basis
And Provides Abundance of Non-PP
Derivative Capacity…Mostly China
Global, Million Metric Tons
© 2014 IHS, Inc. No portion of this presentation may be reproduced,
reused, or otherwise distributed in any form without prior written consent.
Global Propylene Market
• The “Big Picture” and what is motivating the
changes
• China continues to strive towards self
sufficiency
• North America NGL’s impact supply
• Overbuild on the horizon…..prices forecast to
weaken
© 2014 IHS, Inc. No portion of this presentation may be reproduced,
reused, or otherwise distributed in any form without prior written consent.
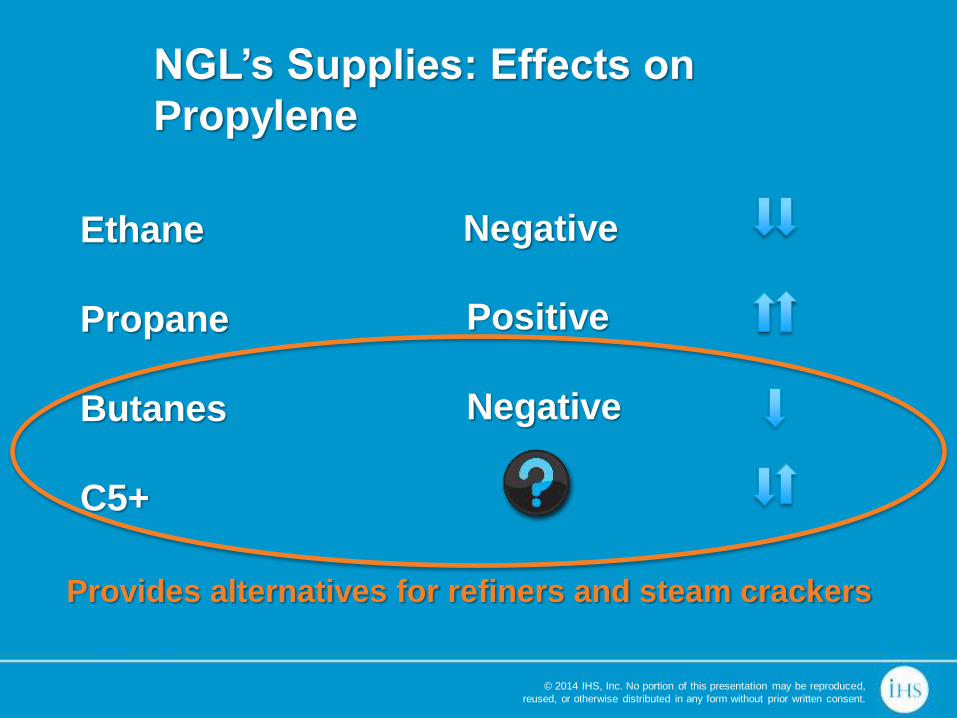
Ethane
Propane
Butanes
C5+
Provides alternatives for refiners and steam crackers
NGL’s Supplies: Effects on
Propylene
Negative
Positive
Negative

© 2014 IHS, Inc. No portion of this presentation may be reproduced,
reused, or otherwise distributed in any form without prior written consent.
North America Propane Abundance
Supports Global PDH Additions
0
500
1,000
1,500
2,000
2,500
2000 2002 2004 2006 2008 2010 2012 2014 2016 2018 2020 2022
MBPD
Domestic Exports
© 2014 IHS, Inc. No portion of this presentation may be reproduced,
reused, or otherwise distributed in any form without prior written consent.
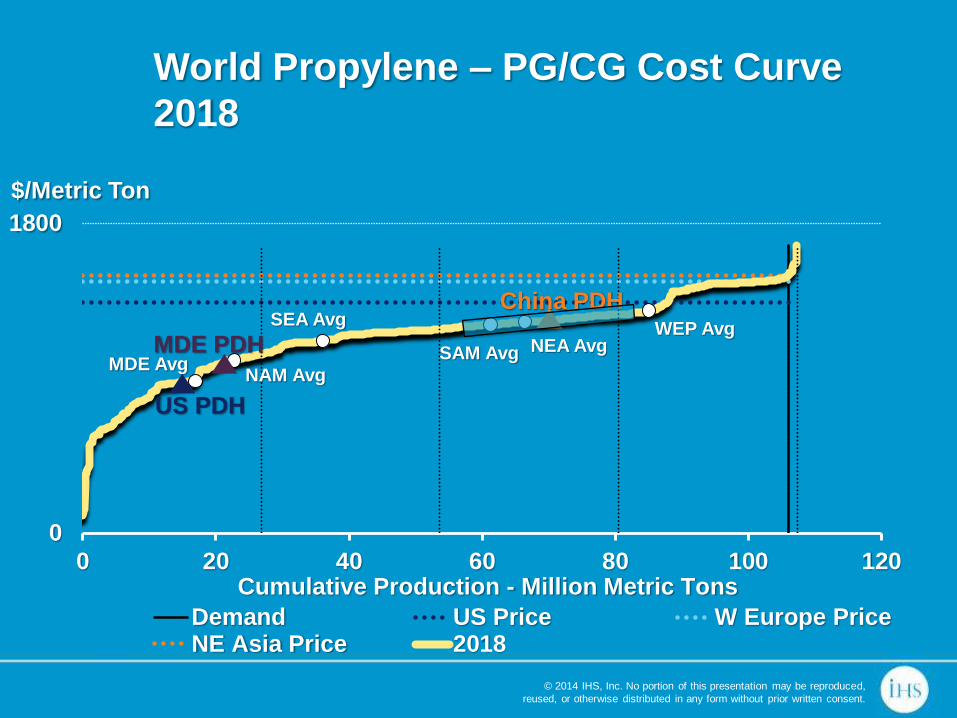
MDE Avg NAM Avg
NEA Avg SAM Avg
SEA Avg WEP Avg
0
1800
0 20 40 60 80 100 120
$/Metric Ton
Demand US Price W Europe PriceNE Asia Price 2018
Cumulative Production - Million Metric Tons
US PDH
MDE PDH
China PDH
World Propylene – PG/CG Cost Curve
2018
© 2014 IHS, Inc. No portion of this presentation may be reproduced,
reused, or otherwise distributed in any form without prior written consent.
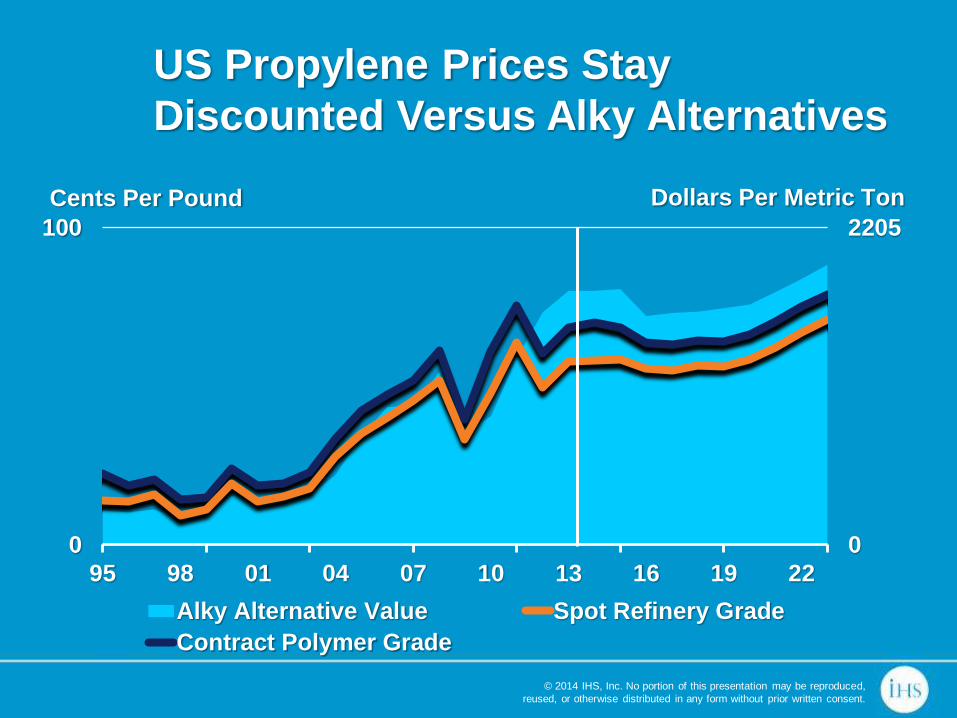
0
2205
0
100
95 98 01 04 07 10 13 16 19 22
Alky Alternative Value Spot Refinery Grade
Contract Polymer Grade
Dollars Per Metric Ton Cents Per Pound
US Propylene Prices Stay
Discounted Versus Alky Alternatives
© 2014 IHS, Inc. No portion of this presentation may be reproduced,
reused, or otherwise distributed in any form without prior written consent.
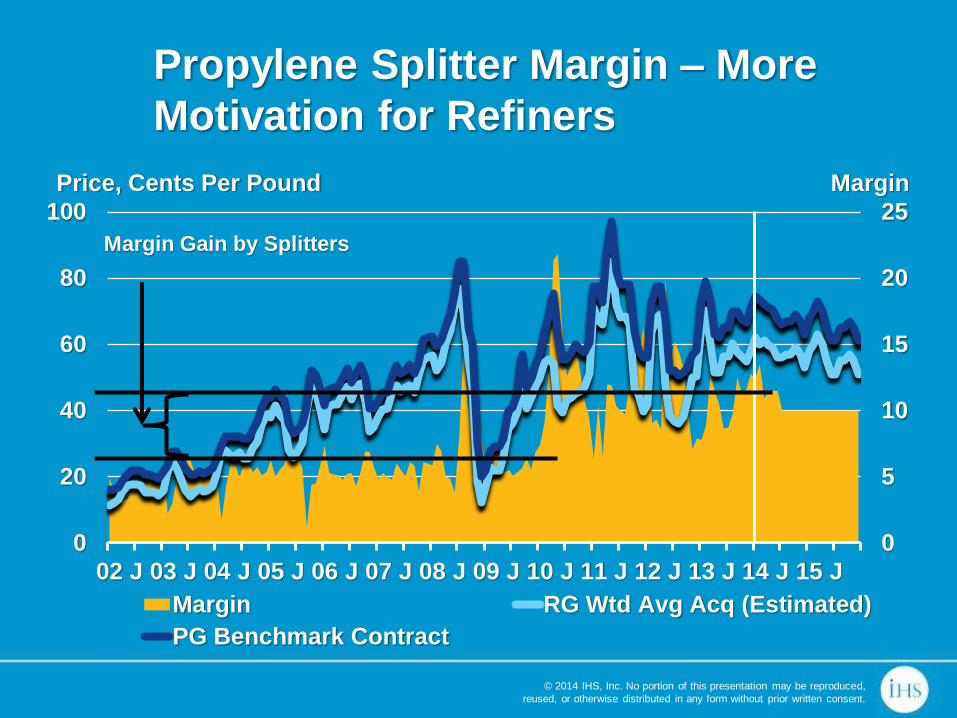
0
5
10
15
20
25
0
20
40
60
80
100
02 J 03 J 04 J 05 J 06 J 07 J 08 J 09 J 10 J 11 J 12 J 13 J 14 J 15 J
Margin RG Wtd Avg Acq (Estimated)
PG Benchmark Contract
Price, Cents Per Pound Margin
Margin Gain by Splitters
Propylene Splitter Margin – More
Motivation for Refiners
© 2014 IHS, Inc. No portion of this presentation may be reproduced,
reused, or otherwise distributed in any form without prior written consent.
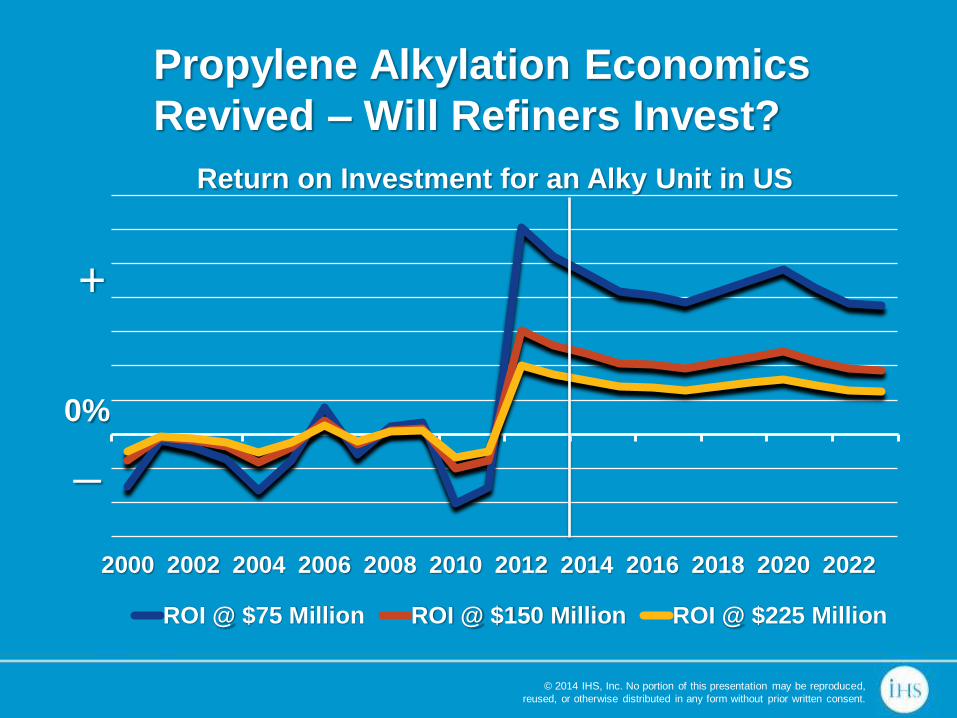
2000 2002 2004 2006 2008 2010 2012 2014 2016 2018 2020 2022
Return on Investment for an Alky Unit in US
ROI @ $75 Million ROI @ $150 Million ROI @ $225 Million
Propylene Alkylation Economics
Revived – Will Refiners Invest?
0%
+
_
© 2014 IHS, Inc. No portion of this presentation may be reproduced,
reused, or otherwise distributed in any form without prior written consent.
Global Propylene Market
• The “Big Picture” and what is motivating the
changes
• China continues to strive towards self
sufficiency
• North America NGL’s revive supply
• Overbuild on the horizon…..price forecast
weakens
© 2014 IHS, Inc. No portion of this presentation may be reproduced,
reused, or otherwise distributed in any form without prior written consent.
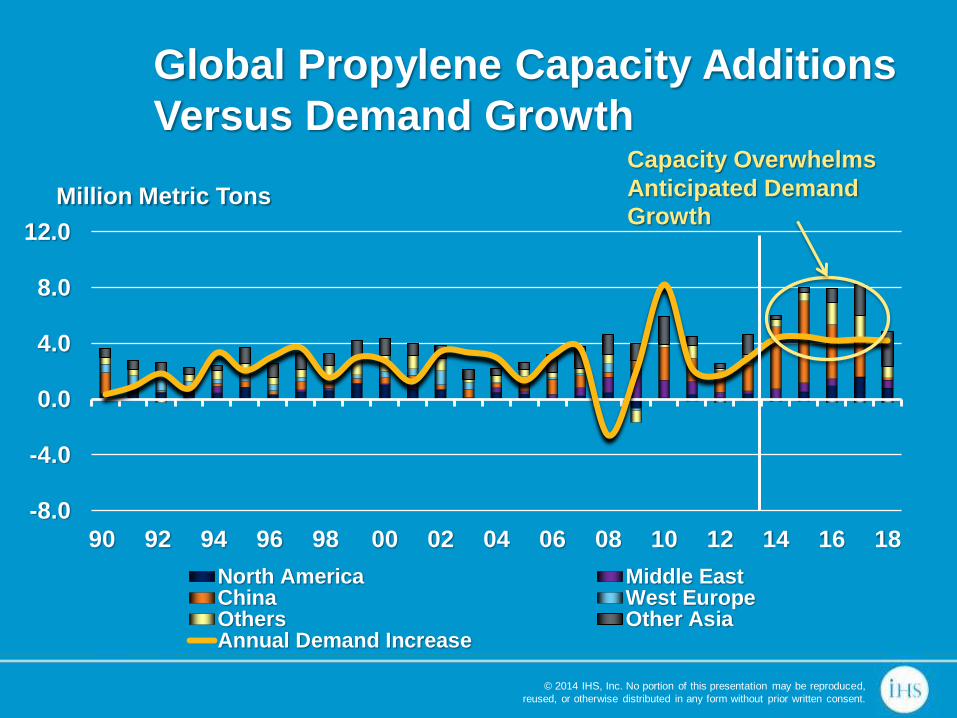
-8.0
-4.0
0.0
4.0
8.0
12.0
90 92 94 96 98 00 02 04 06 08 10 12 14 16 18
Million Metric Tons
North America Middle EastChina West EuropeOthers Other AsiaAnnual Demand Increase
Capacity Overwhelms
Anticipated Demand Growth
Global Propylene Capacity Additions
Versus Demand Growth
© 2014 IHS, Inc. No portion of this presentation may be reproduced,
reused, or otherwise distributed in any form without prior written consent.
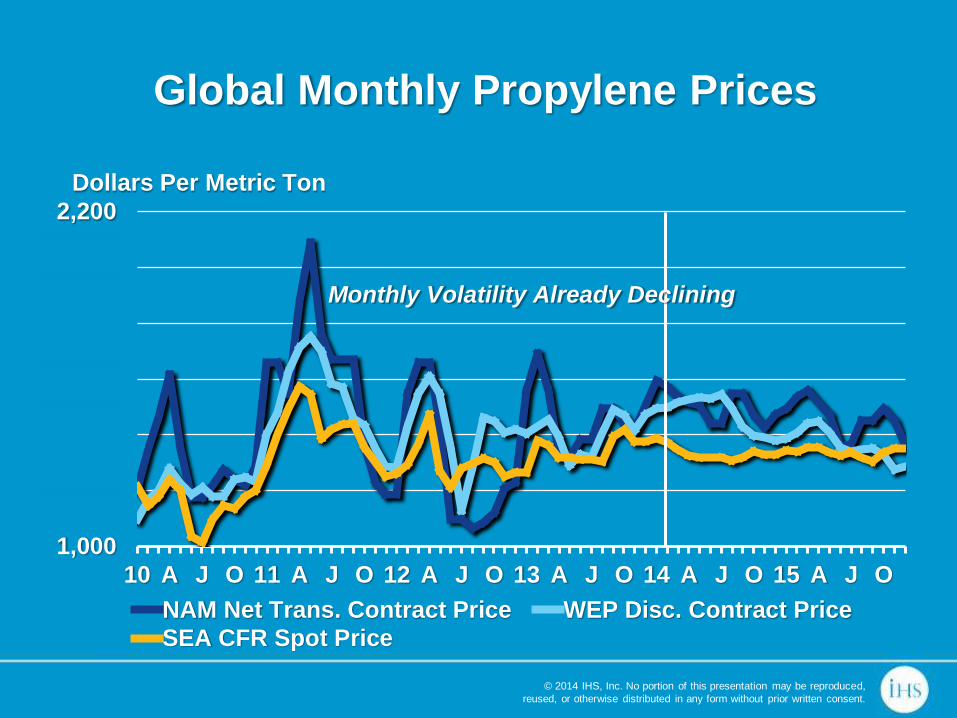
1,000
1,200
1,400
1,600
1,800
2,000
2,200
10 A J O 11 A J O 12 A J O 13 A J O 14 A J O 15 A J O
NAM Net Trans. Contract Price WEP Disc. Contract Price
SEA CFR Spot Price
Dollars Per Metric Ton
Monthly Volatility Already Declining
Global Monthly Propylene Prices
© 2014 IHS, Inc. No portion of this presentation may be reproduced,
reused, or otherwise distributed in any form without prior written consent.
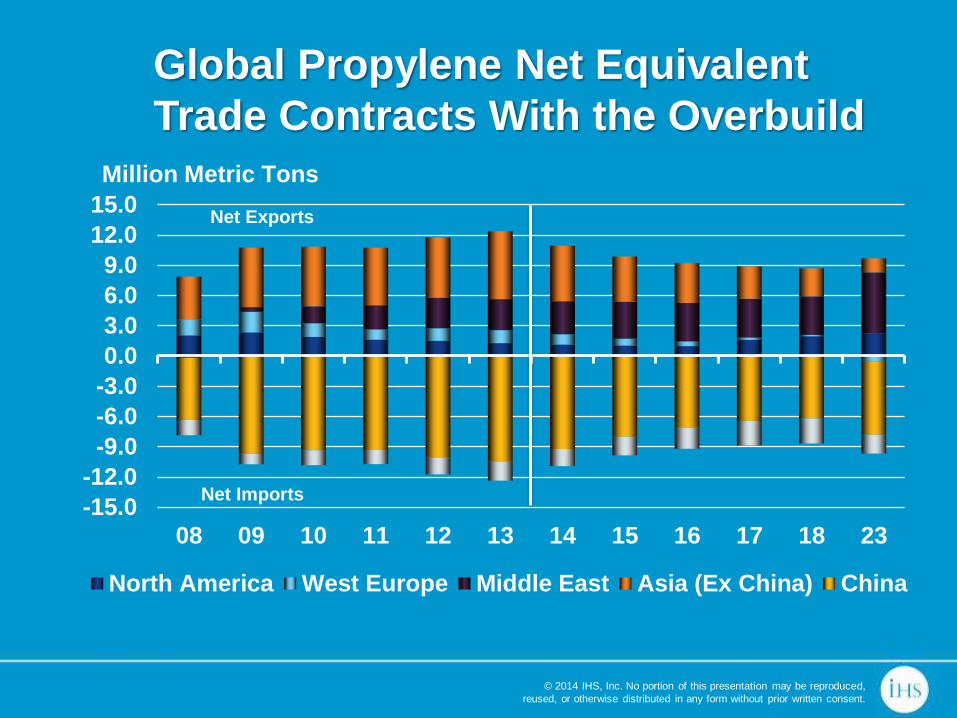
Global Propylene Net Equivalent
Trade Contracts With the Overbuild
-15.0
-12.0
-9.0
-6.0
-3.0
0.0
3.0
6.0
9.0
12.0
15.0
08 09 10 11 12 13 14 15 16 17 18 23
North America West Europe Middle East Asia (Ex China) China
Net Imports
Net Exports
Million Metric Tons
© 2014 IHS, Inc. No portion of this presentation may be reproduced,
reused, or otherwise distributed in any form without prior written consent.
0.5
0.7
0.9
1.1
1.3
1.5
0.5
0.7
0.9
1.1
1.3
1.5
90 93 96 99 02 05 08 11 14 17 20 23
Ratio Ratio
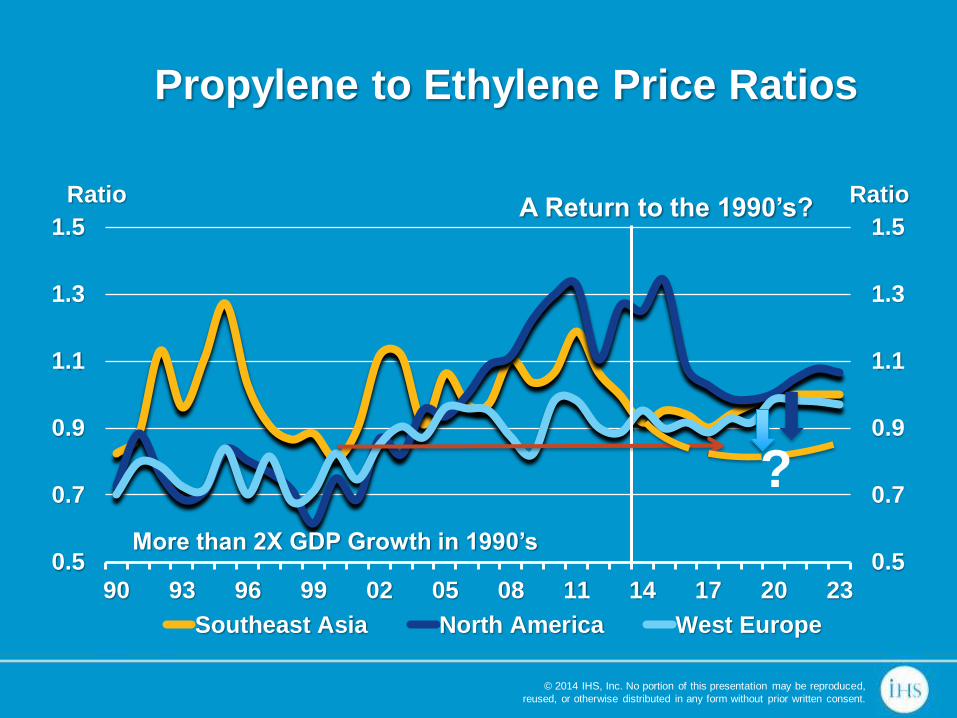
Southeast Asia North America West Europe
?
Propylene to Ethylene Price Ratios
More than 2X GDP Growth in 1990’s
A Return to the 1990’s?
© 2014 IHS, Inc. No portion of this presentation may be reproduced,
reused, or otherwise distributed in any form without prior written consent.
-5.0
-3.0
-1.0
1.0
3.0
5.0
7.0
90 92 94 96 98 00 02 04 06 08 10 12 14 16 18 20 22
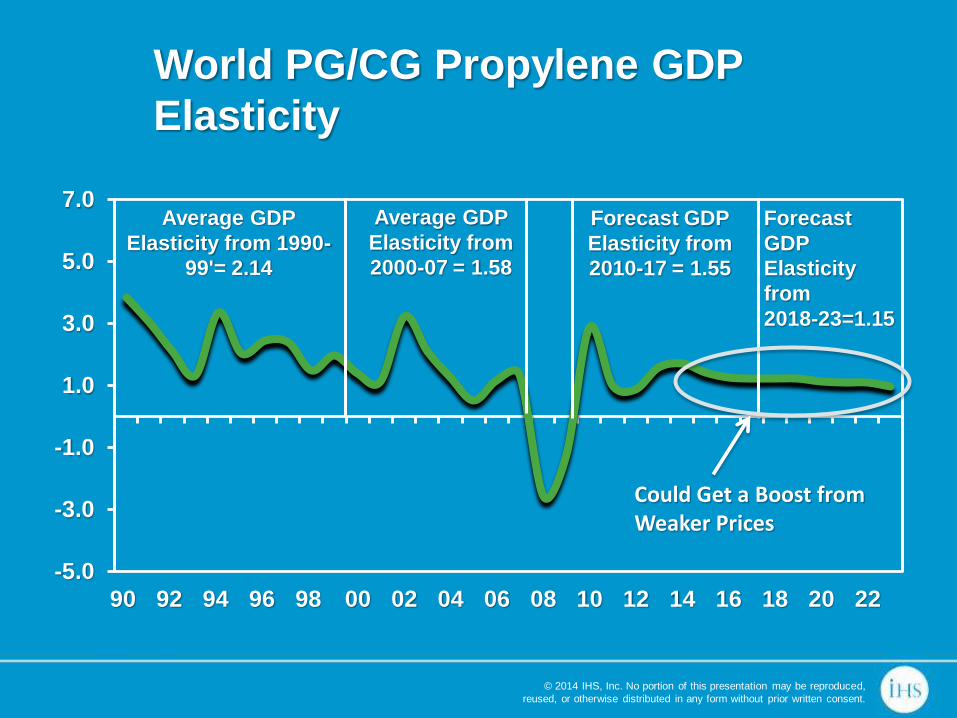
Average GDP
Elasticity from 1990-
99'= 2.14
Average GDP
Elasticity from
2000-07 = 1.58
Forecast GDP
Elasticity from
2010-17 = 1.55
Forecast
GDP
Elasticity
from
2018-23=1.15
World PG/CG Propylene GDP
Elasticity
Could Get a Boost from Weaker Prices
© 2014 IHS, Inc. No portion of this presentation may be reproduced,
reused, or otherwise distributed in any form without prior written consent.
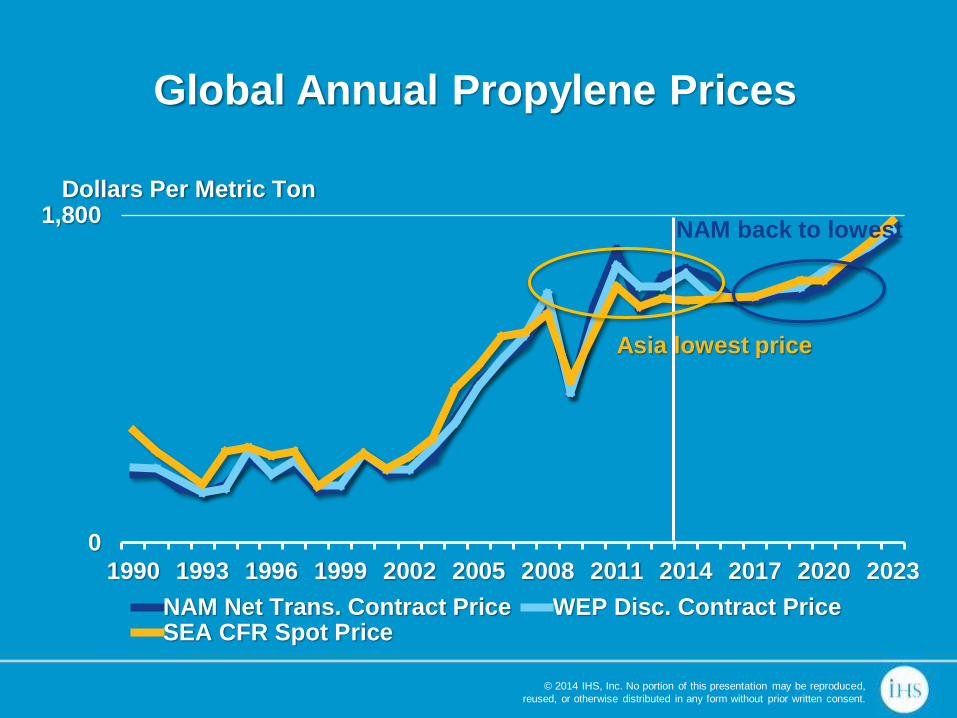
0
1,800
1990 1993 1996 1999 2002 2005 2008 2011 2014 2017 2020 2023
NAM Net Trans. Contract Price WEP Disc. Contract PriceSEA CFR Spot Price
Dollars Per Metric Ton
NAM back to lowest
Asia lowest price
Global Annual Propylene Prices
© 2014 IHS, Inc. No portion of this presentation may be reproduced,
reused, or otherwise distributed in any form without prior written consent.
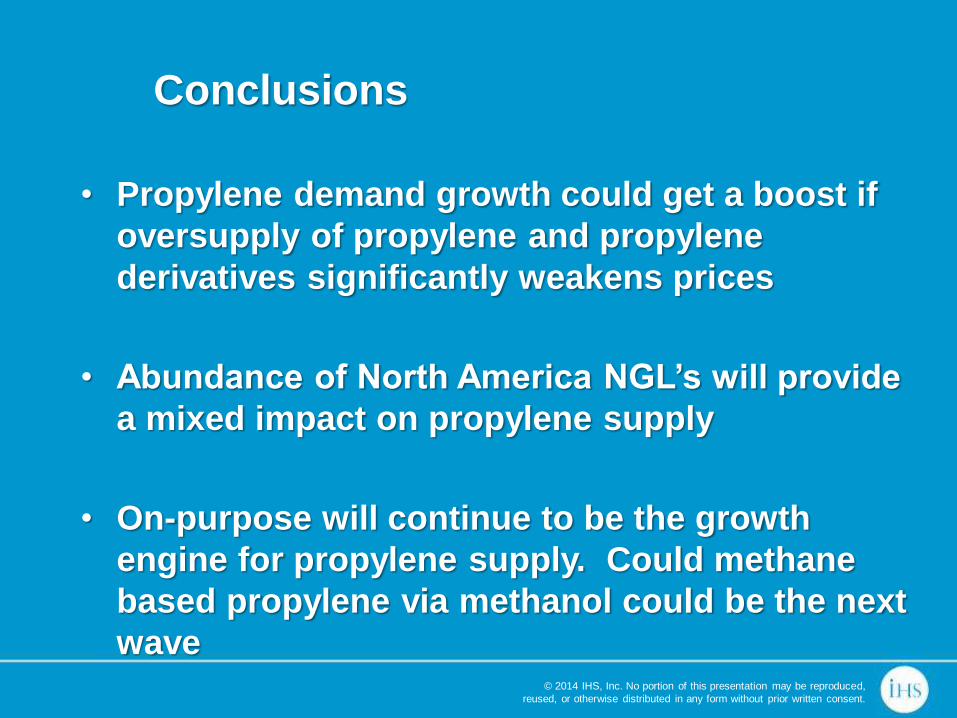
Conclusions
• Propylene demand growth could get a boost if
oversupply of propylene and propylene
derivatives significantly weakens prices
• Abundance of North America NGL’s will provide
a mixed impact on propylene supply
• On-purpose will continue to be the growth
engine for propylene supply. Could methane
based propylene via methanol could be the next
wave

© 2014 IHS, Inc. No portion of this presentation may be reproduced,
reused, or otherwise distributed in any form without prior written consent.
Thank You


![Simulation and Performance Analysis of Propylene · PDF fileon-purpose propylene technology; propane dehydrogenation, olefin metathesis, and methanol to propylene [2]-[4]. However,](https://img.pdfslide.net/doc/110x75/5a9fa6de7f8b9a89178d0123/simulation-and-performance-analysis-of-propylene-propylene-technology-propane.jpg)