Embed Size (px)
Citation preview

Global report on health data systems and capacity, 2020

2
GLOBAL REPORT ON HEALTH DATA SYSTEMS AND CAPACITY, 2020

Made possible by funding from Bloomberg Philanthropies
Global report on health data systems and capacity, 2020

SCORE for health data technical package: global report on health data systems and capacity, 2020 ISBN 978-92-4-001870-9 (electronic version) ISBN 978-92-4-001871-6 (print version)
© World Health Organization 2021
Some rights reserved. This work is available under the Creative Commons Attribution-NonCommercialShareAlike 3.0 IGO licence (CC BY-NC-SA 3.0 IGO; https://creativecommons.org/licenses/by-nc-sa/3.0/igo).
Under the terms of this licence, you may copy, redistribute and adapt the work for non-commercial purposes, provided the work is appropriately cited, as indicated below. In any use of this work, there should be no suggestion that WHO endorses any specific organization, products or services. The use of the WHO logo is not permitted. If you adapt the work, then you must license your work under the same or equivalent Creative Commons licence. If you create a translation of this work, you should add the following disclaimer along with the suggested citation: “This translation was not created by the World Health Organization (WHO). WHO is not responsible for the content or accuracy of this translation. The original English edition shall be the binding and authentic edition”.
Any mediation relating to disputes arising under the licence shall be conducted in accordance with the mediation rules of the World Intellectual Property Organization (http://www.wipo.int/amc/en/mediation/rules/).
Suggested citation.SCORE for health data technical package: global report on health data systems and capacity, 2020. Geneva: World Health Organization; 2021. Licence: CC BY-NC-SA 3.0 IGO.
Cataloguing-in-Publication (CIP) data. CIP data are available at http://apps.who.int/iris.
Sales, rights and licensing. To purchase WHO publications, see http://apps.who.int/bookorders. To submit requests for commercial use and queries on rights and licensing, see http://www.who.int/about/licensing.
Third-party materials. If you wish to reuse material from this work that is attributed to a third party, such as tables, figures or images, it is your responsibility to determine whether permission is needed for that reuse and to obtain permission from the copyright holder. The risk of claims resulting from infringement of any third-party-owned component in the work rests solely with the user.
General disclaimers. The designations employed and the presentation of the material in this publication do not imply the expression of any opinion whatsoever on the part of WHO concerning the legal status of any country, territory, city or area or of its authorities, or concerning the delimitation of its frontiers or boundaries. Dotted and dashed lines on maps represent approximate border lines for which there may not yet be full agreement.
The mention of specific companies or of certain manufacturers’ products does not imply that they are endorsed or recommended by WHO in preference to others of a similar nature that are not mentioned. Errors and omissions excepted, the names of proprietary products are distinguished by initial capital letters.
All reasonable precautions have been taken by WHO to verify the information contained in this publication. However, the published material is being distributed without warranty of any kind, either expressed or implied. The responsibility for the interpretation and use of the material lies with the reader. In no event shall WHO be liable for damages arising from its use.
Photo credits. page 7: © WHO | Blink Media - Lisette Poole; page 49: WHO | Blink Media - Saiyna Bashir; page 57: © WHO | Ploy Phutpheng; page 77: © WHO | Blink Media - Saiyna Bashir; page 87: © WHO | Blink Media - Saiyna Bashir
SCORE logo by Artifex Creative Webnet Ltd (ACW). Design and layout by Café.art.br

Contents
Foreword by Dr Tedros Adhanom Ghebreyesus, WHO Director-General ..................................................................iv
Foreword by Michael R. Bloomberg, WHO Global Ambassador for Noncommunicable Diseases and Injuries ............... v
Acknowledgements ......................................................................................................................................vi
Acronyms ...........................................................................................................................................................viii
Summary ..................................................................................................................................................................x
Introduction .......................................................................................................................................................... 1
Survey populations and health risks .................................................................... 8 System of regular population-based surveys .................................................................................................................... 10
Surveillance of public health threats .................................................................................................................................... 16
Regular population census ...................................................................................................................................................... 21
Looking forward: policy implications ....................................................................................................................................23
Count births, deaths and causes of death.......................................................24Full birth and death registration ............................................................................................................................................ 26
Certification and reporting of causes of death ................................................................................................................. 32
Looking forward: policy implications ....................................................................................................................................35
Optimize health service data ................................................................................... 36Routine facility reporting system with patient monitoring ............................................................................................38
Regular system to monitor service availability, quality and effectiveness ................................................................ 42
Health service resources: health financing and health workforce ..............................................................................44
Looking forward: policy implications ....................................................................................................................................48
Review progress and performance ..................................................................... 50Regular analytical reviews of progress and performance, with equity ...................................................................... 52
Institutional capacity for analysis and learning .................................................................................................................54
Looking forward: policy implications ....................................................................................................................................56
Enable data use for policy and action ............................................................... 58Data and evidence drive policy and planning .................................................................................................................... 61
Data access and sharing...........................................................................................................................................................64
Strong country-led governance of data ...............................................................................................................................68
Looking forward: policy implications .................................................................................................................................... 71
Data availability and global health priorities .................................................................... 72
Conclusion ........................................................................................................................................................... 75
Annexes ................................................................................................................................................................. 78Annex 1. SCORE Interventions, elements and indicators ..............................................................................................................................79
Annex 2. SCORE Assessment maturity models for indicators included in scoring ................................................................................84

iv
Foreword | WHO
The COVID-19 pandemic has highlighted the importance of strong data and health information systems that provide timely, reliable and actionable data. The grounding principle of WHO’s transformation is to make a measurable impact in countries. WHO’s Triple Billion targets – one billion more people benefitting from universal health coverage, one billion more people better protected from health emergencies, and one billion more people enjoying better health and well-being – is a pathway to achieve this vision.
Even before the pandemic, health systems were already over-stretched, and the world was not on track to meet the health-related Sustainable Development Goals (SDGs). COVID-19 has shown that even the most advanced and resilient systems have faced significant disruption across multiple sectors. We can only build back better with robust data and health information systems in every country and every community.
Despite progress in recent years, high-quality data are not routinely collected in all settings, major health challenges are not adequately monitored, and effective interventions are not directed to the right people, at the right time and at the right place. This impacts policies and programmes and consequently, the health of entire populations. Similarly, in order to meet the shared SDG commitment to “leave no-one behind”, we need disaggregated data to ensure equitable health outcomes.
This means we must strengthen comprehensive data systems, collaborate with other sectors, and apply innovative digital technologies to collect, analyse and use data to make informed decisions and deliver impact.
The publication of the SCORE Global report on health data systems and capacity, 2020 therefore comes at a particularly relevant time. As the first global assessment of the status and capacity of health information systems in 133 countries, covering 87% of the global population, it identifies gaps and provides guidance to precisely and rapidly improve the quality, availability, analysis, accessibility and use of data.
Using the innovative SCORE (Survey, Count, Optimize, Review, Enable) Assessment instrument to measure the status of data and health information
systems, the report highlights some important findings. It shows for example, that while 68% of countries have well-developed and sustainable capacity to detect public health threats, this varies between regions. Although there is good coverage of basic national level data, this is not the case in all countries. Similarly, there is high availability of data on immunization, tuberculosis and HIV; however, coverage of other critical health issues such as noncommunicable diseases, including mental health and cancer, is very limited.
The SCORE for Health Data Technical Package includes this report and its accompanying Assessment methodology, Assessment instrument and Online Data Portal along with the recently launched Essential interventions and Tools and standards. This is a unique, one-stop-shop of essential interventions, recommended actions, tools and resources. We encourage all countries and partners to use this global report and the SCORE Assessment instrument to urgently identify gaps, prioritize investments, and accelerate progress towards achieving the SDGs and the Triple Billion targets to promote health, keep the world safe and serve the vulnerable.
We would like to express our sincere gratitude to Member States for their engagement, to Bloomberg Philanthropies for funding this truly collaborative work, and to all Data for Health Initiative partners who played a role in bringing the SCORE global report and technical package to fruition.
Dr Tedros Adhanom Ghebreyesus
Director-General, World Health Organization

Foreword | Bloomberg Philanthropies
Good data is essential to good decision-making. Fortunately, for a growing number of governments around the world, “Follow the Data” is the motto driving their work to strengthen public health. With more timely and accurate data in hand – ranging from basic birth and death records, to detailed evidence on risk behaviours like tobacco use – policymakers can then make smart, targeted investments in improving public health and saving lives.
To help more countries do just that, Bloomberg Philanthropies teamed up with our longtime partner the World Health Organization and developed the SCORE package. SCORE is a set of essential, standardized tools, which boil down to: Survey, Count, Optimize, Review, and Enable. While there is still much work to be done, our results so far are encouraging.
Most significantly, this SCORE report is the first to gauge countries’ progress in producing sustainable health data. The report’s findings come from over 130 countries, representing nearly 90 percent of the global population. While no country has achieved perfect marks in each of SCORE’s five categories, one important fact is clear now. All countries, across income levels, have the capacity to fill gaps in their health data. By pinpointing those gaps, we hope this report leads countries not just to produce more data, but to take policy action.
At Bloomberg Philanthropies, that kind of data-driven approach informs all our work to help protect and advance global public health. Whether we are responding to the urgent needs of the COVID-19 pandemic, or expanding our longstanding efforts to reduce preventable deaths
from noncommunicable diseases around the world, we search out the best data and use it to help our partners develop the most effective strategies for success. To cite one example: Since 2015, through our Data for Health programme, we have helped countries around the world strengthen their health data systems – and we look forward to enhancing our impact.
Together with the World Health Organization, we encourage our partners in government to continue following the data – and putting it to immediate use, in crafting policies that save and improve their residents’ everyday lives.
Michael R. Bloomberg
WHO Global Ambassador for Noncommunicable Diseases and Injuries
Founder, Bloomberg LP and Bloomberg Philanthropies
v

vi
Acknowledgements
The WHO SCORE Global report on health data system and capacity, 2020 is the result of close collaboration between individuals within WHO, Member States and external partners, without whom this work would not be possible. This report was coordinated by the Division of Data, Analytics and Delivery for Impact at WHO.
We would like to thank all partner institutions, UN statistical division, participating Member States, WHO colleagues and leadership of WHO countries, territories and areas for their contributions and inputs to this report. We would also like to thank the Bloomberg Philanthropies Data for Health Initiative. WHO is a proud partner of the Bloomberg Philanthropies Data for Health Initiative which works with governments to strengthen their public health data to inform improved policy decisions and public health investments.
MEMBER STATES
AFRICAN REGION
Benin: Midodji Hervé Djossou; Botswana: Baile Moagi; Burundi: Anaclet Nahayo; Cameroon: Gnigninanjouena Oumarou; Côte d’Ivoire: Joseph Acka; Ethiopia: Biruk Abate; Ghana: Nana Kwabena Adjei-Mensah; Guinea: Sekou Conde; Guinea-Bissau: Orlando Lopes; Madagascar: Harisoa Julie Norovoahangy; Malawi: Issac Oambula; Namibia: Ben Nangombe; Nigeria: A. M. Abdullani; Sierra Leone: Amara Jambal; South Africa: GV Andrews; Zimbabwe: A. Mahomva
REGION OF THE AMERICAS
Antigua and Barbuda: Joon Corrott; Argentina: Cintia Speranza, Alejandro Osornio, Daniel Rizzato Lede, Carlos Guevel; Bahamas: Delon Brennen; Costa Rica: Adriana Salazar González; Cuba: Jose Angel Portal Miranda; Guatemala: Carlos Enrique Soto Menegazzo; Haiti: Jean Partrick Alfred; Honduras: Karla Yadira; Jamaica: Andriene Grant, Karen Webster-Kerr; Nicaragua: Carolina Davila Murillo; Paraguay: Luis Roberto
Escoto; Peru: Elizabeth Zulema Tomas Gonzales; Saint Kitts and Nevis: Delores Stapleton Harris; Saint Lucia: Feix St. Hill; Saint Vincent and the Grenadines: Cuthbert Knights; Trinidad and Tobago: Asif Ali; Venezuela: Jose Manuel Garcia
EASTERN MEDITERRANEAN REGION
Afghanistan: Attaullah Sayeedzai, Ahmad Nawid Shams; Bahrain: Safa Sayed Ali Majed; Djibouti: Saleh Banoita Tourab; Egypt: Ibtesam Mostafa Zakzouk; Iraq: Hisham Jasim Abed, Raoof Tareq Raoof; Jordan: Kareman Al-Zain; Lebanon: Hilda Harb; Libya: Mohamed Ibrahim Saleh Daganee; Oman: Omar Al Farsi, Halima Al Hinai, Ahmed Al Qasmi, Badar Awlad Thani; Palestine: Jawad Bitar; Saudi Arabia: Mawyah Alatassi; Somalia: Abdullahi Hashi Ali; Sudan: Amal Abass, Amal Alamin, Khalid Almardy, Wiam Bushra
EUROPEAN REGION
Austria: Jeannette Klimont; Belgium: Lieven De Raedt, Francoise Renard, Timmy Van Dijck; Cyprus: Vasos Scoutellas; Germany: Philip Wahlster, David Herr; Netherlands: Polanen Petel, Wendy Loorbach-van Zutphen, Bruin, A. de (Agnes), Mariken Tijhuis, Peter Achterberg; Poland: Karolina Konarzewska; Portugal: Jose Martins; San Marino: Elena Sacchini, Gabriele Rinaldi, Andrea Gualtieri, Mauro Sammaritani; Slovakia: Bukšárová Daniela, Urbanová Gabriela, Greisigerová Dominika, Pauhof Ján; United Kingdom: Sion Ward
SOUTH-EAST ASIA REGION
Bangladesh: Habibur Rahman; Indonesia: Didik Budijanto; Maldives: Aishath Samiya, Sofoora Kawsar Usman; Nepal: Kehav Raj Pandit; Thailand: Walaiporn Patcharanarumol, Cha-aim Pachanee; Timor-Leste: Elia A A dos Reis Amaral
WESTERN PACIFIC REGION
Australia: Sami Iohara; Brunei Darussalam: Rudy bin Haji Harun, Haji Shamsul Bahrine bin

vii
Haji Sabtu; China: Min Cai, Yue Cai; Japan: Yuuta Yokobori; Laos: Chansaly Phommavong, Founkham Rattanavong; Malaysia: Chansaly Phommavong, Founkham Rattanavong, Christopher Lee Kwok Choong, Chen Chaw Min, Muna Zahira Mohd Yusoff, Nur Shahadah Zakaria; Mongolia: Bayasgalan Dashnyam, Amarjargal Yadamsuren; Republic of Korea: Sunmi An, Jeongwoo Shin; Solomon Islands: Seraphina Elisha, Rodley Ruskin; Vanuatu: Rachel Takoar, Posikai Samuel Tapo; Viet Nam: Phan Le Thu Hang
WORLD HEALTH ORGANIZATION
HEADQUARTERS
Adewale Akinjeji, Oluwaseun Aladesanmi, Samira Asma, Azza Badr, Philippe Jean-Pierre Boucher, Somnath Chatterji, Anh Chu, Dida Connor, Doris Ma Fat, Gabriela Flores, Ahmad Hosseinpoor, Robert Jakob, Nenad Kostanjsek, Muriel Levy, Benjamin Gutierrez Lobos, Kathryn O’Neill, Alyssa Palmquist, Amit Prasad, Amani Siyam, Chelsea Taylor, Tamitza Toroyan, Pavel Ursu, Luhua Zhao
REGIONAL OFFICES
African Region: Benson Droti, Humphrey Cyprian; Region of the Americas: Marcelo Jose D’Agostino, Vilma Gawryszewski; Eastern Mediterranean Region: Henry Doctor, Arash Rashidian; European Region: Stefania Davia, David Novillo Ortiz; South-East Asia Region: Mark Landry, Rakesh Mani Rastogi; Western Pacific Region: Mengjuan Duan, Jun Gao
The following experts and reviewers were part of the conceptual development and finalization of the report. We are grateful for their expertise, contributions and critical review to produce a timely and impactful resource for health systems strengthening:
Technical Experts and ReviewersCarla Abouzahr, Ties Boerma, David Boone, Jennifer Ellis, Fern Greenwell, Adam Karpati, Manish Kumar, Francesca Perucci, Adrienne Pizatella, Robert Pond, Heidi Reynolds, Philip Setel, Kavitha Viswanathan
This document was edited by Prudence Smith.
The SCORE technical package is made possible by funding from Bloomberg Philanthropies.

viii
Acronyms
AFR WHO African Region
AMR WHO Region of the Americas
ART Antiretroviral Therapy
CRVS Civil Registration and Vital Statistics
DFI Delivery for Impact
DHS Demographic and Health Survey
DTP Diphtheria-tetanus-pertussis
EMR WHO Eastern Mediterranean Region
EUR WHO European Region
HDC Health Data Collaborative
HHFA Harmonized Health Facility Assessments
HIS Health Information System
HMIS Health Management Information System
HRHIS Human Resource Health Information System
HRSDG Health-Related Sustainable Development Goals
ICD International Classification of Diseases
IHR International Health Regulations
LSMS Living Standards Measurement Study
M&E Monitoring and Evaluation
MICS Multiple Indicator Cluster Surveys
MoH Ministry of Health
NHA National Health Accounts
NHO National Health Observatories
NHSP National Health Sector Strategic Plan

NHWA National Health Workforce Accounts
OPD Outpatient Department
PES Post Enumeration Survey
SCORE Survey, Count, Optimize, Review, Enable
SDG Sustainable Development Goal
SEAR WHO South-East Asia Region
SHA System of Health Accounts
SPAR State Party Self-Assessment Annual Reporting
UHC Universal Health Coverage
UNDESA United Nations Department of Economic and Social Affairs
UNSD United Nations Statistical Division
WHO World Health Organization
WPR WHO Western Pacific Region
ix

x
Summary
Data and information that help governments prioritize health challenges and allocate necessary resources rely on strong country health information systems. These systems identify health care availability as well as access and quality of care issues that prevent the attainment of universal health coverage (UHC). The same country health information systems also provide important data for global monitoring for the Sustainable Development Goals (SDGs) and other donor reporting.
To meet the increasingly complex demands on countries for health information, the new SCORE for Health Data Technical Package brings together, for the first time, a set of the most effective interventions and tools for addressing critical data gaps and strengthening country health data for planning and monitoring health priorities.
The package is based on five key interventions, represented by the acronym SCORE (Figure 1). Interventions S, C and O focus on improving critical data sources, their availability and quality; while R and E aim to enhance the synthesis, analysis, access and use of health data for action. Key components of the SCORE package were launched in August 2020 – SCORE Essential interventions for strengthening country health information systems and SCORE Tools and standards. Together, these documents provide an overview of health information systems, the context and indicators of each intervention, examples of actions needed to strengthen different aspects of the system and a summary of the best tools and standards to do so. An additional key component of the SCORE package is the Assessment instrument which was developed to evaluate a country’s health information system according to the five SCORE interventions. One hundred and thirty-three country health information systems were assessed, covering 87% of the global population, with the data collected between 2013 and 2018.
The results of the global assessment are published in this SCORE Global report on health data systems and capacity, 2020. Accompanying the global report is the SCORE Assessment methodology which provides details of the indicators and methodologies applied in the assessment and subsequent analyses.
This report is particularly timely and highlights how important it is to strengthen a country’s health information system to meet data needs. Among several key findings, the income divide between high and low-income countries is reflected in the lack of health information system capacity to address fundamental areas such as the registration of births, deaths and causes of death. While some countries have achieved sustainable capacity in some key areas, no country has a fully mature system capable of meeting their evolving needs for health information.
The report provides recommendations for countries to prioritize investments in health information system and is published during one of the most data-strained public health crisis responses ever - that of the COVID-19 pandemic. As countries’ health information systems have had to track COVID-19, they have also had to continue tracking other health priorities. This challenge underlines the demand to improve countries’ health information system to meet current and
country health information systems were assessed, covering
of the global population.
133
87%
future data needs. While the global report’s assessment predates the COVID-19 pandemic, the results remain relevant, highlighting the key gaps and challenges countries face around the world.
All countries have the potential to realise stronger data systems
The report assesses the five SCORE interventions that determine if a country has a fully mature health information system with the capacity to meet a country’s evolving data needs. Up to 60% of the countries have a well-developed or sustainable capacity for reviewing progress and performance of their health sector and more than half have a well-developed or sustainable capacity to survey populations and health risks (Figure I). Fewer countries reach such capacity for the other three interventions, but over half of all countries have moderate or better capacity for each of the five interventions, respectively.
No single country assessed achieves sustainable capacity across all five interventions, nor meets best practice guidelines across the full spectrum of the health information system. Therefore, all countries could benefit from understanding the gaps in their system and follow SCORE recommendations for improvement.
of countries have moderate or better capacity for each of the five SCORE interventions, respectively.
50%OVER
xi

xii
FIGURE I DISTRIBUTION OF SCORE CAPACITY BY SCORE INTERVENTIONS*
1%
2%
5%
28%
8%
11%
20%
8%
16%
22%
35%
28%
14%
38%
43%
34%
33%
20%
27%
27%
27%
32%
16%
4%
5%
1 0%Nascent
14 1%Limited
47 11%Moderate
45 24%Well-developed
26 51%Sustainable
Number of countries
Percentage of world population
37 14%Nascent
21 12%Limited
18 22%Moderate
36 32%Well-developed
21 7%Sustainable
Number of countries
Percentage of world population
3 1%Nascent
26 4%Limited
57 17%Moderate
42 62%Well-developed
5 3%Sustainable
Number of countries
Percentage of world population
6 0%Nascent
10 1%Limited
37 10%Moderate
44 21%Well-developed
36 55%Sustainable
Number of countries
percentage of world population
10 1%Nascent
29 4%Limited
51 21%Moderate
36 55%Well-developed
7 6%Sustainable
Number of countries
Percentage of world population
ENABLE data use for policy and action
COUNT births, deaths and causes of death
SURVEY populations and health risks
REVIEW progress and performance
*Data from 133 countries either validated or approved for use are included in analysis.
OPTIMIZE health service data
Percentage of countries

xiii
More disaggregated data will enhance countries ability to monitor inequalities
Of the 673 total surveys conducted between 2013 and 2018 that are analysed as part of the SCORE assessment, 91% of them present data disaggregated by sex and 83% by age, but less than 75% collect disaggregated data by education, rural- urban status, and wealth. Similarly, while 90% of countries have published an analytical report within the last five years, only 56% examine inequality by sex and even fewer (38%) by socioeconomic status. This lack of disaggregated data can also be seen in data from health facilities and data on health workers. Data of higher quality are often available at national level; this may mask the lack of disaggregated data, creating the perception that systems are stronger than they really are. Therefore, relying solely on data at national level to monitor the strength of a country’s health information system may lead to biased conclusions, and some subpopulations being overlooked.
High-income countries have stronger health information systems. Sustainable solutions are needed to improve all countries’ systems
There is a marked difference between the high-income countries and countries in other income groups when it comes to health information system. An estimated 66% of high-income countries have well-developed or sustainable capacity for surveying populations and health risks, while countries in the upper-middle-income, lower-middle-income and low-income groups, have 47%, 51% and 50%, well-developed
and sustainable capacity, respectively. Similar differences can be seen across other interventions: while 100% of high-income countries and 91% of upper-middle-income countries have well-developed or higher capacity for counting births, only 58% of lower-middle- income and 23% of low-income countries have the same capacity. For counting deaths, the differences are even more marked. While 97% and 82%, respectively, of high-income and upper-middle-income countries have well-developed and higher capacity for death registration, only 27% of lower-middle-income countries and no low-income countries achieve the same capacity.
Country wealth also affects the capacity to enable data use for policy and action; 63% of high-income countries have well-developed or sustainable capacity for data use compared to 32%, 19%, 15% of upper-middle income, lower-middle income, and low-income countries, respectively.
Some of these differences can be explained by how health information systems are funded in countries. The SCORE assessment collected information on funding sources for nationally representative population-based surveys. The results show that between 2013-2018 low-income countries had a higher average number of annual surveys compared to upper-middle-income countries (0.9 surveys compared to 0.7 surveys). However, only 6% of surveys in lower-middle-income countries and low-income countries are funded solely by the national government. This situation has both advantages and disadvantages for countries. There is a need for countries to be less reliant on external assistance to monitor their health priorities. As evidence shows, upper-middle-income countries fall into the gap between being aided by external donors and being able to adequately fund surveys themselves. This can have implications for other areas of data collection and highlight the need for progressive country solutions that lead to greater sustainability.
of countries have disaggregated population projections.
51%

xiv
Equitable investment across all health programmes strengthens a country’s reporting system
Focused spending on key programme areas such as immunization and tuberculosis, has improved their data availability but has not uniformly strengthened the reporting system. For example, less than 50% of countries have data available for mental health disorders compared to almost 100% of countries which have data for immunization and tuberculosis. There are promising shifts however, and a greater focus now on overall health system strengthening, rather than supporting only specific programmes.
Improving data quality is essential for policy and planning
Data availability does not automatically translate into availability of the quality data needed for policy, planning and patient health care. Data quality is a critical issue for health facilities with about 40% of countries not showing clear evidence that data quality assurance processes have been followed for their published health facility data. Census data provide benchmark population data for many health statistics. With less than 50% of countries conducting post-enumeration surveys, there is legitimate concern about the quality of census data. The quality of cause-of-death data could also be an issue. Only 28% of countries have less than 10% ill-defined cause-of-death codes. The remaining 72% either do not record cause-of-death data using International Classification of Diseases (ICD) codes, or have more than 10% ill-defined cause-of-death codes. Furthermore, many countries require technical support and/or funding to ensure that the data collected through all aspects of their health information systems are of sufficient quality to be useful.
Effective governance of data management and use will maximise return of investment in health information systems
Timely, reliable, actionable data is essential for delivering interventions to improve the health of populations. Translating data to policies and actions requires effective investment in mechanisms which focus on using data to formulate policy (such as dedicated units within the ministry of health or another ministry); mechanisms which ensure data can be accessed and shared openly (such as national health data observatories); and country-led governance of data (policies or regulations which guide the management and use of a country’s data).
While 84% of countries have a central unit or function to translate data and evidence to policy, the functionality of these units is not very clear. Over 60% of countries have a national health observatory or portal. However, these portals are not updated frequently (only 25% of countries updated them more than once a year) and only 26% of countries have portals with full coverage of health statistics. Similarly, 74% and 62% of countries, respectively, have a national monitoring and evaluation plan and a national digital or eHealth strategy. However, these plans do not usually meet recommended standards, an index for good governance of data. For example, only 21% of countries have a monitoring and evaluation plan that meets 85% of the standards, and another 21% for eHealth strategy.
High-income countries have stronger systems for translating data to policy and action compared to countries in other income groups. It is worth noting that the disparity between low-income, middle-income and upper-income countries is not very wide though low-income countries overall face more barriers in using data and evidence to drive policies.

1
Introduction
Unprecedented demand for data
Monitoring progress: national and subnational health priorities
Countries need data to inform national-level planning and management at programme, subnational and facility levels. Health ministry officials, district and facility managers, as well as individual providers, legislative bodies, communities, citizens and the media need accessible, high-quality health information to:
• better target health programming to reach all people;
• increase the monitoring of populations at greatest risk;
• provide early warning on potential public health threats;
• efficiently adjust programming to meet evolving needs;
• improve the quality and efficiency of health care;
• support global monitoring;
• effectively plan and advocate for resources both within and beyond the health sector;
• hold health institutions and government authorities to account for resource use and health outcomes.
Monitoring progress towards the SDGs, UHC, health emergency protection and healthier populations
There are 59 health and health-related SDG (HRSDG) indicators, including 27 indicators under the overarching health goals that countries need to consider and monitor in national health strategies and policies, and additional 32 health-related indicators that fall within other SDGs. Some of the 59 indicators rely on non-health sector data sources such as civil registration and vital statistics systems (CRVS), satellite data, air-quality monitors for air pollution, and police data for suicide, homicide and road traffic mortality. Countries have primary responsibility to monitor progress made in implementing the SDGs, which requires high-quality, accessible and timely data collection and analysis, to ensure that no one is left behind.
Underpinning SDG 3 - ”to ensure healthy lives and promote well-being for all at all ages” - is a pledge by countries to provide UHC – a commitment that everyone will receive the high-quality health interventions they need without incurring financial hardship. Monitoring UHC requires information about both financial protection and effective coverage of health interventions. Effective coverage requires both measurement of access to health services, and the quality of the services received.
Meeting the HRSDGs requires health emergencies protection and healthier populations based on indicators such as sanitation, nutrition and environment.

2
GLOBAL REPORT ON HEALTH DATA SYSTEMS AND CAPACITY, 2020
Emergency protection means preparedness, prevention and the ability to detect and respond quickly to public health threats. Each of these depends on effective early warning systems based on reliable data. No single data source can meet all information needs; therefore, a multisectoral approach to monitor overall progress towards the SDGs is essential.
Data is essential to ensure equity
The “leaving no one behind” imperative of the SDGs implies that countries must significantly increase their efforts to ensure that marginalized populations achieve equitable health outcomes. Thus, disaggregation of health data by inequality dimensions such as sex, age, economic status, education, place of residence and other context-specific population subgroups, is important for the achievement of this objective.
Health information systems do not meet the data needs of countries
Despite the increasing demands for data and evidence, the health information systems (HIS) currently in place in many countries are inadequate. High-quality data are not routinely collected in sufficient detail to allow regular computation of levels, trends and inequalities in health outcomes. Major health challenges are not adequately measured and monitored, thus affecting programme implementation at national and local levels and, consequently, the health status of the population.
In addition:
1. Many health facility recording and reporting systems lack the capacity to measure the quality and outcomes of the services provided. Facility assessments and population-based surveys may provide insights, but they are not conducted routinely. Furthermore, absence of reporting from private sector facilities means that coverage of certain services cannot be accurately reflected at population level.
2. Data systems and workers are often burdened by requirements to collect and report on an excessive number of data elements and indicators.
3. CRVS systems are often incomplete and paper-based and thus do not provide timely and reliable information for public health decisions
4. Health inequality data are not fully collected, analysed and reported.
5. Integration and use of data from other sectors are often piecemeal, especially those concerning risks to health (for example, environmental risks and road traffic accidents). The same is true for data on coverage of preventive interventions to reduce those risks.
6. Ministries of health and national public health institutions may lack the technological and analytical capacity to cope with the increase in data demands related to the SDGs.

3
INTRODUCTION
WHO’s SCORE for Health Data Technical Package
The SCORE for Health Data Technical Package was developed by WHO and partners to assist Member States in strengthening country data systems and capacity to monitor progress towards the health-related SDGs, UHC, and other national and subnational health priorities and targets. It provides a coherent framework that enables national policymakers and planners to:
1. focus investments on priority interventions (“best buys”) – proven to be effective, feasible, affordable, scalable, and sustainable;
2. access recommended/best practice actions, tools and standards;
3. identify critical gaps and needs and allow for continuous monitoring, based on a set of simple, standardized, verifiable core indicators.
The SCORE package represents the most effective strategies and interventions for strengthening country health data systems. The package encourages stakeholders to invest in a select number of interventions that synergistically have greatest impact on the quality, availability, analysis,
use and accessibility of data in countries. This package is not intended to replace existing detailed guidance on implementing various components of a health information system. Instead, it provides a coherent framework for countries to focus on priority interventions and elements, and points countries towards best practices and universally accepted standards and tools. It is intended that the SCORE for Health Data Technical Package will evolve over time to incorporate new and innovative tools, approaches and country experiences.
The SCORE for Health Data Technical Package is based on five key interventions (Figure 1.1) represented by the acronym SCORE. Interventions S, C and O focus on improving critical data sources and their availability and quality, while interventions R and E aim to enhance the synthesis, analysis, access and use of health data for action.
The package includes the following components which complement this Global report on health data systems and capacity, 2020:
SCORE Essential Interventions:
A description of five SCORE interventions with underlying elements and indicators, and examples of actions for assessing and strengthening health information systems.
SCORE Tools and Standards:
A list of up-to-date resources for each intervention.
SCORE Assessment Instrument:
A data collection instrument with accompanying user guide to assess health information systems and identify gaps.
SCORE Assessment Methodology, 2020:
A technical explanation of the scoring methods used in the Global report for quantifying SCORE indicators, elements and interventions.
Assessment Methodology, 2020

GLOBAL REPORT ON HEALTH DATA SYSTEMS AND CAPACITY, 2020
FIGURE 1.1 FIVE ESSENTIAL INTERVENTIONS FOR STRENGTHENING COUNTRY HEALTH DATA SYSTEMS AND CAPACITY
Survey populations and health risks
Count births, deaths and causes of death
Optimize health service data
Review progress and performance
Enable data use for policy and action
4
5
INTRODUCTION
About this report
This Global report on health data systems and capacity, 2020 represents the results of country health information system assessments conducted by WHO between 2018 and 2020 using the WHO SCORE assessment tools.
Scope
The SCORE Assessment instrument measures the status of a country’s health information system and its suitability for use as a basis for country planning. The Assessment instrument is not intended to conduct a comprehensive diagnosis of all aspects of a country health information system, but it triggers more specialised and in-depth assessments based on gaps and identified needs.
The objective of this report is to:
• Provide an overview of the status of health information systems in Member States around the world using a comparable methodology;
• Identify gaps in health information systems and CRVS systems which can guide investments and action;
• Provide baseline information and data that allow monitoring of progress towards the SDGs, UHC and other national and international targets;
• Guide international investments and actions and track improvements in the health information system over time.
Process
A multi-step process was undertaken to assess country health information systems. These steps included:
• Expert consultation: Multiple consultations with different stakeholders were held to define a core set of simple, measurable indicators. These indicators formed the basis of the SCORE Assessment instrument.
• Data collection: Each intervention was measured against the indicators and attributes identified in the SCORE Assessment Instrument for each country. Reviewers included HIS experts who undertook desk reviews and examined published and grey literature as source documents for each country to complete the tool. They also triangulated country data with data collected from global databases such health workforce, health expenditures, etc.
• Review and preliminary validation: The preliminary desk review results were shared with country counterparts in regional consultations for feedback. Review and validation were also carried out by country HIS focal points.
• Final validation: Final results were shared with the country for further validation, final review and sign-off
• Data analysis: Global level data analyses were performed on 133 countries, representing 87% of the world population, with either fully validated or approved assessments.

6
GLOBAL REPORT ON HEALTH DATA SYSTEMS AND CAPACITY, 2020
• Results presentation: The majority of the results in this report include the 133 validated and approved countries. In some cases, only a sub-set of countries are included in the analysis due to data availability. For indicators collected from published and validated sources (for example, results from State Party Self-Assessment Annual Reporting (SPAR)), all countries with available data were included, even though countries may not have validated data in other areas.
Figure I.2 shows the global map of the countries that participated in the SCORE assessment.
FIGURE 1.2 MAP OF COUNTRY PARTICIPATION IN SCORE ASSESSMENT
Distribution of countries, by status of participation in SCORE Assessment
Validated country profiles for publication
Validated and approved desk review assessment
Not included in report
Number of countries 99 133 62
Share of world population 61% 87% 13%
Validated country profiles for publication Validated and approved desk review assessment Not included in report

ABOUT THIS REPORT

8
Survey populations and health risksto know what makes people sick or at risk
KEY ELEMENTS
S3. REGULAR POPULATION CENSUS
of countries have disaggregated population projections.
51%
S1. SYSTEM OF REGULAR POPULATION-BASED SURVEYS
surveys conducted annually.112
S2. SURVEILLANCE OF PUBLIC HEALTH THREATS
of countries achieve a well-developed or higher capacity for indicator and event-based surveillance.
70%NEARLY

9
SURVEY POPULATIONS AND HEALTH RISKS
Information about a population’s health and health risks is the cornerstone of disease and disability prevention. Population-based surveys are one of the main sources (and sometimes the only source) of this information, providing critical insight into factors affecting the population such as poverty, education, water and sanitation, living conditions, nutrition, air quality and security. Surveys are the most important instrument for assessing inequality and are a prominent source of data for many HRSDG indicators. They are also the main source of health data disaggregation especially in low-and middle-income countries, given that they collect information both for a large number of health indicators as well as inequality dimensions like economic status, education, place of residence, age and sex and other context-specific population subgroups.
A population and housing census (or population registry) is an important data source for health and other sectors. It provides information on population size, geographical distribution, and social, demographic and economic factors
that are critical for resource allocation and targeting interventions. It is recommended that a population census is conducted once every 10 years. A population registry may include basic characteristics such as date and place of birth, sex, date and place of death, date of arrival/departure in the country, citizenship(s) and marital status. It also provides essential population statistics that are often used in population-based surveys for population adjustment and calibration.
Figure S.1 shows that overall 68% of countries have well-developed or higher capacity for surveying populations and health risks. Further analysis indicates that while an estimated 66% of high-income countries have well-developed or higher capacity for surveying populations and health risks, only 47%, 51% and 50%, respectively, of upper-middle-income, lower-middle-income and low-income countries, achieve the same capacity (numbers not shown in the figure).
FIGURE S.1 NUMBER AND PERCENTAGE OF COUNTRIES (N=133), AND COUNTRY POPULATION AS A PERCENTAGE OF WORLD POPULATION, BY COUNTRY CAPACITY TO SURVEY POPULATIONS AND HEALTH RISKS
1%
11%
35%34%
20%
1 0%Nascent
14 1%Limited
47 11%Moderate
45 24%Well-developed
26 51%Sustainable
Number of countries
Percentage of world population
Percentage of countries

10
GLOBAL REPORT ON HEALTH DATA SYSTEMS AND CAPACITY, 2020
S1. System of regular population- based health surveys
1 Asma S, Lozano R, Chatterji S, Swaminathan S, de Fátima Marinho M, Yamamoto N, Varavikova E, Misganaw A, Ryan M, Dandona L, Minghui R, Murray CJL. Monitoring the health-related Sustainable Development Goals: lessons learned and recommendations for improved measurement. Lancet. 2020 Jan 18;395(10219):240-246. doi: 10.1016/S0140-6736(19)32523-1. Epub 2019 Nov 22. PMID: 31767190.
In many low- and middle-income countries population-based surveys are the main source of information on population health, particularly in the absence of well-functioning CRVS and population registries. Surveys can capture information that complements CRVS and registries, and thus play important roles in tracking population health and identifying priority areas for improvement even in countries where CRVS and population registries are in place.
Population-based health surveys are a significant source of data for many HRSDGs and UHC indicators. For a number of indicators that measure health-related behaviours and risk factors, such as breastfeeding practices, tobacco use prevalence and some measures of mental health, they are often the only data source. Similarly, surveys can provide critical information from non-health sectors (such as education, water and sanitation, living conditions, nutrition, security) that impact health and are among the data sources used to determine out-of-pocket expenditure in national health accounts. Household surveys can provide data for 29 of the 57 HRSDG1; an upcoming WHO publication indicates that the Demographic and Health Survey (DHS), Multiple Indicator Cluster Survey (MICS), and Living Standards Measurement Study (LSMS) are able to measure the highest number of HRSDG indicators.
A survey programme should identify strategic priorities, periodicity and scope of data collection. It also should enforce quality assurance, ethical practices, transparency and data sharing in accordance with stringent confidentiality protocols and international standards for measurement to ensure comparability of results between populations and over time.
population-based surveys are conducted annually.
112
Upper-middle-income countries fall between being aided by external donors and funding survey systems adequately themselves
Representative population surveys verify information that is collected through routine systems and show us where there are gaps. The 133 countries included in this report conducted a total of 673 surveys between 2013 and 2018 (an average of 112 per year). On average, countries conducted about one survey per year. The lowest number of surveys were conducted in upper-middle-income countries. These countries are often not supported by international donor agencies in conducting surveys, but are also limited in their ability to fund and conduct their own surveys.

11
SURVEY POPULATIONS AND HEALTH RISKS
FIGURE S1.1 AVERAGE NUMBER OF SURVEYS CONDUCTED PER YEAR IN 133 COUNTRIES, BY COUNTRY INCOME GROUP, 2013-2018
High Income (n=32)
Upper-middle income (n=34)
Lower-middle income (n=41)
Low income (n=26)
0,2 0,4 0,6 0,8 1 1,20 1,4
1,3
1,1
0,7
0,9
Coverage of key topics in surveys conductedGood coverage of topics in surveys conducted, but some key topics are still being missed
While over 70% of countries captured tobacco use, child weight/height, and family planning (Figure S1.2), in at least one survey since 2013; less than half of countries captured cervical cancer screening, catastrophic health expenditure, and HIV prevalence. While a few high-income countries do measure some of these topics through population-based surveys, many of these topics such as child weight or height, family planning, and child immunization are less likely to be included in their surveys compared to other countries. This is likely because 1) much of this information can be captured by the well-functioning CRVS in most high-income countries, 2) the majority of these countries have sound health care systems that can provide data in some areas without resorting to surveys.
Box S1.1 shows, with examples, three types of topics or indicators that are commonly included in health-related surveys. These three types include 1) indicators that use surveys as the
primary data source, 2) indicators that can be best captured through other sources, but surveys can provide valuable information if other sources are insufficient or unavailable, 3) indicators that may only apply in certain countries; for example, malaria is not endemic in all countries so these countries will not collect malaria data through household surveys.
In calculating the percentage for certain topics, including those that are either not relevant (e.g. malaria parasite in non-malaria endemic countries) or are usually collected by non-survey methods in given countries (e.g. child mortality in countries with strong CRVS systems), the denominators are accordingly adjusted. In other words, the number of countries included in the calculation may vary by indicator. For example, only 8 out of 32 high-income countries collected child mortality data through surveys; the others measured mortality through other means, such as the CRVS systems. To avoid misunderstanding, child mortality and a few other indicators are not considered applicable in Figure S2.1 for high-income countries.
11

12
GLOBAL REPORT ON HEALTH DATA SYSTEMS AND CAPACITY, 2020
BOX S1.1 USE OF HOUSEHOLD SURVEYS TO MEASURE HEALTH PRIORITIES
Indicators using other means as primary source
Family planningDeliveries
ImmunizationChild mortality
Cervical cancer screeningTB prevalence
HIV
Indicators depending on epidemiology
Malaria
Indicators using surveys as primary data source
Tobacco useChild anthropometry
Blood pressureBlood glucose
Health expenditure
12

13
SURVEY POPULATIONS AND HEALTH RISKS
FIGURE S1.2 PERCENTAGE OF COUNTRIES (N=133) THAT CAPTURED RELEVANT HEALTH TOPICS IN AT LEAST ONE SURVEY, BY COUNTRY INCOME GROUP, 2013-2018
Tobacco use
Delivery/Skilled birth attendance
Child weight/height
Family planning
Child mortality
Child immunization
Prevalence of raised blood pressure
Prevalence of raised fasting blood glucose
Cervical cancer screening
Malaria parasite prevalence among
children
Catastrophic health expenditure
HIV prevalence
Tuberculosis prevalence
High income Upper-middle income Lower-middle income Low incomeGlobal Average (GA)
20% 40% 60% 80% 100%0
28%
40%
40%
42%
47%
53%
60%
68%
69%
73%
74%
79%
85%88%
82%93%
73%
70%90%
81%
68%65%
90%69%
55%67%
90%73%
30%68%
90%77%
69%55%
59%58%
53%50%
59%46%
55%48%
46%35%
50%31%
46%31%
42%41%
62%
23%27%
35%
24%36%
73%
55%85%
65%
not applicable
not applicable
not applicable
not applicable
not applicable

14
GLOBAL REPORT ON HEALTH DATA SYSTEMS AND CAPACITY, 2020
Understanding wealth-related inequality is essential, yet less than 60% of all surveys disaggregate based on wealth
Population-based surveys are among the most important instruments for assessing equality, since they can be designed deliberately to provide relevant disaggregated data (e.g., including sex, age, economic status, education and geographic location).
However, while most surveys disaggregate data by age and sex, fewer surveys apply urban-rural or wealth disaggregation. Sex and age are the most commonly-used inequality dimensions (included in over 80% of surveys overall and at least 75% of surveys across all income groups), followed by education (74%), place of residence (70%) and subnational units (67%). Economic status is least likely to be collected (58%) in surveys overall (Figure S1.3).
FIGURE S1.3 PERCENTAGE OF HEALTH SURVEYS CONDUCTED IN 133 COUNTRIES THAT INCLUDED INEQUALITY MEASUREMENT, BY COUNTRY INCOME GROUP, 2013-2018
High income Upper-middle income Lower-middle income Low incomeGlobal Average
Sex
Age
Education
Urban-rural
Subnational
Wealth
20% 40% 60% 80% 100%0
91%95%
92%87%
89%
88%87%
79%76%
84%74%
67%68%
63%70%
72%81%
66%65%
68%70%
74%53%
49%55%
83%
74%
70%
67%
58%

15
SURVEY POPULATIONS AND HEALTH RISKS
of surveys in low-and middle-income countries are funded by government.
ONLY
8%Heavy reliance on external funding creates challenges for building sustainable approaches to measure population health
While there is partial government funding support for survey implementation in low- and lower-middle income countries, only 3% and 8%, respectively, of the surveys, are fully-funded by the government. This has significant implications for a country’s ability to control their own survey programme and the long-term sustainability of surveys (Figure S1.4).
FIGURE S1.4 PERCENTAGE OF HEALTH SURVEYS IN 133 COUNTRIES THAT ARE FULLY FUNDED BY GOVERNMENT, BY COUNTRY INCOME GROUP, 2013-2018
Global (n=133)
High income (n=32)
Upper-middle income (n=34)
Lower-middle income (n=41)
Low income (n=26)
20% 40% 60% 80% 100%0
78%
35%
8%
3%
33%
15

16
GLOBAL REPORT ON HEALTH DATA SYSTEMS AND CAPACITY, 2020
S2. Surveillance of public health threats
1 International Health Regulations (2005) State Party Self-assessment Annual Reporting Tool. Geneva: World Health Organization; 2018. Licence: CC BY-NC-SA 3.0 IGO.
The International Health Regulations (IHR) 2005 require countries to maintain an integrated national system for public health surveillance and response and have set out the core national capacities they should achieve to meet the required standards for surveillance and response.
As part of the IHR commitment, countries use the SPAR tool to self-assess their core IHR capacities and report the results to WHO1. This SCORE element used the validated SPAR results sent by 180 countries to WHO in 2018. The 13 core capacities in SPAR are measured by 24 indicators with each core capacity being measured by 1-3 indicators. Indicators are further broken down into attributes, which further define the indicator. Two of the 13 SPAR core capacities were used as tracers to measure the surveillance element as part of the SCORE assessment. These two core capacities are 1) IHR coordination and national IHR focal point functions and, 2) surveillance. Together these two core capacities indicate that for countries to detect public health events requiring rapid investigation and response and ensuring timely action and control they should have:
• a strong indicator and event-based surveillance system that can detect events of significance for public health, animal health and health security (these are the two main channels of information for public health surveillance);
• effective communication and collaboration across sectors and between subnational, national and international authorities on surveillance of events of public health significance;
• strong country and intermediate level/regional capacity to analyse and link data from and between strengthened, real-time surveillance systems, including interoperable, interconnected electronic reporting systems.
Capacity to detect public health threats
of countries have well-developed or higher capacity to detect public health threats.
ABOUT
TWO THIRDS

17
SURVEY POPULATIONS AND HEALTH RISKS
FIGURE S2.1 PERCENTAGE OF COUNTRIES (N=180), BY CAPACITY TO SURVEY PUBLIC HEALTH THREATS AND COUNTRY INCOME GROUP*
Figure S2.1 reveals that 83% of high-income countries have well-developed and sustainable capacity to detect public health threats compared to 58% of lower-middle-income counties and 41% of low-income countries.
However, only 8% of the 180 countries with SPAR data had limited or less capacity to detect public health threats – overall a positive picture for the global health security agenda (Figure S2.2).
Global (n=180)
High Income (n=54)
Upper-middle income (n=51)
Lower-middle income (n=46)
Low income (n=29)
Nascent Limited Moderate Well-developed Sustainable
0% 20% 40% 60% 80% 100%
1%7% 25% 41% 27%
13% 39% 44%
18%8% 41%
33%9% 43% 15%
48%7% 38%
2%
3% 3%
4%
31%
*There are 15 countries that do not have a SPAR result, and thus, are not included in the analysis.
17

18
GLOBAL REPORT ON HEALTH DATA SYSTEMS AND CAPACITY, 2020
FIGURE S2.2 PERCENTAGE OF COUNTRIES (N=180), BY CAPACITY TO SURVEY PUBLIC HEALTH THREATS AND WHO REGION
0% 20% 40% 60% 80% 100%
1%7% 25% 41% 27%
3%
4%
26% 39% 32%
4%13% 47% 34%
19% 52% 29%
2%
15% 40% 40%
18%9% 55% 18%
9%9% 39% 43%
Nascent Limited Moderate Well-developed Sustainable
Global
AMR
AFR
EMR
EUR
SEAR
WPR
Distribution of countries, by level of capacity and WHO region
Nascent Limited Moderate Well-developed Sustainable Total
AMR 0 1 8 12 10 31
AFR 2 6 22 16 1 47
EMR 0 0 4 11 6 21
EUR 0 2 7 19 19 47
SEAR 0 1 2 6 2 11
WPR 0 2 2 9 10 23
GLOBAL 2 12 45 73 48 180
Stark regional variations exist in country capacity to survey population health threats
In the WHO African region, only 1 out of 47 countries has sustainable capacity for public health surveillance. In addition, of the 14 countries that have only limited or less capacity, eight are in the African region.
Countries in WHO African region has sustainable capacity for public health surveillance.
OUT OF1 47

19
SURVEY POPULATIONS AND HEALTH RISKS
Countries have good early warning systems but are weaker in ability to respond to threats
Each SPAR indicator is scored between 1-5 based on the level of capacity of a country. This score is translated into a percentage. For example, if a country gets a score of 4 (level 4), it has a 80% capacity. Figures S2.3 and S2.4 present variations in the scores for surveillance by country income levels and WHO regions by showing the average percentage capacity of the 3-tracer indicators as well as showing them individually. Figure S2.3 shows there is not much difference between the various income-level groups in their overall ability to detect threats – the early warning function – with scores ranging from 75-83%.
However, Figure S2.3 also shows that what really differentiates the high-income countries from the others is the coordination mechanism that exists within the country to be able to respond to the public health threat (the national IHR coordination function). In addition, there is also some difference between high-income and low-income countries in their ability to respond to early detection of public health threats, as measured by mechanisms for event management. These same patterns play out even more acutely within the WHO African region which faces key challenges in maintaining robust functions for coordination and response. Having real time information to make the right decisions is critical for managing public health threats.
FIGURE S2.3 AVERAGE SCORES OF SPAR TRACERS FOR SURVEILLANCE OF PUBLIC HEALTH THREATS IN 180 COUNTRIES, BY COUNTRY INCOME GROUP*
0% 20% 40% 60% 80% 100%
71%
69%
79%
65%
79%72%
66%62%
82%69%
63%54%
83%79%
75%75%
71%67%
60%56%
High income Upper-middle income Lower-middle income Low incomeGlobal Average
Overall SPAR
National IHR Focal Point functions under IHR
Early warning function: indicator and event-based surveillance
Mechanism for event management (verification, risk assessment,
analysis investigation)
*There are 15 countries that do not have a SPAR result, and thus, are not included in the analysis.

20
GLOBAL REPORT ON HEALTH DATA SYSTEMS AND CAPACITY, 2020
FIGURE S2.4 AVERAGE SCORE OF SPAR TRACERS FOR SURVEILLANCE OF PUBLIC HEALTH THREATS, BY WHO REGION
Global (n=180)
AFR (n=47)
AMR (n=31)
EMR (n=21)
EUR (n=47)
SEAR (n=11)
WPR (n=23)
Overall SPAR
National IHR Focal Point functions
Early warning function
Mechanism for event management
0% 20% 40% 60% 80% 100%
71%
69%
79%
65%
57%53%
69%49%
75%77%
83%65%
76%73%
83%70%
77%75%
80%75%
71%69%
82%62%
77%74%
85%71%
20
21
SURVEY POPULATIONS AND HEALTH RISKS
S3. Regular population census
2 Principles and Recommendations for Population and Housing Censuses, Revision 3. New York: United Nation; 2016
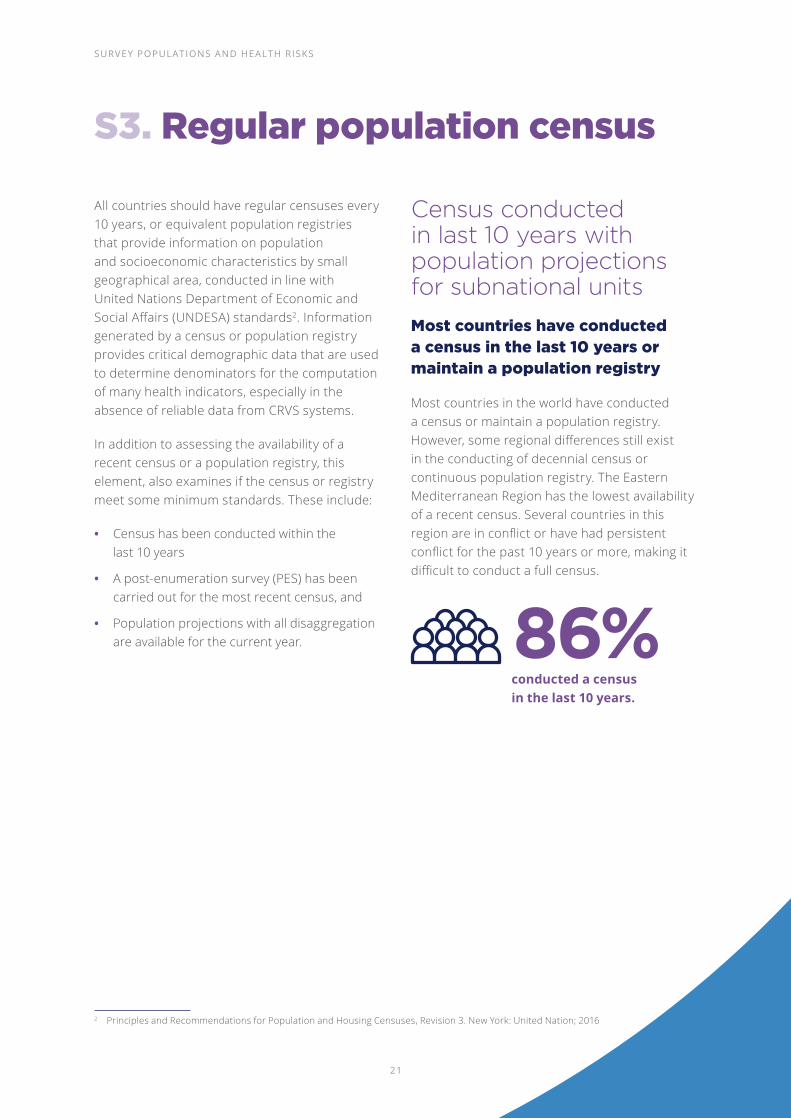
All countries should have regular censuses every 10 years, or equivalent population registries that provide information on population and socioeconomic characteristics by small geographical area, conducted in line with United Nations Department of Economic and Social Affairs (UNDESA) standards2. Information generated by a census or population registry provides critical demographic data that are used to determine denominators for the computation of many health indicators, especially in the absence of reliable data from CRVS systems.
In addition to assessing the availability of a recent census or a population registry, this element, also examines if the census or registry meet some minimum standards. These include:
• Census has been conducted within the last 10 years
• A post-enumeration survey (PES) has been carried out for the most recent census, and
• Population projections with all disaggregation are available for the current year.
Census conducted in last 10 years with population projections for subnational units
Most countries have conducted a census in the last 10 years or maintain a population registry
Most countries in the world have conducted a census or maintain a population registry. However, some regional differences still exist in the conducting of decennial census or continuous population registry. The Eastern Mediterranean Region has the lowest availability of a recent census. Several countries in this region are in conflict or have had persistent conflict for the past 10 years or more, making it difficult to conduct a full census.
conducted a census in the last 10 years.
86%

22
GLOBAL REPORT ON HEALTH DATA SYSTEMS AND CAPACITY, 2020
FIGURE S3.1 PERCENTAGE OF COUNTRIES THAT CONDUCTED AT LEAST ONE CENSUS WITHIN LAST 10 YEARS, BY WHO REGION*
0% 20% 40% 60% 100%
100%
86%
100%
96%
89%
77%
55%
Global (n=189)
SEAR (n=11)
WPR (n=21)
EUR (n=53)
AMR (n=35)
AFR (n=47)
EMR (n=22)
While availability of a census is high, countries need support in conducting quality censuses
While most countries are conducting a census, a much smaller percentage are conducting post-enumeration surveys (PES). As the PES is critical in ascertaining the degree of coverage error for the census as well as assessing item errors in
questionnaires, not conducting the PES can raise questions on the quality of the census data. Only 46% of countries with a census conducted a PES.
Disaggregated population projections are among the most important analytical outputs from the census (Figure S3.2); only 51% of countries had disaggregated population projections.
FIGURE S3.2 PERCENTAGE OF COUNTRIES THAT HAVE CONDUCTED A CENSUS IN LAST 10 YEARS WITH SELECTED ATTRIBUTES*
Census in last 10 years
Post enumeration survey done
Population projection available
Disaggregation for population projections available
*Data collected between 2018 and 2020 in 189 countries.
* Data collected between 2018 and 2020 in 189 countries.
0% 20% 40% 60% 80% 100%
86%
46%
85%
51%

23
SURVEY POPULATIONS AND HEALTH RISKS
Looking forward: policy implications
• There has been increased investment in surveys overall but it has been uneven in distribution, with some health topics well supported and others neglected. International surveys have played an important role in securing good health data
• Data disaggregation is improving but is still lacking with regard to monitoring inequality dimensions in many countries
• More investment is needed to establish a more synergized and coordinated approach to surveys which meet country needs, and ensures the relevant equality issues are captured
• Countries need a systematic and coordinated approach to population surveys
• Indicator-based surveillance (i.e. the routine reporting of cases of disease), including an early warning function, is needed to detect unusual disease patterns
• Countries need event-based surveillance and mechanisms that capture public health events from a variety of sources
• Most countries have undertaken an annual SPAR report to measure country capacity for ensuring health security, based on IHR requirements
• Censuses, including small-area identifiers, should be done every 10 years and provide comprehensive demographic data, including consideration of migrant populations, where relevant
• Ensure national capacity to produce small-area population projections based on census data
• Implementation of PES is necessary to ensure the quality of censuses
SURVEY POPULATIONS AND HEALTH RISKS
23

24
Count births, deaths and causes of deathto know who is born and what people die from
KEY ELEMENTS
C1. FULL BIRTH AND DEATH REGISTRATION
of the world’s deaths are not registered.
40%NEARLY
C2. CERTIFICATION AND REPORTING OF CAUSES OF DEATH
of reported deaths in low-income countries show causes of death.
8%ONLY

25
COUNT BIRTHS, DEATHS AND CAUSES OF DEATH
Civil registration is the continuous recording of vital events in an individual’s life (such as birth, marriage, death and cause of death). An effective CRVS system is critical for recording these events, as well as for tracking public health trends, planning interventions to improve population health and evaluating policy effectiveness.
CRVS is the optimal system for producing fertility and mortality statistics, while birth registration is the foundation of individual identity management
systems, that in many countries, provide the proof of legal identity required to access health and other services. Several health and health-related SDGs require either all-cause or cause-specific reporting of deaths. In addition, CRVS systems provide the population denominators required for the calculation of many SDG and UHC indicators. Development of a CRVS system is a fundamental responsibility of government and requires collaboration among multiple stakeholders across multiple sectors.
FIGURE C.1 PERCENTAGE OF COUNTRIES (N=133) BY COUNTRY CAPACITY TO COUNT BIRTHS, DEATHS AND CAUSES OF DEATH
37 14%Nascent
21 12%Limited
18 22%Moderate
36 32%Well-developed
21 7%Sustainable
Number of countries
Percentage of world population
28%
16%
27%
16%
14%
Percentage of countries
25

26
GLOBAL REPORT ON HEALTH DATA SYSTEMS AND CAPACITY, 2020
C1. Full birth and death registration
All countries should have a well-functioning CRVS system that registers all births and deaths, issues birth and death certificates, and compiles and disseminates vital statistics, including cause-of-death data. It may also record marriages, divorces and adoptions.
Completeness of birth and death registration
Countries are stronger at birth registration than death registration
Figure C1.1 describes country capacity to achieve complete birth and death registration, defined as having at least 90% of births or/and deaths registered. About half of the 133 countries
assessed register at least 90% of births in their countries. On the other hand, less than 40% of the countries register at least 90% of deaths in their countries.
FIGURE C1.1 PERCENTAGE OF COUNTRIES (N=133) BY CAPACITY TO ACHIEVE FULL BIRTH AND DEATH REGISTRATION
Full birth and death registration system
Completeness of birth registration
Completeness of death registration
20% 40% 60% 80%0% 100%
10% 26% 15%11% 38%
15%1%
14% 51%19%
29% 14% 5% 40%13%
Nascent: No data on birth (death) registration completenessLimited: <50%Moderate: 50-74%Well-developed: 75-89%Sustainable: ≥90%
of countries register at least 90% of births.
of countries register at least 90% of deaths.
50%
40%
ABOUT
NEARLY

27
COUNT BIRTHS, DEATHS AND CAUSES OF DEATH
Significant disparity exists, between high-and low-income countries, in registering births, deaths and causes of death
There is considerable disparity in coverage of birth registration by country income level. While over 90% of high-income countries have complete registration of births (defined as over 90% of births registered), less than 10% of low-income countries have such complete registration (Figure C1.2).
FIGURE C1.2 PERCENTAGE OF COUNTRIES (N=133), BY CAPACITY TO ACHIEVE COMPLETENESS OF BIRTH REGISTRATION AND COUNTRY INCOME GROUP
Global (n=133)
High Income (n=32)
Upper-middle income (n=34)
Lower-middle income (n=41)
Low income (n=26)
20% 40% 60% 80%0% 100%
15%
1%
3%
4% 4%
14% 19%
97%
9%
22% 20%
42% 31% 19%
24% 34%
26% 65%
51%
Nascent: No information on birth registration completenessLimited: <50%Moderate: 50-74%Well-developed: 75-89%Sustainable: ≥90%
27

28
GLOBAL REPORT ON HEALTH DATA SYSTEMS AND CAPACITY, 2020
A similar pattern is seen in death registration. Whereas more than one third of countries – predominantly high-income nations – register at least 90% of their deaths (Figure C1.3), most low-income countries either have no data, or report registration completeness below 50%.
FIGURE C1.3 PERCENTAGE OF COUNTRIES (N=133), BY CAPACITY TO ACHIEVE COMPLETE DEATH REGISTRATION AND COUNTRY INCOME GROUP
However, the relationship between income group and death registration completeness is by no means uniform. Several lower-middle-income countries have levels of death registration completeness in excess of 90%. Conversely, a number of upper-middle-income countries have death registration levels below 75%.
A number of upper-middle-income countries have death registration levels
75%BELOW
Global (n=133)
High Income (n=32)
Upper-middle income (n=34)
Lower-middle income (n=41)
Low income (n=26)
20% 40% 60% 80%0% 100%
14%29% 5% 13% 40%
6%3%
91%
9% 53%29%9%
32% 12%10%32% 15%
81% 19%
Nascent: No information on death registration completenessLimited: <50%Moderate: 50-74%Well-developed: 75-89%Sustainable: ≥90%
28

29
COUNT BIRTHS, DEATHS AND CAUSES OF DEATH
There are fewer effective incentives for the registration of deaths compared with births. For example, although some countries make death registration a condition for permission to dispose of the body, this only works in settings where burial or cremation is regulated by law and enforcement measures are applied. In some settings, such as Bangladesh, permission to dispose of a body is not required. In other jurisdictions there are local, informal ways of burying a body, including family burial plots. In Brazil, Ghana, and Liberia, for example, there are unregulated cemeteries where burials take place without any legal documentation. Elsewhere, permission to bury is given by local cemetery managers who are not required to report burial details to the civil registrar.
There is often a lack of recognition that a death certification is an important document for the family of a deceased person, in particular for children (who may be able to benefit from services for orphans) and for widows(ers) who need the death certificate in order to claim spousal pensions and benefits, as well as the right to marry in settings where monogamy is the law. In addition, a death certificate is required for surviving family members to claim inheritance or access to resources and property of the decedent.
Although incentives such as these can encourage death registration, for many people, especially the poorest, there is little to inherit following the death of a loved one and there is little understanding of how a death certificate can help establish eligibility for certain benefits. Sometimes, the family only become aware of the need for a death certificate some years after the death when legal issues arise in relation to transfer of property or land. By then, it may be too late to register the death and penalties for late registration may be a major barrier.
This situation has enabled the identification of key prerequisites of a functioning CRVS system. These prerequisites can be considered as intermediate indicators of progress and will be important in leading to improved and well-functioning CRVS systems in the future.
The following are considered important prerequisites for a strong CRVS system:
A legal framework for CRVS – adequate and enforced legislation which states that registration of births and deaths is compulsory.
Existence of a functioning CRVS intersectoral coordination mechanism
Registration Infrastructure (offices and registrars) in adequate numbers to ensure easy access for registration.
Business processes for notification and registration of births and deaths, and other vital events, that enable timely and reliable reporting.
Health sector exercises a strong role in notification of births and deaths, including causes of death.
Availability of a system for notification of births, deaths and vital events that takes place in the community (including verbal autopsy methods for reporting probable cause of death in the absence of medical certification).
Physicians that are well trained in medical certification of deaths.
Coders that are well trained in ICD mortality coding of cause of death.
Statisticians that can analyse vital events and produce vital statistics.

30
GLOBAL REPORT ON HEALTH DATA SYSTEMS AND CAPACITY, 2020
Few countries meet all recommended standards for a functioning CRVS system
In the 75 countries (covering 70% of the world population) where details were available about the cause-of-death attributes, only 20% met at least 80% of the eleven standards for a functioning CRVS system. Of the eleven standards examined, countries were most likely to be able to demonstrate they have legal frameworks, business processes, and standard operating procedures in place and that the country is fully covered with locations for citizens to register births and death, including rural and hard-to-reach areas. The standards that countries were least likely to meet included having a system
for interagency collaboration (that has oversight role, includes key stakeholders, meets regularly) and having a comprehensive electronic system for sharing information between local, regional and central locations.
FIGURE C1.4 PERCENTAGE OF COUNTRIES (N=75) THAT MEET RECOMMENDED STANDARDS FOR FUNCTIONAL CRVS SYSTEM, BY KEY INDICATORS*
of countries with cause-of-death data meet
of CRVS standards.
ONLY
20%
80%
20% 40% 60% 80%0% 100%
85%
81%
68%
61%
60%
56%
48%
47%
43%
39%
28%
20%
Legal framework
Access to registration offices
Interagency collaboration oversees CRVS planning
Interagency collaboration meets regularly
Adequate training of registrars
Data quality and analysis
Performance monitoring
Interagency collaboration includes key stakeholders
Frequency of reports
Electronic exchange of data
Formal CRVS interagency collaboration
Meets at least 80% of standards for functional CRVS system
*Recommended standards for a functional CVRS system were examined in 75 countries where reliable information was collected.

31
COUNT BIRTHS, DEATHS AND CAUSES OF DEATH
Where are the missing millions?
million babies born each year are unregistered.36
Globally, just over 70% of births each year are registered. This means that 36 million babies born each year go unregistered. Only 44% of children born in the WHO African region are registered, while birth registration completeness is highest in the European and Americas regions, where over 90% of births are registered.
Approximately 62% of deaths are registered every year. Only 10% of deaths in the African region are registered while in the European and Americas regions, over 90% of deaths are registered.
TABLE C1.1 NUMBER OF REGISTERED BIRTHS AND DEATHS BY WHO REGION*
Global AFR EMR EUR AMR SEAR WPR
Number of births 126 423 36 067 16 045 2 708 11 670 36 327 23 607
Number of registered births 90 574 15 950 11 006 2 661 11 154 28 326 21 476
Percentage of registered births 72% 44% 69% 98% 96% 78% 91%
Global AFR EMR EUR AMR SEAR WPR
Number of deaths 47 749 9 285 3 701 2 592 5 173 13 762 13 236
Number of registered deaths 29 463 921 2 033 2 535 4 718 8 390 10 866
Percentage of registered deaths 62% 10% 55% 98% 91% 61% 82%
*Based on most recent data available from 133 countries; all numbers of births and deaths are in thousands.
20% 40% 60% 80%0% 100%
85%
81%
68%
61%
60%
56%
48%
47%
43%
39%
28%
20%

32
GLOBAL REPORT ON HEALTH DATA SYSTEMS AND CAPACITY, 2020
C2. Certification and reporting of causes of death
All countries should have the capacity to generate good quality, recent mortality statistics to describe levels and trends of mortality, and identify and track changes in the burden of disease in different population groups.
Completeness of deaths with cause of death
Countries with cause-of-death completeness greater than 90% are almost all high or upper-middle income countries
While high-income countries record cause of death for 95% of their reported deaths, low-income countries only record cause of death for 8% of their reported deaths.
FIGURE C2.1 PERCENTAGE OF DEATH REGISTRATION WITH CAUSES OF DEATH AMONG ALL DEATH REGISTRATION, BY COUNTRY INCOME GROUP*
of reported deaths.
Low-income countries record cause of death in
ONLY
8%
20% 60%40% 80%0% 100%
95%
58%
78%
26%
8%
Global (n=94)
High income (n=31)
Upper-middle income (n=31)
Lower-middle income (n=28)
Low income (n=4)
*Data are from 94 out of 133 countries that have death registration information.

33
COUNT BIRTHS, DEATHS AND CAUSES OF DEATH
FIGURE C2.2 PERCENTAGE OF COUNTRIES (N=133), BY CAPACITY TO REGISTER CAUSE OF DEATH, AND COUNTRY INCOME GROUP
Distribution of countries, by level of capacity and country income group
Nascent Limited Moderate Well-developed Sustainable Total
High income 0 1 0 4 27 32
Upper-middle income 4 1 6 10 13 34
Lower-middle income 18 11 4 3 5 41
Low income 18 6 0 0 2 26
Global 40 19 10 17 47 133
There are 47 countries where the percentage of death registration with cause of death is higher than 90%. More than 85% of these 47 countries are in upper-middle-income and high-income groups. Less than 15% are in lower-middle- income and low-income groups. (Figure C2.2).
of countries that have causes of death for
85%
90%or more of their registered deaths are upper-middle or high-income countries.
Global
High income
Upper-middle income
Lower-middle income
Low income
20% 40% 60% 80%0% 100%
8%23%69%
27%44% 10% 7% 12%
8%14% 13% 35%30%
29% 38%18%12%3%
84%13%3%
Nascent: No standardised systemLimited: <30% of deaths medically certifiedModerate: 30-69% of deaths medically certifiedWell-developed: 70-89% of deaths medically certifiedSustainable: ≥90% of deaths medically certified

34
GLOBAL REPORT ON HEALTH DATA SYSTEMS AND CAPACITY, 2020
Quality of cause-of-death data
Quality of cause-of-death data is problematic in many countries
Even when deaths are medically certified by a physician, there can be quality problems that limit the usefulness of the cause-of-death information. The quality of cause-of-death information can be improved using international standards to correctly code cause of death. The International Classification of Diseases 10th
revision (ICD-10) is a standardized classification of diseases that allows causes of death to be comparable across time and across populations. Standardized cause- of-death information helps inform public health decisions and equips policymakers to prioritise health challenges and investments and monitor progress.
Ensuring that deaths are medically certified and coded reliably is a particular challenge in countries where most deaths occur outside of health facilities. In such cases, verbal autopsies can provide information on probable cause of death. A verbal autopsy is where a trained interviewer uses a questionnaire to collect information about the signs, symptoms, and demographic characteristics of a recently deceased person from an individual familiar with the deceased and translates this information into a probable cause of death.
Only 28% of countries have less than 10% ill-defined cause-of-death codes. While around 50% of high-income countries have less than 10% ill-defined cause-of-death codes, about a third of lower-middle income and low income-countries do not use ICD-10 to code causes of death and therefore do not have quality cause-of-death data.
FIGURE C2.3 PERCENTAGE OF COUNTRIES, BY QUALITY OF DEATH REGISTRATION AND COUNTRY INCOME GROUP*
Global (n=94)
High income (n=31)
Upper-middle income (n=31)
Lower-middle income (n=28)
Low income (n=4)
20% 40% 60% 80%0% 100%
28%24%19%12%17%
55%32%13%
13%16%
36%
13% 29%29%
32%18%
25% 50% 25%
14%
*Data are from 94 out of 133 countries that have death registration information.
Nascent: No dataLimited: ≥30% ill-defined or unknown causesModerate: 20-29% ill-defined or unknown causesWell-developed: 10-19% ill-defined or unknown causesSustainable: <10% ill-defined or unknown causes

35
COUNT BIRTHS, DEATHS AND CAUSES OF DEATH
Looking forward: policy implications
This global snapshot of CRVS systems suggests significant room for improvement, however, the examination of completeness of registration is the end stage of a process and ignores progress that is already taking place further “upstream” by many governments that are investing in CRVS systems. Policymakers in a number of low- and middle-income countries have taken bold steps to strengthen their national CRVS systems – steps that have led to greatly improved birth and death registration coverage and cause-of-death data. Nevertheless:
• Accurate information on births, deaths and causes of death is essential for health policymakers to prioritise health challenges, guide investments and ensure optimal resource allocation
• Civil registration records are the best source of vital statistics needed for tracking progress towards achieving national and international health targets: the ability to monitor progress towards achievement of the SDGs will be strongly influenced by the availability of comprehensive Civil Registration and Vital Statistics systems
• The key to a strengthened CRVS system is improved governance, improved notification processes, capacity building, the establishment of collaborative partnerships that involve stakeholders from across government sectors and capacity building for certification of death and ICD mortality coding
• WHO is investing in strengthening CRVS systems and has developed the WHO CRVS Strategy and Implementation Plan 2020-2023. This aims to empower Member States to more effectively mobilize their health sector to lead CRVS system strengthening efforts in order to ensure maximum benefit from routine data systems for policy and development
• WHO is also collaborating with many partners and donors to accelerate CRVS system strengthening through the Health Data Collaborative (HDC) platform which was established in 2017. The HDC platform aims to ensure alignment of investments and activities of CRVS partners and donors
35

36
Optimize health service datato ensure equitable, quality services for all
KEY ELEMENTS
O1. ROUTINE FACILITY REPORTING SYSTEM WITH PATIENT MONITORING
of countries report subnational facility data on severe mental health disorders.
31%O2. REGULAR SYSTEM TO MONITOR
SERVICE AVAILABILITY, QUALITY AND EFFECTIVENESS
of countries have limited or less capacity for systematic monitoring quality of care.
50%ALMOST
O3. HEALTH SERVICE RESOURCES: HEALTH FINANCING AND HEALTH WORKFORCE
of countries report public health expenditures.
89%
ONLY

37
OPTIMIZE HEALTH SERVICE DATA
Health service data are generated through many data subsystems, including routine facility and community reporting systems, health facility surveys and various health resource data systems such as health workforce and health financing information systems.
These subsystems should ideally be integrated or interoperable to facilitate comprehensive analysis of health services to support patient management, facility management, disease surveillance, sector planning, monitoring and management at all levels. Data generated in health facilities contribute to a number of health SDG and UHC monitoring indicators.
FIGURE O.1 NUMBER AND PERCENTAGE OF COUNTRIES (N=133), COUNTRY POPULATION AS A PERCENTAGE OF WORLD POPULATION, BY CAPACITY TO OPTIMIZE HEALTH SERVICE DATA
of participating countries have sustainable capacity to optimize health service data.
ONLY
4%
20%
2%
43%
32%
4%
3 1%Nascent
26 4%Limited
57 17%Moderate
42 62%Well-developed
5 3%Sustainable
Number of countries
Percentage of world population
Percentage of countries
37

38
GLOBAL REPORT ON HEALTH DATA SYSTEMS AND CAPACITY, 2020
O1. Routine facility reporting system with patient monitoring
Data routinely reported by health facilities are not fully representative of population health and they may be incomplete or of uneven quality. Nonetheless, these data have several advantages over those collected through surveys and special studies. They are available close-to-real-time and they are available for every service delivery unit. As such, these data can be used for client/patient management, health service management at facility and higher levels and disease surveillance. Data generated by health facilities contribute to the monitoring of a number of health SDG and UHC indicators, including tuberculosis incidence and treatment success, malaria incidence, coverage of essential health services (UHC tracer indicators with facility data component), percentage of people living with HIV currently receiving antiretroviral therapy and hospital beds per capita.
Availability of key indicators derived from facility data
More action needed to strengthen routine facility reporting - only selected diseases or areas measured
The limitations of the data routinely reported by health facilities are well recognized, including the lack of comprehensive representation of a population’s health, data incompleteness, and low data quality. Nonetheless, these data have a couple of advantages over data from other sources: they are available close-to-real-time and they are available for every service delivery unit.
Results from the examination of a set of tracer indicators collected show that many health issues are being tracked nationally but these results vary greatly between indicators. Examining availability of data from 2013 onwards show high availability of data for HIV, TB and immunization but lower availability for the other tracer indicators (Figure O1.1).
This high availability of data for HIV, TB and immunization reflects the impact of many years of intensive support for these programmes through large funding mechanisms, including support for monitoring and reporting. Other indicators do not benefit from the same type of support, and this shows in the results. Less than 50% of countries can demonstrate data availability for mental health, for example.
due to unevenly resourced health programmes.
DATADISPARITY EXISTS

39
OPTIMIZE HEALTH SERVICE DATA
Measuring inequality in service delivery is critical, yet countries often don’t report disaggregated data
Disaggregation of programme data allows planners and programme managers to assess inequality in the delivery of services and treatment outcomes.
Access to, and availability of, services can vary in different parts of the country or be different for men, women and different age subgroups. Where relevant, it is also important to disaggregate data by appropriate population subgroups to determine the magnitude and patterns of inequality in the delivery of health services.
FIGURE O1.1 PERCENTAGE OF COUNTRIES (N=133) WITH DATA MEASURING FACILITY-BASED INDICATORS*
National Subnational
Tuberculosis treatment success rates
Diphtheria-tetanus-pertussis (DTP)/Penta3
Antiretroviral therapy (ART) coverage
Outpatient department (OPD) visits
Hospital admission/discharge rate by diagnosis
Low birth weight prevalence among institutional births
Institutional maternal mortality ratio
New cancer diagnosis by type
Hospital deaths by major diagnostic category (use ICD)
Surgical interventions by type
Severe mental health disorders
20% 40% 60% 80%0% 100%
59,4%
97%83%
92%
84%70%
80%66%
74%51%
72%54%
68%44%
60%46%
50%38%
48%31%
98%sub-national not applicable
sub-national not applicable

40
GLOBAL REPORT ON HEALTH DATA SYSTEMS AND CAPACITY, 2020
In Figure O1.1, the disaggregated data is examined for a set of 10 indicators among the countries that collect data at national level. Data disaggregation is most commonly available at subnational level; however, for four indicators,
only less than 50% of countries have data disaggregated at subnational level, respectively. When looking at sex and age, for eight indicators, the percentages of countries are all under 50% (Figure O1.2).
FIGURE O1.2 PERCENTAGE OF COUNTRIES (N=133) REPORTING DISAGGREGATED FACILITY DATA, BY SELECTED INDICATORS*
Sex AgeSubnational
Diphtheria-tetanus-pertussis (DTP)/Penta3
Antiretroviral therapy (ART) coverage
Outpatient department (OPD) visits
Hospital admission /discharge rates by diagnosis
Institutional maternal mortality ratio
Low birthweight prevalence among institutional births
Hospital deaths by major diagnostic category (use ICD)
New cancer diagnosis by type
Surgical interventions by type
Severe mental health disorders
20% 40% 60% 80%0% 100%
83%
84%80%
70%
sub-national not applicable
38%45%
sex not applicableage not applicable
38%65%
42%
44%49%
44%
45%36%
38%
38%20%20%
31%26%26%
age not applicable
51%25%
54%
age not applicablesex not applicable

41
OPTIMIZE HEALTH SERVICE DATA
Good data quality practices produce reliable data
Where countries collect facility-based data, the quality of these data are often not assured. There should be documented processes for checking the completeness, consistency and accuracy of the data and adjustment of the statistics based upon such findings; however, fewer than one-in- five countries reported having comprehensive
systems of documented quality checks for facility data in both primary care facilities and hospitals. Over 40% (42% in primary care facilities and 45% in hospitals, Figure O1.3) either do not have data quality checks or could not provide any documentation about the process. The representativeness and reliability of the facility data is highly dependent upon the completeness of reporting from facilities, which varies by facility type (Figure O1.4).
FIGURE O1.3 PERCENTAGE OF COUNTRIES (N=133) WITH DOCUMENTATION ON QUALITY CHECKS FOR HEALTH FACILITY DATA, BY FACILITY TYPE
FIGURE O1.4 PERCENTAGE OF COUNTRIES (N=133) THAT REPORT FACILITY DATA WITH DOCUMENTATION, BY FACILITY TYPE
20% 40% 60% 80%0% 100%
42% 39% 19%
45% 36% 19%
Primary care facilities
Hospitals
None or unknown Partial Comprehensive
Primary care facilities
Public hospitals
Private hospitals20% 40% 60% 80%0% 100%
27% 12%5%
34% 52%12%2%
54% 20% 16%9%
56%
<25%No documentation available 25-75% >75%
41

42
GLOBAL REPORT ON HEALTH DATA SYSTEMS AND CAPACITY, 2020
O2. Regular system to monitor service availability, quality and effectiveness
1 Evans DB, Hsu J, Boerma T. Universal health coverage and universal access. Bull World Health Organ 2013; 91: 546-546A http://dx.doi.org/10.2471/BLT.13.125450 pmid: 23940398.2 O’Neill K, Takane M, Sheffel A, Abou-Zahr C, Boerma T. Monitoring service delivery for universal health coverage: the Service Availability and Readiness Assessment. Bull World Health Organ. 2013 Dec 1;91(12):923-31. doi: 10.2471/BLT.12.116798. Epub 2013 Sep 30. PMID: 24347731; PMCID: PMC3845262.
Universal access to quality services is a necessary precondition to achieving universal health coverage1. Hence, the importance of a system for monitoring service availability and readiness2 as well as the quality and effectiveness of care. Countries are at different levels of monitoring quality of care: at the simplest level, facility assessments can be used to capture information that is not routinely reported, such as availability of essential equipment, supplies and human resources; compliance with clinical guidelines; quality of care; and client experience. Facility assessments are also used to validate data reported through the routine system. More mature systems, present in many high-income countries, involve accreditation.
Well-established system to independently monitor health services
Quality health services are critical yet, systematic assessment still a challenge
All countries should have in place an independent, objective, comprehensive system for external review, through to regularly monitoring health service availability, readiness, quality and effectiveness. Findings were interpreted in terms of maturity levels which assumes that, as health systems mature, monitoring of health service availability and readiness will evolve to regular independent monitoring of quality of care.
of countries have limited or less capacity for systematic monitoring quality of care.
ALMOST
50%

43
OPTIMIZE HEALTH SERVICE DATA
FIGURE O2.1 PERCENTAGE OF COUNTRIES (N=133) THAT HAVE A REGULAR SYSTEM TO MONITOR SERVICE AVAILABILITY, QUALITY AND EFFECTIVENESS
Quality of care is critical to achieve effective universal health coverage. Globally, almost 50% of the countries had limited capacity to monitor quality of care (Figure O2.1). The majority of high-income countries demonstrated comprehensive and regular monitoring of quality of care based
upon a system of accreditation. However, this was not the case with countries in other income levels where a large percentage of countries demonstrated no, or limited, capacity to monitor quality of care.
Standards and methods for assessing the quality of health services
A service is available if it is offered by a health facility. A health facility is ready to offer the service if it has the trained staff, diagnostic capacity and medicines required to provide the service. Availability, readiness and quality of care can either be measured through independent facility surveys or through a system of accreditation.
WHO’s Service Availability and Readiness Assessment (SARA) has been used to assess availability and readiness at a representative sample of health facilities. Other health facility survey methodologies (e.g. Service
Provision Assessment (SPA), Service Delivery Indicator (SDI) survey, the Harmonized Health Facility Assessment (HHFA) go beyond assessment of readiness to more robustly assess the quality of services.
Accreditation is a systematic process of review that requires health facilities to recurrently demonstrate their ability to meet official standards, unlike a survey approach, which typically assesses a sample of availability and readiness. At a more mature stage, health systems should introduce monitoring of the quality of services, based either upon appropriately designed facility surveys or a system of accreditation of all health facilities.
Global (n=133)
High Income (n=32)
Upper-middle income (n=34)
Lower-middle income (n=41)
Low income (n=26)
Nascent Limited Moderate Well-developed Sustainable
20% 40% 60% 80%0% 100%
26% 24% 8% 10% 33%
63%6%6%6%19%
32%
32%
15% 38% 12% 19% 15%
37% 5% 7% 20%
15% 9% 9% 35%

44
GLOBAL REPORT ON HEALTH DATA SYSTEMS AND CAPACITY, 2020
O3. Health service resources: health financing and health workforce
All countries should have comprehensive databases for tracking health financing and human resources for health. Systems of national health accounts (NHA) and national health workforce accounts (NHWA) should be maintained according to international standards.
Availability of latest data on national health expenditures
The aim of having a sustainable method to track health expenditures is for all countries to systematically measure the flow of funds in their health system using NHA, based on international standards. An electronic system for tracking public expenses at all levels of government is desirable to enable effective monitoring of subnational health expenditures.
NHAs provide national decision-makers with essential financial information to inform policy choices, budgetary planning and resource allocation and to monitor accountability. NHA information includes: the share of health expenditure within an economy, the financial burden of health spending on households, the magnitude of external financing in health expenditure and the share of spending on different levels of care (e.g. hospitals, primary care facilities) and on different diseases or conditions.
NHAs are produced using the System of Health Accounts (SHA) 2011, an internationally recognized methodology that tracks the flow of expenditures in the health system. The SHA generates consistent, comprehensive data on all
health spending in a country, providing a common framework for enhancing comparability of health expenditure data over time and among countries.
Over 40% of countries are not tracking catastrophic health expenditures – a fundamental measure of UHC
The SHA provides a framework for examining public and private health expenditures, based on a set of international standards. While almost 90% and 80% of countries have tracked public and private health expenditures, respectively, in the last five years, they are not always tracked according to international standards. Approximately, only 60% of countries have tracked public and private health expenditures according to international standards, such as SHA, since 2013. However, tracking of catastrophic spending is lower overall, with only 56% of countries doing any tracking, and only 32% meeting SCORE standards (Figure O3.1). Data that is not based on standards is difficult to compare within a country across time and between countries. Higher-income countries are more likely to be collecting expenditure data according to the standards. There is both the need to increase the tracking of catastrophic health expenditures and the need to use international standards for the collection of public, private and catastrophic expenditures.
of countries report public health expenditures.
89%

45
OPTIMIZE HEALTH SERVICE DATA
FIGURE O3.1 PERCENTAGE OF COUNTRIES (N=133) THAT COLLECT EXPENDITURE DATA, BY TYPE OF EXPENDITURE AND COUNTRY INCOME GROUP
3 Working for health and growth: investing in the health workforce. Report of the High-Level Commission on Health Employment and Economic Growth. Geneva: World Health Organization; 2016.
Annual data on health worker density and distribution
Health workers are the backbone of strong, resilient health systems. UHC and any guarantees of global health security are only possible with investments targeting inequities in access to skilled health workers within countries (between urban and rural areas and between public and
private sectors). Given the importance of placing sustained focus on achieving intra-country equity, countries should disaggregate data to inform policy-making on the density and distribution of the health workforce3. The implementation of NHWAs provides a systematic and progressive approach to the improvement in the availability and quality of human resources data.
Any public health expenditure
Public health expenditure based on
International standards
Any private health expenditure
Any private health expenditure based on
International standards
Any catastrophic spending
Catastrophic spending based on International
standards
20% 40% 80%60%0% 100%
91%89%
94%93%
73%
78%84%
82%80%
62%
75%71%
54%31%
63%50%
66%42%
56%32%
24%12%
75%74%
51%35%
59%
59%
56%
32%
High income Upper-middle income Lower-middle income Low incomeGlobal Average

46
GLOBAL REPORT ON HEALTH DATA SYSTEMS AND CAPACITY, 2020
Only 55% of countries provide disaggregated data on the health workforce by subnational units
Five health workforce occupations were the focus of the data availability assessment: Physicians, pharmacists, dentists, nurses and midwives. While 71% of the 133 countries surveyed had capacity to report aggregate data on the five occupations combined nationally (Figure O3.2), the same was not the case in terms of the recommended disaggregation (namely by age,
sex, subnational and managing authority (public or private)). When examining all five occupations combined, 55% of countries have sub-national data, 39% have data on age, 43% have data on sex and 34% report data on managing authority (by public/private sector). These subtle differences in the availability of disaggregated data for the health workforce distribution limits the development of effective plans and policies at the national and subnational level.
FIGURE O3.2 PERCENTAGE OF COUNTRIES (N=133) THAT REPORT HEALTH WORKFORCE DENSITY AND DISTRIBUTION, BY OCCUPATION
Subnational
Physicians
Pharmacists
Dentists
Nurses
Midwives
National Age Sex Private/public
20% 40% 60% 80%0% 100%
95%58%
65%76%
46%
88%45%
51%66%
44%
86%44%
50%64%
44%
94%56%
62%73%
46%
78%41%
48%62%
40%
71%39%
43%55%
34%
Five occupations combined

47
OPTIMIZE HEALTH SERVICE DATA
Some key indicators of a functional human resources information system (HRHIS) were assessed in 65 countries (Figure O3.3). Although a high proportion of these countries were able to meet some of these key criteria in their reporting, only 29% of the 65 countries met 80% or more of the standards required for a functional HRHIS. In implementing NHWAs, countries can progressively improve their data reporting on many aspects which are reflected by these indicators.
FIGURE O3.3 PERCENTAGE OF COUNTRIES (N=65) THAT MEET ACCEPTED STANDARDS FOR A FUNCTIONAL NATIONAL HRHIS, BY KEY INDICATORS*
Subnational level data of active health workers
Demographic distribution of active health workers
Number of graduates from education and training institutions
Number of active stock (people) on the labour market
Number of entrants to the labour market
Information on foreign-born and/ or foreign-trained health workers
Number of exits from the labour market
Meets at least 80% of the standards for functional HRHIS system
20% 40% 60% 80%0% 100%
80%
77%
68%
66%
57%
43%
40%
29%
*The standards for a functional national human resources information system (HRHIS) are examined in 65 countries where reliable information was collected.
47

48
GLOBAL REPORT ON HEALTH DATA SYSTEMS AND CAPACITY, 2020
Looking ahead: policy implications
Data from health facilities and health resources data are essential for management of health services and a key requirement for monitoring progress towards UHC. Some key policy implications that emerge include:
• Standards need to be promoted for country statistical reports to specify the completeness of data and describe processes for data quality assurance
• Standards need to be reinforced for annual publication of core health statistics based upon routine health data. To meet the need for policy, planning and management, these statistics need to be recent and appropriately disaggregated (by geographic region, sex and age subgroups). Methods for assuring the quality of data must be adequately described in statistical reports and any limitations noted
• Based on the models established for reporting on immunization and care for TB and HIV, global support needs to be extended to tracking the delivery of essential services (antenatal and delivery care, mental health care, cardiovascular disease care, cancer diagnoses, etc) as well as for monitoring health system utilization (outpatient visits, admissions, major surgeries)
• For many countries there is a pressing need to strengthen the monitoring of quality of care. Where practical, accreditation programmes could be taken to scale and better documented – particularly for
middle-income countries which may have the resources to adopt such an approach. Nationally representative health facility assessments provide an interim strategy for monitoring service availability, readiness and quality. However, most countries employing this strategy need to conduct such surveys more regularly which will necessitate the mobilization of considerably more resources
• Countries should develop a harmonized programme for health facility surveys, based on international standards and adapted to country context and needs, that reduces duplication and includes details on content, funding and execution as part of the monitoring and evaluation plan of the national health sector
• Standards need to be reinforced for the dissemination of basic information on the health workforce. Statistics for the previous year should be published annually with disaggregation by health district. Global advocacy and aligned investments, particularly through supporting the NHWA implementation in countries, will build country capacity to strengthen existing HRH information systems (and subsystems that belong to professional associations and the private sector) to produce timely, disaggregated quality data needed to address complex policy questions for health workforce development
GLOBAL REPORT ON HEALTH DATA SYSTEMS AND CAPACITY, 2020
48

49
OPTIMIZE HEALTH SERVICE DATA
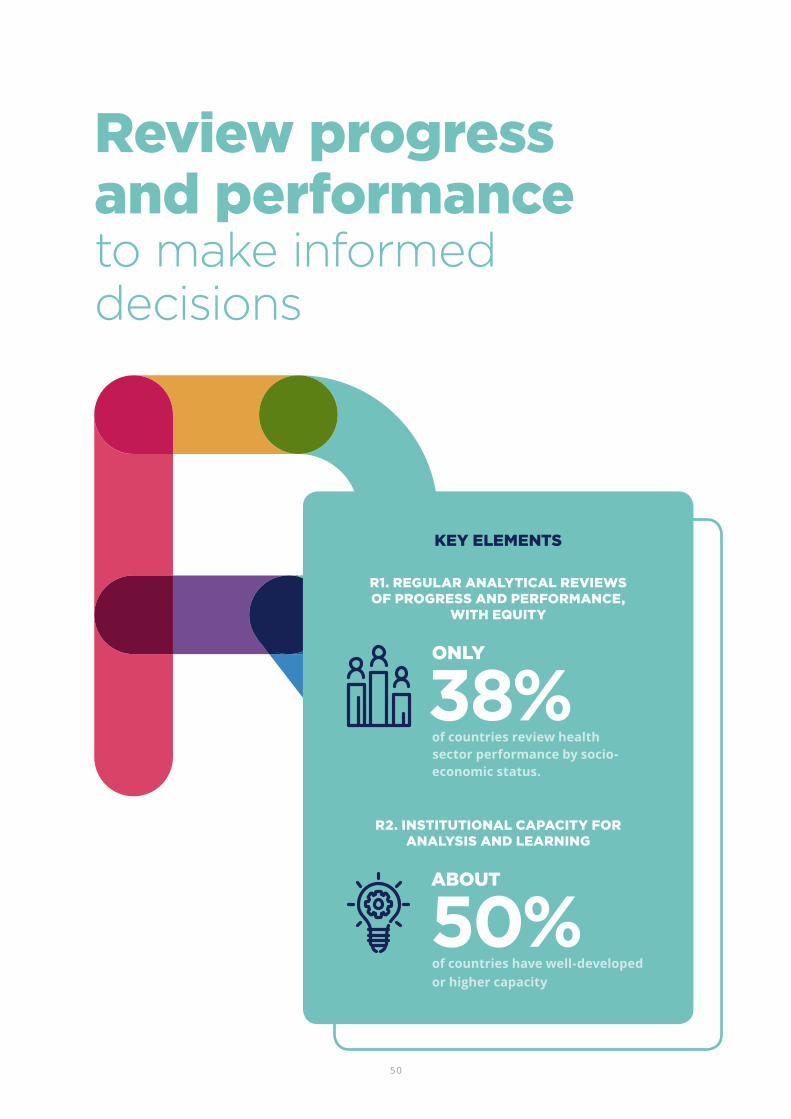
50
Review progress and performanceto make informed decisions
KEY ELEMENTS
R2. INSTITUTIONAL CAPACITY FOR ANALYSIS AND LEARNING
R1. REGULAR ANALYTICAL REVIEWS OF PROGRESS AND PERFORMANCE,
WITH EQUITY
of countries review health sector performance by socio-economic status.
38%ONLY
of countries have well-developed or higher capacity
50%ABOUT

51
REVIEW PROGRESS AND PERFORMANCE
The use of data and information for periodic health sector progress and performance reviews is critical to understanding what is working and what is not working. The output of a review process (based on standards and including the highest-possible quality data and indicators) will support decision-making at all levels and help generate consensus on where action is needed, including guiding resource allocation. Assessing equity dimensions, system performance against targets, and enablers and barriers to effective access to, and utilization of, health care services are key components of a review.
Progress and performance reviews are part of national and local governance mechanisms, and scorecards or dashboards are tools that have tremendous potential for regular annual or more frequent assessment of progress. Mid-term and end-of-plan reviews are also common and should be more extensive. The results
of these analyses are interpreted in the light of national strategies, plans and policies and take into account international developments as well as contextual changes. Engagement of national academic, public health and research institutions will foster broader institutional capacity to improve the analysis and use of health-related data.
Within the SCORE intervention, “Review progress and performance”, there are two elements:
1. regular analytical reviews of progress and performance, with equity, and
2. institutional capacity for analysis and learning.
Overall, 60% of countries demonstrated well-developed or higher capacity for this intervention (Figure R.1).
FIGURE R.1 NUMBER AND PERCENTAGE OF COUNTRIES (N=133), COUNTRY POPULATION AS A PERCENTAGE OF WORLD POPULATION, BY CAPACITY TO REVIEW PROGRESS AND PERFORMANCE IN HEALTH SECTOR
6 0%Nascent
10 1%Limited
37 10%Moderate
44 21%Well-developed
36 55%Sustainable
Number of countries
percentage of world population
5%
17%
28%
33%
27%
Percentage of countries

52
GLOBAL REPORT ON HEALTH DATA SYSTEMS AND CAPACITY, 2020
R1. Regular analytical reviews of progress and performance, with equity
Countries should assess and monitor progress and performance of their NHSP, including the extent to which equity in access to, and availability of, health care has been achieved. Health sector performance assessments should adhere to international standards for content and rigor, and lead to action to improve performance towards targets. Essential elements for performance assessments include the use of multiple data sources (for example, routine health information system data as well as periodic population-based surveys, and CRVS, etc.). They should assess progress against targets for core health indicators, and assess coverage and access with regard to equity (sex, across socioeconomic strata, and subnational units). It should include an assessment of efficiency by comparing progress relative to expenditures. Finally, it should compare progress towards targets among different types of health care providers (that is hospitals vs. primary health care units) and among different subnational units to identify well performing and poorly performing areas of the country. Finally, comparisons should be made for national results against the performance of similar countries (external comparison).
Inequality analyses are critical in health systems review, yet only 38% countries include disaggregated data by socio-economic status
While most countries (91%) have produced an analytical report of the health sector strategy within the last 5 years, only 25% of countries had reports that met at least 80% of recommended standards (Figure R1.1). Common aspects that were lacking included comparative analyses (comparisons with similar countries) and subnational rankings (for example, comparisons of performance between districts within the same country). Measures of inequality, particularly socioeconomic, also were lacking; comparisons of health sector performance among different socioeconomic strata were included in only 38% of surveyed countries, while comparisons of health sector performance for men and women were included in 56% of countries and subnational administrative units (70%) were included more often.
ONLY
of countries report inequality measurement by sex.
56%

53
REVIEW PROGRESS AND PERFORMANCE
FIGURE R1.1 PERCENTAGE OF COUNTRIES (N=133) THAT REGULARLY PUBLISH ANALYTICAL REPORTS IN COMPLIANCE WITH RECOMMENDED STANDARDS, BY KEY INDICATORS
Analytical report published in last 5 years
All data sources used
Shows progress against target
Inequality - subnational
Links findings to policy
Linking performance to health inputs
Inequality - sex
Performance of hospitals included
Subnational rankings
Inequality - socioeconomic
Comparative analysis
20% 40% 60% 80%0% 100%
91%
85%
74%
70%
67%
59%
56%
53%
40%
38%
23%
of countries measure progress against targets.
70%MORE THAN
53
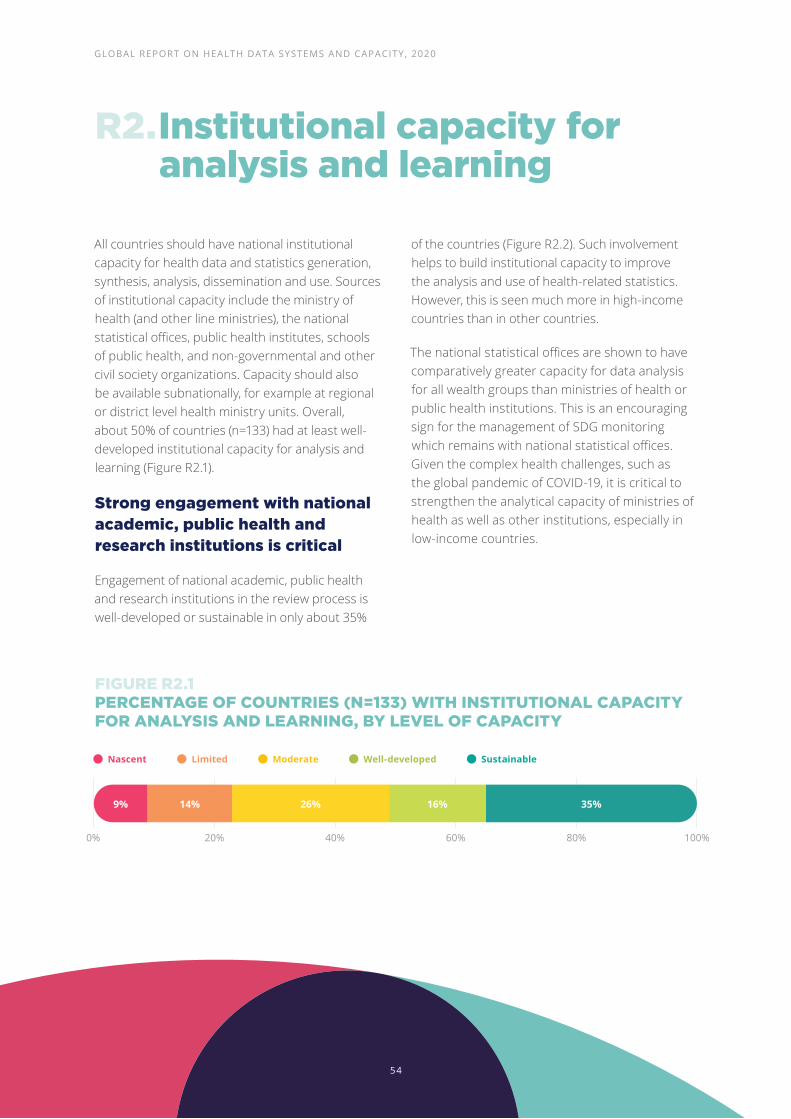
54
GLOBAL REPORT ON HEALTH DATA SYSTEMS AND CAPACITY, 2020
R2. Institutional capacity for analysis and learning
All countries should have national institutional capacity for health data and statistics generation, synthesis, analysis, dissemination and use. Sources of institutional capacity include the ministry of health (and other line ministries), the national statistical offices, public health institutes, schools of public health, and non-governmental and other civil society organizations. Capacity should also be available subnationally, for example at regional or district level health ministry units. Overall, about 50% of countries (n=133) had at least well-developed institutional capacity for analysis and learning (Figure R2.1).
Strong engagement with national academic, public health and research institutions is critical
Engagement of national academic, public health and research institutions in the review process is well-developed or sustainable in only about 35%
of the countries (Figure R2.2). Such involvement helps to build institutional capacity to improve the analysis and use of health-related statistics. However, this is seen much more in high-income countries than in other countries.
The national statistical offices are shown to have comparatively greater capacity for data analysis for all wealth groups than ministries of health or public health institutions. This is an encouraging sign for the management of SDG monitoring which remains with national statistical offices. Given the complex health challenges, such as the global pandemic of COVID-19, it is critical to strengthen the analytical capacity of ministries of health as well as other institutions, especially in low-income countries.
FIGURE R2.1 PERCENTAGE OF COUNTRIES (N=133) WITH INSTITUTIONAL CAPACITY FOR ANALYSIS AND LEARNING, BY LEVEL OF CAPACITY
20% 40% 60% 80%0% 100%
9% 14% 26% 16% 35%
Nascent Limited Moderate Well-developed Sustainable
54

55
REVIEW PROGRESS AND PERFORMANCE
FIGURE R2.2 PERCENTAGE OF COUNTRIES (N=133) WITH INSTITUTIONAL CAPACITY OR INVOLVEMENT IN DATA ANALYSIS, BY COUNTRY INCOME GROUP
Strong capacity at national statistical offices
Strong capacity at national MoH
Strong subnational capacity in MoH or
independent institutions
Strong involvement from public health
institutions
of countries have strong capacity at national ministry of health.
42%
20% 40% 60% 80%0% 100%
53%72%
41%46%
54%
56%44%
24%50%
34%29%
20%23%
50%38%
24%31%
42%
26%
35%
High income Upper-middle income Lower-middle income Low incomeGlobal Average
55

56
GLOBAL REPORT ON HEALTH DATA SYSTEMS AND CAPACITY, 2020
Looking forward: policy implications
• While the vast majority of countries are conducting regular health sector performance reviews, the reviews are not always of the highest quality, often missing important elements to promote equity
• Comparisons of health sector performance by socioeconomic strata, sex, and subnational units can help identify underperforming areas, improve access and uptake of services among disadvantaged groups, thereby enhancing equity in health service delivery
• Countries should make efforts to reform the processes and content of health sector performance reviews and ensure the inclusion of these essential elements
• Institutional capacity for data analysis needs to focus on two fronts:
1. It is essential to foster collaborations with private entities such as public health institutes, universities, and non-governmental organizations to support the review process
2. In addition, there is critical need to improve the institutional capacities of ministries of health to face complex health challenges
GLOBAL REPORT ON HEALTH DATA SYSTEMS AND CAPACITY, 2020
56

57
REVIEW PROGRESS AND PERFORMANCE

58
Enable data use for policy and actionto accelerate improvement in health
KEY ELEMENTS
E1. DATA AND EVIDENCE DRIVE POLICY AND PLANNING
of countries include health system strength analysis in strategic plans.
40%
E2. DATA ACCESS AND SHARING
of countries update their global health portal more than once a year.
25%E3. STRONG COUNTRY-LED
GOVERNANCE OF DATA
of countries have an M&E plan and a national eHealth strategy.
74%

59
ENABLE DATA USE FOR POLICY AND ACTION
An enabling environment is critical for ensuring the effective use of health data, the bedrock of sound national health service plans. Accessible, credible data from multiple sources must be made available to a broad group of users to improve health system performance. This user group include decision-makers at all levels, health service funders and implementers, academic institutions, the media and the public. It must also be accessible to those who hold the government accountable.
WHO Delivery for Impact (DFI) Knowledge Hub
• The DFI Knowledge Hub is, focused on supporting country-level implementation efforts to accelerate progress towards the Triple Billion targets1.
• The programme is based on a hybrid learning model including webinars, workshops, 1:1 facilitator-led sessions, and independent and group work.
• The online learning portal will also allow participants to review delivery content, download key tools, take self-guided courses, and interact with their peer community and network of participating countries.
1 World Health Organization. Thirteenth General Programme of Work, 2019–2023. 2019. Geneva.2 Thirteenth General Programme of Work (GPW13): methods for impact measurement. Geneva: World Health Organization; 2020.
• The DFI Knowledge Hub was launched with eight countries, ensuring representation from all WHO regions - Ethiopia, Mauritius, Oman, Pakistan, Paraguay, Philippines, Sri Lanka, and Ukraine. The programme is organized around Country Teams comprised of priority leads and project members in charge of implementation. Each team includes representation from the Member State governments, regional offices, and country offices.
• The “Delivery of the Triple Billion” WHO Academy course will further promote an impact-focused culture by explicitly linking country implementation plans and efforts to the WHO GPW 13 (Thirteenth General Programme for Work) impact measures and strategy2.
Mechanisms that enable data use include:
• sound health sector strategic plans which include a plan for monitoring and evaluation,
• annual high-quality statistical reports with priority analyses
• national health observatories or portals that are easy to access and use and contain relevant content,
• and an open and transparent policy on data access.
Policy-relevant data analyses, evidence synthesis and structured expert review processes are needed to translate this knowledge to inform policy-making and legislative proposals, and to enable monitoring of progress towards UHC and the HRSDGs.

60
GLOBAL REPORT ON HEALTH DATA SYSTEMS AND CAPACITY, 2020
Overall, about 30% of 133 countries have well-developed or higher capacity for this intervention. For the key element “Data and evidence drive policy and planning”, almost 60% of countries have well-developed or higher capacity,
compared to 42% for “Data access and sharing”; capacity for “strong country-led governance of data” was the least developed among the three elements – only 25% of countries were found to have well-developed or higher capacity.
FIGURE E.1 PERCENTAGE OF COUNTRIES (N=133) WITH CAPACITY TO ENABLE DATA FOR POLICY AND ACTION, BY KEY CAPACITY ELEMENTS
Nascent Limited Moderate Well-developed Sustainable
0% 20% 40% 60% 80% 100%
8%
6% 14% 21% 42% 17%
18%24%16%18%24%
21% 26% 28% 17% 8%
22% 38% 27% 5%
Data and evidence drive policy and
planning
Data access and sharing
Strong country-led governance of data
Overall Capacity
60

61
ENABLE DATA USE FOR POLICY AND ACTION
E1. Data and evidence drive policy and planning
All public health policies and planning should be driven by data and evidence. Governments at all levels need data to budget and allocate resources, and monitor and track progress. Quality data can provide effective feedback for course correction, enhance performance and improve accountability.
Most countries have good capacity for using data and evidence to drive policy and planning
It is difficult to measure a country’s capacity to use data and evidence to drive policy and planning. This measurement is approximated by examining the availability of national plans and policies
and their contents using a set of standards, as well as determining the presence of a central unit or function in the ministry of health that is responsible for data to policy development. About 60% of countries have well-developed or higher capacity to use data and evidence for policy and planning, with 75% of high-income countries and less than 50% of low-income countries achieving this level (Figure E1.1). Up to 41% of high-income countries reported sustainable capacity in this area, while 4% of low-income countries and 12% of upper-middle-income countries reported the same level of capacity, suggesting that country wealth levels influence how well health policy and planning are driven by data and evidence.
FIGURE E1.1 PERCENTAGE OF COUNTRIES (N=133) WITH CAPACITY TO HAVE DATA AND EVIDENCE DRIVE POLICY AND PLANNING, BY COUNTRY INCOME GROUP
0% 20% 40% 60% 80% 100%
6%
9%
12%
17%
27% 23% 42%
24% 49% 10%
12% 24% 41% 12%
3%
4% 4%
13% 34% 41%
14% 21% 42% 17%
Nascent Limited Moderate Well-developed Sustainable
Global (n=133)
High income (n=32)
Upper-middle income (n=34)
Lower-middle income (n=41)
Low income (n=26)

62
GLOBAL REPORT ON HEALTH DATA SYSTEMS AND CAPACITY, 2020
Figure E1.2 shows the distribution of key indicators or standards that are used to evaluate health sector performance. Nearly all countries produced a publicly available national plan for the health sector, but the quality of the plan varied. A review of past performance was present in 40% of countries, while a burden of disease analysis was only found in 38% of countries. A health system strength analysis was found in the strategic plans of 50% of countries.
FIGURE E1.2 PERCENTAGE OF COUNTRIES (N=133) WITH A PUBLICLY AVAILABLE NATIONAL HEALTH SECTOR STRATEGIC PLAN THAT MEETS RECOMMENDED STANDARDS, BY KEY INDICATORS
Health sector plan publicly available
Presence of a central unit or function in MoH for data and evidence to
policy translation
Coordination function between MoH and external partners exists
National health plan/policies include review of past performance (trends)
National health plan/policies include health system strength analysis
(response strength)
National health plan/policies include burden of disease analysis
At least quarterly output of a central unit or function in MoH for data and
evidence to policy translation0% 20% 40% 60% 80% 100%
95%
84%
56%
50%
40%
38%
14%
countries have a national health sector strategic plan.
ALLNEARLY

63
ENABLE DATA USE FOR POLICY AND ACTION
To ensure that data are analysed critically, and decisions are taken to better align the health system to meet the needs of the population, the responsibility for translating evidence into policy should be assigned to a discreet entity, such as a working group or unit within the ministry of health. The vast majority of countries (84%) reported having such a unit (Figure E1.3). However, the strength and utility of these units is difficult to gauge; only 14% of countries indicated quarterly outputs from these policy units, with less frequent output from lower-income countries (8%).
FIGURE E1.3 PERCENTAGE OF COUNTRIES (N=133) WITH A COORDINATION UNIT FOR DATA AND EVIDENCE TO POLICY TRANSLATION, BY KEY INDICATOR, AND COUNTRY INCOME GROUP
High income Upper-middle income Lower-middle income Low incomeGlobal Average
Coordination function between MoH and external partners exists
At least quarterly output of a central unit or function in MoH for data and
evidence to policy translation
Central unit or function in MoH for data and evidence to
policy translation
84%88%
71%88%
92%
53%44%
68%58%
28%9%10%
8%
56%
14%
0% 20% 40% 80% 100%
of countries have a data to policy unit.
84%
63
64
GLOBAL REPORT ON HEALTH DATA SYSTEMS AND CAPACITY, 2020
E2. Data access and sharing
All countries should make health data accessible to decision-makers at all levels, including subnational and local communities, and to all constituencies, including the public, with appropriate disaggregation dimensions to address inequality among subpopulations. Although data access and sharing has improved overall, data are not yet accessible to all who need it, and not yet shared extensively.
Once data have been collected and analysed according to the highest standards, the methods for data collection and compilation — and the data themselves — should be made available to all potential users. This encourages openness and transparency, an essential element of accountability and good governance.
The most commonly shared data are aggregated data. However, there is also great value in sharing individual records or microdata with bona fide users such as researchers, as long as there are solid mechanisms to ensure data privacy, confidentiality and security. Data sharing has numerous advantages; it permits analysts and researchers to conduct in-depth analyses, study historical trends, and draw out correlations and relationships that enhance the policy value of the information collected. A supportive legal and
administrative framework is essential to enable data access and sharing, in accordance with global standards for confidentiality and data security.
The potential for data sharing is greatly enhanced by the establishment of a data warehouse or national health observatory (NHO). The health observatory concept of gathering, analysing, synthesizing and sharing timely and reliable information on population health and health services has become increasingly popular since the 1970s.
The main objectives of NHOs are to improve and encourage the utility of health data, including health status, health trends and their social determinants, to inform policy, national health strategies and planning.
of countries have well-developed or higher capacity for data access and sharing.
OVER
40%
64
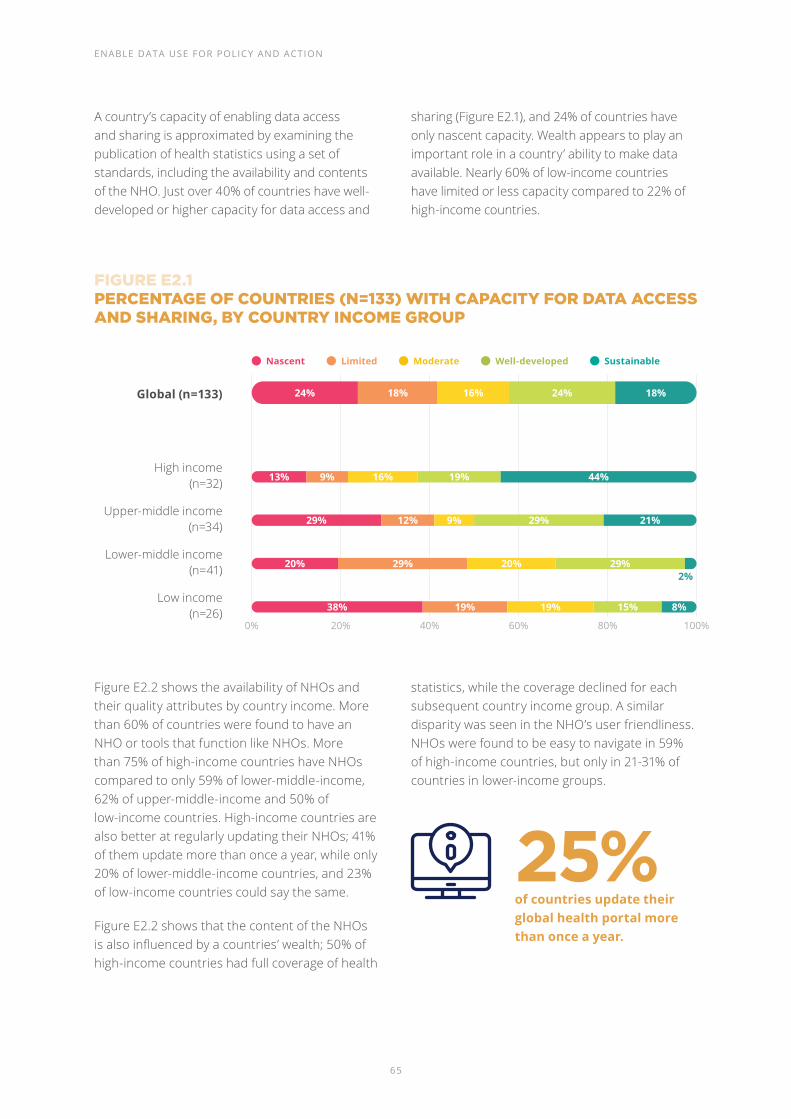
65
ENABLE DATA USE FOR POLICY AND ACTION
A country’s capacity of enabling data access and sharing is approximated by examining the publication of health statistics using a set of standards, including the availability and contents of the NHO. Just over 40% of countries have well-developed or higher capacity for data access and
sharing (Figure E2.1), and 24% of countries have only nascent capacity. Wealth appears to play an important role in a country’ ability to make data available. Nearly 60% of low-income countries have limited or less capacity compared to 22% of high-income countries.
FIGURE E2.1 PERCENTAGE OF COUNTRIES (N=133) WITH CAPACITY FOR DATA ACCESS AND SHARING, BY COUNTRY INCOME GROUP
Figure E2.2 shows the availability of NHOs and their quality attributes by country income. More than 60% of countries were found to have an NHO or tools that function like NHOs. More than 75% of high-income countries have NHOs compared to only 59% of lower-middle-income, 62% of upper-middle-income and 50% of low-income countries. High-income countries are also better at regularly updating their NHOs; 41% of them update more than once a year, while only 20% of lower-middle-income countries, and 23% of low-income countries could say the same.
Figure E2.2 shows that the content of the NHOs is also influenced by a countries’ wealth; 50% of high-income countries had full coverage of health
statistics, while the coverage declined for each subsequent country income group. A similar disparity was seen in the NHO’s user friendliness. NHOs were found to be easy to navigate in 59% of high-income countries, but only in 21-31% of countries in lower-income groups.
0% 20% 40% 60% 80% 100%
24%
13%
29% 12% 9% 29% 21%
20%
38% 19% 19% 15% 8%
29% 20% 29%2%
9% 16% 19% 44%
18% 16% 24% 18%
Nascent Limited Moderate Well-developed Sustainable
Global (n=133)
High income (n=32)
Upper-middle income (n=34)
Lower-middle income (n=41)
Low income (n=26)
of countries update their global health portal more than once a year.
25%

66
GLOBAL REPORT ON HEALTH DATA SYSTEMS AND CAPACITY, 2020
FIGURE E2.2 PERCENTAGE OF COUNTRIES (N=133) WITH HEALTH PORTAL THAT MEET RECOMMENDED STANDARDS, BY COUNTRY INCOME GROUP
Another aspect of data access and sharing is the regular production of statistics on the operations of the health system. Figure E2.3 shows the publication frequency of statistical reports and quality indicator–the inclusion of appropriate disaggregation, by income. More frequent production of the statistical report means the information is more relevant (describing current health status and health system functioning). Data disaggregation permits the assessment of inequity of population health and health care, particularly with regard to vulnerable sub-populations.
Most countries (84%) reported to have produced at least one national statistical report in the past 10 years. Annual publication of statistical reports was found in 57% of the countries (66% of high-income, 42% of low-income countries). The inclusion of appropriate disaggregation in statistical reports was found in 63% of high-income countries, but only in 46-50% of countries in other income groups.
0% 40%20% 60% 80% 100%
62%78%
62%59%
50%
59%
50%
21%
24%
27%
17%
31%
15%
41%18%
20%23%
34%
26%
25%
Existence of health portal
Health portal easy to navigate
Health portal has full coverage of health
statistics
Health portal updated more than
once per year
High income Upper-middle income Lower-middle income Low incomeGlobal Average
66

67
ENABLE DATA USE FOR POLICY AND ACTION
FIGURE E2.3 PERCENTAGE OF COUNTRIES (N=133) WITH HEALTH STATISTICS REPORTS THAT MEET RECOMMENDED STANDARDS, BY COUNTRY INCOME GROUP
About one-third of the countries offer bona fide users access to health management information system (HMIS) data, and almost 40% offer access to health survey data (Figure E2.4) while almost half have an open data policy in government. Among high-income countries, 53% provide access for both HMIS and survey data; 78% have an open
data policy in government for health data. In comparison, the percentage of countries in other income groups that provide access to survey data ranges from 31% to 37% as opposed to 8%-38% for HMIS. The availability of an open data policy ranges from 56% in upper-middle-income countries to 23% for low-income countries.
FIGURE E2.4 PERCENTAGE OF COUNTRIES (N=133) WITH HEALTH DATA ACCESS POLICIES THAT MEET RECOMMENDED STANDARDS, BY COUNTRY INCOME GROUP
0% 40%20% 60% 80% 100%
57%
51%
84%84%
76%88%88%
66%47%
68%42%
63%47%
46%50%
Health statistics report published in
last ten years
Statistical report published annually
Statistical report includes disaggregation
High income Upper-middle income Lower-middle income Low incomeGlobal Average
0% 40%20% 60% 80% 100%
39%53%
35%37%
31%
33%53%
38%29%
8%
49%78%
56%37%
23%
Open data policy in government exists
Broad access to health survey data
Broad access to HMIS*
High income Upper-middle income Lower-middle income Low incomeGlobal Average
*HMIS: Health management information system.

68
GLOBAL REPORT ON HEALTH DATA SYSTEMS AND CAPACITY, 2020
E3. Strong country-led governance of data
Countries need to improve the mechanisms for health data governance
Successful implementation of the SCORE interventions and progress towards a well-functioning country health information system requires a sound policy and institutional environment. This includes robust governance policies and legal frameworks for data as well as multi-stakeholder coordination mechanism.
A clear legal framework and associated regulations should underpin policy and planning for health information systems. Data policies should be based on the principles of accountability, transparency and participation of multiple stakeholders at different levels, promoting the open use of data at all levels. Furthermore, policies must make explicit provision to assure ethical data use, and protection of individual privacy and confidentiality. Countries should also have effective governance structures for country-led coordination mechanisms (including defined roles and responsibilities of different stakeholders) for monitoring, evaluation and review for the entire HIS policy framework, including those concerning monitoring of the many health-related SDGs.
A key focus is investment in a country-led HIS system that meets all country data needs and enables monitoring of progress towards UHC, and the HRSDGs, with high-level commitment and aligned investments by countries and partners. This requires one strong country-led M&E, as an integral component of NHSP and related sub-sectoral plans.
A strong M&E plan is comprehensive, addressing the goals and objectives of the NHSP and supporting the selection of a balanced set of core indicators with well-defined baselines and targets based on accepted standards. The plan also details ways to address data gaps and weaknesses in the various data systems, specifies analytical outputs, defines communication and dissemination mechanisms and outlines plans for institutional capacity building. In many countries, the M&E plan is accompanied by a comprehensive national HIS strategy and implementation plan that provides additional details for strengthening the country HIS. The M&E plan and its relationship to the NHSP provide the basis for multi-year costing and investment in the HIS by both government and partners.
Take advantage of digitalization
Digitalization of health data has become an integral component of country HIS. The use of digital health data should be strategic, support national health goals and be closely linked to the national M&E and HIS plans. A national strategy for digital health data may be embedded within the HIS strategy. Within the context of the NHSP, information and communication technologies (ICT) require effective governance, investment in infrastructure and adoption of standards for information systems at all levels. Furthermore, national information policies and regulations should ensure security of digital data and consistent management of data protection, privacy, confidentiality and consent.

69
ENABLE DATA USE FOR POLICY AND ACTION
FIGURE E3.1 PERCENTAGE OF COUNTRIES (N=133) WITH COUNTRY-LED GOVERNANCE OF DATA, BY KEY INDICATORS
0% 40%20% 60% 80% 100%
0% 40%20% 60% 80% 100%
41%
74%
29%
26%
25%
23%
23%
21%
20%
62%
29%
29%
26%
25%
26%
25%
21%
M&E plan available
Includes core indicator list
Specifies use of data for policy and planning
Specifies dissemination of data
Includes specification on data collection
Specifies resource requirements
Includes analysis and review process specifications
Includes data quality assurance mechanisms
M&E plan meets at least 85% of the standards
Digital/eHealth strategy available
Includes discussion of health data architecture
Specifies alignment with national HIS strategy
Includes handling of data security issues
Includes specifications for confidentiality and storage
Includes description of health data standards
Specifies access to data
Digital/eHealth strategy meets at least 85% of the standards
E3.1 National monitoring and evaluation (M&E) plan
E3.2 National digital/ eHealth strategy

70
GLOBAL REPORT ON HEALTH DATA SYSTEMS AND CAPACITY, 2020
Figure E3.1 displays the quality of tracer items for country M&E plans. Of the 133 countries included in this assessment, 74% reported the existence of a national M&E plan. Core indicators with baselines and targets were present most frequently (41%), while data quality assurance mechanisms were only referenced in the M&E plans of 20% of countries. Only 21% of countries have M&E plans that meet 85% or more of recommended standards.
Another indicator of good data governance is the quality of the national digital or eHealth strategy. Whereas 62% of countries have a current eHealth strategy, less than 30% have tracer items which can measure the quality and content of these strategies. The tracer items included data standards, access to data, data security, and alignment with HIS.
eHealth is dependent upon information and computer technology. As such investments can be costly, the capacity and quality of eHealth strategies often rely on countries’ financial ability. Figure E3.2 shows the countries’ capacity to develop sound national eHealth strategies by country income groups. While almost 50% of high-income countries have sustainable capacity to have eHealth strategies that meet standards, only 7-19% of countries in other income groups have such capacity. It is worth noting that the quality of eHealth strategies in low-income countries (19%) is better than lower-middle and upper-middle-income countries (7% and 15% respectively). Technical assistance support, as well as emphasis on availability of key strategies for required investments by donors, could potentially explain this phenomenon.
FIGURE E3.2 PERCENTAGE OF COUNTRIES (N=133) THAT HAVE NATIONAL DIGITAL/eHEALTH STRATEGY BASED ON RECOMMENDED STANDARDS, BY COUNTRY INCOME GROUP
0% 20% 40% 60% 80% 100%
38%
6%16%
41%
54%
38% 8% 27% 8% 19%
10% 20% 10% 7%
9% 29% 6% 15%
13% 19% 47%
8% 22% 11% 21%
Nascent Limited Moderate Well-developed Sustainable
Global
High income (n=32)
Upper-middle income (n=34)
Lower-middle income (n=41)
Low income (n=26)

71
ENABLE DATA USE FOR POLICY AND ACTION
Looking forward: policy implications
• Clearly work remains to be done to achieve sustainable capacity for creating an enabling environment for data use, particularly in lower income categories. Nearly half of all countries in the three lower-income categories have “limited” capacity or worse for enabling data use
• Even when basic elements, such as health sector strategic plans, monitoring and evaluation plans, eHealth strategies, national health observatories, and national statistical reports are in place, the optimal use of data may not be achieved due to lack of quality, missing key components, and data not being generated nor updated often enough
• Many countries have taken the initial steps towards establishing a national health observatory to provide greater access to health data and information, and greater transparency and accountability for health system performance. However, such solutions can be costly and require external technical assistance. Donors and international technical partners are working with countries to identify and fill needs, but more can be done to ensure that countries are not left behind (particularly lower-income countries that
do not top to the list of countries with high disease burden and large populations)
• For some countries, impediments to data access are less structural, or technical, and more political. Low confidence in data quality can inhibit the wider availability of health data. However, greater access can produce the pressure, often lacking on health information personnel, to make the necessary efforts to improve data quality
• The translation from health data to policy change is not guaranteed, even when a strategy is in place and a mechanism set up for coordinating and monitoring the process. Well trained personnel, adequately resourced dedicated discreet units, will go some way to ensure that informed decisions are taken to better align the health system to meet the needs of the population
71
72
Data availability and global health priorities
1 World health statistics 2019: monitoring health for the SDGs, sustainable development goals. Geneva: World Health Organization; 2019.Licence: CC BY-NC-SA 3.0 IGO.2 GPW 13 methods for impact measurement 2020. Geneva: World Health Organization; 2020.
How does the strength of HIS affect global health monitoring, including UHC and SDGs?
Tracking progress towards UHC and SDG targets is hampered by poor, out-dated data
Accurate and timely data are essential for tracking progress towards achieving the HRSDGs, UHC, and national and subnational priorities. This requires comprehensive national health information systems based on data from CRVS systems, nationally representative household surveys, administrative data and surveillance systems, and routine health-facility reporting systems. Methods for measuring many HRSDGs depend on the availability of accurate cause-of-death data, household surveys, and disease registries.
Many of the HRSDGs also require data from sources beyond the health sector. However, health data are often incomplete, fragmented or of poor quality. As this report shows, many countries lack good data for critical areas such as access to health services, health workforce and health financing. This affects low- and middle-income countries disproportionately. A key
issue is that while estimates for indicators may be available, they are not always derived from recent primary data. World Health Statistics 20191 reported that for about one-third of countries, over half of the indicators had no recent primary or underlying data2.
Figure D.1 shows that the calculation for UHC index (SDG 3.8.1) face major limitations linked to the availability of key indicators. Many countries do not even have one data point for some tracer indicators between 2013 and 2018. For the reproductive maternal neonatal child health (RMNCH) indicators, except for Diphtheria-tetanus-pertussis immunization coverage, the data availability was between 58% and 77% for other indicators. The availability for non-communicable disease indicators was particularly low, ranging from 50% to 86%. Data on health services are also not as readily available with less than 75% of countries having at least one data point for hospital beds per 10,000 population and density of surgeons per 100,000 population
Data availability for other SDG indicators shows similar trend with low availability for NCD indicators and indicators measuring mortality rates (Figure D.2). These results are demonstrated by poor CRVS capacity in low- and middle-income countries as well as low capacity in facility reporting systems (see previous chapters).

73
DATA AVAILABILITY AND GLOBAL HEALTH PRIORITIES
FIGURE D.1 PERCENTAGE OF COUNTRIES (N=133) WITH AT LEAST ONE DATA POINT SINCE 2013, BY UHC COVERAGE INDEX TRACER VARIABLE
Reproductive Maternal Neonatal Child Health
Diphtheria-tetanus-pertussis (DTP3) immunization coverage among 1-year-olds
Proportion of married or in-union women of reproductive age who have their need for family
planning satisfied with modern methods
Antenatal care, four or more visits (ANC4)
Care-seeking behaviour for child pneumonia
Non-Communicable Diseases
Age-standardized prevalence of tobacco smoking among persons 15 years and older
Prevalence of normal blood pressure, regardless of treatment status
Cervical cancer screening among women aged 30-49 years
Mean fasting plasma glucose (mmol/L)
Infectious Diseases
Tuberculosis effective treatment coverage
Antiretroviral therapy (ART) coverage
Households with at least access to basic sanitation
Population at risk sleeping under insecticide- treated nets for malaria prevention
Health System and Financing
Average of 13 International Health Regulations (IHR) core capacity scores
Density of physicians (per 1000 population)
Density of psychiatrists (per 100,000 population)
Density of surgeons (per 100,000 population)
Hospital beds per 10,000 population
0% 40%20% 60% 80% 100%
0% 40%20% 60% 80% 100%
0% 40%20% 60% 80% 100%
0% 40%20% 60% 80% 100%
100%
77%
73%
58%
86%
67%
59%
50%
100%
92%
90%
84%
100%
95%
83%
74%
71%
0% 40%20% 60% 80% 100%
0% 40%20% 60% 80% 100%
0% 40%20% 60% 80% 100%
0% 40%20% 60% 80% 100%
100%
77%
73%
58%
86%
67%
59%
50%
100%
92%
90%
84%
100%
95%
83%
74%
71%
0% 40%20% 60% 80% 100%
0% 40%20% 60% 80% 100%
0% 40%20% 60% 80% 100%
0% 40%20% 60% 80% 100%
100%
77%
73%
58%
86%
67%
59%
50%
100%
92%
90%
84%
100%
95%
83%
74%
71%
0% 40%20% 60% 80% 100%
0% 40%20% 60% 80% 100%
0% 40%20% 60% 80% 100%
0% 40%20% 60% 80% 100%
100%
77%
73%
58%
86%
67%
59%
50%
100%
92%
90%
84%
100%
95%
83%
74%
71%
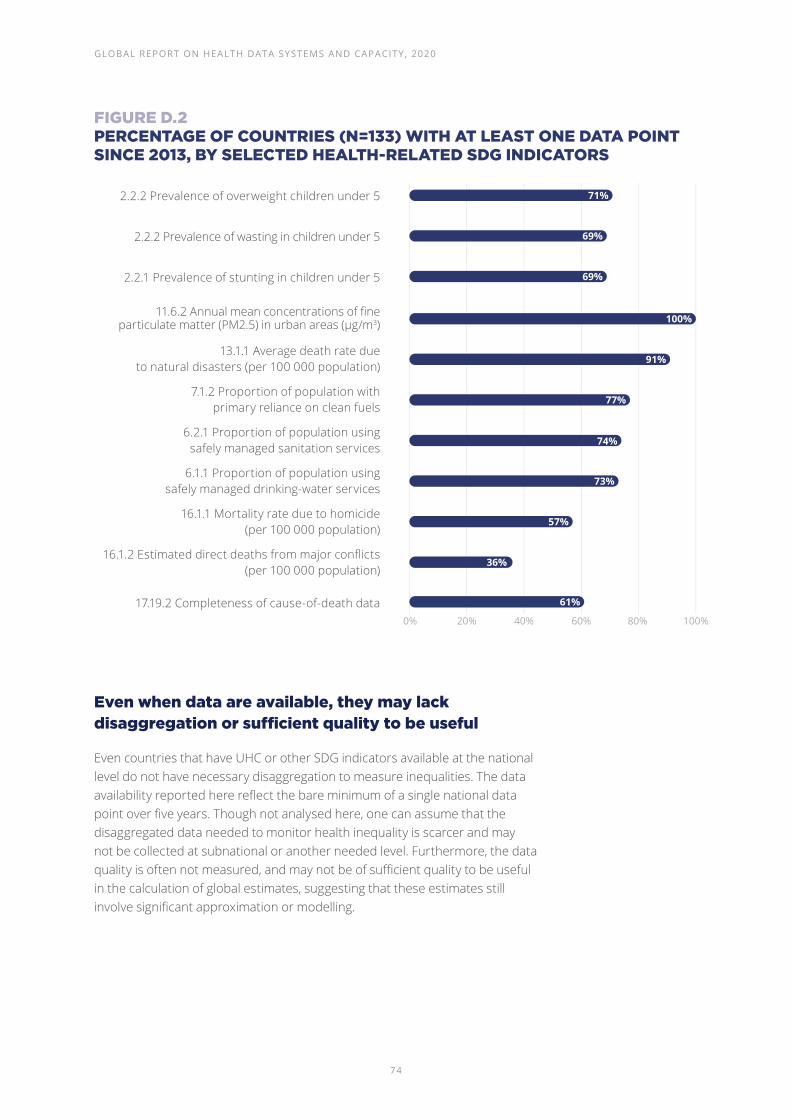
74
GLOBAL REPORT ON HEALTH DATA SYSTEMS AND CAPACITY, 2020
FIGURE D.2 PERCENTAGE OF COUNTRIES (N=133) WITH AT LEAST ONE DATA POINT SINCE 2013, BY SELECTED HEALTH-RELATED SDG INDICATORS
Even when data are available, they may lack disaggregation or sufficient quality to be useful
Even countries that have UHC or other SDG indicators available at the national level do not have necessary disaggregation to measure inequalities. The data availability reported here reflect the bare minimum of a single national data point over five years. Though not analysed here, one can assume that the disaggregated data needed to monitor health inequality is scarcer and may not be collected at subnational or another needed level. Furthermore, the data quality is often not measured, and may not be of sufficient quality to be useful in the calculation of global estimates, suggesting that these estimates still involve significant approximation or modelling.
0% 40%20% 60% 80% 100%
71%
69%
69%
100%
91%
77%
74%
73%
57%
36%
61%
2.2.2 Prevalence of overweight children under 5
2.2.2 Prevalence of wasting in children under 5
2.2.1 Prevalence of stunting in children under 5
11.6.2 Annual mean concentrations of fine particulate matter (PM2.5) in urban areas (µg/m3)
13.1.1 Average death rate due to natural disasters (per 100 000 population)
7.1.2 Proportion of population with primary reliance on clean fuels
6.2.1 Proportion of population using safely managed sanitation services
6.1.1 Proportion of population using safely managed drinking-water services
16.1.1 Mortality rate due to homicide (per 100 000 population)
16.1.2 Estimated direct deaths from major conflicts (per 100 000 population)
17.19.2 Completeness of cause-of-death data

75
Conclusion
Leave no one behind
A robust national health information system that incorporates inequality monitoring is vital to track the sustainable development agenda’s central promise of leaving no one behind. But more importantly, strong national health information systems are critical for monitoring national health priorities as well as for ensuring quality health services are available to all populations.
The SCORE for Health Data Technical Package identifies key interventions that are critical to attain robust health information systems capable of providing information to all the relevant stakeholders. In addition to specifying key data sources that need to be strengthened, it also emphasizes the need to enhance capacity for analysis and use of data, as well as having strong governance structures that support and promote the collection and use of data.
The SCORE assessment provides a rich overview of the health information systems landscape globally. Data from 133 Member States were analysed for this report and the results show key areas that have benefited from efforts made over time, and also show critical areas in need of strengthening that require focused national and international efforts.
Forge sustainable health data systems for all countries
Countries at all income levels are conducting national population-based health surveys. While some health topics, that require a survey as the primary means of data collection, are still being missed, countries are conducting standards-based surveys world-wide. Large international health survey programmes, such as the DHS,
MICS and others, have underpinned these efforts. While these surveys have been critical in solving country data needs, there is a need to examine how countries can achieve sustainable capacity, which includes both technical and financial independence, over time. For example, results in upper-middle-income countries showed that they conducted the lowest average number of annual surveys based on international standards.
Higher income countries performed consistently better across all the five SCORE interventions, which was expected. However, the results among the other country income groups – upper-middle, lower-middle and low-income – did not always follow the expected trajectory where countries in upper-middle-income would perform better than countries in lower-middle-income group, which in turn would perform better than countries in the low-income group. This divide between high-income countries and others, demonstrates the importance of national wealth but also shows the need to focus on other context-specific levers that drive improvement in health information systems.
In all interventions, except for “C – Counting births, deaths and causes of death, there were low- income countries that attained sustainable capacity. This situation indicates that sustainable health information systems can be achieved at all income levels. Counting births and deaths and causes of death was the single intervention where a large majority of low-income countries were not able to demonstrate the existence of a viable system. It is critical to know what people are dying from. The current COVID-19 pandemic has brought this situation into dramatic focus, where countries face serious challenges in both measuring the full burden of, as well as counting the deaths due to the pandemic.
Measurement and analysis of inequality was assessed in the S, O and R interventions. The ability to know the distribution and burden of diseases across key population-groups

76
GLOBAL REPORT ON HEALTH DATA SYSTEMS AND CAPACITY, 2020
is necessary to achieve UHC, and for the SDGs. Availability of disaggregated data as well as analysis of inequality in available data, continues to present challenges to countries. Moving forward, countries need to ensure disaggregation is included in different data collections methods.
Ensure equitable investment across health data systems
Focused attention on key programme areas such as immunization, HIV, TB, and malaria in the last two decades have improved data availability in these areas but other priority areas have struggled to attain similar gains. It will be important, going forward, to maintain the gains made in these programme areas but also to advance data availability and data use in other health programmes by focusing on cross-cutting efforts that strengthen the overall health system.
Data is only as good as its use. There will need to be innovative efforts to increase institutional capacity for analysis and use of data. In-country public health and research institutions are key in providing independent analysis and review of country progress and performance. Strengthening the capacities of national and regional institutions will be critical to develop this SCORE pillar.
Strengthen good data governance and ownership
Governance of health data has traditionally languished when special interest data collection was pursued by different stakeholders. However, given the drive to develop sustainable health information systems, where countries will be the drivers and managers of their own systems, health data governance has taken a prominent role. Governance of health data includes, but is not limited to, access and sharing of health data, legal
frameworks, strategies that include specification of health data architecture, data standards, data security, protection of data confidentiality, monitoring and evaluation functions, and institutional mechanisms for data use. Because of the all-encompassing nature of health data governance, it is one challenging area to improve, but also one critical area that has to be tackled as the lack of it hampers all other areas of health information system.
SCORE – building foundations for the future
This SCORE report highlights the status of country health information systems and lays building blocks for strengthening those systems and enhancing country capacity to collect, manage, and use data effectively. Countries, partners, and stakeholders must take up the challenge – and build upon this foundation, to create strong health information systems and meet the ever-evolving demand for quality data, to inform policy and action that will lead to improved health for all.

77
CONCLUSION

78
GLOBAL REPORT ON HEALTH DATA SYSTEMS AND CAPACITY, 2020
Annex 1. SCORE Interventions, elements and indicators
Annex 2. SCORE Assessment maturity models for indicators included in scoring
Annexes

79
Annex 1. SCORE Interventions, elements and indicators
SURVEY POPULATIONS AND HEALTH RISKS
Key elements Indicators Key attributes
S1.System of regular population-based health surveys
S1.1. A system of regular and comprehensive population health surveys that meets international standards
• At least one survey conducted in the last five years that:• Cover major health priorities• Cover major dimensions of inequity• Are aligned with international standards• Are funded by government
S2.Surveillance of public health threats
S2.1. Completeness and timeliness of weekly reporting of notifiable conditions (%)*
• Percentage of reporting sites that submitted weekly report in last month: public sites
• Percentage of reporting sites that submitted weekly in last month: non-public sites
S2.2. Indicator and event-based surveillance system(s) in place based on International Health Regulations standards
• If country has done SPAR, based on SPAR:• National IHR Focal Point functions under IHR• Early warning function: indicator-and event-based
surveillance mechanism for event management (verification, risk assessment, analysis investigation).
• If country has not done a SPAR but done JEE, based on JEE:• Indicator- and event-based surveillance system• Inter-operable, inter-connected, electronic real-time
reporting system• Integration and analysis of surveillance data• Syndromic surveillance systems• System for efficient reporting • Reporting network and protocols in country
• If country has not done SPAR or JEE, based on IHR:• Self-assessment score for surveillance• Self-assessment score for IHR coordination
S3.Regular population census
S3.1. Census conducted in last 10 years in line with international standards with population projections for subnational units
• Census conducted within last 10 years• Post enumeration survey conducted• Population projections with all disaggregation
*The indicator or attribute is not included in the calculation of overall element score.

80
GLOBAL REPORT ON HEALTH DATA SYSTEMS AND CAPACITY, 2020
COUNT BIRTHS, DEATHS AND CAUSES OF DEATH
Key elements Indicators Key attributes
C1.Full birth and death registration
C1.1. Completeness of birth registration (%)
• Completeness of birth registration (%)
C1.2. Completeness of death registration (%)
• Completeness of death registration (%)
C1.3. Core attributes of a functional CRVS in place to generate vital statistics*
• Legal framework for CRVS• Easy access to registration offices• Adequate training for registrars• Formal CRVS Interagency collaboration• All data are exchanged electronically• Data quality assessment, adjustment, and analysis
using international standards• System performance monitoring• Vital statistics report published in last five years
C2.Certification and reporting of causes of death
C2.1. Completeness of deaths with cause of death reported to national authorities and/or international institutions (%)
• Completeness of deaths with cause of death reported
C2.2. Quality of cause-of-death data (% of cause of death with ill-defined or unknown causes of mortality)
• Quality of cause-of-death data, measured as percentage of records with ill-defined or unknown causes of mortality
C2.3. Core attributes of a functional system to generate causeof-death statistics*
• Legislation for MCCD is line with international standards
• ICD compliant MCCD are used• Medical students trained in correct death
certification practices• Statistical clerks trained in mortality coding• Verbal autopsy (if applicable) is applied• Data quality assurance and dissemination• Cause of death statistics available
*The indicator or attribute is not included in the calculation of overall element score.

81
SCORE INTERVENTION, ELEMENTS, AND INDICATORS
OPTIMIZE HEALTH SERVICE DATA
Key elements Indicators Key attributes
O1.Routine facility reporting system with patient monitoring
O1.1. Availability of annual statistics for selected indicators derived from facility data
• Annual statistics available for 11 key facility-based indicators, including key disaggregation
• Data quality for primary care facilities • Data quality for hospitals• Completeness of reporting by public, primary care facilities• Completeness of reporting by public hospitals• Completeness of reporting by private health facilities
O1.2. Functional facility/patient reportingsystem in place basedon key criteria*
• National unique patient identifier system• Cancer registries for all types of cancer• Master facility list is up-to-date• Institutional system of data quality assurance• Standards of practice for health management information
systems describe all parts of process, are fully implemented and revised periodically
• System of electronic data entry: aggregate at district level• System of electronic capture - patient level primary
care facilities• System of electronic capture - patient level in hospitals• Standards based data exchange between systems
O2.Regular system to monitor service availability, quality and effectiveness
O2.1. Well established system to independently monitor health services
• Regular independent assessments of the quality of care in hospitals and health facilities
• System of accreditation of health facilities based on data• System of adverse event reporting following medical
interventions*
O3.Health service resources: health financing and health workforce
O3.1. Availability of latest data on national health expenditure
• Data available within last five years on:• Public health expenditure• Private health expenditure• Catastrophic spending
O3.2. Availability of data on health workforce density and distribution updated annually
• Information, including availability at subnational level and major levels of disaggregation for:• Medical doctors• Nurses• Midwives• Dentists• Pharmacists
O3.3. National human resources health information system is in place and functional*
• Human resource for health information systems tracks • Number of entrants to the labour market • Number of active stock on the labour market• Number of exits from the labour market• Demographic distribution of health workers• Subnational level data of active health workers• Number of graduates from education and training
institutions• Information on foreign-born and/ or foreign-trained
health workers
*The indicator or attribute is not included in the calculation of overall element score.

82
GLOBAL REPORT ON HEALTH DATA SYSTEMS AND CAPACITY, 2020
REVIEW PROGRESS AND PERFORMANCE
Key elements Indicators Key attributes
R1.Regular analytical reviews of progress and performance, with equity
R1.1. High quality analytical reports on progress and performance of health sector strategy/plan are produced annually
• Analytic report published within last five years:• Uses all available data sources• Assesses progress against targets• Pays attention to measures of inequity• Links performance to health inputs• Provides comparative analysis • Includes Subnational rankings• Evaluates performance of hospitals and large facilities• Summarizes main findings for use for policy
and planning
R2.Institutional capacity for analysis and learning
R2.1. Institutional capacity in data analysis at national and subnational level
• Involvement of public health institutes/schools of public health
• Subnational capacity in ministry of health or institutions to conduct health analysis*
• Capacity at national ministry of health to conduct health analysis
• Capacity at NBS to: draw sample, implement surveys and conduct analysis
*The indicator or attribute is not included in the calculation of overall element score.
82

83
SCORE INTERVENTION, ELEMENTS, AND INDICATORS
ENABLE DATA USE FOR POLICY AND ACTION
Key elements Indicators Key attributes
E1.Data and evidence drive policy and planning
E1.1. National health plan and policies are based on data and evidence
• National health plan/policies include review of past performance (trends)
• National health plan/policies include burden of disease analysis
• National health plan/policies include health system strength analysis (response strength)
• Presence of a central unit or function in ministry of health for data and evidence to policy translation
• Level of output of a central unit or function in ministry of health for data and evidence to policy translation
• Coordination function between ministry of health and partners
E2.Data access and sharing
E2.1. Health statistics are publicly available
• Frequency of updating national database• Contents of national database• Navigation ease of national database• Statistical report publication frequency• Statistical report includes disaggregation• Bona fide users have Access to HMIS data• Bona fide users have access to health survey data• Open data policy
E3.Strong country-led governance of data
E3.1. National monitoring and evaluation (M&E) is based on standards
• National M&E plan that:• Includes core indicator list with baselines and targets• Includes specification on data collection methods and
digital architecture• Includes data quality assurance mechanisms• Includes analysis and review process specifications • Specifies use of data for policy and planning• Specifies dissemination of data• Specifies resource requirements to implement
the strategic plan/policy
E3.2. National digital health/eHealth strategy is based on standards
• National digital health/eHealth strategy that:• Includes discussion of health data architecture• Includes description of health data standards
and exchange• Includes handling of data security issues• Includes specifications for data confidentiality
and data storage• Specifies access to data• Specifies alignment/is integrated with national
HIS strategy
E3.3. Foundational elements to promote data use and access are present*
• Legal framework or policies exist for health information systems
• Legal framework or policies are enforced
*The indicator or attribute is not included in the calculation of overall element score.

84
Annex 2. SCORE Assessment maturity models for indicators included in scoring
Nascent capacity
Limited capacity
Moderate capacity
Well- developed capacity
Sustainable capacity
1 2 3 4 5
S1. System of regular population-based health surveys
Overall score is <0.25
Overall score is 0.25-0.49
Overall score is 0.50–0.70
Overall score is 0.71-0.89
Overall score is ≥0.90
S2. Surveillance of public health threats
Average % implementation of surveillance indicators ≤20%
Average % implementation of surveillance indicators 21%-40%
Average % implementation of surveillance indicators 41%-60%
Average % implementation of IHR surveillance indicators 61%-80%
Average % implementation of surveillance indicators 81%-100%
S3. Regular population census
25% of criteria are met or less
26-49% of criteria are met
50-70% of criteria are met
71-90% of criteria are met
Greater than 90% of criteria are met
C1.1. Full birth and death registration - birth
There is no data on birth registration completeness
<50% 50-74% 75-89% ≥90%
C1.2. Full birth and death registration - death
There is no data on death registration completeness
<50% 50-74% 75-89% ≥90%
C2.1. Certification and reporting of causes of death - reporting
There is no standardised system for medical certification of cause of death
Score <30% Score 30-69% Score 70-89% Score ≥90%
C2.2. Certification and reporting of causes of death - quality
Not applicable in the absence of data
At least 30% ill-defined or unspecified causes
20-29% ill-defined or unspecified causes
10-19% ill-defined or unspecified causes
Less than 10% ill-defined or unspecified

85
SCORE ASSESSMENT MATURITY MODELS FOR INDICATORS INCLUDED IN SCORING
Nascent capacity
Limited capacity
Moderate capacity
Well- developed capacity
Sustainable capacity
1 2 3 4 5
O1. Routine facility reporting system with patient monitoring
Meets <25 % of criteria for availability
Meets 25-49% of criteria for availability
Meets 50-70% of criteria for availability
Meets 71-89% of criteria for availability
Meets ≥90% of criteria for availability
O2. Regular system to monitor service availability, quality and effectiveness
Survey-based system for monitoring of the quality of services = 1 and accreditation system = 1
Survey-based system for monitoring of the quality of services = 2 or accreditation system = 2
Survey-based system for monitoring of the quality of services = 3
Survey-based system for monitoring of the quality of services = 4
Survey-based system for monitoring of the quality of services = 5 or accreditation system = 3
O3.1. Health service resources - health financing
Key health expenditure indicators are not produced
Total weighted score of key indicator items is less than 1
Total weighted score of key indicator items is between 1 and 2
Total weighted score of key indicator items is between 2 and 3
Total score of key indicator items is 3
O3.2. Health service resources - health workforce
Meets <20 % of criteria for availability
Meets 20-39% of criteria for availability
Meets 40-59% of criteria for availability
Meets 60-79% of criteria for availability
Meets ≥80% of criteria for availability
R1. Regular analytical reviews of progress and performance, with equity
No report produced in past 5 years
Total weighted score of key indicator items is less than 12
Total weighted score of key indicator items is 12 to less than 20
Total weighted score of key indicator items is 20 to less than 25
Total score of key indicator items is 25 or higher
R2. Institutional capacity for analysis and learning
Key indicator items meet 25% or less of standards
Key indicator items meet more than 25% but less than 50% standards
Key indicator items meet 50% to less than 67% of standards
Key indicator items meet 67% to less than 83% of standards
Key indicator items meet at least 85% of standards

86
GLOBAL REPORT ON HEALTH DATA SYSTEMS AND CAPACITY, 2020
Nascent Capacity
Limited capacity
Moderate capacity
Well- developed capacity
Sustainable capacity
1 2 3 4 5
E1. Data and evidence drive policy and planning
Total score of key indicator items is 3 or less
Total score of key indicator items is 4-6
Total score of key indicator items is 7-8
Total score of key indicator items is 9-11
Total score of key indicator items is 12 or higher
E2. Data access and sharing
Total score of key indicator items is 8 or less
Total score of key indicator items is 9-12
Total score of key indicator items is 13-16
Total score of key indicator items is 17-20
Total score of key indicator items is 21 or higher
E3.1. Strong country-led governance of data – M&E
No M&E or HIS plan exists that is linked to the current national health sector strategic plan
Total score of key indicator items is 9 or less
Total score of key indicator items is 10-14
Total score of key indicator items is 15-17
Total score of key indicator items is 18 or higher
E3.2. Strong country-led governance of data – eHealth strategy
An eHealth strategy is non-existent or is no longer current
Total score of key indicator items is 8 or less
Total score of key indicator items is 9-12
Total score of key indicator items is between 13-15
Total score of key indicator items is 16 or higher
86

87
SCORE ASSESSMENT MATURITY MODELS

88
GLOBAL REPORT ON HEALTH DATA SYSTEMS AND CAPACITY, 2020
20 Avenue Appia CH-1211 Geneva 27 Switzerland
who.int/healthinfo/en