Embed Size (px)
Citation preview

Global Research
October 2008
Equities
Saudi International Petrochemical Co. (SIPCHEM)Saud
i Arab
ia
Crystallizing Growth
Global Investment House KSCCSharq, Global TowerP.O. Box 28807 Safat13149 KuwaitTel: (965) 2295 1000Fax: (965) 2295 1005E-mail: [email protected]://www.globalinv.net
Global Investment House stock market indices can be accessedfrom the Bloomberg page GLOHand from Reuters Page GLOB
Omar M. El-Quqa, CFAExecutive Vice [email protected] No:(965) 2295 1110
Faisal Hasan, CFAHead of [email protected] No:(965) 22951270
Syed Taimure AkhtarFinancial [email protected] No:(965) 22951278
Hettish KumarFinancial [email protected] No:(965) 22951281

Global Research - Saudi Arabia Global Investment House
�Saudi International Petrochemical Company - SIPCHEMOctober 2008
Tickers:SIPCHEM AB (Bloomberg)2310.SE (Reuters)
Listing:Saudi Stock Exchange (Tadawul)
Current Price:SR22.5 (18th October 2008)
October 2008
BUY
Saudi International Petrochemical Company (SIPCHEM)
Investment Summary
- Saudi International Petrochemical Company (SIPCHEM) was registered as a joint stock company in the Kingdom of Saudi Arabia on 22nd December 1999 and got its commercial license on 6th February, 2000. The principle activity of the Company is to own, establish, operate and manage industrial projects in the petrochemical and chemical fields. The Company had started its commercial operations with the manufacturing of three products Methanol, Malice anhydride-Ma and Butanediol-BDO. However, the Company is in the process of enhancing its manufacturing capabilities, mainly in chemical products.
- SIPCHEM went public following an initial public offer (IPO) and got listed on Saudi Stock Exchange (Tadawul) in November 2006. The Company, after approval from Capital Market Authority (CMA), issued 45mn shares at SR55 per share. By the end of 2006, a major portion of the Company’s shares were held by the general public, which accounted for 47.2%.
- SIPCHEM has a total of 6 affiliates, out of which, at present, only two affiliates are under operations. However, the remaining three are under developmental process while the other one is related to the marketing and distribution of chemicals and petrochemical products. Based on the current product range, methanol is the only petrochemical product of the Company, which is categorized under oxygenate products. The remaining products of the Company are (i) Butanediol-BDO and (ii) Maleic Anhydride-Ma. However, after the completion of new production lines of its new affiliates; the product range of the Company will expand to the other chemicals, which includes (i) Vinyl acetate monomer-VAM and (ii) Acetic Acid-AA along with the other olefins products like ethylene, propylene and polymers. Moreover, during 2007, the existing capacity of methanol production accounts for 89.5%, while the remainder capacity is allocated for the production of BDO and Ma, which comprise 4.5% and 6.1% of the total capacity respectively.
- According to the management of SIPCHEM, the completion of Acetyl complex is expected in mid 2009 and we have taken the production commencement from 3Q2009. In order to finance the project, the Company has issued 66.5% right shares at a premium of SR5 per share. Acetyl complexes comprise of three companies i.e. (i) International Acetyl Complex-IAC, from where SIPCHEM will get 400,000 tons of acetate acid-AA and 50,000 tons of AAn, (ii) International Vinyl Acetate Company-IVAC, which will produce 300,000 tons of vinyl acetate monomer-VAM & consume 80% production of IAC and

Global Research - Saudi Arabia Global Investment House
2 October 2008Saudi International Petrochemical Company - SIPCHEM
-5.0
10.015.020.025.030.035.040.045.050.0
-
2,000.0
4,000.0
6,000.0
8,000.0
10,000.0
12,000.0
SIPCHEM TASI
Jan-0
7
Feb
-07
Mar
-07
Apr-
07
May
-07
Jun-0
7
Jul-
07
Aug-0
7
Sep
-07
Oct
-07
Nov-0
7
Dec
-07
Jan-0
8
Feb
-08
Mar
-08
Apr-
08
May
-08
Jun-0
8
Jul-
08
Aug-0
8
Sep
-08
Oct
-08
Mar
ket
Pri
ce (
SR
)
TA
SI
(iii) International Gas Companies-IGC to produce carbon monoxide-CO. Furthermore, these complexes are very well integrated with each other and with methanol producing plant. This will result in an improvement in the gross margins (excluding depreciation) of the Company, going forward.
- Upon the completion of the Acetyl complex in 3Q2009, the management has a plan to set up polyolefin complex, which is designed to produce 1.3mn tins of ethylene and propylene with the capacity to produce 800,000 tons of polymers. The status of the project is still unclear.
- We expect the sales revenue of SIPCHEM to show a growth of 19.7% in 2008 over the sales revenues of SR1.5bn in 2007. The growth in sale revenues is expected to continue in 2009 and is forecasted to be up by 11.1% to reach at SR2.0bn in 2009, which is mainly due to the expected commencement of production from Acetyl complex in 3Q2009. Furthermore, the growth in 2008 & 2009 sales revenue will increase at a CAGR of 12.5%, during 2007-11, while the bottom line is expected to increase at a CAGR of 10.1%, during 2007-11.
- We valued SIPCHEM using the weighted average valuation approach, with an 80% weight to the DCF technique and 20% to value derived from the relative valuation technique. Based on the weighted average valuation approach, we have reached a fair value for SIPCHEM of SR35.3. The current market price of SR22.5 per share as of 18th October 2008, offers a potential upside of 56.4%. We, therefore, initiate our coverage of SPICHEM with a “BUY” recommendation.
Table 01: Investment Indicators
CMP (SR)Shares in issue
(mn)
Market Cap
(SR mn)
52-week price range
(SR)
22.55* 333.3 7,517 50.99 / 19.75
YearRevenues Net Profit EPS BVPS ROE P/E P/BV
(SR Mn) (SR Mn) (SR) (SR) (%) (x) (x)
2009E 2,031.1 658.0 2.0 16.1 10.7 11.4 1.4
2008E 1,828.3 611.2 1.8 15.5 12.3 12.3 1.5
2007A 1,527.7 594.0 1.8 15.7 17.3% 24.7 2.8
2006A 1,334.0 493.7 1.5 14.4 18.6% 15.9 1.6
Source: Annual Reports and Global Research *Historical P/E & P/BV multiples pertain to respective year-end prices, while those for future years are based on closing prices on the Tadawul as of 18th October, 2008.
Chart 01: Share Price Performance Chart
Source: Zawya & Global Research

Global Research - Saudi Arabia Global Investment House
October 2008 Saudi International Petrochemical Company - SIPCHEM �
Company Overview
BackgroundSaudi International Petrochemicals Company was registered as a joint stock company in the Kingdom of Saudi Arabia on 22nd December 1999 and got its commercial license on 6th February, 2000. At present, the Company has a paid-up capital of SR3.3bn (US$880mn). SIPCHEM actively develops and invests in petrochemical and chemical industries, both basic and intermediate, to produce chemicals used to manufacture a multitude of products that improve the lives of people worldwide. Moreover, the principle activity of the Company is to own, establish, operate and manage industrial projects in the petrochemical and chemical fields. The Company had started its commercial operation with the manufacturing of three products Methanol, Malice anhydride-Ma and butanediol-BDO.
The Company has a total of 6 affiliates, out of which only two affiliates are under manufacturing operations. At present, however, 3 are under developmental process while one is related to the marketing and distribution of chemicals and petrochemical products. Based on the current product range, methanol is the only petrochemical product of the Company, which is categorized under oxygenate products. The remaining products of the Company are (i) BDO and (ii) Ma. However, after the completion of new production facilities of it affiliates’ the product range of the Company will expand to the other chemicals, to include (i) VAM and (ii) AA and other olefins products.
Table 02: Designed Production Capacities
Tons 2006 2007 2008E 2009E 2010E 2011E
Methanol 691,600 691,600 650,000 650,000 650,000 650,000
Butanediol 24,899 34,619 40,433 40,433 40,433 40,433
Malice Anhydride 46,772 46,772 56,126 56,126 56,126 56,126
Acetic Acid + Acetic Anhydride - - - 187,500* 375,000 375,000
Vinyl Acetate Monomer - - - 123,750* 247,500 247,500
Carbon Monoxide - - - 127,500* 255,000 255,000
Total 763,270 772,990 746,558 1,185,308 1,624,058 1,624,058
Source: APPC & Global Research*Six months production from Acetyl Complex
In order to attain sustainable growth, the Company, in 2H2006, started construction of a major Acetyls Complex which consisted of an Acetic Acid plant (450,000 tons of AA & AAn), Vinyl Acetate Monomer plant (300,000 tons) and Carbon Monoxide plant (330,000 tons). The complex is expected to commence production by 3Q2008. In addition, the Company is also developing an integrated olefins derivatives complex which will consist of nine plants producing value-added performance chemicals with a production capacity of 1.3mn tons of ethylene and propylene, which will be used to produce 800,000 tons of polymers. The SR 20 billion project is scheduled to start in 2013-14.

Global Research - Saudi Arabia Global Investment House
� October 2008Saudi International Petrochemical Company - SIPCHEM
Chart 02: SIPCHEM Expansion (Investment in US$)
Source: SIPCHEM Management & Global Research
ManagementThe board of directors of the company is led by Mr. Abdulaziz Abdullah Hamad Al Zamil. Mr. Abdulaziz Abdullah Hamad is the acting chairman of the Company’s board.
Table 03: Board of DirectorsNames Position in SIPCHEM
Mr. Abdulaziz Abdullah Hamad Al Zamil Chairman
Mr. Reyadh S. Ahmed Member
Mr. Abdullah S. Bahamdan Member
Mr. Abdulrahman A. Al-Turki Member
Dr. Abdulrahman A. Al-Zamil Member
Dr. Saleh H. Al-Humaidan Member
Mr. Mohammad A. Al-Ghurair Member
Mr. Ibrahim M. Al-Humaidan Member
Dr. Abdulaziz A. Al-Gwaiz Member
Mr. Fahad S. Al-Rajhi Member
Ahmed Al-Ohali Member
Source: Company Website
The senior management of the company is headed by Mr. Ahmed Abdul Aziz Al Ohali. Mr. Ohali’s career started with SABIC National Methanol Company (IBN SINA) in September 1981 and he took a two year assignment with Celanese Chemical Company, in Houston, Texas, shortly afterwards. Mr. Al Ohali progressed within the company during his 15 years service into technical and executive positions. Mr. Al Ohali left SABIC in early 1996 to join the private industry world. He successfully started a medium sized private business in the non-woven films called Saudi German Non-Woven Products and was its Managing Director. During 1999, Mr. Al Ohali participated in setting up SIPCHEM, and became its president.
01000200030004000500060007000
Investments
2000
2001
2002
2003
2004
2005
2006
2007
2008
2009
2010
2011
2012
2013
Capital Increasefrom SR500mn to650mn
Methanol Start-Up
BDO start-up capitalincreased to SR1.5bn Initial Public Offering Bonus shares Issued 33%
Right sharesissued 65.6%
Acetyl Start-up
PolyolefinsComplex

Global Research - Saudi Arabia Global Investment House
October 2008 Saudi International Petrochemical Company - SIPCHEM �
Table 04: Senior Management
Names Position in SIPCHEM
Mr. Ahmad Abdulaziz Al Ohali President & CEO
Mr. Abdulrahman A. Al-Saif President IDC & IMC
Mr. Abdullah S. Al-Saadoon President Acetyl Complex
Mr. Mehdi Aftab V.P, Major Projects
Mr. Abdullatif M. Bhairi V.P, Planning & Development Projects
Mr. Kevin J. Hayes V.P, Corporate Finance
Mr. Alber E Biggs G.M, Maintenance & Technical Services
Rashid M. Al-Dossari G.M, Public Relations & Corporate Affairs
Khaled S. Al-Dossari G.M, Finance & Accounting
Abdullah N. Al-Jaber G.M, Administration & Human Resources
Source: Company Website
Shareholding and LiquidityThe Company went in public following an initial public offering (IPO) and got listed on the Saudi Stock Exchange (Tadawul) in November 2006. The Company on the approval of Capital Market Authority (CMA) had issued 45mn shares at SR55 per share.
Table 05: SIPCHEM Shareholders (By the Year End 2007)
Shareholder Holding
Zamil Group Holding-Saudi Arabia 10.2%
National Industries Group Holdings-Kuwait 8.3%
Olayan Financing Company-Saudi Arabia 6.8%
Public Pension Agency –Saudi Arabia 6.5%
Al Ghurair Investment 3.7%
Sara Development Company 1.5%
Individuals, Corporate and Financial Institutions 14.9%
Public 47.2%
Source: Zawya
By the end of 2007, a major portion of the Company’s shares were held by the general public, which accounted for 47.2%. In addition, by the end of 2007, the Company had further increased its issued number of shares from 150mn to 200mn through the issuance of bonus shares. Furthermore, the Company has recently issued right shares, which are 66.5% of the capital at the end of 2007, and it has raised the Company’s share capital to 333mn shares. The other notable shareholders are (i) Zamil Group Holding Company which owns 10.2% (ii) National Industries Group Holding, which owns 8.3% and (iii) Olayan Financing Company, which owns 6.8% of the total paid-up capital. Rest of the shares are held by several government and private owned corporations and agencies.

Global Research - Saudi Arabia Global Investment House
� October 2008Saudi International Petrochemical Company - SIPCHEM
Table 06: Stock Liquidity
Year Volume Market Price (Year End) Market Cap (SR mn)
2006 9,446,097 23.6 3,540
2007 3,992,250 44.1 8,820
2008 2,351,851 22.5* 7,517
Source: TADAWUL, Global Research * Market price as 18th October 2008
SPICHEM Affiliates / SubsidiariesThe Company, at present, has six affiliates / subsidiaries out of which five are manufacturing units while one is used to carry out marketing & distribution activities of the Company. Currently, only two manufacturing affiliates / subsidiaries of the Company are operational alongwith the marketing affiliate / subsidiary.
International Methanol Company-IMCIMC is a limited liability company established in 2003 in Saudi Arabia, owned 65% by SPICHEM and 35% by Japan-Arabia Methanol Company Limited (JAMC), a special purpose subsidiary owned by a consortium of Japanese companies including Mitsui & Company Limited (Mitsui) (55%), Mitsubishi Corporation (Mitsubishi) (15%), Daicel Chemical Industries Limited (Daicel) (15%) and Iino Kaiun Kaisha Limited (Iino) (15%). IMC owns and operates a Methanol Plant in Jubail, Saudi Arabia. The Methanol plant at IMC commenced its commercial production in 4Q2004. IMC produces 1mn tons of methanol by using natural gas as a primary raw material, for which SIPCHEM signed a supply agreement with Saudi Aramco.
IMC operates proven steam methane reforming and methanol synthesis technology licensed by Jacobs Engineering UK Limited (Jacobs). The Plant also incorporates a range of process proven proprietary technologies including Johnson Matthey catalyst systems (included in approximately 60% of worldwide methanol production capacity) and a Methanol Casale S.A. Axial Radial Converter (ARC). JAMC, which is a shareholder of IMC, markets about 80% of the Company Methanol output outside the Middle East, whereas the Company is marketing the remaining balance in the Middle East.
International Diol Company-IDC International Diol Company is a limited liability company established in 2002 in Saudi Arabia. SIPCHEM owns a majority of the shares of IDC, in a joint venture with the Public Pension Agency GOSI, Huntsman Corp., Davy Process Technology, Sabih Tahir Darwish Al Masri, and A.S. Albabtain & Company. IDC had successfully started it initial production in 4Q2005 and is now going on stream with a total capacity of 75,000 tons to meet the growing demand for butanediol (BDO) and derivatives in the world and domestic markets.
International Diol Company’s product line comprises of specialty chemicals such as Butanediol (BDO), Tetrahydrofuran (THF) and Gamma-butyrolactone (GBL). The BDO production technology is provided by Davy Process Technology Limited of the United Kingdom. Upstream technology is provided by Huntsman Corporation and UOP LLC. Vinmar International Limited, USA and Will & Co B.V., of the Netherlands are providing the marketing services. The BDO and THF market have been very receptive of the new product.

Global Research - Saudi Arabia Global Investment House
October 2008 Saudi International Petrochemical Company - SIPCHEM �
International Acetyl Company –IACIAC is a limited liability company registered in January, 2006, owned 87% by SIPCHEM, 10% by Helm Arabia and 3% by Ministry of Endowments. IAC is intended to build, own and operate the Acetic Acid (AA) plant. Helm Arabia is a special purpose company established in Hamburg, Germany between Helm AG of Germany, a leading multinational producer and distributor of petrochemical products and Thales International Offsites, a subsidiary of Thales Company of France, a leading international electronics and systems group, serving government and business customers worldwide. The plant is designed to produce up to 400,000 tons of acetic acid and up to 50,000 tons of acetic anhydride, which will start commercial operation in 3Q2009. The feedstock, namely methanol, carbon monoxide and hydrogen will be provided internally by other SIPCHEM affiliates, viz. International Methanol Company (IMC) and Industrial Gases Company (IGC), thus ensuring an uninterrupted supply of feedstock.
International Vinyl Acetyl Company –IVACSIPCHEM has 87% stakes in IVAC, which is a limited liability company registered in January 2006. Reminder shares are held by Helm Arabia (10%) and Ministry of Endowmens (3%). IVAC is intended to build, own and operate the Vinyl Acetate Monomer (VAM) plant. Helm Arabia is a special purpose company established in Hamburg, Germany between Helm AG of Germany and Thales International Offsites. In addition, Helm AG of Germany is a leading multinational producer and distributor of petrochemical products and Thales International Offsite, a subsidiary of Thales Company of France, a leading international electronics and systems group, serving government and business customers worldwide.
The IVAC plant is designed to produce up to 330,000 tons of VAM and will start commercial operation in 3Q2009. The feedstock, Acetic Acid, will be provided internally from the complex of IAC, thus ensuring an uninterrupted supply of feedstock. DuPont, a multinational science and technology company, has agreed to supply technology.
International Gas Company-IGCIGC was established as a joint venture between SIPCHEM, National Power Company-NPC and Ministry of Endowments. The affiliate / subsidiary got registered in May2005. SIPCHEM holds a 72% stakes in IGCL while the remaining stakes of 25% are held by NPC and the remainder 3% by Ministry of Endowments. The plant is designed to produce 345,000 tons of Carbon Monoxide-CO, which is expected to start commercial operation in 3Q2009. Saudi Aramco has agreed to supply SIPCHEM the natural gas, which will also be used as feedstock for IGC plant.
Global Research - Saudi Arabia Global Investment House
8 October 2008Saudi International Petrochemical Company - SIPCHEM
Petrochemicals Overview
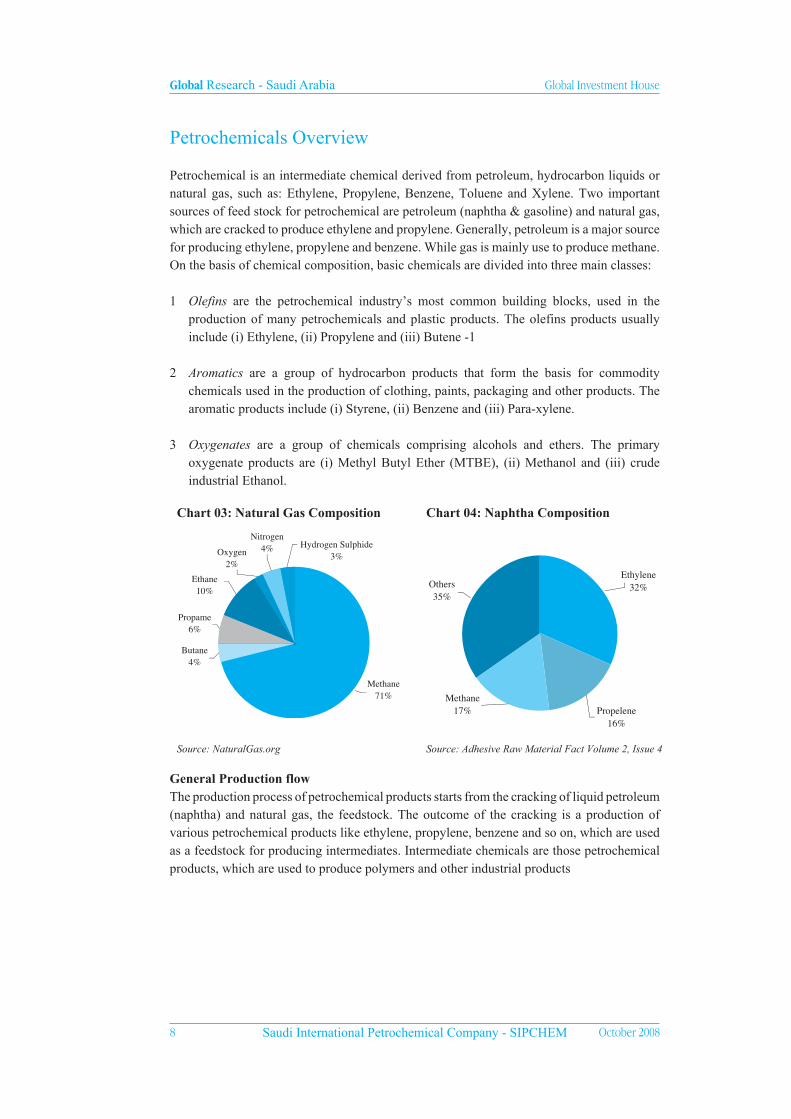
Petrochemical is an intermediate chemical derived from petroleum, hydrocarbon liquids or natural gas, such as: Ethylene, Propylene, Benzene, Toluene and Xylene. Two important sources of feed stock for petrochemical are petroleum (naphtha & gasoline) and natural gas, which are cracked to produce ethylene and propylene. Generally, petroleum is a major source for producing ethylene, propylene and benzene. While gas is mainly use to produce methane. On the basis of chemical composition, basic chemicals are divided into three main classes:
1 Olefins are the petrochemical industry’s most common building blocks, used in the production of many petrochemicals and plastic products. The olefins products usually include (i) Ethylene, (ii) Propylene and (iii) Butene -1
2 Aromatics are a group of hydrocarbon products that form the basis for commodity chemicals used in the production of clothing, paints, packaging and other products. The aromatic products include (i) Styrene, (ii) Benzene and (iii) Para-xylene.
3 Oxygenates are a group of chemicals comprising alcohols and ethers. The primary oxygenate products are (i) Methyl Butyl Ether (MTBE), (ii) Methanol and (iii) crude industrial Ethanol.
Chart 03: Natural Gas Composition Chart 04: Naphtha Composition
Source: NaturalGas.org Source: Adhesive Raw Material Fact Volume 2, Issue 4
General Production flowThe production process of petrochemical products starts from the cracking of liquid petroleum (naphtha) and natural gas, the feedstock. The outcome of the cracking is a production of various petrochemical products like ethylene, propylene, benzene and so on, which are used as a feedstock for producing intermediates. Intermediate chemicals are those petrochemical products, which are used to produce polymers and other industrial products
Ethylene32%
Propelene16%
Methane17%
Others35%
Hydrogen Sulphide3%
Nitrogen4%Oxygen
2%Ethane10%
Propame6%
Butane4%
Methane71%

Global Research - Saudi Arabia Global Investment House
October 2008 Saudi International Petrochemical Company - SIPCHEM �
Figure 01: Production Flow Diagram
Cru
de O
il
Gas
Prim
ary
Feed
Sto
ck
Seco
ndar
y Fe
ed S
tock
Proc
essi
ng U
nit
Bas
ic C
hem
ical
Inte
rmed
iate
s
Poly
mer
s, r
aw m
ater
ial f
or in
dust
ries
Gas
olin
e
Nap
htha
Ben
zene
Bas
ic C
hem
ical
Proc
essi
ng U
nit
Gas
olin
e
Gas
Oil
(Die
sel)
Nap
hta
Ker
osen
e
Eth
ane
Prop
ane
But
ane
Met
hane
Olefins
Eth
ylen
e
Prop
ylen
e
But
ene
Aro
mat
ics
Styr
ene
Ben
zene
Para
-Xyl
ene
Oxy
gena
tes
Met
hano
l
Met
hyl T
ertia
ry B
utyl
Eth
er
(MTB
E)
Crud
e Ind
ustri
al E
than
ol
I n t e r m e d i a t e s
P o l y m e r s
I n d u s t r i a l U s e s
Sour
ce:
Indu
stry
Sou
rces
& G
loba
l Res
earc
h

Global Research - Saudi Arabia Global Investment House
�0 October 2008Saudi International Petrochemical Company - SIPCHEM
3.3%4.2%4.1%
5.0%4.8%
1.7%
-2002 2003 2004 2005 2006 2007
0.0%1.0%2.0%3.0%4.0%5.0%6.0%
World Petrochemical Demand Growth Rate
20,00040,00060,00080,000
100,000120,000140,000
000 t
ons
Grot
h rate
4.0% 4.2%4.1%5.0%5.1%
1.1%
-20,00040,00060,00080,000
100,000120,000140,000
2002 2003 2004 2005 2006 20070.0%1.0%2.0%3.0%4.0%5.0%6.0%
World Petrochemical Production Growth Rate
000 t
ons
Grot
h rate
1.7% 1.6%
5.3% 5.3%
2.5%
5.2%
90,000.0100,000.0110,000.0120,000.0130,000.0
2002 2003 2004 2005 2006 20070.0%
2.0%
4.0%
6.0%
World Petrochemical Capacity Growth
000
tons
Gro
th ra
te
World Petrochemical Industry
Ease in capacity expansionGlobal petrochemical capacity increased at a CAGR of 3.3% to 128.4mn tons, during 2002-07. The major increase in petrochemical production capacity was witnessed in 2005 and 2006. However, in 2007 the growth was limited to 2.5% due to higher feedstock prices than 2005 and 2006.
Chart 05: World Petrochemical Capacity
Source: Global Research, Bloomberg & Industry Sources
Demand for petrochemical productsDemand is a driving force to increase capacity and improve capacity utilization, which results in an increase in production. The demand of petrochemical products has increased at a CAGR of 4% during 2002-07, with a sufficient world capacity to meet the existing demand. The rising prices of ethylene, propylene, and other basic petrochemical products have limited the demand growth between 4%-5% during the last 3-years.
Chart 06: World Petrochemical Demand (000 tons)
Source: Global Research, Bloomberg & Industry Sources
Higher capacity utilization leads to an increase in productionOver the last five years, the world capacity utilization has reached 90.3% in 2007, which is 3.3% higher than the capacity utilization in 2002. The improvement in capacity utilization has led the world production to increase at a 5-year CAGR of 3.9% to 117.7mn tons in 2007. The year-on-year production growth, during the last 3 years, remained at an average level of 4.5%-5%, as compared to a marginal growth of 1.1% in 2003.
Chart 07: World Petrochemical Production
Source: Global Research, Bloomberg & Industry Sources

Global Research - Saudi Arabia Global Investment House
October 2008 Saudi International Petrochemical Company - SIPCHEM ��
Capacity Expansion in ChinaChina, the world’s third largest petrochemicals market, is currently undergoing extensive expansions in ethylene capacities, adding almost 6.6mn tons of ethylene between 2008 and 2012. Ethylene capacities in China are planned to increase by 11.4mn to 11.6mn tons between 2008 and 2016.
China’s ethylene output will go up from 9.6mn tons in 2006 to 14 -18 mn tons by 2010. It is worth noting that most Chinese crackers will be naphtha based, which will result in a rapid growth in the heavy feedstock consumption and consequently this will exert upward pressure on the international naphtha prices.
Table 07: Chinese Ethylene Expansions
Company LocationCapacity
(1,000 mt)
Startup
Year
Projects Underway
Fujian Refining and Petrochemical Company Ltd(JV with Exxon)
Quangzhou 800 1Q2009
PETROCHINA
PetroChina Dushanzi PetroChemical Dushanzi, Xinjiang 1,000 2008
PetroChina Fushun PetroChemical Fushun, Liaoning 800 2010
PetroChina Chengdu Ethylene Project (New plant) Chengdu, Sichuan 800 2012
SINOPEC
Sinopec Zhenhai Refining & Chemical Co. Ltd Zhenhai, Zhejiang 800 - 1000 2009
Sinopec Tianjin Petrochemical Tianjin 800 2010
Sinopec Wuhan Co. Wuhan, Hubei 800 2012
In Early Planning
Sinopec Shanghai Chemical Park Ethylene Project Shanghai 1,000 2014+
Dalian Ethylene Project Dalian, Liaoning 1,000 2015+
Formosa Ningbo Ethylene Project Ningbo, Zhejiang 1,000 2015+
MTO
China Shenhua Group MTO Plant * Erdos,Inner Mongolia 600 2012
Shaanxi Yulin MTO Project * Yulin, Shaanxi 1,000 2013
Shenhua Dow * Shaanxi 1,000 2013+
Total 11,400 – 11,600
* Production will be 50% ethylene and 50% propyleneSource: The Gulf Petrochemicals and Chemicals Directory, Volume I
Alternative Feedstock Experiments in China Currently, China is undertaking extensive experiments to produce chemicals from coal in an attempt to find alternative cheap feedstock post the naphtha price surge. Coal represents almost 70% of the Chinese energy mix. Under this process, coal is converted to synthesis gas “syngas”, which can be then converted to different chemicals, among which is methanol. The methanol is converted to olefins (MTO) ethylene and propylene. Mostly in the planning stage, there are 12 to 14 MTO projects, with some under construction, that are based on coal.

Global Research - Saudi Arabia Global Investment House
�2 October 2008Saudi International Petrochemical Company - SIPCHEM
-1.002.003.004.005.006.007.008.009.00
2001 2002 2003 2004 2005 2006 2007 2008E 2009E 2010E 2011E
-10.0020.0030.0040.0050.0060.0070.0080.00
2001 2002 2003 2004 2005 2006 2007
Feed Stock PricesGas pricesCrude oil prices are used as a benchmark to set gas-well head price in the international markets. However, gas prices are highly subsidized in certain regions of the world, mainly the Middle-East, North Africa, and South Asia. The gas-well head prices, in these regions, are subject to have pre-determined discounts. At the same time, gas well head prices in the international markets, have shot up by 44.2% from US$4.4 per mmbtu in 2001 to US$6.3 per mmbtu in 2007.
Chart 08: Prices of Gas (US$ per mmbtu)
Source: EIA & Global Research
Crude oil pricesOver the period of the last 6 years, the basket price of OPEC crude oil has surged by 192.5% from US$23.01 per barrel in 2002 to US$67.31 per barrel in 2007. The increase in crude oil prices over the period of 5 years are mainly due to the following reasons:
• Global political uncertainty
• High global economic growth
• Lack of refining capacity which caused a shortage of refined products.
Chart 09: OPEC Historical Crude Oil Prices (US$ per barrel)
Source: OPEC
The average basket prices of OPEC crude oil prices were recorded at US$113.5 per barrel, in 3Q2008. The recent upward rally in the price of crude oil, which was started in the 4Q2007, has ended during the 3Q2008, which is mainly due to the ongoing global financial crisis. Going forward, we expect crude oil prices to ease down from the current level (3Q2008) to US$80.8 per barrel in 2011. This assumption is based on the following factors:
• Recovery of the financial market from the ongoing financial crisis.

Global Research - Saudi Arabia Global Investment House
October 2008 Saudi International Petrochemical Company - SIPCHEM ��
-
20.00
40.00
60.00
80.00
100.00
120.00
2007 2008E 2009E 2010E 2011E
Crude Oil US / bbl
• Slowdown in economic development and shifting towards gas base industries
• New refining capacity will come online by 2011, which will fulfill the shortage of refined products.
Chart 10: Forecasted OPEC Crude Oil Prices (US$ per barrels)
Source: OPEC& Global Research
Naphtha is a major feedstock for ethylene and propylene production. The natural gas, mainly ethane and propane, is also used in the manufacturing of these petrochemicals, despite the fact that the main component of the natural gas is the methane, which is primarily used for energy. Naphtha is a direct outcome of crude oil refining, hence the prices of naphtha is much correlated to the prices of crude oil.
World Petrochemical OutlookBased on our expectations, crude oil price will remain on the high side. Even after an expected relaxation, the average price is forecasted to remain in the range of US$80-US$90 per barrel in 2011 as compared to 3Q2008 average prices of US$113.5 per barrel. Since the prices of petroleum products and gas feedstock are derived from crude oil prices, we expect the price of international feedstock to remain high as well. The higher feedstock prices will not allow the global petrochemical industry to expand their margins, as the price of petrochemical products is subject to feedstock prices. Consequently, we expect a major expansion in petrochemical capacities will happen in those areas of the world where feedstock is available at cheap rates, including the MENA region and China. The capacity expansion in MENA and China is mainly due to the following:
•Effort of economic diversification i.e. shifts from oil based economies to industrial based economies.
•Plenty of gas reserves, which accounted for 51.9% of the world reserves. This enables these countries to supply gas at cheap rates. Moreover, the region has plenty of crude oil reserves, which enables the government to supply petroleum products with some specific discounts.
•Extraction of petrochemical products from coal has encouraged China to consider massive expansion in its petrochemical capacities. However, the effort is under process.
Prices of MethanolThe price of methanol has surged by 191.7% to US$472.6 pet ton in 2007 as compared to US$162 per ton in 2001. The increase in the price of methanol during the period of 2001-

Global Research - Saudi Arabia Global Investment House
�� October 2008Saudi International Petrochemical Company - SIPCHEM
0
100
200
300
400
500
600
2007 2008E 2009E 2010E 2011E
Methanol Prices
-
100.0
200.0
300.0
400.0
500.0
2001
2002
2003
2005
2006
2007
2004
07 is mainly because of higher gas prices, which have been increased due to higher crude oil prices. Moreover, methanol is derived from methane which is mainly obtained from the cracking of natural gas while sometime from naphtha. The availability of natural gas at high subsidize price of US$0.75 per mmbtu has further strengthened the margin of Saudi petrochemical units.
Chart 11: Historical Average Prices of Methanol (US$ per ton)
Source: Methanex
Goring forward, the expected future prices of methanol is based on the movement of our expected crude oil prices, which will also affect the price of natural gas in international market. Based on our expectations, the price of methanol will surge by 11.1% in 2008 to reach at US$525.1 per tons as compared to the average prices in 2007. However, we expect a gradual decline in the average prices of methanol to US$304.1 per ton in 2011, in line with our expected prices of crude oil.
Chart 12: Forecasted Average Prices of Methanol (US$ per ton)
Source: Methanex & Global Research
Implications…Methanol is used in manufacturing a wide variety of chemical products such as formaldehyde and Acetic Acid. Methanol, as a hydrogen carrier is being considered for fuel cell application and as an alternate fuel. Methanol was once known as wood alcohol, because it was originally produced as a by-product of the distillation of wood.

Global Research - Saudi Arabia Global Investment House
October 2008 Saudi International Petrochemical Company - SIPCHEM ��
MENA Petrochemical Industry
Petrochemical hubAs of 2007, the MENA region’s combined petrochemical production capacity reached 84.7mn tons, which represents 66% of total world capacity. This indicates that the region is the largest petrochemical producer in world.
Chart 13: Share of MENA in World’s Capacity 2007
Source: Zawya & Global Research
Saudi Arabia: The largest petrochemical playerIn 2007, Saudi Arabia occupied 52.8% of the total MENA capacity, through SABIC. SABIC is not only a major player in Saudi Arabia, but the company has a vital position in the international market. In 2007, SABIC accounted for 53.9% of the total Saudi Arabia’s capacity, 28.4% of MENA and 18.7% of the world. Next to Saudi Arabia, Iran, through National Petrochemical Company, has claimed 20.2% and Qatar has 11.3% of MENA capacity.
Table 08: Country-Wise MENA Capacity (000 tons)
Country 2007 Share
Saudi Arabia 44,686 52.8%
Iran 17,145 20.2%
Qatar 9,585 11.3%
Egypt 3,057 3.6%
Kuwait 2,133 2.5%
UAE 1,441 1.7%
Rest of MENA 6,628 7.8%
Total MENA Capacity 84,675 100%
Source: Zawya
Capacity Expansion in MENAMENA region has planned for a massive expansion of petrochemical capacity of different grades with an estimated cost of US$90.7bn (SR332.8bn). Based on the given expansion plans, the production capacity in MENA region will increase to 90.9mn tons in 2008 and 104.1mn tons in 2009. Going forward, we expect the production capacity will increase to 114.6mn tons by 2011, at a 4-year CAGR of 8.2%. Major capacity expansion in petrochemicals of different grades is expected in Saudi Arabia, which will account for 61.3% in 2008 followed by Kuwait which is expected to contribute by 25.5%. In addition, after 2011, production capacity in MENA region will further increase by 3.4mn tons in 2012, due to upcoming capacity expansion in Saudi Arabia and Qatar.
MENA66%
Rest of the world34%

Global Research - Saudi Arabia Global Investment House
�� October 2008Saudi International Petrochemical Company - SIPCHEM
14. 5%
7.3%
4. 0%7.4%
-20.0040.0060.0080.00
100.00120.00140.00
2008E 2009E 2010E 2011E
0.0%
5.0%
10.0%
15.0%
20.0%
Total Capacity Expansion Growth In Capacity Expansion
Chart 14: MENA Capacity Expansion
Source: Zawya & Global Research
Product-wise capacity expansionThe total expected increase of 31.2mn tons, till 2011, in the petrochemical products capacities of different grades, in the MENA region, is based on the addition of (i) 16.9mn tons of basic chemical-olefins, (ii) 5.6mn tons of basic chemical-Aromatics and (iii) 8.8mn tons of basic chemical-oxygenates.
Table 09: Grade-Wise Capacity Expansion in MENA (Tons)
2008E 2009E 2010E 2011E
Basic-Olefins 2,982,500 6,837,500 3,629,250 3,409,750
Basic-Aromatic 1,848,750 2,566,250 1,200,000 -
Basic-Oxygenate 1,339,000 3,643,000 2,788,000 1,020,000
Expected Expansion 6,170,250 13,046,750 7,617,250 4,429,750
Source: Zawya & Global Research
Country-wise capacity expansionSaudi Arabia – Capacity expansionSaudi Arabia is expected to make an addition of 3.84mn tons of basic chemical of different grades out of the total additions in regional capacities of 6.27mn tons in 2008. The contribution, however, will increase to 6.54mn tons in 2009, and will taper down to 4.2mn tons in 2010.
Table 10: Saudi Arabia Additional Capacity (Tons)
2008E 2009E 2010E 2011E
Basic-Olefins 2,232,500 5,437,500 3,600,000 1,900,000
Basic-Aromatic 573,750 191,250 600,000 -
Basic-Oxygenate 1,039,000 913,000 - -
Expected Expansion 3,845,250 6,541,750 4,200,000 1,900,000
Total Expected Expansion 6,170,250 13,046,750 7,617,250 4,429,750
Contribution in Expansion 62.3% 50.1% 55.1% 42.9%
Source: Zawya & Global Research
Kuwait – Capacity expansionBased on the given expansion plan, production capacities of basic chemicals in Kuwait will increase by 1.5mn tons in 2008 and 2.7mn tons in 2009. This will increase the country’s capacity from 2.1mn tons in 2007 to 6.3mn tons in 2009.
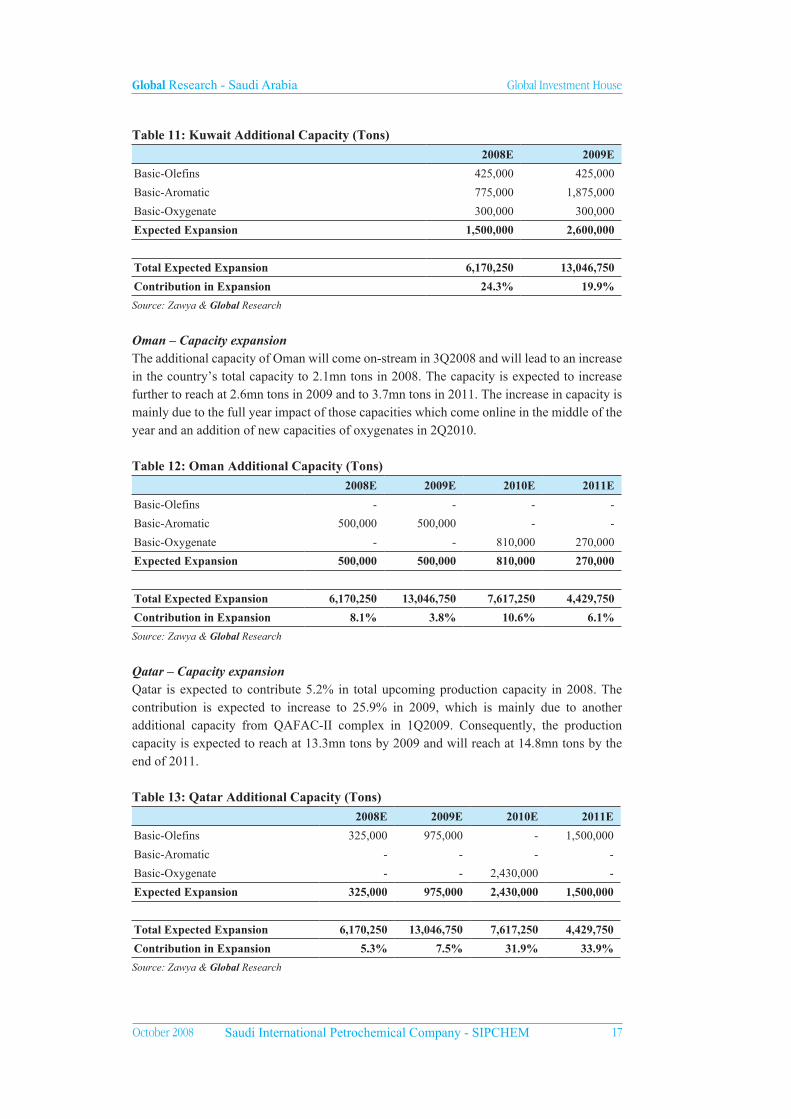
Global Research - Saudi Arabia Global Investment House
October 2008 Saudi International Petrochemical Company - SIPCHEM ��
Table 11: Kuwait Additional Capacity (Tons)
2008E 2009E
Basic-Olefins 425,000 425,000
Basic-Aromatic 775,000 1,875,000
Basic-Oxygenate 300,000 300,000
Expected Expansion 1,500,000 2,600,000
Total Expected Expansion 6,170,250 13,046,750
Contribution in Expansion 24.3% 19.9%
Source: Zawya & Global Research
Oman – Capacity expansionThe additional capacity of Oman will come on-stream in 3Q2008 and will lead to an increase in the country’s total capacity to 2.1mn tons in 2008. The capacity is expected to increase further to reach at 2.6mn tons in 2009 and to 3.7mn tons in 2011. The increase in capacity is mainly due to the full year impact of those capacities which come online in the middle of the year and an addition of new capacities of oxygenates in 2Q2010.
Table 12: Oman Additional Capacity (Tons)
2008E 2009E 2010E 2011E
Basic-Olefins - - - -
Basic-Aromatic 500,000 500,000 - -
Basic-Oxygenate - - 810,000 270,000
Expected Expansion 500,000 500,000 810,000 270,000
Total Expected Expansion 6,170,250 13,046,750 7,617,250 4,429,750
Contribution in Expansion 8.1% 3.8% 10.6% 6.1%
Source: Zawya & Global Research
Qatar – Capacity expansionQatar is expected to contribute 5.2% in total upcoming production capacity in 2008. The contribution is expected to increase to 25.9% in 2009, which is mainly due to another additional capacity from QAFAC-II complex in 1Q2009. Consequently, the production capacity is expected to reach at 13.3mn tons by 2009 and will reach at 14.8mn tons by the end of 2011.
Table 13: Qatar Additional Capacity (Tons)
2008E 2009E 2010E 2011E
Basic-Olefins 325,000 975,000 - 1,500,000
Basic-Aromatic - - - -
Basic-Oxygenate - - 2,430,000 -
Expected Expansion 325,000 975,000 2,430,000 1,500,000
Total Expected Expansion 6,170,250 13,046,750 7,617,250 4,429,750
Contribution in Expansion 5.3% 7.5% 31.9% 33.9%
Source: Zawya & Global Research

Global Research - Saudi Arabia Global Investment House
�8 October 2008Saudi International Petrochemical Company - SIPCHEM
Table 14: MENA Capacity Expansion (Tons)
Country Basic-Olefins Basic-Aromatic Basic-Oxygenate Expected Production
Saudi Arabia 252,000 2Q2008
Saudi Arabia 50,000 2Q2008
Saudi Arabia 950,000 4Q2008
Saudi Arabia 1,700,000 2010
Saudi Arabia 3,800,000 3Q2010
Saudi Arabia 230,000 715,000 2Q2008
Saudi Arabia 2,100,000 2012
Saudi Arabia 1,285,000 4Q2008
Saudi Arabia 600,000 2010
Saudi Arabia 1,200,000 2009
Saudi Arabia 1,700,000 3Q2008
Kuwait 850,000 450,000 600,000 3Q2008
Kuwait 1,100,000 3Q2008
Kuwait 1,100,000 1Q2009
UAE 600,000 2010
Egypt 350,000 4Q2009
Oman 1,080,000 2Q2010
Oman 1,000,000 3Q2008
Qatar 1,300,000 4Q2008
Qatar 2,430,000 1Q2010
Qatar 1,500,000 2011
Qatar 880000 600000 2012
Qatar 1,300,000 2012
Algeria 1,000,000 4Q2010
Algeria 1,400,000 2012
Bahrain 1,728,000 2010
Source: Zawya & Global Research

Global Research - Saudi Arabia Global Investment House
October 2008 Saudi International Petrochemical Company - SIPCHEM ��
Saudi Petrochemical Industry
IntroductionSaudi Arabia is a key player in the global petrochemical industry commanding a 34.8% and 52.8% of the world and MENA petrochemical production capacity in 2007, respectively. The major part of Saudi Arabia’s petrochemical production is exported. The Saudi petrochemical industry is mainly concentrated in the industrial cities of Jubail and Yanbu.
Chart 15: Saudi Arabia Share in World Chart 16: Saudi Arabia Share in Region 2007 2007
Source: Global Research
Feedstock a competitive edgeThe Kingdom’s petrochemical industry enjoys high profit margins, mainly due to a natural competitive advantage of availability of low cost feedstock, on account of vast crude oil and natural gas resources. The cost of natural gas for the Saudi Arabian petrochemical industry is just US$0.75/mmbtu, which is far below than the international prices.
Table 15: Gross Margins on Petrochemical Products in Saudi Arabia
2008E 2009E 2010E 2011E
Ethylene Average High High High
Propylene Average High High High
MTBE Low Low Low Low
Styrene Average Average Average Average
Benzene High High High High
Paraxylene Low Low Low Low
Mono Ethylene Glycol Average Low Low Low
Di Ethylene Glycol Average Average Average Average
Teri Ethylene Glycol Average Average Average Average
Purified Terephthalic Acid - PTA Low High High High
Ethylene Di Chloride High High High High
Caustic Soda Low Average High High
Vinyl Chloride Monomer - VCM Average Average Average Average
Polyethylene Average Average Average Average
Polypropylene Average Average Average Average
Polyvinyl Chloride - PVC High High High High
Polyethylene Terephthalate Resin - PET High Average Average Low
Polystyrene - PS Low Low Low Low
Source: Global ResearchNote: High Return = 50%, Average Return = 20%-50%, Low Return = Below 20%
MENA47%Saudi Arabia
53%
Rest of the World65%
Saudi Arabia35%

Global Research - Saudi Arabia Global Investment House
20 October 2008Saudi International Petrochemical Company - SIPCHEM
The WTO agreement confirmed Saudi Arabia has the right to retain low feedstock prices on the grounds that its hydrocarbon resources are a natural advantage and low prices are not classed as a subsidy. The agreement also allows a dual pricing system, where domestic users pay less than the export price for feedstock, under the reasoning that domestic customers do not require export infrastructure or export marketing.
Major Players
Saudi Arabian Basic Industries (SABIC)SABIC is the world’s leading petrochemical producing company and was established by the Saudi government in 1976 in furtherance of a government policy to diversify the Saudi industrial base outside the oil sector and in order to make use of crude oil-associated gases at well-heads which had, until that point, been flared off. The intention was to build a chain of basic, large-scale industries located close to or with easy access to gas resources and to develop export-oriented non-oil businesses of strategic importance to Saudi Arabia, including hydrocarbon-based chemicals and basic metal industries.
Now SABIC has a total 21 petrochemical affiliates and YANSAB is one of them. The affiliates of SABIC are distinguished in six strategic business units (SBUs), organized by products. These are: Basic Chemicals, Intermediates, Polymers, Specialized Products, Fertilizers, and Metals. Each of these is headed by a Vice-President. These six business units make four different kinds of products:
1 Chemicals – Basic Chemicals, Intermediates and Specialized Products (three SBUs)
2 Plastics – Polymers (one SBU)
3 Fertilizers (one SBU)
4 Metals (one SBU)
Table 16: SABIC’s Affiliates
Name of Affiliates LocationHolding of
SABIC
Arabian Petrochemical Company Saudi Arabia 100.00%
SABIC Asia Pacific Singapore Singapore 100.00%
SABIC Industries Investments Company Saudi Arabia 100.00%
SABIC Innovative Plastics United States 100.00%
SABIC Luxembourg Luxembourg 100.00%
SABIC Sukuk Company Saudi Arabia 100.00%
SABIC UK Petrochemicals UK 100.00%
Saudi Iron and Steel Company Saudi Arabia 100.00%
Saudi European Petrochemical Company Saudi Arabia 80.00%
Jubail United Petrochemical Company Saudi Arabia 75.00%
National Industrial Gases Company Saudi Arabia 70.00%
Yanbu National Petrochemicals Company Saudi Arabia 56.00%
Arabian Industrial Fibers Company Saudi Arabia 53.90%

Global Research - Saudi Arabia Global Investment House
October 2008 Saudi International Petrochemical Company - SIPCHEM 2�
Al Jubail Fertilizer Company Saudi Arabia 50.00%
Al Jubail Petrochemical Company Saudi Arabia 50.00%
Eastern Petrochemical Company Saudi Arabia 50.00%
National Chemical Fertilizer Company Saudi Arabia 50.00%
National Methanol Company Saudi Arabia 50.00%
Saudi Methanol Company Saudi Arabia 50.00%
Saudi Petrochemical Company Saudi Arabia 50.00%
Saudi Yanbu Petrochemical Company Saudi Arabia 50.00%
Saudi Arabian Fertilizer Company Saudi Arabia 42.99%
Saudi Kayan Petrochemical Company Saudi Arabia 35.00%
Gulf Petrochemical Industries Company Bahrain 33.33%
Gulf Aluminum Rolling Mill Company Bahrain 30.28%
Maaden Phosphate Company Saudi Arabia 30.00%
Power and Water Utility Company for Jubail and Yanbu Saudi Arabia 24.81%
Aluminum Bahrain [Via SABIC Industries Investments Company] Bahrain 20.00%
National Chemical Carriers Saudi Arabia 20.00%
Source: Zawya
Saudi Chemical CompanySaudi Chemical’s line of production includes the latest generation, safest, and world wide commonly used civil explosives and non-electrical detonators, which are KEMULEX, PRILLEX, and SANEL, respectively. KEMULEX is an emulsion type explosive characterized by its high detonation velocity and good waterproof properties and packaged in special plastic cartridges with different sizes that meet the clients’ needs. PRILLEX is a dry blasting agent, which is composed of Ammonium Nitrates and Fuel Oil (ANFO).
Saudi Chemical Company also manufactures non-electric detonators “SANEL” that provide the precious control and accuracy that reduces blasting vibration and improves fragmentation for all kind of blasting. SANEL is produced in a wide range of delay times, lengths, and models for different types of use. In addition, the company offers wide variety of Electrical Detonators, and Detonating Cords, in addition to all accessories for rock blasting and oil exploration shooting.
Progress continues and Saudi Chemical proceeds along the path of ongoing improvement, advancing in all aspects that go beyond expectation to provide domestic and global supplies of most modern explosives. This resulted in new production line for ENVIROSEIS, the latest in seismic explosives specially designed for seismic exploration. Proudly, ENVIROSEIS is now used for oil and gas exploration in Saudi Arabia. It is worth mentioning that the company’s activity is not limited to production of civil explosives only, but also will be extended to include military explosives in manufacturing and demilitarization processes. Sahara Petrochemical CompanySince its establishment in 2004, Sahara’s management team has been successfully working on two projects, Al Waha Petrochemical Company, its first majority owned subsidiary and on its affiliated participation in Saudi Olefins and Polyolefins Company (SEPC), both of which are expected to become operational by the fourth quarter of 2008.

Global Research - Saudi Arabia Global Investment House
22 October 2008Saudi International Petrochemical Company - SIPCHEM
8.3%
5.2%
5.5%12.3%
-
2008E 2009E 2010E 2011E
0.0%
5.0%
10.0%
15.0%
Capacity Expansion Growth
Al Waha Petrochemical Company (Al-Waha) is located in the Industrial City of Jubail in the Eastern Province of the Kingdom of Saudi Arabia. The affiliate (Al-Waha) was established in September of 2006, as Sahara’s first majority owned industrial project subsidiary. Al Waha is a limited liability joint venture company, which is to construct, own and operate a world scale petrochemical complex for the production of 460,000 tons of propylene that will serve as feedstock for the production of 450,000 tons of polypropylene. The polypropylene will be sold both within the region and into international markets.
Sahara, together with Tasnee Petrochemical Company (Tasnee) 50.6% stake owner and the Basell group of companies (Basell) holding 25% stake, formed a new company to develop, finance, construct, commission, own, manage and operate a world-scale petrochemical complex for the production of some 1,000,000 tons of ethylene, 80% of which will be used as the primary feedstock for the production of approximately 800,000 tons of polyethylene. The Saudi Ethylene and Polyethylene Company (SEPC) is also located in Al-Jubail Industrial City, Saudi Arabia with commercial operations set to begin in the fourth quarter of 2008.
Capacity expansionDuring the last 4 years, the growth in Saudi Arabia’s economy is mainly due to higher crude oil prices. This depicts a serious threat for the country in case of ease in crude oil prices. In order to minimize this risk the government of Saudi Arabia has promoted non-oil industries. Consequently, a massive expansion in petrochemical has been taken into account, which will increase at a CAGR of 7.8% during the period from 2007 to 2011.
Chart 17: Saudi Arabia Capacity Expansion
Source: Zawya and Global Research
Major new capacities in Saudi Arabia are expected to locate in Jubail industrial area. In our valuations, we have not incorporated the upcoming capacity of SIPCHEM’s olefins complex, as it will come online in 2012 with a designed capacity of 2.1mn tons.
Major capacity expansion – Company WiseMajor additional petrochemical capacity in Saudi Arabia is expected from Saudi Kayan Petrochemical Company (KAYAN), which will come on line on 3Q2010. KAYAN is expected to contribute by 23% in the total Saudi Arabia expansion of 16.5mn tons. However, the capacity from Eastern Petrochemical (SHARQ) and YANSAB will contribute to 24.3%, with a combined capacity of 4mn tons.

Global Research - Saudi Arabia Global Investment House
October 2008 Saudi International Petrochemical Company - SIPCHEM 2�
Table 17: Capacity Expansion by Company
Name Basic-Olefins Basic-Aromatic Basic-Oxygenate Expected Production
Saudi European-IBN ZAHR 950,000 - - 4Q2008
Sino-Saudi Petrochemical Project 1,700,000 - - 2010
Saudi Kayan 3,800,000 - - 3Q2010
Sharq-Eastern Petrochemical 2,000,000 - - 3Q2008
YANSAB 2,005,000 - - 4Q2008
SIPCHEM-Olefins 2,100,000 - - 2012
Sahara/Tanesse-Saudi Ethylene &
Propylene Plant1,285,000 4Q2008
Petrokemya-PVC and Offsite - - - 2010
Sadaf-Styrene Plant-Saudi
Petrochemical- 600,000 - 2010
Delta Oil 1,200,000 - - 2009
Source: Zawya & Global Research

Global Research - Saudi Arabia Global Investment House
2� October 2008Saudi International Petrochemical Company - SIPCHEM
SIPCHEM Competitors’ Profile
Based on the, current, production mix of the Company, we have identified the following potential competitors in local and regional market.
•Saudi Methanol Company (Ar-Razi)
•Egyptian Methanex Methanol Company (EMETHANEX)
•National Methanol Company (Ibn Sina)
•Oman Methanol Company (OMC)
•Salalah Methanol Company (SMC)
Saudi Methanol Company-Ar Razi The company was formed in 1979 in Saudi Arabia under a 50-50 joint venture between SABIC and Japanese companies (led by Japan Saudi Arabia Methanol Company). This was the first joint venture of SABIC. The basic activity of Ar Razi is to produce chemical grade methanol with a designed capacity of 3.3mn tons. However, the additional capacity of 1.7mn tons of methanol will lead the overall production capacity of the complex to 5mn tons by the end of 2008. Moreover, the expansion cost was estimated at SR2.2bn (US$600mn) for the complex. Egyptian Methanex Methanol Company-EMETHANEXEMETHANEX was established as a limited liability company in 2005. The plant of the company is under developmental stage and is designed to produce 1.3mn tons of Methanol per year. The majority of the shareholding is held by Methanex Corporation, which accounts for 60% of the total stakes. The remainder stakes are held by (i) Egyptian Natural Gas Holding Company (12%), (ii) Egyptian Petrochemicals Holding Limited (12%), Egyptian Natural Gas Company (9%) and Arab Petroleum Investments Corporation (7%). The present shareholding structure shows an undisrupted supply of gas to the plant at subsidize rate of US$2.5-US$2.75 pet mmbtu.
National Methanol Company-Ibn Sina Ibn Sina is a joint venture of (i) SABIC, which holds 50% stakes, (ii) Duke Energy Corporation, holds 25% stakes and (iii) Hoechst Celanese Chemicals, holds 25% stakes. The company has a designed capacity to produce 2.1mn tons of Methanol and MTBE.
Oman Methanol Company-OMCOMC is a joint venture between Methanol Holding International Limited-MHIL of Trinidad, Oman Methanol Holding Company, which is a division of Omar Zawawi Establishment (OMZEST) Group & MAN Ferrostaal Methanol Holding Limited. The project has the backing of MHIL, which already has four methanol plants in Trinidad and Tobago and is in the process of constructing the world’s largest methanol plant with a production capacity of 1.9mn tons.
OMC has constructed a methanol producing complex with a design producing capacity

Global Research - Saudi Arabia Global Investment House
October 2008 Saudi International Petrochemical Company - SIPCHEM 2�
of 1.1mn tons in the Sohar Industrial Port area, which will use Johnson Matthey LPM technology as originally developed by ICI. The complex is managed and operated by Oman Plants Services Company-OPSC, which is a joint venture between Oman Mechanical Services Company, a part of The OMZEST Group and Industrial Plant Services Limited, a Trinidadian company which manages and operates Methanol Holding Trinidad Limited’s methanol plants in Trinidad. Salalah Methanol Company-SMCSMC is a subsidiary of Oman Oil Company-OOC and was established in 2006 with the principle activities (i) to produce 1.2mn tons of methanol, (ii) water desalination and (iii) waste water treatment. Currently, the petrochemical complex of SMC is under developmental phase and is expected to start commercial production of by the end of 2009.

Global Research - Saudi Arabia Global Investment House
2� October 2008Saudi International Petrochemical Company - SIPCHEM
-1,000.02,000.03,000.04,000.05,000.06,000.07,000.0
2004 2005 2006 2007-20.040.060.080.0100.0120.0140.0160.0180.0
Longtermloans - LHS Assetbase _ LHS Depriciation - RHS Financial Cost - RHS
72.4%72.7%
77.6%
71.5%
-200.0400.0600.0800.0
1,000.01,200.01,400.01,600.01,800.0
2004 2005 2006 200768.0%70.0%72.0%74.0%76.0%78.0%80.0%
Gross Profit (excluding depriciation Cost) Gross Profit Margins
SIPCHEM Financial Overview
Growth in sales revenue Since inception, the sale revenues of the Company have increased at a CAGR of 274%, during 2004-07. The increase in the sale revenues of the Company during the last 3 years are mainly due to (i) commencement of production of methanol, through IMC in mid 2004, (ii) start-up of BDO in late 2005, through its affiliates IDL. Moreover, the increase in the average prices of methanol and BDO, on account of higher crude oil prices, has also fueled the sales revenue of the Company.
High gross marginsHistorically, the gross margins (excluding depreciation cost) of the Company remained higher since inception, at an average level of 73.5%. The major reason of high gross margins is the availability of feed stock gas at highly subsidize rate of US$0.75 per mmbtu and butane (from naphtha) at 30%-35% lower than the average prices in international market.
Chart 18: Gross Profit (SR mn) & Gross Margins (Excluding Depreciation Cost)
Source: Company Reports & Global Research
Increase in asset-base inflates financial & depreciation chargesThe consistent efforts to expand the manufacturing operation of the Company through (i) establishment of IMC and IDL in 2005 and 2006 respectively and (ii) planned development of Acetyl complex by 2009 have led the management to go for long-term loans. Consequently, the asset base of the Company has been increased from SR2.2bn in 2004 to SR5.4bn in 2007 which has led the depreciation cost to reach at SR164.1bn in 2007.
Chart 19: Long-Term Loans, Asset Base, Depreciation & Financial Cost (SR mn)
Source: Company Reports & Global Research

Global Research - Saudi Arabia Global Investment House
October 2008 Saudi International Petrochemical Company - SIPCHEM 2�
71.1%73.1%79.2%
100.6%
44.8%
78.3%
37.0% 38.9%
-200.0400.0600.0800.0
1,000.01,200.0
2004 2005 2006 20070.0%20.0%40.0%60.0%80.0%100.0%120.0%
EBITDA EBITDA MarginProfitability Profitability Margin
Surge in profitabilityRapid increase in the sale revenues of the Company has eliminated the impact of higher depreciation and financial cost, which has led profitability to increase at a CAGR of 359.8%, during 2004-07, and reached at SR593.9mn in 2007. However, the net profit margin has declined to 38.9% in 2007 as compared to 78.3% in 2004. Furthermore, the EBITDA of the Company has surged to SR1,087mn in 2007 as compared to SR7.8mn in 2004, with the average EBITDA margins 81% during the same period.
Chart 20: Profitability & EBITDA (SR mn)
Source: Company Reports & Global Research
Major concernsThe prime risk of the company is on the supply of feedstock, which includes naphtha (propane) and natural gas. As Saudi Aramco is the only supplier of feedstock to the Company, the risk of constant supplies of raw material from Saudi Aramco is associated with the Company.
SIPCHEM is enjoying the benefit of getting Naphtha and natural gas, as a feed stock at subsidized rates like other Saudi Arabian petrochemical complexes. This provides the competitive edge to the Company on regional competitors.
SIPCHEM has to face stiff competition within the country with Ar-Razi and Ibn-Sina methanol producing complexes, as both of these complexes are the affiliates / subsidiaries of SABIC. Thus, the Company has to face stiff competition with SABIC on a local, regional and international basis. The Company is enjoying the benefit of having a BDO producing complex, and is one of the few petrochemical companies in Saudi Arabia.
Production growthBy the end of 2007, the production of the Company had reached 772,990 tons out of which methanol production accounted for 89.5%, while BDO production recorded at 34,619 tons and the remainder is Ma production. The production in 2008 is expected to decline by 3.4% due to the expectations of lower capacity utilization i.e. at 100% with the domination of methanol production. The completion of the Acetyl complex in 3Q2009 will lead production to grow at a CAGR of 20.4%, during 2007-11. Furthermore, by the end of 2011, the Company will be able to expand its product-line by adding AA, AAn, VAM and CO. Despite the, expected commencement of production from Acetyl complex, methanol is expected to remain the Company’s main product till 2011, though the share of methanol is expected to dilute and reach at 40% in overall production of the Company.

Global Research - Saudi Arabia Global Investment House
28 October 2008Saudi International Petrochemical Company - SIPCHEM
-3.5%
25.0%11.1%
19.7%14.5%
83.7%
-500.0
1,000.01,500.02,000.02,500.03,000.0
2006 2007 2008E 2009E 2010E 2011E-20.0%0.0%20.0%40.0%60.0%80.0%100.0%
Sales Revenue Sales Growth
3.6%
-26.0%
1.3% -3.4%
58.8%37.0%
0.0%
-200,000400,000600,000800,000
1,000,0001,200,000
2005 2006 2007 2008E 2009E 2010E 2011E-30.0%-10.0%10.0%30.0%50.0%70.0%90.0%
Methanol-IMCCarbon Monoxide
BDO-Beutaidiol-IDLAcetic Acid & Acetic Anhydride
Malice anhydrideVinyl Actate Monomer
Production Growth
Chart 21: Production Growth (Tons)
Source: Company Reports & Global Research
Sale revenues growthThe price of crude oil is expected to remain on the higher side, despite an expected relaxation in prices in 2009, which will force the price of methanol, VAM and BDO to remain on the higher side as compared to the average prices by the end of 2007. While the prices of methanol is expected to relax down to US$304.1 per ton by 2011 as compared to US$472.6 per ton in 2007. However, YoY basis, our expected average prices of methanol is expected to depict a decline of 34.2% in 2009, 7.1% in 2010 and 5.2% in 2011. Moreover, the completion of Acetyl Complex by 3Q2009, will help the Company to register a growth in sales revenue, which is expected to increase at a CAGR of 12.5%, during 2007-11.
Chart 22: Sales Revenues (SR mn)
Source: Company Annual Reports & Global Research
Sales revenue mixCurrently, the sales revenue of the Company is mainly composed on the sales of methanol, which constitute 68.3% in 2007, which is mainly due to the higher contribution in the overall production of the Company. The contribution in 2008 is expected to remain at same level as it recorded in 2007, since no new production is expected to come online during the year. However, upon the completion of acetyl complex, in 3Q2009, the product line of the Company will expand and utilize 70% production of methanol as a feed stock for IAC. Thus, the contribution from methanol will decline to 35.2% in 2009, which will further get diluted in 2010 and reach 21.2% in 2011 with an increasing contribution of VAM in total sales. Furthermore, we expect 80% of AA production will use as the feed stock for the production of VAM.

Global Research - Saudi Arabia Global Investment House
October 2008 Saudi International Petrochemical Company - SIPCHEM 2�
9.1%9.7%
6.8%7.0%9.1%
10.2%9.2%
-100.0200.0300.0400.0500.0600.0700.0800.0900.0
1,000.0
2005 2006 2007 2008E 2009E 2010E 2011E0.0%
2.0%
4.0%6.0%
8.0%
10.0%12.0%
Profitability ROAA
19.0%18.6% 17.3%
12.3%10.7%
14.3%12.6%
-
200.0
400.0
600.0
800.0
1,000.0
2005 2006 2007 2008E 2009E 2010E 2011E0.0%
5.0%
10.0%
15.0%
20.0%
Profitability ROAA
62.7%70.2%
57.8%
-200.0400.0600.0800.0
1,000.01,200.01,400.01,600.0
2007 2008E 2009E 2010E 2011E0.0%10.0%20.0%30.0%40.0%50.0%60.0%70.0%80.0%
58.3%60.0%
Growth Profit Growth Margins
Chart 23: Sales Revenue Mix 2008E Chart 24: Sales Revenue Mix 2011E
Source: Global Research
Improving gross profit marginsThe gross margin of the Company is expected to shown an improvement and will reach 70.5% by the end of 2008 from 62.7% in 2007. This is mainly due to the expected increase in methanol prices in international market with the feedstock availability at US$0.75 per mmbtu in Saudi Arabia. Furthermore, the completion of acetyl complex in 3Q2009 will increase the depreciation cost, which will result in a contraction in gross profit margins for the Company and limited GP margins in the range of 57%-60%.
Chart 25: Improving Gross Profit (SR mn) & Margins
Source: Global Research
Improving ProfitabilityThe Company is expected to register after tax profit of SR611.2mn (translating into EPS of SR1.8) in 2008 as compared to SR593.9mn in 2007. The increase in 2008 profitability is mainly due to the improvement in gross margins. Furthermore, we expect the return on average assets (ROAA) of the Company will remain at 7.0% in 2008 as compared to 9.1% in 2007. This is mainly due to a higher CAPEX on account of Acetyl Complex. The return on average equity (ROAE), on the other hand, is expected to dilute from 17.3% in 2007 to 12.3% in 2008, which is mainly due to higher equity-base following rights issue. However, the completion of Acetyl Complex will lead the profitability of the Company to increase at a CAGR of 10.2%, during 2007-11.
Chart 26: Profitability (SR mn) & ROA Chart 27: Profitability (SR mn) & ROE
Source: Company Reports & Global Research
Malice Anhydride23.4%
Methano-IMC68.3%
BDO-Beutaidiol-IDL8.3%
Methano-IMC 21.2%
BDO-Beutaidiol-IDL5.0%
Malice Anhydride15.3%Carbon Monoxide 15.3%
Vinyl Acetate Monomer34.5%

Global Research - Saudi Arabia Global Investment House
�0 October 2008Saudi International Petrochemical Company - SIPCHEM
Acetyl Complex & Impact On Profitability
The future growth of SIPCHEM is based on the timely completion of the Acetyl Complex. The complex comprises of three plants which are vertically integrated with each other and also the methanol plant as well. Hence, the feedstock of the additional capacity is internal generated, which will help the Company to reduce costs (excluding depreciation).
Figure 02: Acetyl Complex Production Flow
Source: SIPCHEM Prospectus & Global Research
We have conducted a sensitivity analysis of the commencement of production from acetyl complex by using different time scenario.
Table 18: Acetyl Complex Commissioning (EPS in SR)-Scenario AnalysisBase
Assumption*
Commencement
in 1Q2010
Commencement
in 3Q2010
Commencement
in 1Q2011
Commencement
in 3Q2011
2008E 1.8 1.8 1.8 1.8 1.8
2009E 2.0 0.9 0.9 0.9 0.9
2010E 2.8 2.8 1.7 0.6 0.6
2011E 2.6 2.6 2.6 2.6 1.6
* Expected commencement of production from acetyl complex in 3Q2009Source: Global Research
Complexes Feed Stocks
CO Plant 300,000 tons AA plant 450,000 tons VAM 300,000 tons
Methanol Ethylene OxygenNatural Gas
Common Utilities
Port Facilities
H2 65,000

Global Research - Saudi Arabia Global Investment House
October 2008 Saudi International Petrochemical Company - SIPCHEM ��
Polyolefins Complex
The next expansion plan of the Company is the establishment of envisaged olefins complex, which will comprise a world scale ethane/propane cracker manufacturing facilities for producing various derivatives including polymers, speciality chemicals, engineering plastics, fabricated plastics and value added downstream products. The project was initially expected to come online by the end of 2012 and now the status of this project is unclear, so we have not taken the impact of this project in our valuation.
Figure 03: SIPCHEM Polyolefins Complex Production Flow
Prim
ary
Seco
ndar
y
Ole
fins
Cra
cker
By
Pro
duct
s
Eth
ylen
e 1m
n to
ns
Pro
pyle
ne 2
20,0
00 t
ons
Am
mon
ia 6
00,0
00 t
ons
AC
N 2
00,0
00
tons
PAN
50,
000
tons
Car
bon
Fib
er
3,00
0 t
ons
LD
PE
400
,000
ton
s
HD
PE
400
,000
ton
s
VA
M 3
30,0
00 t
ons
MM
A 2
50,0
00 t
ons
PM
MA
30,
000
tons
Sodi
um C
yani
de
50,0
00 t
ons
HD
Pip
e 15
,000
to
ns
HD
Flil
ms
20,0
00 t
ons
HD
Pal
lets
30
,000
ton
s
PV
A
PV
OH
40,
000
tons
EV
OH
15,
000
tons
Sour
ce:
SIP
CH
EM
Pro
spec
tus
& G
loba
l Res
earc
h

Global Research - Saudi Arabia Global Investment House
�2 October 2008Saudi International Petrochemical Company - SIPCHEM
9M-2008 Financial Results
SIPCHEM has reported a net profit of SR502.1mn in 9M-2008, against the net profit of SR339.9mn in corresponding period last year. The improvement in profitability is mainly due to the increase in methanol prices from US$401.0 per ton to US$579.0 per ton, with the subsidized prices of feedstock gas at US$0.75 per mmbtu. Consequently, the Company has shown an improvement in gross margins, which had recorded at 61.6%, in 9M-2008, as compared to 58.0% in the corresponding period last year.
Table 19: 9M-2008 Income Statement
SR ‘000’ 9M-2007 9M-2008 Change
Net Sales 1,025,648 1,472,076 43.5%
Cost of Sales (430,772) (565,603) 31.3%
Gross Profit 594,876 906,473 52.4%
Selling, General & Administrative Expenses (37,359) (45,055) 20.6%
Operating Income 557,516 861,417 54.5%
Financial Charges (71,766) (62,779) -12.5%
Other Income 5,335 11,388 113.5%
Investment Income 25,829 31,049 20.2%
Net Expenses of pre-operating expenses + Provision for project
developmental cost(623) (54,639) 8670.3%
Minority Interest (160,168) (259,742) 62.2%
Net Profit Before Zakat 356,123 526,694 47.9%
Zakat (16,229) (24,636) 51.8%
Net Profit After Zakat 339,893 502,058 47.7%
Source: Company Accounts
The balance sheet size of the company, during 9M-2008, has increased by 23.4% from the reported size of SR7.8bn by the end of 2007. During the period, share capital of the company has increased from SR2bn to SR3.3bn, which is mainly due to issuance of right shares at SR15 per share with SR5 per share as a premium to finance the acetyl project. On the other hand, the obligation of the Company has shown a decline of 9.1%, during the period under review, to SR3.5bn from SR3.8bn by the end of 2007, thus improving the current ratio to 2.4x, in 9M-2008, as compared to 0.92x by the end of 2007.

Global Research - Saudi Arabia Global Investment House
October 2008 Saudi International Petrochemical Company - SIPCHEM ��
Table 20: 9M-2008 Balance Sheet
SR ‘000’ 2007 9M-2008
Assets
Total Current Assets 1,995,522 2,215,316
Total Fixed Assets 5,755,300 7,076,267
Other Assets - 273,699
Total Assets 7,750,822 9,565,282
Liabilities & Equity
Total Current Liabilities 2,164,335 905,812
Total Non-Current Liabilities 1,694,328 2,602,643
Provisions - -
Total Liabilities & Provisions 3,858,663 3,508,454
Minority Interest 895,292 926,416
Shareholders’ Equity
Share Capital 2,000,000 3,333,333
Statutory Reserves 176,947 860,828
General Reserves 275,000 275,000
Retained Earnings 544,920 661,249
Total Shareholders’ Equity 2,996,867 5,130,410
Total Liabilities & Shareholders> Equity 7,750,822 9,565,282
Source: Company Accounts

Global Research - Saudi Arabia Global Investment House
�� October 2008Saudi International Petrochemical Company - SIPCHEM
Valuation and Recommendation
Discounted Cash Flows MethodologyOur DCF model is based on a 4-year (FY2008-FY2011) explicit forecast period for the Free Cash Flow (FCF). The terminal value is estimated using the constant growth Gordon Growth Model (GGM). The forecasted cash flow and the terminal value is then discounted at the company Weighted Average Cost of Capital (WACC). In our DCF valuation, we have used the following assumptions:
1. Risk Free Rate (RFR) of 5.4%.
2. Equity risk premium of 5.5%.
3. Beta of 1.05.
4. A terminal growth rate of 3.0%.
5. A target cost of debt of 7%.
Using the above assumptions, we have derived a cost of equity for the Company at 11.4%, by using Capital Assets Pricing Model, and a WACC of 10.0%, resulting in a fair value of SR35.9 per share.
Table 21: DCF Calculations
(SR Mn) 2008 (E) 2009 (E) 2010 (E) 2011 (E)
FCF (713) 910 399 1,095
Discounted Cash Flow (679) 789 314 784
Terminal Value 15,083
Primary Value 1,209
Terminal Value (discounted) 11,185
Total Enterprise Value 12,375
Debt (2365) (As of 2008E)
Add: Investments & cash equivalents 1,960 (As of 2008E)
Total Equity Value 11,970
Shares Outstanding (’000) 333,333
Fair Value Per Share 35.9
Source: Global Research
Sensitivity AnalysisWe provide below a sensitivity analysis table, which shows the probable value given different growth rate assumption and WACC. The shaded area represents the most probable outcomes.
Table 22: Sensitivity Analysis Terminal Growth Rates
1.50% 2.50% 3.00% 3.50% 4.50%
WA
CC
8.48% 40.0 46.7 51.0 56.1 70.2
9.48% 34.3 39.3 42.3 45.8 55.0
10.48% 29.9 33.7 35.9 38.5 44.9
11.48% 26.4 29.3 31.1 33.0 37.8
12.48% 23.5 25.8 27.2 28.7 32.4
Source: Global Research

Global Research - Saudi Arabia Global Investment House
October 2008 Saudi International Petrochemical Company - SIPCHEM ��
Relative Valuation For relative valuation, we have made a comparison of SIPCHEM with selected regional and international players.
Table 23: Relative Comparison
Company Name Country Name
Market
Price
(Local)
Adjusted
Market
Price
(US$)
Adjusted
Market
Cap
(US$mn)
EV/
EBITDA
2008
Mitsui Chemicals Inc JAPAN 352.0 3.6 2,814.2 7.3
FMC Corp UNITED STATES 36.3 37.3 2,786.9 8.4
JSR Corp JAPAN 1,055.0 10.6 2,725.0 6.2
Teijin Ltd JAPAN 266.0 2.7 2,644.1 6.4
Lubrizol Corp UNITED STATES 37.0 37.9 2,567.6 5.6
Umicore BELGIUM 14.8 20.4 2,551.3 9.9
Fertilizantes Fosfatados SA BRAZIL 11.8 5.7 2,434.4 13.4
Braskem SA BRAZIL 9.9 4.8 2,312.2 7.3
Sinofert Holdings Ltd HONG KONG 2.5 0.3 2,336.7 11.1
Albemarle Corp UNITED STATES 23.5 24.1 2,202.2 8.6
Hitachi Chemical Co Ltd JAPAN 1,013.0 10.2 2,130.6 4.2
China BlueChemical Ltd CHINA 3.4 0.5 2,086.5 6.6
Hercules Inc UNITED STATES 17.8 18.2 2,056.8 5.9
Showa Denko KK JAPAN 160.0 1.6 2,016.0 5.7
Yantai Wanhua Polyurethanes C CHINA 8.1 1.2 2,018.0 18.6
Valspar Corp UNITED STATES 19.5 20.0 1,997.2 7.9
RPM International Inc UNITED STATES 14.8 15.2 1,961.1 7.3
Terra Industries Inc UNITED STATES 20.5 21.1 1,934.2 3.7
Ube Industries Ltd/Japan JAPAN 181.0 1.8 1,843.5 6.9
Makhteshim-Agan Industries Lt ISRAEL 1,620.0 4.4 1,925.6 8.6
Mitsubishi Gas Chemical Co In JAPAN 367.0 3.7 1,791.1 6.7
Symrise AG GERMANY 10.7 14.7 1,732.1 9.0
IRPC PCL THAILAND 2.9 0.1 1,690.8 7.7
Ashland Inc UNITED STATES 25.4 26.1 1,642.5 3.4
Nufarm Ltd AUSTRALIA 12.3 8.7 1,624.9 11.7
PTT Chemical PCL THAILAND 36.5 1.1 1,639.1 6.8
Altana AG GERMANY 8.5 11.6 1,632.8 6.7
Huabao International Holdings HONG KONG 4.0 0.5 1,628.7 11.9
Clariant AG SWITZERLAND 7.8 7.0 1,622.4 5.5
Lanxess AG GERMANY 14.1 19.4 1,613.4 4.8
Arkema SA FRANCE 19.0 26.2 1,602.4 5.8
Cabot Corp UNITED STATES 24.3 24.9 1,602.2 5.7
Air Water Inc JAPAN 847.0 8.5 1,583.5 5.6
Kaneka Corp JAPAN 443.0 4.5 1,565.1 4.8
Saudi International Petrochem SAUDI ARABIA 22.3 6.1 2,020.9
Source: Bloomberg * As on 19th October 2008

Global Research - Saudi Arabia Global Investment House
�� October 2008Saudi International Petrochemical Company - SIPCHEM
The comparison is made on sector EV/EBITDA of 2008, which is calculated at 7.4. By employing the sector EV/EBITDA on the Company’s EBITDA, our fair value of the Company arrives at SR32.7. Consolidated Fair ValueIn order to arrive at a consolidated fair value for the Company, we have assigned 80% weightage to the value arrived from DCF base valuation and 20% to the relative value. On the basis of this, our consolidated value for the Company comes at SR35.3.
Table 24: Consolidated Fair Value
Valuation Techniques Value per Share (SR) Weights Weighted Value per share (SR)
DCF Method 35.9 80% 28.7
Relative Valuation 32.7 20% 6.5
Consolidated Fair Vale 35.3
Source: Global Research
Based on our consolidated valuation techniques, the stock offers a potential upside of 56.4% over the market price of SR22.5 per share. We, therefore, initiate our coverage of SIPCHEM with a ‘BUY’ recommendation.

Global Research - Saudi Arabia Global Investment House
October 2008 Saudi International Petrochemical Company - SIPCHEM ��
SIP
CH
EM
Am
ount
in S
R ‘
000’
2005
2006
2007
2008
E20
09E
2010
E20
11E
Ass
ets
C
urre
nt A
sset
s
Cas
h an
d E
quiv
alen
ts1,
163,
583
1,50
7,11
7 1,
562,
011
1,96
0,13
7 1,
816,
476
1,03
5,99
5 1,
029,
904
Inve
ntor
ies
54,9
01
59,9
62
101,
764
98,1
12
126,
946
139,
613
161,
746
A/R
, P.P
aym
ent &
R/A
83,9
69
256,
990
330,
975
365,
667
406,
227
507,
682
612,
673
Tot
al C
urre
nt A
sset
s1,
302,
453
1,82
4,06
9 1,
994,
750
2,42
3,91
6 2,
349,
649
1,68
3,29
0 1,
804,
322
Non
-Cur
rent
Ass
ets
Pl
ant &
Pro
pert
y-N
et2,
486,
835
3,19
9,86
0 5,
416,
418
5,40
1,90
9 7,
049,
114
7,02
8,74
3 7,
007,
352
Dif
fere
d pr
ojec
ts im
plem
enta
tion
cost
s25
1,15
3 40
,836
17
0,73
9 1,
749,
938
- 76
8,75
0 76
8,75
0 In
tang
ible
Ass
ets
113,
695
197,
439
168,
143
150,
444
30,9
76
109,
560
86,0
03
Oth
er A
sset
s14
,134
-
-
- -
-
-
T
otal
Non
-Cur
rent
Ass
ets
3,12
5,40
1 3,
438,
135
5,75
5,30
0 7,
302,
290
7,18
0,09
0 7,
907,
053
7,86
2,10
6
T
otal
Ass
ets
4,42
7,85
4 5,
262,
204
7,75
0,05
0 9,
726,
206
9,52
9,73
9 9,
590,
343
9,66
6,42
8
L
iabi
litie
s an
d E
quit
ies
C
urre
nt L
iabi
litie
s
Tra
de C
redi
tors
146,
607
476,
606
1,11
2,69
2 98
1,11
9 88
8,62
2 78
1,83
0 70
0,89
8 Sh
ort t
loan
s-
- 87
8,25
0 -
- -
- C
urre
nt P
ortio
n of
Lon
g te
rm lo
ans
64,8
65
124,
630
140,
503
260,
687
273,
721
232,
663
197,
764
Cur
rent
Por
tion
of C
apita
l Lea
se-
- 32
,108
48
,697
35
,062
32
,257
29
,677
T
otal
Cur
rent
Lia
bilit
ies
211,
472
601,
236
2,16
3,55
3 1,
290,
503
1,19
7,40
5 1,
046,
750
928,
338
Non
-Cur
rent
Lia
bilit
ies
L
ong-
Ter
m D
ebt
1,85
3,57
5 1,
688,
004
1,08
5,49
6 1,
824,
809
1,55
1,08
8 1,
318,
425
1,12
0,66
1 E
nd-O
f-Se
rvic
e In
dem
nitie
s7,
990
12,9
57
19,8
07
19,8
07
19,8
07
19,8
07
19,8
07
Obl
igat
ion
Und
er C
apita
l Lea
se-
- 48
6,97
3 43
8,27
6 40
3,21
4 37
0,95
7 34
1,28
0 Su
b-O
rdin
ate
Loa
ns F
rom
Min
ority
Sha
reho
lder
s-
- 10
2,05
2 10
2,05
2 10
2,05
2 10
2,05
2 10
2,05
2
T
otal
Non
-Cur
rent
Lia
bilit
ies
1,86
1,56
5 1,
700,
961
1,69
4,32
8 2,
384,
944
2,07
6,16
0 1,
811,
240
1,58
3,80
0
T
otal
Lia
bilit
ies
2,07
3,03
7 2,
302,
197
3,85
7,88
1 3,
675,
447
3,27
3,56
5 2,
857,
990
2,51
2,13
8 Sh
areh
olde
rs’
Equ
ity
Sh
are
Cap
ital
1,50
0,00
0 1,
500,
000
2,00
0,00
0 3,
333,
333
3,33
3,33
3 3,
333,
333
3,33
3,33
3 Sh
are
Prem
ium
66
6,66
7 66
6,66
7 66
6,66
7 66
6,66
7 St
atut
ory
Res
erve
s68
,181
11
7,55
0 17
6,94
8 23
8,06
7 30
3,86
9 39
6,74
6 48
4,20
0 G
ener
al R
eser
ves
- -
275,
000
275,
000
275,
000
275,
000
275,
000
Ret
aine
d ea
rnin
gs34
3,63
1 78
7,95
5 54
4,93
0 64
2,40
2 78
2,01
5 1,
165,
316
1,49
9,80
0 T
otal
Equ
ity
1,91
1,81
2 2,
405,
505
2,99
6,87
8 5,
155,
469
5,36
0,88
3 5,
837,
062
6,25
9,00
0 M
inor
ity I
nter
est
443,
005
554,
502
895,
292
895,
292
895,
292
895,
292
895,
292
Tot
al S
hare
hold
ers’
Equ
ity
& M
inor
ity
Inte
rest
2,35
4,81
7 2,
960,
007
3,89
2,17
0 6,
050,
761
6,25
6,17
5 6,
732,
354
7,15
4,29
2 T
otal
Lia
bilit
ies,
Sha
reho
lder
s’ E
quit
y &
Min
orit
y In
tere
st4,
427,
854
5,26
2,20
4 7,
750,
050
9,72
6,20
6 9,
529,
739
9,59
0,34
3 9,
666,
428
Sour
ce:
Com
pany
Rep
orts
& G
loba
l Res
earc
h
Bal
ance
She
et

Global Research - Saudi Arabia Global Investment House
�8 October 2008Saudi International Petrochemical Company - SIPCHEM
SIP
CH
EM
Am
ount
in S
R ‘
000’
2005
2006
2007
2008
E20
09E
2010
E20
11E
Sale
s72
6,08
7 1,
333,
990
1,52
7,67
5 1,
828,
334
2,03
1,13
5 2,
538,
409
2,45
0,69
1 C
ost o
f Sa
les
(250
,036
)(5
12,2
70)
(574
,984
)(7
42,0
74)
(964
,635
)(1
,040
,615
)(1
,048
,144
)
G
ross
Pro
fit
476,
051
821,
720
952,
691
1,08
6,25
9 1,
066,
500
1,49
7,79
4 1,
402,
547
Gen
eral
& A
dmin
istr
atio
n E
xpen
ses
(25,
090)
(48,
494)
(56,
850)
(59,
305)
(81,
245)
(101
,536
)(9
8,02
8)
O
pera
ting
Inc
ome
450,
961
773,
226
895,
841
1,02
6,95
4 98
5,25
4 1,
396,
258
1,30
4,52
0
In
vest
men
t Inc
ome
54,7
12
49,1
18
69,0
00
61,2
64
89,7
55
75,4
81
76,7
28
Fina
ncia
l Cha
rges
(40,
485)
(81,
289)
(100
,186
)(8
6,43
0)(8
2,25
4)(7
1,65
7)(6
2,56
0)N
et E
xpen
ses
of P
re-O
pera
ting
Act
iviti
es(2
,328
)(1
,106
)(8
57)
(51,
244)
(3,2
59)
(3,4
22)
(3,5
94)
Inco
me
Bef
ore
Min
orit
y In
tere
st &
Zak
at46
2,86
0 73
9,94
9 86
3,79
8 95
0,54
4 98
9,49
6 1,
396,
659
1,31
5,09
5
M
inor
ity I
nter
est
(130
,066
)(2
20,8
08)
(250
,019
)(3
08,9
74)
(296
,849
)(4
18,9
98)
(394
,528
)
N
et I
ncom
e B
efor
e Z
akat
332,
794
519,
141
613,
779
641,
569
692,
647
977,
661
920,
566
Zak
at(7
,833
)(2
5,44
8)(1
9,80
7)(3
0,37
9)(3
4,63
2)(4
8,88
3)(4
6,02
8)
N
et I
ncom
e32
4,96
1 49
3,69
3 59
3,97
2 61
1,19
1 65
8,01
5 92
8,77
8 87
4,53
8
O
peni
ng B
alan
ce51
,166
34
3,63
1 78
7,95
5 54
4,93
0 64
2,40
2 78
2,01
5 1,
165,
316
Net
Inc
ome
of th
e ye
ar32
4,96
1 49
3,69
3 59
3,97
2 61
1,19
1 65
8,01
5 92
8,77
8 87
4,53
8 T
rans
fer
to S
taut
ory
Res
erve
s(3
2,49
6)(4
9,36
9)(5
9,39
7)(6
1,11
9)(6
5,80
1)(9
2,87
8)(8
7,45
4)D
ivid
end
- -
- (4
50,0
00)
(450
,000
)(4
50,0
00)
(450
,000
)B
onus
- -
(500
,000
)-
- -
- G
ener
al R
eser
ves
- -
(275
,000
)-
- -
-D
irec
tors
’ R
emun
erat
ion
- -
(2,6
00)
(2,6
00)
(2,6
00)
(2,6
00)
(2,6
00)
End
ing
Bal
ance
343,
631
787,
955
544,
930
642,
402
782,
015
1,16
5,31
6 1,
499,
800
Sour
ce:
Com
pany
Rep
ort &
Glo
bal R
esea
rch
Inco
me
Stat
emen
t
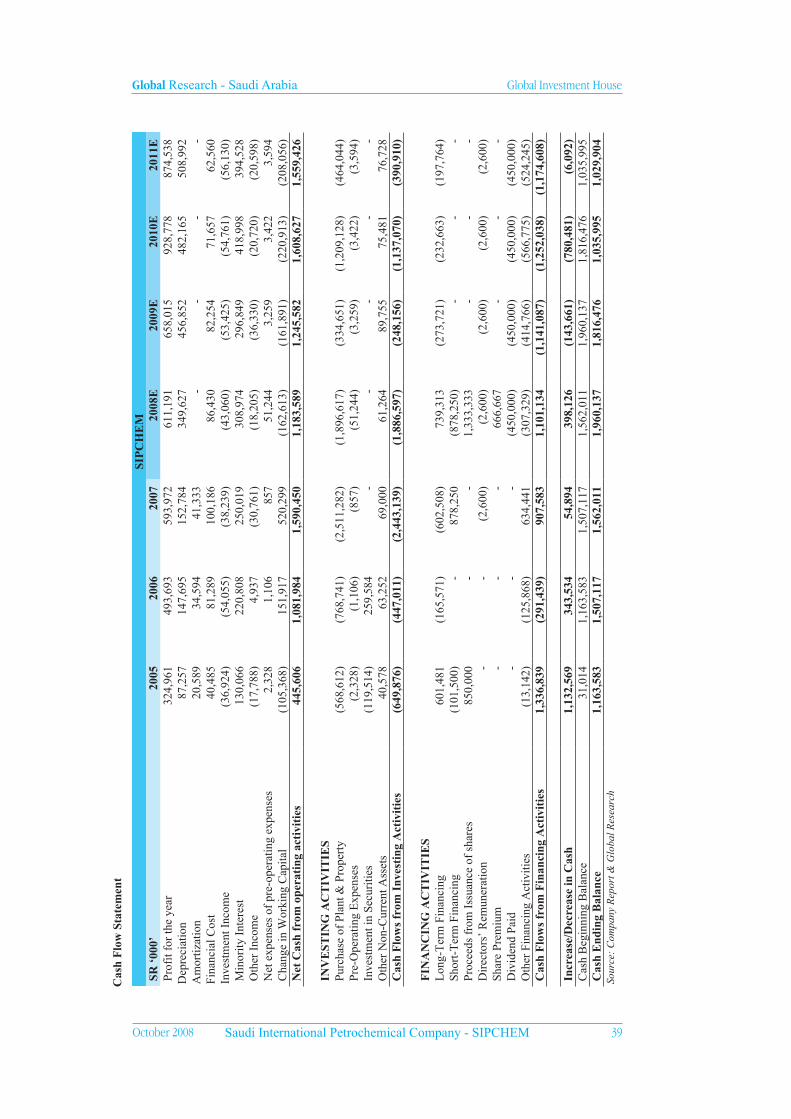
Global Research - Saudi Arabia Global Investment House
October 2008 Saudi International Petrochemical Company - SIPCHEM ��
SIP
CH
EM
S
R ‘
000’
20
0520
0620
0720
08E
2009
E20
10E
2011
E P
rofi
t for
the
year
32
4,96
1 49
3,69
3 59
3,97
2 61
1,19
1 65
8,01
5 92
8,77
8 87
4,53
8 D
epre
ciat
ion
87,2
57
147,
695
152,
784
349,
627
456,
852
482,
165
508,
992
Am
ortiz
atio
n20
,589
34
,594
41
,333
-
- -
- Fi
nanc
ial C
ost
40,4
85
81,2
89
100,
186
86,4
30
82,2
54
71,6
57
62,5
60
Inve
stm
ent I
ncom
e(3
6,92
4)(5
4,05
5)(3
8,23
9)(4
3,06
0)(5
3,42
5)(5
4,76
1)(5
6,13
0) M
inor
ity I
nter
est
130,
066
220,
808
250,
019
308,
974
296,
849
418,
998
394,
528
Oth
er I
ncom
e (1
7,78
8)4,
937
(30,
761)
(18,
205)
(36,
330)
(20,
720)
(20,
598)
Net
exp
ense
s of
pre
-ope
ratin
g ex
pens
es
2,32
8 1,
106
857
51,2
44
3,25
9 3,
422
3,59
4 C
hang
e in
Wor
king
Cap
ital
(105
,368
)15
1,91
7 52
0,29
9 (1
62,6
13)
(161
,891
)(2
20,9
13)
(208
,056
) N
et C
ash
from
ope
rati
ng a
ctiv
itie
s 44
5,60
6 1,
081,
984
1,59
0,45
0 1,
183,
589
1,24
5,58
2 1,
608,
627
1,55
9,42
6
I
NV
EST
ING
AC
TIV
ITIE
S
Pur
chas
e of
Pla
nt &
Pro
pert
y (5
68,6
12)
(768
,741
)(2
,511
,282
)(1
,896
,617
)(3
34,6
51)
(1,2
09,1
28)
(464
,044
) P
re-O
pera
ting
Exp
ense
s (2
,328
)(1
,106
)(8
57)
(51,
244)
(3,2
59)
(3,4
22)
(3,5
94)
Inv
estm
ent i
n Se
curi
ties
(119
,514
)25
9,58
4 -
- -
- -
Oth
er N
on-C
urre
nt A
sset
s 40
,578
63
,252
69
,000
61
,264
89
,755
75
,481
76
,728
C
ash
Flo
ws
from
Inv
esti
ng A
ctiv
itie
s (6
49,8
76)
(447
,011
)(2
,443
,139
)(1
,886
,597
)(2
48,1
56)
(1,1
37,0
70)
(390
,910
)
F
INA
NC
ING
AC
TIV
ITIE
S
Lon
g-T
erm
Fin
anci
ng
601,
481
(165
,571
)(6
02,5
08)
739,
313
(273
,721
)(2
32,6
63)
(197
,764
) S
hort
-Ter
m F
inan
cing
(1
01,5
00)
- 87
8,25
0 (8
78,2
50)
- -
- P
roce
eds
from
Iss
uanc
e of
sha
res
850,
000
- -
1,33
3,33
3 -
- -
Dir
ecto
rs’
Rem
uner
atio
n -
- (2
,600
)(2
,600
)(2
,600
)(2
,600
)(2
,600
) S
hare
Pre
miu
m
- -
- 66
6,66
7 -
- -
Div
iden
d Pa
id
- -
- (4
50,0
00)
(450
,000
)(4
50,0
00)
(450
,000
) O
ther
Fin
anci
ng A
ctiv
ities
(1
3,14
2)(1
25,8
68)
634,
441
(307
,329
)(4
14,7
66)
(566
,775
)(5
24,2
45)
Cas
h F
low
s fr
om F
inan
cing
Act
ivit
ies
1,33
6,83
9 (2
91,4
39)
907,
583
1,10
1,13
4 (1
,141
,087
) (
1,25
2,03
8)(1
,174
,608
)
I
ncre
ase/
Dec
reas
e in
Cas
h 1,
132,
569
343,
534
54,8
94
398,
126
(143
,661
)(7
80,4
81)
(6,0
92)
Cas
h B
egin
ning
Bal
ance
31
,014
1,
163,
583
1,50
7,11
7 1,
562,
011
1,96
0,13
7 1,
816,
476
1,03
5,99
5 C
ash
End
ing
Bal
ance
1,
163,
583
1,50
7,11
7 1,
562,
011
1,96
0,13
7 1,
816,
476
1,03
5,99
5 1,
029,
904
Sour
ce:
Com
pany
Rep
ort &
Glo
bal R
esea
rch
Cas
h F
low
Sta
tem
ent

Global Research - Saudi Arabia Global Investment House
�0 October 2008Saudi International Petrochemical Company - SIPCHEM
SIP
CH
EM
20
0520
0620
0720
08E
2009
E20
10E
2011
EL
iqui
dity
Rat
ios
C
urre
nt R
atio
6.2
3.0
0.9
1.9
2.0
1.6
1.9
Cas
h R
atio
5.5
2.5
0.7
1.5
1.5
1.0
1.1
Pro
fita
bilit
y R
atio
s
Gro
ss M
argi
n 77
.5%
66.1
%62
.7%
70.2
%57
.8%
60.0
%58
.3%
EB
ITD
A M
argi
n 79
.2%
73.1
%71
.1%
77.6
%73
.6%
76.2
%76
.3%
EB
IT M
argi
n 67
.2%
62.0
%61
.1%
58.5
%51
.1%
57.2
%55
.5%
Net
Pro
fit M
argi
n 44
.8%
37.0
%38
.9%
33.4
%32
.4%
36.6
%35
.7%
RO
AE
19.0
%18
.6%
17.3
%12
.3%
10.7
%14
.3%
12.6
%R
OA
A9.
2%10
.2%
9.1%
7.0%
6.8%
9.7%
9.1%
Lev
erag
e R
atio
s
Deb
t to
Equ
ity0.
97
0.70
0.
36
0.35
0.
29
0.23
0.
18
Deb
t to
Ass
et
41.9
%32
.1%
14.0
%18
.8%
16.3
%13
.7%
11.6
%L
iabi
litie
s/T
otal
Ass
ets
(x)
0.47
0.
44
0.50
0.
38
0.34
0.
30
0.26
G
row
th R
ates
R
even
ue G
row
th R
ate
n/a
83.7
%14
.5%
19.7
%11
.1%
25.0
%-3
.5%
Net
Inc
ome
Gro
wth
Rat
en/
a51
.9%
20.3
%2.
9%7.
7%41
.1%
-5.8
%E
quity
Gro
wth
Rat
en/
a25
.8%
24.6
%72
.0%
4.0%
8.9%
7.2%
Tot
al A
sset
Gro
wth
Rat
e
Rat
ios
Use
for
Val
uati
on
Num
ber
of S
hare
s (m
n)15
0.0
150.
0 20
0.0
333.
3 33
3.3
333.
3 33
3.3
Par
valu
e pe
r sh
are
(SR
)10
.0
10.0
10
.0
10.0
10
.0
10.0
10
.0
BV
per
sha
re (
SR)
12.6
14
.4
15.7
15
.5
16.1
17
.5
18.8
E
PS (
SR)-
Adj
uste
d1.
0 1.
5 1.
8 1.
8 2.
0 2.
8 2.
6 M
arke
t Pri
ce (
SR)
- 23
.6
44.1
22
.6
22.6
22
.6
22.6
M
arke
t Cap
in (
SR M
n)-
3,54
0.0
8,82
0.0
7,51
6.7
7,51
6.7
7,51
6.7
7,51
6.7
EV
(SR
Mn)
690.
0 8,
047.
6 14
,223
.5
7,38
1.3
7,25
1.3
7,79
9.1
7,60
7.4
EV
/EB
ITD
A1.
2 8.
3 13
.1
5.2
4.8
4.0
4.1
P/E
Rat
io-
15.9
24
.7
12.3
11
.4
8.1
8.6
P/B
V R
atio
- 1.
6 2.
8 1.
5 1.
4 1.
3 1.
2 So
urce
: C
ompa
ny R
epor
t & G
loba
l Res
earc
h*H
isto
rica
l P/E
& P
/BV
mul
tiple
s pe
rtai
n to
res
pect
ive
year
-end
pri
ces,
whi
le th
ose
for
futu
re y
ears
are
bas
ed o
n cl
osin
g pr
ices
on
the
Tada
wul
as
of 1
8th
Oct
ober
, 200
8.
Fac
t Sh
eet

This material was produced by Global Investment House KSCC (‘Global’),a firm regulated by the Central Bank ofKuwait. This document is not to be used or considered as an offer to sell or a solicitation of an offer to buy anysecurities. Global may, from time to time,to the extent permitted by law, participate or invest in other financingtransactions with the issuers of the securities (‘securities’), perform services for or solicit business from such issuer,and/or have a position or effect transactions in the securities or options thereof. Global may, to the extent permittedby applicable Kuwaiti law or other applicable laws or regulations, effect transactions in the securities before thismaterial is published to recipients.Information and opinions contained herein have been compiled or arrived by Global from sources believed tobe reliable, but Global has not independently verified the contents of this document. Accordingly, no representationor warranty, express or implied, is made as to and no reliance should be placed on the fairness, accuracy,completeness or correctness of the information and opinions contained in this document. Global accepts no liabilityfor any loss arising from the use of this document or its contents or otherwise arising in connection therewith.This document is not to be relied upon or used in substitution for the exercise of independent judgement. Globalshall have no responsibility or liability whatsoever in respect of any inac curacy in or ommission from this orany other document prepared by Global for, or sent by Global to any person and any such person shall beresponsible for conducting his own investigation and analysis of the information contained or referred to in thisdocument and of evaluating the merits and risks involved in the securities forming the subject matter of this orother such document.Opinions and estimates constitute our judgment and are subject to change without prior notice.Past performanceis not indicative of future results. This document does not constitute an offer or invitation to subscribe for orpurchase any securities, and neither this document nor anything contained herein shall form the basis of anycontract or commitment what so ever. It is being furnished to you solely for your information and may not bereproduced or redistributed to any other person.Neither this report nor any copy hereof may be distributed in any jurisdiction outside Kuwait where its distributionmay be restricted by law. Persons who receive this report should make themselves aware of and adhere to anysuch restrictions. By accepting this report you agree to be bound by the foregoing limitations.
Company
Saudi InternationalPetrochemical Co.SIPCHEM
Recommendation
Buy
Ticker
SIPCHEM AB(Bloomberg)2310.SE (Reuters)
Price
SR22.5
Disclosure
1,10
Disclosure Checklist
1. Global Investment House did not receive and will not receive any compensation from the companyor anyone else for the preparation of this report.
2. The company being researched holds more than 5% stake in Global Investment House.3. Global Investment House makes a market in securities issued by this company.4. Global Investment House acts as a corporate broker or sponsor to this company.5. The author of or an individual who assisted in the preparation of this report (or a member of his/her
household) has a direct ownership position in securities issued by this company.6. An employee of Global Investment House serves on the board of directors of this company.7. Within the past year , Global Investment House has managed or co-managed a public offering for
this company, for which it received fees.8. Global Investment House has received compensation from this company for the provision of
investment banking or financial advisory services within the past year.9. Global Investment House expects to receive or intends to seek compensation for investment banking
services from this company in the next three months.10. Please see special footnote below for other relevant disclosures.
The following is a comprehensive list of disclosures which may or may not apply to all our researches.
Only the relevant disclosures which apply to this particular research has been mentioned in the table
below under the heading of disclosure.
Global Rating
Buy
Global Research: Equity Ratings Definitions
HoldReduceSell
Definition
Fair value of the stock is >10% from the current market priceFair value of the stock is between +10% and -10% from the current market priceFair value of the stock is between -10% and -20% from the current market priceFair value of the stock is < -20% from the current market price

Global Investment HouseTel: (965) 2295 1000 - Fax: (965) 2295 1005
Global Research