Embed Size (px)
Citation preview
Global Scenario and
The Medical Device Industry in Malaysia by
Mr. Hitendra Joshi Chairman
Association of Malaysian Medical Industries (AMMI) 31 October 2013
Agenda
Global Scenario
Medical Device Industry in Malaysia
About AMMI
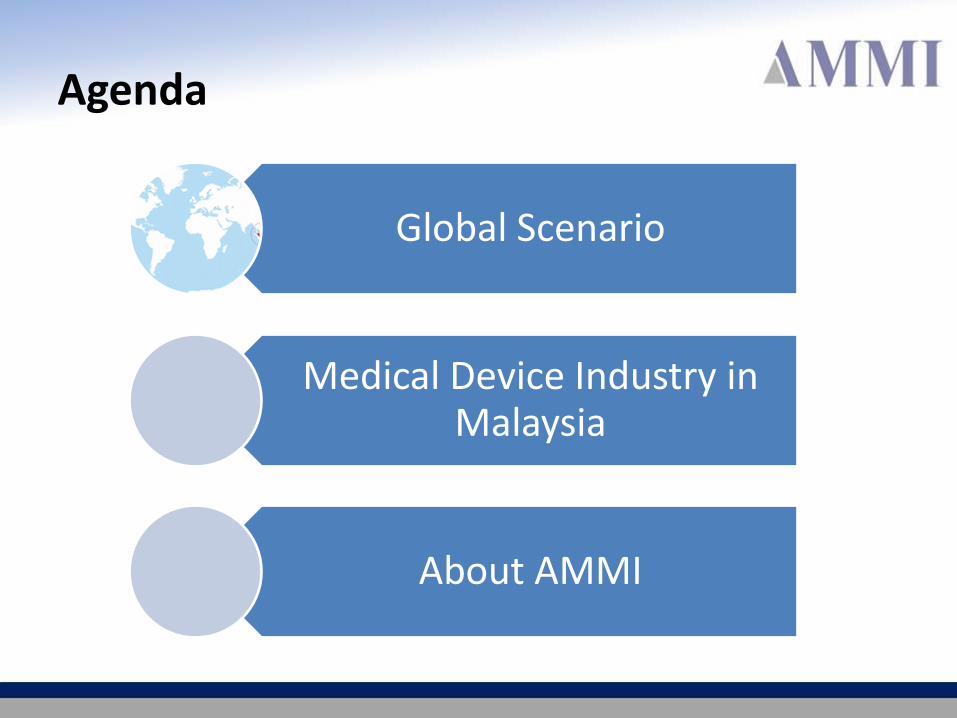
Global Scenario
Source: Espicom, AMMI analysis
298
440.5
0
50
100
150
200
250
300
350
400
450
500
2013 2018
USD ’Billion
Global Medical Device
Market Size
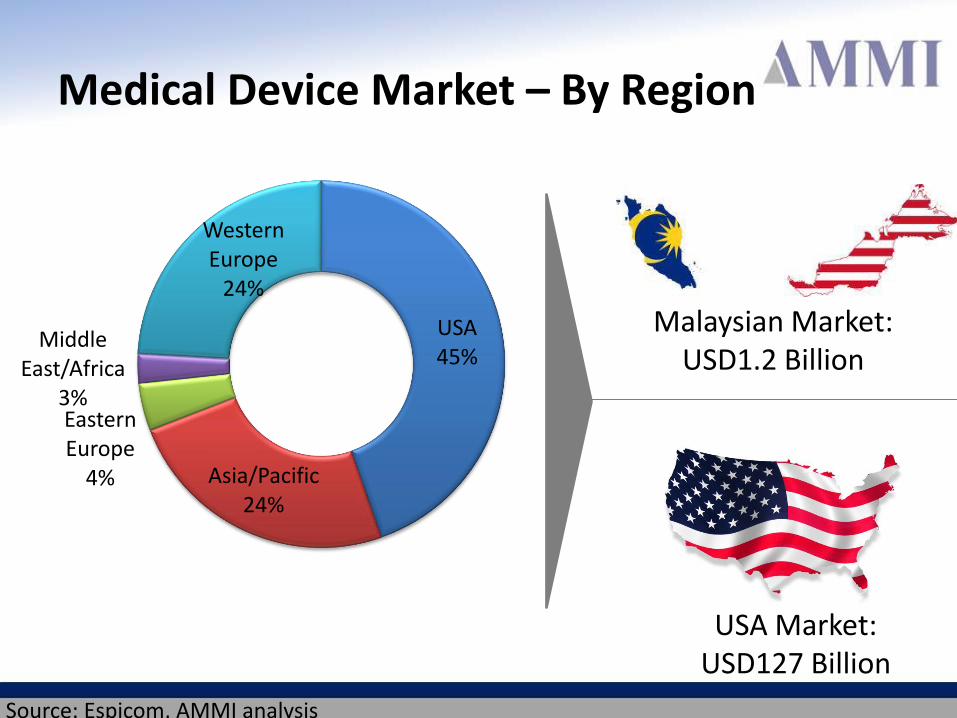
Medical Device Market – By Region
USA 45%
Asia/Pacific 24%
Eastern Europe
4%
Middle East/Africa
3%
Western Europe
24%
Source: Espicom, AMMI analysis
USA Market: USD127 Billion
Malaysian Market: USD1.2 Billion
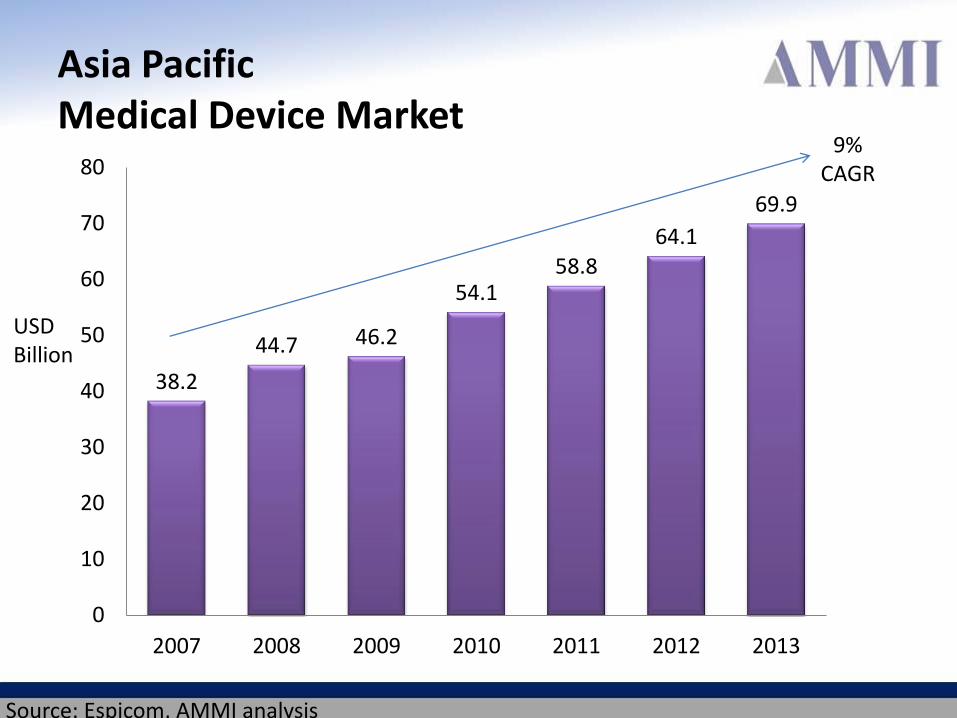
Asia Pacific Medical Device Market
Source: Espicom, AMMI analysis
38.2
44.7 46.2
54.1 58.8
64.1
69.9
0
10
20
30
40
50
60
70
80
2007 2008 2009 2010 2011 2012 2013
9% CAGR
USD Billion
Agenda
Global Scenario
Medical Device Industry in Malaysia
About AMMI
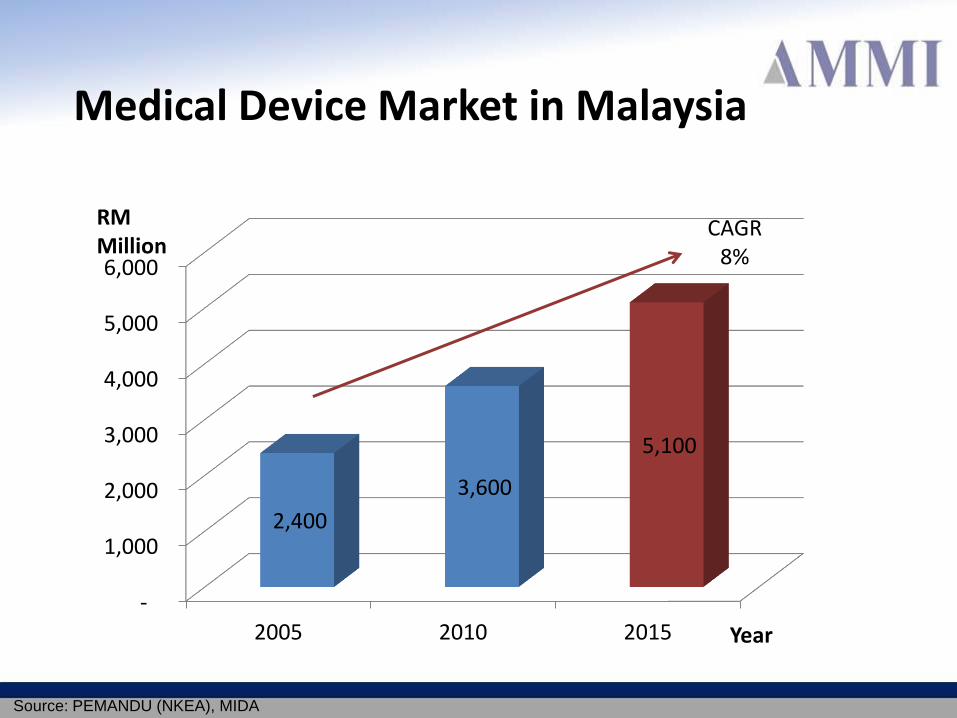
RM Million
Source: PEMANDU (NKEA), MIDA
Medical Device Market in Malaysia
-
1,000
2,000
3,000
4,000
5,000
6,000
2005 2010 2015
2,400
3,600
5,100
Year
CAGR 8%
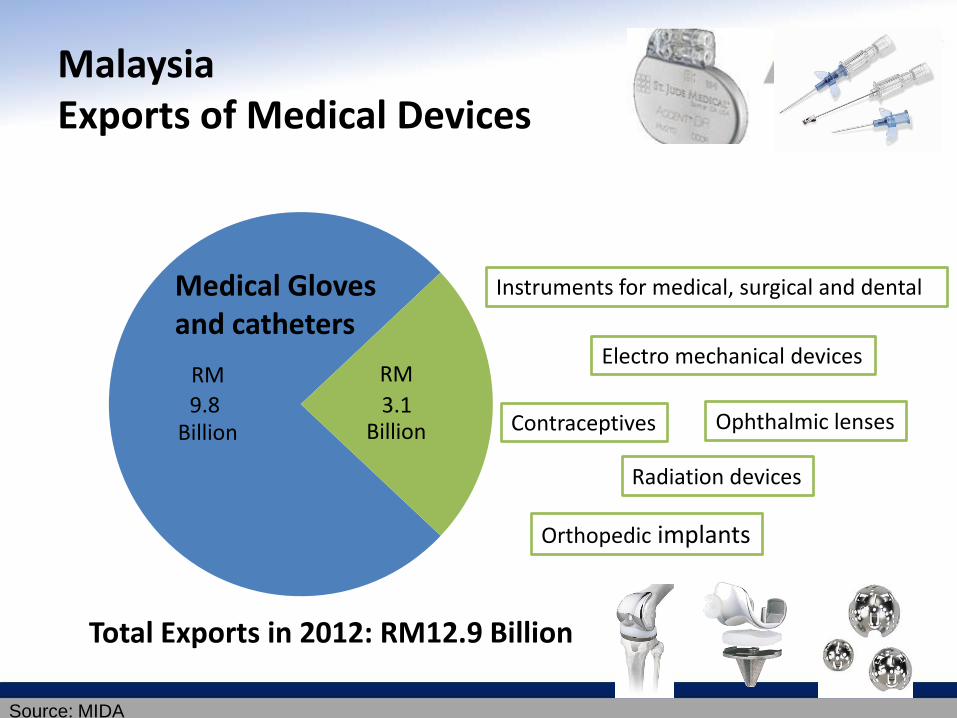
9.8 3.1 3.1
Instruments for medical, surgical and dental
Radiation devices
Ophthalmic lenses Contraceptives
Electro mechanical devices
Orthopedic implants
Malaysia Exports of Medical Devices
RM
Billion
RM
Billion
Medical Gloves and catheters
Source: MIDA
Total Exports in 2012: RM12.9 Billion
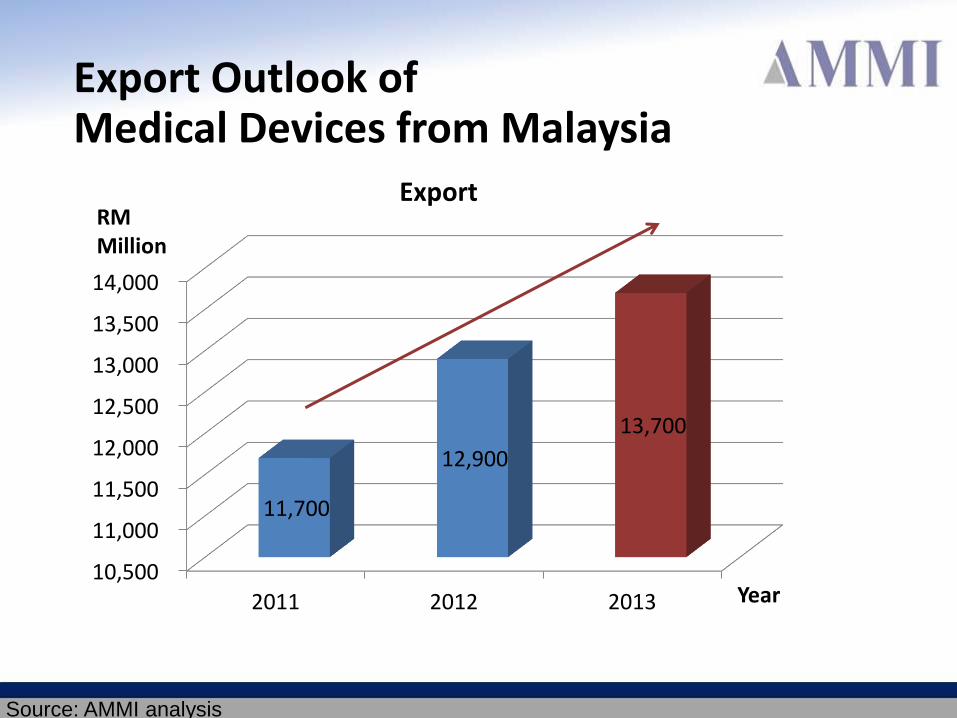
RM Million
Source: AMMI analysis
Export Outlook of Medical Devices from Malaysia
10,500
11,000
11,500
12,000
12,500
13,000
13,500
14,000
2011 2012 2013
11,700
12,900
13,700
Export
Year
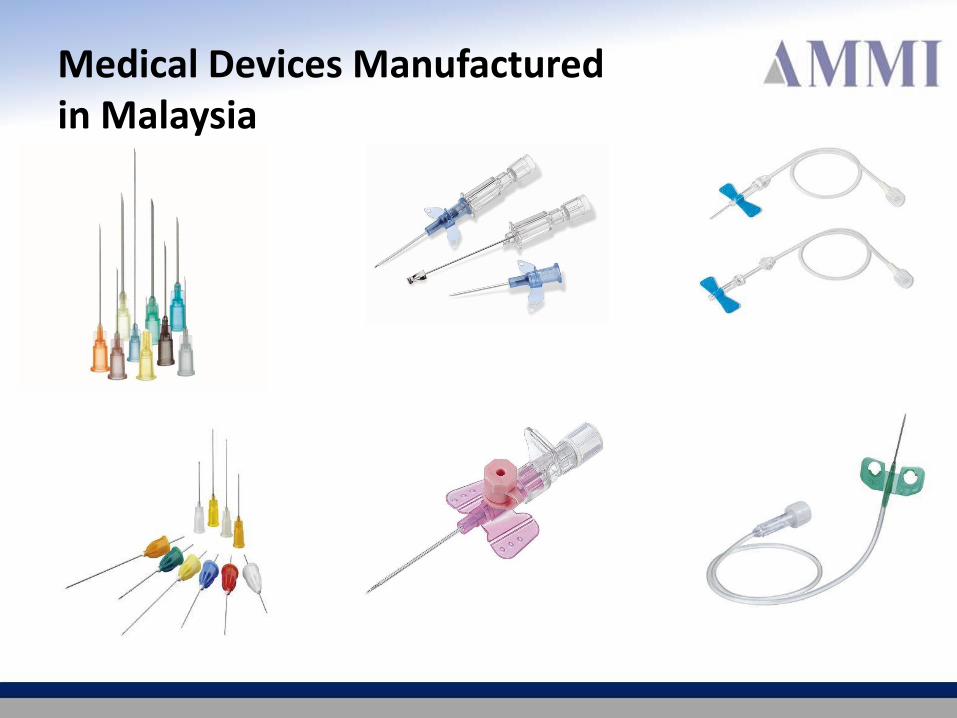
Medical Devices Manufactured in Malaysia
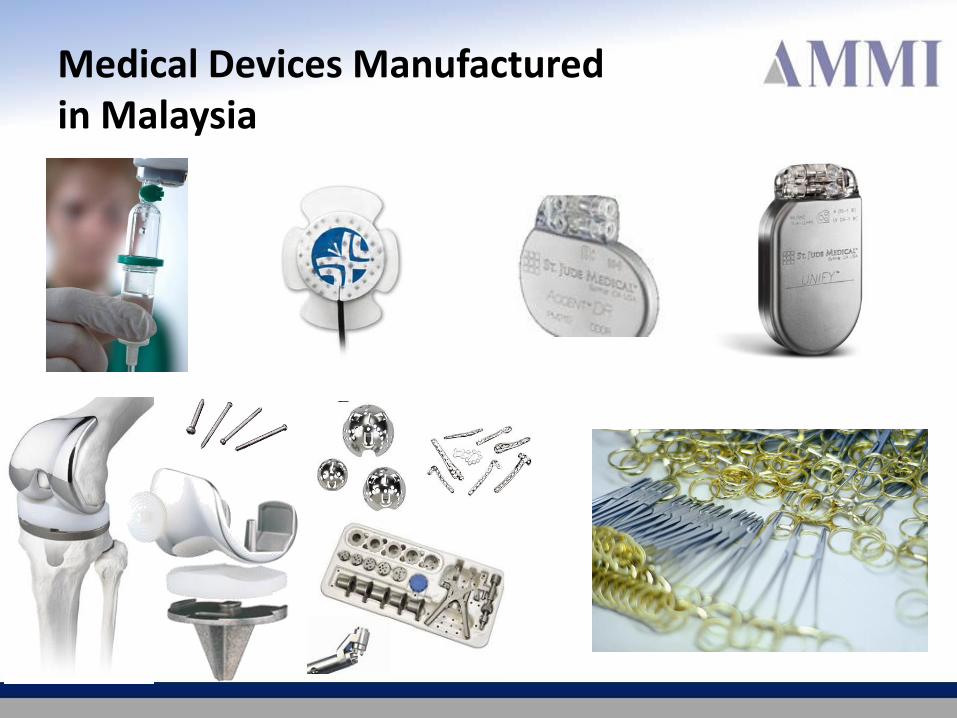
Medical Devices Manufactured in Malaysia
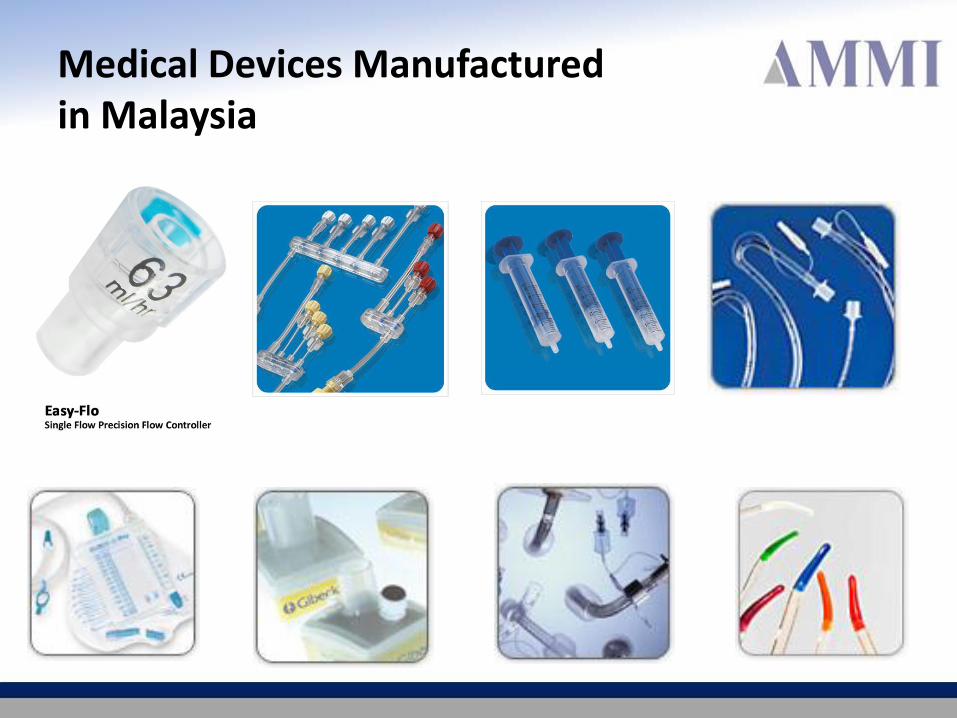
Medical Devices Manufactured in Malaysia
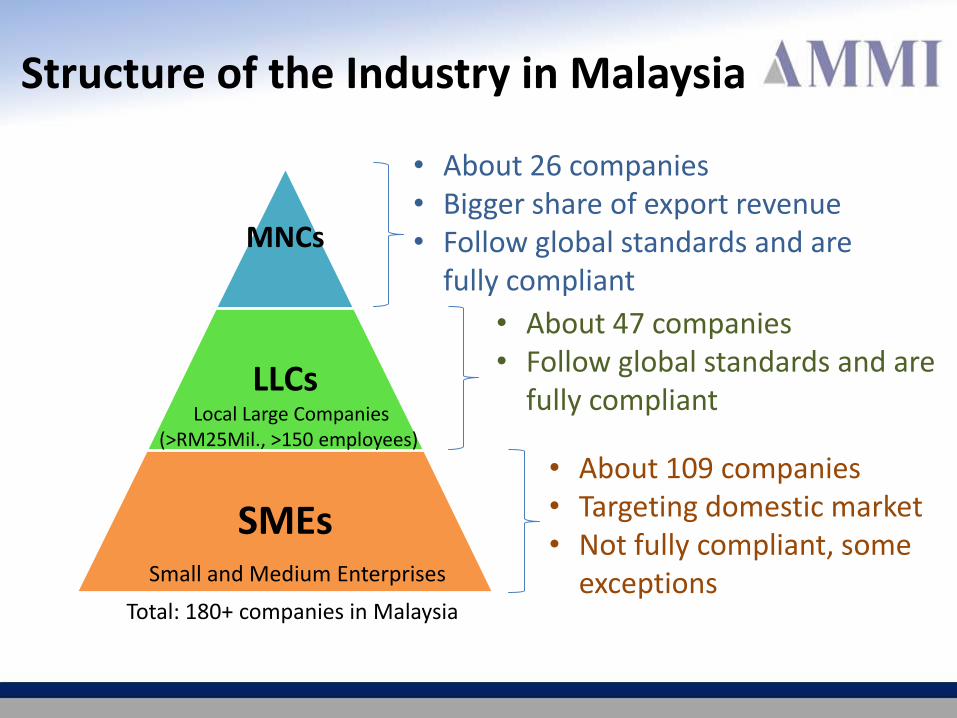
Structure of the Industry in Malaysia
MNCs
LLCs
SMEs
• About 26 companies • Bigger share of export revenue • Follow global standards and are
fully compliant
• About 47 companies • Follow global standards and are
fully compliant • About 109 companies • Targeting domestic market • Not fully compliant, some
exceptions
Total: 180+ companies in Malaysia
Local Large Companies (>RM25Mil., >150 employees)
Small and Medium Enterprises
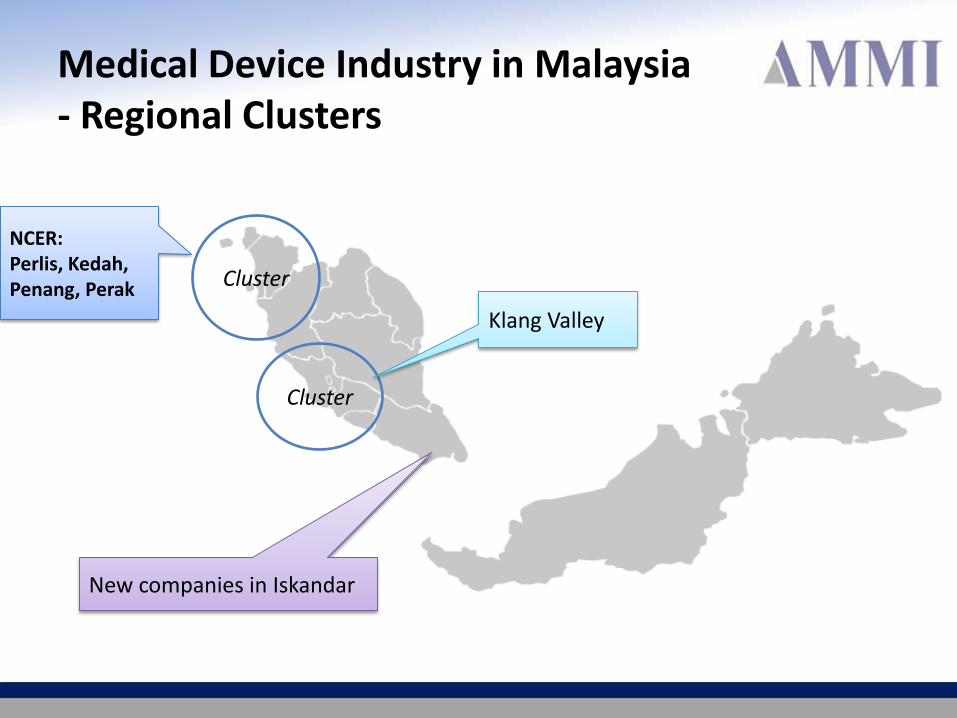
Medical Device Industry in Malaysia - Regional Clusters
Cluster
Cluster
NCER: Perlis, Kedah, Penang, Perak
Klang Valley
New companies in Iskandar
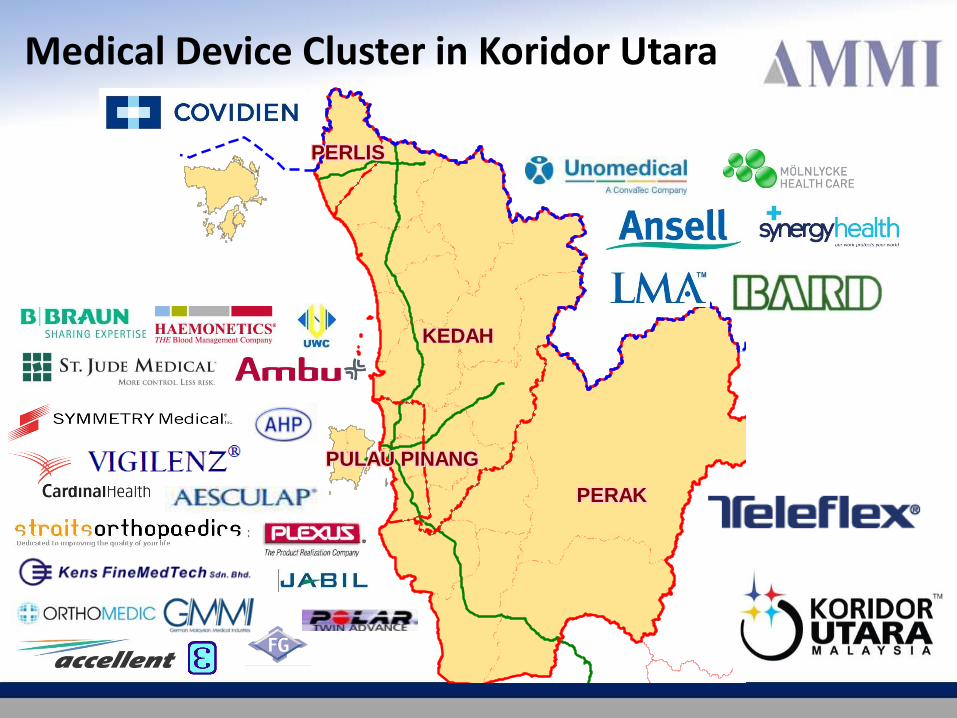
Medical Device Cluster in Koridor Utara
No Window No Window
MELAKAMELAKAMELAKAMELAKAMELAKAMELAKAMELAKAMELAKAMELAKA
NEGERINEGERINEGERINEGERINEGERINEGERINEGERINEGERINEGERI
SEMBILANSEMBILANSEMBILANSEMBILANSEMBILANSEMBILANSEMBILANSEMBILANSEMBILAN
JOHORJOHORJOHORJOHORJOHORJOHORJOHORJOHORJOHOR
PAHANGPAHANGPAHANGPAHANGPAHANGPAHANGPAHANGPAHANGPAHANG
WILAYAH PERSEKUTUANWILAYAH PERSEKUTUANWILAYAH PERSEKUTUANWILAYAH PERSEKUTUANWILAYAH PERSEKUTUANWILAYAH PERSEKUTUANWILAYAH PERSEKUTUANWILAYAH PERSEKUTUANWILAYAH PERSEKUTUAN
SELANGORSELANGORSELANGORSELANGORSELANGORSELANGORSELANGORSELANGORSELANGOR
PERAKPERAKPERAKPERAKPERAKPERAKPERAKPERAKPERAK
TERENGGANUTERENGGANUTERENGGANUTERENGGANUTERENGGANUTERENGGANUTERENGGANUTERENGGANUTERENGGANU
KELANTANKELANTANKELANTANKELANTANKELANTANKELANTANKELANTANKELANTANKELANTANPERAKPERAKPERAKPERAKPERAKPERAKPERAKPERAKPERAK
PERLISPERLISPERLISPERLISPERLISPERLISPERLISPERLISPERLIS
PULAU PINANGPULAU PINANGPULAU PINANGPULAU PINANGPULAU PINANGPULAU PINANGPULAU PINANGPULAU PINANGPULAU PINANG
KEDAHKEDAHKEDAHKEDAHKEDAHKEDAHKEDAHKEDAHKEDAH
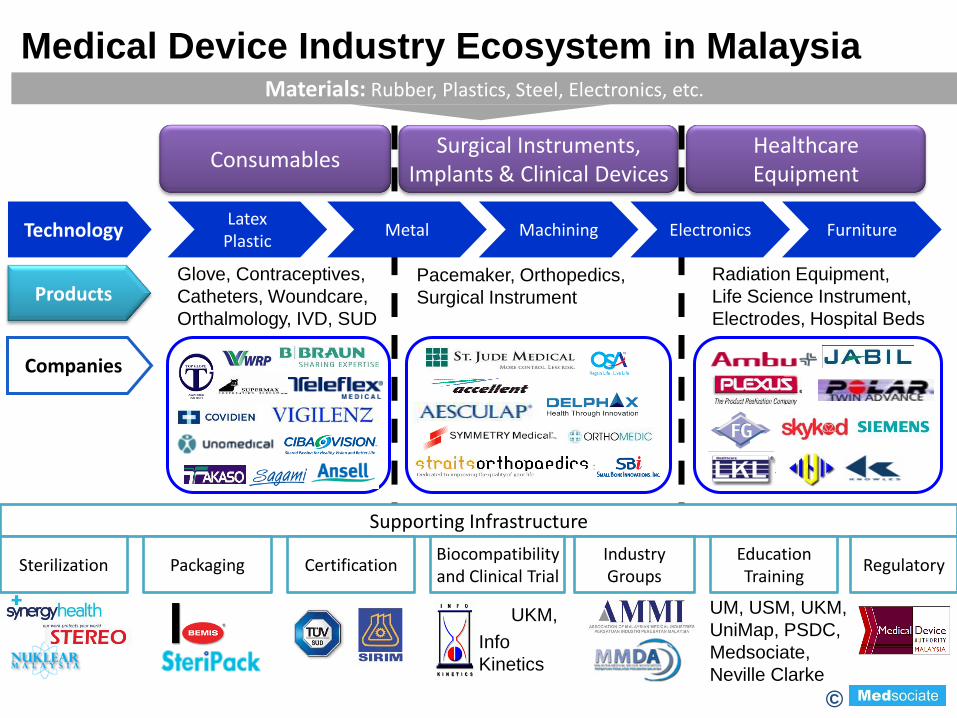
Consumables Surgical Instruments,
Implants & Clinical Devices Healthcare Equipment
Technology Latex
Plastic Metal Machining Electronics Furniture
Products
Companies
Supporting Infrastructure
Sterilization Certification Packaging Biocompatibility and Clinical Trial
Materials: Rubber, Plastics, Steel, Electronics, etc.
Industry Groups
Education Training
Regulatory
Glove, Contraceptives,
Catheters, Woundcare,
Orthalmology, IVD, SUD
Pacemaker, Orthopedics,
Surgical Instrument
Radiation Equipment,
Life Science Instrument,
Electrodes, Hospital Beds
UKM, UM, USM, UKM,
UniMap, PSDC,
Medsociate,
Neville Clarke
Medical Device Industry Ecosystem in Malaysia
Info
Kinetics
©
Agenda
Global Scenario
Medical Device Industry in Malaysia
About AMMI
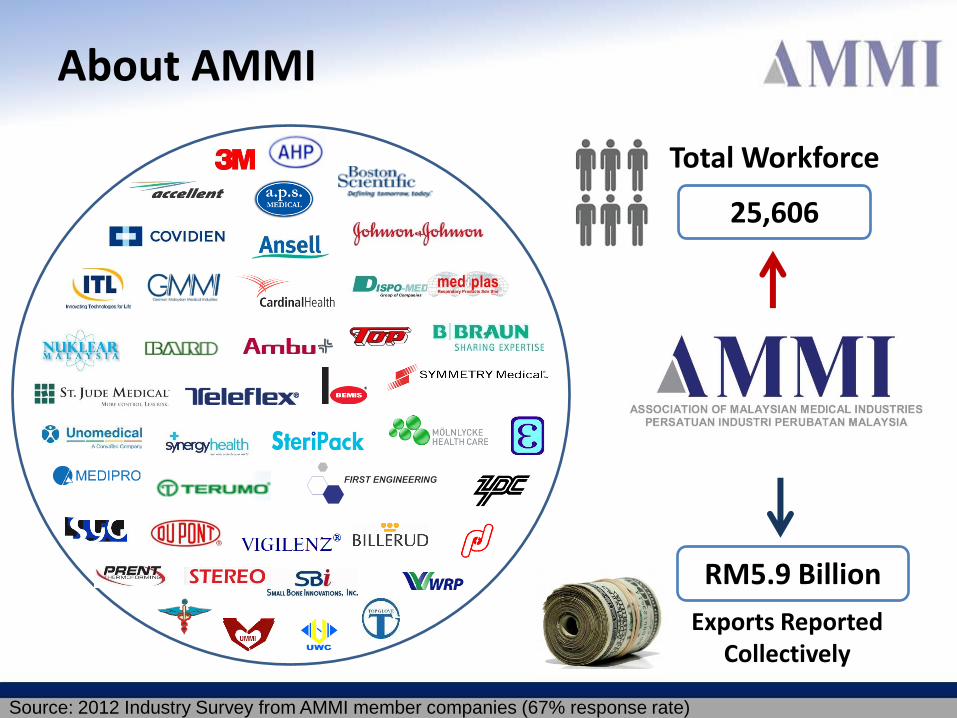
About AMMI
RM5.9 Billion
25,606
Total Workforce
Exports Reported Collectively
Source: 2012 Industry Survey from AMMI member companies (67% response rate)
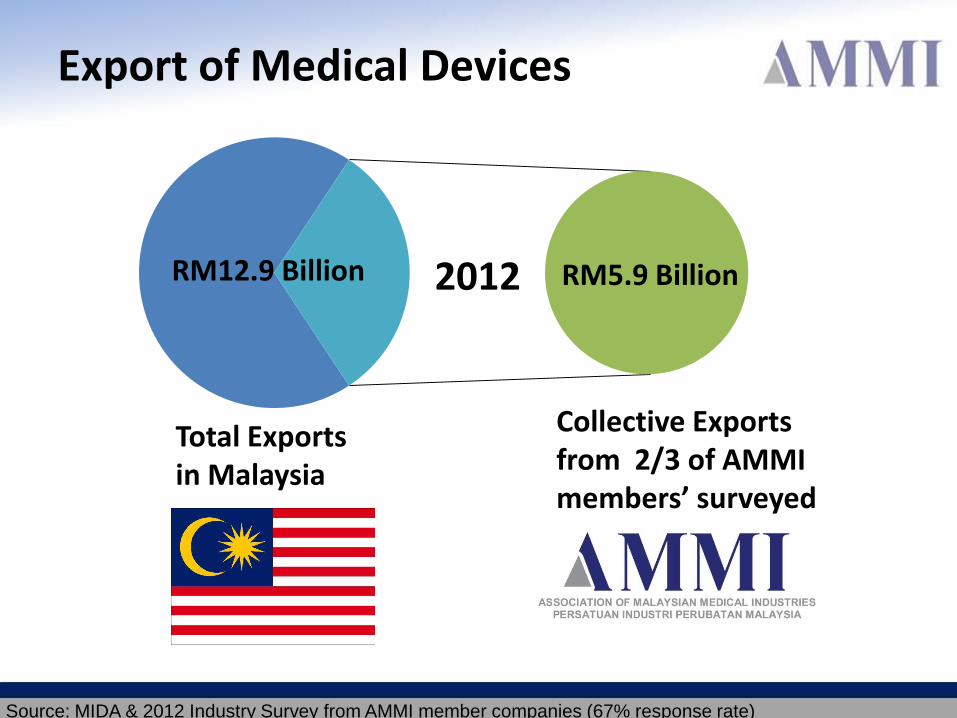
RM12.9 Billion RM5.9 Billion
Collective Exports from 2/3 of AMMI members’ surveyed
Total Exports in Malaysia
2012
Source: MIDA & 2012 Industry Survey from AMMI member companies (67% response rate)
Export of Medical Devices
0.0
1.0
2.0
3.0
4.0
2008 2009
2010 2011
2012
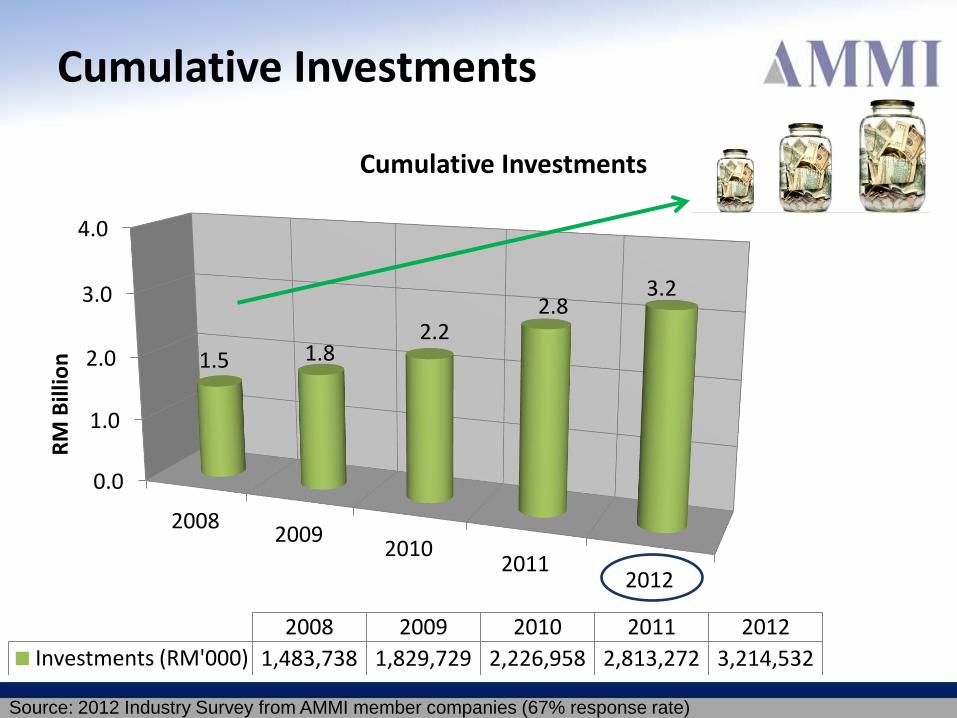
1.5 1.8 2.2
2.8 3.2
RM
Bill
ion
2008 2009 2010 2011 2012
Investments (RM'000) 1,483,738 1,829,729 2,226,958 2,813,272 3,214,532
Cumulative Investments
Cumulative Investments
Source: 2012 Industry Survey from AMMI member companies (67% response rate)
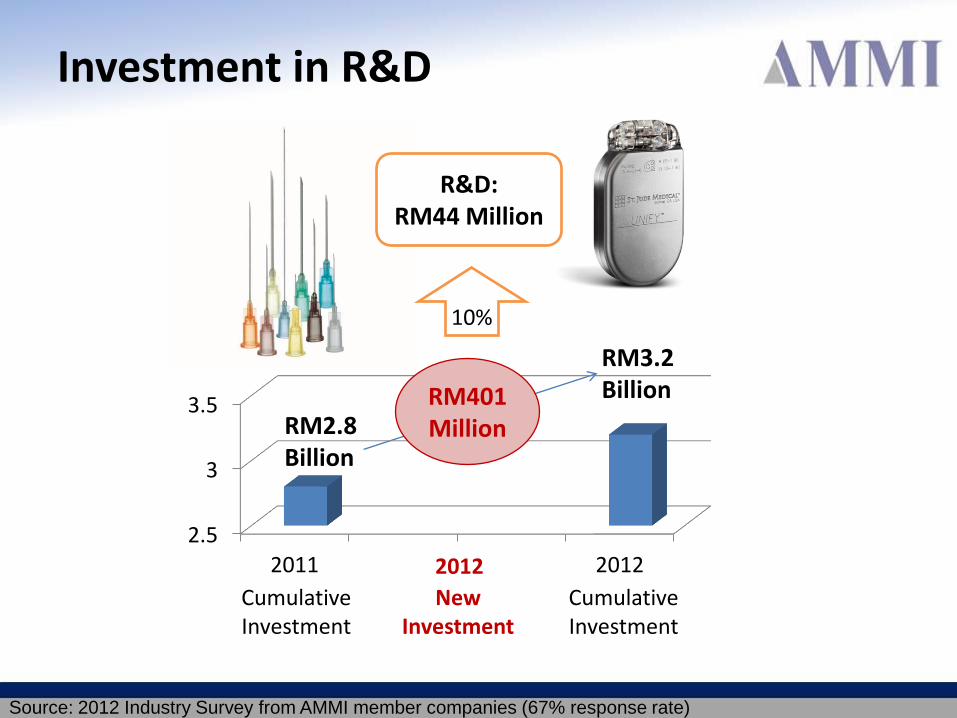
2.5
3
3.5
2011 2012
R&D: RM44 Million
RM401 Million
10%
RM2.8 Billion
2012
RM3.2 Billion
Cumulative Investment
Cumulative Investment
New Investment
Investment in R&D
Source: 2012 Industry Survey from AMMI member companies (67% response rate)
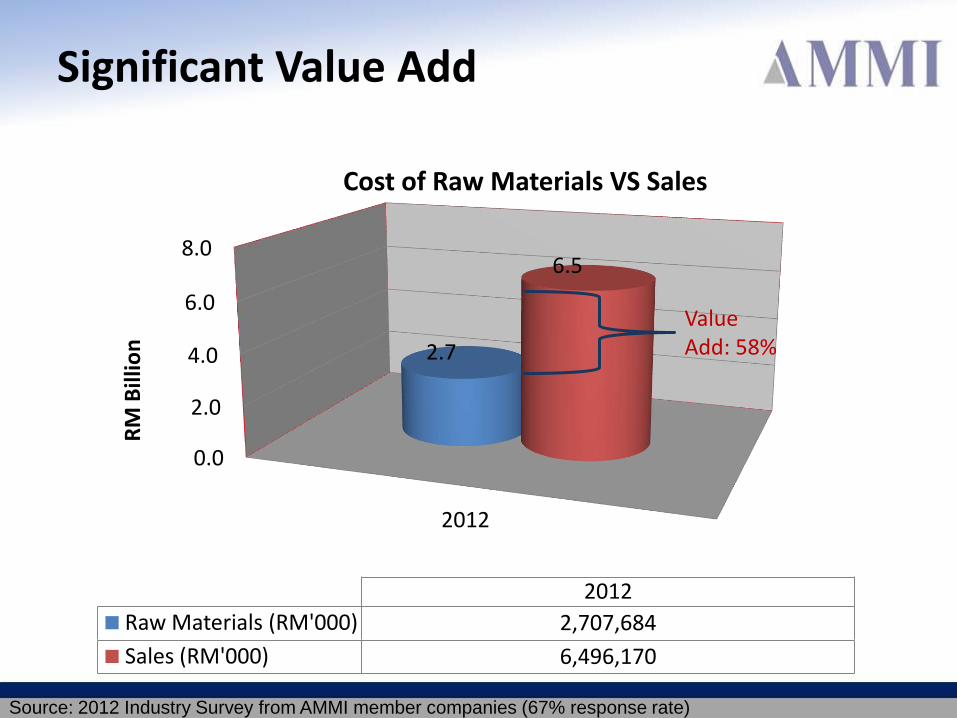
0.0
2.0
4.0
6.0
8.0
2012
2.7
6.5
RM
Bill
ion
2012
Raw Materials (RM'000) 2,707,684
Sales (RM'000) 6,496,170
Cost of Raw Materials VS Sales
Value Add: 58%
Source: 2012 Industry Survey from AMMI member companies (67% response rate)
Significant Value Add
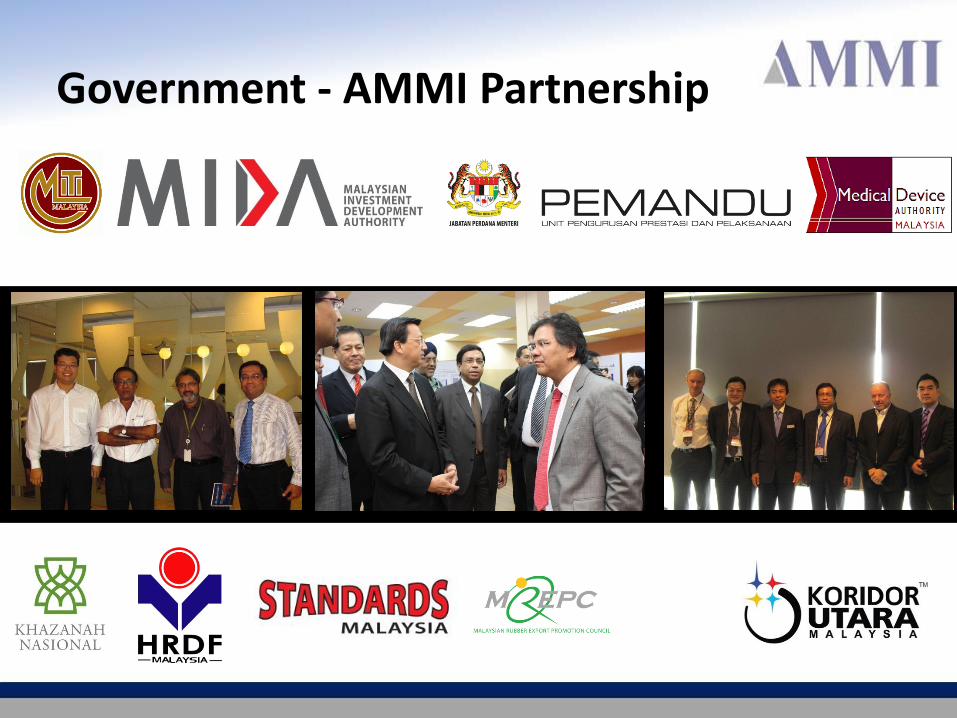
Government - AMMI Partnership
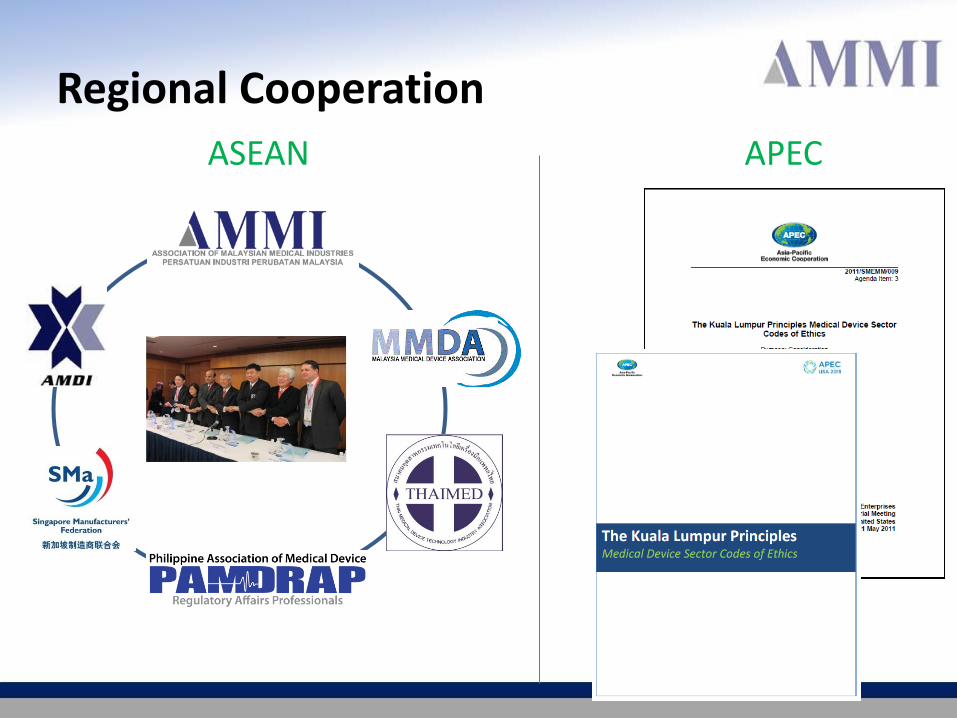
Regional Cooperation
ASEAN APEC
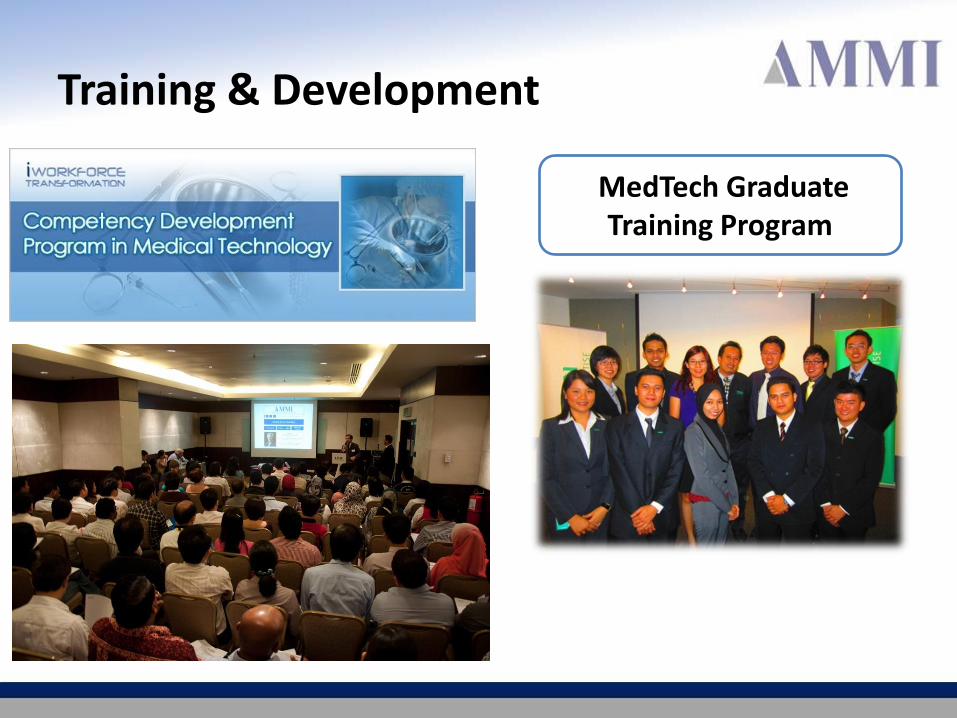
Training & Development
MedTech Graduate Training Program
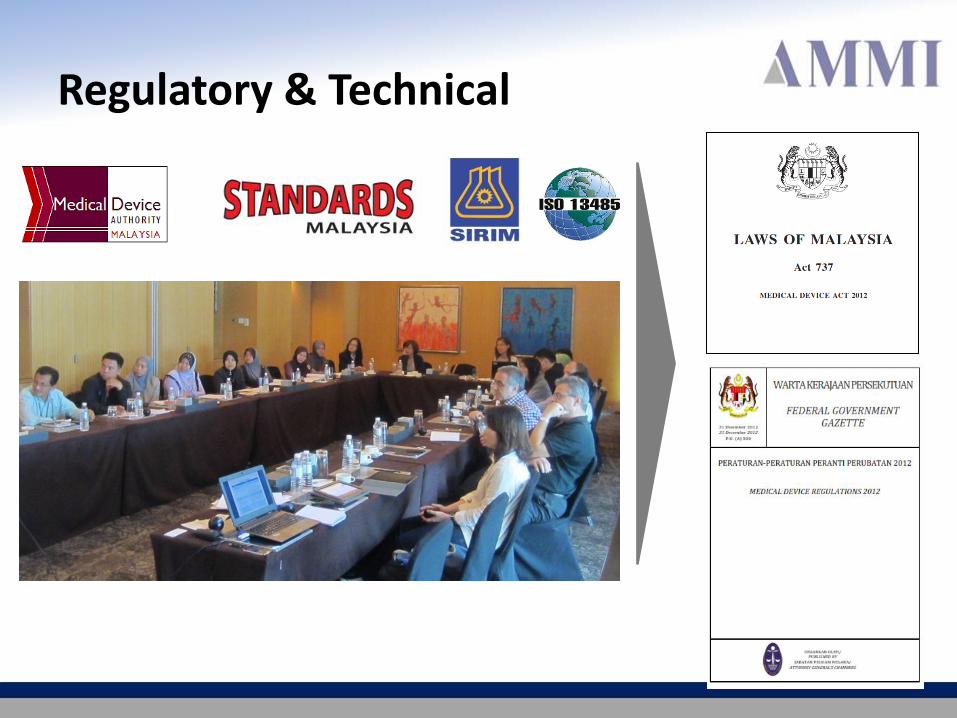
Regulatory & Technical
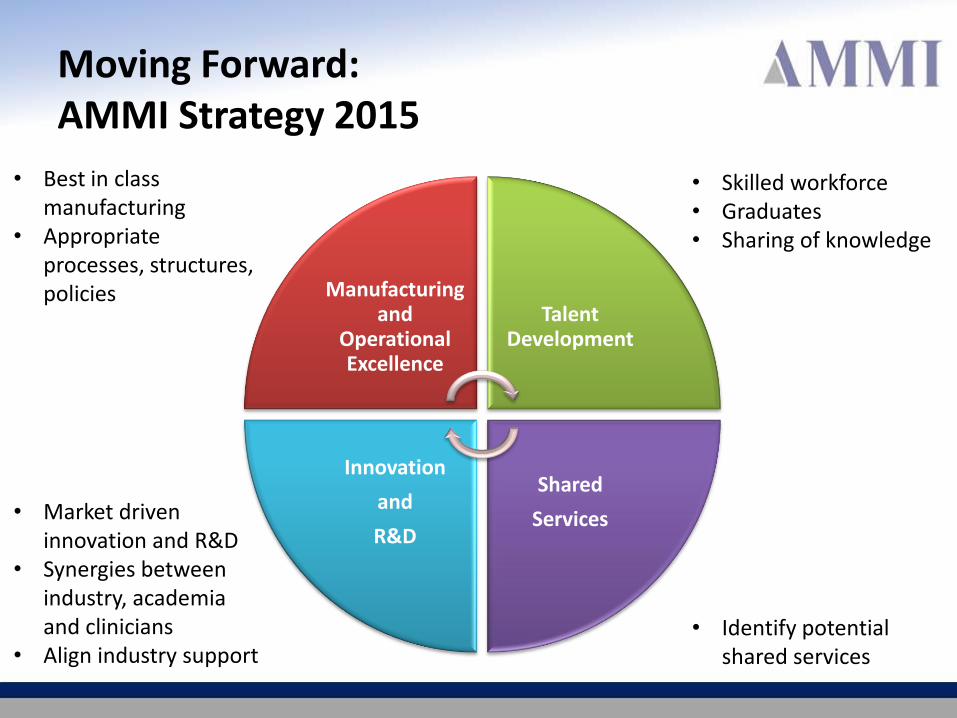
Moving Forward: AMMI Strategy 2015
Manufacturing and
Operational Excellence
Talent Development
Shared
Services
Innovation
and
R&D
• Best in class manufacturing
• Appropriate processes, structures, policies
• Skilled workforce • Graduates • Sharing of knowledge
• Market driven innovation and R&D
• Synergies between industry, academia and clinicians
• Align industry support • Identify potential
shared services
AMMI Secretariat C/O Medsociate Sdn. Bhd. PSDC Building No.1, Jalan Sultan Azlan Shah, Bayan Lepas 11900 Penang, Malaysia Mobile: +6012 – 4766 558 Tel : +604 – 6420 288 Fax : +604 – 6442 289 Email : [email protected]
Thank you