Embed Size (px)
Citation preview

Global Semantic Classi�cation of Scenes using Power
Spectrum Templates
Aude Oliva, Antonio B. Torralba
Anne Guerin-Dugue and Jeanny Herault
Laboratoire des Images et des Signaux (LIS)
Institut National Polytechnique de Grenoble (INPG)
Grenoble, France
foliva,[email protected]
Challenge of Image Retrieval (CIR99),Elect. Work. in Computing Series, Sringer-Verlag, Newcastle, 1999.
Abstract
Scene recognition and content-based procedures are of great interest for image indexing applicationsprocessing very large databases. Knowing the category to which a scene belongs, a retrieval system may�lter out images belonging to other categories.
In this paper, we introduce a computational approach which classi�es and organises real-world scenesalong broad semantic axes. Fundamental to our approach is the computation of global spectral templatesproviding a continuous organisation of scenes between two categories. These templates encode thestructure which is discriminant between two categories. We propose a hierarchical procedure of twostages, that organises images along three semantic axis. Firstly, all the scenes are classi�ed according toan Arti�cial to Natural axis. Then, natural scenes are organised along the Open to Closed axis whereasarti�cial environments are classi�ed according to the Expanded to Enclosed scenes axis.
1 Introduction
Everyday complex scenes depicted in photographs and movies are recognised by the human visual systemas rapidly as objects presented individually. Such an automatic and e�cient recognition is currently acomputational dream (or nightmare) for arti�cial visual systems. In particular, reaching such a level ofperformance is a critical feature of indexing of image databases.
Image retrieval systems usually represent images by a collection of low-level features such as colour,texture, edge positions and spatial relationships in the image. These features are used to compute thesimilarity between a picture selected by the user and the images in the database. The query is based onan image features vector matching between images while human classi�cations are based on fuzzy similaritycomputations that are often context-driven.
Bridging the gap between higher concepts such as \urban scenes" or \snowy mountains" and low-levelfeatures extracted from the picture, requires two fundamental operations: �nding the relevant semanticdescription of the concept and �nding the relevant low-level features.
In this paper, we present the �rst results of a computational approach that classi�es and organises real-world scenes along semantic axes. The research introduces the main concepts of the approach and describesclassi�cation results in "super-ordinate semantic classes" 1. The main marks of our approach are two-fold:
1A super-ordinate category (e.g. arti�cial or natural scenes, urban areas, horizon landscapes, indoor scenes, etc.) can be
Challenge of Image Retrieval, Newcastle, 1999 1

Global Semantic Classi�cation of Scenes using Power Spectrum Templates
1) determine the relevant spectral features correlated with the semantic content of the image 2) a continuousorganisation of scenes.
The low-level features set is represented by a template. This template uses the spectral content of theimage (i.e. the energy distribution through spatial frequencies and orientations) in order to discriminatebetween images with di�erent semantic contents. We propose to call it a Discriminant Spectral Template
(DST). The main properties of a DST are the following: 1) it is dependant upon a speci�c semantic imagecontain 2) it allows to continuously organise pictures along a speci�c semantic axis and 3) it is robust toimage variability.
In the following, we describe the organisation of real-world scenes along three semantic axes, each oneproviding an ideal DST (e.g. from arti�cial scenes to natural scenes; from \open" landscapes to \closed"landscapes, and from "city scenes" to \enclosed" urban scenes and indoors).
2 Context-Driven Recognition
Context-driven recognition procedures usually assume that a semantic classi�cation can emerge from verysimple computations based on low-level features [3-5,8,11,16,17]. Knowing the meaning of the scene, aretrieval system may compute in advance its semantic category.
Recent studies attempt to address this complex issue. For instance, Lipson et al. [6] reasoned that scenecategories should be invariant to image transformations such as scaling, illumination and precise objectslocation. They encode the global con�guration of the scene by using spatial and photometric relationshipswithin and across regions of images. Even though it is e�ective for scene categories that are geometricallywell-de�ned (e.g. snowy mountains with blue sky), their method cannot be generalised to broader categoriesor scenes where parts and objects are randomly localised (such as rooms or indoor buildings). In a similarvein, Picard and collaborators [3, 7, 16] represent scenes by a collection of features (texture, colour, spatialfrequencies) locally computed on tessellated images. Their strategy can retrieve images of urban scenes fromlandscapes [3] or classify pictures in indoor vs. outdoor categories [16]. The work of Vailaya et al. evaluatesthe discrimination power of several low-level features in order to classify city images versus landscapes [17].Common to all these approaches is the classi�cation into exclusive classes. However, when dealing withlarge databases, exclusive classi�cation may increase irrelevant classi�cation rate as most of pictures areambiguous in terms of category.
Fundamental to our approach is the notion that scene recognition requires the de�nition of continuoussemantic axis. The keystone is the computation of Discriminant Spectral Templates, encoding the spectralfeatures that better discriminate between two categories.
3 Power Spectrum Families
The search for an unique template came from experimental results about how the human visual systemmay recognise a complex scene. Typically, real-world scenes belonging to the same category tend to have asimilar organisation of their main component objects. Oriented shapes of the main components de�ne the\skeleton" of the spatial organisation [14]. Human visual processing seems to use these spatial regularities tocategorise a picture in broad classes (e.g. urban areas, coastlines, landscapes, rooms, textured environments,...) [9,10,14]. This \express" visual categorisation is based on a coarse invariant information which isindependent of the viewpoint, object locations, occlusions, shadows, colour and illuminant variations.
To this extent, the power spectrum turns out to be a very good candidate for encoding such a structuralinformation. The power spectrum of an image is the square of the magnitude of its Fourier transform. Itgives global information about the basic elements that form the image. Here, we are not interested in adetailed analysis of the power spectrum which would be as complicated as studying the pixelised image itself.We only look for global characteristics in terms of the main orientations in the image, the dominant spatial
described as a broad semantic category which subsumes several basic-level scene categories (respectively cities or mountains,city center or streets, panoramic beaches or valleys, kitchens or bedrooms).
Challenge of Image Retrieval, Newcastle, 1999 2

Global Semantic Classi�cation of Scenes using Power Spectrum Templates
−0.4−0.2
00.2
0.4
−0.4
−0.2
0
0.2
0.4
0.56
0.58
0.6
0.62
0.64
0.66
0.68
−0.4−0.2
00.2
0.4
−0.4
−0.2
0
0.2
0.4
0.56
0.58
0.6
0.62
0.64
0.66
0.68
−0.4−0.2
00.2
0.4
−0.4
−0.2
0
0.2
0.4
0.56
0.58
0.6
0.62
0.64
0.66
0.68
−0.4−0.2
00.2
0.4
−0.4
−0.2
0
0.2
0.4
0.56
0.58
0.6
0.62
0.64
0.66
0.68
−0.4−0.2
00.2
0.4
−0.4
−0.2
0
0.2
0.4
0.55
0.6
0.65
0.7
0.75
fx
fy
Mag
nitu
de
fx
fy
Mag
nitu
de
fx
fy
Mag
nitu
de
fx
fy
Mag
nitu
de
fx
fy
Mag
nitu
de
a) b) c) d) e)
Figure 1: Examples of power spectrum forms for prototypical images (vertical axis is the magnitude inlogarithmic scale, horizontal axis are the spatial frequencies fx and fy). At the bottom, we show sections atseveral levels of the power spectrum of each image.
scales, the periodic patterns, etc. Power spectrum answers to questions such as: which frequency bandencodes most of the energy; what is its global form through spatial scales; are there poles and narrow lines ofenergy? All these features would mostly be independent of objects arrangements, point of view, illumination,etc. For example, typical beach scenes have a strong horizontal organisation (Fig. 1 c). Therefore, theirpower spectra will display a dominance of energy on the fy axis, mostly at low fy spatial frequencies. At theopposite extreme, city scenes are usually structured along vertical and horizontal directions whereas spectraof forests would be mainly isotropic from low to high spatial frequencies (some examples are shown Fig. 1).
The power spectra of real-world images exhibit very di�erent energy distributions for each orientationsand spatial frequencies. In analysing images from a wide set of real-world environments, we observed astrong bias towards horizontal and vertical orientations [1, 2, 13].
We observed that �ve families of power spectrum can be de�ned showing a strong correlation with thesemantic content of the image [18]. Figure 1 shows prototypical power spectra for the �ve proposed families.These families are characterised by the shape of their dominant orientations:
1. Horizontal shape: The power spectrum exhibits an horizontal dominant line, on the fx axis, from lowto high spatial frequencies. A good example is a city scene composed of tall buildings (Fig.1a).
2. Cross shape: Vertical and horizontal directions are represented approximately equally in the powerspectrum. A typical scene exhibiting such a cross form at all spatial frequencies is an indoor scene of akitchen or a living-room, mainly composed of man-made objects of small and medium sizes (Fig.1b).
3. Vertical shape: The power spectrum shows a vertically dominant line (fy axis) revealing that the scenehas an horizontal structure. Examples are beach and �eld scenes, as well as other panoramic scenes(Fig.1c).
4. Oblique shape: Oblique orientations (mainly orientations at 45 deg plus or minus 15 deg) dominate thepower spectrum. Examples are images of mountain areas, canyons, valleys (Fig.1d).
5. Circular shape: All the orientations are equally represented in the picture, leading to an isotropic powerspectrum. Common examples are highly textured environments such as forests, �elds (Fig.1e).
Fig 1 shows typical examples of scenes belonging to each of the �ve power spectrum categories outlinedabove. For these prototypical images, the shape of the power spectrum is conserved across spatial scale.
Challenge of Image Retrieval, Newcastle, 1999 3

Global Semantic Classi�cation of Scenes using Power Spectrum Templates
a) b) c) d)fx
f y
Figure 2: This �gure shows the main steps for computing the vector of 100 components used to represent animage. a) Original image. b) Output of the pre-processing stage. The e�ect of illuminant and shadows havebeen reduced. c) Power spectrum of the pre�ltered image. It is computed as the squared of the magnitudeof the Fourier Transform. d) -3dB sections of the set of gabor �lters used to sample the power spectrum.The highest frequency is 1/3 cycles/image and the lowest one is 1/72 cycles/image.
For most images however, the shape of the power spectrum varies gradually from one of these categories toanother. For example, a �eld scene may display a vertical dominance at low-spatial frequencies correspondingto the horizon, and a \ring" at medium and high spatial frequencies corresponding respectively to the textureof the trees behind and the texture of the grass in front. As a consequence, the variety of natural images andtheir \intertwined" distributions of orientations is at the origin of the continuity along the semantic axesde�ned in this paper.
Instead of searching for low-level features (e.g. red and yellow) describing a speci�c semantic category(e.g. sunset beaches), we looked for semantic categories that would naturally emerge from the �ve majorpower spectrum forms. From the �ve main power spectrum forms displayed on Figure 1, we propose ahierarchical classi�cation procedure as follows: a �rst level of classi�cation discriminates between arti�cialvs. natural environements. The Horizontal and the Cross shapes together represent arti�cial environements(e.g. man-made scenes), whereas the three other shapes are typical of natural scenes 2. Following this initialclassi�cation, the second level assesses natural scenes along an axis representing scenes from Open to Closedenvironments (e.g. open scenes are mainly horizontally structured with depth view {beaches, �elds{ whereasclosed scenes are bounded environments, highly textured {forests, mountains. Open environments have avertical spectrum shape and closed environments have circular and oblique spectrum shapes). This secondlevel represents also arti�cial scenes along an axis revealing the vertical dominant structure of man-madeoutdoor and indoor environments that we call Expanded-Enclosed axis. This axis represents a continuumbetween unbroken areas of urban scenes made with tall and large buildings (horizontal spectrum shape) andcon�ned images of indoor buildings and rooms (cross spectrum shape).
4 Computational Model
4.1 Image database
We chose 700 pictures from the Corel Image database so as to cover a large variety of real-world scenes. Weimposed the constraint that images must not be pictures of isolated objects. Examples of scenes includedbeaches, �elds, forests, mountain areas, deserts, waterfalls, canyons, urban areas such as shopping centers,streets, highways, skyscrapers and di�erent kind of rooms. Out of the 700 images, 300 were classi�ed asarti�cial environments (man-made scenes), another 300 were classi�ed as natural, and the remaining 100
2As outlined in the previous section, classi�cation must be done on continuus axes. Thus, a panoramic view with an urbanarea in the background would be located between the arti�cial and the natural poles, exhibing a power spectrum form havingboth a cross form and a vertical form.
Challenge of Image Retrieval, Newcastle, 1999 4

Global Semantic Classi�cation of Scenes using Power Spectrum Templates
Figure 3: The �rst 8 Principal Components calculated from the power spectrum of 700 scenes. The horizontalcoordinate is fx and the vertical one is fy. The symmetrical structure of the principal components is due tothe mirror transformation applied to the image power spectrum.
were ambiguous scenes, namely natural scenes containing man-made objects (e.g. farm buildings in a �eld,benches in a garden, boats in an harbour, bridges over a ravine, . . . ). This classi�cation was obtained byasking 4 observers to place each image in the arti�cial or the natural group. Images were 256 by 256 pixelsin size, coded in 8-bit grey-levels.
4.2 Pre-processing
The aim of pre-processing is two-fold: reducing the e�ects of large shadows that may hide important partsof the scene and minimising the impact of high contrasted objects which would disturb the power spectrumshape of the background image. Firstly, we apply a logarithmic function to the intensity distribution. Then,we attenuate the very low spatial frequencies by applying a high pass �lter. We apply an adjustment of thelocal standard deviation at each pixel of the image. This operation makes large regions of the image beingequally bright (see Fig 2b).
4.3 Global Semantic Axes
The aim of the approach is to determine a unique template that can be applied to the power spectrum ofan image so as to localise the image along a continuous one-dimensional semantic axis. We compute threedi�erent templates (DST) corresponding to the three semantic axes of the hierarchical procedure (arti�cial tonatural scenes, open to closed scenes for natural environments and expanded to enclosed scenes for arti�cialenvironments).
The computation phases are as follows:
1) After the pre-processing stage, we compute the power spectrum (see Fig 2c) and we sample it with aset of narrow band Gabor �lters (see Fig. 2d).
2) We use Discriminant Analysis in order to compute the axes. To de�ne each axis, we have chosen twosets of prototypical scenes in order to set up the extremities of the axis. The Discriminant Analysis computesthe axis that both maximises the distance between the two prototypical groups and minimises the standarddeviation of the images belonging to the same group.
4.3.1 Spectral Representation
If we compute the power spectrum of an image of size 256x256 pixels (by computing the magnitude ofthe Discrete Fourier Transform of the image), we obtain a 256x128 (discarding the radial symmetry of thepower spectrum) vector of low-level features for each image. Therefore, images are distributed in a veryhigh dimensional space. To reduce dimensionality, we sample the power spectrum by a set of narrow-bandGabor �lters (100, see Fig. 2d) tuned to di�erent spatial frequencies (orientations and scales) from lowspatial frequencies (1/72 cycles/image) to high spatial frequencies (1/3 cycles/image). We sample the powerspectrum with 10 spatial frequency radial bands and a decreasing number of orientations from high (24) tomedium (12) and low (4) spatial scales.
Challenge of Image Retrieval, Newcastle, 1999 5

Global Semantic Classi�cation of Scenes using Power Spectrum Templates
The transfer function of a Gabor �lter tuned to the spatial frequency fr in the direction determined bythe angle � is given by the expression:
G(fx; fy) = K e�2�2(�2x(f0
x�fr)
2+�2yf 02
y ) (1)
where f 0x and f 0y are obtained by rotation of the spatial frequencies f 0x = fx cos(�) + fy sin(�) and f 0y =�fx sin(�) + fy cos(�). �x and �y give the shape and frequency resolution of the Gabor �lter. K is aconstant. The full set of �lters is obtained by rotation and scaling of this expression. This gives a highfrequency resolution at low spatial frequencies and a low frequency resolution at high spatial frequencies.The values �x and �y are chosen in order to have coincidence in the contour section of the magnitude at-3dB.
Given an image, its semantic content is invariant with respect to an horizontal mirror transformation ofthe image. Therefore, we compute the symmetric energy outputs of the Gabor �lters which are invariantwith respect to an horizontal mirror transformation:
�fr ;� =
Z ZjI(fx; fy)j
2 �G2fr;�
(fx; fy) +G2fr;���(fx; fy)
�dfx dfy (2)
where jI(fx; fy)j2 is the power spectrum of the image. Gfr;� and Gfr;��� are two Gabor �lters tuned to the
spatial frequencies given by the radial frequency fr and the directions � and � � �. Therefore, the value�fr;� is invariant with respect to an horizontal mirror transformation of the image.
The features we are going to use are the normalised ones:
e�fr ;� = �fr;� �E (�fr ;�)
std (�fr ;�)(3)
where E and std are the mean and the standard deviation of the features �fr ;� computed over the entire
image database. Therefore, for each image, we have a feature vector de�ned by the collection of e�fr;�obtained at di�erent frequencies and orientations.
4.3.2 Discriminant Spectral Template
Before applying the discriminant analysis, we performed a second dimensionality reduction (from 100 to 8).We computed the principal components (PC) of the normalised energy features (eq. 3) over the entire imagedatabase. Principal Component Analysis (PCA) gives the orthogonal axes (called principal components)that best represent the variance of the distribution. This operation reduces the dimensionality by takinginto account only the most important components, the components that are responsible of the variabilitybetween images in the feature space [15]. Figure 3 shows the eight �rst Principal Components computedfrom the entire database. The PC pictures are computed by addition of the set of Gabor �lters, weighted bythe components of the principal vectors obtained by the PCA. The symmetrical structure of the principalcomponents is due to the mirror transformation originally applied to the features 3 (eq. 3).
After projection of each image spectral features onto the principal components, we compute the semanticaxis by applying Discriminant Analysis. The following method is applied to each of the three semantic axes.Firstly, we separate the database in two groups de�ning the extremities of the axis. For this purpose, we onlyuse prototypical images. Discriminant Analysis consists in the search of the axis maximising the distancebetween classes while minimising the dispersion between elements of the same class [see [12] for a descriptivereview of the method]. Half of the image database is used for the learning stage and the other half for thetesting stage.
As two prototypical groups of images are considered, Discriminant Analysis provides only one discriminantvector. This discriminant vector is expected to represent a relevant organisation of pictures along thesemantic axis we are looking for. Therefore, we compute the projection of each image spectral features on
3Note that computing the PCA directly from the Gabor outputs without the mirror transformation shows poorer perfor-mances, because only some of the principal components are nearly symmetric.
Challenge of Image Retrieval, Newcastle, 1999 6

Global Semantic Classi�cation of Scenes using Power Spectrum Templates
-6 -2 0 2 60
10
25
-6 -2 0 2 6
0
10
25Artificial Natural
fx
f y
Figure 4: Results of projection of the testing group onto the Arti�cial-Natural axis. The histograms showthe distribution of both the arti�cial and the natural images sets onto the axis (testing phase). 90 % of theimages are accurately classi�ed in the testing phase (91 % in the learning phase). At the righthand side,we show the resulting DST. The angular anisotropy reveals the importance of the statistics of dominantorientations between di�erent groups of images.
the semantic axis. Figures 4, 7 and 9 display the three discriminant vectors. As in Figure 3, these picturesare obtained by addition of the set of Gabor �lters, each one weighted by the components of the discriminantvector. They have been computed from the eight �rst principal components. We call this representation aDiscriminant Spectral Template or DST.
4.4 Arti�cial-Natural Axis
The objective is to compute the DST associated with the Arti�cial-Natural axis. Arti�cial scenes arecomposed of man-made objects, having dominant vertical and horizontal edges. Thus, their power spectrumdisplays an horizontal shape or a cross form (see Fig. 1 a and b). On the contrary, the orientation distributionin the power spectrum of a natural scene is usually isotropic (Fig. 1 e) or has an oblique dominance (Fig. 1 d).Other natural scenes have a strong horizontal component due to the horizon (Fig. 1 c). Out of 600 arti�cialand natural images, 300 prototypical scenes have been used in the learning phase (150 for each class) inorder to compute the Arti�cial-Natural DST, as described in the previous section.
The validity of the DST is assessed along two criteria. We desire that the classi�cation rate obtained bythe discriminant analysis approximates the classi�cation obtained by humans in the two-alternative forcedchoice task (Arti�cial vs. Natural). Then, the pictures should organise themselves in a coherent and denseway along the considered axis.
In the testing phase, 300 new pictures are projected using the DST shown in Figure 4. The DSTshows how the spectral components should be weighted in order to di�erentiate arti�cial from naturalenvironments: the white and dark parts respectively represent natural and arti�cial components. Naturalcomponents are found at very low vertically oriented spatial frequencies and oblique orientations at all spatialscales. Arti�cial components describe a cross, strengthened along the horizontal at low and medium spatialfrequencies. Results of the classi�cation in exclusive groups are displayed Figure 4 (the histograms). Bothlearning and testing performances are slightly larger than 90 %.
The second criterion has been tested in two ways. First, Figure 5 displays prototypical pictures randomlyselected and equally spaced along the axis. We observed that the left side exhibits arti�cial scenes and theright side exhibits natural scenes.
To fully investigate the relevance of the arti�cial-natural DST, we projected 100 other new pictures,supposed to be \ambiguous" regarding their arti�cial or natural status (e.g. natural environments containingmore or less man-made structures).
Challenge of Image Retrieval, Newcastle, 1999 7

Global Semantic Classi�cation of Scenes using Power Spectrum Templates
Artificial Natural
Figure 5: Organisation of new prototypical scenes on the Arti�cial-Natural axis. Pictures have been randomlyselected and are equally spaced along the axis. The left side exhibits arti�cial scenes and the right sideexhibits natural scenes.
Figure 6 shows a sample of the results: the images with an underlined segment are prototypical picturesdisplayed to show the extremities of the axis. Interestingly, the new ambiguous images are mainly projectedaround the middle of the axis (represented by the center line of Figure 6) rather than the extremities. Thebottom line displays pictures seen as mainly natural: indeed, the farm scene contains a dominant textured�eld and the panoramic view over the village scene is strongly horizontally structured like a natural openlandscape. Thus, the model prefers to classify these pictures as \natural". In a similar vein, the top lineshows four ambiguous pictures considered as \more" arti�cial. In fact, their power spectrum exhibits a crossform style. The medium line of Figure 6 represents pictures classi�ed around the center of the axis. Notethat the right images in the central line, are horizontally structured: at low spatial frequencies, verticalcomponents (fy) are dominant, corresponding to the natural components of the DST (white). Note alsothat the images left of the medium line are mainly composed of arti�cial objects (the boat and the farm).Their power spectra are closer to the arti�cial components of the DST (dark).
4.5 Open-Closed Axis
Knowing that a picture belongs more to the natural or the arti�cial set, we propose to compute another DSTwhich purpose is to organise natural scenes along a speci�c semantic axis (Open to Closed axis). This axisoriginally comes from three power spectrum shapes (cf. Fig. 1-c-d-e). Looking at natural environments, wepropose to represent scenes from open, unbroken areas with an horizon (Vertical Power Spectrum family) tobounded and closed textural environments (Circular and Oblique Power Spectrum families). Ideally, imaginea scene with a prominent horizon (e.g. a panoramic view on a valley) being slowly \�lled in", either bydistant large and tall objects in the background (e.g. mountains) or by closer textured parts (e.g. trees,bushes, grass).
From the 300 prototypical natural images (e.g. beaches, seashores, oceans, deserts, �elds, various land-scapes, forests, gardens, waterfall areas, snowy or rocky mountains, valleys, open and closed canyons, ...),150 were used for the learning phase and the DST computation and 150 for the testing phase. Learning andtesting performances of classi�cation rate in Open-Closed are about 88 % (cf. histograms of Figure 7). 4
Figure 8 displays exemplars of natural scenes randomly selected and equally spaced along the axis.We observe an appropriate organisation from open areas (left side of Figure 8) such as �elds, coastlines,panoramic valley views, progressively replaced by mountains environments and wide textured scenes (e.g.gardens, close-up bushes views, forests,...). The Open-Closed DST is displayed in Figure 7. The dark parts(negative values) represent the open components whereas the white parts (positive values) represent theclosed ones. The intensity of dark and white parts reveals how the spectral components of a natural imageshould be weighted to compute its position on the axis.
4Note that the rate in exclusive classi�cation is only indicative of the projection of prototypical images. The purpose of theDST representation is to look for a continuous organisation from Open to Closed environments.
Challenge of Image Retrieval, Newcastle, 1999 8
Global Semantic Classi�cation of Scenes using Power Spectrum Templates
... Natural
Artificial ...
Figure 6: Examples of ambiguous scenes and their organisation along the Arti�cial-Natural axis. Imagesare sorted according to the Arti�cial-Natural DST: from the top to the bottom and from the left to theright, scenes are organised from the most arti�cial to the most natural. Underlined images belong to theprototypical groups.
fx
fy
-6 -2 0 2 6
0
10
25Open
-6 -2 0 2 6
0
10
25Closed
Figure 7: Results of projection of the testing group of natural images onto the Open-Closed axis. At therigthhand side we show the resulting DST. 88 % of images are well-classi�ed both in the learning and thetesting phases.
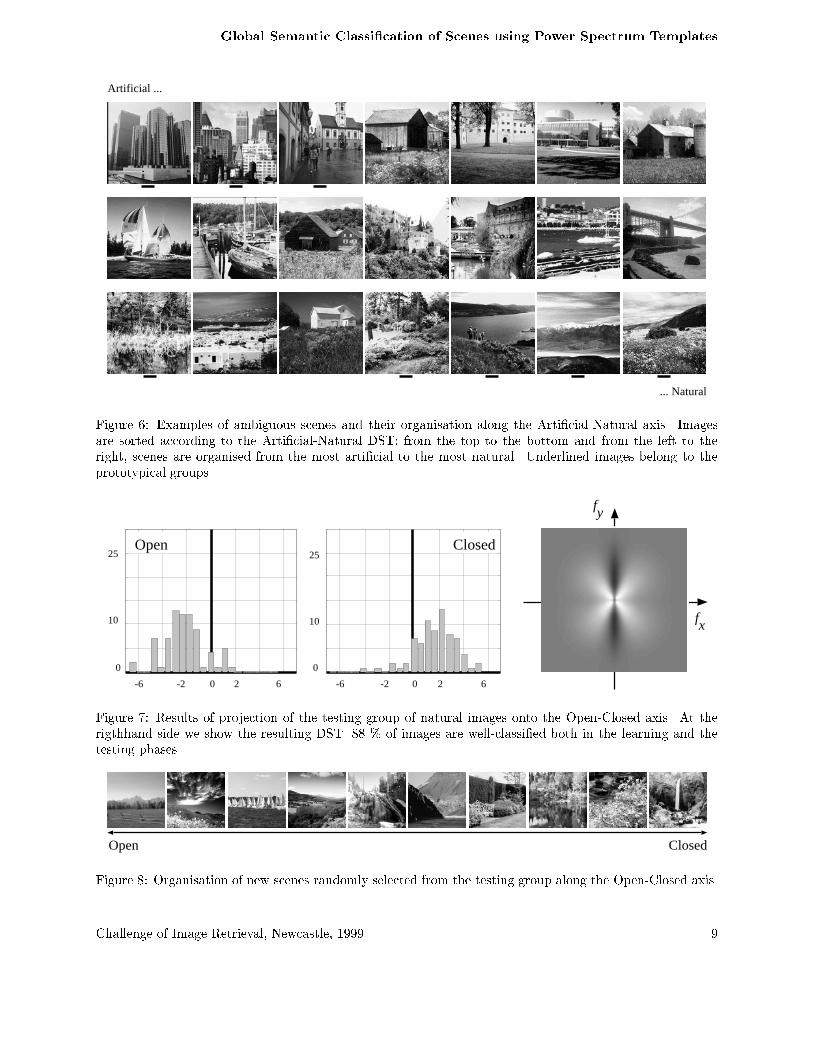
Open Closed
Figure 8: Organisation of new scenes randomly selected from the testing group along the Open-Closed axis.
Challenge of Image Retrieval, Newcastle, 1999 9

Global Semantic Classi�cation of Scenes using Power Spectrum Templates
fx
fy
-10 0 100
10
-10 0 100
10
Expanded Enclosed
Figure 9: Results of projection of the testing group of prototypical arti�cial images onto the Expanded-Enclosed axis. At the rigthhand we show the resulting DST. 82 % of images are well-classi�ed.
Expanded Enclosed
Figure 10: Organisation of new scenes randomly selected from the testing group along the Expanded-Enclosedaxis.
4.6 Expanded-Enclosed Axis
In a way similar to the analysis along the Open-Closed axis, we looked at a possible super-ordinate semanticfor the arti�cial scenes. From the Horizontal and the Cross power spectra shapes (Figs. 1 a and 1 b),two broad categories seem to emerge: Expanded areas of urban scenes with vertically structured parts andcon�ned and Enclosed scenes as urban areas and indoors. The image database was composed of 200 arti�cialscenes representing prototypical images grouped either in the Expanded or Enclosed classes. The learningstage was performed on half of the database (100) and used to de�ne the Expanded-Enclosed DST (seeFigure 9).
The classi�cation rate both for learning and testing was 82 % (Figure 9). Note that this two-alternativeforced choice task (Expanded vs. Enclosed) is ambiguous for human subjects. The organisation is shownin Figure 10. A careful look at the selected pictures, from left to right, shows a \broad" regularity of theorganisation chosen by the model, e.g. from vertically structured areas, some with strong vanishing lines(see the left picture of the Figure 10), to indoor scenes characterised by a double dominance of horizontaland vertical edges. The dark parts of the Expanded-Enclosed DST represent the Expanded components andthe white parts represent the Enclosed components. The dark Expanded components are located along thehorizontal direction (fx) and at an orientation plus or minus 30 deg. around (fy). These latter componentsmay characterise the vanishing lines of images with perspective views. The white Enclosed components arevertically displayed.
5 Conclusion
In this paper, we present a novel computational method for performing broad semantic categorisation.Images are organised along semantic axes using a hierarchical representation (arti�cial to natural scenes,
Challenge of Image Retrieval, Newcastle, 1999 10

Global Semantic Classi�cation of Scenes using Power Spectrum Templates
open to closed natural scenes and expanded to enclosed arti�cial scenes). The position of an image along eachaxis is obtained by matching its power spectrum with a Discriminant Spectral Template (DST) computedfrom learning over a subset of the image database. The DSTs appear to be a suitable representation forcontinuously organising pictures along semantic axes and thus, taking into account the ambiguous nature ofreal-world scenes.
Scene recognition algorithms and context-driven procedures are of great interest for image indexingapplications processing very large databases. Our approach o�ers a collection of features (DST) 5 thatappears to be strongly correlated with a meaningful content of the scene.
Acknowledgments
The authors wish to thank two anonymous reviewers for helful comments and Dr. P. Mamassian and K.Davies for discussions of an earlier version of this manuscript. This work was funded by a post-doctoralfellowship awarded to Aude Oliva from the Region Rhones-Alpes, ACTIV project on Image Indexing, and by aPhD. fellowship from the MEESR, France, awarded to Antonio B. Torralba. Please, send all correspondanceconcerning this paper to A. Oliva or A.B. Torralba foliva, [email protected].
References
[1] R. Baddeley. The correlational structure of natural images and the calibration of spatial representations.Cognitive Science 1997; 21:351{372
[2] D. J. Field and N. Brady. Visual sensitivity, blur and the sources of variability in the amplitude spectraof natural scenes. Vision Research 1997; 37:3367{3383
[3] M. M. Gorkani and R. W. Picard. Texture orientation for sorting photos "at a glance". Proc. Int Conf.Pat. Rec., Jerusalem, 1994, Vol I, pp. 459-464
[4] A. Gurin-Dugu and A. Oliva. Natural image classi�cation from distribution of local dominant orienta-tions. 11th Scandinavian Conference on Image Analysis. Kangerlussuaq, Greenland, 1999
[5] J. Hrault, A. Oliva, and A. Gurin-Dugu. Scene categorisation by curvilinear component analysis of lowfrequency spectra. In European Symposium on Arti�cial Neural Networks. Bruges, 1997, pp 91-96
[6] P. Lipson, E. Grimson, and P. Sinha. Con�guration based scene classi�cation and image indexing. InIEEE Computer Society Conference on Computer Vision and Pattern Recognition. Puerto Rico, 1997,pp 1007-1013 (IEEE Computer Society Press)
[7] F. Liu and R. W. Picard. Periodicity, directionality and randomness: Wold features for image modelingand retrieval. IEEE transactions on Pattern Analysis and Machine Intelligence 1996; 18:722-733
[8] A. Oliva. Perception de Scnes [Scene Perception]. PhD thesis, Institut National Polytechnique deGrenoble, 1995
[9] A. Oliva and P. G. Schyns. Color in uences fast scene categorization. In Proceedings of the 18th annualconference of the cognitive science society. San Diego, California, 1996, pp 239-242
[10] A. Oliva and P.G. Schyns. Coarse blobs or �ne edges? evidence that information diagnosticity changesthe perception of complex visual stimuli. Cognitive Psychology 1997; 34:72-107
[11] A. Oliva and A.B. Torralba. Scene Semantic Spaces from Global and Color Templates. TechnicalReport, LIS-INPG, March 99.
5The DSTs proposed in this paper are not exhaustive and other DSTs may de�ne other semantical axes.
Challenge of Image Retrieval, Newcastle, 1999 11

Global Semantic Classi�cation of Scenes using Power Spectrum Templates
[12] B. D. Ripley. Pattern recognition and neural networks. Cambridge University Press, 1996
[13] A. Schaaf and J. H. Hateren. Modeling the power spectra of natural: statistics and information. VisionResearch 1996; 36:2759-2770
[14] P. G. Schyns and A. Oliva. From blobs to boundary edges: evidence for time- and spatial-scale-dependentscene recognition. Psychological Science 1994; 5:195-200
[15] D. L. Swets and J. J. Weng. Using discriminant eigenfeatures for image retrieval. IEEE transactionson Pattern Analysis and Machine Intelligence 1996; 18:831-836
[16] M. Szummer and R. W. Picard. Indoor-outdoor image classi�cation. In IEEE intl. workshop onContent-based Access of Image and Video Databases, 1998.
[17] A. Vailaya, A. Jain and H. J. Zhang. On image classi�cation: city images vs.landscapes. PatternRecognition 1998; 31:1921-1935
[18] A. B. Torralba and A. Oliva. Semantic Organisation of Scenes using Discriminant Structural Templates.IEEE International Conference in Computer Vision (ICCV'99)
Challenge of Image Retrieval, Newcastle, 1999 12


![FuseSeg: Semantic Segmentation of Urban Scenes Based on ... · ization and mapping algorithms [13]–[17]. Note that the type of urban scenes we are considering is the street scene](https://img.pdfslide.net/doc/110x75/5fffdfd5de02f64f4f45f996/fuseseg-semantic-segmentation-of-urban-scenes-based-on-ization-and-mapping.jpg)


![Scene Flow Propagation for Semantic Mapping and Object ...mapping process. Semantic mapping in outdoor street scenes is considered by Sengupta et al. [16]. In this work, stereo images](https://img.pdfslide.net/doc/110x75/5fffdfd5de02f64f4f45f994/scene-flow-propagation-for-semantic-mapping-and-object-mapping-process-semantic.jpg)