Embed Size (px)
Citation preview
Global soil spectroscopyassessmentSpectral soil data:
needs and capacities
2020
2020 | Global Soil Spectroscopy Assessment
Spectral soil data: Needs and capacities
By Filippo Benedetti
Global Soil Partnership, FAO
Fenny van Egmond
ISRIC – World Soil Information
Food and Agriculture Organization of the United Nations
Rome, 2021
II
Required citation:
Benedetti, F. and van Egmond, F. 2021. Global Soil Spectroscopy Assessment. Spectral soil data – Needs and capacities. Rome, FAO.
https://doi.org/10.4060/cb6265en
The designations employed and the presentation of material in this information product do not imply the expression of any opinion
whatsoever on the part of the Food and Agriculture Organization of the United Nations (FAO) concerning the legal or development status
of any country, territory, city or area or of its authorities, or concerning the delimitation of its frontiers or boundaries. The mention of specific
companies or products of manufacturers, whether or not these have been patented, does not imply that these have been endorsed or
recommended by FAO in preference to others of a similar nature that are not mentioned.
The views expressed in this information product are those of the author(s) and do not necessarily reflect the views or policies of FAO.
ISBN: 978-92-5-134830-7
© FAO, 2021
Some rights reserved. This work is made available under the Creative Commons Attribution-NonCommercial-ShareAlike 3.0 IGO licence
(CC BY-NC-SA 3.0 IGO; https://creativecommons.org/licenses/by-nc-sa/3.0/igo/legalcode).
Under the terms of this licence, this work may be copied, redistributed and adapted for non-commercial purposes, provided that the work
is appropriately cited. In any use of this work, there should be no suggestion that FAO endorses any specific organization, products or
services. The use of the FAO logo is not permitted. If the work is adapted, then it must be licensed under the same or equivalent Creative
Commons licence. If a translation of this work is created, it must include the following disclaimer along with the required citation: “This
translation was not created by the Food and Agriculture Organization of the United Nations (FAO). FAO is not responsible for the content
or accuracy of this translation. The original [Language] edition shall be the authoritative edition.”
Disputes arising under the licence that cannot be settled amicably will be resolved by mediation and arbitration as described in Article 8
of the licence except as otherwise provided herein. The applicable mediation rules will be the mediation rules of the World Intellectual
Property Organization http://www.wipo.int/amc/en/mediation/rules and any arbitration will be conducted in accordance with the Arbitration
Rules of the United Nations Commission on International Trade Law (UNCITRAL).
Third-party materials. Users wishing to reuse material from this work that is attributed to a third party, such as tables, figures or images,
are responsible for determining whether permission is needed for that reuse and for obtaining permission from the copyright holder. The
risk of claims resulting from infringement of any third-party-owned component in the work rests solely with the user.
Sales, rights and licensing. FAO information products are available on the FAO website (www.fao.org/publications) and can be
purchased through [email protected]. Requests for commercial use should be submitted via: www.fao.org/contact-us/licence-
request. Queries regarding rights and licensing should be submitted to: [email protected].
Cover photograph: ©Fenny van Egmond
III
Contents
Contributions ............................................................................................................................................... V
Acknowledgements .................................................................................................................................... IX
Abbreviations and acronyms ........................................................................................................................ X
Key messages and outlook .......................................................................................................................... XI
1. Introduction ............................................................................................................................................. 1
1.1. Participation in the survey ................................................................................................................. 1
1.2. Structure of the survey ...................................................................................................................... 2
2. Results and discussions ............................................................................................................................ 5
2.1. The Global Soil Information System (GLOSIS) and soil spectral data ................................................... 5
2.2. Laboratories and procedures ............................................................................................................. 6
2.2.1. General ...................................................................................................................................... 6
2.2.2. Laboratories not performing spectral measurements ................................................................. 7
2.2.3. Laboratories that perform spectral measurements on soil .......................................................... 8
2.3. Spectral data provisioning ................................................................................................................13
2.4. Spectral data analysis .......................................................................................................................16
2.5. Main areas of interventions..............................................................................................................18
3. Conclusions .............................................................................................................................................19
Annex I. Spectral soil data: needs and capacities questionnaire ..................................................................22
IV
Figures and tables
Figure 1 – Responses per region
Figure 2 – Opinion and potential adoption on the establishment of a distributed infrastructure
Figure 3 – Number of soil samples analysed every year by the laboratories that answered the survey
Figure 4 – Percentage of laboratories responding to the survey on the different soil parameters they analyse
Figure 5 – Instruments brands and models
Figure 6 – Spectral regions measured by laboratories responding to the survey, in percentages
Figure 7 – Laboratory procedures followed for spectral measurements
Figure 8 – Main difficulties experienced in the measurement
Figure 9 – Main challenges experienced in processing the data and supplying the spectrally-derived soil data
Figure 10 – Main solutions proposed by laboratories to improve the spectral measurements
Figure 11 – In what way the data should be provisioned, according to the preferences of laboratories that
…………………joined the survey
Figure 11 and 12 – Preferences on the way and format data should be provisioned
Figure 13 – Preferences on modelling programs
Figure 14 – Potential support preferences
Figure 15 – How to make a platform more user-friendly
Figure 16 – Potential contributions to the project
Figure 17 – Main areas of intervention
Table 1 – Main challenges faced in measuring spectral properties in soil samples, with inputs on potential
………………solutions
Table 2 – Areas of intervention of GLOSOLAN to support laboratories
Table 3 – Regional major drawbacks for measuring spectral properties of soil samples and main needs
V
Contributions
All names listed here are presented in alphabetic order.
Reviewers
Lucrezia Caon (FAO – GSP)
Rich Ferguson (USDA-NRCS-KSSL)
Carla Green Adams (USDA-NSSC)
Yi Peng (FAO – GSP)
Keith Shepherd (ICRAF/iSDA)
Edition and publication
Matteo Sala (FAO – GSP)
Contributing laboratories
African region
Republic of Cameroon - Soil, Water, Plant and Fertilizer Analytical Services laboratory, International
Institute of Tropical Agriculture
Republic of Djibouti - Laboratoire des sciences du sol, CERD
Federal Democratic Republic of Ethiopia - Ethiopian Agricultural Transformation Agency (ATA)
Federal Democratic Republic of Ethiopia - Southern Agricultural Research Institute (SARI)
Republic of Ghana - Analytical Services Laboratory, CSIR-Soil Research Institute
Republic of Ghana - CSIR-SARI Environmental Analytical Laboratory
Republic of Kenya - Soil-Plant Spectral Diagnostics Laboratory, ICRAF
Republic of Kenya - Cropnuts
Kingdom of Lesotho - Soils Lab, Department of Agricultural Research
Republic of Madagascar - Laboratoire des RadioIsotopes, University of Antananarivo
Republic of Niger - LASEVE/INRAN
Federal Republic of Nigeria - Phosphorus laboratory/IAR ABU Zari
Federal Republic of Nigeria - National Soil Testing Laboratory Complex Kaduna
Federal Republic of Nigeria - General Purpose Laboratory, Institute for Agricultural Research Ahmadu
Bello University Zaria
VI
Republic of Senegal - Institut de Technologie Nucléaire Appliquée
Republic of Senegal - IRD - US IMAGO
Republic of South Africa - North West University
Republic of South Africa - Agricultural Research Council-Soil, Climate and Water
Togolese Republic - Laboratoire d'Analyses des sols et Végétaux de l'Ecole Supérieure d'Agronomie de
l'Université de Lomé
Republic of Uganda - National Agricultural Research Laboratories (NARL)
Republic of Zimbabwe - University of Zimbabwe
Asian region
Kingdom of Bhutan - Soil and Plant Analytical Laboratory, National Soil Services Centre, Department of
Agriculture
Republic of India - ICAR-Central Arid Zone Research Institute, Jodhpur
Federal Democratic Republic of Nepal - Soil Science Division, NARC
Islamic Republic of Pakistan - Soil & Plant Nutrition lab, LRRI, NARC
Islamic Republic of Pakistan - Fauji Fertilizer Company Limited (FFCL)
Islamic Republic of Pakistan - Soil and Plant Nutrients Prog., LRRI, National Agricultural Research Centre,
Islamabad
Republic of Philippines - Laboratory Services Division - Bureau of Soils and Water Management
Democratic Socialist Republic of Sri Lanka - Central Soil and Fertilizer Testing Laboratory, Horticultural Crops
Research and Development Institute, Department of Agriculture
Eurasian and European regions
Republic of Austria - AGES Austrian Agency for Health & Food Safety
Kingdom of Belgium - Axe Echanges Eau Sol Plantes, GxABT, Liege University
Kingdom of Belgium - UCLouvain
Kingdom of Belgium - CRA-W, NIR lab
Czech Republic - Department of Soil Science and Soil Protection, Czech University of Life Sciences Prague
Czech Republic - UKZUZ Brno, Laboratory of NIR spectrosopy
Kingdom of Denmark - Aarhus University, AGRO laboratory
Republic of Estonia - Estonian Environmental Research Centre
French Republic- Institut de recherche pour le développement (IRD)
French Republic - Eco&Sols, Institut de recherche pour le développement (IRD)
VII
French Republic - Institut de recherche pour le développement (IRD), UMR LISAH
Federal Republic of Germany - Department of Geosciences, University of Tübingen
Federal Republic of Germany - GFZ , spectroscopy laboratory
Hungary - Soil Conservatory Laboratory, Velence (Hungary)
Republic of Kazakhstan - Research Center of Ecology and Environment of Central Asia (Almaty) / Analytical
Complex International Laboratory
Kingdom of the Netherlands - Agrocares BV
Kingdom of the Netherlands – ISRIC, World Soil Information
Republic of North Macedonia - Laboratory for quality control of soil, fertilizers, water and plant
material/Scientific Tobacco Institute
Republic of North Macedonia - Laboratory for soil quality, fertilizers and plants/Institute of agriculture
Russian Federation - V.V. Dokuchaev Soil Science Institute
Kingdom of Spain - Universitat de Lleida
Kingdom of Sweden - Department of Soil and Environment, Swedish University of Agricultural Scienses
Swiss Confederation - BUCHI Labortechnik AG
Swiss Confederation - Kompetenzzentrum Boden KOBO Switzerland
Republic of Turkey - SOFREL-TR
Republic of Turkey - Isparta University of Applied Sciences
Ukraine - Laboratory of Instrumental Soil Research Methods, Standardization and Metrology
United Kingdom of Great Britain and Northern Ireland - The James Hutton Institute
United Kingdom of Great Britain and Northern Ireland - Rothamsted Research, Dry Spectral Laboratory
Latin America and the Caribbean region
Argentine Republic - RILSAV - EEA ANGUIL
Federative Republic of Brazil - Labgeo - Universidade Federal de Viçosa
Federative Republic of Brazil - Soil Radiometry Laboratory
Republic of Colombia - Agromovilcolombia
Dominican Republic - LABOSUELOS
United Kingdom of Great Britain and Northern Ireland Ecuador - Laboratorio de Suelos, Foliares y Aguas,
Agencia de Regulación y Control Fito y Zoosanitario, AGROCALIDAD
United Mexican States - Laboratorio de Biogeoquímica y Materia Orgánica del Suelo, Instituto de Geología,
UNAM
United Mexican States - Universidad Autónoma de Nuevo León
VIII
Republic of Nicaragua - CRS-LAC
Bolivarian Republic of Venezuela - Laboratorio de Ecología de Suelos, Ambiente y Agricultura, Instituto
Venezolano de Investigaciones Científicas
Near East and North African region
Islamic Republic of Iran - Soil and Water Research Institute
Republic of Iraq - Soil Chemistry Laboratory, Directorate of Agricultural Research -Ministry of Science and
Technology
Hashemite Kingdom of Jordan - Soil/NARC
Republic of the Sudan - Land Use Laboratory
North American region
Canada - Direction de la recherche forestière, MFFP Québec
Canada - University of British Columbia
Canada - University of Saskatchewan
United States of America - Michigan State University, Department of Plant, Soil and Microbial Sciences
United States of America - Texas Tech University
United States of America – United States Department of Agriculture, Natural Resources Conservation
Service
Pacific region
Australia – Commonwealth Scientific and Industrial Research Organisation
Australia - University of New South Wales
Republic of Fiji - Department of Primary Industries Parks Water & Environment Tasmania
Republic of Fiji - Sugar Research Institute of Fiji
New Caledonia - IRD, Laboratoire des Moyens Analytiques US 191 IMAGO
Independent State of Samoa - SAFT Soil Science Laboratory, University of South Pacific
IX
Acknowledgements
The authors would like to thank the respondents of the questionnaire for their time, their willingness to fill
in the survey, and the information provided. This enables GLOSOLAN and others to have a clear overview of
what is current and what is needed in the soil spectroscopy data domain, both in measurements and in data
storage and sharing.
The authors would also like to thank Rich Ferguson (USDA-NRCS-KSSL), Keith Shepherd (ICRAF/iSDA), Lucrezia
Caon (GSP Secretariat and GLOSOLAN coordinator), Yi Peng (GSP Secretariat and coordinator of the
GLOSOLAN initiative on soil spectroscopy), Jon Sanderman (Woodwell Climate Research Center), Yufeng Ge
(University of Nebraska), and Nuwan Wijewardane (University of Nebraska) for reflecting on and suggestions
for the questions and possible answers.
Lastly the authors would like to thank Carla Green Adams (USDA-NSSC) for carefully editing the document.
X
Abbreviations and acronyms
FAO: Food and Agriculture Organisation of the United Nations
GLOSIS: Global Soil Information System
GLOSOLAN: Global Soil Laboratory Network
GSP: Global Soil Partnership
ICRAF: International Centre for Research in Agroforestry
ISO: International Organization for Standardization
ISRIC: International Soil Reference and Information Centre – World Soil Information
MIR: mid-infrared
NENA: Near East and North Africa
NIR: near infrared
PXRF: portable x-ray fluorescence
RESOLAN: Regional Soil Laboratory Network
SOP: standard operating procedure
SWIR: short-wave infrared
USDA: United States Department of Agriculture
VNIR: visible and near infrared
WG: working group
XI
Key messages and outlook
The key messages emerging from an analysis of the results of this questionnaire (reported in Annex I) are
that:
- The vast majority of participants to this survey want to start or improve measurement of soil
properties using diffuse reflectance soil spectroscopy methods.
- Laboratories expect support on starting soil spectral measurements and on improvement of their
current soil spectral measurements from GLOSOLAN and the RESOLANs, and they want to join the
initiative.
- Laboratories measure VNIR and MIR ranges for diffuse reflectance soil spectroscopy; efforts should
therefore focus on both.
- Most-used brands are Bruker and Agilent for MIR, and ASD and FOSS for VNIR.
- There is a clear demand for:
o improvement of the quality of measurements and spectral modelling;
o a standardized soil spectral calibration library;
o harmonization of methods;
o training and tools;
o soil spectral data sharing; and
o a community effort on all of this, led by GLOSOLAN.
- Sharing and using shared soil spectroscopy data is welcomed by most, although the ability to do so
is not always present.
- Integration of soil spectral data in GLOSIS is welcomed by the vast majority of respondents.
- Soil spectral data sharing is preferred as both flat files and proprietary formats, through a web
portal that allows querying of the data and/or makes data downloadable as zip files.
- Efforts should be prioritized within each region as current status and requirements vary.
- Respondents indicated their willingness to help, which supports the aim to continue building a
community of practices on soil spectroscopy.
These key messages summarise the priorities for the work plan of GLOSOLAN and advise cooperation with
GLOSIS.

XII
1
1. Introduction
This survey was conducted by the Global Soil Laboratory Network (GLOSOLAN) of the Global Soil Partnership, FAO. GLOSOLAN was established in November 2017 with the purpose of building and strengthening the capacity of laboratories in soil analysis and to respond to the necessity for harmonizing soil analytical data. In April 2020, GLOSOLAN launched its initiative on soil spectroscopy1 (additional information available here), an alternative to the use of wet chemistry for soil analysis. With the support of its partners, GLOSOLAN aims to build a globally-representative calibrated soil spectral calibration library (database) based on MIR spectra with accompanying accurate soil property reference data. The library will be paired with a freely available and easy-to-use soil property estimation service based on the evolving GLOSOLAN global MIR spectral calibration library. GLOSOLAN initiative on soil spectroscopy will focus on country capacity building and will support countries to contribute to both soil spectral calibration library and the soil property estimation service, by organizing training sessions, developing standards and protocols.
The GLOSOLAN work plan on soil spectroscopy was defined at the first plenary meeting on soil spectroscopy2, which was organized on the online platform Zoom in September 2020. In order to support the discussion and set priorities for activities, all soil laboratories registered in GLOSOLAN and members of the IUSS Pedometrics WG email list were asked to complete an online survey on their capacities and needs for the use of soil spectroscopy. The survey was open from November 2019 to July 2020. The survey results are herewith reported and discussed.
1.1. Participation in the survey
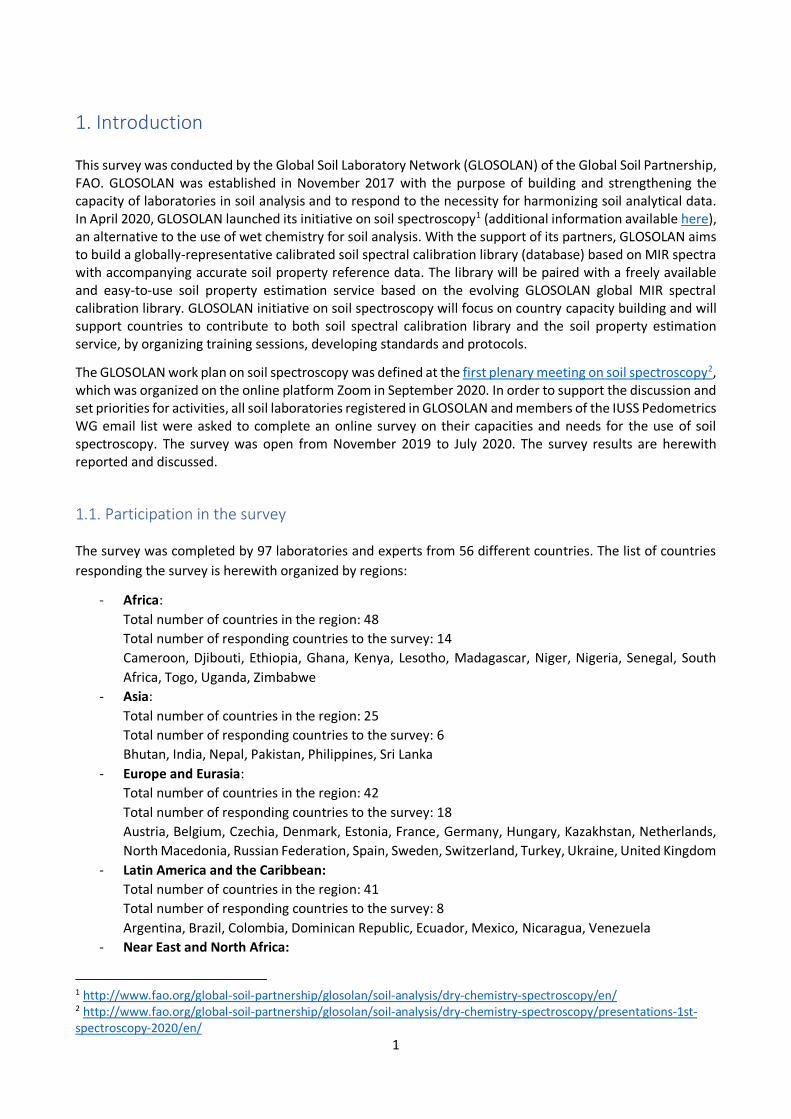
The survey was completed by 97 laboratories and experts from 56 different countries. The list of countries
responding the survey is herewith organized by regions:
- Africa:
Total number of countries in the region: 48
Total number of responding countries to the survey: 14
Cameroon, Djibouti, Ethiopia, Ghana, Kenya, Lesotho, Madagascar, Niger, Nigeria, Senegal, South
Africa, Togo, Uganda, Zimbabwe
- Asia:
Total number of countries in the region: 25
Total number of responding countries to the survey: 6
Bhutan, India, Nepal, Pakistan, Philippines, Sri Lanka
- Europe and Eurasia:
Total number of countries in the region: 42
Total number of responding countries to the survey: 18
Austria, Belgium, Czechia, Denmark, Estonia, France, Germany, Hungary, Kazakhstan, Netherlands,
North Macedonia, Russian Federation, Spain, Sweden, Switzerland, Turkey, Ukraine, United Kingdom
- Latin America and the Caribbean:
Total number of countries in the region: 41
Total number of responding countries to the survey: 8
Argentina, Brazil, Colombia, Dominican Republic, Ecuador, Mexico, Nicaragua, Venezuela
- Near East and North Africa:
1 http://www.fao.org/global-soil-partnership/glosolan/soil-analysis/dry-chemistry-spectroscopy/en/ 2 http://www.fao.org/global-soil-partnership/glosolan/soil-analysis/dry-chemistry-spectroscopy/presentations-1st-spectroscopy-2020/en/
2
Total number of countries in the region: 19
Total number of responding countries to the survey: 4
Iran, Iraq, Jordan, Sudan
- North America:
Total number of countries in the region: 2
Total number of responding countries to the survey: 2
Canada, United States
- Pacific:
Total number of countries in the region: 18
Total number of responding countries to the survey: 4
Australia, Fiji, New Caledonia, Samoa
The European and Eurasian region provided the largest number of feedbacks (see figure 1).
Figure 1 – Participation in the survey by region, expressed as a percentage of the total amount of answers collected.
1.2. Structure of the survey
The survey was available in three languages (English, French, and Spanish) and consisted of 36 questions,
organized in four sections (see Annex I).
Section 1: The Global Soil Information System (GLOSIS) and Soil Spectral Data
Value of organizing the information in a distributed infrastructure and possibility to use it: the
objective here was to retrieve opinions on how the soil spectra data should be organized (more
specifically about the option to incorporate it into the Global Soil Information System – GLOSIS).
24%
8%
36%
10%
4%
6%
12%
Africa Asia Europe and Eurasia
Latin America NENA North America
Pacific
3
Section 2: Laboratories and Procedures
Number of soil samples analysed every year: the objective here was to learn the analytical capacity
of laboratories.
Soil properties analysed: this question enquired what soil parameters are most commonly analysed
by laboratories, as this can focus the efforts for spectral models and proficiency tests.
Measurement of soil spectral properties: to assess how many laboratories do measure spectral
properties of soil samples in their performances, how many do not, and how many do not know
about spectral properties.
Interest in measuring soil spectral properties: this question surveyed the interest of laboratories in
adopting this technique, according to the national context.
Drawbacks on the use of soil spectroscopy: the main challenges in measuring spectral properties of
soil samples were enquired.
Possible assets in the perspective of adopting soil spectroscopy measurements: the objective here
was to learn about what might help laboratories to start such measurements.
Expected support from GLOSOLAN and RESOLAN: this question was asked to learn what are the
expectations from laboratories about the support that the global and regional soil laboratory
networks may provide so the networks can prioritize activities to what is considered necessary.
Potential clients in the country: the objective here was to get information on the presence of
potential users that ask for spectrally-derived soil data, and what the objectives are of such clients.
This can indicate the potential for a viable business model.
Instruments used: This question was asked to get information on which are the most used
instruments (type and brand) to measure spectral properties of soil. Since GLOSOLAN is working on
standard operating procedures for soil spectral measurements and on supporting soil laboratories in
equipment purchasing, such information might be used to prioritize the SOP development and to
guide the personnel towards the choice of instruments that are more widely used (whose
manufacturer may then provide a wider and better assistance).
Spectral region analysed: the question aimed to collect information on the spectral region most
commonly measured by laboratories to prioritize the WG work.
Laboratory procedure followed: this question aimed to get information on the use of more common
or lab-specific SOPs by laboratories use for spectral measurements to inform the harmonization of
SOPs.
Main difficulties experienced in the measurement: this was asked to collect information on the main
challenges faced by laboratories in the process of performing spectral measurements. This helps to
define priorities and work plan activities.
Main difficulties experienced in the data processing: this was asked to collect information on the
main challenges faced by laboratories in the process of processing the data and supplying the
spectrally-derived soil data.
Potential support from GLOSOLAN: the information provided by laboratories will help GLOSOLAN to
prioritize the work in the WG (especially in terms of trainings).
Adoption of a Laboratory Information Management System (LIMS): this question aimed to get
information on the development and application of LIMS by laboratories to organize and manage
their data.
Potential support from RESOLAN: the information provided by laboratories might suggest how to
downscale the GLOSOLAN work plan on spectroscopy, allowing the Regional Soil Laboratory
Networks to implement activities locally.
Additional inputs: laboratories were invited to provide extra points of discussion on the topic of
spectral measurement, in addition to those covered by the previous questions.
4
Section 3: Spectral Data Provisioning
Spectra data sharing — willingness: this question was asked to assess if it is worthwhile to start
working on developing a platform (library) where laboratories can share their spectral data.
Spectra data sharing — capability: this question was asked to get information on the actual
capabilities of laboratories to share their own spectral data (e.g., if it is allowed by their
institutions/countries or if the infrastructure is present).
Data provisioning — access: the question aims to collect the preferences of laboratories on how the
data should be provisioned (query-based web portal, web service, downloading in .zip format, other).
Data provisioning — format: the question aimed to collect the preferences of laboratories regarding
the format in which the data should be provisioned (flat table, instrument-generated file types,
database, etc.)
Organization of flat tables: this question enquired whether measured data, metadata, and spectral
data should be organized in the same flat table or separately.
Modelling software: this was asked to collect information on what type of software is used for data
modelling to prioritize work on those if required.
Soil properties provisioned: the question aimed to collect all soil characteristics that laboratories are
most interested in; for instance, to inform future proficiency testing and spectral modelling.
Need of provision resampled: the information provided by laboratories will help GLOSOLAN/GLOSIS
to focus the way in which MIR ad VNIR data should be provided and subsequent tools.
Current spectral data provision: this question was asked to gain information on how spectral data
are provided by those laboratories that already do it. This can give an overview of the current best
practices.
Section 4: Spectral Data Analysis
Preferences on data modelling: this question was asked to get information on the modality
laboratories prefer to model the data: in the cloud or locally.
Code and tools support: this question enquired whether laboratories might be interested to receive
technical support in terms of code and/or tools.
Platform suitability: the questions here regard any special request to make a platform more suitable
for usage by laboratories; for instance, visualisation.
Testing a beta web-based platform: laboratories were asked to express their willingness to
eventually test this type of platform.
Usefulness of a best practice manual: this was asked to know whether laboratories would see
benefits in using a best practice manual for spectral measurements and modelling, e.g., reporting
wavelength ranges and pre-processing and modelling methods, set-up of instrumentation, data
storage, quality assessment and control, hosting of data, etc.
Suggestions for handling calibration transfer: this question aimed to get possibly new ideas on how
to harmonize spectra that were measured using different instruments or different wavelength
resolutions to allow joint use for modelling.
Type of metadata: this question aimed to retrieve information on which metadata the laboratories
consider relevant to receive or provide together with soil spectral data.
Offering support: laboratories were asked if they might provide technical support to the project,
such as technical expertise, tools, or datasets.
Interest in joining the work: Participants were asked about their interest in joining the efforts of the
GLOSOLAN Working Group on Soil Spectroscopy, under the framework of the Global Soil Partnership.
5
2. Results and discussions
Results are presented and discussed as per the four thematic sections previously identified (section 0).
2.1. The Global Soil Information System (GLOSIS) and soil spectral data
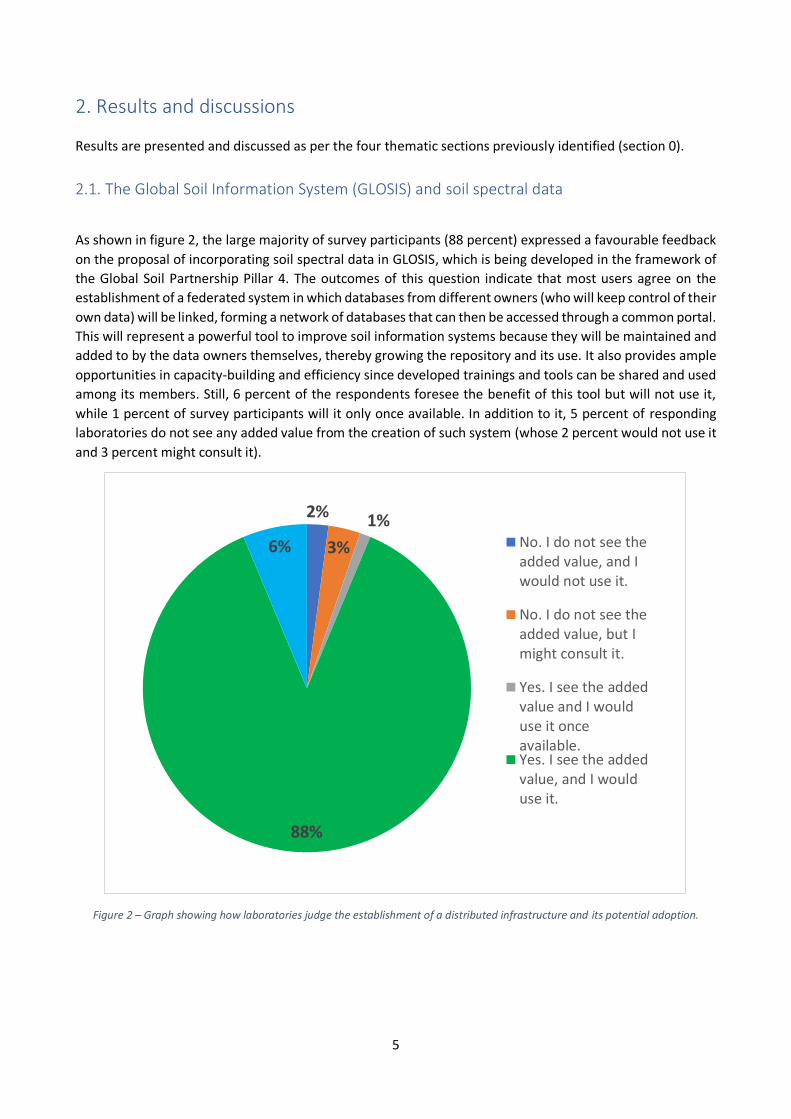
As shown in figure 2, the large majority of survey participants (88 percent) expressed a favourable feedback
on the proposal of incorporating soil spectral data in GLOSIS, which is being developed in the framework of
the Global Soil Partnership Pillar 4. The outcomes of this question indicate that most users agree on the
establishment of a federated system in which databases from different owners (who will keep control of their
own data) will be linked, forming a network of databases that can then be accessed through a common portal.
This will represent a powerful tool to improve soil information systems because they will be maintained and
added to by the data owners themselves, thereby growing the repository and its use. It also provides ample
opportunities in capacity-building and efficiency since developed trainings and tools can be shared and used
among its members. Still, 6 percent of the respondents foresee the benefit of this tool but will not use it,
while 1 percent of survey participants will it only once available. In addition to it, 5 percent of responding
laboratories do not see any added value from the creation of such system (whose 2 percent would not use it
and 3 percent might consult it).
Figure 2 – Graph showing how laboratories judge the establishment of a distributed infrastructure and its potential adoption.
2%
3%
1%
88%
6% No. I do not see theadded value, and Iwould not use it.
No. I do not see theadded value, but Imight consult it.
Yes. I see the addedvalue and I woulduse it onceavailable.Yes. I see the addedvalue, and I woulduse it.
6
2.2. Laboratories and procedures
2.2.1. General
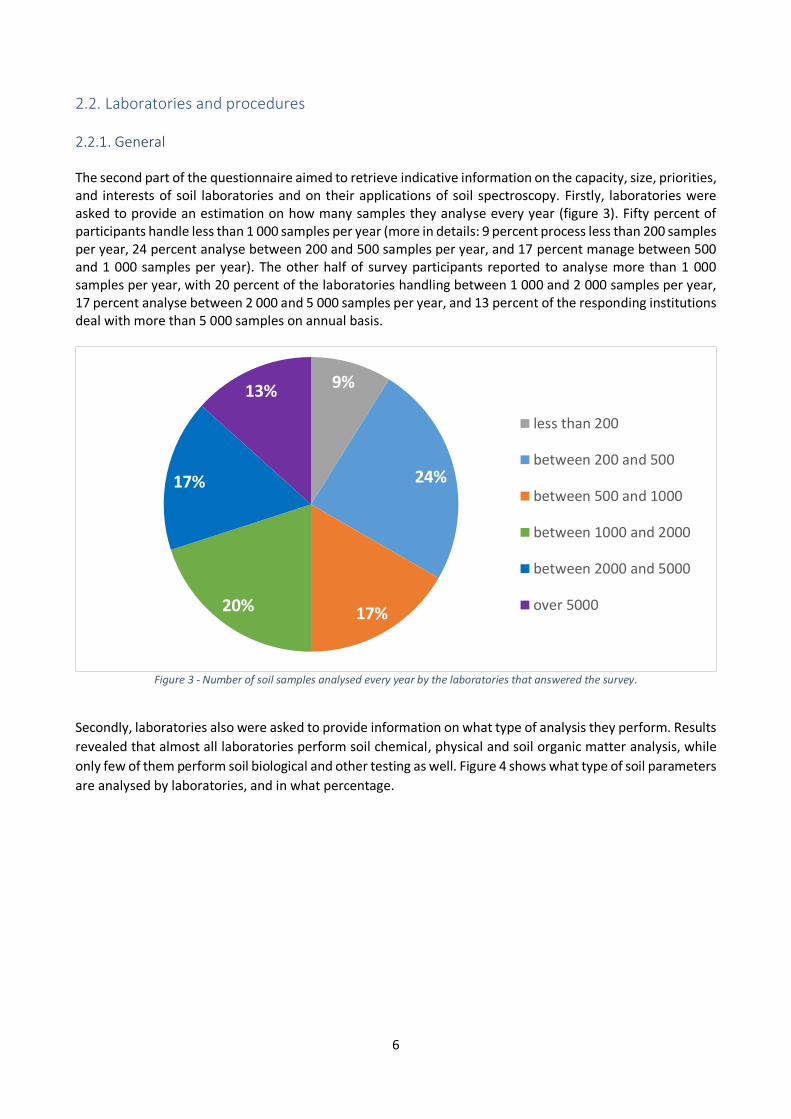
The second part of the questionnaire aimed to retrieve indicative information on the capacity, size, priorities, and interests of soil laboratories and on their applications of soil spectroscopy. Firstly, laboratories were asked to provide an estimation on how many samples they analyse every year (figure 3). Fifty percent of participants handle less than 1 000 samples per year (more in details: 9 percent process less than 200 samples per year, 24 percent analyse between 200 and 500 samples per year, and 17 percent manage between 500 and 1 000 samples per year). The other half of survey participants reported to analyse more than 1 000 samples per year, with 20 percent of the laboratories handling between 1 000 and 2 000 samples per year, 17 percent analyse between 2 000 and 5 000 samples per year, and 13 percent of the responding institutions deal with more than 5 000 samples on annual basis.
Figure 3 - Number of soil samples analysed every year by the laboratories that answered the survey.
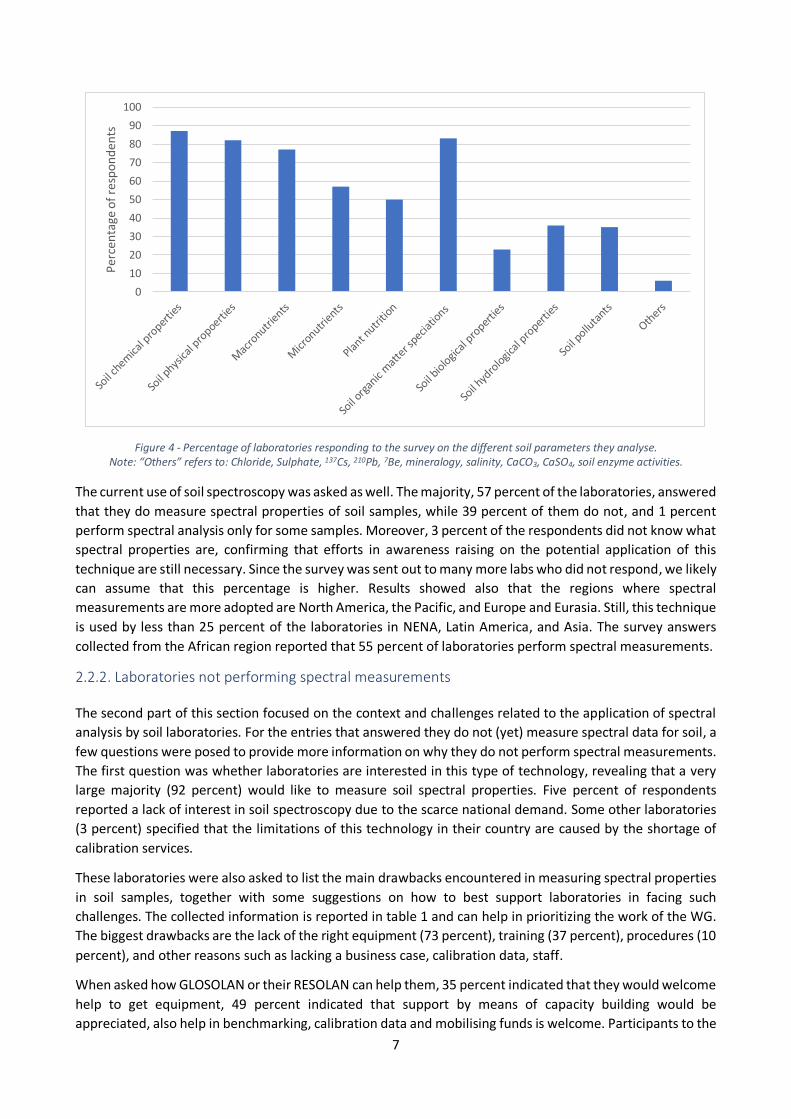
Secondly, laboratories also were asked to provide information on what type of analysis they perform. Results
revealed that almost all laboratories perform soil chemical, physical and soil organic matter analysis, while
only few of them perform soil biological and other testing as well. Figure 4 shows what type of soil parameters
are analysed by laboratories, and in what percentage.
9%
24%
17%20%
17%
13%
less than 200
between 200 and 500
between 500 and 1000
between 1000 and 2000
between 2000 and 5000
over 5000
7
Figure 4 - Percentage of laboratories responding to the survey on the different soil parameters they analyse. Note: “Others” refers to: Chloride, Sulphate, 137Cs, 210Pb, 7Be, mineralogy, salinity, CaCO3, CaSO4, soil enzyme activities.
The current use of soil spectroscopy was asked as well. The majority, 57 percent of the laboratories, answered
that they do measure spectral properties of soil samples, while 39 percent of them do not, and 1 percent
perform spectral analysis only for some samples. Moreover, 3 percent of the respondents did not know what
spectral properties are, confirming that efforts in awareness raising on the potential application of this
technique are still necessary. Since the survey was sent out to many more labs who did not respond, we likely
can assume that this percentage is higher. Results showed also that the regions where spectral
measurements are more adopted are North America, the Pacific, and Europe and Eurasia. Still, this technique
is used by less than 25 percent of the laboratories in NENA, Latin America, and Asia. The survey answers
collected from the African region reported that 55 percent of laboratories perform spectral measurements.
2.2.2. Laboratories not performing spectral measurements
The second part of this section focused on the context and challenges related to the application of spectral
analysis by soil laboratories. For the entries that answered they do not (yet) measure spectral data for soil, a
few questions were posed to provide more information on why they do not perform spectral measurements.
The first question was whether laboratories are interested in this type of technology, revealing that a very
large majority (92 percent) would like to measure soil spectral properties. Five percent of respondents
reported a lack of interest in soil spectroscopy due to the scarce national demand. Some other laboratories
(3 percent) specified that the limitations of this technology in their country are caused by the shortage of
calibration services.
These laboratories were also asked to list the main drawbacks encountered in measuring spectral properties
in soil samples, together with some suggestions on how to best support laboratories in facing such
challenges. The collected information is reported in table 1 and can help in prioritizing the work of the WG.
The biggest drawbacks are the lack of the right equipment (73 percent), training (37 percent), procedures (10
percent), and other reasons such as lacking a business case, calibration data, staff.
When asked how GLOSOLAN or their RESOLAN can help them, 35 percent indicated that they would welcome
help to get equipment, 49 percent indicated that support by means of capacity building would be
appreciated, also help in benchmarking, calibration data and mobilising funds is welcome. Participants to the
0
10
20
30
40
50
60
70
80
90
100P
erce
nta
ge o
f re
spo
nd
ents
8
survey specified that they expect GLOSOLAN and the RESOLANs to play an active role in implementing some
of the solutions that were listed (see table 3). Moreover, some highlighted the great potential of the GLOSIS
platform in linking databases in a global perspective.
Table 1 - Main challenges faced in starting to perform spectral measurements of soil samples, with inputs on potential solutions.
Main drawbacks (in order of importance) Potential solutions (organized according to the list of drawbacks)
Lack of equipment
Acquire sufficient technical knowledge
The need for procedures to follow
The need for a better calibration and a developed spectral calibration library
Maintenance of the instruments and availability of consumables
Low confidence on the accuracy of the data, compared with the conventional analysis
Shorten the measurement time
Sustain laboratories in purchasing the right equipment (also to include more spectral ranges)
Organization of trainings
Harmonize standard operating procedures
Development of an open-source spectral calibration library
Support in financial resources mobilization
Provide reference data and samples
In order to better understand the context in which soil laboratories decide to perform soil spectral
measurements or not, the main objectives of their clients were investigated. The recognized areas of interest
are listed here in order of number of responses:
Digital soil mapping
National soil survey
Soil health and soil quality
General farm management
Soil monitoring
Soil fertility advise
Carbon sequestration for climate mitigation
Soil pollution
2.2.3. Laboratories that perform spectral measurements on soil
For laboratories that already perform spectral measurements, the challenges and needs are likely to be
different than for labs that do not yet perform them. Their answers related to spectral measurements are
specified here.
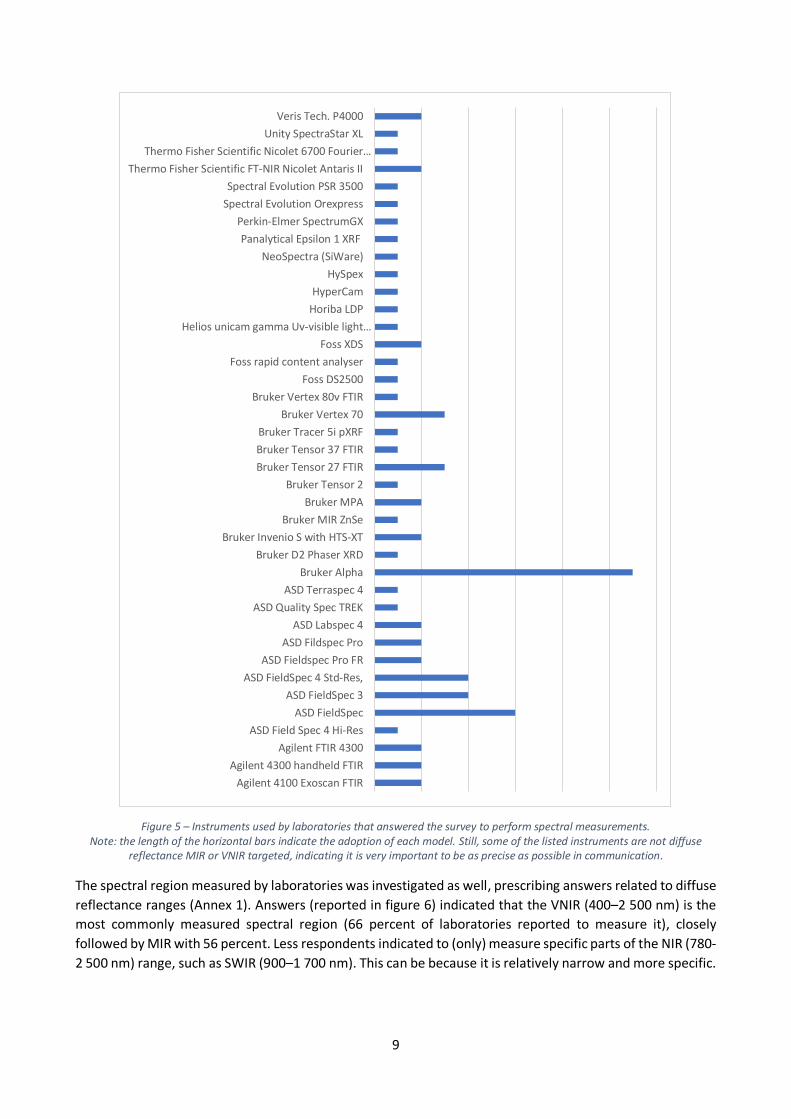
To better understand the current use of various available instruments and to help prioritize the development
of spectral measurement SOPs and trainings, it was asked what type of instrument is used for the spectral
measurements (in terms of both type and model). Information collected is reported in figure 5. Results show
that a wide range of Bruker systems are used for MIR measurements alongside some Agilent systems. ASD is
used a lot for VNIR measurements alongside some FOSS lab instruments. A range of field and other
instruments also are used by the laboratories, together with the worktop instruments or standalone.
9
Figure 5 – Instruments used by laboratories that answered the survey to perform spectral measurements. Note: the length of the horizontal bars indicate the adoption of each model. Still, some of the listed instruments are not diffuse
reflectance MIR or VNIR targeted, indicating it is very important to be as precise as possible in communication.
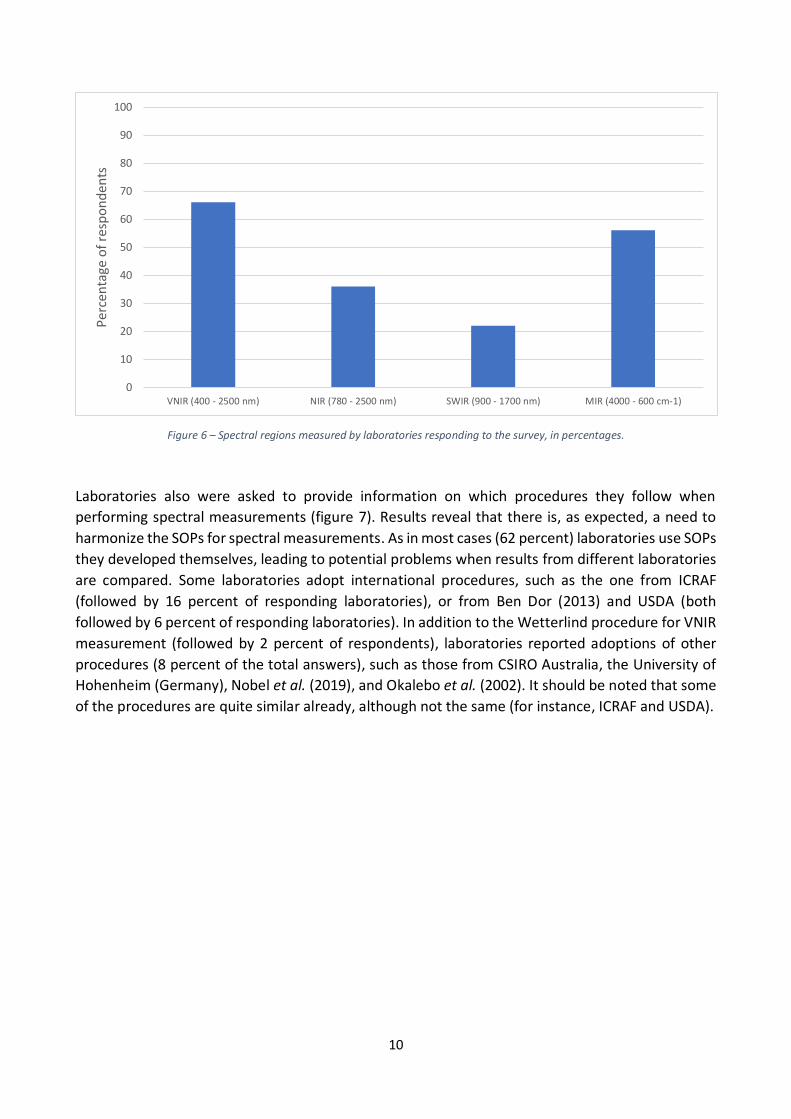
The spectral region measured by laboratories was investigated as well, prescribing answers related to diffuse
reflectance ranges (Annex 1). Answers (reported in figure 6) indicated that the VNIR (400–2 500 nm) is the
most commonly measured spectral region (66 percent of laboratories reported to measure it), closely
followed by MIR with 56 percent. Less respondents indicated to (only) measure specific parts of the NIR (780-
2 500 nm) range, such as SWIR (900–1 700 nm). This can be because it is relatively narrow and more specific.
Agilent 4100 Exoscan FTIR
Agilent 4300 handheld FTIR
Agilent FTIR 4300
ASD Field Spec 4 Hi-Res
ASD FieldSpec
ASD FieldSpec 3
ASD FieldSpec 4 Std-Res,
ASD Fieldspec Pro FR
ASD Fildspec Pro
ASD Labspec 4
ASD Quality Spec TREK
ASD Terraspec 4
Bruker Alpha
Bruker D2 Phaser XRD
Bruker Invenio S with HTS-XT
Bruker MIR ZnSe
Bruker MPA
Bruker Tensor 2
Bruker Tensor 27 FTIR
Bruker Tensor 37 FTIR
Bruker Tracer 5i pXRF
Bruker Vertex 70
Bruker Vertex 80v FTIR
Foss DS2500
Foss rapid content analyser
Foss XDS
Helios unicam gamma Uv-visible light…
Horiba LDP
HyperCam
HySpex
NeoSpectra (SiWare)
Panalytical Epsilon 1 XRF
Perkin-Elmer SpectrumGX
Spectral Evolution Orexpress
Spectral Evolution PSR 3500
Thermo Fisher Scientific FT-NIR Nicolet Antaris II
Thermo Fisher Scientific Nicolet 6700 Fourier…
Unity SpectraStar XL
Veris Tech. P4000
10
Figure 6 – Spectral regions measured by laboratories responding to the survey, in percentages.
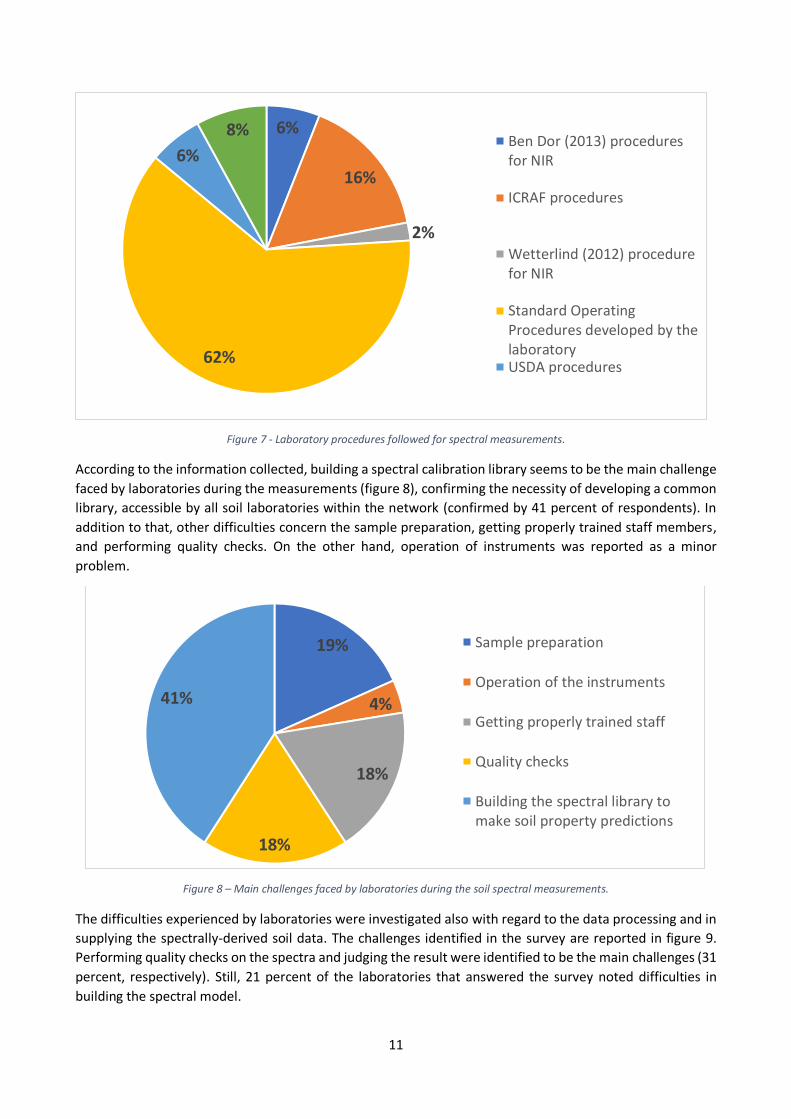
Laboratories also were asked to provide information on which procedures they follow when
performing spectral measurements (figure 7). Results reveal that there is, as expected, a need to
harmonize the SOPs for spectral measurements. As in most cases (62 percent) laboratories use SOPs
they developed themselves, leading to potential problems when results from different laboratories
are compared. Some laboratories adopt international procedures, such as the one from ICRAF
(followed by 16 percent of responding laboratories), or from Ben Dor (2013) and USDA (both
followed by 6 percent of responding laboratories). In addition to the Wetterlind procedure for VNIR
measurement (followed by 2 percent of respondents), laboratories reported adoptions of other
procedures (8 percent of the total answers), such as those from CSIRO Australia, the University of
Hohenheim (Germany), Nobel et al. (2019), and Okalebo et al. (2002). It should be noted that some
of the procedures are quite similar already, although not the same (for instance, ICRAF and USDA).
0
10
20
30
40
50
60
70
80
90
100
VNIR (400 - 2500 nm) NIR (780 - 2500 nm) SWIR (900 - 1700 nm) MIR (4000 - 600 cm-1)
Per
cen
tage
of
resp
on
den
ts
11
Figure 7 - Laboratory procedures followed for spectral measurements.
According to the information collected, building a spectral calibration library seems to be the main challenge
faced by laboratories during the measurements (figure 8), confirming the necessity of developing a common
library, accessible by all soil laboratories within the network (confirmed by 41 percent of respondents). In
addition to that, other difficulties concern the sample preparation, getting properly trained staff members,
and performing quality checks. On the other hand, operation of instruments was reported as a minor
problem.
Figure 8 – Main challenges faced by laboratories during the soil spectral measurements.
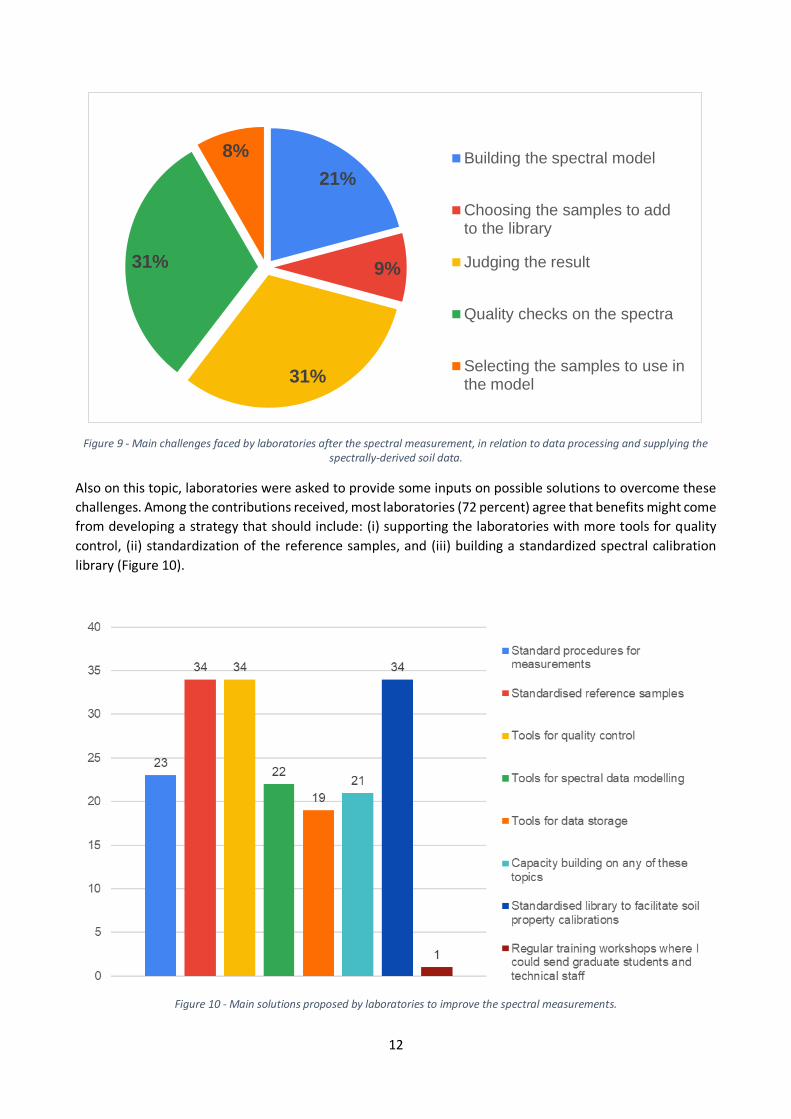
The difficulties experienced by laboratories were investigated also with regard to the data processing and in
supplying the spectrally-derived soil data. The challenges identified in the survey are reported in figure 9.
Performing quality checks on the spectra and judging the result were identified to be the main challenges (31
percent, respectively). Still, 21 percent of the laboratories that answered the survey noted difficulties in
building the spectral model.
6%
16%
2%
62%
6%
8%Ben Dor (2013) proceduresfor NIR
ICRAF procedures
Wetterlind (2012) procedurefor NIR
Standard OperatingProcedures developed by thelaboratoryUSDA procedures
19%
4%
18%
18%
41%
Sample preparation
Operation of the instruments
Getting properly trained staff
Quality checks
Building the spectral library tomake soil property predictions
12
Figure 9 - Main challenges faced by laboratories after the spectral measurement, in relation to data processing and supplying the spectrally-derived soil data.
Also on this topic, laboratories were asked to provide some inputs on possible solutions to overcome these
challenges. Among the contributions received, most laboratories (72 percent) agree that benefits might come
from developing a strategy that should include: (i) supporting the laboratories with more tools for quality
control, (ii) standardization of the reference samples, and (iii) building a standardized spectral calibration
library (Figure 10).
Figure 10 - Main solutions proposed by laboratories to improve the spectral measurements.
21%
9%
31%
31%
8% Building the spectral model
Choosing the samples to addto the library
Judging the result
Quality checks on the spectra
Selecting the samples to use inthe model
13
The topic of data management was investigated in more depth by asking laboratories whether they adopted
a Laboratory Information Management System (LIMS) to store the measured data. Results showed that more
than two-third of soil laboratories which answered the survey (72 percent) needed assistance and training to
develop their own LIMS, as they did not have one.
In order to develop an adequate work plan to properly support laboratories in dealing with these challenges,
participants to the survey were asked to provide their opinion on how GLOSOLAN can assist them. The
collected inputs are reported in table 2 and highlight the key role GLOSOLAN might play in improving the
spectral performance of laboratories.
Table 2 - Areas of interventions where GLOSOLAN might support the laboratories.
Areas of interventions Outcomes
Harmonize and promote SOPs on soil spectroscopy (including sample pre-treatment and instrument calibration)
Harmonized procedures for soil spectral measurement and analysis
Build a global spectral calibration library (easily accessible)
Support soil spectral information exchange and provide high quality spectral calibration datasets
Organize trainings and PTs Technical support and better laboratory performance
Facilitate benchmarking or easy calibration transfer by reference samples
Enhanced comparability of spectral data obtained with different equipment
Knowledge and experience sharing Community of Practice on soil spectroscopy
Provide tools and data, data storage, quality checks, LIMS
Easier and efficient workflows
Facilitate the application of models combining (VN)IR and PXRF elemental or other data (later on)
Further improve spectral predictions
Since the application of soil spectral measurement should rely on a market demand, the presence and type
of potential clients for spectrally-derived soil data in each country was investigated. The clients’ main areas
of interest are listed here in order of number of responses:
National soil survey
Digital soil mapping
Soil health and soil quality
Soil fertility advise
Soil monitoring
General farm management
Carbon sequestration for climate mitigation
Soil pollution
2.3. Spectral data provisioning
This part of the survey first focused on the willingness of soil laboratories to share spectral data (including
reference and metadata) and their actual capability to do that. A vast majority (91 percent) of the
respondents stated that they would like to share spectral data. However, only 70 percent of the respondents
are capable to share spectral and reference data and metadata. Impediments can be due to technical,
financial, or data policy aspects.
14
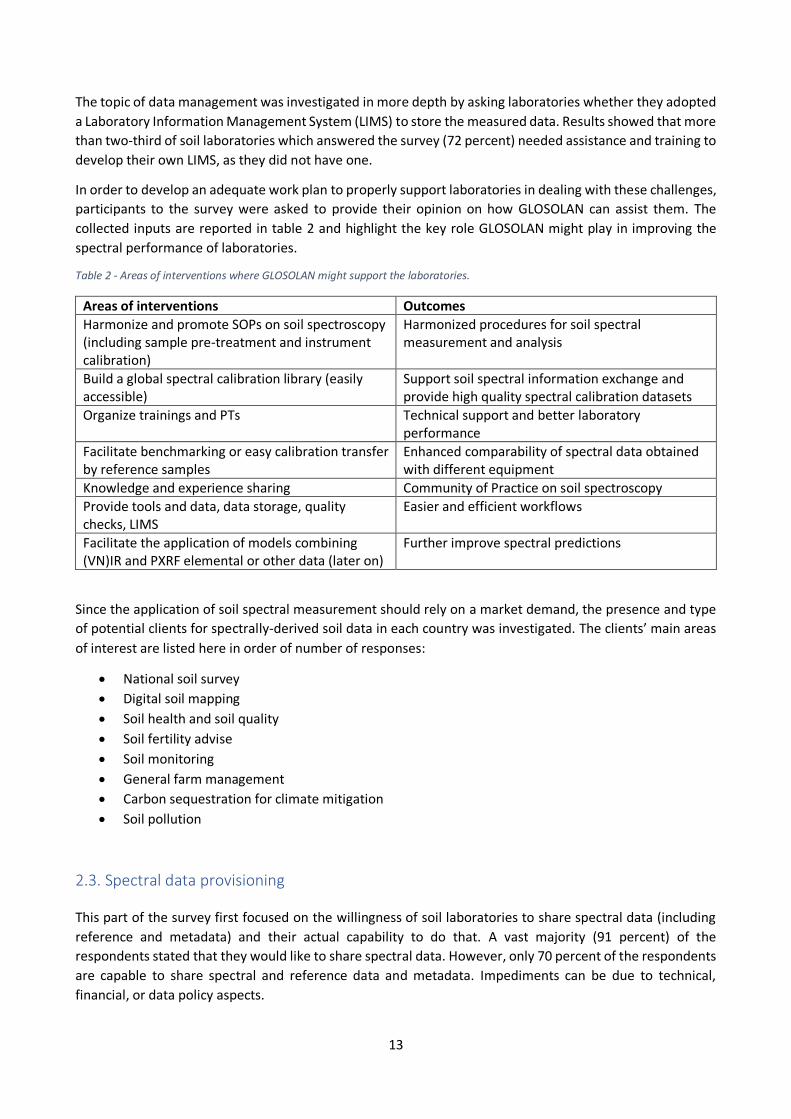
Figure 11 – In what way the data should be provisioned, according to the preferences of laboratories that joined the survey.
To guide the development process of spectral data provisioning services, respondents were asked their
preferred or most user-friendly access to data. As shown in figure 11, the majority of answers (55 percent)
proposed the use of a query-based web portal, possibly with tools for online processing. Others (25 percent)
preferred to download data in .zip format, while 15 percent of participants preferred to combine the two
ways by exploring the online portal with the possibility to download the data in .zip format. A few
contributors proposed to make data available in other ways, such as in JSON. In general, participants stressed
the importance of providing some type of control on who can download the data, and for what purposes.
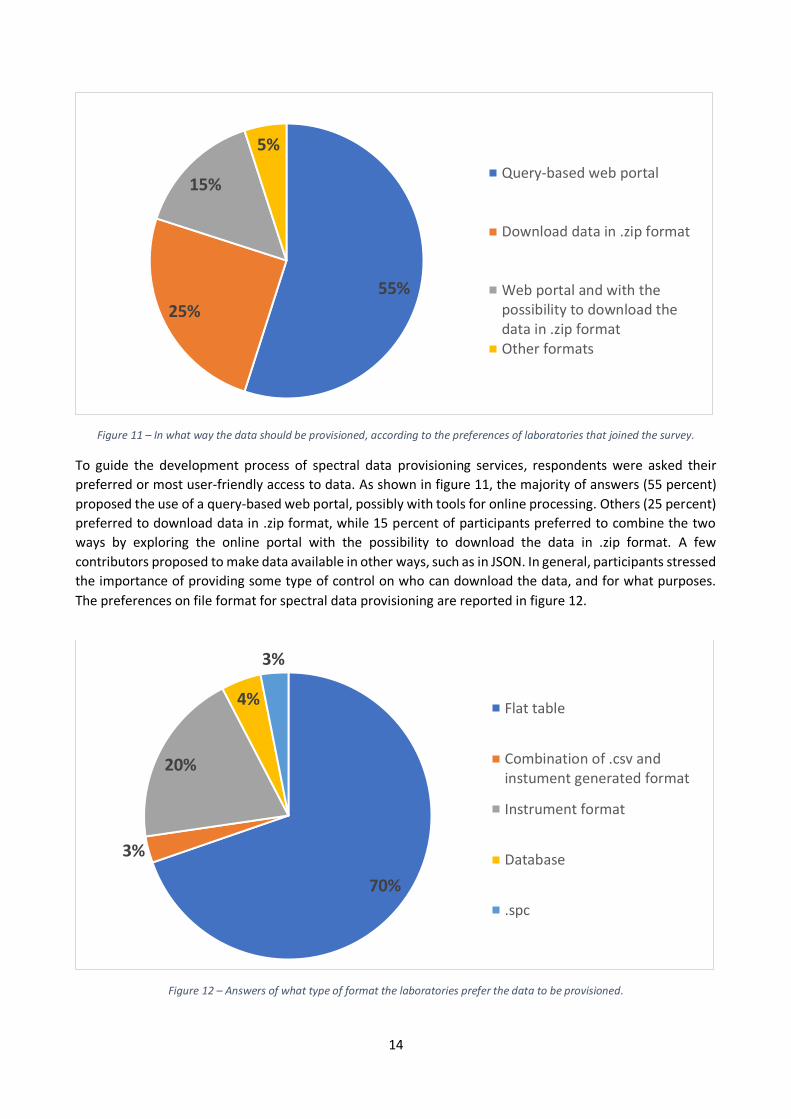
The preferences on file format for spectral data provisioning are reported in figure 12.
Figure 12 – Answers of what type of format the laboratories prefer the data to be provisioned.
55%25%
15%
5%
Query-based web portal
Download data in .zip format
Web portal and with thepossibility to download thedata in .zip formatOther formats
70%
3%
20%
4%
3%
Flat table
Combination of .csv andinstument generated format
Instrument format
Database
.spc
15
In this regard, 70 percent of laboratories reported to prefer provisioning data as a flat table (possibly in .csv
format), while 20 percent would prefer the format generated from the instrument. The remaining 10 percent
of participants opted for database, .spc files, or a combination of flat tables and instrument-generated data.
In case of flat tables, the survey revealed that laboratories have no preferences on reporting measured data,
metadata, and spectral data in the same table or in separated ones (48 against 52 percent).
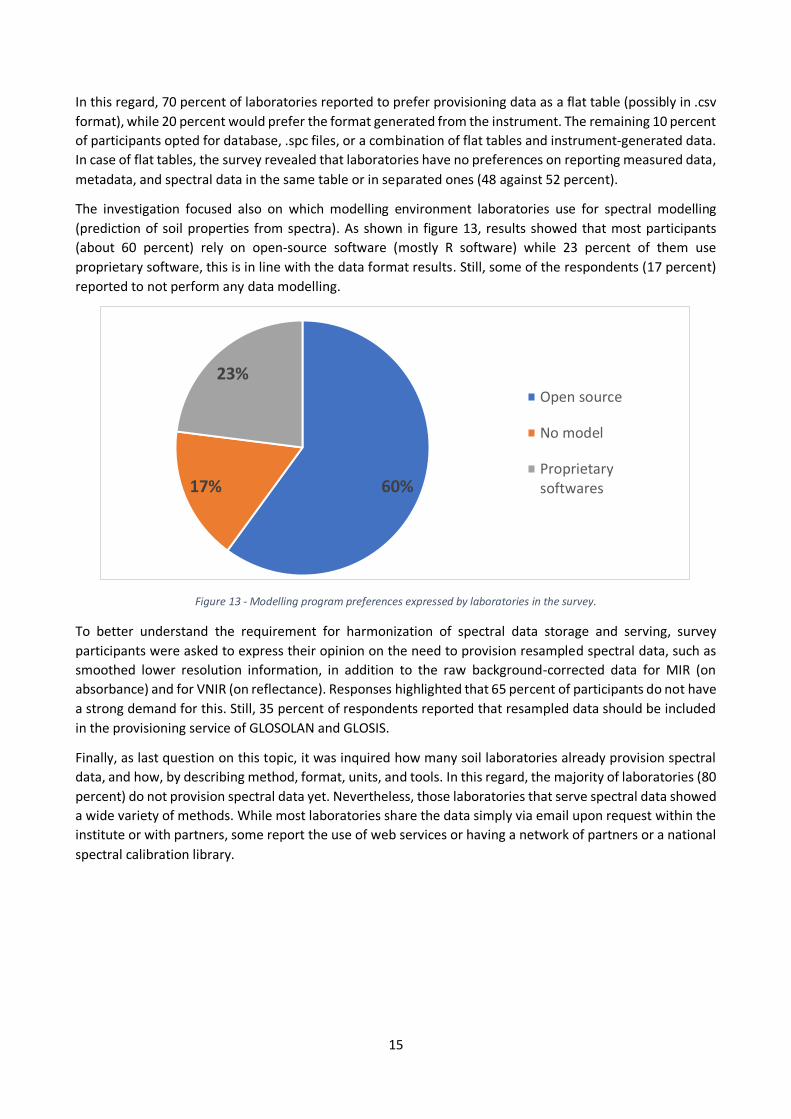
The investigation focused also on which modelling environment laboratories use for spectral modelling
(prediction of soil properties from spectra). As shown in figure 13, results showed that most participants
(about 60 percent) rely on open-source software (mostly R software) while 23 percent of them use
proprietary software, this is in line with the data format results. Still, some of the respondents (17 percent)
reported to not perform any data modelling.
Figure 13 - Modelling program preferences expressed by laboratories in the survey.
To better understand the requirement for harmonization of spectral data storage and serving, survey
participants were asked to express their opinion on the need to provision resampled spectral data, such as
smoothed lower resolution information, in addition to the raw background-corrected data for MIR (on
absorbance) and for VNIR (on reflectance). Responses highlighted that 65 percent of participants do not have
a strong demand for this. Still, 35 percent of respondents reported that resampled data should be included
in the provisioning service of GLOSOLAN and GLOSIS.
Finally, as last question on this topic, it was inquired how many soil laboratories already provision spectral
data, and how, by describing method, format, units, and tools. In this regard, the majority of laboratories (80
percent) do not provision spectral data yet. Nevertheless, those laboratories that serve spectral data showed
a wide variety of methods. While most laboratories share the data simply via email upon request within the
institute or with partners, some report the use of web services or having a network of partners or a national
spectral calibration library.
60%17%
23%Open source
No model
Proprietarysoftwares
16
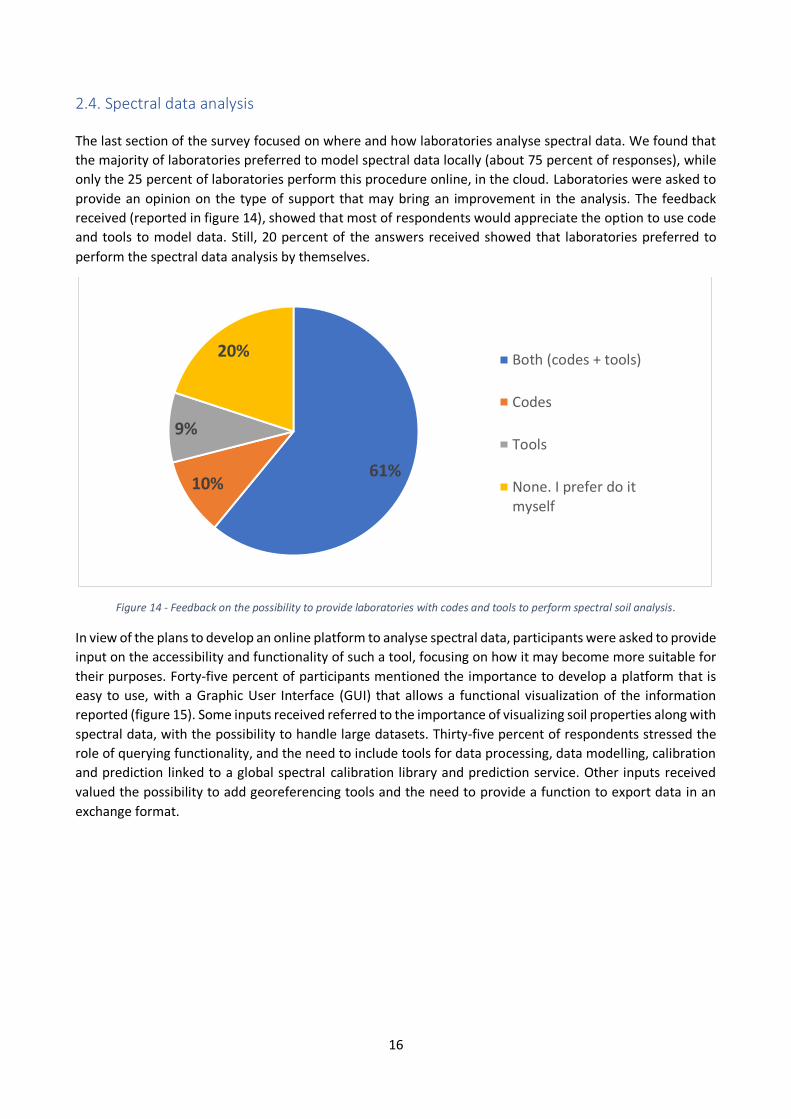
2.4. Spectral data analysis
The last section of the survey focused on where and how laboratories analyse spectral data. We found that
the majority of laboratories preferred to model spectral data locally (about 75 percent of responses), while
only the 25 percent of laboratories perform this procedure online, in the cloud. Laboratories were asked to
provide an opinion on the type of support that may bring an improvement in the analysis. The feedback
received (reported in figure 14), showed that most of respondents would appreciate the option to use code
and tools to model data. Still, 20 percent of the answers received showed that laboratories preferred to
perform the spectral data analysis by themselves.
Figure 14 - Feedback on the possibility to provide laboratories with codes and tools to perform spectral soil analysis.
In view of the plans to develop an online platform to analyse spectral data, participants were asked to provide
input on the accessibility and functionality of such a tool, focusing on how it may become more suitable for
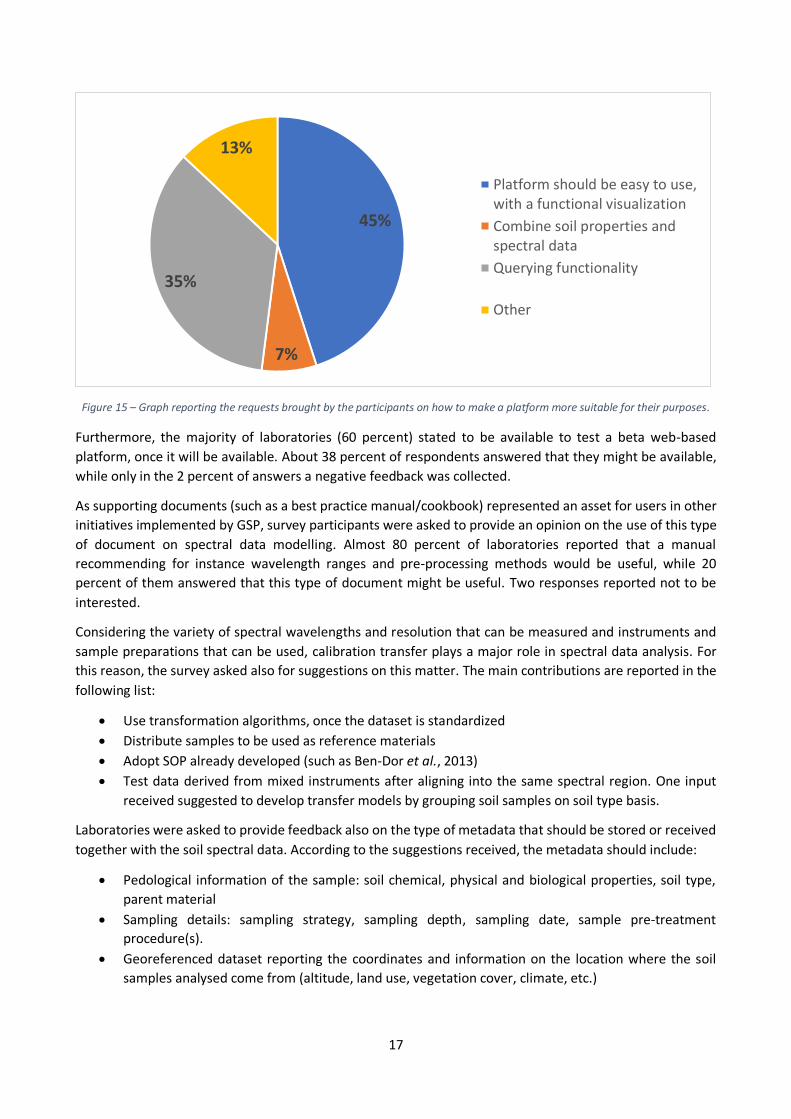
their purposes. Forty-five percent of participants mentioned the importance to develop a platform that is
easy to use, with a Graphic User Interface (GUI) that allows a functional visualization of the information
reported (figure 15). Some inputs received referred to the importance of visualizing soil properties along with
spectral data, with the possibility to handle large datasets. Thirty-five percent of respondents stressed the
role of querying functionality, and the need to include tools for data processing, data modelling, calibration
and prediction linked to a global spectral calibration library and prediction service. Other inputs received
valued the possibility to add georeferencing tools and the need to provide a function to export data in an
exchange format.
61%10%
9%
20% Both (codes + tools)
Codes
Tools
None. I prefer do itmyself
17
Figure 15 – Graph reporting the requests brought by the participants on how to make a platform more suitable for their purposes.
Furthermore, the majority of laboratories (60 percent) stated to be available to test a beta web-based
platform, once it will be available. About 38 percent of respondents answered that they might be available,
while only in the 2 percent of answers a negative feedback was collected.
As supporting documents (such as a best practice manual/cookbook) represented an asset for users in other
initiatives implemented by GSP, survey participants were asked to provide an opinion on the use of this type
of document on spectral data modelling. Almost 80 percent of laboratories reported that a manual
recommending for instance wavelength ranges and pre-processing methods would be useful, while 20
percent of them answered that this type of document might be useful. Two responses reported not to be
interested.
Considering the variety of spectral wavelengths and resolution that can be measured and instruments and
sample preparations that can be used, calibration transfer plays a major role in spectral data analysis. For
this reason, the survey asked also for suggestions on this matter. The main contributions are reported in the
following list:
Use transformation algorithms, once the dataset is standardized
Distribute samples to be used as reference materials
Adopt SOP already developed (such as Ben-Dor et al., 2013)
Test data derived from mixed instruments after aligning into the same spectral region. One input
received suggested to develop transfer models by grouping soil samples on soil type basis.
Laboratories were asked to provide feedback also on the type of metadata that should be stored or received
together with the soil spectral data. According to the suggestions received, the metadata should include:
Pedological information of the sample: soil chemical, physical and biological properties, soil type,
parent material
Sampling details: sampling strategy, sampling depth, sampling date, sample pre-treatment
procedure(s).
Georeferenced dataset reporting the coordinates and information on the location where the soil
samples analysed come from (altitude, land use, vegetation cover, climate, etc.)
45%
7%
35%
13%
Platform should be easy to use,with a functional visualization
Combine soil properties andspectral data
Querying functionality
Other
18
Information on the instruments used: brand, model, device configuration, original resolution,
original range, scan date, software used to record the spectra, operator, instrument serial, gain (if
applicable), temperature (if applicable), device test results, etc.
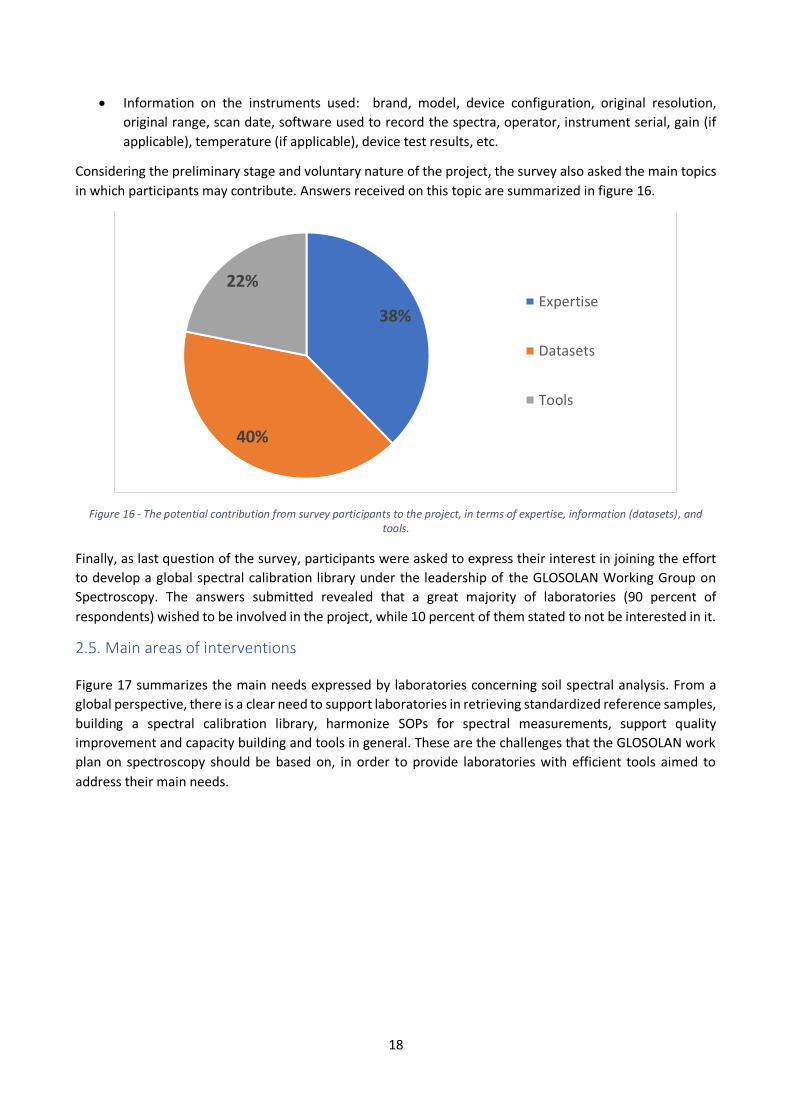
Considering the preliminary stage and voluntary nature of the project, the survey also asked the main topics
in which participants may contribute. Answers received on this topic are summarized in figure 16.
Figure 16 - The potential contribution from survey participants to the project, in terms of expertise, information (datasets), and tools.
Finally, as last question of the survey, participants were asked to express their interest in joining the effort
to develop a global spectral calibration library under the leadership of the GLOSOLAN Working Group on
Spectroscopy. The answers submitted revealed that a great majority of laboratories (90 percent of
respondents) wished to be involved in the project, while 10 percent of them stated to not be interested in it.
2.5. Main areas of interventions
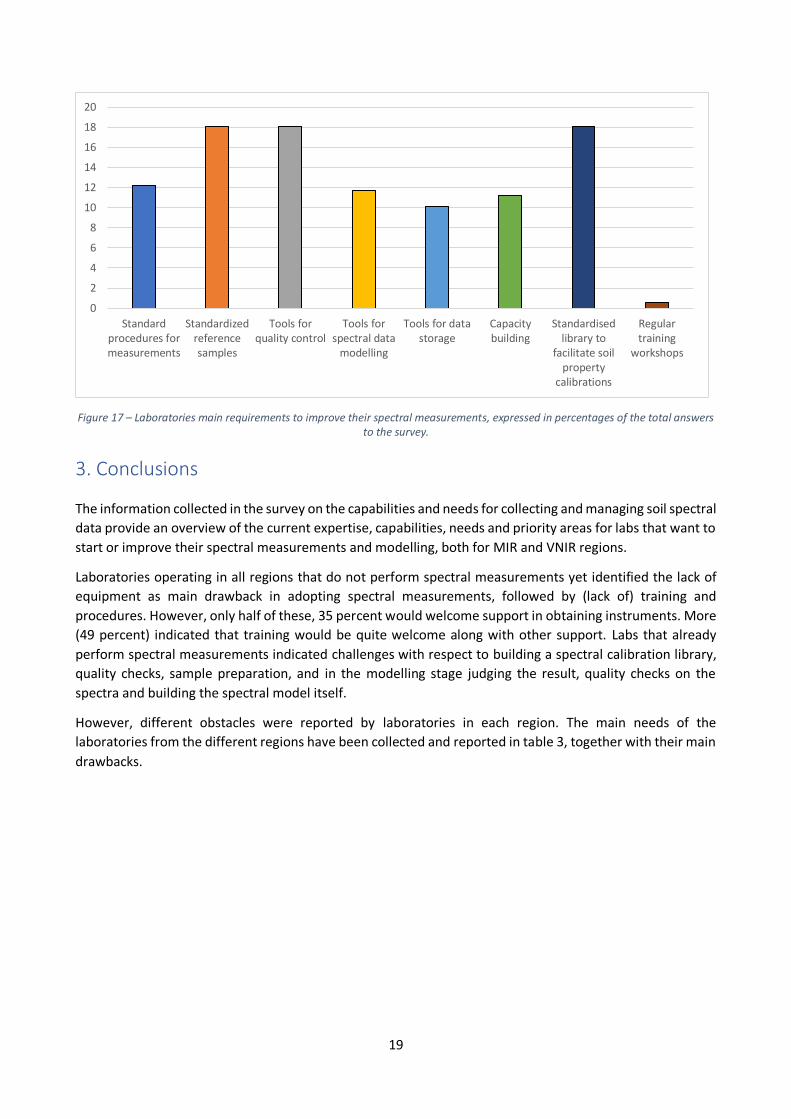
Figure 17 summarizes the main needs expressed by laboratories concerning soil spectral analysis. From a
global perspective, there is a clear need to support laboratories in retrieving standardized reference samples,
building a spectral calibration library, harmonize SOPs for spectral measurements, support quality
improvement and capacity building and tools in general. These are the challenges that the GLOSOLAN work
plan on spectroscopy should be based on, in order to provide laboratories with efficient tools aimed to
address their main needs.
38%
40%
22%Expertise
Datasets
Tools
19
Figure 17 – Laboratories main requirements to improve their spectral measurements, expressed in percentages of the total answers to the survey.
3. Conclusions
The information collected in the survey on the capabilities and needs for collecting and managing soil spectral
data provide an overview of the current expertise, capabilities, needs and priority areas for labs that want to
start or improve their spectral measurements and modelling, both for MIR and VNIR regions.
Laboratories operating in all regions that do not perform spectral measurements yet identified the lack of
equipment as main drawback in adopting spectral measurements, followed by (lack of) training and
procedures. However, only half of these, 35 percent would welcome support in obtaining instruments. More
(49 percent) indicated that training would be quite welcome along with other support. Labs that already
perform spectral measurements indicated challenges with respect to building a spectral calibration library,
quality checks, sample preparation, and in the modelling stage judging the result, quality checks on the
spectra and building the spectral model itself.
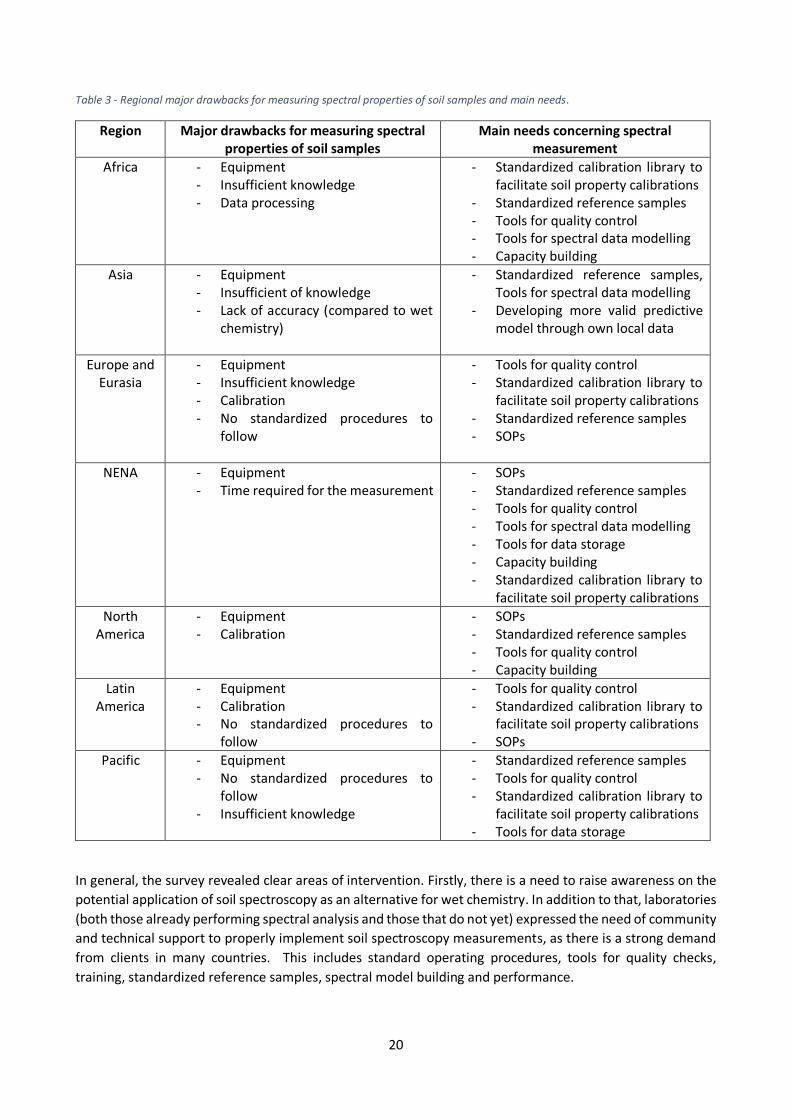
However, different obstacles were reported by laboratories in each region. The main needs of the
laboratories from the different regions have been collected and reported in table 3, together with their main
drawbacks.
0
2
4
6
8
10
12
14
16
18
20
Standardprocedures formeasurements
Standardizedreferencesamples
Tools forquality control
Tools forspectral data
modelling
Tools for datastorage
Capacitybuilding
Standardisedlibrary to
facilitate soilproperty
calibrations
Regulartraining
workshops
20
Table 3 - Regional major drawbacks for measuring spectral properties of soil samples and main needs.
Region Major drawbacks for measuring spectral properties of soil samples
Main needs concerning spectral measurement
Africa - Equipment - Insufficient knowledge - Data processing
- Standardized calibration library to facilitate soil property calibrations
- Standardized reference samples - Tools for quality control - Tools for spectral data modelling - Capacity building
Asia - Equipment - Insufficient of knowledge - Lack of accuracy (compared to wet
chemistry)
- Standardized reference samples, Tools for spectral data modelling
- Developing more valid predictive model through own local data
Europe and Eurasia
- Equipment - Insufficient knowledge - Calibration - No standardized procedures to
follow
- Tools for quality control - Standardized calibration library to
facilitate soil property calibrations - Standardized reference samples - SOPs
NENA - Equipment - Time required for the measurement
- SOPs - Standardized reference samples - Tools for quality control - Tools for spectral data modelling - Tools for data storage - Capacity building - Standardized calibration library to
facilitate soil property calibrations
North America
- Equipment - Calibration
- SOPs - Standardized reference samples - Tools for quality control - Capacity building
Latin America
- Equipment - Calibration - No standardized procedures to
follow
- Tools for quality control - Standardized calibration library to
facilitate soil property calibrations - SOPs
Pacific - Equipment - No standardized procedures to
follow - Insufficient knowledge
- Standardized reference samples - Tools for quality control - Standardized calibration library to
facilitate soil property calibrations - Tools for data storage
In general, the survey revealed clear areas of intervention. Firstly, there is a need to raise awareness on the
potential application of soil spectroscopy as an alternative for wet chemistry. In addition to that, laboratories
(both those already performing spectral analysis and those that do not yet) expressed the need of community
and technical support to properly implement soil spectroscopy measurements, as there is a strong demand
from clients in many countries. This includes standard operating procedures, tools for quality checks,
training, standardized reference samples, spectral model building and performance.
21
A successful soil spectroscopy set-up requires the implementation of an online (open source) spectral
calibration library and the establishment of a user-friendly web platform to allow for data provisioning and
processing, with the option to download and model data. A link with GLOSIS is strongly welcomed.
The efforts within the GLOSOLAN initiative on soil spectroscopy should aim to support laboratories in
improving or building their analytical performance on soil spectroscopy. Laboratories clearly expressed their
availability to join efforts and to contribute to this initiative under the guidance of both GLOSOLAN and
GLOSIS.
22
Annex I. Spectral soil data: needs and capacities questionnaire
Thank you for your willingness to fill in this questionnaire. It is intended to gather insight into the
needs and capacities of GLOSOLAN and the wider soil-sensing community.
With your contribution, we hope to:
1. Acquire an overview of the capacities, needs, and goals of soil laboratories worldwide with
respect to spectral soil data; and
2. Determine if serving spectral data in a more structured, cooperative, and coordinated way
would be useful for laboratories and other users. If so, we hope to understand how to address
the needs of potential users and suppliers of data.
The questionnaire consists of four parts:
Part 1. The Global Soil Information System (GLOSIS) and Soil Spectral Data
Part 2. Laboratories and Procedures
Part 3. Spectral Data Provisioning
Part 4. Spectral Data Analysis
Although we welcome you to fill in all of the questions, you can also choose to answer only parts.
Glossary:
- Spectrum/spectra: visible, near- and mid-infrared reflectance or absorbance spectra
- Spectral calibration library: dataset where soil samples have been measured with both
conventional and spectral laboratory methods
- Spectrally-derived soil data: soil property estimates derived from new spectral
measurements using a spectral calibration library and statistical, machine-learning data
models
- LIMS: Laboratory Information Management System (laboratory database software)
- Provisioning: sharing data with others, usually online
This survey takes less than 15 minutes to complete.
The Global Soil Partnership thanks you in advance for your precious time and contribution. If you
have any questions, please contact GLOSOLAN Coordinator Ms. Lucrezia Caon at
General information
The information gathered in this section will only be used within the context of this questionnaire.
It will allow us to more effectively design follow-up activities, such as targeted capacity building
and technical (product) development. It will be distributed only to the lead of the GLOSOLAN
Spectroscopy Working Group. It will not be used for any other purpose.
Name and last name______________
Email address______________
Laboratory/institution______________
Country______________
23
Part 1. The Global Soil Information System (GLOSIS) and Soil Spectral Data
We propose to incorporate soil spectral data in GLOSIS, the Global Soil Information System, which
is currently being built in Pillar 4 of the Global Soil Partnership. GLOSIS will be a federated system.
Data owners will keep their own database (and therefore control) but will be able to link to a
network of databases. The network will provide tools and training and thereby help improve the
data owner’s national, local, or lab soil information system. GLOSIS will adhere to GLOSOLAN results
and common lab practices for reference data. The system will facilitate quality control and a
standardized data structure that enables plug-ins for high quality spectral predictions and for
national reporting.
Do you see added value in a distributed infrastructure as described here, and would you use it
once available?
o Yes. I see the added value, and I would use it.
o Yes. I see the added value, but I would not use it.
o No. I do not see the added value, and I would not use it.
o No. I do not see the added value, but I might consult it.
Part 2a. Laboratories and Procedures
This section is meant for laboratories that operate wet chemistry, dry chemistry, or both.
How many soil samples do you process on average every year?
o less than 200
o between 200 and 500
o between 500 and 1 000
o between a 1 000 and 2 000
o between 2 000 and 5 000
o over 5 000
What soil properties are you (most) interested in at your lab? Check all that apply.
o Soil physical properties (clay, silt, sand, median grainsize, bulk density)
o Soil chemical properties (CEC, pH, EC, exchangeable bases, etc.)
o Macronutrients (N, P, K, etc.)
o Micronutrients (B, S, Zn, Cu, etc.)
o Plant nutrition (exchangeable nutrient fractions)
o Soil organic matter speciations (organic matter, organic carbon, total carbon, inorganic
carbon, etc.)
o Soil biological properties (bacteria and fungi quantity and speciation, nematodes, etc.)
o Soil hydrological properties (water retention, saturated hydraulic conductivity,
infiltration capacity, etc.)
o Soil pollutants (Pb, Zn, Cu, PAHs, organic substances, PFAS, etc.)
o Other:
Do you measure spectral properties of soil samples in your lab?
o Yes
o No
o I do not know what spectral properties are
24
Part 2b. Laboratories and Procedures
Would you like to measure spectral properties of soil samples in your lab?
o Yes.
o No. I do not trust this technology.
o No. There is not enough local and national interest in this type of measurements.
o No, because we do not have calibrations for my country.
o No: other.
What are your biggest drawbacks for measuring spectral properties of soil samples in your lab?
What would most help you to start these measurements?
How can GLOSOLAN or your Regional Soil Laboratory Network help you on this?
Do you have potential clients in your country for spectrally-derived soil data, and what are their
objectives? Check all that apply.
o Yes: general farm management
o Yes: soil fertility advise
o Yes: (national) soil survey
o Yes: digital soil mapping
o Yes: soil monitoring
o Yes: carbon sequestration for climate mitigation
o Yes: soil health/soil quality
o Yes: soil pollution
o Yes: other
o No
Part 2c. Laboratories and Procedures
Which instrument do you use to measure spectral properties of soil (brand and type)?
What spectral region do you measure? Check all that apply.
o VNIR (400 – 2 500 nm)
o NIR (780 – 2 500 nm)
o SWIR (900 – 1 700 nm)
o MIR (4 000 - 600 cm-1)
o Other
Which lab procedures do you currently follow for spectral measurements?
o ICRAF procedures
o USDA procedures
o Wetterlind (2012) procedure for NIR
o Ben Dor (2013) procedures for NIR
o Standard Operating Procedures developed by my own lab
o Other
What are the main difficulties that you experience in performing these measurements?
o Sample preparation
o Operation of the instruments
o Getting properly trained staff
o Quality checks
o Building the spectral library to make soil property predictions
25
o Other
What are the main difficulties that you experience in processing the data and supplying the
spectral derived soil data?
o Quality checks on the spectra
o Choosing the samples to add to the library
o Selecting the samples to use in the model
o Building the spectral model
o Judging the result
What would most help you to improve these measurements? Check all that apply.
o Standard procedures for measurements
o Standardised reference samples
o Tools for quality control
o Tools for spectral data modelling
o Tools for data storage
o Capacity building on any of these topics
o Standardised library to facilitate soil property calibrations
o Other
Do you have a LIMS (Laboratory Information Management System)?
o Yes
o No
How can GLOSOLAN or your local Regional Soil Laboratory Network help you?
Do you have potential clients in your country for spectral derived soil data, and what is their
objective? Check all that apply.
o Yes: general farm management
o Yes: soil fertility advice
o Yes: (national) soil survey
o Yes: soil monitoring
o Yes: carbon sequestration for climate mitigation
o Yes: soil health/soil quality
o Yes: soil pollution
o Yes: other
o No
Is there anything else regarding measuring spectra in the lab that is not addressed yet and
you would like to share with us?
Part 3. Spectral Data Provisioning
Would you like to share spectral data, including reference and metadata?
o Yes
o No
Can you share spectral data, including reference and metadata?
o Yes
o No
26
In what way would you like the data to be provisioned? For example, by a query-based web
portal or a webservice (OGC wfs, website); by downloading in zip format; or other (please
specify)?
In which format(s) would you like spectral data to be provisioned? For example, flat table (csv,
ASCII, RData), instrument-generated file types (OPUS, etc.), *.spc files, database, etc.
For flat tables, would you prefer reference (measured) data, metadata, and spectral data to be
provisioned in separate tables or in one single table?
o Separate tables
o One single table
o Other:
Do you model in open source (R, etc.) or in proprietary software? Which modelling program(s)
do you use?
What soil properties/characteristics are of interest to you? Please provide an exhaustive list with
prioritization.
The current GLOSOLAN/GLOSIS plan is to serve raw background-corrected absorbance data for
MIR and raw background-corrected reflectance data for VNIR. Is there a strong need to provision
resampled (smoothed, lower resolution) data?
o Yes
o No
Are you currently providing spectral data? If so, how? Please describe method, format, units,
and tools. Please include a link if possible.
Part 4. Spectral Data Analysis
Do you prefer modelling in the cloud or locally?
o Cloud
o Locally
Would you appreciate code or tools to model the data?
o Code
o Tools
o Both
o I do it myself
What special requests do you have to make a platform more suitable for your purposes (for
example visualization, querying functionality, etc.)?
Are you willing to test a beta web-based platform when the time comes?
o Yes
o No
o Maybe
Do you think a “cookbook” type, best practices manual for modelling data would be useful? Such
a manual might, for example, recommend wavelength ranges and pre-processing methods.
o Yes
o No
o Maybe
Do you have suggestions for handling calibration transfer (between different optical
benches/manufacturers)? Please describe.
27
What metadata would you want to store or receive with soil spectral data?
Do you have expertise, tools, or datasets that could be useful for this project? Check all that
apply.
o Expertise
o Datasets
o Tools
Do you want to join this effort led by the Global Soil Partnership and in particular the GLOSOLAN
Spectroscopy Working Group?
o Yes, please
o No, thanks
Thanks for taking this survey. Your contribution is very much appreciated!
GLOSOLANGLOBAL SOIL LABORATORY NETWORK
Global Soil Laboratory A
ssessment | 2020 Laboratories
The Global Soil Partnership (GSP) is a globally recognized mechanism established in 2012. Our mission is to position soils in the Global Agenda through collective action. Our key objectives are to promote Sustainable Soil Management (SSM) and improve soil governance to guarantee healthy and productive soils, and support the provision of essential ecosystem services towards food security and improved nutrition, climate change adaptation and mitigation, and sustaina-ble development.
GLOSOLAN is a Global Soil Laboratory Network which aims to harmonize soil analysis methods and data so that soil information is comparable and interpretable across laboratories, countries and regions. Established in 2017, it facilitates networking and capacity development through cooperation and information sharing between soil laboratories with di ffer-ent levels of experience. Joining GLOSOLAN is a unique opportunity to invest in quality soil laboratory data for a sustainable and food secure world.
Thanks to the financial support of
CB
6395
EN
/1/0
9.21