Embed Size (px)
Citation preview
Global surveillance of trends in cancer survival 2000-14 (CONCORD-3): analysis of individual records for 37 513 025 patients diagnosed with one of 18 cancers from 322 population-based registries in 71 countries. Allemani C, Matsuda T, Di Carlo V, Harewood R, Matz M, Nikšić M, Bonaventure A, Valkov M, Johnson CJ, Estève J, Ogunbiyi OJ, Azevedo E Silva G,
Chen WQ, Eser S, Engholm G, Stiller CA, Monnereau A, Woods RR, Visser O, Lim GH, Aitken J, Weir HK, Coleman MP; CONCORD Working Group
(Bouzbid S, Hamdi‐Chérif M, Zaidi Z, Meguenni K, Regagba D, Bayo S, Cheick Bougadari T, Manraj SS, Bendahhou K, Fabowale A, Bradshaw D,
Somdyala NIM, Kumcher I, Moreno F, Calabrano GH, Espinola SB, Carballo Quintero B, Fita R, Diumenjo MC, Laspada WD, Ibañez SG, Lima CA, De
Souza PCF, Del Pino K, Laporte C, Curado MP, de Oliveira JC, Veneziano CLA, Veneziano DB, Latorre MRDO, Tanaka LF, Rebelo MS, Santos MO, Galaz
JC, Aparicio Aravena M, Sanhueza Monsalve J, Herrmann DA, Vargas S, Herrera VM, Uribe CJ, Bravo LE, Garcia LS, Arias‐Ortiz NE, Morantes D, Jurado
DM, Yépez Chamorro MC, Delgado S, Ramirez M, Galán Alvarez YH, Torres P, Martínez‐Reyes F, Jaramillo L, Quinto R, Castillo J, Mendoza M, Cueva
P, Yépez JG, Bhakkan B, Deloumeaux J, Joachim C, Macni J, Carrillo R, Shalkow Klincovstein J, Rivera Gomez R, Poquioma E, Tortolero‐Luna G, Zavala
D, Alonso R, Barrios E, Eckstrand A, Nikiforuk C, Noonan G, Turner D, Kumar E, Zhang B, McCrate FR, Ryan S, MacIntyre M, Saint‐Jacques N, Nishri
DE, McClure CA, Vriends KA, Kozie S, Stuart‐Panko H, Freeman T, George JT, Brockhouse JT, O'Brien DK, Holt A, Almon L, Kwong S, Morris C, Rycroft
R, Mueller L, Phillips CE, Brown H, Cromartie B, Schwartz AG, Vigneau F, Levin GM, Wohler B, Bayakly R, Ward KC, Gomez SL, McKinley M, Cress R,
Green MD, Miyagi K, Ruppert LP, Lynch CF, Huang B, Tucker TC, Deapen D, Liu L, Hsieh MC, Wu XC, Schwenn M, Gershman ST, Knowlton RC,
Alverson G, Copeland GE, Bushhouse S, Rogers DB, Jackson‐Thompson J, Lemons D, Zimmerman HJ, Hood M, Roberts‐Johnson J, Rees JR, Riddle B,
Pawlish KS, Stroup A, Key C, Wiggins C, Kahn AR, Schymura MJ, Radhakrishnan S, Rao C, Giljahn LK, Slocumb RM, Espinoza RE, Khan F, Aird KG, Beran
T, Rubertone JJ, Slack SJ, Garcia L, Rousseau DL, Janes TA, Schwartz SM, Bolick SW, Hurley DM, Whiteside MA, Miller‐Gianturco P, Williams MA,
Herget K, Sweeney C, Johnson AT, Keitheri Cheteri MB, Migliore Santiago P, Blankenship SE, Farley S, Borchers R, Malicki R, Espinoza JR, Grandpre J,
Wilson R, Edwards BK, Mariotto A, Lei Y, Wang N, Chen JS, Zhou Y, He YT, Song GH, Gu XP, Mei D, Mu HJ, Ge HM, Wu TH, Li YY, Zhao DL, Jin F, Zhang
JH, Zhu FD, Junhua Q, Yang YL, Jiang CX, Biao W, Wang J, Li QL, Yi H, Zhou X, Dong J, Li W, Fu FX, Liu SZ, Chen JG, Zhu J, Li YH, Lu YQ, Fan M, Huang
SQ, Guo GP, Zhaolai H, Wei K, Zeng H, Demetriou AV, Mang WK, Ngan KC, Kataki AC, Krishnatreya M, Jayalekshmi PA, Sebastian P, Nandakumar A,
Malekzadeh R, Roshandel G, Keinan‐Boker L, Silverman BG, Ito H, Nakagawa H, Sato M, Tobori F, Nakata I, Teramoto N, Hattori M, Kaizaki Y, Moki F,
Sugiyama H, Utada M, Nishimura M, Yoshida K, Kurosawa K, Nemoto Y, Narimatsu H, Sakaguchi M, Kanemura S, Naito M, Narisawa R, Miyashiro I,
Nakata K, Sato S, Yoshii M, Oki I, Fukushima N, Shibata A, Iwasa K, Ono C, Nimri O, Jung KW, Won YJ, Alawadhi E, Elbasmi A, Ab Manan A, Adam F,
Sanjaajmats E, Tudev U, Ochir C, Al Khater AM, El Mistiri MM, Teo YY, Chiang CJ, Lee WC, Buasom R, Sangrajrang S, Kamsa‐Ard S, Wiangnon S,
Daoprasert K, Pongnikorn D, Leklob A, Sangkitipaiboon S, Geater SL, Sriplung H, Ceylan O, Kög I, Dirican O, Köse T, Gurbuz T, Karaşahin FE, Turhan D,
Aktaş U, Halat Y, Yakut CI, Altinisik M, Cavusoglu Y, Türkköylü A, Üçüncü N, Hackl M, Zborovskaya AA, Aleinikova OV, Henau K, Van Eycken L,
Valerianova Z, Yordanova MR, Šekerija M, Dušek L, Zvolský M, Storm H, Innos K, Mägi M, Malila N, Seppä K, Jégu J, Velten M, Cornet E, Troussard X,
Bouvier AM, Guizard AV, Bouvier V, Launoy G, Arveux P, Maynadié M, Mounier M, Woronoff AS, Daoulas M, Robaszkiewicz M, Clavel J, Goujon S,
Lacour B, Baldi I, Pouchieu C, Amadeo B, Coureau G, Orazio S, Preux PM, Rharbaoui F, Marrer E, Trétarre B, Colonna M, Delafosse P, Ligier K,
Plouvier S, Cowppli‐Bony A, Molinié F, Bara S, Ganry O, Lapôtre‐Ledoux B, Grosclaude P, Bossard N, Uhry Z, Bray F, Piñeros M, Stabenow R, Wilsdorf‐
Köhler H, Eberle A, Luttmann S, Löhden I, Nennecke AL, Kieschke J, Sirri E, Emrich K, Zeissig SR, Holleczek B, Eisemann N, Katalinic A, Asquez RA,
Kumar V, Petridou E, Ólafsdóttir EJ, Tryggvadóttir L, Clough‐Gorr K, Walsh PM, Sundseth H, Mazzoleni G, Vittadello F, Coviello E, Cuccaro F, Galasso
R, Sampietro G, Giacomin A, Magoni M, Ardizzone A, D'Argenzio A, Castaing M, Grosso G, Lavecchia AM, Sutera Sardo A, Gola G, Gatti L, Ricci P,
Ferretti S, Serraino D, Zucchetto A, Celesia MV, Filiberti RA, Pannozzo F, Melcarne A, Quarta F, Russo AG, Carrozzi G, Cirilli C, Cavalieri d'Oro L,
Rognoni M, Fusco M, Vitale MF, Usala M, Cusimano R, Mazzucco W, Michiara M, Sgargi P, Boschetti L, Borciani E, Seghini P, Maule MM, Merletti F,
Tumino R, Mancuso P, Vicentini M, Cassetti T, Sassatelli R, Falcini F, Giorgetti S, Caiazzo AL, Cavallo R, Cesaraccio R, Pirino DR, Contrino ML, Tisano F,
Fanetti AC, Maspero S, Carone S, Mincuzzi A, Candela G, Scuderi T, Gentilini MA, Piffer S, Rosso S, Barchielli A, Caldarella A, Bianconi F, Stracci F,
Contiero P, Tagliabue G, Rugge M, Zorzi M, Beggiato S, Brustolin A, Berrino F, Gatta G, Sant M, Buzzoni C, Mangone L, Capocaccia R, De Angelis R,
Zanetti R, Maurina A, Pildava S, Lipunova N, Vincerževskiené I, Agius D, Calleja N, Siesling S, Larønningen S, Møller B, Dyzmann‐Sroka A, Trojanowski
M, Góźdź S, Mężyk R, Mierzwa T, Molong L, Rachtan J, Szewczyk S, Błaszczyk J, Kępska K, Kościańska B, Tarocińska K, Zwierko M, Drosik K,
Maksimowicz KM, Purwin‐Porowska E, Reca E, Wójcik‐Tomaszewska J, Tukiendorf A, Grądalska‐Lampart M, Radziszewska AU, Gos A, Talerczyk M,
Wyborska M, Didkowska JA, Wojciechowska U, Bielska‐Lasota M, Forjaz de Lacerda G, Rego RA, Bastos J, Silva MA, Antunes L, Laranja Pontes J,
Mayer‐da‐Silva A, Miranda A, Blaga LM, Coza D, Gusenkova L, Lazarevich O, Prudnikova O, Vjushkov DM, Egorova AG, Orlov AE, Kudyakov LA,
Pikalova LV, Adamcik J, Safaei Diba C, Primic‐Žakelj M, Zadnik V, Larrañaga N, Lopez de Munain A, Herrera AA, Redondas R, Marcos‐Gragera R,
Vilardell Gil ML, Molina E, Sánchez Perez MJ, Franch Sureda P, Ramos Montserrat M, Chirlaque MD, Navarro C, Ardanaz EE, Guevara MM,
Fernández‐Delgado R, Peris‐Bonet R, Carulla M, Galceran J, Alberich C, Vicente‐Raneda M, Khan S, Pettersson D, Dickman P, Avelina I, Staehelin K,
Camey B, Bouchardy C, Schaffar R, Frick H, Herrmann C, Bulliard JL, Maspoli‐Conconi M, Kuehni CE, Redmond SM, Bordoni A, Ortelli L, Chiolero A,
Konzelmann I, Matthes KL, Rohrmann S, Broggio J, Rashbass J, Fitzpatrick D, Gavin A, Clark DI, Deas AJ, Huws DW, White C, Montel L, Rachet B,
Turculet AD, Stephens R, Chalker E, Phung H, Walton R, You H, Guthridge S, Johnson F, Gordon P, D'Onise K, Priest K, Stokes BC, Venn A, Farrugia H,
Thursfield V, Dowling J, Currow D, Hendrix J, Lewis C.)
brought to you by COREView metadata, citation and similar papers at core.ac.uk
provided by Institutional Research Information System University of Turin

aCancer Survival Group, Department of Non-Communicable Disease Epidemiology, London School of Hygiene & Tropical Medicine, London, UK bPopulation-based Cancer Registry Section, Division of Surveillance, Center for Cancer Control and Information Services, National Cancer Center, Tokyo, Japan cDepartment of Radiology, Radiotherapy and Oncology, Northern State Medical University, Arkhangelsk, Russia dCancer Data Registry of Idaho, Boise, ID, USA eDepartment of Biostatistics, Université Claude Bernard, Lyon, France fIbadan Cancer Registry, University City College Hospital, Ibadan, Dyo State, Nigeria gDepartment of Epidemiology, Universidade do Estado do Rio de Janeiro, Maracanã, Rio de Janeiro, Brazil hNational Office for Cancer Prevention and Control and National Central Cancer Registry, National Cancer Center, Beijing, China iDepartment of Public Health, Balıkesir University, Balıkesir, Turkey jDepartment of Documentation and Quality, Danish Cancer Society, Copenhagen, Denmark kNational Cancer Registration and Analysis Service, Public Health England, London, UK lRegistre des hémopathies malignes de la Gironde, Institut Bergonié, Bordeaux, France mFrench Network of Cancer Registries, Toulouse, France nBritish Columbia Cancer Registry, BC Cancer Agency, Vancouver, BC, Canada oNetherlands Cancer Registry Netherlands Comprehensive Cancer Organisation (IKNL), Utrecht, Netherlands pNational Registry of Diseases Office, Health Promotion Board, Singapore qCancer Council Queensland, Fortitude Valley, QLD, Australia rDivision of Cancer Prevention and Control, Centers for Disease Control and Prevention, Atlanta, GA, USA
Abstract
Background
In 2015, the second cycle of the CONCORD programme established global surveillance of cancer survival as a metric of the effectiveness of health systems and to inform global policy on cancer control. CONCORD-3 updates the worldwide surveillance of cancer survival to 2014.
Methods
CONCORD-3 includes individual records for 37·5 million patients diagnosed with cancer during the 15-year period 2000–14. Data were provided by 322 population-based cancer registries in 71 countries and territories, 47 of which provided data with 100% population coverage. The study includes 18 cancers or groups of cancers: oesophagus, stomach, colon, rectum, liver, pancreas, lung, breast (women), cervix, ovary, prostate, and melanoma of the skin in adults, and brain tumours, leukaemias, and lymphomas in both adults and children. Standardised quality control procedures were applied; errors were rectified by the registry concerned. We estimated 5-year net survival. Estimates were age-standardised with the International Cancer Survival Standard weights.
Findings
For most cancers, 5-year net survival remains among the highest in the world in the USA and Canada, in Australia and New Zealand, and in Finland, Iceland, Norway, and Sweden. For many cancers, Denmark is closing the survival gap with the other Nordic countries. Survival trends are generally increasing, even for some of the more lethal cancers: in some countries, survival has increased by up to 5% for cancers of the liver, pancreas, and lung. For women diagnosed during 2010–14, 5-year survival for breast cancer is now 89·5% in Australia and 90·2% in the USA, but international differences remain very wide, with levels as low as 66·1% in India. For gastrointestinal cancers, the highest levels of 5-year survival are seen in southeast Asia: in South Korea for cancers of the stomach (68·9%), colon (71·8%), and rectum (71·1%); in Japan for oesophageal cancer (36·0%); and in Taiwan for liver cancer (27·9%). By contrast, in the same world region, survival is generally lower than elsewhere for melanoma of the skin (59·9% in South Korea, 52·1% in Taiwan, and 49·6% in China), and for both lymphoid malignancies (52·5%, 50·5%, and 38·3%) and myeloid malignancies (45·9%, 33·4%, and 24·8%). For children diagnosed during 2010–14, 5-year survival for acute lymphoblastic leukaemia ranged from 49·8% in Ecuador to 95·2% in Finland. 5-year survival from brain tumours in children is higher than for adults but the global range is very wide (from 28·9% in Brazil to nearly 80% in Sweden and Denmark).

Interpretation
The CONCORD programme enables timely comparisons of the overall effectiveness of health systems in providing care for 18 cancers that collectively represent 75% of all cancers diagnosed worldwide every year. It contributes to the evidence base for global policy on cancer control. Since 2017, the Organisation for Economic Co-operation and Development has used findings from the CONCORD programme as the official benchmark of cancer survival, among their indicators of the quality of health care in 48 countries worldwide. Governments must recognise population-based cancer registries as key policy tools that can be used to evaluate both the impact of cancer prevention strategies and the effectiveness of health systems for all patients diagnosed with cancer.
Funding
American Cancer Society; Centers for Disease Control and Prevention; Swiss Re; Swiss Cancer Research foundation; Swiss Cancer League; Institut National du Cancer; La Ligue Contre le Cancer; Rossy Family Foundation; US National Cancer Institute; and the Susan G Komen Foundation.
Introduction
The incidence of cancer continues to rise, both in high-income countries and, especially, in low-income and middle-income countries. Prevention is crucial, but implementation has been slow and incomplete, even in high-income countries. Prevention is a long-term strategy, and not all cancers can be prevented.1 To reduce cancer mortality, reduction of cancer incidence and improvement of cancer survival are both necessary.
Many patients will continue to be diagnosed with cancer every year for decades to come: an estimated 14 million patients a year worldwide around 2012,2 with a 50% projected increase to 21·6 million patients a year by 2030.3 Those patients will all need prompt diagnosis and optimal treatment to improve their survival. Monitoring the effectiveness of national and regional health systems in treating and caring for these patients becomes ever more crucial.
Research in context
Evidence before this study
In 2015, the second cycle of the CONCORD programme (CONCORD-2) established global surveillance of cancer survival as one of the key metrics of the effectiveness of health systems and to inform global policy on cancer control. This was done by analysis of individual records for 25·7 million patients diagnosed with one of ten common cancers during 1995–2009 and followed up to Dec 31, 2009. The data were provided by 279 population-based cancer registries in 67 countries. CONCORD-2 revealed wide differences in cancer survival trends that were attributed to differences in access to early diagnosis and optimal treatment.
Added value of this study
CONCORD-3 covers almost 1 billion people worldwide. It includes 15 common cancers in adults and three common cancers in children. Data quality has improved. The results are timely, published within 3 years of the end of follow-up. CONCORD-3 updates the worldwide surveillance of cancer survival to 2014. It includes data for over 37·5 million patients diagnosed with cancer during the 15-year period 2000–14. Data were provided by more than 320 population-based cancer registries

in 71 countries and territories, including 27 countries of low or middle income; 47 countries provided data with 100% population coverage. The study now includes 18 cancers or groups of cancers: oesophagus, stomach, colon, rectum, liver, pancreas, lung, breast (women), cervix, ovary, prostate, and melanoma of the skin in adults, together with brain tumours, leukaemias, and lymphomas in both adults and children. These cancers represent 75% of all cancers diagnosed worldwide every year, in both low-income and high-income countries. The use of a similar study design and the same statistical methods as in CONCORD-2 enables the evaluation of survival trends for ten cancers over the 20-year period 1995–2014. For the first time, worldwide trends in survival are also available for cancers of the oesophagus, pancreas, and brain, and lymphomas and leukaemias.
Implications of all the available evidence
The CONCORD programme enables comparative evaluation of the effectiveness of health systems in providing cancer care. It also contributes to the evidence base for global policy on cancer control. CONCORD monitors progress towards the overarching goal of the 2013 World Cancer Declaration, to achieve “major reductions in premature deaths from cancer, and improvements in quality of life and cancer survival” by 2020. It provides evidence to support WHO policy following the Cancer Resolution passed by the World Health Assembly in 2017. The International Atomic Energy Agency's Programme for Action on Cancer Therapy used CONCORD-2 results in 2015 to launch its worldwide campaign to highlight the global divide in cancer survival, and to raise awareness of persistent inequalities in access to life-saving cancer services. The results were used in a Lancet Series on women's cancers in 2016. The US Centers for Disease Control and Prevention used the results in a 2017 supplement to the journal Cancer to inform cancer control policy designed to reduce racial differences in cancer survival.
CONCORD-3 can be expected to affect cancer control policy worldwide, especially in countries with low survival. The Organisation for Economic Co-operation and Development published a subset of CONCORD-3 results in 2017 as the official benchmark of cancer survival, among their indicators of the quality of health care in 48 countries worldwide. The survival estimates will also form part of the Lancet Oncology Commission on childhood cancer in 2018. Future research will include examination of the impact on international differences in cancer survival of stage at diagnosis, compliance with treatment guidelines, and the quality of health care.
In 2016, the WHO Executive Board recommended strengthening health systems to ensure early diagnosis and accessible, affordable, high-quality care for all patients with cancer.3 The World Health Assembly followed up with a resolution on cancer control in May, 2017. It included recommendations that national cancer control strategies should aim to reduce late presentation and ensure appropriate treatment and care for potentially curable malignancies such as acute leukaemia in children “to increase survival, reduce mortality and improve quality of life”.4
President Tabaré Vázquez of Uruguay and WHO Director-General Tedros Ghebreyesus have called for all countries “to provide universal health coverage, thereby ensuring all people can access needed preventive and curative health-care services, without falling into poverty”.5 Their call relates to all non-communicable diseases, including cancer. Population-based cancer survival is one metric that can help evaluate whether all people have access to effective treatment services.
In 2015, the second cycle of the CONCORD programme (CONCORD-2) established global surveillance of cancer survival for the first time,6 with publication of trends in survival over the 15-year period 1995–2009 among patients diagnosed with cancer in 67 countries, home to two thirds (4·8 billion) of the world's population. In 40 countries, the data had 100% national population

coverage. CONCORD-2 incorporated centralised quality control and analysis of individual data for 25 676 887 patients diagnosed with one of the ten common cancers that represented 63% of the global cancer burden in 2009. The 279 population-based registries covered a combined total population of 896 million people.
The US National Cancer Institute, in an invited commentary7 for The Lancet, noted that the global analyses of cancer survival in CONCORD-2 provided insights from countries with successful cancer control initiatives that could be applied in other regions, and that the availability of better data “provides a clearer picture of the effect of cancer control programmes on the ultimate goal of improving survival and reducing the effect of cancer on the social and economic development of countries”.
The US Centers for Disease Control and Prevention described CONCORD-2 as the start of global surveillance of cancer survival,8 with survival estimates “that can be compared so scientists can begin to determine why survival differs among countries. This could lead to improvements in cancer control programs.” The results from CONCORD-2 influenced national cancer control strategy in the UK in July, 2015.9, 10 In September, 2015, the International Atomic Energy Agency's Programme for Action on Cancer Therapy used the results to launch a worldwide campaign11 to highlight the global divide in cancer survival, and to raise awareness of persistent inequalities in access to life-saving cancer services.12 Further analyses of survival trends and disparities by race and stage at diagnosis in 37 US states have been included in a supplement to Cancer,13, 14 designed to improve cancer control in the USA.
CONCORD-3 updates worldwide surveillance of cancer survival trends to include patients diagnosed up to 2014, with follow-up to Dec 31, 2014. In countries that were already involved, more registries are participating, and eight more countries have joined the programme. Follow-up for patients diagnosed during 2000–09 with one of the ten cancers included in CONCORD-2 has been updated. CONCORD-3 includes data for patients diagnosed during 2000–14 with one of 18 malignancies that represent 75% of the global cancer burden (table 1). In addition to information on stage at diagnosis, we have collected data on tumour grade and the first course of treatment. Findings are published within 3 years of the end of follow-up.
Table 1. Estimated number of patients diagnosed with an index cancer worldwide each year around 2012
Overall (n=14 067 894) More developed regions (n=6 053 621) Less developed regions (n=8 014 273)
Oesophagus 455 784 (3∙2%) 86 144 (1∙4%) 369 640 (4∙6%)
Stomach 951 594 (6∙8%) 274 509 (4∙5%) 677 085 (8∙4%)
Colorectum 1 360 602 (9∙7%) 736 867 (12∙2%) 623 735 (7∙8%)
Liver 782 451 (5∙6%) 134 302 (2∙2%) 648 149 (8∙1%)
Pancreas 337 872 (2∙4%) 187 465 (3∙1%) 150 407 (1∙9%)
Lung 1 824 701 (13∙0%) 758 214 (12∙5%) 1 066 487 (13∙3%)
Melanoma 232 130 (1∙7%) 191 066 (3∙2%) 41 064 (0∙5%)
Breast (women) 1 671 149 (11∙9%) 788 200 (13∙0%) 882 949 (11∙0%)
Cervix 527 624 (3∙8%) 83 078 (1∙4%) 444 546 (5∙5%)

Overall (n=14 067 894) More developed regions (n=6 053 621) Less developed regions (n=8 014 273)
Ovary 238 719 (1∙7%) 99 752 (1∙6%) 138 967 (1∙7%)
Prostate 1 094 916 (7∙8%) 741 966 (12∙3%) 352 950 (4∙4%)
Brain and central nervous system 256 213 (1∙8%) 88 967 (1∙5%) 167 246 (2∙1%)
Lymphomas 451 691 (3∙2%) 219 255 (3∙6%) 232 436 (2∙9%)
Leukaemias 351 965 (2∙5%) 141 274 (2∙3%) 210 691 (2∙6%)
All index cancers* 10 537 411 (74∙9%) 4 531 059 (74∙8%) 6 006 352 (74∙9%)
Data are from Globocan, 2012.15 Index cancer refers to a cancer or group of malignancies included in CONCORD-3. More developed regions refers to North America, Europe, Australia, New Zealand, and Japan; all other countries and regions are classified as less developed.15 These are UN designations intended for statistical convenience and do not reflect a judgment about the stage reached by a particular country or area in the development process.16
*Excluding non‐melanoma skin cancer.
Methods
Cancerregistries
We contacted 412 cancer registries in 85 countries: 20 in Africa (13 countries), 45 in Central and South America (15 countries), 68 in North America (two countries), 80 in Asia (20 countries), 189 in Europe (33 countries), and ten in Oceania (two countries).
When the data call for CONCORD-3 was issued in May, 2016, 12 of the 279 cancer registries that had participated in CONCORD-2 were no longer operational. The registry in Benghazi (Libya) had been disrupted by war, the registry in Macerata (Italy) had ceased operating, the Department of Health had ceased funding the UK National Registry of Childhood Tumours in 2013, and the nine English regional cancer registries had been replaced by a single cancer registry for England in 2013. Of the 267 remaining registries, nine could no longer provide up-to-date follow-up of all registered patients, whereas 13 did not reply to repeated approaches. Data from the Tirol (Austria) registry are no longer reported separately from the Austrian national estimates. In all, 244 (87%) of the 279 registries (63 of the 67 countries) that participated in CONCORD-2 submitted data (appendix p 266).
Of the 133 registries that had not previously participated in the CONCORD programme, 108 agreed to do so. Of these, 85 (78%) registries in 12 countries submitted data, whereas 11 were unable to complete follow-up of registered patients with cancer for their vital status, nine made no further contact, and three signed up too late (appendix p 266).
Of the 329 registries that submitted data, seven were excluded because their data were not compliant with the protocol and could not be rectified in time. These exclusions affected the only participating registry or registries from several countries: Tunisia (Central Region), Bosnia and Herzegovina (Republika Srpska), Saudi Arabia, and Serbia (Central Region and Vojvodina). We analysed data provided by 322 cancer registries (81% of the 400 operational registries invited) in 71 countries and territories (appendix p 266), for patients diagnosed with cancer during the 15-year period 2000–14, with data on their vital status at least 5 years after diagnosis, or at Dec 31, 2014.
Eight countries from four world regions are participating in the global surveillance of cancer survival for the first time: Morocco (Africa); Costa Rica (national), Mexico (children, national), and Peru (Central and South America); Iran, Kuwait (national), and Singapore (national; Asia), and Greece (children, national; Europe).
Ethicalapprovals
We maintain approvals from the Confidentiality Advisory Group of the UK's statutory Health Research Authority (HRA; reference ECC 3-04(i)/2011; last update March 3, 2017), the National Health Service Research Ethics Service (11/LO/0331; Feb 21, 2017), and the London School of Hygiene & Tropical Medicine (12171; Sept 6, 2017). The HRA also approves the Cancer Survival Group's System-Level Security Policy, governing data security. One investigator (MPC) maintains triennial certification with the Collaborative Institutional Training Initiative in Human Subjects Research for Biomedical Investigators (CITI Program; ID3327653; certification updated May 2, 2016). We maintain statutory or ethical approvals and data sharing agreements, usually with annual renewal, in 85 other jurisdictions participating in the CONCORD programme. Registries in all other jurisdictions obtain local approval. The data belong to the participating registries and are only used for purposes agreed in the CONCORD protocol.
Participants transmit data via a specially configured file transmission utility with 256-bit Advanced Encryption Security. The utility automatically generates a random, strong, one-time password for each data file at the time of transmission, and emails it to a different address. Neither the password nor the address are seen by the sender. This avoids the need for confirmation of passwords by email or telephone. Tumour records are effectively anonymised: they do not contain the patient's name, address, postcode, or any national identity or social security number. All variables are numeric or alphanumeric codes. Each registry is sent a set of unique codes that must be used in naming each cancer data file, including distinct filenames for any retransmission. The codes have no meaning outside of the study. Data files thus contain no information that could be used to identify a person or a cancer registry, and neither the name nor the content of the file would indicate that the file contains cancer data. This enhances security and facilitates efficient handling of thousands of data files.
Protocol
The CONCORD-3 protocol defining the data structure, file transmission procedures, and statistical analyses was expanded and updated from the CONCORD-2 protocol, with the inclusion of variables on five additional cancers or groups of malignancies, tumour grade, and the modality and date of the first course of treatment by surgery, radiotherapy, or systemic therapy.
In a study of this scale, adherence to protocol is crucial. The protocol and analytic approaches were discussed with CONCORD Working Group members from 27 countries at a 1-day meeting in Marrakesh, Morocco, on Oct 17, 2016. The protocol was also discussed at workshops in China, Romania, Russia, Singapore, and the USA (for North America), and in conference calls with Costa Rica, Hong Kong, Malaysia, Mauritius, Mexico, and Mongolia.
English is still a barrier to communication in many countries, so the CONCORD-3 protocol was translated into eight other languages: Arabic, Chinese (Mandarin), French, Italian, Japanese, Portuguese, Russian, and Spanish. Translations were done by native speakers in the CONCORD Central Analytic Team in London or the wider CONCORD Working Group, and checked against the English original by other native speakers. The protocol was made available to participants in all

nine languages on the CONCORD website. The Central Analytic Team communicates with participants in six languages.
We examined survival for 18 cancers or groups of malignancies (referred to as index cancers): oesophagus, stomach, colon, rectum, liver, pancreas, lung, melanoma of the skin, breast (women), cervix, ovary, and prostate in adults (15–99 years); brain tumours, myeloid, and lymphoid malignancies in adults; and brain tumours, acute lymphoblastic leukaemia, and lymphomas in children (0–14 years). Collectively, these cancers accounted for about 75% of the estimated number of patients diagnosed with cancer worldwide each year around 2012 (table 1). The overall proportion is very similar in North America, Europe, Australia, New Zealand, and Japan (referred to as developed countries15) and in other world regions (referred to as developing countries15), but it varies widely between cancers: prostate cancer is proportionately three times more common in developed countries, and cervical cancer is four times more common in developing countries (table 1).
Solid tumours were defined by anatomical site (topography), and the leukaemias, lymphomas, and melanoma of the skin by morphology (table 2). Topography and morphology were coded to the International Classification of Diseases for Oncology (third edition, ICD-O-3),17 including its first revision.18 We restricted estimation of survival for melanomas to those arising in the skin, including the skin of the labia majora, vulva, penis, and scrotum (table 2). Melanomas arising in internal organs were included with all other malignancies in those organs. For ovarian cancer, we included the fallopian tube, uterine ligaments, and adnexa, as well as the peritoneum and retroperitoneum, where high-grade serous ovarian carcinomas are often detected.21 Registries were not asked to select cancers by sex, although some did so. Where datasets did include records for breast cancer in men, the proportion was consistently around 0·7%; these records were excluded. We also excluded small numbers of retroperitoneal malignancies in men, as well as Kaposi's sarcoma, and tumours in solid organs with haemopoietic morphology.
Table 2. Definition of malignancies and number of contributing countries and registries by calendar period of diagnosis
Topography or
morphology codes*
Description Contributing countries and registries
2000–04 2005–09 2010–14 2000–14
Countries Registries Countries Registries Countries Registries Countries Registries
Oesophagus C15.0–C15.5, C15.8–C15.9
Oesophagus 55 249 59 287 58 273 60 290
Stomach C16.0–C16.6, C16.8–C16.9
Stomach 57 252 62 293 60 277 62 294
Colon C18.0–C18.9, C19.9 Colon and rectosigmoid junction
57 251 64 294 64 280 65 296
Rectum C20.9, C21.0–C21.2, C21.8
Rectum, anus, and anal canal
56 250 63 292 63 278 64 294
Liver C22.0–C22.1 Liver and intrahepatic bile ducts
56 250 60 289 60 275 61 291
Pancreas C25.0–C25.4, C25.7–C25.9
Pancreas 55 249 58 288 58 274 59 290
Lung C34.0–C34.3, C34.8–C34.9
Lung and bronchus
57 250 61 289 61 275 61 290
Melanoma of the skin
8720–8790 provided topography was C44.0–C44.9, C51.0, C51.9, C60.9, or C63.2
Melanoma of the skin, including skin of labia majora, vulva, penis, and scrotum
55 239 58 278 59 266 59 281
Breast (women)
C50.0–C50.6, C50.8–C50.9
Breast 59 255 64 295 65 282 66 298

Topography or
morphology codes*
Description Contributing countries and registries
2000–04 2005–09 2010–14 2000–14
Countries Registries Countries Registries Countries Registries Countries Registries
Cervix C53.0–C53.1, C53.8–C53.9
Cervix uteri 57 253 63 293 62 277 64 295
Ovary C48.0–C48.2, C56.9, C57.0–C57.4, C57.7–C57.9
Ovary, fallopian tube and uterine ligaments, other and unspecified female genital organs, peritoneum, and retroperitoneum
56 249 61 288 59 272 61 289
Prostate C61.9 Prostate gland 58 249 62 289 62 275 62 290
Brain (adults) C71.0–C71.9 Brain (adults) 55 247 58 283 58 269 59 286
Myeloid (adults)†
9740, 9741, 9742, 9800, 9801, 9805, 9806, 9807, 9808, 9809, 9840, 9860, 9861, 9863, 9865, 9866, 9867, 9869, 9870, 9871, 9872, 9873, 9874, 9875, 9876, 9891, 9895, 9896, 9897, 9898, 9910, 9911, 9920, 9930, 9931, 9945, 9946, 9950, 9960, 9961, 9962, 9963, 9964, 9975, 9980, 9982, 9983, 9984, 9985, 9986, 9987, 9989, 9991, 9992
All myeloid malignancies
56 249 59 280 60 268 61 286
Lymphoid (adults)†
9590, 9591, 9596, 9597, 9650–9655, 9659, 9661–9665, 9667, 9670, 9671, 9673, 9675, 9678, 9679, 9680, 9684, 9687–9691, 9695, 9698, 9699, 9700–9702, 9705, 9708, 9709, 9712, 9714, 9716–9719, 9725–9729, 9731–9735, 9737, 9738, 9760–9762, 9764, 9811–9818, 9820, 9823, 9826, 9827,9831–9837, 9940, 9948
All lymphoid malignancies
57 250 60 284 61 271 62 289
Brain (children)
C71.0–C71.9 Brain (children) 54 219 58 257 60 245 60 260
Acute lymphoblastic leukaemia (children)‡
9835–9837; plus 9811–9818 provided topography was C42.0, C42.1, C42.3, C42.4, or C80.9
Precursor-cell acute lymphoblastic leukaemia
56 214 60 247 61 233 61 254
Lymphoma (children)‡
9590, 9591, 9596, 9597, 9650–9655, 9659, 9661–9665, 9667, 9670, 9671, 9673, 9675, 9678–9680, 9684, 9687–9691, 9695, 9698–9702, 9705, 9708, 9709, 9712, 9714, 9716–9719, 9725–9729, 9731–9735, 9737, 9738, 9740–9742, 9750–9762,
All lymphomas 55 214 60 253 62 235 62 257

Topography or
morphology codes*
Description Contributing countries and registries
2000–04 2005–09 2010–14 2000–14
Countries Registries Countries Registries Countries Registries Countries Registries
9764–9769, 9970, 9971; plus 9811–9818 provided topography was not C42.0, C42.1, C42.3, C42.4, or C80.9
Some registries contributed data for selected cancers or calendar periods, so the number of participating countries also varies by cancer and calendar period. The number of countries and registries that contributed data at some point during 2000–14 is thus greater than or equal to the number in any 5-year period.
*International Classification of Diseases for Oncology (ICD-O-3),17 including its first revision.18 †Lymphoid malignancies were defined by HAEMACARE19 groups 1–19 and myeloid malignancies by HAEMACARE groups 20–25, incorporating morphology codes from the first revision of ICD-O-3. ‡The International Classification of Childhood Cancer (third edition)20 incorporating morphology codes from the first revision of ICD-O-318 was used to define childhood acute lymphoblastic leukaemia (group Ia1) and lymphoma in children (group II).
Registries provided data for all haemopoietic malignancies (ICD-O-3 morphology codes in the range 9590–9992) in adults and children, to minimise differences in the spectrum of leukaemias and lymphomas submitted for analysis. In consultation with specialists in the HAEMACARE19 and InterLymph22, 23 groups, we agreed to analyse survival for adults in two broad groups: lymphoid malignancies (HAEMACARE groups 1–19) and myeloid malignancies (groups 20–25; table 2; appendix pp 2–5).
For children, we agreed to present survival estimates separately for acute lymphoblastic leukaemia and lymphomas, based on ICD-O-3 codes, grouped according to the third edition of the International Classification of Childhood Cancer.20 The first revision of ICD-O-3, published in 2013,18 introduced eight new entities for acute lymphoblastic leukaemia or lymphoma (morphology codes 9811–9818). These new entities were not used at all by registries in 42 of the 58 countries that submitted data for children diagnosed with acute lymphoblastic leukaemia during 2010–14, and very rarely in eight countries (ie, the combined number of children coded to a new entity was fewer than 100), but the proportions ranged from 11% to 89% in large datasets from Australia, Belgium, Canada, the Netherlands, Puerto Rico, Singapore, Taiwan, and the USA. The overall proportion for all 58 countries combined during 2010–14 was 29% (10 679 of 36 867 children). We therefore included the new entities in all analyses. We included them among the acute lymphoblastic leukaemias if the anatomical site was coded as blood, bone marrow, reticulo-endothelial, or haemopoietic system not otherwise specified (C42.0–42.1, C42.3–42.4), or unknown primary site (C80.9). Otherwise, such malignancies were included with the lymphomas (appendix pp 2–5).
Survival analyses include only primary, invasive malignancies (ICD-O-3 behaviour code 3), except for the brain, where benign tumours (behaviour code 0) are also included. To facilitate quality control and comparison of the intensity of early diagnostic and screening activity, registries were asked to provide data for all registered malignancies at each index site, including those that were benign, of uncertain or borderline malignancy (behaviour code 1), in situ (behaviour code 2), metastatic (behaviour code 6), or uncertain whether primary or metastatic (behaviour code 9).
Registries were asked to provide full dates (day, month, and year) of birth, diagnosis, and death or last known vital status, both for quality control and to enable comparable estimation of survival.24 Where the day or month of birth, or the day of the date of diagnosis, or the day or month of the date

of last known vital status was missing, we used an algorithm (details on request) to standardise the imputation of missing components of dates for all populations.
Participating registries completed a questionnaire on their methods of operation, including data definitions, data collection procedures, coding of anatomical site, morphology and behaviour, the tracing of patients registered with cancer to ascertain their vital status, and how tumour records are linked with data on vital status.
Patients diagnosed with two or more primary cancers at different index sites during 2000–14 were included in the analyses for each cancer—eg, colon cancer in 2005 followed by a breast cancer in 2010. Survival was measured from the date of diagnosis until death, loss to follow-up, or censoring. We retained the most complete record for patients with synchronous primary cancers in the same organ. If a patient was registered with two or more primary malignancies in the same index site during 2000–14 (metachronous primaries), only the first was included in analyses.
North American registries define multiple primary cancers under the rules of the Surveillance Epidemiology and End Results programme.25 Those rules accept more cancers as new primary cancers than do the rules of the International Association of Cancer Registries (IACR),26 which are used by most cancer registries in other continents. The North American Association of Central Cancer Registries (NAACCR) kindly updated the program developed for CONCORD-2 to enable all North American registries to recode their entire incidence databases to the IACR multiple primary rules before their datasets for 2000–14 were extracted for CONCORD-3.
Countries and territories were defined by their United Nations (UN) name, continent, and code as of 2015.16 The names of jurisdictions used in the text, tables, graphics, maps, and appendix are based on those used for statistical purposes by the Statistics Division of the UN Secretariat; similarly, we use the terms “national coverage” to contrast with “regional coverage” for statistical purposes. These designations and the presentation of data here do not imply any assumption regarding the political affiliation of countries or territories, or the expression of any opinion whatsoever on the part of the CONCORD programme concerning the legal status of any country, territory, city, or area, or of its authorities, or concerning the delimitation of its frontiers or boundaries. Some names have been shortened for convenience (eg, Korea for South Korea): this does not carry any political significance.
Cyprus is a Member State of the European Union, but it is part of Asia. Costa Rica, Cuba, Guadeloupe, Martinique, Mexico, and Puerto Rico (Caribbean and Central America) were grouped with South America as Central and South America. World maps and 29 regional maps were prepared in ArcGIS Release 10.3,27 using digital boundaries (shapefiles) from the database of global administrative areas (GADM 2.8).
The population coverage of the data from participating registries is given as the proportion of the country or jurisdiction's population, taken from the UN Population Division database for 2014,28 or from the authorities for Australia, Guadeloupe, Hong Kong, Poland, Portugal, and Taiwan, or the registries concerned. Belarus, Greece, and Mexico provided data only for childhood cancers, so the populations used were for children (0–14 years), and Mali, Mongolia, and Morocco only provided cancer data for women, so we used the female populations.

Qualitycontrol
As for the previous cycle of the CONCORD programme,6 we carried out data quality checks in three phases: protocol adherence, exclusions, and editorial checks. After each phase, a detailed report was sent to each cancer registry for discussion and correction of data where required.
First, we sent registries a report showing the percentage compliance with the protocol for each of 51 variables in each cancer file. Compliance of less than 100% required correction or resubmission of data. Next, we checked for logical inconsistencies between the variables in each tumour record. Exclusion criteria were defined a priori, on the basis of experience from CONCORD-2, and extended to cover features of some of the five additional cancers such as Ann Arbor stage for the lymphomas and 14 additional variables on tumour grade and treatment. The variables in each record were checked for logical coherence against 20 sets of criteria, including eligibility (eg, age and tumour behaviour), definite errors (eg, sex-site errors, invalid dates, impossible date sequence, and missing vital status), and possible errors, including a wide range of inconsistencies between age, tumour site, and morphology.6, 29 Registries were sent exclusion reports for each index cancer and each calendar period, summarising the number of tumour records with each type of definite or possible error, the number registered from a death certificate only (DCO) or detected at autopsy, and the number and proportion of eligible patients whose data could be included in survival analyses. Registries were invited to request details of tumour records in which errors had been detected. Many registries used this information to update their databases. Where errors in classification, coding, or pathological assignment were identified, registries were asked to correct and resubmit their data.
Finally, we examined the proportion of tumour records with morphological verification of the diagnosis, whether from histology of a biopsy or surgical specimen, cytology of a smear or bone marrow aspirate, or from imaging or biomarkers, including tumours with a specific morphology code. We also examined the proportion of cases with non-specific morphology; the distributions of the day and month of the dates of birth, diagnosis, and last known vital status; and the proportion of patients who died within 30 days, were lost to follow-up, or were censored within 5 years of diagnosis.
Follow‐upforvitalstatus
Cancer registries use various methods to determine the vital status (alive, dead, emigrated, or lost to follow-up) of patients registered with cancer.6 Among 243 registries that provided specific information on follow-up procedures, 242 (99%) determine the vital status of registered patients with cancer using passive follow-up techniques in which tumour registration records are regularly linked to a regional or national index of all death registrations, regardless of the cause of death. Linkages are usually based on a national identity or social security number that is stored in both records. Such linkages are increasingly done electronically, but manual scrutiny of printed lists is still required in places. Tumour records that match to a death record are updated with the date of death. Some registries routinely receive paper or electronic death certificates for their territory but this is insufficient on its own because death certificates that do not mention cancer are rarely included. Transcription errors can arise with identity numbers, so variables such as the name, sex, and date of birth are often used to improve the probability of an accurate match between a cancer record and a death registration.
Many registries use electoral registers, hospital records, or official databases, such as social insurance, health insurance, and driving licences, to determine the date on which a patient was last known or believed to have been alive. Patients recorded as having migrated beyond the registry's

jurisdiction, or to another country, might be recorded as lost to follow-up because the patient's eventual death is unlikely to be recorded: they are censored from survival analysis on that date.
Active follow-up techniques are also used by 124 (51%) of the 243 registries, which routinely contact the treating physician, general practitioner, or hospital administration to determine the vital status for each registered patient, often on a quarterly or annual basis. Some registries also determine the vital status by contact with the patient's family, by telephone or home visit, or with the village administration.
Registries were asked to submit data with follow-up for at least 5 years or, for patients diagnosed during 2010–14, until Dec 31, 2014. Registration and follow-up for patients diagnosed in 2000–09 was updated and new datasets were submitted.
Patients registered solely from a death certificate or diagnosed at autopsy were excluded from analyses because their survival time is unknown.
Statisticalanalysis
Most registries submitted data for patients diagnosed between 2000 and 2014, with follow-up to 2014, although some registries only began operation after 2000 or provided data for less than 15 years. The study design we used to examine survival trends among patients diagnosed in three consecutive 5-year calendar periods was “cohort, cohort, period”. We used the cohort approach to estimate survival for patients diagnosed during 2000–04 and 2005–09 and the period approach for patients diagnosed during 2010–14. This design was also used for CONCORD-2,6 so it enables us to examine global trends in survival over a 20-year period by including the estimates for patients diagnosed during 1995–99.
The cohort approach is considered the gold standard30, 31 because it provides a survival estimate for a group of patients who were diagnosed during the same year or period, are likely to have been treated in similar fashion, and who have all been followed up for at least the duration of survival required, such as 5 years. This approach to the estimation of survival is easy to interpret, but other approaches are required when some patients have been followed up for less than 5 years.
We used the cohort approach for patients diagnosed in 2000–04 and 2005–09 because in most datasets all patients had been followed up for at least 5 years. We used the period approach32 for patients diagnosed during 2010–14 because 5 years of follow-up data were not available for all patients. This combination of cohort and period approaches facilitates monitoring of cancer survival trends over an extended time span, from the earliest to the most recent years of cancer registration for which follow-up data are available (appendix p 267).33
To ensure comparability of survival trends from 1995,6 we estimated net survival up to 5 years after diagnosis for both adults and children. Net survival is the cumulative probability of surviving up to a given time since diagnosis (eg, 5 years) after correcting for other causes of death (background mortality). We used the Pohar Perme estimator,34 which takes unbiased account of the higher competing risks of death in elderly people, implemented with the algorithm stns35 in Stata (version 14).
To control for the wide differences in background mortality between participating jurisdictions and over time, we produced 6210 life tables of all-cause mortality rates for each calendar year during 2000–14 in the general population of each country or registry territory, by single year of age, by sex, and by race or ethnicity in Australia (Northern Territory: Indigenous or non-Indigenous), Israel

(Arab or Jewish), New Zealand (Māori or non-Māori), and Singapore (Chinese, Malay, or Indian). For 127 registries, we obtained complete life tables that did not require interpolation or smoothing for each calendar year in 2000–14.
For 193 registries, the method of life table construction depended on whether we received raw data (numbers of deaths and populations) or mortality rates, and on whether the raw data or the mortality rates were by single year of age (ie, complete) or by 5-year age group (ie, abridged).
For 108 registries, we obtained death and population counts from the registry or the relevant national statistical authority. We derived life tables for 2001 and 2013 if possible, each centred on 3 calendar years of data (eg, 2000–02 or 2012–14) to increase the robustness of the rates. We constructed raw mortality rates from the death and population counts using a Poisson regression model with flexible functions,36 then smoothed and extended the rates to obtain complete life tables by sex and single year of age up to age 99 years. Life tables for each calendar year in 2002–12 were created by linear interpolation between the 2001 and 2010 life tables.37 Rather than extrapolate, we used the life table centred on 2001 for 2000, and the life table centred on 2013 for 2014.
For 56 registries that provided abridged mortality rates, or complete mortality rates that were not smoothed, we used the Ewbank relational model38 with three or four parameters to interpolate (if abridged) and smooth the mortality rates for the registry territory against a high-quality smooth life table for a country with a similar pattern of mortality by age.39
Each set of life tables was checked with a standardised statistical summary on the earliest and latest year of available data, showing the data source and the method of construction and smoothing. For each sex and, where relevant, each race or ethnicity, the reports show the life expectancy at birth, the probability of death in the age bands 15–59, 60–84, and 85–99 years, and semi-log plots of the age–mortality rates from 0 to 99 years, showing both the raw datapoints and the final smoothed life-table curve, and the model residuals by age group (appendix pp 268–271).
Collection of authoritative raw data on the numbers of deaths and populations by age, sex, and calendar year or period in participating jurisdictions proved more difficult than in 2013–14. For 29 registries, no reliable data on all-cause mortality could be obtained for the registry territory. We took national life tables published by the UN Population Division28 and interpolated and extended them to age 99 years with the Elandt-Johnson method.40
For the 42 participating states in the USA, we used life tables by state, race, and socioeconomic status, provided by the US National Cancer Institute (Mariotto A; personal communication on Jan 26, 2016).
For each country, registry, and calendar period, we present age-standardised net survival estimates for each cancer at 5 years after diagnosis. For adults, we used the International Cancer Survival Standard (ICSS) weights,41 in which age at diagnosis is categorised into five groups: 15–44, 45–54, 55–64, 65–74, and 75–99 years and, for prostate cancer, 15–54, 55–64, 65–74, 75–84, and 85–99 years. Of the three sets of ICSS weights, we used group 2 (cancers for which incidence does not increase steeply with age) for melanoma of the skin, cervix uteri, and brain (adults), and group 1 (cancers for which incidence does increase steeply with age) for oesophagus, stomach, colon, rectum, liver, pancreas, lung, breast, ovary, and prostate, and both groups of haemopoietic malignancies. For children, we estimated survival for the age groups 0–4, 5–9, and 10–14 years; we obtained age-standardised estimates by assigning equal weights to the three age-specific estimates.41, 42

Cumulative survival probabilities in the range 0–1 are presented for convenience as percentages in the range 0–100%. 95% CIs for both unstandardised and age-standardised survival estimates were derived assuming a normal distribution, truncated to the range 0–100. Standard errors to construct the CIs were derived with the Greenwood method.43 If no death or censoring occurred within 5 years, or if all patients died within 5 years (survival probability 1 or 0), we obtained a binomial approximation for the lower or upper bound, respectively, of the CI.30
We did not estimate survival if fewer than ten patients were available for analysis. If 10–49 patients were available for analysis in a given calendar period, we only estimated survival for all ages combined. If 50 or more patients were available, we attempted survival estimation for each age group. If a single age-specific estimate could not be obtained, we merged the data for adjacent age groups and assigned the combined estimate to both age groups before standardisation for age. If two or more age-specific estimates could not be obtained, we present only the unstandardised estimate for all ages combined. We did not merge data between consecutive calendar periods.
We considered survival estimates as less reliable if 15% or more of patients were lost to follow-up or censored alive within 5 years of diagnosis. For patients diagnosed in 2010 or later, this criterion was applied for patients censored alive before Dec 31, 2014, the study closure date. Estimates are also considered less reliable if 15% or more of patients were registered only from a death certificate or at autopsy and excluded from analysis, because their survival is unknown. Finally, estimates are also considered less reliable if 15% or more of patients were excluded from analysis because one or more dates was incomplete: unknown year of birth, unknown month or year of diagnosis, or unknown year of last known vital status.
The pooled estimates for countries with more than one registry do not include data from registries for which the estimates were less reliable. Less reliable estimates are shown with a flag in figures and tables when they are the only available information from a given country or territory.
Roleofthefundingsource
The funding sources played no part in the design, data collection, quality control, analysis, interpretation of the findings, writing of the manuscript, or the decision to submit for publication. The corresponding author had full access to all data and responsibility for submission for publication.
Results
TheCONCORDdatabase2000–14
We analysed data for 322 cancer registries in 71 countries in Africa (eight registries, six countries), Central and South America (33 registries, 13 countries), North America (57 registries, two countries), Asia (66 registries, 17 countries), Europe (149 registries, 31 countries), and Oceania (nine registries, two countries; figure 1).
For 47 countries, data were provided with 100% coverage of the national population: 41 countries for both adults and children, and six for children only (Argentina, Belarus, France, Greece, Mexico, and Switzerland; table 3). In the other countries, population coverage varied from less than 1% in India to 86% in the USA (Table 4, Table 5). 80 cancer registries joined the CONCORD programme for the first time. The 322 participating registries covered a combined population of almost 1 billion people around 2014 (989 082 244; Table 4, Table 5). Detailed maps of participating jurisdictions are shown in the appendix (pp 178–208).

Table 3. Data quality indicators: patients diagnosed during 2000–14 by continent and country
Calendar period
Patients submitted
Ineligible patients†
Eligible
patients
Excluded§
Patients
included
Data quality indicators¶
Incomplete dates
In situOthe
r DCO
Other
Microscopically verified
Non-specific
morphology
Lost to
follow-up
Censored
Africa 46 627 9·6% 0·4% 1·1% 41 447 0·9% 2·1% 40 197 91·6% 14·1% 7·6% 37·7%
Algerian registries
2000–14
18 157 7·6% 0·1% 1·8% 16 434 1·8% 3·3% 15 602 98·4% 10·2% 0·0% 31·5%
Mali (Bamako)
2010–12
104 41·3% 0·0% 0·0% 61 0·0% 1·6% 60 100·0% 20·0% 0·0% 0·0%
Mauritius*
2005–12
4125 0·0% 0·0% 0·4% 4109 0·0% 3·7% 3959 96·7% 19·8% 0·0% 2·3%
Morocco (Casablanca)
2008–12
4840 1·4% 0·0% 0·1% 4769 0·0% 1·8% 4683 100·0% 2·4% 33·0%
35·6%
Nigeria (Ibadan)
2003–14
11 726 25·4% 1·4% 1·2% 8443 0·9% 1·1% 8274 98·7% 2·0% 0·0% 65·3%
South Africa (Eastern Cape)
2000–14
7675 0·0% 0·0% 0·6% 7631 0·0% 0·2% 7619 62·3% 39·5% 19·7%
40·2%
America (Central and South)
906 076 5·4% 3·1% 0·7% 822 687 13·7% 1·1% 700 946 92·4% 8·0% 5·2% 3·7%
Argentinian registries‡
2000–14
75 167 1·7% 1·5% 0·5% 72 366 10·8% 0·6% 64 151 96·5% 5·7% 0·0% 2·3%
Brazilian registries
2000–14
191 344 18·5% 3·9% 0·5% 147 622 8·0% 0·9% 134 597 90·0% 10·6% 22·9%
0·3%
Chilean registries
2000–12
28 987 0·0% 0·8% 0·7% 28 555 7·6% 0·1% 26 363 86·2% 12·0% 0·0% 13·6%
Colombian registries
2000–14
63 402 3·1% 1·5% 1·2% 59 740 5·0% 0·9% 56 245 89·9% 11·3% 0·0% 21·0%
Costa Rica*
2002–14
72 900 0·0% 4·1% 1·4% 68 900 8·4% 0·8% 62 536 90·1% 13·0% 0·0% 0·0%
Cuba*
2000–12
193 196 0·0% 0·0% 0·2% 192 755 32·3% 2·5% 125 696 91·8% 5·1% 2·6% 0·0%
Ecuadorian registries
2000–14
71 798 7·7% 8·2% 0·8% 59 892 9·8% 1·6% 53 043 92·0% 9·9% 0·3% 2·7%
Guadeloupe*
2008–13
8896 0·0% 12·0% 0·3% 7802 0·0% 0·2% 7787 99·1% 2·1% 0·0% 57·7%
Martinique*
2000–12
16 066 0·0% 0·0% 0·1% 16 053 0·0% 1·7% 15 779 97·3% 0·7% 7·3% 0·1%
Mexico (childhood)‡
2008–14
9749 5·8% 0·0% 9·7% 8236 0·0% 0·5% 8194 99·8% 3·9% 9·3% 7·6%
Peru (Lima)
2010–12
19 078 0·1% 0·0% 0·7% 18 929 8·9% 0·1% 17 226 93·9% 2·9% 0·0% 10·2%
Puerto Rico*
2000–11
118 877 3·7% 3·9% 0·7% 109 001 6·4% 0·3% 101 613 98·4% 3·4% 0·0% 0·0%
Uruguay*
2008–12
36 616 0·0% 9·6% 0·7% 32 836 15·5% 0·1% 27 716 85·0% 15·9% 0·0% 0·0%
America (North)
15 925 870
0·7% 6·8% 0·7%14 622 183
1·8% 0·3%14 320 034
97·7% 3·0% 1·4% 0·0%
Canadian registries
2000–14
1 519 461 0·1% 4·9% 0·7% 1 431 975 1·2% 0·4% 1 409 413 94·8% 5·5% 0·0% 0·0%
US registries
2000–14
14 406 409
0·7% 7·0% 0·7%13 190 208
1·8% 0·3%12 910 621
98·0% 2·8% 1·5% 0·0%
Asia 6 595 363 0·6% 3·4% 0·4% 6 298 518 4·7% 0·4% 5 976 959 88·6% 11·5% 0·4% 1·0%
Chinese registries
2003–13
610 729 0·8% 0·2% 0·2% 603 861 1·4% 0·1% 594 533 66·2% 41·8% 3·2% 0·1%
Cyprus*
2004–14
25 086 1·4% 2·6% 0·8% 23 880 9·0% 0·5% 21 610 98·9% 1·8% 0·0% 34·8%

Calendar period
Patients submitted
Ineligible patients†
Eligible
patients
Excluded§
Patients
included
Data quality indicators¶
Incomplete dates
In situOthe
r DCO
Other
Microscopically verified
Non-specific
morphology
Lost to
follow-up
Censored
Hong Kong*
2005–14
78 127 3·8% 0·0% 0·0% 75 146 0·4% 0·2% 74 721 96·6% 0·0% 5·5% 0·0%
Indian registries
2000–14
5048 3·2% 0·0% 0·0% 4882 1·7% 0·6% 4774 82·1% 25·1% 1·8% 0·1%
Iran (Golestan)
2006–08
1187 0·0% 0·0% 0·5% 1181 8·9% 3·1% 1 039 82·1% 17·9% 8·9% 0·0%
Israel*
2000–13
282 191 0·0% 7·3% 2·2% 255 359 4·8% 0·4% 241 881 96·8% 4·2% 0·0% 0·0%
Japanese registries
2000–14
2 237 861 1·0% 4·8% 0·5% 2 096 697 12·4% 0·1% 1 834 894 91·4% 11·3% 0·0% 1·7%
Jordan*
2000–14
43 442 0·2% 1·2% 1·5% 42 179 0·2% 1·6% 41 433 99·1% 3·0% 5·9% 0·0%
Korea*
2000–14
1 770 463 0·5% 0·0% 0·0% 1 762 176 0·0% 0·1% 1 760 804 93·1% 7·8% 0·0% 0·0%
Kuwait*
2000–13
8931 0·0% 1·4% 1·1% 8710 2·3% 0·3% 8484 99·8% 0·4% 1·2% 0·0%
Malaysia (Penang)
2000–13
19 612 0·3% 0·0% 0·1% 19 527 1·6% 2·1% 18 805 94·2% 9·5% 0·0% 13·0%
Mongolia*
2003–14
1025 0·0% 1·1% 0·0% 1014 0·3% 1·2% 999 77·0% 4·1% 7·6% 0·0%
Qatar*
2000–14
7940 0·0% 1·0% 1·0% 7778 1·0% 0·7% 7642 95·4% 6·3% 0·0% 51·0%
Singapore*
2000–14
122 461 0·0% 7·0% 1·9% 111 495 1·1% 0·3% 109 992 91·7% 1·9% 0·0% 0·0%
Taiwan*
2000–14
941 313 0·1% 8·6% 0·1% 859 169 0·0% 0·1% 858 683 86·6% 0·5% 0·0% 0·0%
Thai registries
2000–14
183 776 0·0% 0·3% 0·5% 182 455 3·8% 8·7% 159 528 68·6% 34·0% 0·0% 3·0%
Turkish registries
2000–13
256 171 1·5% 2·7% 0·9% 243 009 1·9% 0·5% 237 137 94·7% 7·9% 0·2% 3·8%
Europe
17 057 088
0·1% 7·0% 2·1%15 481 564
2·8% 0·3%14 991 316
94·0% 3·9% 0·9% 2·1%
Austria*
2000–14
486 379 0·0% 7·4% 1·2% 444 735 6·1% 1·1% 412 683 98·0% 4·9% 0·0% 0·0%
Belarus (childhood)‡
2000–14
1740 0·0% 0·0% 0·0% 1740 0·6% 2·5% 1687 97·9% 2·5% 1·5% 0·0%
Belgium*
2004–14
616 737 0·0% 11·4% 0·2% 545 373 0·0% 0·2% 544 110 98·4% 2·0% 1·1% 0·0%
Bulgaria*
2000–14
299 563 0·0% 0·0% 0·1% 299 333 8·5% 0·0% 273 868 89·2% 1·4% 0·1% 0·0%
Croatia*
2000–14
246 883 0·0% 3·5% 0·2% 237 793 6·2% 0·1% 222 776 82·9% 0·5% 0·0% 0·0%
Czech Republic*
2000–14
640 594 0·0% 7·5% 1·6% 582 748 1·3% 0·4% 572 368 90·3% 1·5% 0·0% 0·0%
Denmark*
2000–14
366 310 0·0% 0·0% 0·2% 365 525 0·0% 0·1% 365 105 96·3% 6·8% 0·2% 0·0%
Estonia*
2000–12
64 038 0·0% 1·8% 0·7% 62 396 3·9% 0·2% 59 848 89·2% 2·0% 0·3% 0·0%
Finland*
2000–14
328 513 0·6% 5·4% 0·9% 306 077 3·8% 0·1% 294 268 95·8% 3·2% 0·1% 0·0%
French registries‡
2000–12
466 020 0·2% 0·0% 0·3% 463 588 0·0% 0·6% 460 927 96·1% 0·6% 1·8% 0·1%
German registries
2000–14
1 925 070 0·4% 4·5% 1·0% 1 811 465 10·3% 0·2% 1 621 312 97·5% 0·7% 0·3% 17·7%
Gibraltar*
2000–10
732 13·0% 11·7% 1·1% 543 0·2% 1·7% 533 99·6% 0·8% 0·0% 41·7%
Greece (childhood)
2000–14
1743 0·6% 0·0% 0·0% 1733 0·0% 0·4% 1726 99·9% 0·1% 0·8% 0·2%

Calendar period
Patients submitted
Ineligible patients†
Eligible
patients
Excluded§
Patients
included
Data quality indicators¶
Incomplete dates
In situOthe
r DCO
Other
Microscopically verified
Non-specific
morphology
Lost to
follow-up
Censored
‡
Iceland*
2000–14
15 245 0·0% 1·4% 0·8% 14 918 0·8% 0·1% 14 782 96·5% 3·9% 0·0% 0·0%
Ireland*
2000–13
240 962 0·0% 16·3% 0·9% 199 552 1·5% 0·2% 196 331 92·2% 1·7% 0·0% 0·0%
Italian registries
2000–14
1 452 003 0·0% 1·8% 0·8% 1 414 476 0·7% 0·3% 1 400 117 87·5% 14·1% 0·7% 0·8%
Latvia*
2000–14
97 852 0·0% 0·1% 26·8%
71 511 0·0% 0·6% 71 082 99·8% 1·1% 0·0% 0·0%
Lithuania*
2000–12
154 857 0·0% 4·1% 1·1% 146 896 4·9% 0·2% 139 475 87·6% 1·5% 0·0% 0·3%
Malta*
2000–13
17 625 0·0% 6·9% 1·8% 16 091 3·1% 0·4% 15 518 92·4% 8·9% 0·0% 0·0%
Netherlands*
2000–14
1 047 456 0·0% 3·8% 1·2% 994 826 0·2% 0·6% 987 029 96·2% 4·0% 0·5% 0·0%
Norway*
2000–14
488 733 0·0% 10·3% 32·5%
279 696 0·5% 0·1% 277 991 99·8% 0·4% 0·2% 0·0%
Poland*
2000–14
1 389 978 0·0% 0·1% 0·3% 1 383 780 2·5% 0·3% 1 344 837 91·4% 1·3% 0·0% 0·0%
Portugal*
2000–14
408 523 0·7% 2·7% 1·5% 388 199 0·1% 0·2% 386 853 96·7% 2·7% 1·7% 0·0%
Romania (Cluj)
2006–12
17 740 0·0% 3·1% 1·7% 16 894 16·6% 0·2% 14 060 90·1% 10·7% 0·0% 0·0%
Russian registries
2000–14
252 171 0·0% 0·5% 0·4% 249 928 0·8% 1·0% 245 591 85·4% 4·1% 2·0% 1·3%
Slovakia*
2000–10
180 029 0·0% 4·1% 1·3% 170 269 8·2% 0·1% 156 122 94·0% 6·7% 0·0% 0·0%
Slovenia*
2000–13
124 213 0·0% 13·0% 2·4% 105 052 2·0% 0·0% 102 970 93·5% 0·3% 0·1% 0·0%
Spanish registries
2000–14
417 865 0·3% 6·8% 0·9% 384 586 1·9% 0·2% 376 759 91·7% 2·2% 0·5% 0·5%
Sweden*
2000–14
676 693 0·0% 15·4% 3·0% 551 717 1·1% 0·2% 544 531 98·6% 2·2% 0·2% 0·0%
Swiss registries‡
2000–14
241 610 0·0% 7·9% 2·5% 216 439 1·2% 0·5% 212 695 95·9% 2·4% 4·6% 3·9%
UK*
2000–14
4 389 211 0·1% 13·0% 1·4% 3 753 685 1·8% 0·3% 3 673 362 94·9% 4·5% 1·9% 0·0%
Oceania 1 691 153 0·3% 9·7% 0·7% 1 510 866 1·6% 0·2% 1 483 573 96·5% 3·6% 0·0% 0·0%
Australia*
2000–14
1 443 620 0·3% 11·3% 0·8% 1 263 961 1·4% 0·2% 1 244 350 97·0% 3·0% 0·0% 0·0%
New Zealand*
2000–14
247 533 0·0% 0·0% 0·3% 246 905 2·9% 0·2% 239 223 94·3% 6·3% 0·0% 0·0%
Total
42 222 177
0·5% 6·4% 1·2%38 777 265
2·9% 0·3%37 513 025
94·6% 4·9% 1·0% 1·1%
DCO=death certificate only.
*Data with 100% coverage of the national population. †Incomplete dates: records in which the year of birth is unknown; or the month or year of diagnosis is unknown; or the year of last known vital status is unknown. In-situ malignancy (ICD-O-3 behaviour code 2): some registries do not register in-situ cancers; other registries did not submit them. Other: records with incomplete data or for tumours that are benign (behaviour code 0, except brain tumours), of uncertain behaviour (behavior code 1), metastatic from another organ (behavior code 6), or unknown if primary or metastatic (behavior code 9); or for patients with age outside the range 0–14 years (children) or 15–99 years (adults); or other conditions. ‡Data with 100% coverage of the national population for childhood malignancies only. §DCO: tumours registered only from a death certificate or detected at autopsy. Sweden does not register DCOs; autopsy-detected cases were not submitted for CONCORD-2 but have been submitted for CONCORD-3. Other: vital status or sex unknown; invalid date or sequence of dates; inconsistency of sex–site, site-morphology, age–site, age-morphology, or age–site-morphology. ¶Non-specific morphology (solid tumours only): ICD-O-317, 18 morphology code in the range 8000–8005. Censored: patients whose last known vital status is “alive” and who were censored within 5 years of diagnosis or, if diagnosed in 2010 or later, before Dec 31, 2014.

Table 4. Population covered by participating registries (number of people and percentage of national population) and number of adults diagnosed with cancer of the oesophagus, stomach, colon, rectum, liver, pancreas, or lung, or melanoma of the skin during 2000–14 by continent and country
Population
covered
Percentage of national
population covered
Number of patients Total
number of patients†
Oesophagus Stomach Colon Rectum Liver Pancreas Lung
Melanoma of the skin
Africa 10 533 762 3·5% 3057 1731 2172 1487 869 379 2734 368 40 197
Algerian registries
2 447 075 6·3% 104 1129 1331 827 244 272 1852 248 15 602
Mali (Bamako) 764 245 9·0% ·· ·· ·· ·· ·· ·· ·· ·· 60
Mauritius* 1 268 567 100·0% 59 494 494 289 27 45 584 4 3959
Morocco (Casablanca)
2 178 083 12·7% ·· ·· ·· ·· ·· ·· ·· ·· 4683
Nigeria (Ibadan)
2 797 220 1·6% ·· ·· 230 266 333 ·· ·· 69 8274
South Africa (Eastern Cape)
1 078 572 2·0% 2894 108 117 105 265 62 298 47 7619
America (Central and South)
99 818 363 23·7% 13 528 60 643 82 843 26 424 9019 15 731 53 959 8202 700 946
Argentinian registries‡
3 973 922 9·2% 1152 2686 6076 1959 968 1657 5195 1084 64 151
Brazilian registries
15 882 624 7·7% 6678 15 567 21 984 10 354 858 5520 4884 1424 134 597
Chilean registries
2 459 133 13·8% 918 4423 1949 824 525 793 2166 554 26 363
Colombian registries
4 277 369 9·0% 642 7988 3874 1990 1129 1303 3965 1373 56 245
Costa Rica* 4 757 606 100·0% 528 8577 5438 1926 1239 1188 2688 1432 62 536
Cuba* 11 379 111 100·0% ·· 6664 15 047 ·· ·· ·· 19 344 ·· 125 696
Ecuadorian registries
6 398 546 40·2% 486 7210 3203 1622 1502 1069 2641 1080 53 043
Guadeloupe* 450 273 100·0% 119 521 724 210 82 167 308 52 7787
Martinique* 396 425 100·0% 213 973 1305 423 206 473 693 164 15 779
Mexico (childhood)‡
35 188 624 100·0% ·· ·· ·· ·· ·· ·· ·· ·· 8194
Peru (Lima) 7 548 697 24·4% ·· ·· 2803 992 ·· ·· ·· ·· 17 226
Puerto Rico* 3 686 517 100·0% 1743 3900 14 594 3882 2202 1984 6570 1039 101 613
Uruguay* 3 419 516 100·0% 1049 2134 5846 2242 308 1577 5505 ·· 27 716
America (North)
301 237 785 84·8% 195 255 283 566 1 471 548 461 707 246 966 462 187 2 564 507 678 206 14 320 034
Canadian registries
27 213 277 76·5% 18 788 33 889 166 760 60 958 20 858 41 908 236 434 65 235 1 409 413
US registries 274 024 508 85·8% 176 467 249 677 1 304 788 400 749 226 108 420 279 2 328 073 612 971 12 910 621
Asia 227 771 765 7·2% 206 254 971 935 703 081 361 987 617 479 205 345 950 362 31 314 5 976 959
Chinese registries
31 755 347 2·3% 72 714 92 578 35 001 31 498 74 295 19 110 133 932 1 449 594 533
Cyprus* 1 153 658 100·0% 81 802 2665 788 247 534 2489 589 21 610
Hong Kong* 7 241 700 100·0% ·· ·· 28 797 12 856 ·· ·· ·· ·· 74 721
Indian registries
1 005 294 0·1% 269 303 199 191 230 134 850 29 4774
Iran (Golestan) 1 893 646 2·4% 412 353 216 58 ·· ·· ·· ·· 1039
Israel* 7 939 483 100·0% 1691 9737 33 938 9401 2310 8083 25 347 12 265 241 881
Japanese registries
51 445 407 40·6% 63 631 381 457 247 682 102 776 122 792 79 636 276 444 4018 1 834 894
Jordan* 7 416 083 100·0% 352 1955 5116 1775 606 952 4282 214 41 433
Korea* 50 074 400 100·0% 30 627 396 213 187 078 121 053 214 821 59 357 257 345 5771 1 760 804
Kuwait* 3 753 121 100·0% 90 207 908 330 261 240 559 18 8484
Malaysia (Penang)
1 543 500 5·2% 290 1061 2285 1126 927 539 2863 ·· 18 805
Mongolia* 1 468 823 100·0% ·· ·· ·· ·· ·· ·· ·· ·· 999

Population
covered
Percentage of national
population covered
Number of patients Total
number of patients†
Oesophagus Stomach Colon Rectum Liver Pancreas Lung
Melanoma of the skin
Qatar* 2 172 065 100·0% 98 361 784 283 438 186 587 55 7642
Singapore* 3 870 700 100·0% 1 434 6822 17 225 6241 7101 3481 17 921 367 109 992
Taiwan* 23 123 866 100·0% 27 680 54 983 108 844 57 163 158 157 22 283 141 108 2988 858 683
Thai registries 13 738 188 20·3% 3344 5321 13 801 6679 30 814 3284 28 865 695 159 528
Turkish registries
18 176 484 23·4% 3541 19 782 18 542 9769 4480 7526 57 770 2856 237 137
Europe 321 365 615 50·0% 294 606 668 096 1 764 170 801 387 283 720 506 723 2 317 434 647 507 14 991 316
Austria* 8 516 916 100·0% 5324 19 308 46 127 23 360 10 570 18 371 56 130 19 150 412 683
Belarus (childhood)‡
1 498 163 100·0% ·· ·· ·· ·· ·· ·· ·· ·· 1687
Belgium* 11 226 322 100·0% 10 191 15 222 63 540 27 614 7026 15 015 83 551 21 905 544 110
Bulgaria* 7 201 308 100·0% ·· 21 404 37 854 22 511 5704 ·· 50 210 5875 273 868
Croatia* 4 255 853 100·0% 3007 14 589 27 382 15 309 5456 8596 41 744 7848 222 776
Czech Republic*
10 542 666 100·0% 7764 24 157 83 481 34 838 12 056 27 622 93 241 27 800 572 368
Denmark* 5 646 899 100·0% 6556 8022 40 495 22 384 4708 13 279 62 402 24 630 365 105
Estonia* 1 316 203 100·0% 786 5212 6523 3062 903 2698 9201 1983 59 848
Finland* 5 479 660 100·0% 3686 9871 25 374 12 847 5096 12 851 31 950 14 949 294 268
French registries‡
13 891 552 21·7% 9958 13 770 53 149 20 018 14 818 15 328 51 989 13 677 460 927
German registries
29 655 933 36·8% 27 208 75 378 191 396 99 791 28 301 57 498 212 897 78 713 1 621 312
Gibraltar* 31 997 100·0% 12 29 81 21 5 13 63 31 533
Greece (childhood)‡
1 610 335 100·0% ·· ·· ·· ·· ·· ·· ·· ·· 1726
Iceland* 327 318 100·0% 271 473 1433 580 165 481 2 314 713 14 782
Ireland* 4 675 164 100·0% 4899 6801 21 724 9085 2178 5931 26 838 9470 196 331
Italian registries
34 479 972 57·7% 12 219 80 686 188 983 53 226 63 084 56 698 203 548 46 607 1 400 117
Latvia* 1 989 354 100·0% 1294 6878 7658 4748 464 1072 9691 2503 71 082
Lithuania* 2 916 798 100·0% 2130 11 840 11 148 7694 1776 5421 18 499 3317 139 475
Malta* 417 723 100·0% 184 656 1908 781 152 709 2043 541 15 518
Netherlands* 16 868 020 100·0% 25 342 29 585 126 237 51 839 6397 28 717 159 895 59 088 987 029
Norway* 5 147 970 100·0% 3021 7548 36 646 16 306 1916 6671 33 558 19 994 277 991
Poland* 38 483 957 100·0% 18 959 79 466 140 075 83 669 20 764 47 635 306 136 35 834 1 344 837
Portugal* 10 566 132 100·0% 6122 33 865 57 219 25 989 5107 8303 40 422 9358 386 853
Romania (Cluj)
983 525 5·0% 216 1201 1552 657 547 563 2126 436 14 060
Russian registries
8 081 400 5·6% 6000 31 711 28 946 16 305 3757 10 048 42 434 4914 245 591
Slovakia* 5 422 861 100·0% 2794 9604 23 694 11 066 2741 6624 22 971 6389 156 122
Slovenia* 2 066 068 100·0% 1202 6443 12 376 6682 1964 4073 16 051 5603 102 970
Spanish registries
9 396 745 20·3% 5637 17 844 54 250 18 245 11 848 12 438 54 237 11 028 376 759
Sweden* 9 703 247 100·0% 6233 13 463 55 664 29 777 7242 14 240 51 122 36 921 544 531
Swiss registries‡
4 368 854 53·2% 3583 6135 21 137 8633 5070 7694 27 116 14 893 212 695
UK* 64 596 700 100·0% 120 008 116 935 398 118 174 350 53 905 118 134 605 055 163 337 3 673 362
Oceania 27 952 971 100·0% 21 728 33 411 174 823 67 496 20 311 39 014 162 266 187 512 1 483 573
Australia* 23 457 489 100·0% 17 877 27 952 144 382 56 260 17 281 33 319 136 318 156 302 1 244 350
New Zealand* 4 495 482 100·0% 3851 5459 30 441 11 236 3030 5695 25 948 31 210 239 223
Total 988 680 261 20·2% 734 428 2 019 382 4 198 637 1 720 488 1 178 364 1 229 379 6 051 262 1 553 109 37 513 025
Populations given are for 2014 or nearest available year. Populations for 2014 are from the UN Population Division28 or national authorities in Australia, Guadeloupe, Hong Kong, Poland, Portugal,

and Taiwan (2010). Subnational populations were provided by the registry concerned. Belarus, Greece, and Mexico only provided data for childhood cancers: national populations shown are for children (0–14 years). Mali, Mongolia, and Morocco only provided cancer data for women: national populations shown are for women. Population shown for France excludes Guadeloupe and Martinique.
*Data with 100% coverage of the national population. †Total given is for all 18 cancers (see also table 5). ‡Data with 100% coverage of the national population for childhood malignancies only.
Table 5. Population covered by participating registries (number of people and percentage of national population) and number of patients diagnosed with cancer of the breast (women), cervix, ovary, prostate, or brain, or myeloid or lymphoid malignancies (adults), and brain, acute lymphoblastic leukaemia, or lymphoma (children) during 2000–14 by continent and country
Population
covered
Percentage of
national population
covered
Number of patients Total
number of patients†
Breast
(women) Cervix Ovary Prostate
Brain (adults
)
Myeloid
(adults)
Lymphoid (adults)
Brain (children
)
Acute lymphoblastic leukaemia (children)
Lymphoma
(children)
Africa 10 533 762 3·5% 15 117 5017 1010 2726 592 425 2042 179 64 228 40 197
Algerian registries
2 447 075 6·3% 5196 885 423 764 392 290 1376 109 45 115 15 602
Mali (Bamako)
764 245 9·0% 60 ·· ·· ·· ·· ·· ·· ·· ·· ·· 60
Mauritius* 1 268 567
100·0%
483 436 244 628 36 42 86 3 ·· 5 3959
Morocco (Casablanca)
2 178 083 12·7% 4683 ·· ·· ·· ·· ·· ·· ·· ·· ·· 4683
Nigeria (Ibadan)
2 797 220 1·6% 3962 1578 225 833 148 76 412 45 12 85 8274
South Africa (Eastern Cape)
1 078 572 2·0% 733 2118 118 501 16 17 168 22 7 23 7619
America (Central and South)
99 818 363 23·7% 159 976 49 067 16 023 115 102 8547 10 842 47 740 4936 13 299 5065 700 946
Argentinian registries‡
3 973 922 9·2% 15 282 2467 1688 7115 1217 1588 4281 2662 5119 1955 64 151
Brazilian registries
15 882 624 7·7% 49 811 3083 1201 7556 1011 852 3270 168 233 143 134 597
Chilean registries
2 459 133 13·8% 3717 1564 698 4816 475 652 1968 83 171 67 26 363
Colombian registries
4 277 369 9·0% 9609 5124 1759 8722 1601 1476 5004 243 306 137 56 245
Costa Rica* 4 757 606
100·0%
12 019 7466 1408 11 345 1067 857 4646 153 456 103 62 536
Cuba* 11 379 111
100·0%
33 313 16 396 4560 21 358 ·· ·· 8451 ·· ·· 563 125 696
Ecuadorian registries
6 398 546 40·2% 8283 5453 1732 7939 1481 1489 6330 324 859 340 53 043
Guadeloupe*
450 273 100·0%
1266 160 110 3389 55 115 480 14 9 6 7787
Martinique* 396 425
100·0%
2279 399 191 6480 182 482 1257 20 29 10 15 779
Mexico (childhood)‡
35 188 624 100·0%
·· ·· ·· ·· ·· ·· ·· 1047 5647 1500 8194
Peru (Lima)
7 548 697 24·4% 5590 2917 ·· ·· ·· 891 3 653 ·· 268 112 17 226
Puerto Rico*
3 686 517 100·0%
18 807 2458 1728 29 855 1458 2440 8400 222 202 129 101 613
Uruguay* 3 419 516
100·0%
·· 1580 948 6 527 ·· ·· ·· ·· ·· ·· 27 716
America 301 237 78 84·8% 2 587 79 163 51 312 95 2 703 95 251 88 508 562 1 356 829 27 157 29 995 13 440 14 320 03

Population
covered
Percentage of
national population
covered
Number of patients Total
number of patients†
Breast
(women) Cervix Ovary Prostate
Brain (adults
)
Myeloid
(adults)
Lymphoid (adults)
Brain (children
)
Acute lymphoblastic leukaemia (children)
Lymphoma
(children)
(North) 5 8 7 4 2 8 4
Canadian registries
27 213 277 76·5% 237 321 16 054 31 395 256 736 28 186 49 474 139 370 2196 2712 1139 1 409 413
US registries
274 024 508
85·8% 2 350 477
147 463
281 559
2 447 216
223 702
459 088 1 217 459 24 961 27 283 12 301 12 910 621
Asia 227 771 765
7·2% 726 968 161 620
109 998
397 673 73 306 140 066 293 307 8513 11 371 6380 5 976 959
Chinese registries
31 755 347 2·3% 53 791 13 131 10 517 12 380 11 341 12 171 19 388 526 498 213 594 533
Cyprus* 1 153 658
100·0%
5069 321 553 4088 394 555 2326 14 56 39 21 610
Hong Kong*
7 241 700 100·0%
28 956 4112 ·· ·· ·· ·· ·· ·· ·· ·· 74 721
Indian registries
1 005 294 0·1% 812 753 172 183 162 153 272 18 32 12 4774
Iran (Golestan)
1 893 646 2·4% ·· ·· ·· ·· ·· ·· ·· ·· ·· ·· 1039
Israel* 7 939 483
100·0%
51 125 2942 5663 32 503 5235 8375 30 911 843 754 758 241 881
Japanese registries
51 445 407 40·6% 184 372 30 606 31 244 168 505 15 007 37 845 85 640 1293 1438 508 1 834 894
Jordan* 7 416 083
100·0%
11 584 579 ·· 2457 1483 1917 6511 489 681 480 41 433
Korea* 50 074 400
100·0%
179 520 58 663 28 076 83 892 17 701 42 322 70 594 2333 3389 2049 1 760 804
Kuwait* 3 753 121
100·0%
2568 163 221 509 230 346 1405 49 251 129 8484
Malaysia (Penang)
1 543 500 5·2% 4606 1046 805 915 289 504 1244 84 156 65 18 805
Mongolia* 1 468 823
100·0%
999 ·· ·· ·· ·· ·· ·· ·· ·· ·· 999
Qatar* 2 172 065
100·0%
1861 196 214 586 287 489 1042 33 71 71 7642
Singapore* 3 870 700
100·0%
22 473 2943 3514 7991 1202 3339 7187 196 388 167 109 992
Taiwan* 23 123 866
100·0%
116 929 29 214 16 872 52 681 8410 17 813 39 704 1211 1811 832 858 683
Thai registries
13 738 188 20·3% 25 001 12 737 5469 5869 2779 5177 8486 385 605 217 159 528
Turkish registries
18 176 484 23·4% 37 302 4214 6678 25114 8786 9060 18 597 1039 1241 840 237 137
Europe 321 365 615
50·0% 2 700 348
267 986
399 675
2 355 249
297 032
436 684 1 182 009 24 316 29 544 14 830 14 991 316
Austria* 8 516 916
100·0%
74 818 6455 11 567 75 082 7615 7223 31 583 ·· ·· ·· 412 683
Belarus (childhood)‡
1 498 163 100·0%
·· ·· ·· ·· ·· ·· ·· 580 740 367 1687
Belgium* 11 226 322
100·0%
111 685 6929 10 447 97 316 9057 19 790 42 772 781 720 549 544 110
Bulgaria* 7 201 308
100·0%
53 605 16 329 12 206 26 190 ·· 6226 14 919 ·· 537 298 273 868
Croatia* 4 255 853
100·0%
35 323 5279 7138 22 066 7515 5026 15 421 403 443 231 222 776
Czech Republic*
10 542 666 100·0%
89 989 14 950 18 875 78 581 11 007 9734 36 974 489 531 279 572 368
Denmark* 5 646 899
100·0%
65 840 5755 9024 55 052 8951 8951 27 756 493 574 233 365 105
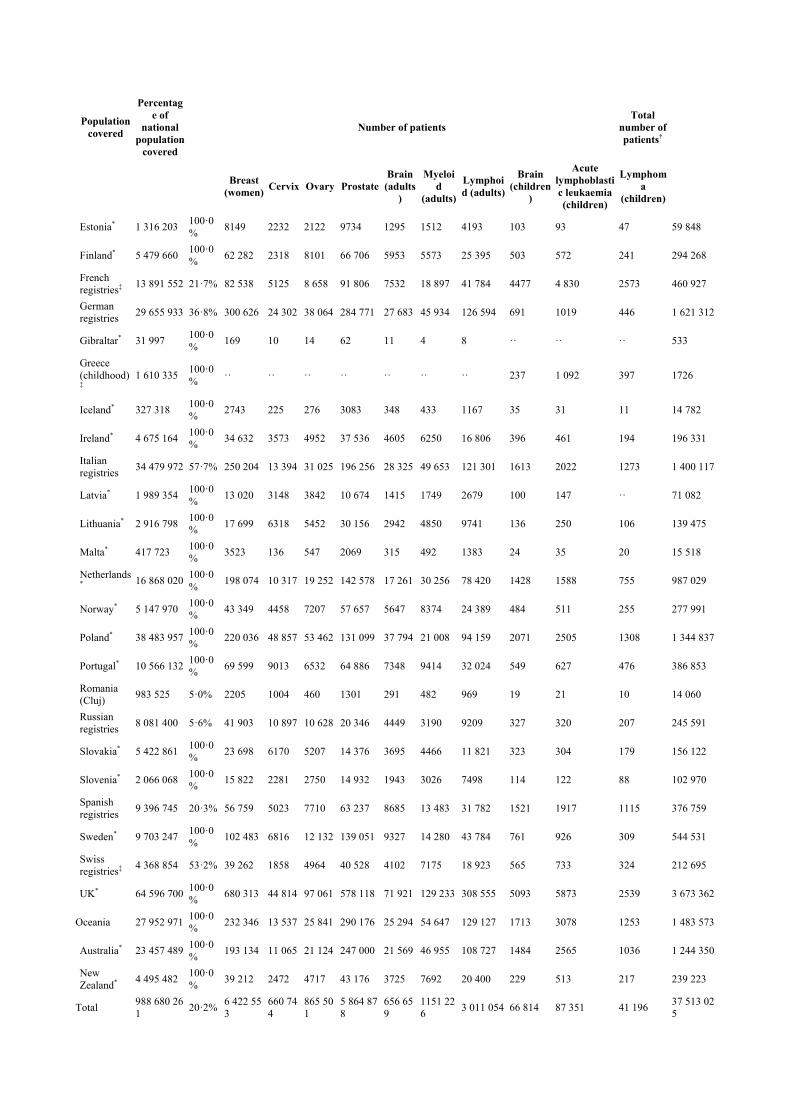
Population
covered
Percentage of
national population
covered
Number of patients Total
number of patients†
Breast
(women) Cervix Ovary Prostate
Brain (adults
)
Myeloid
(adults)
Lymphoid (adults)
Brain (children
)
Acute lymphoblastic leukaemia (children)
Lymphoma
(children)
Estonia* 1 316 203
100·0%
8149 2232 2122 9734 1295 1512 4193 103 93 47 59 848
Finland* 5 479 660
100·0%
62 282 2318 8101 66 706 5953 5573 25 395 503 572 241 294 268
French registries‡
13 891 552 21·7% 82 538 5125 8 658 91 806 7532 18 897 41 784 4477 4 830 2573 460 927
German registries
29 655 933 36·8% 300 626 24 302 38 064 284 771 27 683 45 934 126 594 691 1019 446 1 621 312
Gibraltar* 31 997
100·0%
169 10 14 62 11 4 8 ·· ·· ·· 533
Greece (childhood)‡
1 610 335 100·0%
·· ·· ·· ·· ·· ·· ·· 237 1 092 397 1726
Iceland* 327 318
100·0%
2743 225 276 3083 348 433 1167 35 31 11 14 782
Ireland* 4 675 164
100·0%
34 632 3573 4952 37 536 4605 6250 16 806 396 461 194 196 331
Italian registries
34 479 972 57·7% 250 204 13 394 31 025 196 256 28 325 49 653 121 301 1613 2022 1273 1 400 117
Latvia* 1 989 354
100·0%
13 020 3148 3842 10 674 1415 1749 2679 100 147 ·· 71 082
Lithuania* 2 916 798
100·0%
17 699 6318 5452 30 156 2942 4850 9741 136 250 106 139 475
Malta* 417 723
100·0%
3523 136 547 2069 315 492 1383 24 35 20 15 518
Netherlands*
16 868 020 100·0%
198 074 10 317 19 252 142 578 17 261 30 256 78 420 1428 1588 755 987 029
Norway* 5 147 970
100·0%
43 349 4458 7207 57 657 5647 8374 24 389 484 511 255 277 991
Poland* 38 483 957
100·0%
220 036 48 857 53 462 131 099 37 794 21 008 94 159 2071 2505 1308 1 344 837
Portugal* 10 566 132
100·0%
69 599 9013 6532 64 886 7348 9414 32 024 549 627 476 386 853
Romania (Cluj)
983 525 5·0% 2205 1004 460 1301 291 482 969 19 21 10 14 060
Russian registries
8 081 400 5·6% 41 903 10 897 10 628 20 346 4449 3190 9209 327 320 207 245 591
Slovakia* 5 422 861
100·0%
23 698 6170 5207 14 376 3695 4466 11 821 323 304 179 156 122
Slovenia* 2 066 068
100·0%
15 822 2281 2750 14 932 1943 3026 7498 114 122 88 102 970
Spanish registries
9 396 745 20·3% 56 759 5023 7710 63 237 8685 13 483 31 782 1521 1917 1115 376 759
Sweden* 9 703 247
100·0%
102 483 6816 12 132 139 051 9327 14 280 43 784 761 926 309 544 531
Swiss registries‡
4 368 854 53·2% 39 262 1858 4964 40 528 4102 7175 18 923 565 733 324 212 695
UK* 64 596 700
100·0%
680 313 44 814 97 061 578 118 71 921 129 233 308 555 5093 5873 2539 3 673 362
Oceania 27 952 971 100·0%
232 346 13 537 25 841 290 176 25 294 54 647 129 127 1713 3078 1253 1 483 573
Australia* 23 457 489
100·0%
193 134 11 065 21 124 247 000 21 569 46 955 108 727 1484 2565 1036 1 244 350
New Zealand*
4 495 482 100·0%
39 212 2472 4717 43 176 3725 7692 20 400 229 513 217 239 223
Total 988 680 261
20·2% 6 422 553
660 744
865 501
5 864 878
656 659
1151 226
3 011 054 66 814 87 351 41 196 37 513 025

Populations given are for 2014 or nearest available year. Populations for 2014 are from the UN Population Division28 or national authorities in Australia, Guadeloupe, Hong Kong, Poland, Portugal, and Taiwan (2010). Subnational populations were provided by the registry concerned. Belarus, Greece, and Mexico only provided data for childhood cancers: national populations shown are for children (0–14 years). Mali, Mongolia, and Morocco only provided cancer data for women: national populations shown are for women. Population shown for France excludes Guadeloupe and Martinique.
*Data with 100% coverage of the national population. †Total is for all 18 cancers (see table 4). ‡Data with 100% coverage of the national population for childhood malignancies only.
Coverage is now national in Australia, and contributions from additional registries increased the population coverage in another 14 of the 25 countries that participated in CONCORD-2 with subnational coverage. These are Africa: Algeria (from 1·6% to 6·0%); Central and South America: Brazil (from 5·7% to 7·7%), Chile (from 5·5% to 13·8%), Colombia (from 6·9% to 9·0%), and Ecuador (from 33·8% to 40·2%); North America: the USA (from 83·2% to 85·8%); Asia: Japan (from 29·2% to 40·6%), Thailand (from 5·9% to 20·3%), and Turkey (from 5.4% to 23·4%); Europe: France (from 18·4% to 21·7%), Italy (from 38·6% to 58·3%), Romania (from 3·1% to 5·0%), Russia (from 0·9% to 5·6%), and Switzerland (from 47·4% to 54·7%); and Oceania: Australia (from 90·8% to 100·0%). International coverage has been reduced by the loss of data from Indonesia (Jakarta) and from four countries in Africa: Gambia, Lesotho, Libya, and Tunisia.
Three of the Polish registries that participated in CONCORD-2 now use a different or anglicised name, changing the alphabetical order in the supplementary tables: Holy Cross (formerly Kielce), Lower Silesia (Wrocław), and Subcarpathia (Podkarpackie). All 16 voivodeships of Poland are now included.
Four registries submitted data with wider territorial coverage than before. The Burgundy (Digestive) registry in France submitted data for both the Saône-et-Loire and the Côte-d'Or departments; in Italy, the Biella registry now covers the Vercelli province as well as Biella, and the Milan registry now covers the Milan province and Lodi as well as the city of Milan; and the Cluj registry in Romania expanded coverage from Cluj county to include Bistrița-Năsăud county.
We received more than 4700 datasets. We examined individual cancer registrations for 42 222 177 patients diagnosed with an index cancer during the period 2000–14 (table 3). Of these, 2 690 466 (6·4%) were for an in-situ cancer, mostly of the cervix (54·6% of 1 708 385 women), melanoma of the skin (27·0% of 2 262 368 patients), breast (10·6% of 7 379 194 women), rectum (4·8% of 1 881 039 patients), colon (4·4% of 4 619 844 adults), or prostate (0·6% of 6 069 870 men; appendix pp 6–101). The proportions of in-situ cancer are not directly comparable between countries because some registries still do not record in-situ malignancies, whereas others did not submit data for cancers for which in-situ malignancy is common. The variation between continents is still of interest: for cervical cancer, it ranged from 2·2% in African registries to 23·6% in Central and South American registries, 37·4% in Asian registries, 66·7% in European registries, and 81·9% in Oceania; US registries did not submit data for in-situ cervical cancers and only three Canadian provinces did so. The proportion of in-situ breast cancers varied from 0·2% in African registries to 4-6% in Central and South America, Asia, Europe, and Oceania, and 17·3% in North America (appendix pp 52–56).
Patients with in-situ cancer were not included in survival analyses. We excluded a further 227 038 (0·5%) patients because the year of birth, the month or year of diagnosis, or the year of last known vital status was unknown; and 527 408 (1·2%) patients because the tumour was not a primary, invasive malignancy (behaviour code 3); or the morphology was that of Kaposi's sarcoma or lymphoma in a solid organ; or for other reasons (table 3). The proportion of records excluded for these reasons is shown for each cancer and each cancer registry in the appendix (pp 6–101).

Of the 38 777 265 patients otherwise eligible for inclusion in survival analyses, we excluded 1 132 833 (2·9%) records because the cancer was registered only from a death certificate or discovered at autopsy (table 3) and a further 131 407 (0·3%) for other reasons. These reasons included definite errors (unknown vital status, unknown sex, sex-site error, and invalid dates or sequence of dates) and possible errors, such as apparent inconsistencies between age, cancer site, and morphology (details on request). For example, we excluded hepatoblastomas in children older than 6 years and multiple myeloma in people aged less than 20 years, unless the record was confirmed as correct by the registry concerned.
Among the 37 513 025 patients available for survival analyses for all cancers combined (96·7% of those eligible for inclusion), pathological evidence of malignancy (histology, cytology, or haematology) was available for 35 502 123 (94·6%). This proportion ranged from 88·6% in Asia, 91·6% in Africa, and 92·4% in Central and South America up to 94–98% in Europe, Oceania, and North America (table 3). Continental variation was much wider for some cancers (appendix pp 6–101).
In what follows, we present results in a similar structure for each group of cancers. Differences between survival estimates are given as the arithmetic difference: for example, 12% is 2% (not 20%) higher than 10%. We use flags in the figures (Figure 2, Figure 3) and tables (Table 6, Table 7) to indiate where survival estimates are based on national population coverage, are unstandardised, or are considered less reliable. Where relevant, we mention in the text only reliable, age-standardised survival estimates. Where possible, we also present graphics of national trends in cancer survival over the 20-year period 1995–2014. Estimates for patients diagnosed during 1995–99 are for countries that provided data for one of the ten cancers included in CONCORD-2.6
Table 6. Age-standardised 5-year net survival (%) with 95% CI: adults (15–99 years) diagnosed with one of eight common malignancies (oesophagus, stomach, colon, rectum, liver, pancreas, lung, or melanoma of the skin) by continent, country, and calendar period of diagnosis
Gastrointestinal cancers Lung
Melanoma of the skin
Oesophagus Stomach Colon Rectum Liver Pancreas
Africa
Algeria (three registries)
2000–04
·· 20·7§ (14·3–27·1)
88·1§ (80·1–96·0)
63·4§ (48·3–78·5)
6·2†§ (0·0–13·7)
8·3†§ (0·0–20·3)
18·0§ (14·0–22·0)
6·9†§ (0·0–18·5)
2005–09
55·4†§ (36·4–74·5)
42·4§ (36·4–48·4)
76·7§ (69·6–83·9)
64·5§ (56·4–72·7)
13·9§ (8·6–19·2)
30·2§ (21·3–39·2)
30·2§ (25·7–34·8)
63·4§ (59·4–67·3)
2010–14
37·3§ (23·4–51·1)
41·6§ (35·5–47·7)
74·2§ (65·7–82·7)
67·3§ (58·0–76·5)
13·5§ (6·9–20·1)
29·8§ (18·7–40·9)
33·7§ (28·5–38·9)
54·9§ (47·3–62·6)
Mali (Bamako)
2000–04
·· ·· ·· ·· ·· ·· ·· ··
2005–09
·· ·· ·· ·· ·· ·· ·· ··
2010–14
·· ·· ·· ·· ·· ·· ·· ··
Mauritius*
2000–04
·· ·· ·· ·· ·· ·· ·· ··
2005–09
·· 44·3 (36·8–51·7)
65·9 (56·7–75·1)
83·6§ (75·0–92·1)
·· ·· 31·7 (25·9–37·6)
··
2010–14
28·1† (14·6–41·5)
25·7 (18·0–33·3)
57·9 (48·5–67·2)
72·9§ (62·7–83·0)
17·0† (2·6–31·3)
24·5† (11·4–37·6)
20·4 (13·2–27·7)
··
Morocco (Casablanca)
2000–04
·· ·· ·· ·· ·· ·· ·· ··
2005–09
·· ·· ·· ·· ·· ·· ·· ··

Gastrointestinal cancers Lung
Melanoma of the skin
Oesophagus Stomach Colon Rectum Liver Pancreas
2010–14
·· ·· ·· ·· ·· ·· ·· ··
Nigeria (Ibadan)
2000–04
·· ·· ·· ·· ·· ·· ·· ··
2005–09
·· ·· 41·2†§ (16·9–65·6)
25·9†§ (0·0–53·7)
·· ··
100·0†§ (100·0–100·0)
2010–14
·· ·· 17·4†§ (0·1–34·8)
16·9†§ (0·0–37·8)
·· ·· ·· 97·7†§ (74·6–100·0)
South Africa (Eastern Cape)
2000–04
12·1†§ (0·0–27·0)
·· ·· ·· 27·1†§ (0·0–57·1)
·· ·· ··
2005–09
19·2§ (12·0–26·4)
25·0†§ (6·1–44·0)
31·9†§ (10·7–53·1)
19·9†§ (0·0–46·4)
·· ·· 16·7†§ (0·8–32·5)
··
2010–14
18·0§ (12·6–23·4)
25·6†§ (7·2–43·9)
12·3§ (4·3–20·2)
9·1†§ (0·0–21·5) 0·0†§ (0·0–0·0)21·8†§ (0·0–49·5)
15·0§ (6·1–24·0)
16·7†§ (0·0–41·0)
America (Central and South)
Argentina (five registries)‡
2000–04
18·7§ (12·7–24·8)
21·7§ (17·1–26·2)
54·2§ (49·7–58·7)
48·9 (41·5–56·3)
14·1§ (6·0–22·1)
9·6§ (5·5–13·6)19·5§ (15·5–23·5)
68·4 (60·6–76·3)
2005–09
15·0§ (11·4–18·6)
19·3§ (16·9–21·7)
51·2§ (49·0–53·5)
47·5 (43·3–51·7)
11·4§ (8·2–14·5)
8·3§ (6·0–10·7)12·4§ (10·9–14·0)
68·1 (63·4–72·9)
2010–14
16·4§ (11·9–21·0)
21·5§ (18·5–24·4)
54·4§ (51·8–57·1)
49·9 (45·3–54·4)
12·6§ (8·7–16·6)
11·4§ (8·1–14·6)
13·1§ (11·2–15·1)
71·0 (65·6–76·4)
Brazil (six registries)
2000–04
10·7§ (9·0–12·4) 19·1§ (17·9–20·3)
44·5§ (42·9–46·0)
37·7§ (35·7–39·6)
15·4§ (10·4–20·5)
3·9§ (3·0–4·9) 10·7 (8·3–13·1)
76·7 (71·5–81·8)
2005–09
12·5§ (10·6–14·5)
24·7§ (23·2–26·2)
50·6§ (49·3–52·0)
45·7§ (43·7–47·8)
9·6§ (6·5–12·8)
9·1§ (7·3–10·9) 7·8 (5·8–9·8) 75·9 (71·7–80·1)
2010–14
9·7§ (7·9–11·4) 20·6§ (18·9–22·2)
48·3§ (46·7–49·9)
42·4§ (40·1–44·6)
11·2§ (7·6–14·7)
9·5§ (7·4–11·5) 8·5 (5·3–11·6) 70·0 (65·4–74·7)
Chile (four registries)
2000–04
7·0 (3·1–10·9) 14·5 (11·7–17·4)
35·5 (28·6–42·3)
35·9 (26·3–45·5)
3·6†§ (0·0–7·4) 2·2 (0·2–4·2) 7·1§ (4·4–9·8) 57·4 (46·6–68·1)
2005–09
10·8 (7·5–14·1) 16·3 (14·7–18·0)
47·1 (43·1–51·0)
39·5 (33·9–45·0)
2·7§ (1·0–4·4) 3·6 (1·9–5·4) 6·3§ (4·7–7·8) 64·4 (54·4–74·4)
2010–14
8·7 (0·3–17·0) 16·7 (14·2–19·3)
43·9§ (39·3–48·5)
32·7§ (26·6–38·8)
3·7§ (0·7–6·8) 4·4† (1·0–7·8) 4·6§ (3·0–6·2) 59·7§ (49·4–69·9)
Colombia (four registries)
2000–04
10·7§ (5·6–15·8) 18·4 (16·0–20·9)
45·0 (40·6–49·4)
38·3 (32·9–43·7)
4·8§ (1·8–7·9) 6·4§ (3·5–9·4) 9·4 (7·2–11·5) 63·1§ (57·0–69·1)
2005–09
9·5 (4·6–14·4) 17·7 (16·2–19·3)
41·3 (37·9–44·7)
37·2 (32·7–41·7)
5·4 (3·1–7·7) 3·4 (1·6–5·2) 10·5 (8·5–12·5)
71·3§ (66·2–76·5)
2010–14
10·5§ (3·9–17·1) 17·1§ (15·4–18·8)
34·5§ (31·2–37·9)
38·0§ (33·2–42·8)
5·2§ (2·7–7·8) 5·3§ (2·8–7·8) 8·7§ (6·7–10·6)
65·1§ (59·2–71·1)
Costa Rica*
2000–04
35·7§ (26·3–45·1)
48·4 (45·5–51·2)
63·8 (59·5–68·1)
48·4 (41·3–55·6)
39·0§ (32·4–45·6)
38·1§ (31·3–44·8)
36·2§ (31·0–41·5)
82·6 (77·2–88·1)
2005–09
19·2§ (11·3–27·1)
38·4 (36·3–40·5)
55·1 (52·2–58·0)
50·2 (45·2–55·2)
23·6§ (18·5–28·7)
23·8§ (19·1–28·6)
22·0§ (19·0–25·1)
76·2 (71·5–80·8)
2010–14
20·9§ (14·3–27·6)
40·6 (38·5–42·7)
60·1 (57·4–62·8)
53·9 (49·2–58·5)
24·1§ (19·7–28·5)
24·5§ (19·5–29·5)
20·1§ (17·1–23·1)
77·2 (72·7–81·7)
Cuba*
2000–04
·· 17·2§ (15·7–18·7)
39·8§ (38·3–41·2)
·· ·· ·· 4·5§ (3·8–5·1) ··
2005–09
·· 25·6§ (23·6–27·5)
48·5§ (46·9–50·1)
·· ·· ·· 23·2§ (22·1–24·2)
··
2010–14
·· 35·7§ (32·8–38·6)
63·9§ (61·6–66·2)
·· ·· ·· 30·1§ (28·4–31·8)
··
Ecuador (five registries)
2000–04
20·9† (9·9–31·9) 17·8 (12·3–23·3)
47·7 (41·0–54·4)
38·7 (30·4–47·1)
8·1§ (4·6–11·5)
8·4§ (4·7–12·2)10·1§ (7·2–13·0)
59·0 (50·9–67·1)

Gastrointestinal cancers Lung
Melanoma of the skin
Oesophagus Stomach Colon Rectum Liver Pancreas
2005–09
7·7 (3·5–11·9) 17·4 (12·0–22·7)
46·7 (42·9–50·5)
43·5 (38·8–48·2)
6·3§ (4·1–8·6) 9·0§ (6·2–11·8)10·5§ (8·5–12·4)
60·5 (54·5–66·5)
2010–14
12·7 (6·7–18·7) 19·1 (13·1–25·1)
47·8 (43·9–51·6)
44·5 (39·2–49·8)
5·9§ (3·9–7·8) 8·4§ (5·7–11·2)12·2§ (10·0–14·4)
57·9 (51·6–64·1)
Guadeloupe*
2000–04
·· ·· ·· ·· ·· ·· ·· ··
2005–09
0·0† (0·0–0·1) 11·7§ (5·7–17·7)
30·9§ (23·1–38·7)
21·3§ (8·8–33·8)
9·5†§ (0·0–20·3)
11·2†§ (1·7–20·8)
6·8 (2·3–11·2) 86·2†§ (53·0–100·0)
2010–14
·· 11·7§ (6·8–16·6)
26·8§ (19·5–34·0)
35·6§ (22·4–48·8)
3·7†§ (0·0–9·2) ·· 4·0§ (0·2–7·7) 14·1†§ (0·0–36·7)
Martinique*
2000–04
4·2† (0·4–8·1) 29·7 (24·2–35·2)
57·0 (50·4–63·6)
44·1 (35·1–53·1)
12·0 (5·6–18·4)
13·4 (7·8–19·1)12·5 (7·6–17·4)
81·8†§ (68·5–95·1)
2005–09
4·9 (1·1–8·7) 33·0 (27·5–38·5)
54·9 (49·5–60·3)
54·0 (46·0–62·1)
12·4 (5·6–19·1)
6·9 (3·2–10·5) 14·7 (10·4–18·9)
86·4†§ (74·7–98·2)
2010–14
4·0† (1·8–6·3) 32·1 (24·5–39·6)
53·6 (46·9–60·3)
52·0 (42·2–61·7)
15·6 (7·2–23·9)
11·9 (6·5–17·3)11·8 (6·4–17·2)
77·8§ (61·3–94·3)
Peru (Lima)
2000–04
·· ·· ·· ·· ·· ·· ·· ··
2005–09
·· ·· ·· ·· ·· ·· ·· ··
2010–14
·· ·· 59·0 (55·8–62·1)
54·8 (50·0–59·5)
·· ·· ·· ··
Puerto Rico*
2000–04
10·9 (8·5–13·4) 26·6 (24·1–29·1)
60·9 (59·3–62·5)
53·9 (50·9–57·0)
11·8§ (9·0–14·6)
8·8§ (6·3–11·2)14·7§ (13·1–16·3)
73·3 (68·2–78·4)
2005–09
13·0 (10·1–15·9) 29·9 (27·3–32·5)
62·1 (60·6–63·5)
59·4 (56·6–62·3)
8·7§ (6·9–10·5)
9·0§ (6·9–11·1)16·0 (14·5–17·5)
75·4 (70·6–80·1)
2010–14
20·4 (14·8–25·9) 34·6 (30·3–39·0)
63·4 (61·1–65·7)
59·0 (54·6–63·4)
14·2§ (10·4–18·0)
10·2§ (7·1–13·3)
17·6 (14·9–20·3)
75·1 (68·2–81·9)
Uruguay*
2000–04
·· ·· ·· ·· ·· ·· ·· ··
2005–09
12·0§ (8·4–15·6) 20·5 (17·5–23·5)
57·7 (55·0–60·4)
50·5 (46·3–54·6)
12·0§ (4·4–19·7)
4·3§ (2·3–6·3) 9·9§ (8·3–11·5)
··
2010–14
8·0§ (5·3–10·7) 18·5§ (15·4–21·5)
53·5 (49·2–57·7)
50·1 (44·8–55·4)
14·3§ (8·0–20·6)
4·4§ (3·0–5·8) 9·0§ (7·4–10·6)
··
America (North)
Canada (nine registries)
2000–04
14·5 (13·4–15·6) 25·1 (24·2–26·0)
61·6 (61·1–62·1)
61·9 (61·1–62·8)
17·4 (16·2–18·5)
7·9 (7·3–8·5) 16·3 (15·9–16·6)
87·9 (87·3–88·6)
2005–09
14·7 (13·7–15·7) 26·6 (25·7–27·5)
65·7 (65·2–66·2)
65·5 (64·7–66·3)
19·2 (18·2–20·2)
9·4 (8·8–10·0) 18·5 (18·1–18·8)
88·5 (88·0–89·1)
2010–14
16·1 (15·1–17·1) 29·6 (28·6–30·5)
67·0 (66·5–67·5)
66·8 (66·0–67·5)
18·7 (17·8–19·7)
10·8 (10·2–11·4)
20·6 (20·2–20·9)
89·1 (88·6–89·6)
USA (48 registries)
2000–04
16·5 (16·1–16·8) 26·2 (25·8–26·5)
64·7 (64·5–64·9)
63·9 (63·5–64·2)
12·5 (12·2–12·8)
7·2 (7·0–7·4) 17·0 (16·9–17·1)
88·9 (88·7–89·1)
2005–09
18·7 (18·4–19·1) 30·1 (29·7–30·4)
65·5 (65·3–65·7)
64·5 (64·1–64·8)
15·6 (15·3–15·9)
8·9 (8·7–9·1) 19·4 (19·3–19·5)
90·4 (90·2–90·6)
2010–14
20·0 (19·6–20·4) 33·1 (32·7–33·4)
64·9 (64·7–65·1)
64·1 (63·7–64·4)
17·4 (17·1–17·7)
11·5 (11·3–11·7)
21·2 (21·1–21·3)
90·8 (90·6–91·0)
Asia
China (21 registries)
2000–04
22·9 (22·0–23·9) 30·2 (29·3–31·1)
51·4 (49·6–53·3)
49·5 (47·5–51·4)
11·7 (10·9–12·5)
14·4 (12·8–16·0)
18·7 (18·0–19·4)
35·6 (25·8–45·4)
2005–09
27·1 (26·5–27·7) 33·2 (32·7–33·7)
55·6 (54·6–56·5)
52·5 (51·5–53·6)
11·6 (11·1–12·0)
10·2 (9·4–11·0)17·7 (17·4–18·1)
45·5 (40·8–50·2)
2010–14
29·7 (29·0–30·4) 35·9 (35·3–36·5)
57·6 (56·6–58·6)
56·9 (55·8–58·0)
14·1 (13·6–14·7)
9·9 (9·1–10·7) 19·8 (19·4–20·2)
49·6 (44·5–54·6)

Gastrointestinal cancers Lung
Melanoma of the skin
Oesophagus Stomach Colon Rectum Liver Pancreas
Cyprus*
2000–04
·· 36·6† (22·2–51·1)
70·7§ (61·8–79·6)
61·9†§ (43·0–80·8)
8·4†§ (0·0–21·0)
12·8†§ (1·7–23·9)
18·3 (12·2–24·3)
89·0†§ (73·6–100·0)
2005–09
47·2†§ (30·5–63·8)
28·1§ (22·9–33·3)
67·6§ (63·9–71·4)
78·3§ (71·3–85·4)
13·3†§ (6·3–20·2)
8·0§ (4·5–11·6)18·2 (15·6–20·8)
82·1§ (75·8–88·4)
2010–14
39·0†§ (21·8–56·3)
35·6§ (30·0–41·2)
72·1§ (68·5–75·8)
75·9§ (69·6–82·2)
10·6§ (5·8–15·5)
11·6§ (7·7–15·5)
18·7 (16·2–21·2)
79·0§ (73·1–85·0)
Hong Kong*
2000–04
·· ·· ·· ·· ·· ·· ·· ··
2005–09
·· ·· 56·1 (55·1–57·1)
57·3 (55·8–58·7)
·· ·· ·· ··
2010–14
·· ·· 56·4 (55·4–57·3)
58·0 (56·6–59·4)
·· ·· ·· ··
India (two registries)
2000–04
2·9† (0·0–6·4) 6·4 (2·5–10·3) 46·9† (31·9–61·8)
36·9† (16·1–57·8)
2·4† (0·0–6·0) 4·2† (0·0–10·5) 6·9 (2·3–11·5) ··
2005–09
3·4 (0·7–6·0) 9·8 (3·4–16·3) 33·8† (21·1–46·4)
33·6 (20·8–46·3)
3·7 (0·0–7·7) 5·3† (0·0–11·4) 3·5 (1·4–5·7) ··
2010–14
4·1 (0·0–8·5) 8·9 (4·0–13·9) 38·9 (24·6–53·3)
30·0 (20·5–39·5)
6·3† (0·6–11·9)
5·6† (0·0–11·6) 3·7 (1·6–5·7) 61·5† (27·3–95·8)
Iran (Golestan)
2000–04
·· ·· ·· ·· ·· ·· ·· ··
2005–09
7·4 (4·8–10·0) 5·7 (3·3–8·0) 29·1 (20·2–38·0)
26·2† (14·1–38·3)
·· ·· ·· ··
2010–14
·· ·· ·· ·· ·· ·· ·· ··
Israel*
2000–04
17·9 (14·3–21·5) 29·3 (27·6–31·1)
66·5 (65·4–67·6)
62·7 (60·6–64·7)
15·1§ (12·2–17·9)
7·6§ (6·4–8·8) 20·8 (19·8–21·8)
85·6 (84·2–87·0)
2005–09
22·4 (18·6–26·2) 29·8 (28·1–31·5)
71·4 (70·3–72·4)
67·3 (65·3–69·3)
15·6§ (13·1–18·2)
9·2§ (8·0–10·5)23·8 (22·8–24·8)
88·4 (87·2–89·7)
2010–14
25·8 (21·4–30·2) 32·3 (30·4–34·3)
71·7 (70·6–72·9)
67·8 (65·6–70·0)
18·9§ (15·6–22·2)
12·4§ (10·8–14·0)
26·6 (25·4–27·7)
87·4 (86·1–88·8)
Japan (16 registries)
2000–04
27·7 (26·4–29·0) 50·5 (50·0–50·9)
63·4 (62·7–64·0)
58·6 (57·6–59·5)
25·7§ (25·1–26·3)
6·9§ (6·4–7·4) 29·3 (28·1–30·5)
68·9 (65·1–72·8)
2005–09
33·3 (32·3–34·2) 57·6 (57·3–57·9)
66·8 (66·3–67·3)
64·0 (63·3–64·6)
28·6§ (28·1–29·1)
7·6§ (7·2–7·9) 29·3 (28·9–29·7)
68·3 (65·6–71·0)
2010–14
36·0 (34·8–37·3) 60·3 (59·9–60·7)
67·8 (67·3–68·4)
64·8 (64·0–65·7)
30·1§ (29·5–30·6)
8·3§ (7·8–8·7) 32·9 (32·3–33·4)
69·0 (66·0–72·0)
Jordan*
2000–04
52·6§ (41·3–63·9)
76·1§ (69·7–82·5)
86·0§ (81·6–90·5)
79·9§ (71·1–88·8)
71·5§ (58·1–84·9)
66·9§ (52·0–81·8)
42·9§ (38·3–47·4)
68·5†§ (56·4–80·6)
2005–09
53·9§ (43·0–64·8)
64·8§ (58·4–71·3)
80·8§ (77·0–84·7)
76·2§ (67·1–85·3)
64·3§ (54·5–74·1)
32·5§ (25·6–39·4)
44·1§ (39·4–48·7)
63·1†§ (49·3–76·9)
2010–14
41·1§ (30·4–51·9)
55·7§ (48·7–62·6)
76·1§ (72·1–80·1)
73·2§ (65·0–81·4)
40·0§ (28·6–51·3)
24·0§ (18·7–29·3)
28·3§ (24·9–31·6)
55·9§ (41·5–70·4)
Korea*
2000–04
18·6 (17·6–19·6) 48·6 (48·2–48·9)
60·5 (59·9–61·2)
60·8 (60·0–61·6)
15·3 (15·0–15·7)
7·6 (7·2–8·1) 15·3 (15·0–15·6)
51·4 (48·3–54·4)
2005–09
26·9 (25·8–28·0) 61·1 (60·8–61·5)
68·1 (67·6–68·6)
68·1 (67·5–68·7)
22·4 (22·1–22·8)
8·4 (8·0–8·9) 19·9 (19·6–20·2)
55·3 (52·8–57·7)
2010–14
31·3 (30·3–32·4) 68·9 (68·6–69·2)
71·8 (71·4–72·2)
71·1 (70·6–71·7)
27·2 (26·8–27·6)
10·5 (10·0–10·9)
25·1 (24·8–25·4)
59·9 (57·5–62·2)
Kuwait*
2000–04
17·6†§ (2·9–32·4)
15·0 (7·1–22·9) 64·8 (53·1–76·5)
59·3 (48·1–70·4)
11·4†§ (3·5–19·2)
11·2†§ (3·1–19·3)
13·3 (8·9–17·7)
··
2005–09
9·5† (0·0–20·6) 13·4 (7·1–19·7) 50·2 (42·7–57·7)
53·3 (42·4–64·2)
12·4† (5·8–19·1)
7·0 (3·0–11·0) 16·3 (11·1–21·5)
··
2010– 25·4† (10·5– 22·4 (12·6– 58·5 (49·4– 58·2 (48·5– 18·6 (9·8– 23·6 (12·0– 13·4 (8·8– ··

Gastrointestinal cancers Lung
Melanoma of the skin
Oesophagus Stomach Colon Rectum Liver Pancreas
14 40·4) 32·3) 67·7) 67·9) 27·3) 35·2) 18·0)
Malaysia (Penang)
2000–04
·· ·· ·· ·· ·· ·· ·· ··
2005–09
13·2 (6·5–19·9) 23·2 (17·5–29·0)
54·9 (49·2–60·6)
37·3 (30·1–44·5)
6·4 (3·7–9·1) 8·9 (4·5–13·3) 6·8 (4·9–8·7) ··
2010–14
13·7† (3·8–23·6) 30·0 (22·9–37·0)
55·9 (46·1–65·8)
58·0 (46·6–69·4)
9·6† (3·9–15·2)
19·0 (12·0–26·0)
10·1 (7·1–13·2)
··
Mongolia*
2000–04
·· ·· ·· ·· ·· ·· ·· ··
2005–09
·· ·· ·· ·· ·· ·· ·· ··
2010–14
·· ·· ·· ·· ·· ·· ·· ··
Qatar*
2000–04
36·1†§ (10·3–61·9)
15·0§ (2·0–28·0)
62·1§ (50·1–74·1)
67·8†§ (48·7–86·9)
7·1§ (2·6–11·5)
9·9†§ (0·0–21·2)
7·4†§ (0·8–14·1)
77·5†§ (48·0–100·0)
2005–09
33·4†§ (9·4–57·5)
22·0§ (12·2–31·7)
64·3§ (47·6–80·9)
60·5§ (46·7–74·3)
10·3†§ (3·2–17·3)
4·2†§ (0·0–10·4)
14·3§ (7·4–21·2)
30·1†§ (0·0–65·3)
2010–14
42·2†§ (9·4–75·0)
17·5§ (9·7–25·3)
63·5§ (51·7–75·2)
43·6§ (31·2–56·1)
27·2§ (12·9–41·5)
16·6§ (7·2–26·1)
17·2§ (10·3–24·2)
99·7†§ (84·7–100·0)
Singapore*
2000–04
9·0 (6·2–11·8) 25·4 (23·3–27·4)
56·1 (54·4–57·8)
51·4 (48·5–54·2)
13·2 (11·6–14·9)
5·3 (3·6–7·0) 10·3 (9·4–11·2)
62·8 (51·0–74·6)
2005–09
10·5 (7·4–13·5) 27·1 (25·0–29·2)
60·3 (58·7–61·8)
59·0 (56·3–61·8)
20·4 (18·6–22·2)
6·7 (5·1–8·3) 13·0 (12·0–13·9)
59·0 (50·5–67·5)
2010–14
14·8 (11·1–18·4) 30·3 (28·2–32·4)
61·7 (60·2–63·2)
60·5 (58·0–63·0)
24·7 (22·8–26·6)
9·4 (7·6–11·2) 15·5 (14·5–16·5)
60·0 (51·7–68·2)
Taiwan*
2000–04
13·0 (12·0–13·9) 35·6 (34·8–36·4)
56·8 (56·0–57·5)
57·7 (56·8–58·7)
19·5 (19·1–19·9)
7·0 (6·3–7·7) 11·6 (11·2–12·0)
48·6 (44·6–52·6)
2005–09
13·2 (12·3–14·1) 36·7 (35·9–37·5)
60·4 (59·8–61·0)
61·5 (60·6–62·3)
24·4 (24·0–24·8)
6·5 (5·9–7·1) 16·0 (15·6–16·4)
53·3 (49·7–56·9)
2010–14
15·5 (14·6–16·4) 38·6 (37·8–39·4)
62·6 (62·0–63·1)
62·5 (61·7–63·3)
27·9 (27·5–28·4)
7·7 (7·0–8·3) 20·6 (20·2–21·0)
52·1 (48·5–55·6)
Thailand (six registries)
2000–04
8·8§ (6·6–11·1) 22·3§ (18·7–25·8)
39·8§ (37·2–42·5)
43·0§ (38·5–47·4)
7·7§ (6·9–8·6) 6·9§ (5·1–8·7) 10·2§ (9·3–11·1)
44·7§ (34·4–55·0)
2005–09
7·8 (5·9–9·7) 16·1 (13·9–18·3)
42·8 (41·1–44·6)
38·6 (36·0–41·1)
7·9 (7·3–8·6) 9·6 (7·7–11·5) 10·3 (9·6–11·1)
37·9§ (30·6–45·2)
2010–14
7·1 (5·1–9·1) 12·5 (10·7–14·3)
47·0 (45·2–48·8)
44·4 (41·8–47·1)
6·9 (6·3–7·5) 6·8 (5·3–8·2) 8·6 (7·9–9·2) 29·9§ (23·7–36·1)
Turkey (nine registries)
2000–04
14·8§ (9·2–20·4) 21·9§ (18·5–25·4)
52·9§ (49·1–56·7)
48·5 (43·9–53·0)
20·1§ (15·0–25·2)
10·9§ (7·8–14·1)
11·9§ (10·6–13·3)
60·9§ (53·2–68·6)
2005–09
14·7 (12·9–16·5) 21·4 (20·3–22·4)
52·7 (51·3–54·2)
49·3 (47·3–51·3)
14·9 (12·9–17·0)
9·5 (8·4–10·7) 12·7 (12·2–13·2)
57·7 (54·6–60·9)
2010–14
19·0 (16·9–21·1) 24·6 (23·6–25·6)
55·2 (53·8–56·6)
52·6 (50·6–54·5)
15·9 (14·0–17·8)
10·4 (9·3–11·5)14·9 (14·3–15·4)
60·7 (57·6–63·7)
Europe
Austria*
2000–04
16·2 (14·2–18·3) 30·0 (28·7–31·3)
60·7 (59·7–61·7)
60·2 (58·9–61·5)
11·2 (10·0–12·4)
6·7§ (5·9–7·5) 15·4 (14·8–16·0)
83·4 (82·2–84·7)
2005–09
16·8 (15·0–18·7) 34·2 (32·9–35·6)
63·5 (62·5–64·4)
63·5 (62·2–64·8)
14·2§ (12·9–15·6)
8·5 (7·7–9·4) 18·0 (17·4–18·6)
84·6 (83·5–85·8)
2010–14
18·6 (16·6–20·6) 35·4 (34·0–36·9)
63·7 (62·7–64·7)
64·2 (62·9–65·6)
14·8§ (13·4–16·2)
10·5§ (9·5–11·4)
19·7 (19·1–20·4)
87·8 (86·7–88·8)
Belgium*
2000–04
16·6 (13·8–19·4) 29·3 (26·4–32·2)
64·3 (62·7–66·0)
62·9 (60·4–65·4)
21·3 (16·8–25·8)
8·9 (6·9–10·8) 15·4 (14·4–16·4)
86·3 (83·9–88·7)

Gastrointestinal cancers Lung
Melanoma of the skin
Oesophagus Stomach Colon Rectum Liver Pancreas
2005–09
23·2 (21·7–24·7) 35·8 (34·4–37·1)
65·0 (64·3–65·7)
65·3 (64·3–66·4)
20·6 (19·0–22·3)
10·5 (9·6–11·4)17·0 (16·5–17·4)
88·9 (87·9–89·8)
2010–14
23·6 (22·1–25·0) 37·5 (36·2–38·9)
67·9 (67·2–68·6)
66·6 (65·6–67·6)
20·7 (19·2–22·2)
12·4 (11·4–13·3)
18·2 (17·7–18·6)
91·0 (90·1–91·8)
Bulgaria*
2000–04
·· 11·2§ (10·3–12·0)
43·9 (42·7–45·2)
37·0 (35·6–38·4)
4·0§ (2·9–5·1) ·· 5·8 (5·3–6·3) 50·8 (47·9–53·8)
2005–09
·· 13·9 (13·0–14·9)
48·5 (47·4–49·6)
42·1 (40·7–43·5)
4·6§ (3·5–5·6) ·· 7·0 (6·5–7·6) 56·0 (53·3–58·6)
2010–14
·· 16·0 (14·9–17·0)
52·4 (51·3–53·6)
45·9 (44·4–47·4)
6·5§ (5·1–7·9) ·· 7·7 (7·1–8·2) 61·2 (58·8–63·7)
Croatia*
2000–04
6·8 (4·9–8·7) 19·7 (18·4–20·9)
47·3 (45·9–48·7)
44·4 (42·7–46·1)
9·2§ (7·6–10·7)
9·1 (7·9–10·4) 11·2 (10·5–11·9)
66·4 (64·0–68·8)
2005–09
9·1 (6·9–11·2) 18·9 (17·6–20·2)
49·5 (48·2–50·8)
47·1 (45·5–48·7)
9·2§ (7·7–10·8)
8·2 (7·0–9·4) 10·6 (10·0–11·3)
74·7 (72·7–76·7)
2010–14
8·7 (6·6–10·8) 20·0 (18·6–21·3)
51·1 (49·9–52·4)
48·2 (46·5–49·8)
9·3§ (7·7–10·9)
8·4§ (7·1–9·7) 10·0 (9·3–10·6)
77·2 (75·3–79·1)
Czech Republic*
2000–04
7·3 (6·0–8·6) 18·7 (17·7–19·7)
48·0 (47·3–48·8)
43·8 (42·6–44·9)
3·0 (2·3–3·6) 3·6 (3·0–4·1) 8·6 (8·2–9·0) 80·7 (79·5–81·8)
2005–09
9·0 (7·5–10·5) 19·3 (18·3–20·3)
52·0 (51·3–52·7)
47·9 (46·8–49·0)
5·3 (4·5–6·2) 4·7 (4·1–5·3) 9·8 (9·4–10·3) 84·6 (83·7–85·6)
2010–14
9·8 (8·3–11·4) 20·6 (19·6–21·6)
56·1 (55·4–56·9)
52·3 (51·2–53·4)
6·7 (5·6–7·7) 6·1 (5·4–6·7) 10·6 (10·2–11·1)
85·7 (84·8–86·6)
Denmark*
2000–04
8·4 (6·9–9·8) 14·7 (13·2–16·3)
51·5 (50·4–52·6)
53·2 (51·7–54·7)
4·4 (3·1–5·8) 3·8 (3·0–4·5) 9·5 (9·0–10·1) 87·3 (86·0–88·5)
2005–09
10·4 (8·9–11·9) 15·4 (13·9–16·9)
56·5 (55·5–57·6)
59·8 (58·4–61·1)
5·6 (4·2–7·0) 5·6 (4·7–6·4) 12·3 (11·7–12·8)
89·1 (88·1–90·0)
2010–14
13·7 (12·0–15·4) 19·9 (18·1–21·6)
61·6 (60·6–62·7)
64·8 (63·4–66·1)
7·5 (5·9–9·1) 8·0 (7·0–9·1) 16·6 (16·0–17·3)
91·1 (90·2–91·9)
Estonia*
2000–04
5·7 (2·8–8·6) 22·3 (20·2–24·4)
48·9 (46·2–51·5)
46·4 (42·9–49·9)
5·5§ (2·8–8·3) 4·8 (3·2–6·5) 10·8 (9·5–12·2)
71·4 (67·0–75·8)
2005–09
6·0 (3·5–8·5) 24·2 (22·1–26·4)
53·8 (51·3–56·3)
50·5 (46·9–54·1)
6·5 (3·9–9·2) 5·4 (3·8–7·0) 14·3 (12·6–15·9)
75·2 (71·7–78·8)
2010–14
5·4 (2·3–8·5) 29·2 (26·1–32·3)
58·4 (55·2–61·6)
54·8 (50·1–59·5)
4·2 (1·8–6·6) 10·2 (7·0–13·4)16·9 (14·9–19·0)
81·8 (77·6–86·0)
Finland*
2000–04
11·8 (9·5–14·1) 26·0 (24·3–27·6)
61·3 (59·9–62·8)
59·9 (58·0–61·9)
7·1 (5·5–8·8) 4·1 (3·2–4·9) 11·9 (11·0–12·7)
84·8 (83·3–86·4)
2005–09
12·8 (10·6–15·0) 25·1 (23·4–26·8)
63·2 (61·9–64·5)
63·8 (62·0–65·6)
9·1§ (7·3–10·8)
7·3 (6·2–8·5) 12·1 (11·3–13·0)
87·4 (86·2–88·6)
2010–14
12·4 (10·5–14·4) 25·7 (23·9–27·5)
64·9 (63·7–66·2)
64·4 (62·6–66·1)
10·4§ (8·5–12·2)
7·4§ (6·3–8·4) 13·0 (12·1–13·9)
88·7 (87·6–89·8)
France (23 registries)‡
2000–04
13·0 (11·8–14·2) 26·3 (24·9–27·7)
60·7 (59·8–61·5)
58·3 (56·9–59·6)
14·0 (12·9–15·1)
7·8 (6·9–8·7) 14·1 (13·5–14·6)
89·7 (88·5–90·9)
2005–09
14·9 (13·6–16·1) 27·1 (25·8–28·4)
63·6 (62·8–64·3)
60·7 (59·5–61·9)
16·5 (15·4–17·6)
9·0 (8·2–9·8) 16·2 (15·7–16·7)
90·9 (89·9–91·9)
2010–14
13·9 (11·4–16·4) 26·7 (23·9–29·6)
63·7 (62·2–65·3)
60·9 (58·4–63·4)
18·3 (16·0–20·5)
8·6 (7·0–10·2) 17·3 (16·1–18·5)
90·8 (88·7–92·9)
Germany (ten registries)
2000–04
16·6 (15·3–17·8) 31·8 (30·0–33·5)
62·0 (61·2–62·8)
60·9 (60·2–61·6)
12·5§ (11·6–13·4)
8·0§ (7·5–8·6) 14·9 (14·3–15·4)
91·0 (90·4–91·6)
2005–09
19·7 (18·8–20·6) 31·4 (30·8–32·0)
64·9 (64·4–65·3)
62·2 (61·6–62·8)
12·9 (11·3–14·5)
9·3 (8·4–10·2) 16·9 (16·5–17·4)
92·0 (91·5–92·6)
2010–14
20·8 (19·8–21·8) 33·5 (32·8–34·2)
64·8 (64·3–65·3)
62·3 (61·6–62·9)
13·0 (10·5–15·5)
10·7 (9·6–11·8)18·3 (17·9–18·8)
93·1 (92·6–93·6)
Gibraltar*
2000– ·· 8·0† (0·0–19·9) 38·8† (17·7– ·· ·· ·· 21·7†§ (0·0– 65·4† (37·6–93·3)

Gastrointestinal cancers Lung
Melanoma of the skin
Oesophagus Stomach Colon Rectum Liver Pancreas
04 59·9) 44·9)
2005–09
·· 39·2†§ (12·8–65·5)
52·3†§ (24·3–80·4)
39·3†§ (7·6–70·9)
·· 0·6†§ (0·0–1·9) 19·6†§ (8·0–31·1)
100·0†§ (88·5–100·0)
2010–14
·· ·· ·· ·· ·· ·· ·· ··
Iceland*
2000–04
13·1† (3·8–22·4) 32·9 (24·9–40·9)
61·4 (55·4–67·4)
71·0 (63·0–79·0)
3·9† (0·0–10·0)
4·8 (1·4–8·1) 14·1 (11·2–16·9)
84·5 (77·7–91·3)
2005–09
19·1† (10·4–27·8)
30·3 (21·9–38·6)
64·0 (58·8–69·1)
66·3 (58·2–74·5)
16·0† (6·0–26·1)
0·0 (0·0–0·1) 16·0 (12·9–19·1)
85·4 (79·5–91·3)
2010–14
17·7 (10·5–24·8) 28·1 (20·2–36·1)
68·2 (63·2–73·1)
63·0 (55·5–70·5)
14·3 (6·9–21·7)
0·0† (0·0–0·0) 20·2 (16·9–23·4)
87·5 (82·1–92·9)
Ireland*
2000–04
12·9 (11·0–14·7) 18·6 (16·7–20·4)
53·3 (51·8–54·7)
51·1 (48·9–53·2)
11·6 (8·7–14·6)
5·7 (4·4–7·0) 10·1 (9·3–10·9)
85·5 (83·6–87·4)
2005–09
17·2 (15·2–19·1) 22·2 (20·4–24·1)
58·4 (57·1–59·7)
57·1 (55·0–59·1)
11·8 (9·4–14·2)
6·9 (5·6–8·2) 13·5 (12·7–14·3)
86·6 (85·1–88·1)
2010–14
20·3 (18·0–22·7) 27·6 (25·4–29·8)
60·5 (59·1–62·0)
61·7 (59·4–64·0)
14·2 (11·2–17·2)
9·6 (7·9–11·4) 17·5 (16·5–18·5)
89·2 (87·7–90·7)
Italy (45 registries)
2000–04
11·5 (10·5–12·6) 31·6 (30·9–32·2)
59·0 (58·6–59·5)
55·8 (54·9–56·6)
15·9 (15·2–16·5)
6·8 (6·3–7·3) 14·0 (13·7–14·3)
84·1 (83·3–84·8)
2005–09
12·9 (11·9–14·0) 31·1 (30·5–31·7)
64·3 (63·9–64·7)
61·1 (60·4–61·8)
20·0 (19·4–20·6)
7·9 (7·5–8·3) 15·5 (15·2–15·8)
86·0 (85·5–86·6)
2010–14
13·8 (12·3–15·3) 30·5 (29·7–31·3)
64·2 (63·6–64·7)
61·3 (60·3–62·2)
20·3 (19·6–21·1)
9·2 (8·5–9·8) 15·9 (15·5–16·3)
85·7 (85·0–86·5)
Latvia*
2000–04
6·9 (3·4–10·3) 24·2 (22·2–26·3)
50·5 (47·8–53·3)
39·4 (36·3–42·5)
12·0† (3·8–20·3)
8·8 (5·4–12·1) 17·3 (15·3–19·3)
66·3 (62·0–70·6)
2005–09
10·8 (7·3–14·2) 26·7 (24·6–28·9)
54·0 (51·4–56·5)
46·6 (43·4–49·7)
7·8 (3·8–11·7) 11·2 (7·5–14·8)19·5 (17·7–21·2)
65·1 (61·1–69·1)
2010–14
6·1 (3·6–8·6) 28·0 (25·7–30·3)
56·5 (54·0–58·9)
53·3 (50·2–56·5)
12·9 (7·7–18·0)
13·7 (9·3–18·1)20·4 (18·7–22·1)
72·1 (68·3–75·8)
Lithuania*
2000–04
4·7 (2·9–6·4) 22·0 (20·7–23·3)
44·5 (42·6–46·3)
40·6 (38·4–42·8)
7·9 (5·6–10·2) 6·5 (5·3–7·7) 8·8 (8·0–9·6) 67·2 (63·9–70·6)
2005–09
6·2 (4·2–8·1) 24·9 (23·4–26·4)
51·1 (49·2–53·0)
48·8 (46·6–51·1)
8·3§ (5·9–10·7)
5·4§ (4·3–6·5) 8·8 (8·0–9·7) 70·6 (67·6–73·7)
2010–14
5·6 (3·3–7·8) 27·0 (24·9–29·0)
56·9 (54·4–59·4)
52·7 (49·7–55·7)
8·0§ (5·3–10·7)
7·0§ (5·2–8·8) 9·9 (8·7–11·0) 75·3 (71·8–78·9)
Malta*
2000–04
7·8† (0·0–15·6) 19·9 (14·6–25·2)
57·0 (51·9–62·2)
55·1 (47·7–62·5)
4·2† (0·0–10·5)
5·9 (3·0–8·7) 9·2 (6·5–12·0) 87·3 (80·0–94·7)
2005–09
6·1† (0·5–11·8) 24·8 (19·3–30·3)
52·9 (48·5–57·4)
53·8 (47·2–60·5)
0·0†§ (0·0–0·0) 2·2§ (0·5–4·0) 11·4 (8·7–14·1)
81·6 (75·2–88·1)
2010–14
11·2† (1·6–20·8) 23·8 (17·5–30·0)
57·5 (52·6–62·3)
56·1 (49·2–62·9)
0·0†§ (0·0–0·0) 5·5§ (2·7–8·3) 14·9 (11·5–18·2)
81·9 (75·6–88·3)
Netherlands*
2000–04
12·1 (11·2–13·0) 19·7 (18·8–20·6)
58·1 (57·4–58·7)
58·0 (57·0–59·1)
10·1 (8·6–11·7)
3·7 (3·2–4·2) 12·4 (12·1–12·7)
88·4 (87·6–89·2)
2005–09
16·8 (15·8–17·7) 22·9 (22·0–23·9)
60·9 (60·3–61·5)
63·1 (62·2–64·0)
13·4 (11·8–14·9)
5·5 (5·0–6·1) 15·7 (15·3–16·0)
89·8 (89·1–90·4)
2010–14
21·0 (20·0–22·0) 25·0 (24·0–26·0)
63·1 (62·5–63·7)
65·3 (64·5–66·2)
15·8 (14·2–17·4)
7·4 (6·8–8·1) 17·3 (16·9–17·6)
91·0 (90·4–91·6)
Norway*
2000–04
9·0 (6·7–11·3) 22·4 (20·5–24·2)
60·0 (58·8–61·2)
62·4 (60·8–64·1)
7·9 (5·4–10·3) 5·0 (3·9–6·0) 12·3 (11·5–13·1)
86·4 (85·1–87·6)
2005–09
13·3 (10·8–15·8) 25·3 (23·3–27·4)
64·3 (63·2–65·4)
66·8 (65·1–68·4)
14·2 (11·2–17·2)
6·1 (5·0–7·2) 15·9 (15·1–16·8)
87·3 (86·2–88·3)
2010–14
16·5 (14·0–19·0) 26·5 (24·4–28·6)
66·7 (65·6–67·8)
69·2 (67·6–70·8)
18·7 (15·5–22·0)
9·5 (8·0–11·0) 19·0 (18·1–19·8)
89·3 (88·3–90·3)
Poland (16 registries)*

Gastrointestinal cancers Lung
Melanoma of the skin
Oesophagus Stomach Colon Rectum Liver Pancreas
2000–04
7·2 (6·3–8·1) 15·9 (15·2–16·5)
45·3 (44·6–45·9)
42·5 (41·8–43·3)
9·5 (8·5–10·5) 8·2 (7·6–8·8) 12·1 (11·8–12·4)
63·2 (62·0–64·4)
2005–09
8·9 (7·9–9·8) 19·9 (19·3–20·4)
51·1 (50·5–51·6)
47·6 (46·9–48·3)
10·7 (9·8–11·7)
9·7 (9·2–10·3) 14·1 (13·8–14·4)
67·1 (66·2–68·1)
2010–14
9·1 (8·1–10·1) 20·9 (20·3–21·4)
52·9 (52·3–53·4)
48·4 (47·7–49·1)
10·8 (9·9–11·8)
8·0 (7·5–8·5) 14·4 (14·1–14·7)
69·8 (68·9–70·7)
Portugal (four registries)*
2000–04
10·2 (8·6–11·7) 29·8 (28·9–30·8)
56·5 (55·6–57·4)
54·4 (53·1–55·7)
13·6 (11·8–15·5)
8·0 (6·7–9·2) 10·6 (10·0–11·2)
78·8 (76·8–80·7)
2005–09
12·5 (11·0–14·1) 32·4 (31·5–33·3)
61·1 (60·4–61·9)
59·8 (58·7–60·9)
15·3 (13·6–17·0)
10·3 (9·1–11·4)14·1 (13·5–14·7)
81·7 (80·2–83·2)
2010–14
16·1 (12·0–20·2) 32·2 (30·2–34·2)
60·9 (59·2–62·6)
59·6 (57·1–62·1)
18·7 (14·5–22·9)
10·7 (8·2–13·1)15·7 (14·3–17·1)
83·7 (80·4–87·0)
Romania (Cluj)
2000–04
·· ·· ·· ·· ·· ·· ·· ··
2005–09
10·2§ (4·4–16·0) 19·3§ (16·0–22·7)
53·5§ (48·9–58·0)
44·8 (38·9–50·8)
4·1§ (1·8–6·4) 4·5§ (2·2–6·7) 7·9§ (6·1–9·6) 68·4 (61·5–75·3)
2010–14
0·0†§ (0·0–0·1) 26·0§ (21·5–30·5)
52·2§ (46·0–58·4)
58·4 (49·8–67·0)
13·2§ (9·2–17·3)
6·0†§ (2·6–9·3) 11·1§ (8·7–13·6)
71·3 (63·0–79·6)
Russia (five registries)
2000–04
10·9 (8·8–13·0) 22·9 (21·7–24·1)
40·4 (38·9–41·9)
38·5 (36·4–40·6)
7·4 (5·2–9·5) 7·5 (6·0–9·1) 16·8 (15·7–17·8)
64·7 (61·4–68·0)
2005–09
8·6 (7·0–10·2) 20·2 (19·3–21·1)
42·4 (41·2–43·6)
38·9 (37·3–40·5)
5·1 (3·6–6·6) 5·4 (4·5–6·4) 13·9 (13·2–14·6)
63·3 (60·3–66·3)
2010–14
8·6 (7·1–10·1) 21·0 (20·0–21·9)
44·9 (43·8–46·1)
41·9 (40·2–43·5)
6·3 (4·8–7·9) 4·4 (3·7–5·2) 13·7 (13·0–14·4)
66·5 (63·6–69·3)
Slovakia*
2000–04
5·8§ (3·8–7·9) 20·6§ (19·1–22·0)
50·4 (49·1–51·7)
43·6 (41·7–45·5)
5·6§ (4·1–7·2) 4·8§ (3·8–5·8) 9·5§ (8·7–10·3)
75·0 (72·7–77·3)
2005–09
6·4 (4·7–8·0) 20·9 (19·5–22·4)
51·2 (50·1–52·4)
47·5 (45·8–49·2)
6·1§ (4·8–7·5) 5·8 (4·8–6·7) 10·5 (9·7–11·2)
79·7 (77·7–81·7)
2010–14
6·4 (3·3–9·4) 21·1 (17·8–24·3)
51·8 (49·1–54·4)
48·6 (44·9–52·4)
7·6§ (4·5–10·7)
6·4 (4·4–8·4) 11·2 (9·5–12·8)
78·2 (73·9–82·5)
Slovenia*
2000–04
8·2 (5·7–10·8) 25·9 (23·8–27·9)
53·6 (51·6–55·6)
48·6 (46·1–51·1)
3·8 (2·2–5·4) 4·7 (3·4–6·1) 9·9 (9·1–10·8) 79·3 (76·7–81·9)
2005–09
9·3 (6·2–12·3) 25·8 (23·7–27·8)
56·2 (54·4–58·0)
57·0 (54·6–59·4)
7·0 (5·2–8·8) 5·7 (4·3–7·1) 12·7 (11·7–13·7)
85·0 (83·0–87·0)
2010–14
8·6 (5·2–11·9) 28·8 (26·4–31·2)
61·9 (60·0–63·8)
60·3 (57·7–62·9)
7·4 (5·3–9·5) 6·6 (4·9–8·4) 14·8 (13·6–16·1)
85·1 (83·0–87·1)
Spain (ten registries)
2000–04
8·9 (7·5–10·3) 25·7 (24·5–26·9)
56·5 (55·6–57·4)
55·2 (53·7–56·6)
14·4 (13·2–15·7)
5·6 (4·8–6·4) 10·8 (10·4–11·3)
85·3 (83·8–86·8)
2005–09
11·6 (10·2–13·1) 26·7 (25·5–27·9)
61·1 (60·3–61·9)
58·6 (57·3–59·9)
16·3 (15·1–17·4)
6·9 (6·1–7·7) 12·5 (12·0–13·0)
87·1 (85·9–88·3)
2010–14
13·0 (10·6–15·4) 27·6 (25·7–29·5)
63·2 (62·0–64·5)
59·5 (57·4–61·5)
17·3 (15·4–19·2)
7·7 (6·3–9·2) 13·5 (12·7–14·3)
86·8 (84·8–88·7)
Sweden*
2000–04
11·4 (9·6–13·1) 21·2 (19·8–22·6)
60·2 (59·2–61·2)
59·9 (58·7–61·1)
7·8 (6·4–9·1) 4·9 (4·1–5·8) 13·9 (13·2–14·6)
88·9 (88·1–89·8)
2005–09
13·1 (11·4–14·8) 23·6 (22·1–25·1)
64·2 (63·3–65·2)
63·0 (61·9–64·2)
13·0 (11·4–14·6)
7·9 (6·9–8·9) 16·6 (15·9–17·3)
90·3 (89·5–91·0)
2010–14
14·8 (12·8–16·7) 24·8 (23·3–26·3)
64·9 (64·0–65·8)
64·7 (63·5–65·8)
16·6 (14·9–18·3)
9·7 (8·7–10·8) 19·5 (18·7–20·2)
91·5 (90·9–92·2)
Switzerland (ten registries)‡
2000–04
16·1 (13·6–18·6) 29·2 (26·9–31·4)
62·8 (61·3–64·3)
59·5 (57·2–61·8)
12·2 (10·3–14·0)
5·6 (4·4–6·9) 14·7 (13·8–15·6)
90·7 (88·4–92·9)
2005–09
20·6 (17·9–23·2) 31·4 (29·0–33·7)
65·1 (63·7–66·6)
65·6 (63·5–67·7)
13·4 (11·6–15·3)
7·0 (5·8–8·2) 17·3 (16·5–18·2)
92·4 (91·3–93·5)
2010–14
23·9 (21·0–26·9) 32·2 (29·9–34·5)
67·3 (65·7–68·9)
67·3 (65·0–69·6)
15·4 (13·5–17·4)
9·4 (7·9–10·8) 20·4 (19·4–21·4)
93·6 (92·4–94·7)

Gastrointestinal cancers Lung
Melanoma of the skin
Oesophagus Stomach Colon Rectum Liver Pancreas
UK (four registries)*
2000–04
11·5 (11·1–11·9) 16·2 (15·7–16·6)
52·0 (51·6–52·3)
54·6 (54·0–55·1)
7·1 (6·6–7·7) 3·7 (3·4–4·0) 8·3 (8·1–8·5) 86·4 (85·9–86·8)
2005–09
14·0 (13·5–14·4) 19·2 (18·7–19·7)
56·5 (56·2–56·9)
58·7 (58·2–59·2)
9·7 (9·1–10·2) 5·2 (4·9–5·5) 10·1 (9·9–10·3)
89·2 (88·9–89·6)
2010–14
15·7 (15·3–16·1) 20·7 (20·1–21·2)
60·0 (59·7–60·4)
62·5 (62·0–63·0)
13·0 (12·4–13·6)
6·8 (6·5–7·2) 13·3 (13·1–13·5)
90·9 (90·6–91·3)
Oceania
Australia (eight registries)*
2000–04
18·0 (16·9–19·2) 27·7 (26·7–28·8)
63·7 (63·2–64·3)
64·4 (63·5–65·2)
14·2 (13·1–15·3)
7·3 (6·7–8·0) 14·8 (14·4–15·2)
92·0 (91·7–92·4)
2005–09
19·9 (18·7–21·0) 29·8 (28·8–30·9)
68·1 (67·6–68·6)
68·6 (67·8–69·5)
17·7 (16·6–18·7)
9·1 (8·5–9·8) 17·1 (16·7–17·5)
92·5 (92·2–92·8)
2010–14
23·7 (22·4–25·0) 31·8 (30·7–32·9)
70·7 (70·1–71·2)
71·0 (70·2–71·9)
19·2 (18·1–20·3)
12·0 (11·2–12·8)
19·4 (19·0–19·9)
92·9 (92·5–93·2)
New Zealand*
2000–04
11·5 (9·4–13·6) 24·6 (22·4–26·8)
61·4 (60·2–62·7)
60·1 (58·0–62·1)
12·4 (9·9–15·0)
7·0 (5·5–8·5) 11·4 (10·5–12·2)
90·0 (89·1–90·8)
2005–09
14·5 (12·1–16·8) 24·8 (22·5–27·0)
62·8 (61·6–64·0)
63·3 (61·4–65·3)
16·8 (14·4–19·1)
7·7 (6·3–9·0) 12·4 (11·6–13·3)
91·1 (90·3–91·8)
2010–14
15·3 (13·0–17·7) 25·7 (23·5–27·9)
64·0 (62·8–65·1)
66·0 (64·1–67·9)
19·0 (16·7–21·4)
8·1 (6·7–9·6) 15·3 (14·3–16·2)
91·8 (91·1–92·5)
Some registries contributed data for selected cancers or calendar periods. Countries that only provided data for childhood cancers (Belarus, Greece, and Mexico) are not included in this table (see table 7 for childhood cancers).
*Data with 100% coverage of the national population. †Survival estimate is not age-standardised. ‡Data with 100% coverage of the national population for childhood malignancies only. §
Survival estimate considered less reliable because 15% or more of patients were (1) lost to follow-up or censored alive within 5 years of diagnosis or, if diagnosed in 2010 or later, before Dec 31, 2014; or (2) registered only from a death certificate or at autopsy; or (3) patients with unknown vital status or registered with incomplete dates—ie, unknown year of birth, unknown month or year of diagnosis, or unknown year of last known vital status.
Table 7. Age-standardised 5-year net survival (%) with 95% CI: adults (15–99 years) diagnosed with one of seven common malignancies (breast, cervix, ovary, prostate, brain, myeloid, and lymphoid) and children (0–14 years) diagnosed with one of three common malignancies (brain, acute lymphoblastic leukaemia, and lymphoma) by continent, country, and calendar period of diagnosis
Women's cancers Prostate Brain
(adults) Haemopoietic
malignancies (adults)Childhood malignancies
Breast Cervix Ovary
Myeloid Lymphoid Brain
Acute lymphoblastic
leukaemia Lymphoma
Africa
Algeria (three registries)
2000–04
38·9§ (29·1–48·7)
61·1§ (55·5–66·7)
50·7†§ (35·6–65·8)
89·9†§ (77·8–100·0)
·· 21·1†§ (6·0–36·2)
23·3§ (13·8–32·8)
·· 30·9†§ (10·1–51·6) 6·0†§ (0·0–15·1)
2005–09
55·6§ (47·4–63·8)
70·7§ (64·5–77·0)
54·3§ (44·7–63·8)
50·3§ (41·0–59·6)
51·9§ (43·4–60·4)
17·1†§ (0·1–34·1)
47·8§ (39·9–55·8)
43·3§ (29·4–57·2)
100·0†§ (100·0–100·0)
78·9†§ (62·5–95·3)
2010–14
77·0§ (68·5–85·6)
72·4§ (66·0–78·7)
66·5§ (53·5–79·5)
64·1§ (56·6–71·6)
46·5§ (37·5–55·5)
17·9§ (5·3–30·6)
59·1§ (49·9–68·3)
54·1§ (39·2–69·0)
·· 77·5§ (65·4–89·7)
Mali (Bamako)
2000–04
·· ·· ·· ·· ·· ·· ·· ·· ·· ··
2005–09
·· ·· ·· ·· ·· ·· ·· ·· ·· ··
2010–14
0·0†§ (0·0–0·0)
·· ·· ·· ·· ·· ·· ·· ·· ··

Women's cancers Prostate Brain
(adults) Haemopoietic
malignancies (adults)Childhood malignancies
Breast Cervix Ovary
Myeloid Lymphoid Brain
Acute lymphoblastic
leukaemia Lymphoma
Mauritius*
2000–04
·· ·· ·· ·· ·· ·· ·· ·· ·· ··
2005–09
83·6 (75·9–91·3)
80·8 (76·0–85·6)
79·7 (69·6–89·8)
61·8 (54·1–69·4)
·· ·· ·· ·· ·· ··
2010–14
·· ·· ·· 63·5 (54·7–72·4)
43·7† (25·5–61·9)
50·1† (34·4–65·8)
65·9 (53·4–78·4)
·· ·· ··
Morocco (Casablanca)
2000–04
·· ·· ·· ·· ·· ·· ·· ·· ·· ··
2005–09
86·7§ (71·7–100·0)
·· ·· ·· ·· ·· ·· ·· ·· ··
2010–14
99·7§ (95·8–100·0)
·· ·· ·· ·· ·· ·· ·· ·· ··
Nigeria (Ibadan)
2000–04
·· ·· ·· ·· ·· ·· ·· ·· ·· ··
2005–09
98·8§ (95·6–100·0)
58·6§ (46·5–70·7)
59·4†§ (24·9–93·9)
73·9§ (50·2–97·6)
88·6†§ (60·4–100·0)
57·4†§ (29·0–85·8)
86·8§ (54·9–100·0)
·· ·· 51·0§ (31·5–70·6)
2010–14
97·5§ (89·9–100·0)
49·8§ (36·5–63·1)
49·1§ (33·8–64·4)
58·7§ (40·1–77·2)
54·9†§ (19·7–90·0)
28·4†§ (3·0–53·7)
56·4§ (32·2–80·5)
·· ·· 6·0§ (0·0–13·6)
South Africa (Eastern Cape)
2000–04
53·0†§ (23·4–82·7)
70·7§ (56·7–84·7)
82·5†§ (42·5–100·0)
77·6†§ (55·0–100·0)
·· ·· ·· ·· ·· ··
2005–09
32·0§ (23·3–40·7)
40·2§ (32·2–48·1)
81·0†§ (58·8–100·0)
38·6§ (25·1–52·0)
·· ·· 29·5†§ (10·8–48·2)
·· ·· ··
2010–14
40·1§ (30·7–49·6)
37·1§ (31·4–42·9)
67·8†§ (47·4–88·2)
37·8§ (25·5–50·1)
51·6†§ (0·6–100·0)
·· 47·7†§ (31·1–64·4)
·· ·· ··
America (Central and South)
Argentina (five registries)‡
2000–04
82·3 (79·4–85·2)
58·3 (52·6–64·0)
40·4 (32·4–48·4)
83·5 (78·5–88·6)
29·8§ (22·6–37·0)
47·9 (39·4–56·3)
54·5 (49·1–59·8)
45·1 (41·8–48·3)
65·0 (62·7–67·3) 79·9 (76·7–83·0)
2005–09
82·0 (80·4–83·6)
55·6 (52·0–59·1)
43·2 (38·6–47·9)
83·6 (81·2–86·0)
27·7§ (24·4–31·0)
39·5 (34·5–44·6)
48·8 (45·9–51·6)
56·1 (52·9–59·3)
72·0 (69·7–74·2) 76·9 (73·5–80·3)
2010–14
84·4 (82·6–86·2)
52·7 (48·7–56·7)
38·6 (34·3–42·9)
87·6 (84·9–90·4)
30·7§ (26·8–34·6)
37·4 (32·1–42·6)
48·2 (45·0–51·5)
62·9§ (59·4–66·4)
76·1§ (73·7–78·4) 83·4 (80·1–86·6)
Brazil (six registries)
2000–04
68·7§ (67·5–69·8)
69·3 (66·1–72·6)
42·1 (36·0–48·1)
90·0 (87·2–92·8)
31·3§ (26·2–36·4)
31·1† (7·3–54·9)
48·2 (43·7–52·6)
55·7 (44·7–66·6)
67·7 (57·8–77·6) 69·2 (57·3–81·1)
2005–09
76·9§ (75·7–78·0)
63·2 (59·9–66·5)
34·1 (29·4–38·9)
92·5 (90·2–94·8)
28·2§ (24·4–32·1)
41·6 (31·4–51·8)
49·4 (45·6–53·2)
34·7 (21·9–47·5)
69·8 (60·0–79·6) 86·3 (77·1–95·5)
2010–14
75·2§ (73·9–76·5)
60·3 (56·3–64·3)
34·9 (29·5–40·3)
91·6 (89·1–94·1)
28·1§ (23·7–32·6)
39·1 (28·7–49·5)
46·2 (42·2–50·2)
28·9 (15·8–41·9)
66·0 (53·3–78·8) 88·2 (78·2–98·3)
Chile (four registries)
2000–04
74·6 (68·2–81·1)
58·2 (52·3–64·0)
25·8 (18·5–33·1)
82·6 (77·2–88·0)
12·4† (0·0–26·7)
29·1 (19·1–39·1)
28·9 (23·4–34·3)
46·7† (22·7–70·7)
76·7 (65·6–87·7) 70·1† (43·3–96·9)
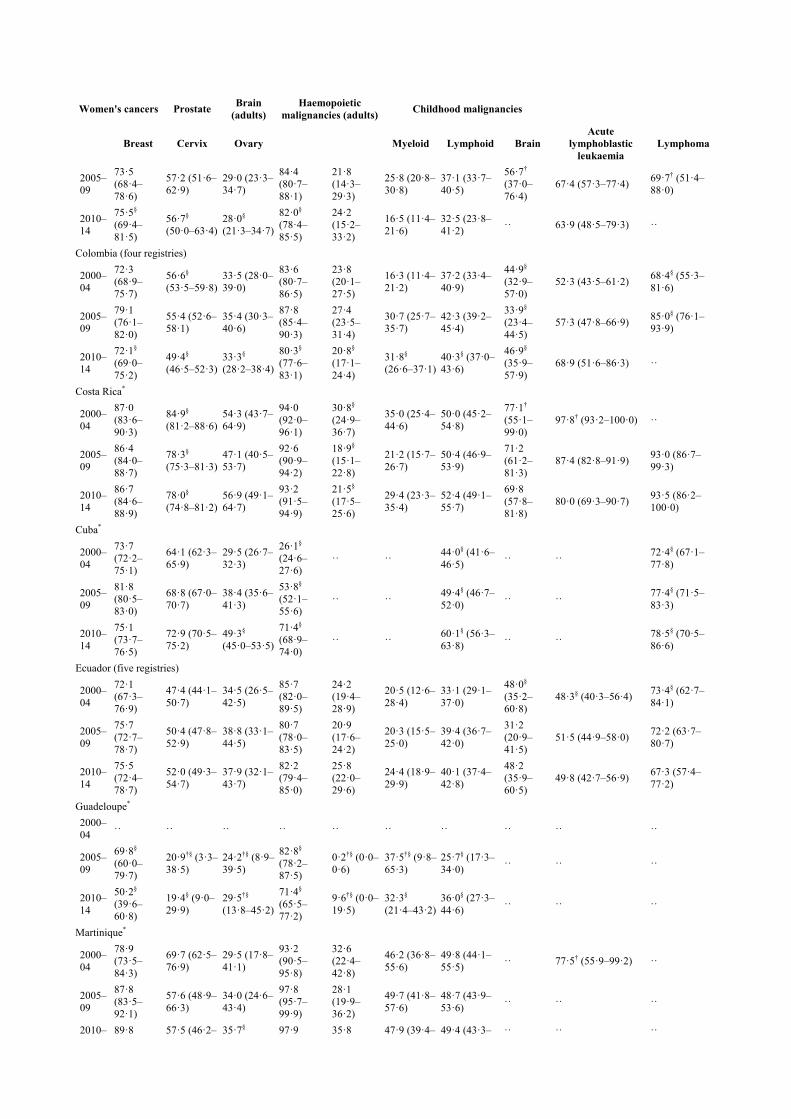
Women's cancers Prostate Brain
(adults) Haemopoietic
malignancies (adults)Childhood malignancies
Breast Cervix Ovary
Myeloid Lymphoid Brain
Acute lymphoblastic
leukaemia Lymphoma
2005–09
73·5 (68·4–78·6)
57·2 (51·6–62·9)
29·0 (23·3–34·7)
84·4 (80·7–88·1)
21·8 (14·3–29·3)
25·8 (20·8–30·8)
37·1 (33·7–40·5)
56·7† (37·0–76·4)
67·4 (57·3–77·4) 69·7† (51·4–88·0)
2010–14
75·5§ (69·4–81·5)
56·7§ (50·0–63·4)
28·0§ (21·3–34·7)
82·0§ (78·4–85·5)
24·2 (15·2–33·2)
16·5 (11·4–21·6)
32·5 (23·8–41·2)
·· 63·9 (48·5–79·3) ··
Colombia (four registries)
2000–04
72·3 (68·9–75·7)
56·6§ (53·5–59·8)
33·5 (28·0–39·0)
83·6 (80·7–86·5)
23·8 (20·1–27·5)
16·3 (11·4–21·2)
37·2 (33·4–40·9)
44·9§ (32·9–57·0)
52·3 (43·5–61·2) 68·4§ (55·3–81·6)
2005–09
79·1 (76·1–82·0)
55·4 (52·6–58·1)
35·4 (30·3–40·6)
87·8 (85·4–90·3)
27·4 (23·5–31·4)
30·7 (25·7–35·7)
42·3 (39·2–45·4)
33·9§ (23·4–44·5)
57·3 (47·8–66·9) 85·0§ (76·1–93·9)
2010–14
72·1§ (69·0–75·2)
49·4§ (46·5–52·3)
33·3§ (28·2–38·4)
80·3§ (77·6–83·1)
20·8§ (17·1–24·4)
31·8§ (26·6–37·1)
40·3§ (37·0–43·6)
46·9§ (35·9–57·9)
68·9 (51·6–86·3) ··
Costa Rica*
2000–04
87·0 (83·6–90·3)
84·9§ (81·2–88·6)
54·3 (43·7–64·9)
94·0 (92·0–96·1)
30·8§ (24·9–36·7)
35·0 (25·4–44·6)
50·0 (45·2–54·8)
77·1† (55·1–99·0)
97·8† (93·2–100·0) ··
2005–09
86·4 (84·0–88·7)
78·3§ (75·3–81·3)
47·1 (40·5–53·7)
92·6 (90·9–94·2)
18·9§ (15·1–22·8)
21·2 (15·7–26·7)
50·4 (46·9–53·9)
71·2 (61·2–81·3)
87·4 (82·8–91·9) 93·0 (86·7–99·3)
2010–14
86·7 (84·6–88·9)
78·0§ (74·8–81·2)
56·9 (49·1–64·7)
93·2 (91·5–94·9)
21·5§ (17·5–25·6)
29·4 (23·3–35·4)
52·4 (49·1–55·7)
69·8 (57·8–81·8)
80·0 (69·3–90·7) 93·5 (86·2–100·0)
Cuba*
2000–04
73·7 (72·2–75·1)
64·1 (62·3–65·9)
29·5 (26·7–32·3)
26·1§ (24·6–27·6)
·· ·· 44·0§ (41·6–46·5)
·· ·· 72·4§ (67·1–77·8)
2005–09
81·8 (80·5–83·0)
68·8 (67·0–70·7)
38·4 (35·6–41·3)
53·8§ (52·1–55·6)
·· ·· 49·4§ (46·7–52·0)
·· ·· 77·4§ (71·5–83·3)
2010–14
75·1 (73·7–76·5)
72·9 (70·5–75·2)
49·3§ (45·0–53·5)
71·4§ (68·9–74·0)
·· ·· 60·1§ (56·3–63·8)
·· ·· 78·5§ (70·5–86·6)
Ecuador (five registries)
2000–04
72·1 (67·3–76·9)
47·4 (44·1–50·7)
34·5 (26·5–42·5)
85·7 (82·0–89·5)
24·2 (19·4–28·9)
20·5 (12·6–28·4)
33·1 (29·1–37·0)
48·0§ (35·2–60·8)
48·3§ (40·3–56·4) 73·4§ (62·7–84·1)
2005–09
75·7 (72·7–78·7)
50·4 (47·8–52·9)
38·8 (33·1–44·5)
80·7 (78·0–83·5)
20·9 (17·6–24·2)
20·3 (15·5–25·0)
39·4 (36·7–42·0)
31·2 (20·9–41·5)
51·5 (44·9–58·0) 72·2 (63·7–80·7)
2010–14
75·5 (72·4–78·7)
52·0 (49·3–54·7)
37·9 (32·1–43·7)
82·2 (79·4–85·0)
25·8 (22·0–29·6)
24·4 (18·9–29·9)
40·1 (37·4–42·8)
48·2 (35·9–60·5)
49·8 (42·7–56·9) 67·3 (57·4–77·2)
Guadeloupe*
2000–04
·· ·· ·· ·· ·· ·· ·· ·· ·· ··
2005–09
69·8§ (60·0–79·7)
20·9†§ (3·3–38·5)
24·2†§ (8·9–39·5)
82·8§ (78·2–87·5)
0·2†§ (0·0–0·6)
37·5†§ (9·8–65·3)
25·7§ (17·3–34·0)
·· ·· ··
2010–14
50·2§ (39·6–60·8)
19·4§ (9·0–29·9)
29·5†§ (13·8–45·2)
71·4§ (65·5–77·2)
9·6†§ (0·0–19·5)
32·3§ (21·4–43·2)
36·0§ (27·3–44·6)
·· ·· ··
Martinique*
2000–04
78·9 (73·5–84·3)
69·7 (62·5–76·9)
29·5 (17·8–41·1)
93·2 (90·5–95·8)
32·6 (22·4–42·8)
46·2 (36·8–55·6)
49·8 (44·1–55·5)
·· 77·5† (55·9–99·2) ··
2005–09
87·8 (83·5–92·1)
57·6 (48·9–66·3)
34·0 (24·6–43·4)
97·8 (95·7–99·9)
28·1 (19·9–36·2)
49·7 (41·8–57·6)
48·7 (43·9–53·6)
·· ·· ··
2010– 89·8 57·5 (46·2– 35·7§ 97·9 35·8 47·9 (39·4– 49·4 (43·3– ·· ·· ··
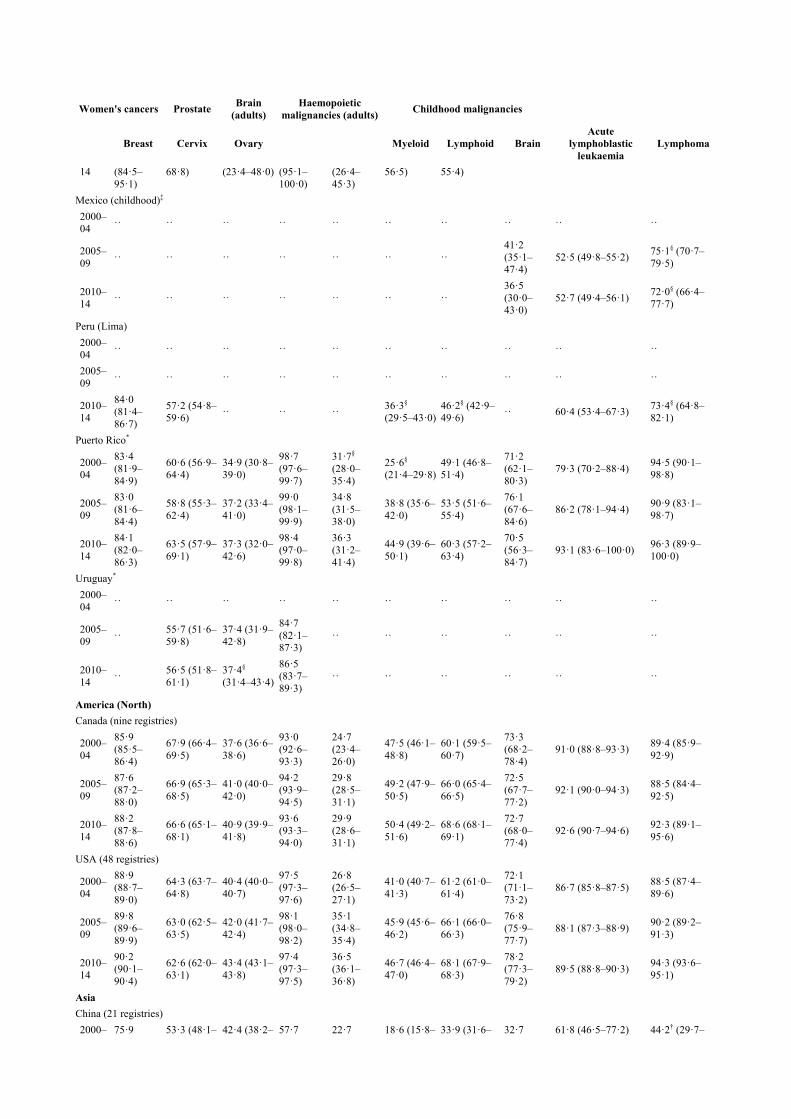
Women's cancers Prostate Brain
(adults) Haemopoietic
malignancies (adults)Childhood malignancies
Breast Cervix Ovary
Myeloid Lymphoid Brain
Acute lymphoblastic
leukaemia Lymphoma
14 (84·5–95·1)
68·8) (23·4–48·0) (95·1–100·0)
(26·4–45·3)
56·5) 55·4)
Mexico (childhood)‡
2000–04
·· ·· ·· ·· ·· ·· ·· ·· ·· ··
2005–09
·· ·· ·· ·· ·· ·· ·· 41·2 (35·1–47·4)
52·5 (49·8–55·2) 75·1§ (70·7–79·5)
2010–14
·· ·· ·· ·· ·· ·· ·· 36·5 (30·0–43·0)
52·7 (49·4–56·1) 72·0§ (66·4–77·7)
Peru (Lima)
2000–04
·· ·· ·· ·· ·· ·· ·· ·· ·· ··
2005–09
·· ·· ·· ·· ·· ·· ·· ·· ·· ··
2010–14
84·0 (81·4–86·7)
57·2 (54·8–59·6)
·· ·· ·· 36·3§ (29·5–43·0)
46·2§ (42·9–49·6)
·· 60·4 (53·4–67·3) 73·4§ (64·8–82·1)
Puerto Rico*
2000–04
83·4 (81·9–84·9)
60·6 (56·9–64·4)
34·9 (30·8–39·0)
98·7 (97·6–99·7)
31·7§ (28·0–35·4)
25·6§ (21·4–29·8)
49·1 (46·8–51·4)
71·2 (62·1–80·3)
79·3 (70·2–88·4) 94·5 (90·1–98·8)
2005–09
83·0 (81·6–84·4)
58·8 (55·3–62·4)
37·2 (33·4–41·0)
99·0 (98·1–99·9)
34·8 (31·5–38·0)
38·8 (35·6–42·0)
53·5 (51·6–55·4)
76·1 (67·6–84·6)
86·2 (78·1–94·4) 90·9 (83·1–98·7)
2010–14
84·1 (82·0–86·3)
63·5 (57·9–69·1)
37·3 (32·0–42·6)
98·4 (97·0–99·8)
36·3 (31·2–41·4)
44·9 (39·6–50·1)
60·3 (57·2–63·4)
70·5 (56·3–84·7)
93·1 (83·6–100·0) 96·3 (89·9–100·0)
Uruguay*
2000–04
·· ·· ·· ·· ·· ·· ·· ·· ·· ··
2005–09
·· 55·7 (51·6–59·8)
37·4 (31·9–42·8)
84·7 (82·1–87·3)
·· ·· ·· ·· ·· ··
2010–14
·· 56·5 (51·8–61·1)
37·4§ (31·4–43·4)
86·5 (83·7–89·3)
·· ·· ·· ·· ·· ··
America (North)
Canada (nine registries)
2000–04
85·9 (85·5–86·4)
67·9 (66·4–69·5)
37·6 (36·6–38·6)
93·0 (92·6–93·3)
24·7 (23·4–26·0)
47·5 (46·1–48·8)
60·1 (59·5–60·7)
73·3 (68·2–78·4)
91·0 (88·8–93·3) 89·4 (85·9–92·9)
2005–09
87·6 (87·2–88·0)
66·9 (65·3–68·5)
41·0 (40·0–42·0)
94·2 (93·9–94·5)
29·8 (28·5–31·1)
49·2 (47·9–50·5)
66·0 (65·4–66·5)
72·5 (67·7–77·2)
92·1 (90·0–94·3) 88·5 (84·4–92·5)
2010–14
88·2 (87·8–88·6)
66·6 (65·1–68·1)
40·9 (39·9–41·8)
93·6 (93·3–94·0)
29·9 (28·6–31·1)
50·4 (49·2–51·6)
68·6 (68·1–69·1)
72·7 (68·0–77·4)
92·6 (90·7–94·6) 92·3 (89·1–95·6)
USA (48 registries)
2000–04
88·9 (88·7–89·0)
64·3 (63·7–64·8)
40·4 (40·0–40·7)
97·5 (97·3–97·6)
26·8 (26·5–27·1)
41·0 (40·7–41·3)
61·2 (61·0–61·4)
72·1 (71·1–73·2)
86·7 (85·8–87·5) 88·5 (87·4–89·6)
2005–09
89·8 (89·6–89·9)
63·0 (62·5–63·5)
42·0 (41·7–42·4)
98·1 (98·0–98·2)
35·1 (34·8–35·4)
45·9 (45·6–46·2)
66·1 (66·0–66·3)
76·8 (75·9–77·7)
88·1 (87·3–88·9) 90·2 (89·2–91·3)
2010–14
90·2 (90·1–90·4)
62·6 (62·0–63·1)
43·4 (43·1–43·8)
97·4 (97·3–97·5)
36·5 (36·1–36·8)
46·7 (46·4–47·0)
68·1 (67·9–68·3)
78·2 (77·3–79·2)
89·5 (88·8–90·3) 94·3 (93·6–95·1)
Asia
China (21 registries)
2000– 75·9 53·3 (48·1– 42·4 (38·2– 57·7 22·7 18·6 (15·8– 33·9 (31·6– 32·7 61·8 (46·5–77·2) 44·2† (29·7–
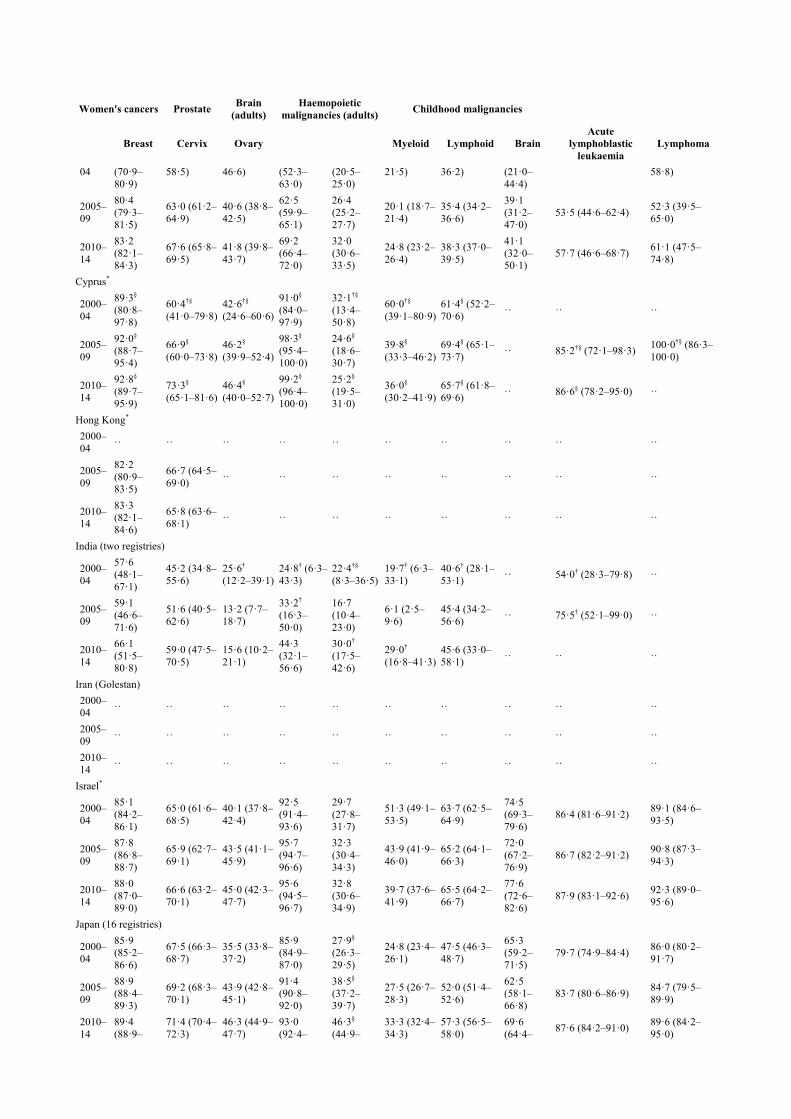
Women's cancers Prostate Brain
(adults) Haemopoietic
malignancies (adults)Childhood malignancies
Breast Cervix Ovary
Myeloid Lymphoid Brain
Acute lymphoblastic
leukaemia Lymphoma
04 (70·9–80·9)
58·5) 46·6) (52·3–63·0)
(20·5–25·0)
21·5) 36·2) (21·0–44·4)
58·8)
2005–09
80·4 (79·3–81·5)
63·0 (61·2–64·9)
40·6 (38·8–42·5)
62·5 (59·9–65·1)
26·4 (25·2–27·7)
20·1 (18·7–21·4)
35·4 (34·2–36·6)
39·1 (31·2–47·0)
53·5 (44·6–62·4) 52·3 (39·5–65·0)
2010–14
83·2 (82·1–84·3)
67·6 (65·8–69·5)
41·8 (39·8–43·7)
69·2 (66·4–72·0)
32·0 (30·6–33·5)
24·8 (23·2–26·4)
38·3 (37·0–39·5)
41·1 (32·0–50·1)
57·7 (46·6–68·7) 61·1 (47·5–74·8)
Cyprus*
2000–04
89·3§ (80·8–97·8)
60·4†§ (41·0–79·8)
42·6†§ (24·6–60·6)
91·0§ (84·0–97·9)
32·1†§ (13·4–50·8)
60·0†§ (39·1–80·9)
61·4§ (52·2–70·6)
·· ·· ··
2005–09
92·0§ (88·7–95·4)
66·9§ (60·0–73·8)
46·2§ (39·9–52·4)
98·3§ (95·4–100·0)
24·6§ (18·6–30·7)
39·8§ (33·3–46·2)
69·4§ (65·1–73·7)
·· 85·2†§ (72·1–98·3) 100·0†§ (86·3–100·0)
2010–14
92·8§ (89·7–95·9)
73·3§ (65·1–81·6)
46·4§ (40·0–52·7)
99·2§ (96·4–100·0)
25·2§ (19·5–31·0)
36·0§ (30·2–41·9)
65·7§ (61·8–69·6)
·· 86·6§ (78·2–95·0) ··
Hong Kong*
2000–04
·· ·· ·· ·· ·· ·· ·· ·· ·· ··
2005–09
82·2 (80·9–83·5)
66·7 (64·5–69·0)
·· ·· ·· ·· ·· ·· ·· ··
2010–14
83·3 (82·1–84·6)
65·8 (63·6–68·1)
·· ·· ·· ·· ·· ·· ·· ··
India (two registries)
2000–04
57·6 (48·1–67·1)
45·2 (34·8–55·6)
25·6† (12·2–39·1)
24·8† (6·3–43·3)
22·4†§ (8·3–36·5)
19·7† (6·3–33·1)
40·6† (28·1–53·1)
·· 54·0† (28·3–79·8) ··
2005–09
59·1 (46·6–71·6)
51·6 (40·5–62·6)
13·2 (7·7–18·7)
33·2† (16·3–50·0)
16·7 (10·4–23·0)
6·1 (2·5–9·6)
45·4 (34·2–56·6)
·· 75·5† (52·1–99·0) ··
2010–14
66·1 (51·5–80·8)
59·0 (47·5–70·5)
15·6 (10·2–21·1)
44·3 (32·1–56·6)
30·0† (17·5–42·6)
29·0† (16·8–41·3)
45·6 (33·0–58·1)
·· ·· ··
Iran (Golestan)
2000–04
·· ·· ·· ·· ·· ·· ·· ·· ·· ··
2005–09
·· ·· ·· ·· ·· ·· ·· ·· ·· ··
2010–14
·· ·· ·· ·· ·· ·· ·· ·· ·· ··
Israel*
2000–04
85·1 (84·2–86·1)
65·0 (61·6–68·5)
40·1 (37·8–42·4)
92·5 (91·4–93·6)
29·7 (27·8–31·7)
51·3 (49·1–53·5)
63·7 (62·5–64·9)
74·5 (69·3–79·6)
86·4 (81·6–91·2) 89·1 (84·6–93·5)
2005–09
87·8 (86·8–88·7)
65·9 (62·7–69·1)
43·5 (41·1–45·9)
95·7 (94·7–96·6)
32·3 (30·4–34·3)
43·9 (41·9–46·0)
65·2 (64·1–66·3)
72·0 (67·2–76·9)
86·7 (82·2–91·2) 90·8 (87·3–94·3)
2010–14
88·0 (87·0–89·0)
66·6 (63·2–70·1)
45·0 (42·3–47·7)
95·6 (94·5–96·7)
32·8 (30·6–34·9)
39·7 (37·6–41·9)
65·5 (64·2–66·7)
77·6 (72·6–82·6)
87·9 (83·1–92·6) 92·3 (89·0–95·6)
Japan (16 registries)
2000–04
85·9 (85·2–86·6)
67·5 (66·3–68·7)
35·5 (33·8–37·2)
85·9 (84·9–87·0)
27·9§ (26·3–29·5)
24·8 (23·4–26·1)
47·5 (46·3–48·7)
65·3 (59·2–71·5)
79·7 (74·9–84·4) 86·0 (80·2–91·7)
2005–09
88·9 (88·4–89·3)
69·2 (68·3–70·1)
43·9 (42·8–45·1)
91·4 (90·8–92·0)
38·5§ (37·2–39·7)
27·5 (26·7–28·3)
52·0 (51·4–52·6)
62·5 (58·1–66·8)
83·7 (80·6–86·9) 84·7 (79·5–89·9)
2010–14
89·4 (88·9–
71·4 (70·4–72·3)
46·3 (44·9–47·7)
93·0 (92·4–
46·3§ (44·9–
33·3 (32·4–34·3)
57·3 (56·5–58·0)
69·6 (64·4–
87·6 (84·2–91·0) 89·6 (84·2–95·0)

Women's cancers Prostate Brain
(adults) Haemopoietic
malignancies (adults)Childhood malignancies
Breast Cervix Ovary
Myeloid Lymphoid Brain
Acute lymphoblastic
leukaemia Lymphoma
89·9) 93·6) 47·7) 74·7)
Jordan*
2000–04
87·6§ (83·5–91·7)
75·6§ (66·8–84·3)
·· 88·5§ (83·7–93·3)
55·8§ (49·0–62·6)
57·1§ (48·1–66·1)
76·0§ (69·4–82·6)
73·5§ (65·7–81·3)
75·4§ (69·7–81·2) 92·4§ (88·1–96·6)
2005–09
86·6§ (83·2–90·0)
70·6§ (63·9–77·4)
·· 88·6§ (83·3–93·9)
46·7§ (41·1–52·4)
56·5§ (46·9–66·1)
74·6§ (68·3–80·9)
66·0§ (58·6–73·3)
89·2§ (84·8–93·6) 91·1§ (86·4–95·8)
2010–14
84·4§ (80·9–88·0)
56·4§ (48·2–64·6)
·· 86·1§ (81·1–91·0)
32·9§ (26·8–39·0)
42·5§ (35·3–49·6)
65·1§ (60·3–69·9)
57·3§ (49·9–64·8)
88·0§ (83·1–92·8) 87·0§ (81·4–92·6)
Korea*
2000–04
79·5 (78·0–81·0)
76·0 (75·3–76·7)
43·0 (41·2–44·7)
76·0 (74·6–77·5)
27·6 (26·4–28·9)
31·7 (30·4–33·0)
39·8 (38·8–40·8)
54·2 (50·8–57·6)
73·1 (70·4–75·8) 82·4 (79·3–85·4)
2005–09
84·0 (83·0–85·0)
77·0 (76·4–77·7)
44·1 (42·7–45·5)
87·3 (86·5–88·1)
31·9 (30·8–33·0)
41·5 (40·5–42·5)
47·5 (46·7–48·4)
61·4 (58·1–64·7)
78·6 (76·1–81·0) 83·0 (80·0–85·9)
2010–14
86·6 (85·8–87·5)
77·3 (76·6–78·0)
47·5 (46·2–48·9)
89·9 (89·2–90·5)
33·7 (32·6–34·7)
45·9 (44·9–46·8)
52·5 (51·8–53·3)
60·3 (56·9–63·8)
84·4 (82·1–86·7) 91·0 (88·9–93·1)
Kuwait*
2000–04
68·3 (58·0–78·7)
54·8 (45·2–64·3)
38·9† (26·3–51·5)
78·8† (66·7–90·9)
30·3†§ (19·1–41·5)
38·6 (27·1–50·0)
52·1 (42·9–61·2)
47·1† (24·4–69·8)
76·1§ (65·7–86·5) 93·0 (86·2–99·8)
2005–09
71·0 (63·8–78·2)
73·8† (61·7–86·0)
35·4 (25·2–45·6)
71·9 (63·7–80·0)
24·9 (17·3–32·6)
24·0 (15·9–32·0)
63·2 (55·8–70·7)
59·2† (39·2–79·1)
74·9 (65·6–84·1) 90·7 (83·2–98·2)
2010–14
75·2 (66·4–83·9)
56·6 (44·2–69·0)
35·1 (25·6–44·7)
84·0 (74·1–94·0)
31·8 (23·2–40·4)
25·6 (17·7–33·6)
68·2 (59·5–76·9)
·· 88·4 (80·6–96·2) 96·3 (91·4–100·0)
Malaysia (Penang)
2000–04
·· ·· ·· ·· ·· ·· ·· ·· ·· ··
2005–09
74·4§ (66·3–82·4)
56·3§ (49·5–63·0)
36·4§ (27·3–45·6)
74·9 (67·5–82·3)
20·5† (10·7–30·4)
20·3 (11·5–29·1)
31·4 (24·7–38·1)
41·3†§ (19·0–63·6)
72·8§ (62·4–83·3) 95·3§ (89·2–100·0)
2010–14
65·0§ (52·1–78·0)
57·1§ (48·3–65·9)
46·8§ (34·5–59·0)
87·7 (80·8–94·5)
28·3† (14·7–42·0)
29·6 (21·2–38·0)
51·3 (39·6–63·1)
63·4†§ (45·7–81·2)
82·3§ (72·0–92·5) 85·0†§ (66·2–100·0)
Mongolia*
2000–04
·· ·· ·· ·· ·· ·· ·· ·· ·· ··
2005–09
76·7 (60·0–93·4)
·· ·· ·· ·· ·· ·· ·· ·· ··
2010–14
76·1 (63·8–88·4)
·· ·· ·· ·· ·· ·· ·· ·· ··
Qatar*
2000–04
59·2§ (48·7–69·7)
83·9†§ (68·5–99·2)
47·1†§ (25·1–69·0)
81·5†§ (60·7–100·0)
52·9†§ (34·0–71·9)
63·8†§ (49·8–77·7)
46·5§ (34·5–58·4)
11·1†§ (0·0–27·1)
67·3†§ (44·3–90·3) 69·0§ (52·6–85·4)
2005–09
73·3§ (63·0–83·7)
55·6†§ (35·3–76·0)
62·6†§ (47·5–77·6)
98·2†§ (87·1–100·0)
32·4†§ (19·0–45·8)
52·1†§ (39·7–64·6)
60·3§ (45·9–74·7)
·· 82·6†§ (61·2–100·0) 88·5†§ (73·8–100·0)
2010–14
71·9§ (58·4–85·5)
63·5†§ (44·2–82·8)
39·2§ (26·3–52·1)
89·6§ (79·0–100·0)
36·1†§ (20·5–51·7)
56·9§ (42·0–71·9)
75·0§ (58·8–91·2)
65·5†§ (34·5–96·5)
100·0§ (100·0–100·0)
95·3§ (87·3–100·0)
Singapore*
2000–04
76·3 (73·9–78·7)
68·3 (65·2–71·5)
42·5 (37·9–47·0)
83·4 (80·3–86·5)
26·2 (21·5–30·9)
39·2 (35·1–43·3)
46·0 (43·0–48·9)
60·9 (48·0–73·8)
79·8 (72·3–87·2) 86·9 (77·5–96·3)

Women's cancers Prostate Brain
(adults) Haemopoietic
malignancies (adults)Childhood malignancies
Breast Cervix Ovary
Myeloid Lymphoid Brain
Acute lymphoblastic
leukaemia Lymphoma
2005–09
80·3 (78·3–82·3)
63·3 (60·1–66·6)
46·8 (42·8–50·7)
86·7 (84·5–88·9)
30·3 (26·2–34·4)
43·7 (40·1–47·4)
55·3 (52·7–57·9)
57·5 (45·9–69·0)
90·4 (84·2–96·6) 73·8 (61·6–86·0)
2010–14
80·3 (78·4–82·2)
63·4 (60·2–66·6)
43·9 (40·7–47·0)
87·8 (85·8–89·8)
34·4 (30·6–38·2)
44·1 (41·1–47·1)
58·7 (56·4–61·1)
62·0 (51·4–72·5)
88·6 (81·8–95·4) 92·1 (85·2–99·1)
Taiwan*
2000–04
80·2 (78·9–81·6)
74·3 (73·4–75·2)
44·1 (41·8–46·4)
75·5 (73·8–77·2)
26·5 (24·8–28·1)
23·1 (21·6–24·6)
40·3 (39·2–41·4)
57·1 (52·4–61·8)
72·1 (68·2–75·9) 80·1 (75·6–84·7)
2005–09
82·2 (81·2–83·2)
73·2 (72·2–74·2)
47·5 (45·5–49·5)
79·8 (78·7–81·0)
27·6 (26·0–29·2)
30·4 (29·1–31·7)
46·8 (45·8–47·8)
58·8 (54·1–63·5)
78·8 (75·3–82·3) 84·0 (79·6–88·4)
2010–14
84·2 (83·3–85·1)
70·0 (68·9–71·1)
48·8 (46·9–50·8)
83·0 (81·9–84·0)
28·4 (26·9–29·9)
33·4 (32·2–34·6)
50·5 (49·6–51·5)
54·8 (49·9–59·6)
76·5 (72·8–80·1) 86·7 (82·5–90·8)
Thailand (six registries)
2000–04
56·6§ (52·0–61·3)
53·5§ (51·3–55·7)
41·8§ (34·8–48·7)
52·1§ (46·6–57·6)
11·7§ (9·2–14·3)
9·4§ (7·2–11·6)
30·3§ (26·7–34·0)
23·4§ (15·2–31·5)
54·5§ (46·7–62·4) 43·9†§ (27·1–60·8)
2005–09
64·8§ (62·5–67·0)
55·8§ (54·0–57·7)
35·8 (32·3–39·3)
71·8 (69·0–74·7)
17·6 (15·2–20·0)
18·2 (16·0–20·4)
36·1 (33·7–38·4)
38·4 (30·6–46·3)
60·6 (54·2–67·1) 63·7§ (52·3–75·0)
2010–14
68·7§ (66·6–70·8)
53·9§ (52·1–55·8)
37·2 (34·0–40·5)
68·0 (65·2–70·8)
14·7 (12·6–16·9)
25·4 (22·8–28·0)
35·0 (32·8–37·1)
44·5§ (35·9–53·1)
65·9§ (59·2–72·6) 73·9§ (65·0–82·7)
Turkey (nine registries)
2000–04
84·8 (81·5–88·0)
64·8 (59·7–69·9)
46·1§ (38·3–53·8)
83·4§ (79·3–87·5)
32·1§ (27·9–36·2)
35·9§ (30·6–41·2)
54·3§ (49·6–58·9)
56·8 (46·3–67·2)
72·4 (64·3–80·6) 79·9 (70·9–88·9)
2005–09
80·6 (79·2–82·1)
59·2 (56·5–61·9)
40·0 (37·4–42·6)
81·2 (79·9–82·6)
34·0 (32·4–35·6)
49·0 (46·8–51·2)
50·3 (48·7–51·8)
61·1 (56·2–66·0)
78·7 (74·9–82·6) 85·0 (81·4–88·7)
2010–14
82·1 (80·7–83·5)
60·7 (58·1–63·3)
39·7 (37·3–42·0)
83·8 (82·5–85·1)
35·6 (34·1–37·0)
54·0 (51·8–56·1)
54·5 (53·0–56·1)
62·5 (58·4–66·7)
80·9 (77·2–84·6) 82·9 (79·1–86·7)
Europe
Austria*
2000–04
81·7 (80·9–82·4)
65·4 (63·4–67·4)
40·9 (39·4–42·5)
90·1 (89·3–90·8)
24·2 (22·6–25·9)
25·0 (23·1–26·8)
57·6 (56·5–58·7)
·· ·· ··
2005–09
83·9 (83·2–84·6)
66·0 (63·7–68·2)
41·2 (39·6–42·8)
90·8 (90·1–91·5)
28·5 (26·9–30·1)
29·6 (27·7–31·5)
62·2 (61·1–63·3)
·· ·· ··
2010–14
84·8 (84·1–85·5)
63·9 (61·6–66·2)
41·0 (39·4–42·7)
90·2 (89·5–90·9)
26·3 (24·7–27·9)
32·0 (30·1–34·0)
63·3 (62·3–64·4)
·· ·· ··
Belarus (childhood)‡
2000–04
·· ·· ·· ·· ·· ·· ·· 66·1 (59·8–72·3)
78·5 (73·0–83·9) 86·5 (80·7–92·3)
2005–09
·· ·· ·· ·· ·· ·· ·· 70·4 (64·0–76·8)
87·0 (81·9–92·2) 84·6 (77·0–92·2)
2010–14
·· ·· ·· ·· ·· ·· ·· 68·5 (61·6–75·5)
86·6 (81·7–91·5) 85·2 (78·0–92·4)
Belgium*
2000–04
84·8 (83·5–86·0)
65·1 (61·1–69·0)
42·7 (39·4–45·9)
92·1 (90·8–93·4)
31·5 (28·5–34·5)
49·7 (46·7–52·7)
65·5 (63·6–67·4)
84·1 (75·6–92·6)
80·4 (69·8–91·0) 94·2 (87·9–100·0)
2005–09
85·3 (84·7–
65·7 (63·8–67·6)
42·8 (41·3–44·3)
93·2 (92·6–
31·9 (30·6–
53·2 (51·9–54·5)
68·0 (67·2–68·8)
75·2 (70·3–
90·5 (87·0–94·1) 95·6 (92·9–98·2)

Women's cancers Prostate Brain
(adults) Haemopoietic
malignancies (adults)Childhood malignancies
Breast Cervix Ovary
Myeloid Lymphoid Brain
Acute lymphoblastic
leukaemia Lymphoma
85·8) 93·7) 33·2) 80·1)
2010–14
86·4 (85·9–86·9)
65·4 (63·5–67·2)
43·1 (41·6–44·6)
93·8 (93·2–94·3)
31·2 (29·9–32·5)
55·4 (54·2–56·5)
70·6 (69·8–71·4)
74·5 (70·2–78·9)
90·8 (87·3–94·3) 95·4 (92·7–98·1)
Bulgaria*
2000–04
70·9 (69·7–72·1)
49·2 (47·6–50·7)
32·9 (30·9–34·9)
49·4 (47·1–51·7)
·· 29·9§ (27·2–32·6)
38·1 (36·1–40·0)
·· 63·5 (55·5–71·5) 70·7 (62·2–79·2)
2005–09
75·9 (74·8–77·0)
53·2 (51·7–54·7)
33·9 (32·2–35·5)
54·8 (52·7–56·9)
·· 40·1 (37·6–42·6)
39·9 (38·1–41·6)
·· 74·8 (68·4–81·1) 74·3 (64·9–83·7)
2010–14
78·3 (77·2–79·4)
54·8 (53·3–56·3)
37·3 (35·4–39·1)
68·3 (66·2–70·5)
·· 41·6§ (39·2–44·1)
43·5 (41·8–45·2)
·· 78·3 (71·7–84·9) 87·7 (80·6–94·9)
Croatia*
2000–04
73·6 (72·2–75·0)
63·2 (60·6–65·8)
36·9 (34·6–39·2)
65·7 (63·6–67·9)
37·0 (35·1–38·8)
31·1 (28·6–33·6)
42·7 (41·0–44·4)
65·7 (58·3–73·1)
81·7 (74·3–89·1) 76·6 (66·8–86·3)
2005–09
78·2 (77·0–79·4)
64·3 (61·9–66·7)
33·4 (31·3–35·5)
78·3 (76·7–79·9)
39·6 (37·8–41·5)
29·2 (26·8–31·6)
51·0 (49·3–52·6)
75·2 (67·9–82·5)
86·7 (81·1–92·3) 84·6 (76·2–93·0)
2010–14
78·6 (77·4–79·7)
63·2 (60·8–65·6)
36·0 (33·9–38·2)
80·9 (79·3–82·4)
42·2 (40·4–44·0)
32·2 (29·7–34·7)
52·7 (51·1–54·3)
73·4 (65·6–81·3)
85·2 (79·1–91·3) 94·5 (89·1–99·9)
Czech Republic*
2000–04
75·7 (74·8–76·5)
60·4 (58·9–61·9)
34·3 (33·0–35·5)
71·0 (69·9–72·2)
19·5 (18·2–20·8)
19·9 (18·2–21·7)
49·9 (48·8–51·0)
55·6 (47·9–63·3)
88·0 (82·9–93·1) 89·0 (82·7–95·3)
2005–09
79·1 (78·4–79·9)
62·7 (61·2–64·1)
35·3 (34·0–36·5)
81·5 (80·7–82·3)
22·1 (20·8–23·4)
33·5 (31·8–35·1)
53·2 (52·2–54·3)
64·3 (57·4–71·3)
90·3 (85·6–95·0) 82·9 (73·2–92·5)
2010–14
81·4 (80·7–82·1)
61·0 (59·5–62·4)
36·5 (35·2–37·8)
85·3 (84·6–86·0)
21·4 (20·1–22·7)
36·8 (35·2–38·5)
57·2 (56·1–58·2)
69·7 (63·2–76·2)
88·2 (82·1–94·3) 89·6 (82·5–96·6)
Denmark*
2000–04
80·3 (79·4–81·2)
63·0 (60·6–65·4)
33·1 (31·4–34·8)
63·6 (62·1–65·1)
30·5 (28·8–32·2)
35·7 (33·6–37·8)
57·7 (56·4–59·0)
68·8 (62·1–75·5)
84·3 (78·6–90·0) 90·2 (82·2–98·2)
2005–09
84·0 (83·2–84·8)
66·7 (64·3–69·1)
37·4 (35·7–39·2)
82·5 (81·6–83·4)
35·1 (33·4–36·7)
45·0 (43·0–47·0)
66·9 (65·7–68·0)
79·4 (72·9–85·8)
93·1 (88·4–97·7) 90·0 (83·1–97·0)
2010–14
86·1 (85·4–86·9)
69·5 (67·0–72·0)
39·7 (37·8–41·6)
85·6 (84·7–86·4)
38·9 (37·3–40·6)
47·6 (45·7–49·6)
70·9 (69·8–72·1)
79·5 (73·3–85·6)
94·0 (90·1–97·9) 93·8 (89·0–98·7)
Estonia*
2000–04
70·9 (68·2–73·6)
62·3 (58·5–66·1)
31·2 (27·7–34·6)
67·9 (64·5–71·3)
25·2 (21·4–29·0)
36·6 (31·6–41·6)
48·8 (45·6–52·0)
81·2 (69·9–92·5)
63·7 (51·0–76·4) 88·3† (73·4–100·0)
2005–09
75·4 (73·1–77·6)
66·9 (63·4–70·4)
37·2 (33·8–40·7)
83·2 (80·9–85·6)
26·1 (22·6–29·6)
42·4 (38·1–46·8)
53·5 (50·6–56·4)
72·3† (57·9–86·7)
85·4† (73·6–97·1) 85·8† (68·1–100·0)
2010–14
76·6 (73·8–79·3)
66·5 (62·2–70·7)
42·3 (37·4–47·1)
86·3 (83·5–89·0)
31·0 (26·1–36·0)
37·8 (32·1–43·5)
53·8 (50·2–57·4)
64·5 (47·3–81·8)
87·7 (76·4–98·9) 88·0 (73·1–100·0)
Finland*
2000–04
86·5 (85·5–87·5)
67·8 (64·3–71·3)
41·2 (39·2–43·1)
90·0 (89·1–90·9)
35·4 (33·5–37·4)
40·1§ (37·4–42·8)
56·8 (55·5–58·1)
78·5 (72·5–84·6)
84·7 (78·0–91·4) 90·5 (84·3–96·7)
2005–09
87·7 (86·9–88·5)
65·2 (61·4–69·0)
44·2 (42·2–46·2)
93·4 (92·6–94·1)
35·8 (34·0–37·6)
41·6§ (39·2–44·0)
62·5 (61·2–63·7)
78·0 (71·5–84·5)
88·1 (83·2–92·9) 92·0 (84·5–99·6)
2010–14
88·5 (87·7–
67·4 (63·8–71·1)
41·1 (39·2–43·0)
93·2 (92·4–
37·6 (35·7–
47·2§ (44·7–49·6)
64·4 (63·2–65·5)
75·6 (69·0–
95·2 (91·5–98·9) 91·2 (84·3–98·1)

Women's cancers Prostate Brain
(adults) Haemopoietic
malignancies (adults)Childhood malignancies
Breast Cervix Ovary
Myeloid Lymphoid Brain
Acute lymphoblastic
leukaemia Lymphoma
89·3) 93·9) 39·4) 82·2)
France (23 registries)‡
2000–04
86·8 (86·1–87·4)
61·7 (59·4–64·0)
41·6 (39·8–43·3)
90·1 (89·4–90·8)
21·8 (20·3–23·3)
53·3 (51·9–54·7)
64·4 (63·6–65·3)
67·2 (65·0–69·5)
88·1 (86·4–89·8) 92·7 (90·8–94·6)
2005–09
87·2 (86·6–87·8)
62·1 (60·0–64·2)
42·1 (40·4–43·7)
93·6 (93·1–94·1)
27·2 (25·8–28·7)
54·6 (53·3–55·8)
69·9 (69·1–70·7)
70·8 (68·6–73·0)
90·0 (88·4–91·6) 92·6 (90·6–94·6)
2010–14
86·7 (85·5–88·0)
65·0 (60·3–69·7)
43·5 (40·0–46·9)
93·1 (91·9–94·2)
27·2 (24·2–30·3)
57·5 (54·9–60·1)
69·6 (67·9–71·3)
70·8 (68·1–73·5)
88·6 (86·5–90·8) 94·2 (92·0–96·4)
Germany (ten registries)
2000–04
83·9 (83·4–84·4)
64·9 (63·8–66·1)
40·8 (39·3–42·2)
90·4 (89·9–90·9)
29·1 (24·8–33·3)
46·0 (43·9–48·1)
61·2 (60·4–62·0)
63·1 (56·0–70·2)
94·0 (90·7–97·3) 90·4 (84·2–96·5)
2005–09
85·6 (85·2–85·9)
65·7 (64·6–66·8)
40·6 (39·6–41·6)
91·8 (91·3–92·2)
27·3 (26·2–28·5)
51·9 (50·7–53·1)
65·7 (65·1–66·3)
67·8 (61·1–74·6)
92·1 (89·2–95·0) 93·8 (88·9–98·8)
2010–14
86·0 (85·7–86·4)
65·2 (64·0–66·4)
41·2 (40·2–42·2)
91·6 (91·2–92·0)
29·6 (28·3–30·9)
54·9 (53·5–56·3)
67·9 (67·3–68·6)
69·5 (61·8–77·2)
91·1 (87·4–94·8) 96·9 (94·2–99·6)
Gibraltar*
2000–04
79·3†§ (66·5–92·1)
·· ·· 62·5†§ (31·5–93·5)
·· ·· ·· ·· ·· ··
2005–09
72·1§ (56·8–87·4)
·· ·· 42·3†§ (9·1–75·6)
·· ·· ·· ·· ·· ··
2010–14
·· ·· ·· ·· ·· ·· ·· ·· ·· ··
Greece (childhood)‡
2000–04
·· ·· ·· ·· ·· ·· ·· ·· 80·3 (75·3–85·4) 89·2 (82·6–95·8)
2005–09
·· ·· ·· ·· ·· ·· ·· ·· 84·8 (80·4–89·3) 84·9 (78·3–91·6)
2010–14
·· ·· ·· ·· ·· ·· ·· 68·9 (60·3–77·4)
84·2 (80·0–88·3) 87·5 (81·5–93·5)
Iceland*
2000–04
87·4 (82·9–91·8)
81·8† (72·8–90·8)
39·6 (30·9–48·3)
80·1 (75·5–84·7)
24·1 (19·5–28·6)
48·2 (38·3–58·1)
66·6 (60·4–72·8)
80·0† (56·6–100·0)
·· ··
2005–09
85·8 (81·4–90·2)
87·6† (79·5–95·7)
40·9 (31·3–50·5)
89·7 (86·5–92·9)
21·0 (14·3–27·6)
47·9 (39·7–56·1)
67·9 (62·6–73·1)
73·4† (51·8–94·9)
·· ··
2010–14
89·1 (85·1–93·1)
80·1† (71·2–89·1)
40·3 (31·2–49·4)
90·8 (87·7–93·9)
29·2 (20·8–37·7)
43·4 (35·8–50·9)
71·5 (66·3–76·6)
90·1† (72·4–100·0)
92·4† (78·4–100·0) ··
Ireland*
2000–04
77·2 (75·8–78·5)
57·8 (54·1–61·6)
29·4 (27·2–31·7)
83·7 (82·5–84·9)
26·9 (24·9–29·0)
47·6 (44·9–50·2)
55·4 (53·8–57·0)
67·8 (60·0–75·6)
82·9 (76·6–89·2) 97·4 (94·6–100·0)
2005–09
81·4 (80·2–82·6)
58·7 (55·5–61·9)
31·2 (28·9–33·4)
89·7 (88·7–90·7)
30·8 (28·7–33·0)
52·5 (50·1–55·0)
64·2 (62·7–65·7)
68·6 (61·1–76·1)
87·1 (80·9–93·4) 96·2 (92·0–100·0)
2010–14
82·0 (80·7–83·3)
63·6 (60·1–67·2)
32·8 (30·3–35·3)
91·1 (90·1–92·2)
34·5 (32·0–36·9)
53·1 (50·5–55·8)
66·9 (65·3–68·5)
74·0 (66·4–81·5)
88·3 (82·4–94·3) 95·3 (89·6–100·0)
Italy (45 registries)
2000–04
84·2 (83·8–84·5)
67·3 (66·0–68·7)
37·7 (36·8–38·6)
87·2 (86·7–87·7)
24·1 (23·2–25·1)
46·4 (45·5–47·3)
58·5 (57·9–59·0)
68·5 (64·5–72·5)
82·6 (79·2–86·0) 88·3 (84·9–91·8)

Women's cancers Prostate Brain
(adults) Haemopoietic
malignancies (adults)Childhood malignancies
Breast Cervix Ovary
Myeloid Lymphoid Brain
Acute lymphoblastic
leukaemia Lymphoma
2005–09
85·9 (85·5–86·2)
67·7 (66·5–68·9)
39·3 (38·5–40·1)
89·6 (89·2–90·0)
27·0 (26·2–27·8)
49·2 (48·5–49·9)
61·9 (61·5–62·4)
75·5 (72·3–78·8)
89·2 (86·8–91·6) 89·4 (86·5–92·4)
2010–14
86·0 (85·5–86·4)
66·8 (65·1–68·5)
39·4 (38·3–40·5)
89·5 (89·0–89·9)
28·8 (27·8–29·9)
49·2 (48·2–50·2)
62·6 (61·9–63·2)
74·8 (70·4–79·2)
87·8 (84·4–91·2) 91·6 (87·4–95·7)
Latvia*
2000–04
79·7 (77·1–82·2)
52·8 (49·0–56·6)
40·3 (36·6–44·0)
69·9 (66·5–73·3)
22·2 (18·8–25·7)
22·2 (18·7–25·7)
59·8 (54·9–64·8)
79·7† (67·1–92·2)
80·5 (70·0–91·0) ··
2005–09
79·9 (77·8–82·1)
57·7 (54·2–61·2)
39·8 (36·5–43·1)
88·8 (86·0–91·6)
23·9 (20·8–27·0)
17·9 (14·4–21·4)
64·7 (60·5–68·9)
72·3† (52·2–92·3)
77·0 (66·4–87·7) ··
2010–14
82·2 (80·3–84·2)
56·0 (52·6–59·5)
45·5 (41·9–49·0)
90·4 (87·6–93·2)
26·1 (22·7–29·5)
21·4 (17·9–25·0)
71·6 (67·8–75·4)
67·1 (51·2–83·1)
84·1 (73·2–94·9) ··
Lithuania*
2000–04
64·6 (62·9–66·4)
53·8 (51·6–56·0)
30·2 (28·1–32·3)
75·8 (73·7–77·9)
19·4 (17·2–21·6)
25·4 (22·5–28·3)
43·5 (41·5–45·5)
47·5 (36·2–58·8)
74·3 (65·2–83·3) 86·1 (77·2–95·0)
2005–09
71·3 (69·6–73·1)
59·1 (56·9–61·3)
31·6 (29·5–33·8)
93·8 (92·6–95·1)
22·0 (19·7–24·3)
47·5 (45·1–49·9)
50·8 (48·9–52·7)
66·6 (53·4–79·8)
67·7 (56·5–78·8) 79·6† (67·1–92·1)
2010–14
73·5 (71·3–75·7)
59·2 (56·4–62·0)
35·0 (32·0–37·9)
94·3 (92·7–95·8)
23·4§ (20·4–26·4)
52·8 (49·7–56·0)
56·7 (54·0–59·3)
61·8 (44·7–78·9)
74·7 (62·8–86·5) 93·7 (85·9–100·0)
Malta*
2000–04
79·7 (75·6–83·8)
46·4† (30·8–62·0)
39·6 (31·6–47·5)
81·9 (76·6–87·2)
22·3 (15·2–29·3)
32·7 (24·6–40·8)
43·4 (37·8–49·0)
60·1† (31·7–88·6)
87·5† (71·8–100·0) ··
2005–09
84·8 (81·3–88·2)
65·1† (51·4–78·9)
27·5 (22·0–33·0)
86·4 (81·9–91·0)
20·1 (14·0–26·1)
25·4§ (18·0–32·8)
52·4 (47·3–57·6)
·· 93·8† (82·3–100·0) ··
2010–14
86·9 (83·1–90·6)
57·4 (46·8–68·1)
28·0 (21·4–34·6)
88·2 (83·9–92·5)
28·0 (19·7–36·2)
46·3§ (38·3–54·3)
61·9 (55·8–68·0)
·· ·· ··
Netherlands*
2000–04
83·9 (83·4–84·4)
66·1 (64·1–68·0)
36·3 (35·1–37·6)
83·4 (82·7–84·1)
21·4 (20·4–22·5)
39·4 (38·2–40·6)
54·7 (53·9–55·4)
62·7 (58·4–67·0)
84·1 (80·7–87·4) 86·5 (81·9–91·2)
2005–09
85·8 (85·3–86·3)
65·5 (63·6–67·3)
37·2 (36·0–38·5)
87·5 (86·9–88·1)
26·3 (25·2–27·3)
49·9 (48·8–51·0)
63·7 (63·0–64·4)
66·0 (61·9–70·1)
89·8 (86·9–92·6) 86·5 (82·3–90·8)
2010–14
86·6 (86·1–87·1)
67·5 (65·6–69·3)
37·5 (36·2–38·7)
88·5 (87·9–89·0)
28·2 (27·2–29·3)
52·2 (51·2–53·2)
66·4 (65·8–67·1)
69·1 (65·1–73·1)
90·4 (87·5–93·3) 87·9 (83·5–92·2)
Norway*
2000–04
84·7 (83·7–85·8)
70·9 (68·0–73·7)
41·4 (39·3–43·6)
83·8 (82·8–84·9)
32·4 (30·5–34·3)
41·5 (39·2–43·8)
57·5 (56·1–58·8)
79·7 (73·8–85·5)
87·7 (82·4–93·1) 93·3 (87·2–99·4)
2005–09
87·2 (86·1–88·3)
70·7 (67·8–73·6)
42·8 (40·7–45·0)
90·3 (89·5–91·1)
36·7 (34·9–38·5)
50·9 (48·8–53·0)
64·9 (63·7–66·2)
75·9 (69·7–82·1)
84·9 (78·2–91·6) 90·9 (84·3–97·5)
2010–14
87·7 (86·6–88·8)
73·3 (70·3–76·3)
45·5 (43·3–47·7)
92·9 (92·2–93·7)
36·8 (34·9–38·7)
52·7 (50·7–54·7)
68·4 (67·2–69·6)
74·3 (67·6–81·0)
83·0 (76·5–89·5) 95·2 (90·9–99·4)
Poland (16 registries)*
2000–04
71·3 (70·7–71·9)
51·6 (50·8–52·5)
32·7 (31·9–33·6)
68·8 (67·9–69·7)
26·6 (25·6–27·7)
18·9 (17·9–19·9)
40·3 (39·6–41·0)
62·6 (59·2–66·0)
79·6 (76·3–82·9) 81·7 (77·8–85·6)
2005–09
74·7 (74·2–75·2)
54·4 (53·6–55·3)
35·4 (34·6–36·2)
75·0 (74·4–75·7)
29·0 (28·2–29·8)
26·3 (25·2–27·5)
47·8 (47·2–48·5)
61·7 (58·1–65·3)
84·4 (81·7–87·0) 89·4 (86·4–92·4)

Women's cancers Prostate Brain
(adults) Haemopoietic
malignancies (adults)Childhood malignancies
Breast Cervix Ovary
Myeloid Lymphoid Brain
Acute lymphoblastic
leukaemia Lymphoma
2010–14
76·5 (76·1–77·0)
55·1 (54·2–55·9)
37·5 (36·7–38·3)
78·1 (77·5–78·7)
28·2 (27·4–28·9)
27·3 (26·2–28·4)
52·1 (51·4–52·8)
62·5 (58·7–66·4)
86·9 (84·1–89·7) 92·6 (89·7–95·5)
Portugal (four registries)*
2000–04
81·6 (80·7–82·5)
60·4 (58·6–62·2)
39·9 (37·7–42·1)
87·2 (86·2–88·1)
22·9 (21·3–24·6)
43·7 (41·6–45·8)
51·3 (50·1–52·6)
62·0 (55·0–69·1)
80·8 (75·3–86·4) 86·2 (81·0–91·4)
2005–09
86·1 (85·3–86·9)
65·3 (63·6–67·0)
41·8 (39·7–44·0)
90·0 (89·3–90·8)
23·8 (22·4–25·3)
49·0 (47·1–50·9)
58·2 (57·1–59·2)
63·1 (56·5–69·7)
84·1 (78·8–89·5) 94·0 (90·1–97·9)
2010–14
87·6 (85·9–89·3)
66·2 (62·6–69·8)
43·6 (38·7–48·4)
90·9 (89·1–92·6)
22·7 (19·7–25·8)
49·8 (45·4–54·2)
59·7 (57·3–62·1)
70·5 (57·0–84·1)
89·8 (80·7–98·9) 94·7 (88·9–100·0)
Romania (Cluj)
2000–04
·· ·· ·· ·· ·· ·· ·· ·· ·· ··
2005–09
74·8 (70·4–79·3)
61·7 (57·0–66·5)
28·9§ (22·3–35·6)
78·2 (72·5–83·8)
20·4§ (14·0–26·7)
44·9 (37·2–52·5)
47·3 (42·0–52·5)
·· ·· ··
2010–14
74·8 (68·5–81·1)
65·3 (59·7–70·9)
37·2§ (29·7–44·6)
77·1 (70·0–84·2)
34·0§ (23·8–44·1)
51·5 (42·7–60·3)
40·4 (33·3–47·5)
60·1† (31·6–88·5)
53·9† (28·2–79·6) ··
Russia (five registries)
2000–04
71·6 (69·8–73·4)
59·8 (57·3–62·2)
38·1 (35·2–41·1)
58·8 (55·4–62·1)
25·2 (21·3–29·0)
33·1 (28·7–37·5)
40·5 (37·4–43·5)
61·2 (50·4–72·0)
71·3 (62·6–80·0) 67·0 (54·9–79·1)
2005–09
67·7 (66·4–69·0)
58·0 (56·0–59·9)
33·2 (31·3–35·0)
68·6 (66·2–71·0)
21·2 (19·2–23·2)
35·3 (31·7–39·0)
42·4 (39·8–45·0)
61·2 (50·3–72·0)
74·2 (65·3–83·0) 73·5 (62·6–84·4)
2010–14
70·8 (69·5–72·1)
57·7 (55·7–59·7)
34·8 (32·8–36·8)
79·3 (77·1–81·5)
22·8 (20·8–24·9)
33·2 (29·8–36·7)
45·5 (42·9–48·2)
61·7 (51·5–71·8)
76·9 (68·4–85·4) 92·1 (84·6–99·6)
Slovakia*
2000–04
75·3 (73·5–77·2)
61·8 (59·4–64·3)
35·0 (32·4–37·6)
63·6 (61·1–66·0)
22·0§ (20·0–24·0)
35·1§ (32·2–38·1)
46·6 (44·6–48·6)
67·9 (60·5–75·4)
79·2 (71·8–86·5) 83·8 (75·1–92·5)
2005–09
76·6 (75·1–78·2)
58·9 (56·5–61·3)
34·5 (31·7–37·3)
74·4 (72·7–76·2)
27·2 (25·3–29·0)
37·1 (34·8–39·4)
49·6 (48·0–51·2)
70·0 (62·5–77·5)
80·7 (73·8–87·7) 94·6 (90·1–99·1)
2010–14
75·5 (72·4–78·5)
60·5 (56·2–64·9)
33·4 (28·6–38·2)
74·7 (70·9–78·6)
28·5 (24·3–32·8)
37·5 (32·2–42·8)
51·6 (48·0–55·2)
80·6 (69·4–91·7)
87·0 (77·3–96·7) 88·6 (75·4–100·0)
Slovenia*
2000–04
78·7 (76·9–80·5)
67·2 (63·8–70·7)
37·8 (34·4–41·2)
74·4 (71·9–76·9)
23·0 (19·9–26·1)
42·4 (38·5–46·2)
52·7 (50·2–55·2)
76·5 (66·8–86·3)
89·7 (82·1–97·3) 80·1 (68·7–91·5)
2005–09
82·5 (81·0–84·1)
67·1 (63·3–70·9)
35·4 (32·3–38·4)
83·2 (81·6–84·8)
24·1 (21·2–27·0)
39·8 (36·6–42·9)
56·7 (54·6–58·9)
61·2 (49·2–73·1)
79·1† (67·1–91·1) 100·0† (86·3–100·0)
2010–14
83·5 (81·8–85·2)
65·5 (61·3–69·8)
37·0 (33·4–40·5)
85·0 (83·3–86·7)
24·8 (21·4–28·3)
37·5 (34·2–40·7)
59·0 (56·6–61·3)
60·1 (44·2–76·1)
70·1 (54·4–85·8) 100·0 (100·0–100·0)
Spain (ten registries)
2000–04
82·9 (82·0–83·8)
63·6 (61·3–65·9)
36·0 (34·1–37·9)
85·0 (84·1–85·9)
21·6 (20·2–23·0)
45·4 (43·6–47·2)
58·2 (57·1–59·3)
63·6 (57·7–69·4)
80·9 (76·3–85·5) 85·8 (80·2–91·4)
2005–09
84·6 (83·8–85·4)
64·5 (62·2–66·8)
37·9 (36·1–39·6)
90·4 (89·7–91·1)
27·2 (25·8–28·7)
52·3 (50·8–53·8)
62·2 (61·3–63·2)
63·4 (58·2–68·6)
80·0 (75·4–84·5) 89·9 (85·9–94·0)
2010–14
85·2 (84·0–86·5)
64·5 (60·8–68·1)
39·8 (36·9–42·7)
89·7 (88·6–90·7)
27·4 (25·2–29·7)
50·0 (47·7–52·3)
62·0 (60·5–63·6)
66·2 (58·0–74·4)
84·7 (77·6–91·7) 92·9 (87·5–98·3)
Sweden*

Women's cancers Prostate Brain
(adults) Haemopoietic
malignancies (adults)Childhood malignancies
Breast Cervix Ovary
Myeloid Lymphoid Brain
Acute lymphoblastic
leukaemia Lymphoma
2000–04
85·6 (84·9–86·3)
66·9 (64·7–69·1)
43·2 (41·6–44·8)
85·9 (85·3–86·5)
26·5 (25·1–28·0)
30·7 (28·9–32·6)
58·5 (57·6–59·5)
75·9 (70·5–81·3)
86·8 (82·6–90·9) 84·7 (75·8–93·6)
2005–09
87·9 (87·2–88·5)
67·7 (65·6–69·9)
42·9 (41·2–44·6)
90·1 (89·6–90·6)
29·0 (27·5–30·4)
54·6 (53·1–56·1)
64·2 (63·3–65·1)
78·4 (73·2–83·6)
87·1 (82·6–91·5) 88·6 (81·5–95·8)
2010–14
88·8 (88·2–89·4)
68·3 (66·1–70·4)
46·5 (44·8–48·2)
90·7 (90·2–91·2)
31·6 (30·1–33·0)
57·5 (56·0–58·9)
66·7 (65·9–67·6)
79·8 (74·9–84·7)
89·0 (84·6–93·3) 88·0 (80·4–95·7)
Switzerland (ten registries)‡
2000–04
84·4 (83·3–85·5)
63·4 (58·4–68·4)
36·9 (34·4–39·5)
86·9 (85·8–87·9)
26·4 (23·9–28·8)
46·5 (43·9–49·1)
61·6 (60·1–63·2)
73·7 (67·7–79·8)
87·3 (82·4–92·2) 94·0 (89·5–98·6)
2005–09
86·4 (85·3–87·4)
69·4 (65·1–73·6)
42·0 (39·5–44·4)
88·6 (87·6–89·5)
29·0 (26·7–31·2)
51·6 (49·3–53·9)
70·9 (69·5–72·3)
68·0 (61·2–74·8)
89·2 (84·9–93·4) 94·2 (89·5–98·9)
2010–14
86·2 (85·1–87·3)
71·4 (66·6–76·2)
44·1 (41·3–46·8)
89·2 (88·2–90·3)
29·7 (27·5–31·9)
49·7 (47·2–52·2)
72·0 (70·4–73·5)
71·6 (65·1–78·0)
90·3 (86·1–94·5) 93·6 (88·1–99·1)
UK (four registries)*
2000–04
79·8 (79·5–80·1)
58·9 (58·0–59·9)
30·2 (29·7–30·7)
81·9 (81·6–82·3)
20·6 (20·1–21·2)
42·3 (41·7–42·9)
54·3 (53·9–54·6)
68·4 (66·2–70·7)
85·9 (84·1–87·7) 86·8 (84·1–89·5)
2005–09
83·8 (83·6–84·1)
61·9 (61·0–62·9)
33·2 (32·6–33·7)
86·7 (86·4–86·9)
23·8 (23·3–24·4)
47·7 (47·1–48·2)
60·7 (60·4–61·1)
69·1 (66·9–71·3)
91·4 (89·9–92·8) 90·6 (88·3–93·0)
2010–14
85·6 (85·4–85·9)
63·8 (62·8–64·7)
36·2 (35·7–36·8)
88·7 (88·5–89·0)
26·3 (25·7–26·8)
48·7 (48·1–49·2)
64·9 (64·6–65·3)
71·9 (69·8–74·0)
92·2 (90·9–93·6) 91·7 (89·7–93·8)
Oceania
Australia (eight registries)*
2000–04
87·0 (86·5–87·4)
67·9 (66·1–69·6)
37·3 (36·1–38·6)
87·8 (87·4–88·2)
24·5 (23·5–25·4)
43·3 (42·3–44·3)
61·5 (60·9–62·1)
62·0 (57·7–66·3)
86·5 (83·8–89·1) 91·4 (88·0–94·8)
2005–09
88·5 (88·1–89·0)
67·5 (65·7–69·3)
41·0 (39·8–42·2)
93·2 (92·9–93·5)
28·9 (27·9–29·8)
50·3 (49·4–51·1)
68·1 (67·6–68·7)
60·6 (56·4–64·9)
90·3 (87·9–92·6) 94·2 (91·4–96·9)
2010–14
89·5 (89·1–90·0)
66·4 (64·5–68·2)
42·0 (40·8–43·2)
94·5 (94·1–94·8)
30·2 (29·2–31·2)
51·8 (50·9–52·7)
71·2 (70·6–71·8)
67·1 (62·9–71·4)
90·7 (88·3–93·1) 92·3 (89·2–95·4)
New Zealand*
2000–04
82·8 (81·6–84·1)
67·4 (63·8–71·1)
38·7 (36·0–41·4)
89·1 (88·1–90·0)
19·0 (16·8–21·2)
40·3 (37·8–42·9)
61·0 (59·6–62·5)
60·2 (50·6–69·8)
85·8 (79·9–91·6) 93·6 (88·7–98·4)
2005–09
86·1 (84·9–87·3)
64·4 (60·4–68·4)
33·4 (31·0–35·9)
89·3 (88·4–90·2)
22·7 (20·4–25·0)
49·7 (47·7–51·8)
63·5 (62·1–64·9)
54·4 (42·9–66·0)
91·2 (86·8–95·6) 93·5 (88·0–99·0)
2010–14
87·6 (86·4–88·7)
67·4 (63·4–71·5)
36·7 (34·1–39·3)
90·3 (89·4–91·1)
23·3 (21·0–25·7)
44·1 (42·1–46·2)
65·6 (64·3–66·9)
58·2 (46·1–70·4)
91·4 (86·7–96·1) 96·6 (92·7–100·0)
Some registries contributed data for selected cancers or calendar periods.
*Data with 100% coverage of the national population. †Survival estimate is not age-standardised. ‡Data with 100% coverage of the national population for childhood malignancies only. §Survival estimate considered less reliable because 15% or more of patients were (1) lost to follow-up or censored alive within 5 years of diagnosis or, if diagnosed in 2010 or later, before Dec 31, 2014; or (2) registered only from a death certificate or at autopsy; or (3) patients with unknown vital status or registered with incomplete dates—ie, unknown year of birth, unknown month or year of diagnosis, or unknown year of last known vital status.

Oesophagus
Results are available for 734 428 adults from 290 registries in 60 countries (table 2, table 4). In 2010–14, 5-year age-standardised net survival was in the range 10–30% in most countries, with a much wider range in Asia (appendix p 248). Most survival estimates were considered reliable (table 6; appendix pp 138–151).
Survival was highest in Japan (36·0%) and Korea (31·3%), and less than 30% in all other countries (table 6; appendix p 210). Survival was in the range 20–30% in ten countries: Puerto Rico; the USA; China and Israel; five European countries (Ireland [northern Europe]; and Belgium, Germany, the Netherlands, and Switzerland [western Europe]); and Australia.
Survival trends from 2000 to 2014 increased by 4–5% in three European countries (Denmark and the UK [northern Europe]; and Germany [western Europe]), and the USA (appendix p 229). Survival increased by 6–10% in Puerto Rico; China, Israel, Japan, and Singapore; six European countries (Ireland and Norway [northern Europe]; Portugal [southern Europe]; Belgium, the Netherlands, and Switzerland [western Europe]); and Australia. The increase in Korea was 12·7%.
Stomach
Results are available for 2 019 382 adults from 294 registries in 62 countries (table 2, table 4). Age-standardised 5-year net survival was generally in the range 20–40%, with very wide variation in Asia (appendix p 249). Most estimates were considered reliable (table 6; appendix pp 138–151).
In 2010–14, survival was very high in Korea (68·9%) and Japan (60·3%; table 6; appendix p 211). Survival was in the range 30–40% in 16 countries: Canada and the USA; Puerto Rico and Martinique; five Asian countries (Malaysia [Penang] and Singapore [south Asia]; China and Taiwan [east Asia]; and Israel [west Asia]); six European countries (Italy and Portugal [southern Europe]; and Austria, Belgium, Germany, and Switzerland [western Europe]); and Australia (table 6; appendix p 211).
Survival was in the range 20–29% in 24 countries (Mauritius, Kuwait, Turkey, 20 European countries, and New Zealand), and less than 20% in Chile, Ecuador, India (Karunagappally), Thailand, and Bulgaria.
Survival trends between 1995–99 and 2010–14 were rather flat in most countries (appendix p 230), but after 2000, survival increased by up to 5% in six European countries (Denmark, Lithuania, and the UK [northern Europe]; Poland [eastern Europe]; and Austria and the Netherlands [western Europe]). Over the same 20 years, 5-year survival increased by 6–10% in Canada, Israel, Japan, Estonia, and Ireland, by 11% in the USA and Germany, and by 20% or more in China and Korea.
Colon
Results are available for 4 198 637 adults from 296 registries in 65 countries (Table 2, Table 4). Survival for colon cancer varied widely, especially in Central and South America, Asia, and Europe (figure 4; appendix p 250). Most estimates were considered reliable (table 6; appendix pp 139–151).
For patients diagnosed during 2010–14, survival was higher than 70% in three countries: Israel, Korea, and Australia. Survival was in the range 60–69% in 25 countries: Costa Rica and Puerto Rico; Canada and the USA; Japan, Singapore, and Taiwan; 17 European countries (Denmark, Finland, Iceland, Ireland, Norway, Sweden, and the UK [northern Europe]; Italy, Portugal,

Slovenia, and Spain [southern Europe]; and Austria, Belgium, France, Germany, the Netherlands, and Switzerland [western Europe]); and New Zealand (table 6; appendix p 212).
Survival ranged from 50% to 60% in 18 countries: Mauritius; three Central and South American countries (Martinique, Peru [Lima], and Uruguay); five Asian countries (Malaysia [Penang; south Asia]; China and Hong Kong [east Asia]; and Kuwait and Turkey [west Asia]); and nine European countries (Estonia, Lithuania, and Latvia [northern Europe]; Croatia and Malta [southern Europe]; and Bulgaria, the Czech Republic, Poland, and Slovakia [eastern Europe]). 5-year net survival was less than 50% in Ecuador, Thailand, Russia, and India (table 6).
Survival trends between 1995–99 and 2000–14 were generally flat or increasing (appendix p 231). 5-year survival increased over this period by 5–10% in 14 countries: Canada; Japan and Taiwan; ten European countries (Estonia, Finland, Ireland, Lithuania, and Sweden [northern Europe]; Italy and Malta [southern Europe]; Austria, France, and the Netherlands [western Europe]); and Australia. Over the same period, survival increased by more than 10% in China, Israel, and Korea, and in 13 European countries (Denmark, Iceland, Latvia, Norway, and the UK [northern Europe]; Portugal, Slovenia, and Spain [southern Europe]; and Bulgaria, the Czech Republic, and Poland [eastern Europe]; and Germany and Switzerland [western Europe]).
Rectum
Results are available for 1 720 488 adults from 294 registries in 64 countries (table 2, table 4). Similarly to colon cancer, 5-year net survival for rectal cancer varied widely. The range of survival estimates in Asia for 2010–14 was even wider than that for colon cancer (appendix p 251). Almost all the survival estimates were considered reliable (table 6; appendix pp 139–151).
Survival was higher than 70% in Korea and Australia (table 6). For patients diagnosed during 2010–14, survival was in the range 60–69% in 24 countries: Canada and the USA; four Asian countries (Singapore [south Asia]; Japan and Taiwan [east Asia]; and Israel [west Asia]); 17 European countries (Denmark, Finland, Iceland, Ireland, Norway, Sweden, and the UK [northern Europe]; Italy, Portugal, Slovenia, and Spain [southern Europe]; and Austria, Belgium, France, Germany, the Netherlands, and Switzerland [western Europe]); and New Zealand (table 6; appendix p 213).
Survival was in the range 50–59% in 18 countries: six countries in Central and South America (Argentina, Costa Rica, Martinique, Peru [Lima], Puerto Rico, and Uruguay); five Asian countries (Malaysia [Penang; south Asia]; China and Hong Kong [east Asia]; and Kuwait and Turkey [west Asia]); and six European countries (Estonia, Latvia, and Lithuania [northern Europe]; Malta [southern Europe]; and the Czech Republic and Romania [Cluj; eastern Europe]). 5-year survival was less than 50% in Slovakia, Poland, Croatia, Bulgaria, Ecuador, Thailand, Russia, and India (table 6).
Survival trends between 1995–99 and 2000–14 were generally increasing, especially since 2000, in Asia, Europe, and Oceania (appendix p 232). Survival increased by 5–10% in Japan, Taiwan, and Turkey; Austria, Finland, France, Italy, Malta, and Sweden; and New Zealand.
Over the same period, 5-year survival increased by 10% or more in Canada; Israel and Korea; 16 European countries (Denmark, Estonia, Iceland, Ireland, Latvia, Lithuania, Norway, and the UK [northern Europe]; Portugal and Spain [southern Europe], Bulgaria, the Czech Republic, and Poland [eastern Europe]; and Germany, the Netherlands, and Switzerland [western Europe]); and Australia. The increase was about 20% or more in China, Korea, and Slovenia.

Liver
Results are available for 1 178 364 adults from 291 registries in 61 countries (Table 2, Table 4).
5-year net survival was in the range 5–30% throughout 2000–14 (appendix p 252). Estimates are often flagged as less reliable than for other solid tumours (table 6; appendix pp 139–151) because of the exclusion of higher proportions of DCO registrations (table 3; appendix pp 32–36).
For patients diagnosed during 2010–14, age-standardised 5-year net survival was in the range 20–29% only in Korea, Singapore, and Taiwan; and Belgium and Italy. Survival was in the range 10–19% in 27 countries: Canada and the USA; Martinique; three Asian countries (China [east Asia]; and Kuwait and Turkey [west Asia]); 13 European countries (Iceland, Ireland, Latvia, Norway, Sweden, and the UK [northern Europe]; Portugal and Spain [southern Europe]; Poland [eastern Europe]; France, Germany, the Netherlands, and Switzerland [western Europe]); and Australia and New Zealand. 5-year survival was less than 10% in Denmark, Slovenia, Thailand, the Czech Republic, Russia, and Estonia.
In most countries, survival has changed very little during the 20-year period 1995–99 to 2000–14. It increased by 5–10% in Canada and the USA; Japan; eight European countries (Denmark, Ireland, and the UK [northern Europe]; Italy and Spain [southern Europe]; and France, the Netherlands, and Switzerland [western Europe]); and Australia and New Zealand. Survival increased by more than 10% in China, Korea, and Taiwan; and Norway, Portugal, and Sweden.
Pancreas
Results are available for 1 229 379 adults from 290 registries in 59 countries (Table 2, Table 4).
Age-standardised 5-year net survival estimates were generally in the range 5–15% throughout 2000–14 (appendix p 253). Similarly to liver cancer, some estimates are less reliable (table 6; appendix pp 139–151) owing to the high proportion of DCO registrations (table 3; appendix pp 37–41).
For patients diagnosed during 2010–14, survival was high in Kuwait (23·6%) and Malaysia (Penang; 19·0%; table 6; appendix p 215). Survival was in the range 10–15% in 15 countries: Canada and the USA; Martinique; China, Korea, and Turkey; eight European countries (Estonia, Ireland, Latvia, Norway, and Sweden [northern Europe]; Portugal [southern Europe]; and Belgium and Germany [western Europe]); and Australia. 5-year net survival ranged between 5% and 9% in 14 countries. Survival was very low in Russia (4·4%).
Trends in 5-year survival between 2000–04 and 2010–14 were generally flat, but increases of 3–5% were seen in Canada and the USA; Korea and Singapore; 12 European countries (Denmark, Estonia, Ireland, Latvia, Norway, Sweden, and the UK [northern Europe]; Portugal [southern Europe]; the Czech Republic [eastern Europe]; and Belgium, the Netherlands, and Switzerland [western Europe]); and Australia (appendix p 234).
Lung
Results are available for 6 051 262 adults from 290 registries in 61 countries (Table 2, Table 4).
Age-standardised 5-year net survival was in the range 10–20% in most countries (table 6; appendix p 254). Most estimates in Central and South America were less reliable owing to the high

proportion of DCO registrations excluded from analysis (table 6; appendix pp 152–164), although the proportion of DCOs has generally decreased worldwide (table 3; appendix pp 42–46).
For patients diagnosed during 2010–14, 5-year survival was high in Japan (32·9%). It was in the range 20–30% in 12 countries: Mauritius; Canada and the USA; four Asian countries (China, Korea, and Taiwan [east Asia]; and Israel [west Asia]); and five European countries (Latvia, Iceland, and Sweden [northern Europe]; and Austria and Switzerland [western Europe]; table 6; appendix p 216). In most countries, however, survival was in the range 10–19%: Martinique and Puerto Rico; five Asian countries (Malaysia [Penang] and Singapore [south Asia]; and Cyprus, Kuwait, and Turkey [west Asia]); 21 European countries (Denmark, Estonia, Finland, Ireland, Lithuania, Norway, and the UK [northern Europe]; Croatia, Italy, Malta, Portugal, Slovenia, and Spain [southern Europe]; the Czech Republic, Poland, Russia, and Slovakia [eastern Europe]; and Belgium, France, Germany, and the Netherlands, [western Europe]); and Australia and New Zealand. Survival was less than 10% in Thailand, Brazil, Bulgaria, and India (table 6).
Lung cancer survival trends between 1995–99 and 2000–14 were generally flat, but survival increased by 5–10% in 21 countries: Canada and the USA; Israel, Japan, and Taiwan; 15 European countries (Denmark, Estonia, Iceland, Ireland, Latvia, Norway, Sweden, and the UK [northern Europe]; Portugal and Slovenia [southern Europe]; and Austria, France, Germany, the Netherlands, and Switzerland [western Europe]); and Australia. Survival increased by more than 10% in China and Korea (table 6; appendix p 235).
Melanomaoftheskin
Results are available for 1 553 109 adults from 281 registries in 59 countries (Table 2, Table 4).
Age-standardised 5-year net survival was in the range 60–90% in most countries (appendix p 255). Most estimates were considered reliable (table 6; appendix pp 152–164). For patients diagnosed during 2010–14, 5-year survival estimates exceeded 90% in 11 countries: the USA; eight European countries (Denmark, Sweden, and the UK [northern Europe]; and Belgium, France, Germany, the Netherlands, and Switzerland [western Europe]); and Australia and New Zealand (table 6; appendix p 217).
Survival was in the range 80–89% in 14 countries: Canada; Israel; and 12 European countries (Estonia, Finland, Iceland, Ireland, and Norway [northern Europe]; Italy, Malta, Portugal, Slovenia, and Spain [southern Europe]; the Czech Republic [eastern Europe]; and Austria [western Europe]).
Survival was in the range 70–79% in ten countries: four countries in Central and South America (Argentina, Brazil, Costa Rica, and Puerto Rico); and six European countries (Latvia and Lithuania [northern Europe]; Croatia [southern Europe]; and Poland, Romania [Cluj], and Slovakia [eastern Europe]).
Survival was in the range 60–69% in six countries: four Asian countries (Singapore [south Asia]; Korea and Japan [east Asia]; and Turkey [western Asia]); and Bulgaria and Russia. Survival was less than 60% in Ecuador, China, and Taiwan.
Trends between 2000–04 and 2010–14 were generally stable in North America, Oceania, and Japan, and in several European countries, where 5-year survival was already around 85–90% among patients diagnosed during 2000–04. Survival increased by 5–10% in Korea and in 12 European countries (Denmark, Estonia, Latvia, Lithuania, and the UK [northern Europe]; Croatia, Portugal,

and Slovenia [southern Europe]; Bulgaria, the Czech Republic, and Poland [eastern Europe]; and Belgium [western Europe]).
Breast(women)
Results are available for 6 422 553 women from 298 cancer registries in 66 countries (Table 2, Table 5).
The range of survival estimates is still wide in each continent, apart from North America and Oceania (figure 4; appendix p 256). Most estimates were considered reliable (table 7; appendix pp 152–164).
For women diagnosed during 2010–14, age-standardised 5-year net survival was 85% or higher in 25 countries: Costa Rica and Martinique; Canada and the USA; Israel, Japan, and Korea; 16 European countries (Denmark, Finland, Iceland, Norway, Sweden, and the UK [northern Europe]; Austria, Belgium, France, Germany, the Netherlands, and Switzerland [western Europe]; and Italy, Malta, Portugal, and Spain [southern Europe]); and Australia and New Zealand (table 7; figure 2; appendix p 218).
5-year survival was in the range 80–84% in 12 countries: three countries in Central and South America (Argentina, Peru [Lima], and Puerto Rico); five Asian countries (Singapore [south Asia]; China, Hong Kong, and Taiwan [east Asia]; and Turkey [west Asia]); and four European countries (Ireland [northern Europe]; the Czech Republic and Latvia [eastern Europe]; and Slovenia [southern Europe]). Survival was in the range 70–79% in 12 countries: Cuba and Ecuador; Kuwait and Mongolia; and eight countries in Europe (Estonia and Lithuania [northern Europe]; Croatia [southern Europe]; and Bulgaria, Poland, Romania [Cluj], Russia, and Slovakia [eastern Europe]). Survival was still low in India (Karunagappally; table 7).
5-year net survival continued to increase up to 2010–14 in most countries in Central and South America, east and west Asia, and in all of Europe. Even so, survival remains lower in eastern Europe than in other parts of the continent. In North America and Oceania, 5-year net survival approached 90% (figure 3; appendix p 237).
Cervix
Results are available for 660 744 women from 295 cancer registries in 64 countries (Table 2, Table 5). The global range in cervical cancer survival is still wide (50–70%), especially in Central and South America, Asia, and Europe (table 7; appendix p 257). Most survival estimates are reliable (appendix pp 152–164).
For women diagnosed during 2010–14, age-standardised 5-year net survival was 70% or higher in seven countries (Japan, Korea, and Taiwan; Denmark, Norway, and Switzerland; and Cuba), of which five had national coverage (table 7; appendix p 219).
Survival was in the range 60–69% in 29 countries: Canada and the USA; Brazil and Puerto Rico; five countries in Asia (China and Hong Kong [east Asia]; Singapore [south Asia]; and Israel and Turkey [west Asia]); 18 countries in Europe; and Australia and New Zealand.
Survival was in the range 50–59% in five countries in Central and South America (Argentina, Ecuador, Martinique, Peru [Lima], and Uruguay); India and Kuwait; and six European countries

(Latvia and Lithuania [northern Europe]; Bulgaria, Poland, and Russia [eastern Europe]; and Malta [southern Europe]).
Over the 20 years from 1995 to 2014, 5-year survival has increased by 4–7% in Cuba; Israel, Japan, and Korea; and six European countries (Denmark, Ireland, Lithuania, Norway, and the UK [northern Europe]; and Poland [eastern Europe]; appendix p 238). Survival increased by 8–10% in India; and in Bulgaria, Estonia, and Switzerland. In China, 5-year survival increased by 14·3% from 2000–04 to 2010–14 (table 7).
Ovary
Results are available for 865 501 women from 289 registries in 61 countries (Table 2, Table 5).
Age-standardised 5-year net survival was mostly in the range 30–50%, with even wider variation in Europe and Asia (appendix p 258). Most survival estimates were reliable (table 7; appendix pp 152–164).
For women diagnosed during 2010–14, 5-year survival was still less than 50% in most countries, except Costa Rica (table 7; appendix pp 220, 239, 258). Survival was in the range 40–49% in 24 countries: in Canada and the USA; seven countries in Asia (Singapore [south Asia]; China, Korea, Japan, and Taiwan [east Asia]; and Israel and Turkey [west Asia]); 14 European countries (Denmark, Estonia, Finland, Iceland, Latvia, Norway, and Sweden [northern Europe]; Portugal and Spain [southern Europe]; and Austria, Belgium, France, Germany, and Switzerland [western Europe]); and Australia.
Survival was in the range 30–39% in 19 countries: four in Central and South America (Argentina, Brazil, Ecuador, and Puerto Rico); Kuwait and Thailand; 12 European countries (Ireland, Lithuania, and the UK [northern Europe]; Croatia, Italy, and Slovenia [southern Europe]; Bulgaria, the Czech Republic, Poland, Russia, and Slovakia [eastern Europe]; and the Netherlands [western Europe]); and New Zealand. Survival was less than 30% in Malta and less than 20% in India (Karunagappally; table 7).
Survival trends between 1995–99 and 2010–14 were fairly flat in most countries. However, 5-year survival rose by 5–10% in the USA; Israel, Korea, and Taiwan; 11 European countries (Denmark, Iceland, Ireland, Norway, and Sweden [northern Europe]; Portugal and Spain [southern Europe]; Bulgaria and Poland [eastern Europe]; and France and Switzerland [western Europe]); and Australia. Survival increased by more than 10% in Estonia and Latvia, and by 20% in Japan.
Prostate
Results are available for 5 864 878 men from 290 registries in 62 countries (Table 2, Table 5).
Age-standardised 5-year net survival was in the range 70–100% in most countries (appendix p 259). Most estimates were reliable (table 7; appendix pp 152–164).
For men diagnosed during 2010–14, 5-year survival was approaching 100% in Puerto Rico, Martinique, and the USA. Survival was at least 90% in a further 22 countries: Brazil and Costa Rica; Canada; Israel, Japan, and Korea; 14 European countries (Iceland, Ireland, Finland, Latvia, Lithuania, Norway, and Sweden [northern Europe]; Italy, Portugal, and Spain [southern Europe]; Austria, Belgium, France, and Germany [western Europe]); and Australia and New Zealand.
Survival was in the range 80–89% in 17 countries: Argentina, Ecuador, and Uruguay; five Asian countries (Malaysia [Penang] and Singapore [south Asia]; Taiwan [east Asia]; Kuwait and Turkey [west Asia]); and nine European countries (Denmark, Estonia, and the UK [northern Europe]; Croatia, Malta, and Slovenia [southern Europe]; the Czech Republic [eastern Europe]; and the Netherlands and Switzerland [western Europe]).
Survival approached 80% in Russia, Poland, and Romania (Cluj). It was less than 80% in Slovakia; less than 70% in China, Mauritius, Bulgaria, and Thailand; and less than 50% in India (Karunagappally; table 7).
Over the 20-year period between 1995–99 and 2010–14, age-standardised 5-year net survival rose in most countries. Survival increased by 5–10% in Brazil and Ecuador; Canada; China and Turkey; Austria and Portugal; and New Zealand. During the same period, 5-year survival rose by more than 10% in Israel, Taiwan, and Thailand, and in 12 European countries (Finland, Iceland, Norway, and Sweden [northern Europe]; Croatia, Italy, Malta, and Spain [southern Europe]; and France, Germany, the Netherlands, and Switzerland [western Europe]); and Australia. Survival increased by more than 20% in 13 countries: Japan, Korea, and Malaysia (Penang); and ten European countries (Denmark, Estonia, Ireland, Latvia, Lithuania, and the UK [northern Europe]; Slovenia [southern Europe]; and Bulgaria, the Czech Republic, and Poland [eastern Europe]).
Brain(adults)
Results are available for 656 659 adults from 286 registries in 59 countries (Table 2, Table 5). Age-standardised 5-year net survival was in the range 20–40% in most countries (appendix p 260). Most estimates were considered reliable (table 7; appendix pp 165–177).
For patients diagnosed during 2010–14, 5-year survival was higher than 40% only in Croatia (table 7). Survival was in the range 30–40% in 20 countries: Canada and the USA; Puerto Rico and Martinique; six Asian countries (Singapore [south Asia]; China and Korea [east Asia]; and Israel, Kuwait, and Turkey [west Asia]); nine European countries (Denmark, Estonia, Finland, Ireland, Norway, and Sweden [northern Europe]; and Belgium, Germany, and Switzerland [western Europe]); and Australia.
Survival was in the range 20–29% in 19 countries: Chile and Ecuador; Taiwan; 15 European countries (Iceland, Latvia, and the UK [northern Europe]; Italy, Malta, Portugal, Slovenia, and Spain [southern Europe]; the Czech Republic, Poland, Russia, and Slovakia [eastern Europe]; and Austria, France, and the Netherlands [western Europe]); and New Zealand (table 7). 5-year survival was 14·7% in Thailand.
Trends in 5-year survival between 2000–04 and 2010–14 were generally rather flat, but survival increased by 3–5% in 12 countries: Martinique; Canada; Israel; eight European countries (Iceland, Latvia, Norway, and Sweden [northern Europe]; Croatia and Italy [southern Europe]; and France and Switzerland [western Europe]); and New Zealand.
Survival increased by 6–10% in a further 12 countries: the USA; China, Korea, and Singapore; and seven European countries (Denmark, Estonia, Ireland, and the UK [northern Europe]; Malta and Spain [southern Europe]; and the Netherlands [western Europe]); and Australia.
Myeloidmalignancies
Results are available for 1 151 226 adults from 286 registries in 61 countries (Table 2, Table 5).

Age-standardised 5-year net survival was in the range 30–50% in most countries, although lower in Asia (appendix p 261). Most estimates were considered reliable (table 7; appendix pp 165–177).
For patients diagnosed during 2010–14, survival was 55–60% in Belgium, France, Germany, and Sweden; and in the range 50–54% in Canada; Turkey; eight European countries (Ireland, Lithuania, and Norway [northern Europe]; Portugal and Spain [southern Europe]; Romania [Cluj; eastern Europe]; and the Netherlands and Switzerland [western Europe]); and Australia.
5-year survival was in the range 40–49% in 11 countries: the USA; Martinique and Puerto Rico; Israel, Korea, and Singapore; four European countries (Denmark, Iceland, and the UK [northern Europe]; and Italy [southern Europe]); and New Zealand.
Survival was in the range 30–39% in 12 countries: Argentina and Brazil; Japan, Malaysia (Penang), and Taiwan; and seven European countries (Estonia [northern Europe]; Croatia and Slovenia [southern Europe]; the Czech Republic, Russia, and Slovakia [eastern Europe]; and Austria [western Europe]). Survival was less than 30% in Chile and Ecuador; China, Kuwait, and Thailand; and Latvia and Poland.
Over the 15 years between 2000–04 and 2010–14, age-standardised 5-year net survival increased by 5–10% in 14 countries: the USA; China, Japan, Singapore, and Taiwan; eight European countries (Ireland and the UK [northern Europe]; Portugal and Spain [southern Europe]; Poland [eastern Europe]; and Austria, Belgium, and Germany [western Europe]); and Australia. Survival rose by more than 10% in Korea, Denmark, the Netherlands, and Norway.
Survival increased dramatically in Lithuania (27·4%), Sweden (26·8%), and the Czech Republic (16·9%).
Lymphoidmalignancies
Results are available for 3 011 054 adults from 289 registries in 62 countries (Table 2, Table 5).
5-year age-standardised net survival was usually in the range 40–70% in most countries, but lower in Asia and in Central and South America (appendix p 262). Most estimates were considered reliable (table 7; appendix pp 165–177).
For patients diagnosed during 2010–14, 5-year survival was 70% or higher in six European countries (Denmark, Iceland, and Latvia [northern Europe]; and Belgium, France, and Switzerland [western Europe]); and Australia. Survival was in the range 60–69% in Mauritius; Puerto Rico; Canada and the USA; Israel and Kuwait; 12 European countries (Finland, Ireland, Norway, Sweden, and the UK [northern Europe]; Italy, Malta, Portugal, and Spain [southern Europe]; and Austria, Germany, and the Netherlands [western Europe]); and New Zealand.
Survival was 50–59% in 14 countries: Costa Rica; six Asian countries (Malaysia [Penang] and Singapore [south Asia]; Japan, Korea, and Taiwan [east Asia]; and Turkey [west Asia]); and seven European countries (Estonia and Lithuania [northern Europe]; Croatia and Slovenia [southern Europe]; and the Czech Republic, Poland, and Slovakia [eastern Europe]).
Survival was lower than 50% in five countries in Central and South America (Argentina, Brazil, Chile, Ecuador, and Martinique); China, India (Karunagappally), and Thailand; and Bulgaria, Romania (Cluj), and Russia.

5-year survival trends between 2000–04 and 2010–14 were increasing in most countries. Survival increased by 5–10% in 23 countries: Ecuador; Canada and the USA; Japan and Taiwan; 15 European countries (Finland, Estonia, Iceland, and Sweden [northern Europe]; Croatia, Portugal, and Slovenia [southern Europe]; Bulgaria, the Czech Republic, Russia, and Slovakia [eastern Europe]; and Austria, Belgium, France, and Germany [western Europe]); and Australia and New Zealand.
Survival increased by more than 10% in 14 countries: Puerto Rico; Korea, Kuwait, and Singapore; and ten European countries (Denmark, Ireland, Latvia, Lithuania, Norway, and the UK [northern Europe]; Malta [southern Europe]; Poland [eastern Europe]; and the Netherlands and Switzerland [western Europe]).
Brain(children)
Results are available for 66 814 children from 260 registries in 60 countries (Table 2, Table 5). Age-standardised 5-year net survival was in the range 40–80% in most countries (appendix p 263). Most estimates were reliable (table 7; appendix pp 165–177).
For children diagnosed during 2010–14, age-standardised 5-year net survival was close to 80% in Denmark, Slovakia, and Sweden. Survival was in the range 70–79% in 18 countries: Canada and the USA; Costa Rica and Puerto Rico; Israel and Japan; and 12 European countries (Finland, Ireland, Norway, and the UK [northern Europe]; Croatia, Italy, and Portugal [southern Europe]; the Czech Republic [eastern Europe]; and Belgium, France, Germany, and Switzerland [western Europe]).
Survival was in the range 60–69% in 14 countries: Korea, Singapore, and Turkey; ten European countries (Estonia, Latvia, and Lithuania [northern Europe]; Greece, Slovenia, and Spain [southern Europe]; Belarus, Poland, and Russia [eastern Europe]; and the Netherlands [western Europe]); and Australia. 5-year survival was less than 40% in Brazil and Mexico.
Survival trends between 2000–04 and 2010–14 were generally stable or increasing. 5-year age-standardised survival increased by 5–10% in the USA; China, Korea, and Turkey; six European countries (Ireland [northern Europe]; Croatia, Italy, and Portugal [southern Europe]; and Germany and the Netherlands [western Europe]); and Australia.
Survival increased by 10% or more in four European countries (Denmark and Lithuania [northern Europe]; and the Czech Republic and Slovakia [eastern Europe]).
Acutelymphoblasticleukaemia(children)
Results are available for 87 351 children from 254 registries in 61 countries (Table 2, Table 5).
The global range in survival was very wide, from 50% to more than 90% (figure 2; appendix pp 226, 264). Most estimates were considered reliable. For children diagnosed during 2010–14, age-standardised 5-year net survival was 90% or more in Puerto Rico; Canada and the USA; eight European countries (Denmark, Finland, and the UK [northern Europe]; Portugal [southern Europe]; Belgium, Germany, the Netherlands, and Switzerland [western Europe]); and Australia and New Zealand.
Survival was in the range 80–89% in Costa Rica; six Asian countries (Singapore [south Asia]; Japan and Korea [east Asia]; and Israel, Kuwait, and Turkey [west Asia]); and 14 European

countries (Estonia, Ireland, Latvia, Norway, and Sweden [northern Europe]; Croatia, Greece, Italy, and Spain [southern Europe]; Belarus, the Czech Republic, Poland, and Slovakia [eastern Europe]; and France [western Europe]; table 7; figure 2; appendix p 226).
5-year net survival was still less than 70%, even after adjustment for the very high background mortality in childhood, in Brazil, Chile, Colombia, and Peru (Lima). Survival was less than 60% in China, Ecuador, and Mexico.
In the 20-year period between 1995–99 and 2010–2014, 5-year survival increased by 10% or more in 14 countries: Colombia; five Asian countries (China, Japan, Korea, and Taiwan [east Asia]; and Turkey [west Asia]); eight European countries (Finland, Lithuania, and the UK [northern Europe]; Portugal and Spain [southern Europe]; Belarus and Bulgaria [eastern Europe]; and Belgium [western Europe]; appendix p 245).
Lymphoma(children)
Results are available for 41 196 children from 257 registries in 62 countries (Table 2, Table 5).
5-year age-standardised net survival was generally in the range 80–95% (table 7; appendix p 265). Most estimates were reliable. For children diagnosed during 2010–14, 5-year survival was at least 90% in 29 countries: Canada and the USA; Costa Rica and Puerto Rico; five Asian countries (Singapore [south Asia]; Japan and Korea [east Asia]; and Israel and Kuwait [west Asia]); 18 European countries (Denmark, Finland, Ireland, Lithuania, Norway, and the UK [northern Europe]; Croatia, Italy, Portugal, Slovenia, and Spain [southern Europe]; the Czech Republic, Poland, and Russia [eastern Europe]; and Belgium, France, Germany, and Switzerland [western Europe]); and Australia and New Zealand. 5-year survival was less than 70% only in Ecuador and China (table 7).
5-year survival trends were generally rather flat over the 15 years between 2000–04 and 2010–14 (appendix p 246), but survival increased by 5–10% in the USA; Korea, Singapore, and Taiwan; and six European countries (the UK and Lithuania [northern Europe]; Portugal and Spain [southern Europe]; Slovakia [eastern Europe]; and Germany [western Europe]).
5-year survival increased by more than 10% in Brazil, Bulgaria, Croatia, and Poland, and by at least 20% in Slovenia and Russia (table 7).
Discussion
CONCORD-3 updates the worldwide surveillance of cancer survival to 2014. It is the largest and most up-to-date study of international cancer survival trends. It includes individual data for more than 37·5 million patients diagnosed with cancer during the 15-year period 2000–14. Data were provided by more than 320 population-based cancer registries in 71 countries and territories, in 47 of which the data covered 100% of the population. The participating countries were home to 67% of the world's population in 2014 (7·3 billion people).28 The registries record all cancers diagnosed in a combined population of almost 1 billion people, or 14% of the world population. Internationally comparable survival trends are now available for 18 cancers that collectively represent 75% of all cancers diagnosed worldwide every year.
We used a similar design and statistical approach to those used in CONCORD-26 to enable evaluation of survival trends for ten cancers over the 20-year period 1995–2014. Worldwide survival trends are also available for the first time for melanoma of the skin and cancers of the

oesophagus and pancreas in adults, and for brain tumours and lymphomas in both adults and children.
5-year survival has been recognised by clinicians as an index of the effectiveness of the treatment of cancer for more than 60 years. When applied to hospital case series, it has often been labelled as the 5-year cure rate, because “with so mortal a disease as cancer, those who survive for this length of time can be considered cured”.44 5-year survival has increased for many cancers since the 1950s, but it remains a widely used benchmark, even though it cannot be directly interpreted as the proportion of patients who are cured.45
Population-based cancer survival is increasingly recognised as a key indicator of the overall effectiveness of health systems in managing care and treatment for all patients with cancer.46, 47 Other outcome measures with applications in cancer control include the number of avoidable premature deaths,48, 49, 50, 51, 52, 53 person-years of life lost,54, 55 disability-adjusted life-years lost,56 and estimates of the proportion of patients with cancer who can be considered to have been cured.57, 58, 59, 60, 61 Cancer survival has applications to cancer control and health policy at the state, national, and global levels, in both high-income and low-income countries.62
In some countries, population-based cancer survival estimates might be considered as too high, potentially discouraging ministerial action to improve survival. Estimates showing ethnic or regional variation in cancer survival can be politically sensitive. Survival estimates can also be considered too low if they are seen as a reflection of clinical competence.63 Low levels of survival in a country or region should not be interpreted as an indicator of the competence of the health professionals who work there. Population-based survival reflects the overall effectiveness of the health service, which depends on much wider issues than the competence of any individual doctor or team.64, 65, 66
The Organisation for Economic Co-operation and Development (OECD) recently concluded from the wide international variation in cancer survival that many countries could do better in cancer control.64 It recommended a national cancer plan, adequate funding, and initiatives for early detection and rapid access to high-quality treatment.64 The OECD also recommended improving the quality of cancer data to support monitoring improvements in survival.
From 2017, the OECD has included age-standardised 5-year net survival estimates from the CONCORD programme for colorectal and breast cancers in adults and acute lymphoblastic leukaemia in children among the indicators of health-care quality in its biennial and online publications Health at a Glance.67 This is formal recognition of the global coverage, methodological rigour, and international comparability of the CONCORD survival estimates, which will now contribute to the comparative evaluation of health systems performance in 48 countries, including all OECD member countries. The findings will also help to monitor progress toward the overarching goal of the 2013 World Cancer Declaration: to achieve major improvements in cancer survival by 2020.68
We carried out extensive checks on data quality and liaised with the cancer registries to resolve problems. Many registries told us that the CONCORD data quality reports helped them to improve their data. Some centres in Nigeria and India have modified hospital admission forms or pathology request forms to capture telephone numbers of patients and their next of kin, to facilitate follow-up of their patients. We extended our programs and reports on data quality control. Rectifying errors or inconsistencies in the data often led to extensive discussion with registry staff and resubmission of data with higher quality.

The quality and completeness of cancer registration data and follow-up vary between countries, and this can affect the comparability of survival estimates. We have provided extensive documentation of data quality with standard indicators69 for each cancer and each cancer registry (appendix pp 6–101). Survival figures and trends should be interpreted alongside those indicators. The overall proportion of tumour records excluded because of incomplete dates (0·5%) or for other reasons such as missing vital status (1·2%) has remained very low. The overall proportion of cancers registered solely from a DCO or detected at autopsy dropped to 2·9%, but remains high in some countries where cancer registration processes are slow, especially for the more rapidly lethal cancers of the oesophagus, pancreas, and liver. These are well known issues in population-based cancer registration. DCOs can be included in cancer incidence statistics under certain assumptions, but they reflect some underestimation of incidence.69 By contrast, DCO cases must be excluded from survival analyses, because the patient's survival time is unknown: this tends to inflate survival estimates.70
In some countries, survival estimates have fluctuated or declined in successive calendar periods; this is likely to reflect improvements in the completeness of cancer registration data and in the completeness of follow-up for vital status. In Jordan, for example, linkage with the national death index has been insufficient because only about 70% of deaths are certified. Survival estimates were very high for stomach and colorectal cancers and are flagged as less reliable. A recent hospital-based survival study71 from Jordan suggests that colon cancer survival in Jordan is much lower than the estimates we have obtained. Other countries with incomplete death registration, such as India, follow up their patients actively to determine their vital status.
Despite these problems, we believe our findings represent the best that can be achieved with the available coverage and quality of cancer registration systems and vital statistics systems worldwide. The quality of diagnostic evidence is generally high. Data quality has improved in many countries, with increasing proportions of cases for which the diagnosis was confirmed by pathology, imaging, or biomarkers, and a reduction in the proportion of patients lost to follow-up. Pathological confirmation of a primary, invasive malignancy was available for more than 94% of all patients. The proportion varies widely between countries and for different cancers, but the evidence supporting a cancer diagnosis in routine cancer registry data is far more precise and definitive than for the cause or causes of death recorded on death certificates, from which mortality statistics are derived.72, 73, 74, 75
In some cases, especially in South America, the improvement in data quality is reflected in survival estimates that are actually lower than those previously published,6 with fewer DCO registrations and more complete follow-up. In Brazil, for example, improvement in the quality and completeness of the national death registry76 during 2000–15 has enabled more complete linkage of death records with the cancer registries. In several countries, survival estimates that were flagged as less reliable in CONCORD-2 are now more reliable, even if the survival estimates are lower.
To estimate the global burden of cancer incidence, assumptions are required where no cancer registries exist, usually by modelling incidence and mortality data from other countries in the same world region.2, 77 By contrast, we have made no attempt to model cancer survival in countries or regions where population-based cancer registration data were not available. Cancer survival cannot be estimated or modelled by assuming that the health system is as effective as in some other country for which population-based survival estimates are available. On the contrary, cancer survival estimates are required to assess the overall effectiveness of a country's health system in the first place. For that, cancer registries are essential.
The survival estimates reported here are derived directly from the records of individual patients diagnosed with cancer, and from long-term follow-up to ascertain their vital status, followed by standardised quality control and central analysis. This is not a compilation of published reports or a meta-analysis.
Survival for most cancers remains among the highest in the world in the USA, Canada, Australia, and New Zealand, and in Finland, Iceland, Norway, and Sweden. Publications that showed surprisingly low survival in Denmark78, 79 prompted national cancer plans in 2000, 2005, and 2011 that were all focused on early diagnosis and treatment to improve survival.80 From 2007, cancer was regarded as an acute life-threatening disease, leading to accelerated cancer-specific pathways for diagnosis, with public monitoring of hospitals' compliance with waiting times. For most cancers, survival has increased more rapidly in Denmark, nearly catching up with the other Nordic countries.81, 82 Norway and Sweden have now established similar pathways for cancer patients.
Cancer survival trends are generally increasing, even for some of the more lethal cancers. In some countries, survival increased by up to 5% for cancers of the liver, pancreas, or lung. For example, survival trends for liver cancer were generally stable during 1995–2014, but survival increased by more than 10% in Korea, Singapore, and Norway.
However, for cancers for which 5-year survival remains extremely low in all countries (eg, pancreatic cancer, in the range 5–15%), international efforts will be required to understand risk factors, improve prevention, and promote earlier diagnosis and better treatment to improve outcomes. International comparisons of survival for pancreatic cancer include both ductal adenocarcinomas and the less common neuroendocrine tumours, for which survival is generally higher. The effect of variation in these proportions will require detailed analysis.
Age-standardised 5-year net survival for stomach cancer was less than 30% in most countries, but high in Korea (68·9%) and Japan (60·3%), where it increased by 10% or more between 2000–04 and 2010–14. This pattern is likely to be associated with long-standing population-based endoscopic screening programmes for early detection of gastric and oesophageal cancers, which are very common. Population awareness is high. Gastric cancer screening in Korea started in 1999 as part of the National Cancer Screening Programme, with biennial contrast radiology or endoscopy for adults aged 40 years or older.83 This doubles the chances of early diagnosis compared with unscreened patients.84 Endoscopic resection with clear margins can be curative in stage I oesophageal and gastric cancers (up to 2 cm diameter) if invasion is limited to the superficial submucosa and there is no lymphovascular invasion.85 By contrast, in countries where gastric cancer is a less serious public health issue, and in the absence of screening, this cancer is often diagnosed at an advanced stage. In Russia in 2015, for example, stomach cancer was most often diagnosed in stage IV (40%), and open laparotomy, chemotherapy, and radiation were required for 22% and 25% of cases in stages II and III, respectively. Screening for oesophageal and gastric cancers should be considered as part of national cancer control plans in countries where these tumours are common, or in high-risk populations.86
Survival trends for colorectal cancer were generally flat, or increasing, over the 20 years 1995–2014. Survival for rectal cancer was very similar among the Nordic countries (64–69%) and among most southern European countries (61%).
Survival from melanoma of the skin is generally lower in Asian populations than in the rest of the world. One explanation might be lower public awareness because melanoma is less common in Asian populations, but it could also be that Asian patients typically present with more advanced

disease and with acral lentiginous melanoma. This is one of the more lethal subtypes, and it is more common in Asian populations than in western populations.87 In the CONCORD data (not shown), acral lentiginous melanoma represents 1·2% of all skin melanomas, and 1% in Europe and North America, but 6% in Asia.
The increasing trend in 5-year net survival from breast cancer during the 15 years 1995–20096 has continued in most countries up to 2014, but remains lower in India, Thailand, and several of the eastern European countries.
5-year survival from cervical cancer has increased in several European and Asian countries. However, survival can even decline following an increase in diagnostic activity. In North America and Oceania, survival is lower than in other countries due to more intensive screening programmes that detect precancerous cells and in-situ tumours. These can be cured with a range of simple techniques, reducing the incidence of invasive malignancy by removal of the more indolent pre-invasive lesions, whereas the more aggressive tumours are less likely to be detected by screening.
Some of the global range in survival might be attributable to differences in the intensity of diagnostic activity, and to overdiagnosis from the detection of very small or less aggressive tumours that would not have been expected to lead to symptomatic diagnosis or death in the patient's expected lifetime.88, 89 As in CONCORD-2,6 we were unable to use the proportion of in-situ cancers to compare the intensity of diagnostic activity for solid tumours. Some registries still do not record in-situ tumours and other registries did not submit data for in-situ tumours.
Because screening programmes are only available in wealthier countries, mainly in selected age ranges for cancers of the breast, cervix, and colon, the extent of overdiagnosis seems unlikely to have a large effect on the global range of cancer survival. Measures of overdiagnosis are only available at the population level, so their application in the interpretation of cancer survival patterns would be limited to ecological comparisons, as for gross domestic product (GDP) or total national expenditure on health. By contrast, data on stage at diagnosis are available for individuals. Analyses of the distribution of stage at diagnosis and stage-specific survival will be expected to provide further insight into international variation in cancer survival.90, 91
Survival from the adult leukaemias up to 2009 in Asian populations was much lower than in Europe, North America, and Oceania.6 One possible explanation was the relative rarity in Asian populations of chronic lymphocytic leukaemia, which has a relatively good prognosis in western populations. However, survival from chronic lymphocytic leukaemia is also much lower in Taiwan than in the USA,92 and the findings reported here also show that survival in adults is generally lower in southeast Asia than in other countries, for both myeloid and lymphoid malignancies. The difference between the median of the survival estimates for Asian populations and for other populations narrowed between 2000–04 and 2010–14, for both myeloid and lymphoid malignancies. In most southeast Asian countries, survival for myeloid malignancies has risen by 5–14%, and by 10% or more for lymphoid malignancies.
Survival from brain tumours in children is generally higher than for adults, but the global range is much more pronounced. Some of the international variation in survival from brain tumours might be due to variation in the proportion that are benign. Where benign tumours are registered, the proportion typically ranges up to 10–15% in both adults and children (data not shown). However, some registries do not record benign brain tumours, and this varies both between and within countries. For example, in Australia, benign brain tumours are not registrable in New South Wales or Western Australia (45% of the national population), whereas they comprise up to 5% of brain tumours in Queensland and Victoria, with a similar combined population. The impact of

morphology, behaviour, and grade on international patterns of brain tumour survival needs further research.
International variation in survival for childhood lymphoma was less marked than for childhood acute lymphoblastic leukaemia. The marked increase in 5-year survival among children diagnosed with lymphoma in Brazil (from 69·2% in 2000–04 to 88·2% in 2010–14) is likely to reflect a real improvement in diagnosis and treatment.
Cancer kills more than 100 000 children every year, mainly in low-income and middle-income countries,93 where access to health services is often poor and abandonment of treatment is a major problem.94, 95 Reliable data on the cost and the effectiveness of health services in managing childhood cancer are scarce, yet such data would offer important evidence for countries to compare the impact of their strategies for managing children with cancer.96 Survival estimates published here for children diagnosed with a brain tumour, lymphoma, or leukaemia will be used in a Lancet Oncology Commission on childhood cancer, designed to establish the evidence for investing in effective interventions to reduce the burden of childhood cancer.
Survival trends could not be systematically assessed in Africa. In some registries, the proportion of records with incomplete dates reached up to 40%. Survival estimates for acute lymphoblastic leukaemia in Algeria were considered less reliable because follow-up was less than 5 years for more than 50% of children. For Nigeria (Ibadan) and South Africa (Eastern Cape), data were only available for 12 and seven children, respectively, and survival was not estimated. Where survival could be estimated with some confidence, it was often very low, although survival in Mauritius was generally higher. In Nigeria, for example, there are no trained medical oncologists. Some haematologists and paediatric oncologists administer chemotherapy, but the availability of chemotherapy is limited in both the public and private sectors. Most patients pay out of their own pocket, and the cost is prohibitive. These factors frequently disrupt treatment and are likely to lead to poor outcomes.
To control for background mortality by age and sex, we updated the library of life tables for 1995–2010 by country, registry, race (selected countries), and calendar year to 2014, with a statistical summary for each set of life tables. The updated library is available from the Cancer Survival Group website. In some countries, it has become more difficult to obtain the death and population counts required to construct life tables.
Survival estimates from CONCORD-2 for cancers of the breast and cervix were used in a recent Lancet Series on women's cancers,97, 98 to help to describe trends in the global burden of these cancers. Survival for the 2 million women diagnosed with one of these cancers every year remains highly dependent on the country in which they live. The Series highlighted the urgent need for more cost-effective cancer control strategies in low-income and middle-income countries.
The global economic cost of treating the 12·9 million new patients diagnosed with cancer worldwide in 2009 was estimated at US$285·8 billion.99 The costs of cancer treatment and care in the USA alone were projected to rise by 23% between 2010 and 2020, from $124·6 to $157·7 billion, solely on the basis of demographic change, and with fixed incidence rates, survival probabilities, and treatment costs.100 If treatment costs rise by 2% a year in the first and last phases of treatment, the overall cost of treatment and care in the USA could reach $172·8 billion, a 39% increase. If incidence rates continue to rise, the prevalence of cancer survivors will increase further, triggering still further increase in the costs of care.

On the basis of these figures, it seems plausible that the global cost of cancer treatment and care in 2017 must already be substantially higher than $300 billion a year. Spiralling costs101 threaten the viability of health systems and national economies. Where universal health coverage has not been achieved, the out-of-pocket costs of cancer treatment can lead to financial catastrophe for individuals and families.3
The indirect economic costs associated with premature death and lost productivity from the growing cancer burden have been estimated at $1·16 trillion a year,3 or approaching 2% of global GDP.102 The increasing cost and complexity of cancer treatment might require a radical shift in cancer policy, in which inequitable access to affordable cancer treatment ceases to be politically acceptable.103 Population-based data on cancer survival trends that are comparable within and between countries are part of the evidence base needed to drive such a policy shift.
With this background, cancer registries can be seen as efficient public health instruments, producing a continuous stream of valuable information for cancer control at low cost.104 In Europe in 2013, the average cost per patient registered, including the registry's costs for personnel, information technology, and infrastructure, was €51 (range €6–213; equivalent to $59 [7–252]). This is less than the typical cost of a chest x-ray. For the population as a whole, the cost was less than €1 ($1·18) per person per year.
In 2015, the UN introduced 17 Sustainable Development Goals (SDGs), aiming to end poverty, protect the planet, and ensure prosperity for all.105 Goal 3 is “to ensure healthy lives and promote well-being for all at all ages”. For this goal, target 3.4 is to reduce “premature” mortality (among people aged 30–70 years) from non-communicable diseases, including cancer, by a third by 2030, through prevention and treatment.106 The challenge will be to secure overall improvements in health outcomes that do not lead to wider inequalities.107
Achieving the SDG target of a one-third reduction in premature mortality by 2030 clearly requires more effective prevention to reduce cancer incidence. However, the 15-year timeframe is short, and achieving the target will also require investment in more effective health systems, to improve survival.46
WHO recently called for the development of population-based cancer registries, so that effective policies for cancer control can be founded on accurate data.3 It also called for stronger civil registration and vital statistics systems. These systems support the basic functions of government and enable measurement of progress towards development goals,108 yet population coverage is poor in low-income and middle-income countries, and closely related to gross national income.109
Most cancer registries establish the vital status of all patients registered with cancer by linkage with vital statistics data (regional or national death indexes). This is known as passive follow-up, although many registries also contact patients' doctors or families directly (active follow-up). For passive follow-up to work, efficient civil registration systems that capture information on all deaths are required. This process underpins the estimation of population-based cancer survival, even though active follow-up can be effective in some populations. Yet cancer registries report increasing difficulty in linking their databases to regional or national death indexes. Legal and administrative obstacles and technical difficulties have all been reported. Some national authorities holding death indexes clearly give very low priority to such linkages.
These problems undermine the public health purpose of cancer registration. Of the 400 operational registries we contacted, more than 20 were unable to follow up all registered patients to ascertain their vital status. This problem arose in 16 countries, including some high-income countries. Some

registries were unable to provide survival data at all. In Canada, for example, national coverage of cancer survival statistics was achieved for the first time in CONCORD-2,6 with data from all 13 provinces and territories for 1995–2009, but several jurisdictions were unable to participate in CONCORD-3 because of legal or administrative difficulties in linking their cancer registry with death records. For eight countries that expressed interest or even submitted data, these difficulties meant that no survival estimates could be produced at all: Benin, Bosnia and Herzegovina, Indonesia, Panama, the Philippines, Saudi Arabia, Serbia, and Tunisia.
It is crucial for national and regional governments to recognise that population-based cancer registries are key policy tools, both to monitor the impact of cancer prevention strategies and to evaluate the effectiveness of the health system for all patients diagnosed with cancer. All registries, especially those in low-income and middle-income countries, need to be given adequate resources to register all patients with cancer in a timely fashion, the right to access up-to-date national and regional death records to establish their vital status, and the legislative stability to operate efficiently over the long term.110
For the database of global administrative areas see http://www.gadm.org/
For the life tables from the CONCORD programme see http://csg.lshtm.ac.uk/toolsanalysis#tools
Contributors
CA, AB, CAS, and MPC drafted the protocol. CA and MPC obtained statutory and ethical approvals. GAeS, W-QC, GE, SE, CJJ, GHL, AM, TM, OJO, MV, and HKW contributed to data acquisition. CA, VDC, and MPC prepared the life tables. CA, VDC, RH, MM, MN, AB, and MPC had access to all the raw data. CA, VDC, RH, MM, MN, AB, CJJ, and MPC did the data preparation, quality control, and analyses, and CA, VDC, RH, MM, MN, AB, JA, GE, JE, SE, OV, RW, and MPC checked the results. CA and MPC drafted the report. All authors contributed to writing the final report and approved the version to be published. All members of the CONCORD Working Group had access to the results of all steps of data preparation, quality control, and analyses, and contributed to interpretation of the findings.
CONCORD Working Group
Africa: Algeria: S Bouzbid (Registre du Cancer d'Annaba); M Hamdi-Chérif*, Z Zaidi (Registre du Cancer de Sétif); K Meguenni, D Regagba (Registre du Cancer Tlemcen); Mali: S Bayo, T Cheick Bougadari (Kankou Moussa University); Mauritius: S S Manraj (Mauritius National Cancer Registry); Morocco: K Bendahhou (Registre du Cancer du Grand Casablanca); Nigeria: A Fabowale, O J Ogunbiyi* (Ibadan Cancer Registry); South Africa: D Bradshaw, N I M Somdyala (Eastern Cape Province Cancer Registry). America (Central and South): Argentina: I Kumcher, F Moreno (National Childhood Cancer Registry); G H Calabrano, S B Espinola (Chubut Cancer Registry); B Carballo Quintero, R Fita (Registro Provincial de Tumores de Córdoba); M C Diumenjo, W D Laspada (Registro Provincial de Tumores de Mendoza); S G Ibañez (Population Registry of Cancer of the Province Tierra del Fuego); Brazil: C A Lima (Registro de Câncer de Base Populacional de Aracaju); P C F De Souza (Registro de Câncer de Base Populacional de Cuiabá); K Del Pino, C Laporte (Registro de Curitiba); M P Curado, J C de Oliveira (Registro de Goiânia); C L A Veneziano, D B Veneziano (Registro de Câncer de Base Populacional de Jaú); M R D O Latorre, L F Tanaka (Registro de Câncer de São Paulo); M S Rebelo, M O Santos (Instituto Nacional de Câncer, Rio de Janeiro); G Azevedo e Silva* (University of Rio de Janeiro); Chile: J C Galaz (Registro Poblacional de Cáncer Region de Antofagasta); M Aparicio Aravena, J Sanhueza Monsalve (Registro Poblacional de Cáncer de la Provincia de Biobio; Registro Poblacional de

Cáncer Provincia de Concepción); D A Herrmann, S Vargas (Registro Poblacional Region de Los Rios); Colombia: V M Herrera, C J Uribe (Registro Poblacional de Cáncer Area Metropolitana de Bucaramanga); L E Bravo, L S Garcia (Cali Cancer Registry); N E Arias-Ortiz, D Morantes (Registro Poblacional de Cáncer de Manizales); D M Jurado, M C Yépez Chamorro (Registro Poblacional de Cáncer del Municipio de Pasto); Costa Rica: S Delgado, M Ramirez (Registro Nacional de Tumores de Costa Rica); Cuba: Y H Galán Alvarez, P Torres (Registro Nacional de Cáncer de Cuba); Ecuador: F Martínez-Reyes (Cuenca Tumor Registry); L Jaramillo, R Quinto (Guayaquil Cancer Registry); J Castillo (Loja Cancer Registry); M Mendoza (Manabí Cancer Registry); P Cueva, J G Yépez (Quito Cancer Registry); France: B Bhakkan, J Deloumeaux (Registre des cancers de la Guadeloupe); C Joachim, J Macni (General Cancer Registry of Martinique); Mexico: R Carrillo, J Shalkow Klincovstein (Centro Nacional para la Salud de la Infancia y la Adolescencia); R Rivera Gomez (Registro Poblacional de Cancer Region Fronteriza Norte de Mexico Zona Tijuana); Peru: E Poquioma (Lima Metropolitan Cancer Registry); Puerto Rico: G Tortolero-Luna, D Zavala (Puerto Rico Central Cancer Registry); Uruguay: R Alonso, E Barrios (Registro Nacional de Cáncer).
America (North): Canada: A Eckstrand, C Nikiforuk (Alberta Cancer Registry); R R Woods (British Columbia Cancer Registry); G Noonan, D Turner* (Manitoba Cancer Registry); E Kumar, B Zhang (New Brunswick Provincial Cancer Registry); F R McCrate, S Ryan (Newfoundland & Labrador Cancer Registry); M MacIntyre, N Saint-Jacques (Nova Scotia Cancer Registry); D E Nishri* (Ontario Cancer Registry); C A McClure, K A Vriends (Prince Edward Island Cancer Registry); S Kozie, H Stuart-Panko (Saskatchewan Cancer Agency); USA: T Freeman, J T George (Alabama Statewide Cancer Registry); J T Brockhouse, D K O'Brien (Alaska Cancer Registry); A Holt (Arkansas Central Cancer Registry); L Almon (Metropolitan Atlanta Registry); S Kwong, C Morris (California State Cancer Registry); R Rycroft (Colorado Central Cancer Registry); L Mueller, C E Phillips (Connecticut Tumor Registry); H Brown, B Cromartie (Delaware Cancer Registry); A G Schwartz, F Vigneau (Metropolitan Detroit Cancer Surveillance System); G M Levin, B Wohler (Florida Cancer Data System); R Bayakly (Georgia Cancer Registry); K C Ward (Georgia Cancer Registry; Metropolitan Atlanta Registry); S L Gomez, M McKinley (Greater Bay Area Cancer Registry); R Cress (Cancer Registry of Greater California); M D Green, K Miyagi (Hawaii Tumor Registry); C J Johnson (Cancer Data Registry of Idaho); L P Ruppert (Indiana State Cancer Registry); C F Lynch (State Health Registry of Iowa); B Huang, T C Tucker* (Kentucky Cancer Registry); D Deapen, L Liu (Los Angeles Cancer Surveillance Program); M C Hsieh, X C Wu (Louisiana Tumor Registry); M Schwenn (Maine Cancer Registry); S T Gershman, R C Knowlton (Massachusetts Cancer Registry); G Alverson, G E Copeland (Michigan State Cancer Surveillance Program); S Bushhouse (Minnesota Cancer Surveillance System); D B Rogers (Mississippi Cancer Registry); J Jackson-Thompson (Missouri Cancer Registry and Research Center); D Lemons, H J Zimmerman (Montana Central Tumor Registry); M Hood, J Roberts-Johnson (Nebraska Cancer Registry); J R Rees, B Riddle (New Hampshire State Cancer Registry); K S Pawlish, A Stroup (New Jersey State Cancer Registry); C Key, C Wiggins (New Mexico Tumor Registry); A R Kahn, M J Schymura (New York State Cancer Registry); S Radhakrishnan, C Rao (North Carolina Central Cancer Registry); L K Giljahn, R M Slocumb (Ohio Cancer Incidence Surveillance System); R E Espinoza, F Khan (Oklahoma Central Cancer Registry); K G Aird, T Beran (Oregon State Cancer Registry); J J Rubertone, S J Slack (Pennsylvania Cancer Registry); L Garcia, D L Rousseau (Rhode Island Cancer Registry); T A Janes, S M Schwartz (Seattle Cancer Surveillance System); S W Bolick, D M Hurley (South Carolina Central Cancer Registry); M A Whiteside (Tennessee Cancer Registry); P Miller-Gianturco, M A Williams (Texas Cancer Registry); K Herget, C Sweeney (Utah Cancer Registry); A T Johnson (Vermont Cancer Registry); M B Keitheri Cheteri, P Migliore Santiago (Washington State Cancer Registry); S E Blankenship, S Farley (West Virginia Cancer Registry); R Borchers, R Malicki (Wisconsin Department of Health Services); J R Espinoza, J Grandpre (Wyoming Cancer Surveillance

Program); H K Weir*, R Wilson (Centers for Disease Control and Prevention); B K Edwards*, A Mariotto (National Cancer Institute). Asia: China: Y Lei, N Wang (Beijing Cancer Registry); J S Chen, Y Zhou (Changle City Cancer Registry); Y T He, G H Song (Cixian Cancer Registry); X P Gu (Dafeng County Center for Disease Control and Prevention); D Mei, H J Mu (Dalian Centers for Disease Prevention and Control); H M Ge, T H Wu (Donghai County Center for Disease Prevention and Control); Y Y Li, D L Zhao (Feicheng County Cancer Registry); F Jin, J H Zhang (Ganyu Center for Disease Prevention and Control); F D Zhu (Guanyun Cancer Registry); Q Junhua, Y L Yang (Haimen Cancer Registry); C X Jiang (Haining City Cancer Registry); W Biao, J Wang (Jianhu Cancer Registry); Q L Li (Jiashan County Cancer Registry); H Yi, X Zhou (Jintan Cancer Registry); J Dong, W Li (Lianyungang Center for Disease Prevention and Control); F X Fu, S Z Liu (Linzhou Cancer Registry); J G Chen, J Zhu (Qidong County Cancer Registry); Y H Li, Y Q Lu (Sihui Cancer Registry); M Fan, S Q Huang (Taixing Cancer Registry); G P Guo, H Zhaolai (Cancer Institute of Yangzhong City); K Wei (Zhongshan City Cancer Registry); W Q Chen*, H Zeng (The National Cancer Center); Cyprus: A V Demetriou (Cyprus Cancer Registry); Hong Kong: W K Mang, K C Ngan (Hong Kong Cancer Registry); India: A C Kataki, M Krishnatreya (Guwahati Cancer Registry); P A Jayalekshmi, P Sebastian (Karunagappally Cancer Registry); A Nandakumar* (National Centre for Disease Informatics and Research); Iran: R Malekzadeh, G Roshandel (Golestan Population-based Cancer Registry); Israel: L Keinan-Boker, B G Silverman (Israel National Cancer Registry); Japan: H Ito, H Nakagawa (Aichi Cancer Registry); M Sato, F Tobori (Akita Prefectural Cancer Registry); I Nakata, N Teramoto (Ehime Prefectural Cancer Registry); M Hattori, Y Kaizaki (Fukui Cancer Registry); F Moki (Gunma Prefectural Cancer Registry); H Sugiyama, M Utada (Hiroshima Prefecture Cancer Registry); M Nishimura, K Yoshida (Hyogo Prefectural Cancer Registry); K Kurosawa, Y Nemoto (Ibaraki Prefectural Cancer Registry); H Narimatsu, M Sakaguchi (Kanagawa Cancer Registry); S Kanemura (Miyagi Prefectural Cancer Registry); M Naito, R Narisawa (Niigata Prefecture Cancer Registry); I Miyashiro, K Nakata (Osaka Cancer Registry); S Sato, M Yoshii (Saga Prefectural Cancer Registry); I Oki (Tochigi Prefectural Cancer Registry); N Fukushima, A Shibata (Yamagata Prefectural Cancer Registry); K Iwasa, C Ono (Yamanashi Cancer Registry); T Matsuda* (National Cancer Center); Jordan: O Nimri (Jordan National Cancer Registry); Korea: K W Jung, Y J Won (Korea Central Cancer Registry); Kuwait: E Alawadhi, A Elbasmi (Kuwait Cancer Registry); Malaysia: A Ab Manan (Malaysia National Cancer Registry); F Adam (Penang Cancer Registry); Mongolia: E Sanjaajmats, U Tudev (Cancer Registry of Mongolia); C Ochir (Mongolian National University of Medical Sciences); Qatar: A M Al Khater, M M El Mistiri (Qatar Cancer Registry); Singapore: G H Lim, Y Y Teo (Singapore Cancer Registry); Taiwan: C J Chiang, W C Lee (Taiwan Cancer Registry); Thailand: R Buasom, S Sangrajrang (Bangkok Cancer Registry); S Kamsa-ard, S Wiangnon (Khon Kaen Provincial Cancer Registry); K Daoprasert, D Pongnikorn (Lampang Cancer Registry; Lamphun Cancer Registry); A Leklob, S Sangkitipaiboon (Lopburi Cancer Registry); S L Geater, H Sriplung (Songkhla Cancer Registry); Turkey: O Ceylan, I Kög (Ankara Cancer Registry); O Dirican (Antalya Cancer Registry); T Köse (Bursa Cancer Registry); T Gurbuz (Edirne Cancer Registry); F E Karaşahin, D Turhan (Erzurum Cancer Registry Center); U Aktaş, Y Halat (Eskişehir Cancer Registry); S Eser, C I Yakut (Izmir Cancer Registry); M Altinisik, Y Cavusoglu (Samsun Cancer Registry); A Türkköylü, N Üçüncü (Trabzon Cancer Registry). Europe: Austria: M Hackl (Austrian National Cancer Registry); Belarus: A A Zborovskaya (Belarus Childhood Cancer Subregistry); O V Aleinikova (Belarusian Research Center for Pediatric Oncology, Hematology and Immunology); Belgium: K Henau, L Van Eycken (Belgian Cancer Registry); Bulgaria: Z Valerianova, M R Yordanova (Bulgarian National Cancer Registry); Croatia: M Šekerija (Croatian National Cancer Registry); Czech Republic: L Dušek, M Zvolský (Czech National Cancer Registry); Denmark: G Engholm, H Storm* (Danish Cancer Society); Estonia: K Innos, M Mägi (Estonian Cancer Registry); Finland: N Malila, K Seppä (Cancer Society of Finland); France: J Jégu, M Velten (Bas-Rhin General Cancer Registry); E Cornet, X Troussard (Registre Régional des Hémopathies Malignes de Basse Normandie); A M Bouvier (Registre

Bourguignon des Cancers Digestifs); A V Guizard (Registre Général des Tumeurs du Calvados); V Bouvier, G Launoy (Registre des Tumeurs Digestives du Calvados); P Arveux (Breast cancers registry of Côte-d'Or France); M Maynadié, M Mounier (Hémopathies Malignes de Côte d'Or); A S Woronoff (Doubs and Belfort Territory General Cancer Registry); M Daoulas, M Robaszkiewicz (Finistère Cancer Registry); J Clavel, S Goujon (French National Registry of Childhood Hematopoietic Malignancies); B Lacour (National Registry of Childhood Solid Tumors); I Baldi, C Pouchieu (Gironde Registry of Primary Central Nervous System Tumors); B Amadeo, G Coureau (General Cancer Registry of Gironde Department); A Monnereau (Registre des Hémopathies Malignes de la Gironde; French Network of Cancer Registries (FRANCIM)); S Orazio (Registre des Hémopathies Malignes de la Gironde); P M Preux, F Rharbaoui (Registre Général des Cancers de Haute-Vienne); E Marrer (Haut-Rhin Cancer Registry); B Trétarre (Registre des Tumeurs de l'Hérault); M Colonna, P Delafosse (Registre du Cancer du Département de l'Isère); K Ligier, S Plouvier (Registre Général des Cancers de Lille et de sa Region); A Cowppli-Bony, F Molinié (Loire-Atlantique-Vendée Cancer Registry); S Bara (Manche Cancer Registry); O Ganry, B Lapôtre-Ledoux (Registre du Cancer de la Somme); P Grosclaude (Tarn Cancer Registry); N Bossard, Z Uhry (Hospices Civils de Lyon); F Bray*, M Piñeros* (International Agency for Research on Cancer); J Estève (Université Claude Bernard, Lyon); Germany: R Stabenow, H Wilsdorf-Köhler (Common Cancer Registry of the Federal States); A Eberle, S Luttmann (Bremen Cancer Registry); I Löhden, A L Nennecke (Hamburg Cancer Registry); J Kieschke, E Sirri (Epidemiological Cancer Registry of Lower Saxony); K Emrich, S R Zeissig (Rhineland Palatinate Cancer Registry); B Holleczek (Saarland Cancer Registry); N Eisemann, A Katalinic (Schleswig-Holstein Cancer Registry); Gibraltar: R A Asquez, V Kumar (Gibraltar Cancer Registry); Greece: E Petridou (Nationwide Registry for Childhood Haematological Malignancies and Solid Tumors); Iceland: E J Ólafsdóttir, L Tryggvadóttir (Icelandic Cancer Registry, Icelandic Cancer Society); Ireland: K Clough-Gorr, P M Walsh (National Cancer Registry Ireland); H Sundseth* (European Institute of Women's Health); Italy: G Mazzoleni, F Vittadello (Registro Tumori Alto Adige); E Coviello, F Cuccaro (Registro Tumori Puglia—Sezione ASL BT); R Galasso (Registro Tumori di Basilicata); G Sampietro (Registro Tumori di Bergamo); A Giacomin† (Piedmont Cancer Registry Provinces of Biella and Vercelli); M Magoni (Registro Tumori Dell'ASL Di Brescia); A Ardizzone (Registro Tumori Brindisi); A D'Argenzio (Caserta Cancer Registry); M Castaing, G Grosso (Integrated Cancer Registry of Catania-Messina-Siracusa-Enna); A M Lavecchia, A Sutera Sardo (Registro Tumori Catanzaro); G Gola (Registro Tumori della Provincia di Como); L Gatti, P Ricci (Registro Tumori Cremona; Registro Tumori Mantova); S Ferretti (Registro Tumori della Provincia di Ferrara); D Serraino, A Zucchetto (Registro Tumori del Friuli Venezia Giulia); M V Celesia, R A Filiberti (Registro Tumori Regione Liguria); F Pannozzo (Registro Tumori della Provincia di Latina); A Melcarne, F Quarta (Registro Tumori Della Provincia Di Lecce Sezione RTP); A G Russo (Registro Tumori Milano); G Carrozzi, C Cirilli (Registro Tumori della Provincia di Modena); L Cavalieri d'Oro, M Rognoni (Registro Tumori di Monza e Brianza); M Fusco, M F Vitale (Registro Tumori della ASL Napoli 3 Sud); M Usala (Nuoro Cancer Registry); R Cusimano, W Mazzucco (Registro Tumori di Palermo e Provincia); M Michiara, P Sgargi (Registro Tumori della Provincia di Parma); L Boschetti (Cancer Registry of the province of Pavia); E Borciani, P Seghini (Registro Tumori Piacenza); M M Maule, F Merletti (Piedmont Childhood Cancer Registry); R Tumino (Registro Tumori della Provincia di Ragusa); P Mancuso, M Vicentini (Registro Tumori Reggio Emilia); T Cassetti, R Sassatelli (Pancreas Tumour Registry of Reggio Emilia Province); F Falcini, S Giorgetti (Registro Tumori della Romagna); A L Caiazzo, R Cavallo (Registro Tumori Salerno); R Cesaraccio, D R Pirino (Registro Tumori della Provincia di Sassari); M L Contrino, F Tisano (Registro Tumori Siracusa); A C Fanetti, S Maspero (Registro Tumori della Provincia di Sondrio); S Carone, A Mincuzzi (Registro Tumori Taranto); G Candela, T Scuderi (Registro Tumori Trapani); M A Gentilini, S Piffer (Registro Tumori Trento); S Rosso (Piedmont Cancer Registry); A Barchielli, A Caldarella (Registro Tumori della Regione Toscana); F Bianconi, F Stracci (Registro Tumori Umbro di Popolazione); P Contiero, G Tagliabue (Registro

Tumori Lombardia, Provincia di Varese); M Rugge, M Zorzi (Registro Tumori Veneto); S Beggiato, A Brustolin (Registro Tumori Della Provincia Di Viterbo); F Berrino*, G Gatta, M Sant* (Fondazione IRCCS Istituto Nazionale dei Tumori); C Buzzoni, L Mangone (Italian Association of Cancer Registries [AIRTUM]); R Capocaccia*, R De Angelis (National Centre for Epidemiology); R Zanetti* (International Association of Cancer Registries; Piedmont Cancer Registry); Latvia: A Maurina, S Pildava (Latvian Cancer Registry); Lithuania: N Lipunova, I Vincerževskienė (Lithuanian Cancer Registry); Malta: D Agius, N Calleja (Malta National Cancer Registry); Netherlands: S Siesling, O Visser (Netherlands Cancer Registry, IKNL); Norway: S Larønningen, B Møller (The Cancer Registry of Norway); Poland: A Dyzmann-Sroka, M Trojanowski (Greater Poland Cancer Registry); S Góźdź, R Mężyk (Holy Cross Cancer Registry); T Mierzwa (Kuiavian-Pomeranian Cancer Registry); L Molong, J Rachtan (Lesser Poland Cancer Registry); S Szewczyk (Łódź Cancer Registry); J Błaszczyk, K Kępska (Lower Silesian Cancer Registry); B Kościańska (Lublin Cancer Registry); K Tarocińska (Lubush Cancer Registry); M Zwierko (Mazovian Cancer Registry); K Drosik (Opole Cancer Registry); K M Maksimowicz, E Purwin-Porowska (Podlahian Cancer Registry); E Reca, J Wójcik-Tomaszewska (Pomeranian Cancer Registry); A Tukiendorf (Silesian Cancer Registry); M Grądalska-Lampart, A U Radziszewska (Subcarpathian Cancer Registry); A Gos (Varmian-Mazurian Cancer Registry); M Talerczyk, M Wyborska (West-Pomeranian Cancer Registry); J A Didkowska, U Wojciechowska (National Cancer Registry); M Bielska-Lasota (National Institute of Public Health, NIH); Portugal: G Forjaz de Lacerda, R A Rego (Registo Oncológico Regional dos Açores); J Bastos, M A Silva (Registo Oncológico Regional do Centro); L Antunes, J Laranja Pontes (Registo Oncológico Regional do Norte); A Mayer-da-Silva, A Miranda (Registo Oncólogico Regional do Sul); Romania: L M Blaga, D Coza (Cancer Institute I. Chiricuta); Russia: M Y Valkov (Arkhangelsk Regional Cancer Registry); L Gusenkova, O Lazarevich (Population Cancer Registry of the Republic of Karelia); O Prudnikova, D M Vjushkov (Omsk Regional Cancer Registry); A G Egorova, A E Orlov (Samara Cancer Regional Registry); L A Kudyakov, L V Pikalova (Tomsk Regional Cancer Registry); Slovakia: J Adamcik, C Safaei Diba (National Cancer Registry of Slovakia); Slovenia: M Primic-Žakelj, V Zadnik (Cancer Registry of Republic of Slovenia); Spain: N Larrañaga, A Lopez de Munain (Basque Country Cancer Registry); A A Herrera, R Redondas (Registro Poblacional de Cáncer de la Comunidad Autónoma de Canarias); R Marcos-Gragera, M L Vilardell Gil (Epidemiology Unit and Girona Cancer Registry); E Molina, M J Sánchez Perez (Granada Cancer Registry); P Franch Sureda, M Ramos Montserrat (Mallorca Cancer Registry); M D Chirlaque, C Navarro (Murcia Cancer Registry); E E Ardanaz, M M Guevara (Registro de Cáncer de Navarra); R Fernández-Delgado, R Peris-Bonet (Registro Español de Tumores Infantiles); M Carulla, J Galceran (Tarragona Cancer Registry); C Alberich, M Vicente-Raneda (Comunitat Valenciana Childhood Cancer Registry); Sweden: S Khan, D Pettersson (Swedish Cancer Registry); P Dickman* (Karolinska Institutet, Stockholm); Switzerland: I Avelina, K Staehelin (Basel Cancer Registry); B Camey (Registre Fribourgeois des Tumeurs); C Bouchardy, R Schaffar (Geneva Cancer Registry); H Frick, C Herrmann (Cancer Registry Grisons and Glarus; Cancer Registry of St Gallen-Appenzell); J L Bulliard, M Maspoli-Conconi (Registre Neuchâtelois et Jurassien des Tumeurs); C E Kuehni, S M Redmond (Swiss Childhood Cancer Registry); A Bordoni, L Ortelli (Registro Tumori Canton Ticino); A Chiolero, I Konzelmann (Registre Valaisan des Tumeurs); K L Matthes, S Rohrmann (Cancer Registry Zürich and Zug); UK: J Broggio, J Rashbass (National Cancer Registration and Analysis Service England); D Fitzpatrick, A Gavin (Northern Ireland Cancer Registry); D I Clark, A J Deas (Scottish Cancer Registry); D W Huws, C White (Welsh Cancer Intelligence & Surveillance Unit); C Allemani*, A Bonaventure, M P Coleman*, V Di Carlo, R Harewood, M Matz, L Montel, M Nikšić, B Rachet*, A D Turculeț (London School of Hygiene & Tropical Medicine); R Stephens* (National Cancer Research Institute, London); C A Stiller* (Public Health England).

Oceania: Australia: E Chalker, H Phung (Australian Capital Territory Cancer Registry); R Walton, H You (NSW Cancer Registry); S Guthridge, F Johnson (Northern Territory of Australia Cancer Registry); J Aitken, P Gordon (Queensland Cancer Registry); K D'Onise, K Priest (South Australian Cancer Registry); B C Stokes, A Venn (Tasmanian Cancer Registry); H Farrugia, V Thursfield (Victorian Cancer Registry); J Dowling (Western Australian Cancer Registry); D Currow* (Cancer Institute NSW); New Zealand: J Hendrix, C Lewis (New Zealand Cancer Registry). *CONCORD Steering Committee. †A Giacomin passed away on March 23, 2017.
Declaration of interests
We declare no competing interests.
Acknowledgments
This work was funded by the Centers for Disease Control and Prevention (Atlanta, GA, USA); Swiss Re (London, UK); Swiss Cancer Research foundation (Bern, Switzerland); Swiss Cancer League (Bern, Switzerland); Institut National du Cancer (Paris, France); La Ligue Contre le Cancer (Paris, France); Rossy Family Foundation (Montreal, QC, Canada); National Cancer Institute (Bethesda, MD, USA); American Cancer Society (Atlanta, GA, USA); Susan G Komen Foundation (Dallas, TX, USA). We gratefully acknowledge the cancer registry personnel who have recorded the diagnosis and outcome for every patient with cancer in their jurisdictions over many years: without their efforts, we would know very little about trends in the global cancer burden or the effectiveness of health systems in addressing it. The protocol was translated into Arabic by Mufid El Mistiri (Qatar Cancer Registry, Doha, Qatar) and Eiman Alawadhi (London School of Hygiene & Tropical Medicine [LSHTM], London, UK); into Chinese by Ning Wang, Shuo Liu (Beijing Cancer Registry, Beijing, China), Yannan Yuan (Beijing University Cancer Hospital, Beijing, China), and Chun-Ju Chiang (Taiwan Cancer Registry, Taipei, Taiwan); into French by Audrey Bonaventure and Michel Coleman (LSHTM); into Italian by Veronica Di Carlo, Cristina Renzi, and Claudia Allemani (LSHTM); into Japanese by Tomohiro Matsuda (National Cancer Centre, Tokyo, Japan), Mari Kajiwara, and Kayo Nakata (LSHTM); into Portuguese by Gulnar Azevedo e Silva (University of Rio de Janeiro State, Rio de Janeiro, Brazil); into Russian by Daria Dubovichenko and Mikhail Valkov (Arkhangelsk Cancer Registry, Arkhangelsk, Russia); and into Spanish by Gustavo Hernandez Suarez (National Cancer Institute, Bogotá, Colombia), Natalia Sanz (LSHTM), and Enrique Barrios (Cancer Registry of Uruguay, Montevideo, Uruguay). We are grateful for expert advice and ideas from many colleagues, including Marc Maynadié (Hémopathies Malignes de Côte d'Or, Dijon, France) for advice on the classification of haematological malignancies; Amy Kahn (New York State Cancer Registry, Albany, NY, USA), Ron Dewar (Cancer Care Nova Scotia, Halifax, NS, Canada) and Jennifer Stevens (National Cancer Institute, Bethesda, MD, USA) for the program to convert NAACCR data structures to meet the CONCORD protocol; Angela Mariotto (National Cancer Institute, Bethesda, MD, USA) for US mortality data, Reda Wilson (Centers for Disease Control and Prevention, Atlanta, GA, USA) for assistance with the National Program of Cancer Registries, and Giovanni Luca Lo Magno (Caltanissetta, Italy) for the program to convert Stata output into Microsoft Word files. We also thank Graciela Abriata (Instituto Nacional del Cáncer, Buenos Aires, Argentina); Cristian Herrera (Ministerio de Salud, Santiago, Chile); Daniel Salas Peraza (Ministerio de Salud, San José, Costa Rica); Noorlia Yahaya (Penang State Health Department, George Town, Malaysia); Niek Klazinga and Rie Fujisawa (OECD, Paris, France), and Steve Scoppa (Information Management Services, Calverton, MD, USA). We thank our LSHTM colleagues Natalia Sanz (CONCORD programme manager to March, 2017), Lisa Montel (CONCORD programme manager from April, 2017), Yuki Alencar (Cancer Survival Group coordinator), Adrian Turculeţ for maps and database management, and Hakim Miah for the CONCORD file transmission utility. We gratefully acknowledge endorsement of CONCORD by

the following agencies: American Cancer Society (Atlanta, GA, USA); Asociación Española contra el Cáncer (Madrid, Spain); Association of European Cancer Leagues (Brussels, Belgium); Canadian Association of Provincial Cancer Agencies (Toronto, Canada); Canadian Council of Cancer Registries (Toronto, Canada); Childhood Cancer International (Nieuwegein, Netherlands); Children with Cancer UK (London, UK); Danish Cancer Society (Copenhagen, Denmark); European CanCer Organisation (Brussels, Belgium); European Cancer Patient Coalition (Brussels, Belgium); European Institute for Women's Health (Dublin, Ireland); European Society for Medical Oncology (Lugano, Switzerland); Fondation de France (Paris, France); International Agency for Research on Cancer (Lyon, France); International Atomic Energy Agency (Vienna, Austria); International Network for Cancer Treatment and Research (Brussels, Belgium); International SOS (Papua, Indonesia); Israel Centre for Disease Control (Tel-Hashomer, Israel); Jolanta Kwaśniewska's Foundation (Warsaw, Poland); Liga Argentina de Lucha contra el Cancer (Buenos Aires, Argentina); Members of the European Parliament Against Cancer (Brussels, Belgium); National Cancer Institute Center for Global Health (Bethesda MD, USA); National Cancer Research Institute Consumer Liaison Group (Leeds, UK); National Institute for Cancer Epidemiology and Registration (Zürich, Switzerland); NCD Asia Pacific Alliance (Tokyo, Japan); North American Association of Central Cancer Registries (Springfield, IL, USA); OECD (Paris, France); Société Internationale d'Oncologie Pédiatrique (Geneva, Switzerland); Union for International Cancer Control (Geneva, Switzerland); WHO Regional Office for Europe (Copenhagen, Denmark); and World Bank (Washington, DC, USA). The interpretation of the findings in this report, and the opinions, conclusions, and recommendations are those of the authors and do not necessarily reflect the views or official position of the British Columbia Cancer Agency or Cancer Care Ontario (Canada); the Centers for Disease Control and Prevention, the National Cancer Institute, Maryland Cancer Registry, New Hampshire Department of Health and Human Services, New York City Department of Health and Mental Hygiene, Ohio Department of Health, Pennsylvania Department of Health, West Virginia Cancer Registry, or the Susan G Komen Foundation (USA); the Health Directorate of the Australian Capital Territory, or the Institut National du Cancer (France). We are very grateful to Giulia Vivaldi for expert assistance with preparation of this Article.
References1. D Schottenfeld, JF Fraumeni (Eds.), Cancer epidemiology and prevention (3rd edn.), Oxford
University Press, Oxford (2006)
2. International Agency for Research on CancerGLOBOCAN 2012: estimated cancer incidence,
mortality and prevalence worldwide in 2012 http://globocan.iarc.fr/Default.aspx (accessed Sept
25, 2017).
3. WHOCancer prevention and control in the context of an integrated approach: report by the
Secretariat World Health Organization, Geneva (2016)
4. WHOCancer prevention and control [WHA 58.22] World Health Organization, Geneva (2017)
5. TR Vázquez, TA GhebreyesusBeating NCDs can help deliver universal health coverage Lancet, 390
(2017), pp. 1473‐1474
6. C Allemani, HK Weir, H Carreira, et al.Global surveillance of cancer survival 1995–2009: analysis of
individual data for 25 676 887 patients from 279 population‐based registries in 67 countries
(CONCORD‐2) Lancet, 385 (2015), pp. 977‐1010
7. LC Harlan, JL WarrenGlobal survival patterns: potential for cancer control Lancet, 385 (2015), pp.
926‐928
8. Centers for Disease Control and PreventionCancer survival: the start of global surveillance
https://www.cdc.gov/cancer/dcpc/research/articles/CONCORD‐2.htm (2015) (accessed Nov 1,
2017).
9. S Walters, S Benitez‐Majano, P Muller, et al.Is England closing the international gap in cancer
survival? Br J Cancer, 113 (2015), pp. 848‐860
10. Independent Cancer TaskforceAchieving world‐class cancer outcomes: a strategy for England
2015–2020 NHS England, London (2015)
11. International Atomic Energy AgencyAccess to cancer therapy
https://www.youtube.com/watch?v=cXJ79_hxdNA (Nov 20, 2015) (accessed Nov 1, 2017).
12. International Atomic Energy AgencyPACT's new campaign raises awareness of the persistent
inequalities in access to lifesaving cancer services: PACT highlights the growing global divide in
cancer survival rates https://cancer.iaea.org/newsstory.asp?id=167 (Sept 11, 2015) (accessed Nov
1, 2017).
13. HK Weir, S Stewart, C Allemani, et al.Population‐based cancer survival (2001–2009) in the United
States: findings from the CONCORD‐2 study Cancer, 123 (2017), pp. 4963‐4968
14. C Allemani, MP ColemanPublic health surveillance of cancer survival in the US and world‐wide:
the contribution of the CONCORD programme Cancer, 123 (2017), pp. 4977‐4981
15. J Ferlay, I Soerjomataram, R Dikshit, et al.Cancer incidence and mortality worldwide: sources,
methods and major patterns in GLOBOCAN 2012 Int J Cancer, 136 (2015), pp. E359‐E386
16. UN Statistical DivisionStandard country or area codes for statistical use (M49)
https://unstats.un.org/unsd/methodology/m49/ (2015) (accessed Sept 1, 2017).
17. AG Fritz, C Percy, A Jack (Eds.), International classification of diseases for oncology (ICD‐O) (3rd
edn.), World Health Organization, Geneva (2000)
18. AG Fritz, C Percy, A Jack (Eds.), International Classification of diseases for oncology (ICD‐O) (first
revision of 3rd edn.), World Health Organization, Geneva (2013)
19. M Sant, ML Karjalainen‐Lindsberg, M Maynadié, et al.Manual for coding and reporting
haematological malignancies Tumori, 96 (2010), p. i‐A32
20. E Steliarova‐Foucher, C Stiller, B Lacour, P KaatschInternational classification of childhood cancer
3rd edn Cancer, 103 (2005), pp. 1457‐1467
21. M Matz, MP Coleman, M Sant, et al.The histology of ovarian cancer: world‐wide distribution and
implications for international survival comparisons (CONCORD‐2) Gynecol Oncol, 144 (2017), pp.
405‐413
22. LM Morton, JJ Turner, JR Cerhan, et al.Proposed classification of lymphoid neoplasms for
epidemiologic research from the Pathology Working Group of the International Lymphoma
Epidemiology Consortium (InterLymph) Blood, 110 (2007), pp. 695‐708
23. JJ Turner, LM Morton, MS Linet, et al.InterLymph hierarchical classification of lymphoid
neoplasms for epidemiologic research based on the WHO classification (2008): update and future
directions Blood, 116 (2010), pp. e90‐e98
24. LM Woods, B Rachet, L Ellis, MP ColemanFull dates (day, month, year) should be used in
population‐based cancer survival studies Int J Cancer, 131 (2012), pp. E1120‐E1124
25. Surveillance Epidemiology and End Results programMultiple primary and histology coding rules
manual National Cancer Institute, Bethesda, MD (2013)
26. IARC Working GroupInternational rules for multiple primary cancers (ICD‐O 3rd edn) Eur J Cancer
Prev, 14 (2005), pp. 307‐308
27. Environmental Systems Research InstituteArcGIS desktop: release 10.3
http://desktop.arcgis.com/en/arcmap/10.3/main/get‐started/whats‐new‐in‐arcgis.htm (2015)
(accessed June 1, 2017).
28. United NationsWorld population prospects: the 2015 revision Department of Economic and Social
Affairs, Population Division (2015) http://esa.un.org/unpd/wpp/ (accessed Jan 10, 2017).

29. C Allemani, R Harewood, C Johnson, et al.Population‐based cancer survival in the US: data, quality
control and statistical methods Cancer, 123 (2017), pp. 4982‐4993
30. J Estève, E Benhamou, L RaymondStatistical methods in cancer research, volume IV. Descriptive
epidemiology (IARC Scientific Publications no. 128) International Agency for Research on Cancer,
Lyon (1994)
31. SJ Cutler, F EdererMaximum utilisation of the life table method in analyzing survival J Chronic Dis,
8 (1958), pp. 699‐712
32. H Brenner, O GefellerAn alternative approach to monitoring cancer patient survival Cancer, 78
(1996), pp. 2004‐2010
33. H Brenner, C SpixCombining cohort and period methods for retrospective time trend analyses of
long‐term cancer patient survival rates Br J Cancer, 89 (2003), pp. 1260‐1265
34. M Pohar Perme, J Stare, J EstèveOn estimation in relative survival Biometrics, 68 (2012), pp. 113‐
120
35. I Clerc‐Urmès, M Grzebyk, G HédelinNet survival estimation with stns Stata J, 14 (2014), pp. 87‐102
36. B Rachet, C Maringe, LM Woods, L Ellis, D Spika, C AllemaniMultivariable flexible modelling for
estimating complete, smoothed life tables for sub‐national populations BMC Public Health, 15
(2015), p. 1240
37. A Micheli, P Baili, E Mugno, et al.Life expectancy and cancer survival in the EUROCARE‐3 cancer
registry areas Ann Oncol, 14 (suppl 5) (2003), pp. 28‐40
38. DC Ewbank, JC Gómez de León, MA StotoA reducible four‐parameter system of model life tables
Popul Studies, 37 (1983), pp. 105‐129
39. W BrassOn the scale of mortality W Brass (Ed.), Biological aspects of demography, Taylor and
Francis, London (1971), pp. 69‐110
40. RC Elandt‐Johnson, NL JohnsonSurvival models and data analysis (Wiley series in probability and
mathematical statistics) John Wiley & Sons, Indianapolis, IN (1980)
41. I Corazziari, MJ Quinn, R CapocacciaStandard cancer patient population for age standardising
survival ratios Eur J Cancer, 40 (2004), pp. 2307‐2316
42. CA Stiller, KJ BunchTrends in survival for childhood cancer in Britain diagnosed 1971–85 Br J
Cancer, 62 (1990), pp. 806‐865
43. M GreenwoodThe natural duration of cancer. Report on public health and medical subjects no. 33
HM Stationery Office, London (1926)
44. J Berkson, RP GageSurvival curve for cancer patients following treatment J Am Stat Assoc, 47
(1952), pp. 501‐515
45. PW Dickman, HO AdamiInterpreting trends in cancer patient survival J Intern Med, 260 (2006), pp.
103‐117
46. MP ColemanCancer survival: global surveillance will stimulate health policy and improve equity
Lancet, 383 (2014), pp. 564‐573
47. Allemani C. The importance of global surveillance of cancer survival for cancer control: the
CONCORD programme. Cancer Control (in press).
48. MA Abdel‐Rahman, DL Stockton, B Rachet, T Hakulinen, MP ColemanWhat if cancer survival in
Britain were the same as in Europe: how many deaths are avoidable? Br J Cancer, 101 (suppl 2)
(2009), pp. 115‐124
49. L Ellis, MP Coleman, B RachetHow many deaths would be avoidable if socioeconomic inequalities
in cancer survival in England were eliminated? A national population‐based study, 1996–2006 Eur
J Cancer, 48 (2012), pp. 270‐278

50. GF Ho, NA Taib, RK Pritam Singh, CH Yip, MM Abdullah, TO Lim What if all patients with breast
cancer in Malaysia have access to the best available care: how many deaths are avoidable? Glob J
Health Sci, 9 (2017), pp. 32‐39
51. A Pokhrel, P Martikainen, E Pukkala, M Rautalahti, K Seppä, T HakulinenEducation, survival and
avoidable deaths in cancer patients in Finland Br J Cancer, 103 (2010), pp. 1009‐1114
52. P Sandiford, ME Abdel‐Rahman, C Allemani, MP Coleman, G GalaHow many cancer deaths could
New Zealand avoid if five‐year relative survival ratios were the same as in Australia? Aust NZ J
Public Health, 39 (2015), pp. 157‐161
53. K Seppä, T Hakulinen, E LääräAvoidable deaths and random variation in patients' survival. Br J
Cancer, 106 (2012), pp. 1846‐1849
54. M Mirzaei, M Mirzadeh, M MirzaeiExpected years of life lost due to adult cancer mortality in Yazd
(2004–2010). Asian Pac J Cancer Prev, 17 (2016), pp. 101‐105
55. OT Brustugun, B Møller, Å HellandYears of life lost as a measure of cancer burden on a national
level. Br J Cancer, 111 (2014), pp. 1014‐1020
56. I Soerjomataram, J Lortet‐Tieulent, DM Parkin, et al.Global burden of cancer in 2008: a systematic
analysis of disability‐adjusted life‐years in 12 world regions. Lancet, 380 (2012), pp. 1840‐1850
57. LM Woods, M Morris, B RachetNo ‘cure’ within 12 years of diagnosis among breast cancer
patients who are diagnosed via mammographic screening: women diagnosed in the West
Midlands region of England 1989–2011. Ann Oncol, 27 (2016), pp. 2025‐2031
58. TML Andersson, H Eriksson, J Hansson, et al.Estimating the cure proportion of malignant
melanoma, an alternative approach to assess long term survival: a population‐based study.
Cancer Epidemiol, 38 (2014), pp. 93‐99
59. G Gatta, S Rossi, R Foschi, et al.Survival and cure trends for European children, adolescents and
young adults diagnosed with acute lymphoblastic leukemia from 1982 to 2002. Haematologica, 98
(2013), pp. 744‐752
60. Y Ito, T Nakayama, H Tsukuma, et al.Role of age and tumour stage in the temporal pattern of
‘cure’ from stomach cancer: a population‐based study in Osaka, Japan. Cancer Epidemiol, 36
(2012), pp. 128‐132
61. LG Shack, A Shah, P Lambert, B Rachet“Cure” by age and stage at diagnosis for colorectal cancer
patients: a population‐based study. Cancer Epidemiol, 36 (2012), pp. 548‐553
62. MP ColemanWhy we need global surveillance of cancer survival: the CONCORD programme. I
McGrath (Ed.), Cancer care in emerging health systems, International Network for Cancer
Treatment and Research, Oxford (2013), pp. 60‐65
63. JB CooksonCancer survival. Lancet, 356 (2000), p. 1611
64. OECDCancer care: assuring quality to improve survival. Organisation for Economic Co‐operation
and Development, Paris (2013)
65. R Atun, DA Jaffray, MB Barton, et al.Expanding global access to radiotherapy. Lancet Oncol, 16
(2015), pp. 1153‐1186
66. JG Meara, AJM Leather, L Hagander, et al.Global Surgery 2030: evidence and solutions for
achieving health, welfare, and economic development. Lancet, 386 (2015), pp. 569‐624
67. OECD Health at a glance 2017: OECD indicators Organisation for Economic Co‐operation and
Development, Paris (2017)
68. UICCWorld Cancer Declaration 2013. Union for International Cancer Control, Geneva (2013)
69. OM Jensen, DM Parkin, R MacLennan, CS Muir, RG Skeet (Eds.), Cancer registration: principles and
methods (IARC Scientific Publications no. 95), International Agency for Research on Cancer, Lyon
(1991)

70. F Berrino, J Estève, MP ColemanBasic issues in the estimation and comparison of cancer patient
survival. F Berrino, M Sant, A Verdecchia, R Capocaccia, T Hakulinen, J Estève (Eds.), Survival of
cancer patients in Europe: the EUROCARE study (IARC Scientific Publications no. 132), International
Agency for Research on Cancer (WHO), Lyon (1995), pp. 1‐14
71. H Abdel‐Razeq, F Attiga, A MansourCancer care in Jordan. Hematol Oncol Stem Cell Ther, 8 (2015),
pp. 64‐70
72. R Laurenti, MP Coleman, P AylinAccuracy of statements of the cause of death on death certificates
and the international comparability of mortality statistics
73. MP Coleman, P Aylin (Eds.), Death certification and mortality statistics: an international
perspective, Office for National Statistics, London (2000), pp. 1‐9
74. VK Ovcharov, EA TishukThe improvement of statistical records of the causes of death in Russia.
MP Coleman, P Aylin (Eds.), Death certification and mortality statistics: an international
perspective, Office for National Statistics, London (2000), pp. 28‐30
75. G Filippatos, P Andriopoulos, G Panoutsopoulos, et al.The quality of death certification practice in
Greece. Hippokratia, 20 (2016), pp. 19‐25
76. MH Haghighi, M Dehghani, SH Teshizi, H MahmoodiImpact of documentation errors on accuracy of
cause of death coding in an educational hospital in Southern Iran. HIM J, 43 (2014), pp. 35‐42
77. C Cândida da Cunha, R Teixeira, E FrançaAssessment of the investigation of ill‐defined causes of
death in Brazil in 2010. Epidemiol Serv Saude, 26 (2017), pp. 1‐12
78. S Antoni, I Soerjomataram, B Møller, F Bray, J FerlayAn assessment of GLOBOCAN methods for
deriving national estimates of cancer incidence. Bull World Health Organ, 94 (2016), pp. 174‐184
79. A Engeland, T Haldorsen, PW Dickman, et al.Relative survival of cancer patients: a comparison
between Denmark and other Nordic countries. Acta Oncol, 37 (1998), pp. 49‐59
80. F Berrino, R Capocaccia, J Estève, et al. (Eds.), Survival of cancer patients in Europe: the EUROCARE‐
2 study (IARC Scientific Publications no. 151), International Agency for Research on Cancer, Lyon
(1999)
81. HH Storm, M Gislum, G EngholmCancer survival before and after initiating the Danish Cancer
Control plan Ugeskr Læger, 170 (2008), pp. 3065‐3069 (in Danish).
82. G Engholm, J Ferlay, N Christensen, et al.NORDCAN: cancer incidence, mortality, prevalence and
survival in the Nordic Countries, version 7.3 (08.07.2016). Association of the Nordic Cancer
Registries, Danish Cancer Society (2016) http://www.ancr.nu (accessed Nov 3, 2017).
83. HH Storm, G Engholm, T Hakulinen, et al.Survival of patients diagnosed with cancer in the Nordic
countries up to 1999‐2003 followed to the end of 2006. A critical overview of the results. Acta
Oncol, 49 (2010), pp. 532‐544
84. KY YooCancer control activities in the Republic of Korea. Jpn J Clin Oncol, 38 (2008), pp. 327‐333
85. KS Choi, JK Jun, M Suh, et al.Effect of endoscopy screening on stage at gastric cancer diagnosis:
results of the National Cancer Screening Programme in Korea. Br J Cancer, 112 (2015), pp. 608‐612
86. Pech, A May, H Manner, et al.Long‐term efficacy and safety of endoscopic resection for patients
with mucosal adenocarcinoma of the esophagus. Gastroenterology, 146 (2014), pp. 652‐660
87. YS Suh, HK YangScreening and early detection of gastric cancer: East versus West. Surg Clin North
Am, 95 (2015), pp. 1053‐1066
88. JW‐C Chang, J Guo, C‐Y Hung, et al.Sunrise in melanoma management: time to focus on
melanoma burden in Asia. Asia Pac J Clin Oncol, 13 (2017), pp. 423‐427
89. OW BrawleyAccepting the existence of breast cancer overdiagnosis. Ann Intern Med, 166 (2017),
pp. 364‐365

90. PM Marcus, PC Prorok, AB Miller, EJ DeVoto, BS KramerConceptualizing overdiagnosis in cancer
screening. J Natl Cancer Inst, 107 (2015), pp. 1‐4
91. C Allemani, B Rachet, HK Weir, et al.Colorectal cancer survival in the USA and Europe: a CONCORD
high‐resolution study. BMJ Open, 3 (2013), p. e003055
92. C Maringe, S Walters, B Rachet, et al.Stage at diagnosis and colorectal cancer survival in six high‐
income countries: a population‐based study of patients diagnosed during 2000–2007. Acta Oncol,
52 (2013), pp. 919‐932
93. SJ Wu, CJ Chiang, CT Lin, HF Tien, MS LaiImproving but inferior survival in patients with chronic
lymphocytic leukemia in Taiwan: a population‐based study, 1990–2004. PLoS One, 8 (2013), p.
e62930
94. R Sullivan, JR Kowalczyk, B Agarwal, et al.New policies to address the global burden of childhood
cancers. Lancet Oncol, 14 (2013), pp. e125‐e135
95. I Magrath, E Steliarova‐Foucher, S Epelman, et al.Paediatric cancer in low‐income and middle‐
income countries. Lancet Oncol, 14 (2013), pp. e104‐e116
96. S Mostert, RS Arora, M Arreola, et al.Abandonment of treatment for childhood cancer: position
statement of a SIOP PODC Working Group. Lancet Oncol, 12 (2011), pp. 719‐720
97. K Pritchard‐Jones, CA StillerWhat can we learn from geographical comparisons of childhood
cancer survival? Br J Cancer, 96 (2007), pp. 1493‐1497
98. Ginsburg, F Bray, MP Coleman, et al.The global burden of women's cancers: a grand challenge in
global health. Lancet, 389 (2017), pp. 847‐860
99. Ginsburg, R Badwe, P Boyle, et al.Changing global policy to deliver safe, equitable and affordable
care for women's cancers. Lancet, 389 (2017), pp. 871‐880
100. N Beaulieu, D Bloom, R Bloom, R SteinBreakaway: the global burden of cancer—challenges and
opportunities. A report from the Economist Intelligence Unit. The Economist, London (2009)
101. AB Mariotto, KR Yabroff, Y Shao, EJ Feuer, ML BrownProjections of the cost of cancer care in the
United States: 2010–2020. J Natl Cancer Inst, 103 (2011), pp. 117‐128
102. T Fojo, C GradyHow much is life worth: cetuximab, non‐small cell lung cancer, and the $440
billion question. J Natl Cancer Inst, 101 (2009), pp. 1044‐1048
103. FM Knaul, J Gralow, R Atun, A BhadeliaClosing the cancer divide: an equity imperative. Harvard
University Press, Boston, MA (2011)
104. R Sullivan, J Peppercorn, K Sikora, et al.Delivering affordable cancer care in high‐income countries.
Lancet Oncol, 12 (2011), pp. 933‐980
105. FKL Tangka, S Subramanian, MC Beebe, et al.Cost of operating central cancer registries and factors
that affect cost: findings from an economic evaluation of Centers for Disease Control and
Prevention National Program of Cancer Registries. J Public Health Manag Pract, 22 (2016), pp. 452‐
460
106. United NationsSustainable Development Goals.
http://www.un.org/sustainabledevelopment/sustainable‐development‐goals/ (2015) (accessed
Sept 25, 2017).
107. United NationsSustainable Development Goal 3. https://sustainabledevelopment.un.org/sdg3
(2015) (accessed Sept 25, 2017).
108. H Schmidt, LO Gostin, EJ EmanuelPublic health, universal health coverage, and sustainable
development goals: can they coexist? Lancet, 386 (2015), pp. 928‐930
109. A López, J ThomasonCivil registration and vital statistics—everybody's business but nobody's
business. Lancet, 381 (2013), pp. 1275‐1276

110. PW Setel, SB Macfarlane, S Szreter, et al.Who counts? 1: A scandal of invisibility: making
everyone count by counting everyone. Lancet, 370 (2007), pp. 1569‐1577
111. WHO Cancer prevention and control in the context of an integrated approach
[A70/A/CONF./9] World Health Organization, Geneva (2017)