Embed Size (px)
Citation preview
GLOBAL SURVEY
ASSESSING NATIONAL CAPACITY FOR THE PREVENTION AND CONTROL OF
NONCOMMUNICABLE DISEASES
2015

GLOBAL SURVEY
ASSESSING NATIONAL CAPACITY FOR THE PREVENTION AND CONTROL OF
NONCOMMUNICABLE DISEASES
2015
4
WHO Library Cataloguing-in-Publication Data
Assessing national capacity for the prevention and control of noncommunicable diseases: report of the 2015 global survey. 1.Chronic Disease - prevention and control. 2.National Health Programs. 3.Health Surveys. I.World Health Organization. ISBN 978 92 4 156536 3 (NLM classification: WT 500)
© World Health Organization 2016
All rights reserved. Publications of the World Health Organization are available on the WHO website (http://www.who.int) or can be purchased from WHO Press, World Health Organization, 20 Avenue Appia, 1211 Geneva 27, Switzerland (tel.: +41 22 791 3264; fax: +41 22 791 4857; email: [email protected]).
Requests for permission to reproduce or translate WHO publications –whether for sale or for non-commercial distribution– should be addressed to WHO Press through the WHO website (http://www.who.int/about/licensing/copyright_form/index.html).
The designations employed and the presentation of the material in this publication do not imply the expression of any opinion whatsoever on the part of the World Health Organization concerning the legal status of any country, territory, city or area or of its authorities, or concerning the delimitation of its frontiers or boundaries. Dotted and dashed lines on maps represent approximate border lines for which there may not yet be full agreement.
The mention of specific companies or of certain manufacturers’ products does not imply that they are endorsed or recommended by the World Health Organization in preference to others of a similar nature that are not mentioned. Errors and omissions excepted, the names of proprietary products are distinguished by initial capital letters.
All reasonable precautions have been taken by the World Health Organization to verify the information contained in this publication. However, the published material is being distributed without warranty of any kind, either expressed or implied. The responsibility for the interpretation and use of the material lies with the reader. In no event shall the World Health Organization be liable for damages arising from its use.
Printed by the WHO Document Production Services, Geneva, Switzerland
5Report of the 2015 Global NCD Survey
ACKNOWLEDGEMENTS
LIST OF ACRONYMS
FOREWORD
EXECUTIVE SUMMARY
INTRODUCTION
METHODS
Data collection, review and validation
Questionnaire
Response rate
Analysis
RESULTS
ASPECTS OF NCD INFRASTRUCTURE
Unit, branch or department responsible for NCDs
Funding mechanisms
Fiscal interventions
Multisectoral commissions, agencies or mechanisms
PLANS, POLICIES AND STRATEGIES
National health plans
Policies addressing the major NCDs and their risk factors
Research policy or plan
Marketing to children
Food regulation and policy
SURVEILLANCE
Surveillance responsibility
Civil and vital registration systems reporting mortality by cause
Cancer registries
Diabetes registries
Risk factor surveys
HEALTH SYSTEMS CAPACITY
NCD-related guidelines and referral criteria
Availability of tests and procedures for early detection, diagnosis and monitoring of NCDs
Cancer screening programmes
7
8
9
10
13
15
16
16
17
17
23
24
24
26
31
33
34
34
35
43
43
44
50
50
51
52
53
54
60
60
62
64
TABLE OF CONTENTS
6
HPV vaccination programmes
Availability of medicines in the public health sector
Procedures for treating NCDs
Cancer diagnosis and treatment
Palliative care
Cardiovascular risk stratification
Care of acute stroke and rehabilitation
Secondary prevention of rheumatic fever and rheumatic heart disease
DISCUSSION
KEY FINDINGS
Infrastructure, governance and financing
Policies, action plans and strategies
NCD surveillance
NCD management
STRENGTHS AND LIMITATIONS OF THE SURVEY
CONCLUSION
PRIORITIES FOR FURTHER ACTION
REFERENCES
ANNEXES
ANNEX 1: WHO MEMBER STATES AND SURVEY RESPONDENTS
ANNEX 2: LIST OF COUNTRIES BY WORLD BANK INCOME GROUPS
ANNEX 3: QUESTIONNAIRE
ANNEX 4: GLOSSARY OF TERMS USED IN THE SURVEY
69
70
72
73
74
75
75
76
79
80
80
80
80
81
82
85
86
88
91
92
94
96
126
7Report of the 2015 Global NCD Survey
ACKNOWLEDGEMENTS
This report was prepared by the NCD surveillance team within the Department for Prevention of Noncommunicable Diseases. Leanne Riley coordinated the work on the NCD country capacity survey, the overall implementation of the survey and the reporting of results; Melanie Cowan led the web-based data collection, oversaw the validation of results, and performed all data management and statistical analysis needed to prepare the results for the final report.
We wish to thank the NCD focal points in the WHO regional offices for their generous support and assistance in coordinating the NCD country capacity survey during 2015 with their respective Member States and for undertaking validation and review of completed survey responses: Abdikamal Alisalad, Andrea Bruni, Jean-Marie Dangou, Simona Minchiotti, Nivo Ramanandraibe and Benoit Varenne for the WHO Regional Office for Africa; Roberta Caixeta, Elisa Prieto Lara and Yenny Rodriguez Sanchez for the WHO Regional Office for the Americas; Vasily Bondarev, Enrique Loyola Elizondo and Anna Mezentseva for the WHO Regional Office for Europe; Loulou Kobeissi for the WHO Office for the Eastern Mediterranean; Naveen Agarwal, Renu Garg, Dhirendra Sinha and Thaksaphon Thamarangsi for the WHO Regional Office for South-East Asia; and Marie Clem Carlos, Rick Kim, Hai-Rim
Shin and Wendy Snowdon for the WHO Regional Office for the Western Pacific. Additional thanks to staff in numerous WHO country offices who provided invaluable support in survey-related communication with Member States.
Colleagues from WHO headquarters and IARC also provided helpful input and support in the development of the survey questionnaire and review and validation of the completed questionnaires by countries: Timothy Armstrong, Douglas Bettcher, Lubna Bhatti, Freddie Bray, Marilys Corbex, Kaia Engesveen, Regina Guthold, Luminita Hayes, Belinda Loring, Doris Ma Fat, Colin Mathers, Leslie Mery, Leo Nederveen, Armando Peruga, Vladimir Pozynak, Dag Rekve, Stefan Savin, Kerstin Schotte, Gretchen Stevens, Edouard Tursan d’Espaignet, Cherian Varghese and Temo Waqanivalu.
Thanks also to Steve Moore, independent consultant who designed the web-based platform for data collection and Sylvie Stachenko, independent consultant, who helped with the writing and preparation of this report.
Finally, we thank all Member States that took part in the survey, allowing the assessment and completion of this report.
8
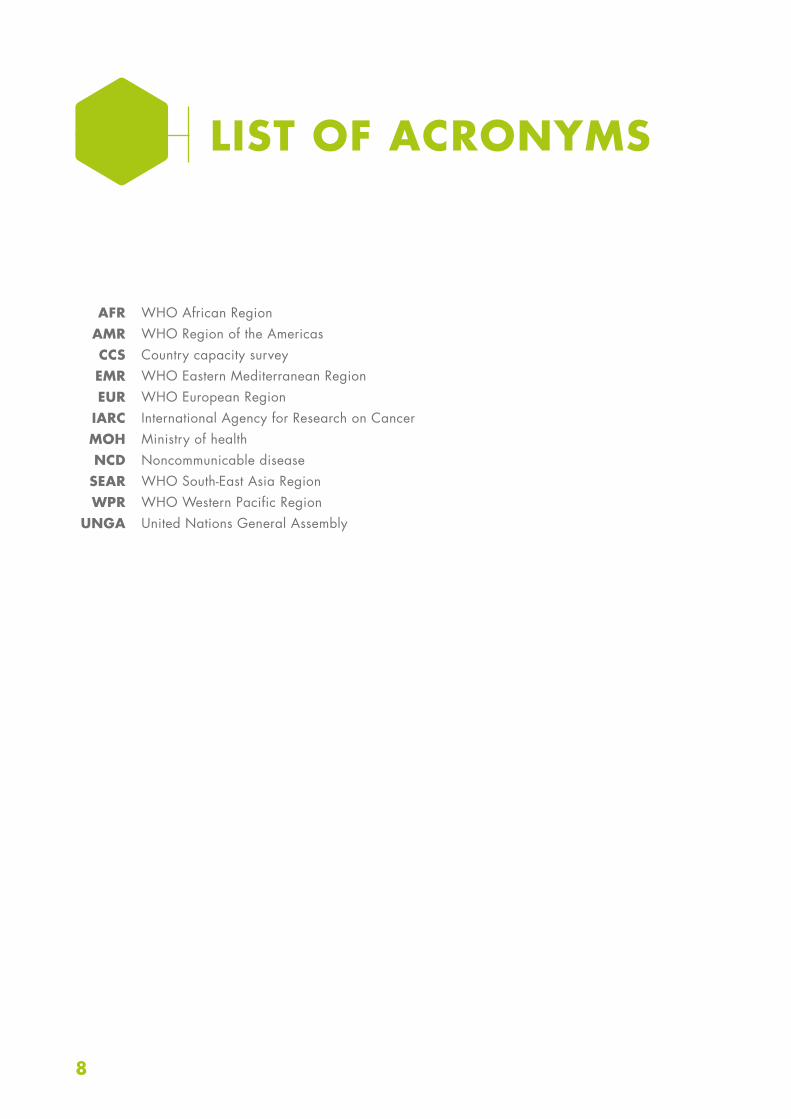
LIST OF ACRONYMS
WHO African RegionWHO Region of the AmericasCountry capacity surveyWHO Eastern Mediterranean RegionWHO European RegionInternational Agency for Research on CancerMinistry of healthNoncommunicable diseaseWHO South-East Asia RegionWHO Western Pacific RegionUnited Nations General Assembly
AFRAMRCCSEMREUR
IARCMOHNCD
SEARWPR
UNGA
9Report of the 2015 Global NCD Survey
FOREWORD
Let’s pick up the pace to beat NCDs
Last year, 2015 was an historic year for noncommunicable diseases (NCDs). Global leaders, recognizing the enormous burden that NCDs place on people and communities in developed and developing countries, included them in the new global Sustainable Development Goals (SDGs).
As part of our efforts to track global progress to reduce premature death from preventable NCDs, WHO conducted, in 2015, its fifth national NCD country capacity survey.The aim of this survey is to generate detailed information from countries on their current capacities related to NCD infrastructure, policy action, surveillance and health-systems response. Besides providing a useful snapshot of the progress countries are making to beat NCDs, the WHO NCD country capacity survey highlights areas that urgently require prioritization and additional strengthening.
The latest survey reveals that while significant progress is being made overall, on-going challenges persist in addressing NCDs in many countries. These include a lack of resourcing of key initiatives that can prevent people developing an NCD or provide care for those in need; weak multisectoral coordination, resulting in NCDs continuing to be seen as just a “health issue” in many countries; and difficulties in putting plans and strategies to address NCDs into action.
The results of the 2015 NCD country capacity survey show that we can achieve real progress in strengthening NCD prevention and control capacities. It highlights encouraging improvements
in infrastructure and staffing in many parts of the world, as well as the existence of policies, plans and strategies to address NCDs.
But a “business-as-usual” approach won’t suffice. Governments must steel themselves to achieve NCDs targets, embedded in the SDGs and World Health Assembly resolutions. Millions of people can be spared from developing and living with an NCD by governments transforming their commitments into action. This entails full implementation of highly cost effective and feasible interventions, such as tobacco control; control of marketing of unhealthy foods and beverages to children; primary health care interventions; and in ensuring NCDs are tackled as a “whole-of-government” priority.
Meeting these commitments, and reporting on them in early 2017 for the sixth edition of this survey, must be recognized for what they are – global priorities. Progress will have to be demonstrated in 2018 when world leaders meet for the third United Nations General Assembly High-level meeting on Non-communicable Diseases. Continued and intensified action to safeguard and accelerate these positive trends will be vital for saving lives and improving health globally and achieving the ambitious targets we have jointly set to beat NCDs.
Dr Oleg ChestnovAssistant Director-GeneralNoncommunicable Diseases and Mental HealthWorld Health Organization
10
EXECUTIVE SUMMARY
Noncommunicable diseases (NCDs), including cardiovascular diseases, cancer, diabetes and chronic respiratory diseases, and their key risk factors – tobacco, harmful use of alcohol, unhealthy diet and physical inactivity – remain the leading causes of death globally. NCDs are currently responsible for almost 70% of global deaths, the majority occurring in low- and middle-income countries. In recent years NCDs have been increasingly in the spotlight of the global public health community and national leaders. Most recently, the 2030 Agenda for Sustainable Development Goals, adopted at the United Nations Summit on Sustainable Development in September 2015, recognized the critical public health importance of addressing NCDs, and included a goal to reduce, by one third, the premature mortality from NCDs, along with targets to address risk factors such as alcohol and tobacco, and achievement of universal health coverage by 2030. Achieving targets for NCD prevention and control require a renewed and concerted action at the national level. Key to this is capacity: physical, human and at the policy level.
To assess the capacity of countries to respond to NCDs, WHO carries out periodic global country capacity surveys. The first of these was conducted in 2001. Subsequent surveys, intended to assess progress, were conducted in 2005, 2010, and 2013. The fifth, and most recent, survey was conducted in early 2015. In the 2015 survey, countries were asked to provide detailed information on their capacity to address NCDs, and to determine current strengths and weaknesses in terms of their NCD infrastructure, policy response, surveillance and health-systems response. Comparisons with results from previous surveys will help to determine if overall global progress is being made.
A web-based questionnaire hosted on the WHO website was used to collect data from NCD focal points or designated colleagues within the ministry
of health, national institute, or agency responsible for NCDs in all WHO Member States (194 countries). The survey tool included questions on (i) public health infrastructure, partnerships and multisectoral collaboration; (ii) policies, strategies and action plans; (iii) health information systems and surveillance; and (iv) health-system capacity for detection treatment and care. Data collection was conducted between May and August 2015. For validation and verification of responses, countries submitted supporting documentation for a select number of questions. These were then reviewed by the WHO Secretariat at WHO regional offices and WHO headquarters. Additional validation was carried out against other known data sources.
In all, 91% of countries (177) responded to the survey. Trends in national capacity for NCDs were derived from comparing the results of the 2015 survey with those from the capacity surveys conducted in 2013 and 2010. For the comparison of responses across these three surveys, analyses were limited to the 160 WHO Member States that completed all three surveys and were focused only on the questions which appeared in all three surveys.
Analysis of results revealed that in 2015, 93% of countries reported having a unit, branch or department responsible for NCDs within their ministry of health, with 91% having at least one full-time technical or professional staff member working within the unit, branch or department. The most prevalent form of funding was for health care and treatment, (94% of countries) followed by primary prevention of NCDs (88%), health promotion activities (87%), early detection and screening (85%), surveillance, monitoring and evaluation (81%), and palliative care (64%). Major sources of funding included government revenues (94% of countries), international donors (64%), health insurance (62%), and earmarked taxes (34%).
11Report of the 2015 Global NCD Survey
Thirty-four per cent (34%) of countries reported having an operational national multisectoral commission, agency, or mechanism to oversee NCD engagement, policy coherence and accountability of sectors beyond health. Fifty-three per cent (53%) of countries reported having an operational, multisectoral national policy, strategy or action plan that integrates several NCDs and their risk factors.
Only 23% of countries reported having a dedicated office, department, or administrative division within the ministry of health exclusively dedicated to NCD surveillance. Eighty-eight per cent (88%) of countries reported having a system for collecting mortality data by cause of death on a routine basis. Fifty-nine per cent (59%) of countries reported having a population-based cancer registry, and 14% a population-based diabetes registry. Nearly a quarter of countries (24%) had not conducted a recent (i.e. conducted in 2010 or later) national adult risk factor survey, and a further 14% reported conducting recent, national adult surveys for only 1–4 of the 9 main NCD risk factors.
In relation to availability of evidence-based guidelines, protocols or standards for disease management, 75% of countries reported guidelines for diabetes; 67% for cardiovascular diseases; 60% for cancer; and 55% for chronic respiratory diseases.
The availability of standard criteria for the referral of patients from primary care level to a higher level of care for each of the four main NCDs were reported by the majority of countries, with diabetes criteria most prevalent (73% of countries), followed closely by criteria for cardiovascular diseases (68%) and cancer (64%). Criteria for chronic respiratory diseases were available in only 57% of countries. More than 90% of countries indicated criteria for each of the four main NCDs (diabetes, hypertension, chronic respiratory diseases and cardiovascular disease) were either fully or partially implemented.
The majority of countries reported having basic technologies generally available for early detection, diagnosis and monitoring of NCDs in primary-care facilities in the public health sector: 97% for blood pressure measurement, 95% for weight measurement, and 90% for height measurement. Blood glucose measurement was also widely available, with 85% of countries reporting general availability in primary care facilities in the public health sector.
Regarding cancer screening programmes, 79% of countries reported availability for cervical cancer, followed by 76% for breast cancer, 40% for colon cancer, and 29% only for prostate cancer. Few of these were described as population-based screening programmes.
Sixty-seven per cent (67%) of countries reported having cancer centres or cancer departments at the tertiary level. Pathology services were generally available in the public health sector in 75% of countries; however cancer surgery (69%) and subsidized chemotherapy (63%) were less available.
The majority of countries reported having essential medicines for the management of the four main NCDs generally available in the public health sector. The most readily available medicines (in 88% of countries) were aspirin (100 mg) and thiazide diuretics; the least available (in 43% of countries) was oral morphine.
In general, palliative care for patients with NCDs in the public health system, in primary health care or as community or home-based care, was not widely available, with only 41% reporting availability of palliative care in primary health care and 36% as community or home-based care.
Cardiovascular risk stratification for the management of patients at high risk for heart attack and stroke was
12
reported as available in more than 50% of primary health-care facilities in just 21% of countries. Around a quarter (24%) reported availability of acute stroke care and rehabilitation in over 50% of public sector health-care facilities.
While the majority of high-income countries reported availability of retinal photocoagulation, renal replacement by dialysis, renal replacement by transplantation, coronary bypass or stenting, and thrombolytic therapy, less than one third of low-income countries reported these available.
Where possible, and to illustrate progress, the report includes comparisons with results of the 2010 and 2013 surveys. Explicit comparisons, where made, are among the 160 countries that participated in all three surveys.
The 2015 NCD CCS revealed ongoing challenges in addressing NCDs at the national level including: a
lack of resourcing of key initiatives; weak multisectoral coordination; disparities between the existence of policies and operational plans to address NCDs and their implementation, particularly in the area of unhealthy diet; lack of routine population-based surveillance; inadequate provision of NCD treatment and management for some NCDs; poor targeting of screening programmes; and very weak provision of palliative care for those suffering from existing NCDs. In general the survey revealed worrying disparities between high- and low-income countries, with very weak capacity and policy and service delivery in low-income countries.
Opportunities revealed in the survey included increased recognition of the importance of addressing NCDs; improved infrastructure and staffing; existence of policies, plans and strategies to address NCDs; target and indicator setting to track overall progress at country level; and improvements in country capacity across the board.
13Report of the 2015 Global NCD Survey
Noncommunicable diseases (NCDs), including cardiovascular diseases, cancer, diabetes and chronic respiratory diseases, and their key risk factors – tobacco, harmful use of alcohol, unhealthy diet and physical inactivity – remain the leading causes of death globally. NCDs are currently responsible for almost 70% of global deaths – the majority occurring in low- and middle-income countries (1). In recent years, NCDs have been increasingly in the spotlight of the global public health community and national leaders. Two United Nations High-level Meetings, in 2011 and 2014, have served to keep NCDs the focus of national and international attention and reflect their significant public health burden (2, 3). In 2013 the World Health Assembly adopted a set of nine ambitious targets covering NCD mortality, risk factors and national systems performance (4). Additionally, the 2030 Agenda for Sustainable Development Goals, adopted at the United Nations Summit on Sustainable Development in September 2015, recognized the critical public health importance of addressing NCDs, and included a goal to reduce, by one third, the premature mortality from NCDs, along with targets to address risk factors such as alcohol and tobacco use, and the achievement of universal health coverage by 2030. Achieving these targets for NCD prevention and control requires a renewed and concerted action at the national level.
In order to assess national capacity for NCD prevention and control, in 2001 WHO conducted the first NCD country capacity survey (NCD CCS) to gather detailed information on the progress of
countries in addressing and responding to NCDs (5). The survey tool used in the assessment has evolved and expanded over time. It was intended to help countries assess current strengths and weaknesses relating to NCD infrastructure, policy response, surveillance, and the response of health systems to address NCDs at the national level. It was anticipated that periodic monitoring of national progress may assist countries in identifying gaps in NCD prevention and control efforts and aid future planning. The survey was repeated in 2005 and in 2010. Since 2010, two surveys have been conducted, in 2013 and in 2015; a subsequent survey is planned for 2017. This is in response to increasing interest in the reporting of progress being made at the national level relating to the adoption of the Global Action Plan for the Prevention and Control of Noncommunicable Diseases 2013–2020 (6) (Global NCD Action Plan) and the national commitments made during the UN High-level Meetings on NCDs in 2011 and 2014.
The objective of this report is to summarize the results of the 2015 NCD CCS and to identify limitations and challenges for national capacity for NCD prevention and control. Where possible, comparisons will be made with results of the 2010 and 2013 surveys. The report will also provide information to monitor progress relating to the objectives and recommendations of the Global NCD Action Plan (6), and to some of the ten progress indicators to monitor national commitments from the UN High-level Meetings on NCDs that will be reported at the United Nations General Assembly (UNGA) in 2017.
INTRODUCTION

14

15Report of the 2015 Global NCD Survey
METHODS
16
Data collection, review and validation
A web-based questionnaire hosted on the WHO website was used to collect data from NCD focal points or designated colleagues within the ministry of health or national institute or agency responsible for NCDs in all WHO Member States (194 countries). Each country received their unique details to access the website in late May or early June 2015 and the focal points were requested to submit their completed questionnaire through the WHO website by the end of August 2015. In order to improve the quality and breadth of information provided, instructions requested that a team of people, led by the NCD focal point, complete the responses so that topic-specific experts could provide more detailed assessment. Additionally, for validation and verification of responses, countries were asked to submit supporting documentation for a select number of questions. For example, for the question on the existence of treatment guidelines for the major NCDs, copies of each guideline were requested.
Upon receipt of each completed questionnaire, the WHO Secretariat reviewed the responses for completeness, and validated responses against existing data sources and supporting documentation submitted. For example,
the existence of a cancer registry was validated against the IARC GLOBOCAN1 database, which included information on recognized cancer registries. Responses related to the collation of mortality data was checked against information on vital registrations systems held within WHO in the Department of Health Statistics and Informatics. Information on recent NCD risk factor surveys was checked against the internal survey tracking systems for WHO-supported risk factor surveys. These included WHO STEPS (adult risk factor surveillance),2 the Global School-based Student Health Survey (GSHS),3 the Global Youth Tobacco Survey (GYTS),4 and the Global Adult Tobacco Survey (GATS).5
Where discrepancies were noted between the country response and these other sources, a clarification request was returned to the country for their consideration and an updating of their response. Likewise, if the review revealed missing documentation or incomplete questions, the focal point was asked to supply the missing information. In most cases, suggested modifications were adopted and the missing data and documents were added to the country’s response in the website.
Questionnaire
The web-based questionnaire consisted of four modules: (i) public health infrastructure, partnerships and multisectoral collaboration; (ii) policies, strategies and action plans; (iii) health information systems and surveillance; and (iv) health system capacity for detection treatment and care (the full questionnaire can be found in Annex 3). The questions were developed through a consultative process with relevant technical departments in WHO headquarters and all WHO regional offices, with the intent of obtaining objective information about each of these four components, as opposed to opinions about adequacy of capacity. Specific components of the questionnaire were as follows:
• The infrastructure component asked questions relating to the presences of a unit or division within the ministry of health dedicated to NCDs,
staffing and funding, fiscal interventions including taxation and subsidies and the motivation for the fiscal interventions, and if there was a high-level national multisectoral commission, agency or mechanism to oversee NCD-related work.
• The policies, strategies and plans component asked questions relating to the presence of policies, strategies, or action plans. The questions differentiated between integrated policies, strategies, or action plans (defined as addressing one or more risk factor or disease) or policies, strategies, or action plans for a specific disease or risk factor. Ministries of health were asked to name the policy and indicate if the plan was currently in operation. Additionally, this component covered cost-effective policies for NCDs, such as policies to reduce population salt-consumption.
1 http://globocan.iarc.fr/Default.aspx 2 http://www.who.int/chp/steps/en/3 http://www.who.int/chp/gshs/en/4 http://www.who.int/tobacco/surveillance/gyts/en/5 http://www.who.int/tobacco/surveillance/survey/gats/en/
17Report of the 2015 Global NCD Survey
Region Total number of countries
Number of responding countries
Response rate
AFR 47 35 75%
AMR 35 34 97%
EMR 21 20 95%
EUR 53 52 98%
SEAR 11 11 100%
WPR 27 25 93%
Total 194 177 91%
• The information systems and surveillance module asked questions on the routine collection of mortality data, the existence of cancer and diabetes registries and risk factor surveillance activities.
• The health system capacity component asked countries to assess the capacity of their health system related to NCD prevention, early detection, and treatment and care within the primary health care sector. Specific questions focused on the existence of guidelines or
protocols to treat major NCDs and the availability of the tests, procedures and equipment related to NCDs within the health system.
The survey included a set of detailed instructions on how to complete the questionnaire and a glossary defining the terms used in the questionnaire. The questionnaire was translated into Spanish, French, and Russian to facilitate completion in all countries. Each country followed their own formal review process before submitting their response to WHO.
Response rate
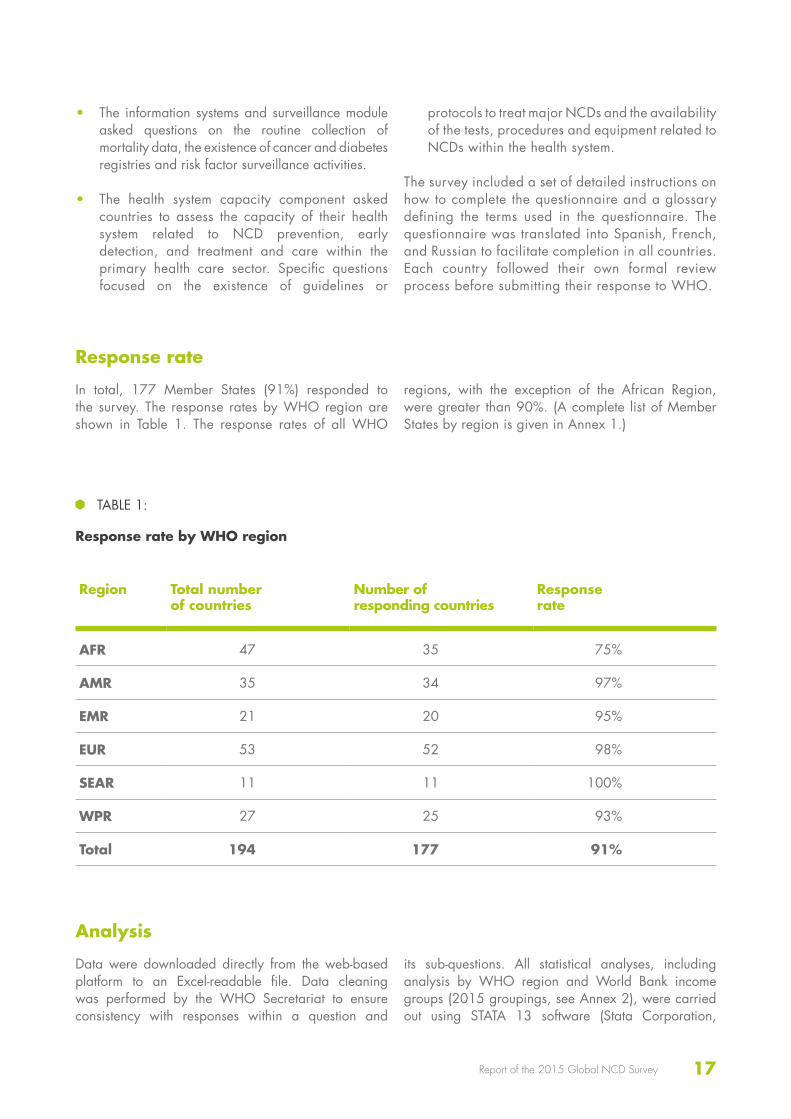
In total, 177 Member States (91%) responded to the survey. The response rates by WHO region are shown in Table 1. The response rates of all WHO
regions, with the exception of the African Region, were greater than 90%. (A complete list of Member States by region is given in Annex 1.)
TABLE 1:
Response rate by WHO region
Analysis
Data were downloaded directly from the web-based platform to an Excel-readable file. Data cleaning was performed by the WHO Secretariat to ensure consistency with responses within a question and
its sub-questions. All statistical analyses, including analysis by WHO region and World Bank income groups (2015 groupings, see Annex 2), were carried out using STATA 13 software (Stata Corporation,
18
2013). All data extraction, cleaning and analysis was performed at WHO headquarters.
For all analyses, the denominator used was the total number of responding countries, either overall or within the subgroup of interest (Table 1). To avoid fluctuating denominators, percentages reported were
based on the positive responses from countries to the survey items. Non-positive responses (i.e. “No”, “Don’t know”, and items left unanswered) were treated equally. Trends in national capacity for NCDs were derived from comparing the results of the 2015 survey with those from the capacity surveys conducted in 2013 and 2010 by WHO. For the comparison of
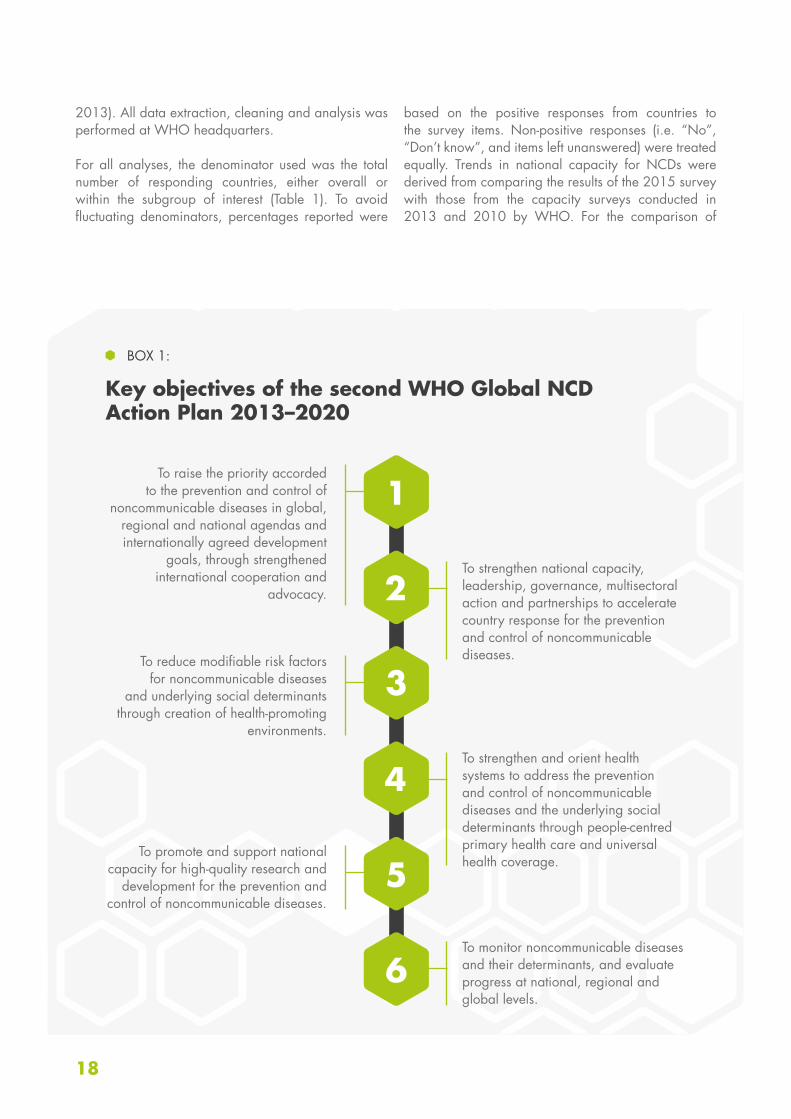
To raise the priority accorded to the prevention and control of
noncommunicable diseases in global, regional and national agendas and internationally agreed development
goals, through strengthened international cooperation and
advocacy.
To reduce modifiable risk factors for noncommunicable diseases
and underlying social determinants through creation of health-promoting
environments.
To promote and support national capacity for high-quality research and
development for the prevention and control of noncommunicable diseases.
To strengthen national capacity, leadership, governance, multisectoral action and partnerships to accelerate country response for the prevention and control of noncommunicable diseases.
To strengthen and orient health systems to address the prevention and control of noncommunicable diseases and the underlying social determinants through people-centred primary health care and universal health coverage.
To monitor noncommunicable diseases and their determinants, and evaluate progress at national, regional and global levels.
BOX 1:
Key objectives of the second WHO Global NCD Action Plan 2013–2020
1
3
5
4
2
6
19Report of the 2015 Global NCD Survey
survey responses across these three surveys, analyses were limited to the 160 Member States that completed all three surveys and were focused only on those questions which appeared in all three surveys.
The results were examined in relation to the objectives and key recommendations made to WHO Member
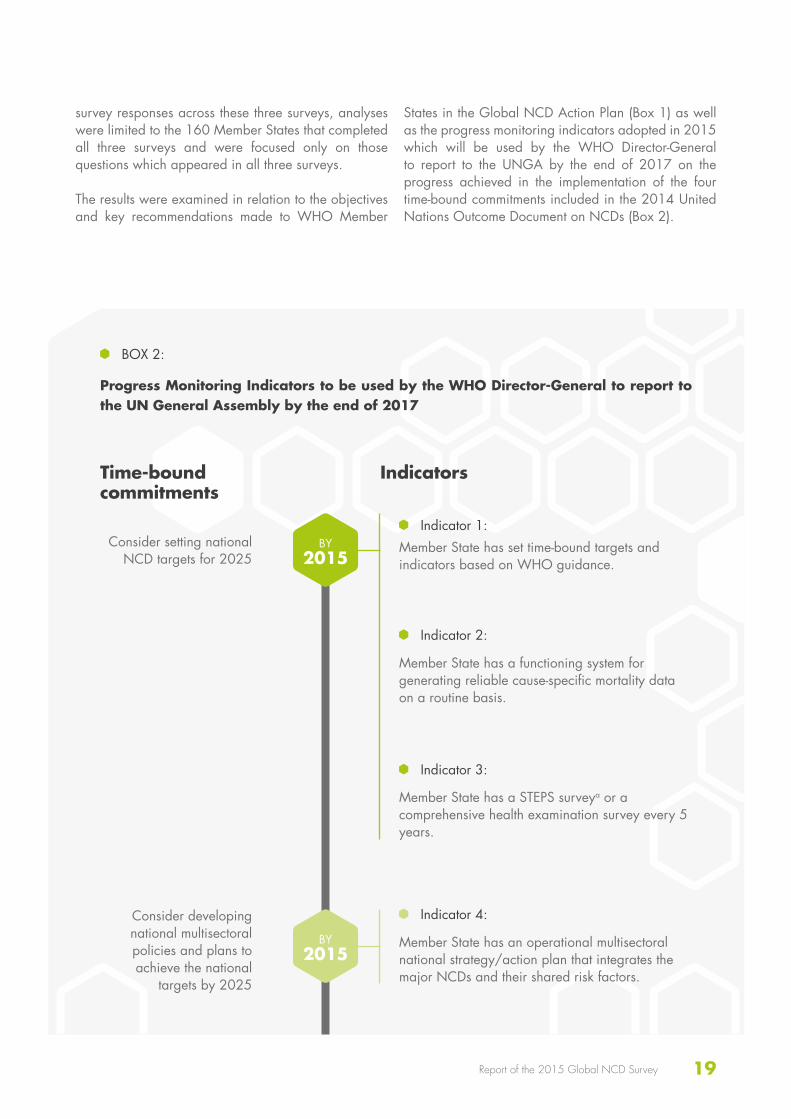
States in the Global NCD Action Plan (Box 1) as well as the progress monitoring indicators adopted in 2015 which will be used by the WHO Director-General to report to the UNGA by the end of 2017 on the progress achieved in the implementation of the four time-bound commitments included in the 2014 United Nations Outcome Document on NCDs (Box 2).
BOX 2:
Progress Monitoring Indicators to be used by the WHO Director-General to report to the UN General Assembly by the end of 2017
BY 2015
BY 2015
Consider setting national NCD targets for 2025
Consider developing national multisectoral policies and plans to achieve the national
targets by 2025
Indicator 2:
Indicator 1:
Indicator 3:
Member State has a functioning system for generating reliable cause-specific mortality data on a routine basis.
Member State has set time-bound targets and indicators based on WHO guidance.
Member State has a STEPS surveya or a comprehensive health examination survey every 5 years.
Indicator 4:
Member State has an operational multisectoral national strategy/action plan that integrates the major NCDs and their shared risk factors.
Time-bound commitments
Indicators
20
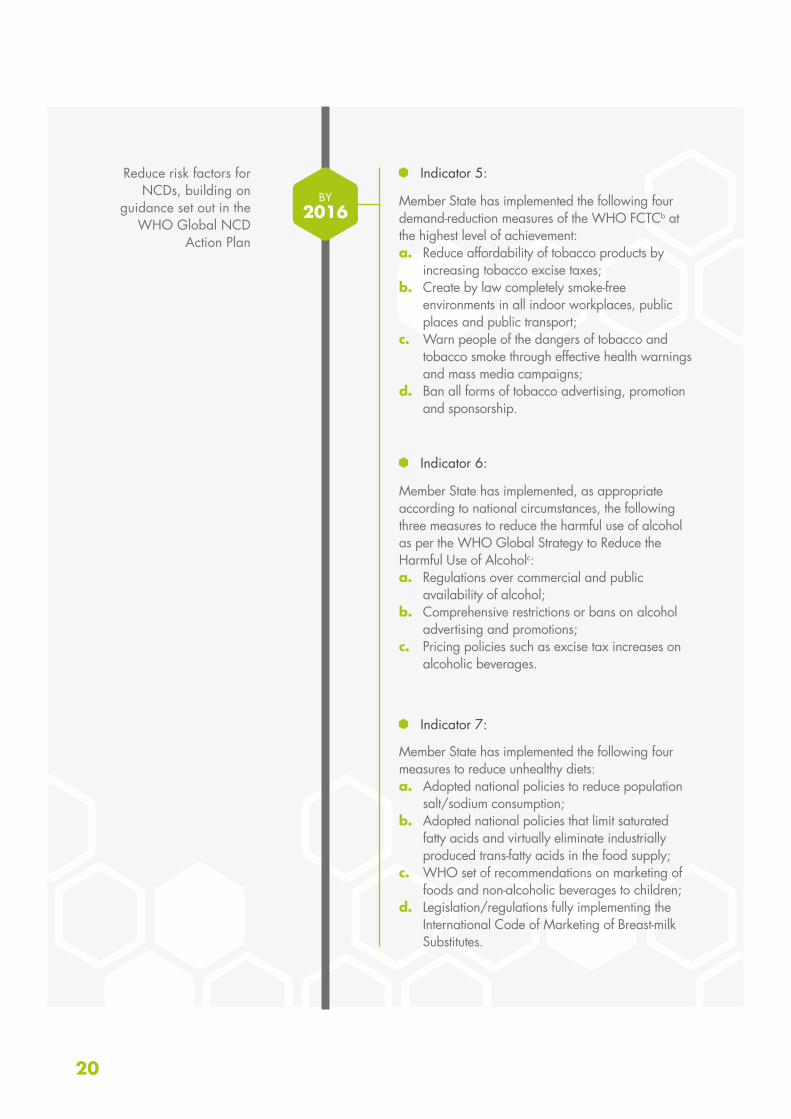
Indicator 7:
Member State has implemented the following four measures to reduce unhealthy diets:a. Adopted national policies to reduce population
salt/sodium consumption;b. Adopted national policies that limit saturated
fatty acids and virtually eliminate industrially produced trans-fatty acids in the food supply;
c. WHO set of recommendations on marketing of foods and non-alcoholic beverages to children;
d. Legislation/regulations fully implementing the International Code of Marketing of Breast-milk Substitutes.
Indicator 5:
Indicator 6:
Member State has implemented the following four demand-reduction measures of the WHO FCTCb at the highest level of achievement:a. Reduce affordability of tobacco products by
increasing tobacco excise taxes;b. Create by law completely smoke-free
environments in all indoor workplaces, public places and public transport;
c. Warn people of the dangers of tobacco and tobacco smoke through effective health warnings and mass media campaigns;
d. Ban all forms of tobacco advertising, promotion and sponsorship.
Member State has implemented, as appropriate according to national circumstances, the following three measures to reduce the harmful use of alcohol as per the WHO Global Strategy to Reduce the Harmful Use of Alcoholc:a. Regulations over commercial and public
availability of alcohol;b. Comprehensive restrictions or bans on alcohol
advertising and promotions;c. Pricing policies such as excise tax increases on
alcoholic beverages.
BY 2016
Reduce risk factors for NCDs, building on
guidance set out in the WHO Global NCD
Action Plan
21Report of the 2015 Global NCD Survey
a http://www.who.int/chp/steps/en/ b http://www.who.int/fctc/en/ c Global strategy to reduce the harmful effects of alcohol. World Health Organization, Geneva, 2010.
BY 2016
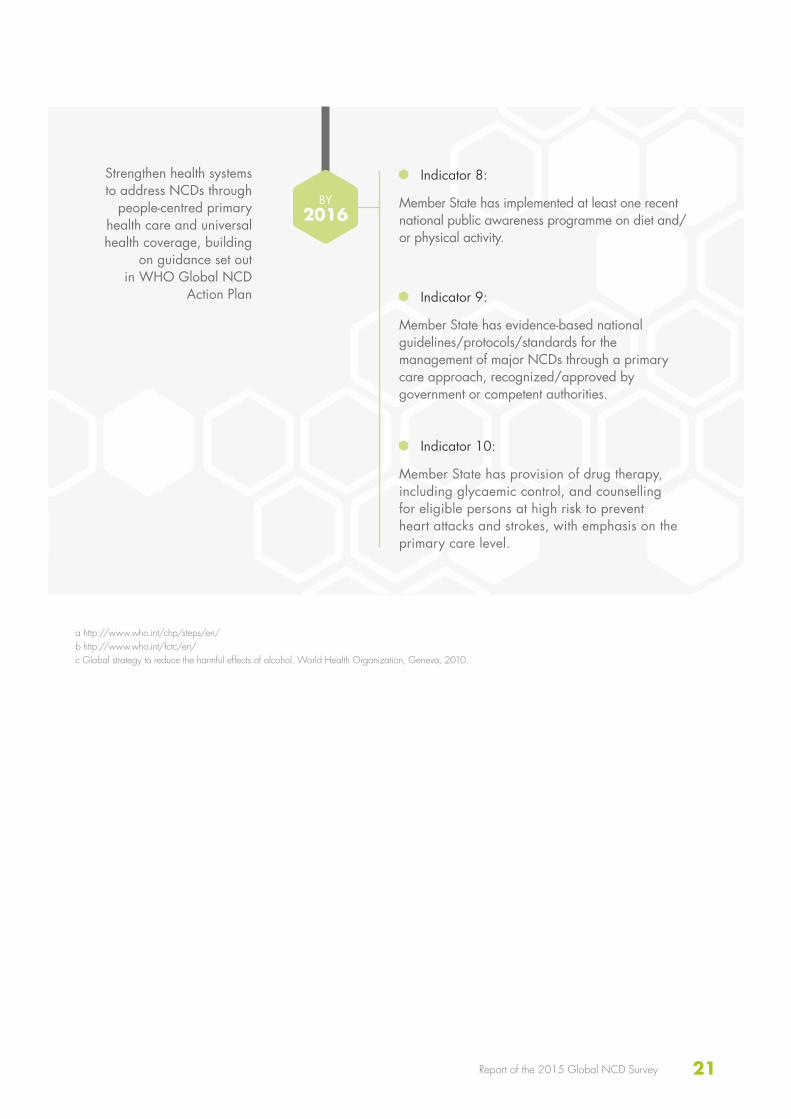
Strengthen health systems to address NCDs through
people-centred primary health care and universal health coverage, building
on guidance set out in WHO Global NCD
Action Plan
Indicator 8:
Indicator 9:
Indicator 10:
Member State has implemented at least one recent national public awareness programme on diet and/or physical activity.
Member State has evidence-based national guidelines/protocols/standards for the management of major NCDs through a primary care approach, recognized/approved by government or competent authorities.
Member State has provision of drug therapy, including glycaemic control, and counselling for eligible persons at high risk to prevent heart attacks and strokes, with emphasis on the primary care level.

22

23Report of the 2015 Global NCD Survey
RESULTS
24
Unit, branch or department responsible for NCDs
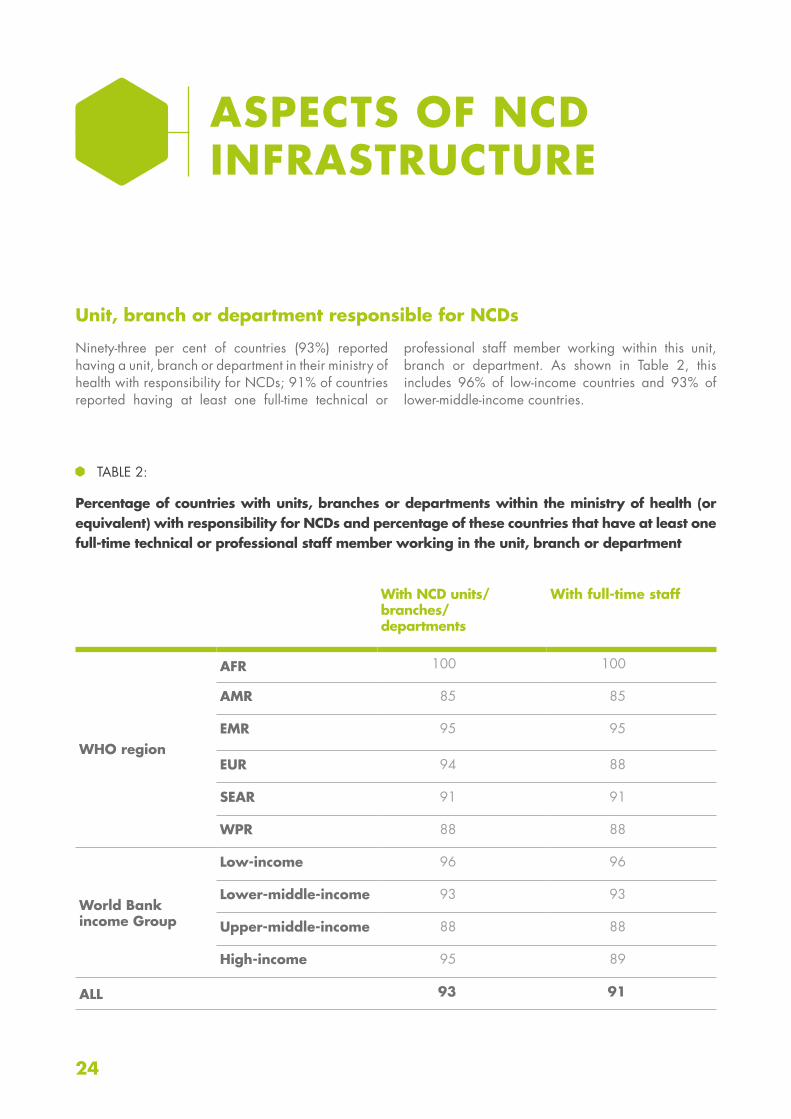
Ninety-three per cent of countries (93%) reported having a unit, branch or department in their ministry of health with responsibility for NCDs; 91% of countries reported having at least one full-time technical or
professional staff member working within this unit, branch or department. As shown in Table 2, this includes 96% of low-income countries and 93% of lower-middle-income countries.
ASPECTS OF NCD INFRASTRUCTURE
With NCD units/ branches/departments
With full-time staff
WHO region
AFR 100 100
AMR 85 85
EMR 95 95
EUR 94 88
SEAR 91 91
WPR 88 88
World Bankincome Group
Low-income 96 96
Lower-middle-income 93 93
Upper-middle-income 88 88
High-income 95 89
ALL 93 91
TABLE 2:
Percentage of countries with units, branches or departments within the ministry of health (or equivalent) with responsibility for NCDs and percentage of these countries that have at least one full-time technical or professional staff member working in the unit, branch or department
25Report of the 2015 Global NCD Survey
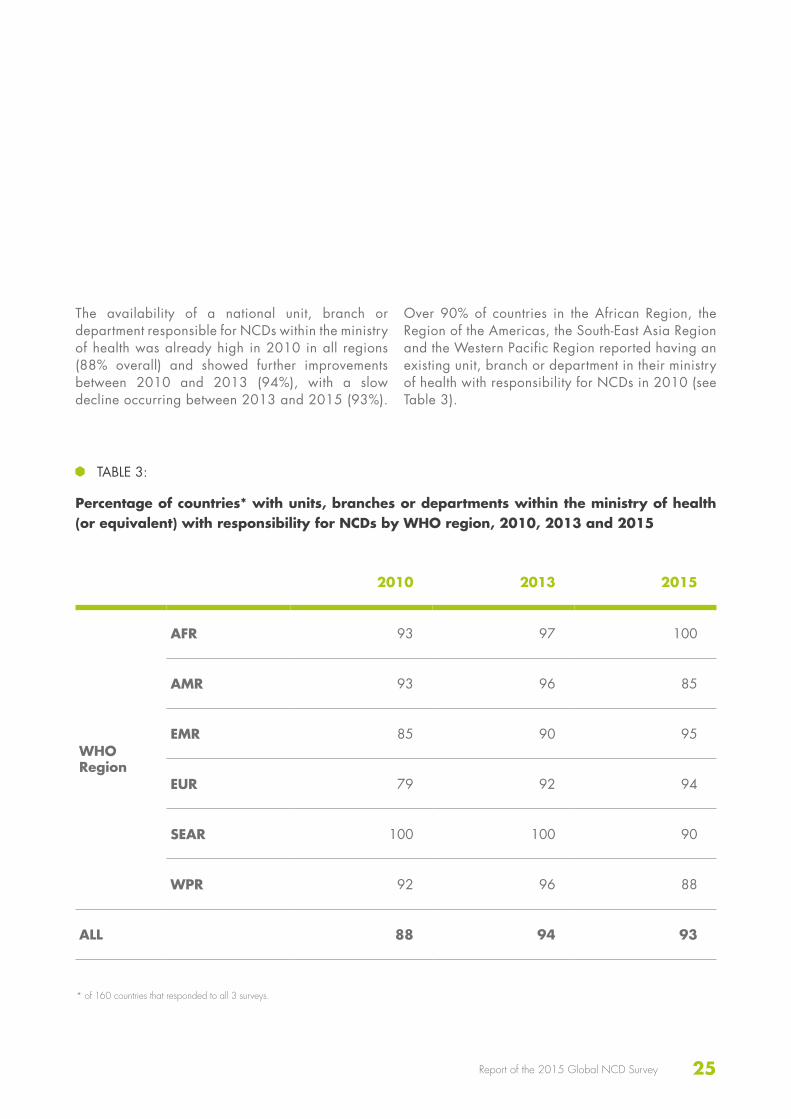
The availability of a national unit, branch or department responsible for NCDs within the ministry of health was already high in 2010 in all regions (88% overall) and showed further improvements between 2010 and 2013 (94%), with a slow decline occurring between 2013 and 2015 (93%).
Over 90% of countries in the African Region, the Region of the Americas, the South-East Asia Region and the Western Pacific Region reported having an existing unit, branch or department in their ministry of health with responsibility for NCDs in 2010 (see Table 3).
2010 2013 2015
WHO Region
AFR 93 97 100
AMR 93 96 85
EMR 85 90 95
EUR 79 92 94
SEAR 100 100 90
WPR 92 96 88
ALL 88 94 93
TABLE 3:
Percentage of countries* with units, branches or departments within the ministry of health (or equivalent) with responsibility for NCDs by WHO region, 2010, 2013 and 2015
* of 160 countries that responded to all 3 surveys.
26
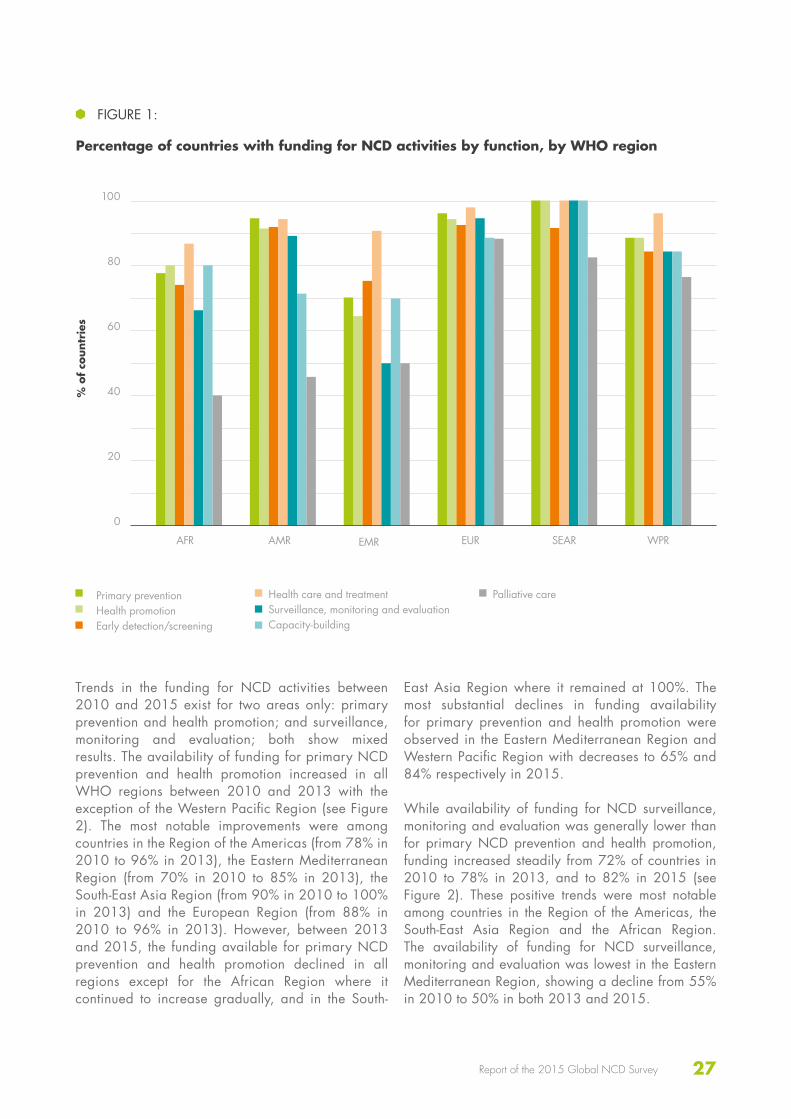
Funding mechanisms
Countries were asked to report on the availability of funding for seven key risk factor activities or functions. Funding for health care and treatment was the most prevalent (94% of countries) with funding also prevalent for primary prevention of NCDs (88%), health promotion activities (87%), and early detection and screening (85%) (see Figure 1). The prevalence of funding for surveillance, monitoring and evaluation as well as for capacity-building reported by the countries was slightly lower overall, with only 81% of countries reporting funding for each of these. Palliative care
funding was considerably less prevalent, with less than two thirds of countries (64%) reporting having funding. The African Region (40%), the Region of the Americas (44%) and the Eastern Mediterranean Region (50%) reported particularly low levels of funding for palliative care, while this area was more widely funded in the European Region (88%), the South-East Asia Region (82%) and the Western Pacific Region (76%). Countries of the South-East Asia Region reported 100% funding for all categories, with the exception of early detection (91%) and palliative care.
2010 2013 2015
WHO Region
AFR 83 93 100
AMR 78 78 85
EMR 80 80 95
EUR 69 75 88
SEAR 100 90 90
WPR 84 92 88
ALL 79 83 91
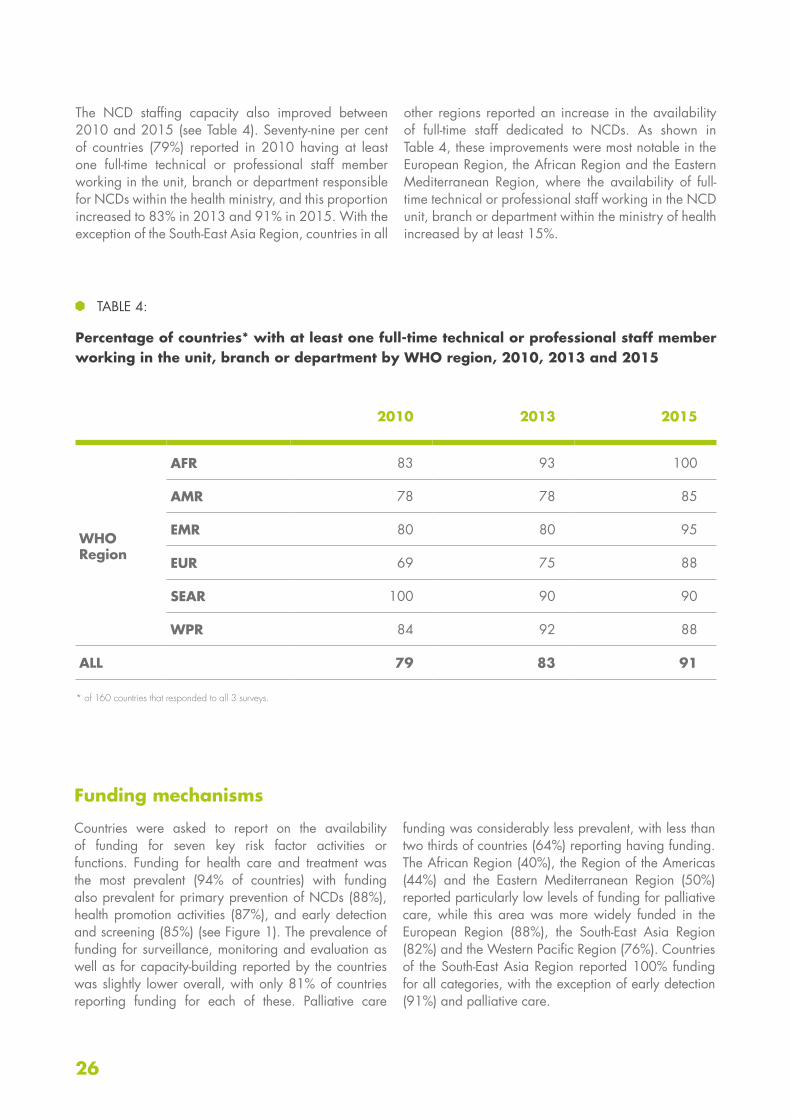
TABLE 4:
Percentage of countries* with at least one full-time technical or professional staff member working in the unit, branch or department by WHO region, 2010, 2013 and 2015
* of 160 countries that responded to all 3 surveys.
The NCD staffing capacity also improved between 2010 and 2015 (see Table 4). Seventy-nine per cent of countries (79%) reported in 2010 having at least one full-time technical or professional staff member working in the unit, branch or department responsible for NCDs within the health ministry, and this proportion increased to 83% in 2013 and 91% in 2015. With the exception of the South-East Asia Region, countries in all
other regions reported an increase in the availability of full-time staff dedicated to NCDs. As shown in Table 4, these improvements were most notable in the European Region, the African Region and the Eastern Mediterranean Region, where the availability of full-time technical or professional staff working in the NCD unit, branch or department within the ministry of health increased by at least 15%.
27Report of the 2015 Global NCD Survey
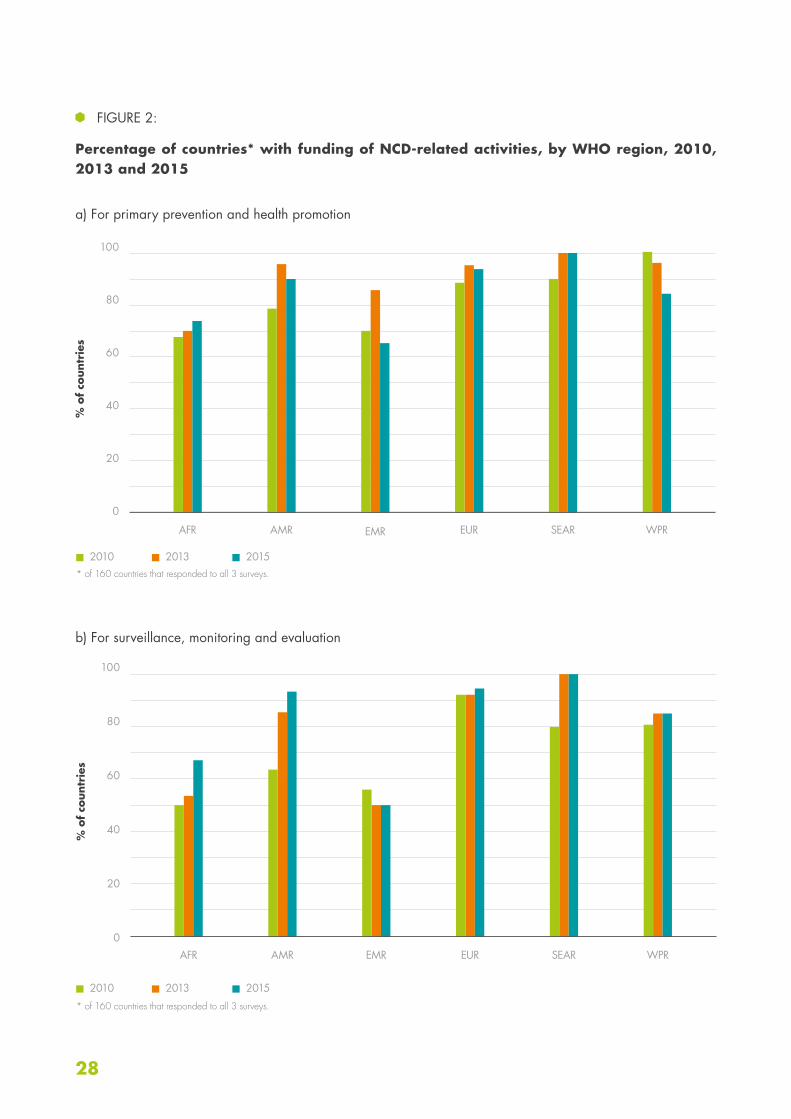
Trends in the funding for NCD activities between 2010 and 2015 exist for two areas only: primary prevention and health promotion; and surveillance, monitoring and evaluation; both show mixed results. The availability of funding for primary NCD prevention and health promotion increased in all WHO regions between 2010 and 2013 with the exception of the Western Pacific Region (see Figure 2). The most notable improvements were among countries in the Region of the Americas (from 78% in 2010 to 96% in 2013), the Eastern Mediterranean Region (from 70% in 2010 to 85% in 2013), the South-East Asia Region (from 90% in 2010 to 100% in 2013) and the European Region (from 88% in 2010 to 96% in 2013). However, between 2013 and 2015, the funding available for primary NCD prevention and health promotion declined in all regions except for the African Region where it continued to increase gradually, and in the South-
East Asia Region where it remained at 100%. The most substantial declines in funding availability for primary prevention and health promotion were observed in the Eastern Mediterranean Region and Western Pacific Region with decreases to 65% and 84% respectively in 2015.
While availability of funding for NCD surveillance, monitoring and evaluation was generally lower than for primary NCD prevention and health promotion, funding increased steadily from 72% of countries in 2010 to 78% in 2013, and to 82% in 2015 (see Figure 2). These positive trends were most notable among countries in the Region of the Americas, the South-East Asia Region and the African Region. The availability of funding for NCD surveillance, monitoring and evaluation was lowest in the Eastern Mediterranean Region, showing a decline from 55% in 2010 to 50% in both 2013 and 2015.
Primary preventionHealth promotionEarly detection/screening
FIGURE 1:
Percentage of countries with funding for NCD activities by function, by WHO region
Health care and treatment Surveillance, monitoring and evaluationCapacity-building
Palliative care
100
80
60
40
20
0
% o
f co
untr
ies
AFR AMR EMR EUR SEAR WPR
28
FIGURE 2:
Percentage of countries* with funding of NCD-related activities, by WHO region, 2010, 2013 and 2015
a) For primary prevention and health promotion
100
80
60
40
20
0
100
80
60
40
20
0
% o
f co
untr
ies
AFR AMR EMR EUR SEAR WPR
2010
2010
2013
2013
2015
2015
b) For surveillance, monitoring and evaluation
% o
f co
untr
ies
AFR AMR EMR EUR SEAR WPR
* of 160 countries that responded to all 3 surveys.
* of 160 countries that responded to all 3 surveys.
29Report of the 2015 Global NCD Survey
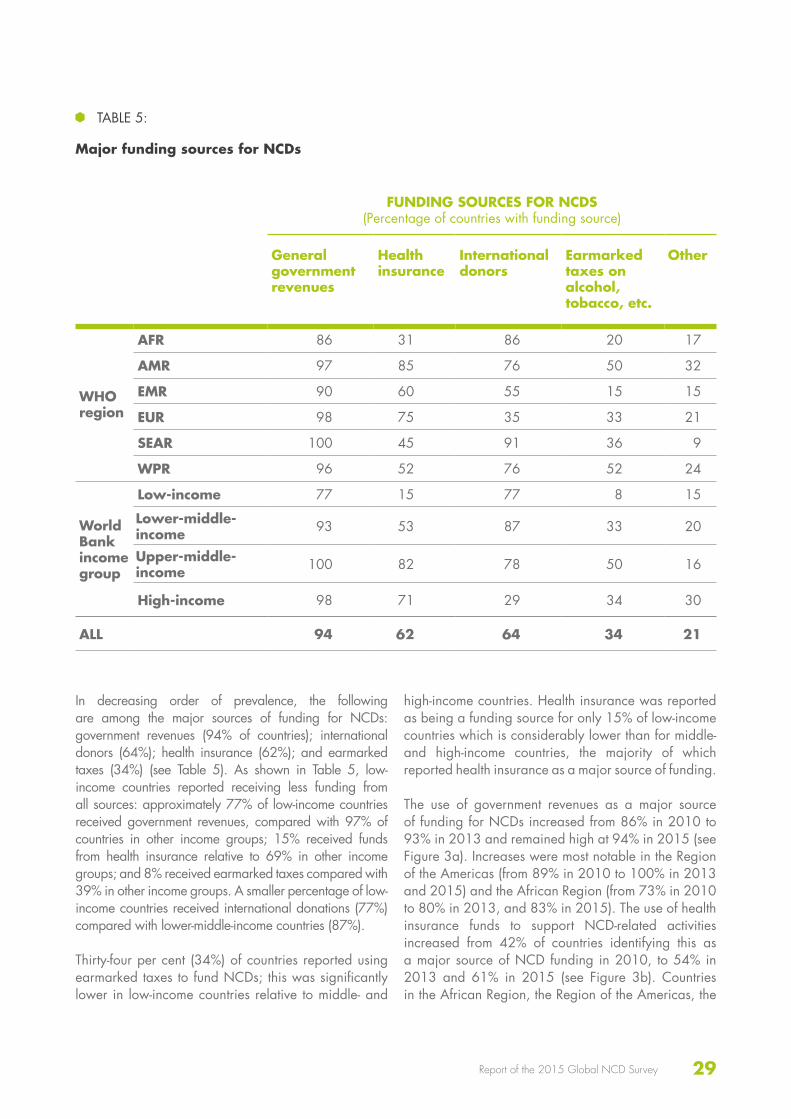
In decreasing order of prevalence, the following are among the major sources of funding for NCDs: government revenues (94% of countries); international donors (64%); health insurance (62%); and earmarked taxes (34%) (see Table 5). As shown in Table 5, low-income countries reported receiving less funding from all sources: approximately 77% of low-income countries received government revenues, compared with 97% of countries in other income groups; 15% received funds from health insurance relative to 69% in other income groups; and 8% received earmarked taxes compared with 39% in other income groups. A smaller percentage of low-income countries received international donations (77%) compared with lower-middle-income countries (87%).
Thirty-four per cent (34%) of countries reported using earmarked taxes to fund NCDs; this was significantly lower in low-income countries relative to middle- and
high-income countries. Health insurance was reported as being a funding source for only 15% of low-income countries which is considerably lower than for middle- and high-income countries, the majority of which reported health insurance as a major source of funding.
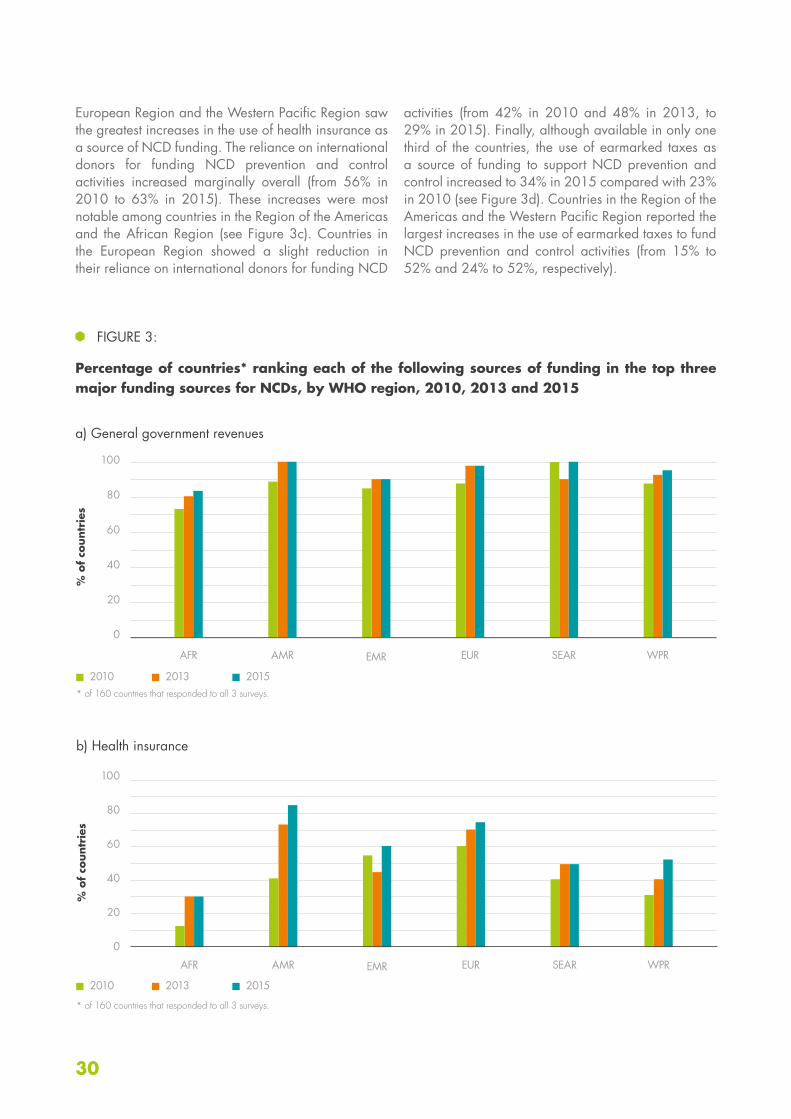
The use of government revenues as a major source of funding for NCDs increased from 86% in 2010 to 93% in 2013 and remained high at 94% in 2015 (see Figure 3a). Increases were most notable in the Region of the Americas (from 89% in 2010 to 100% in 2013 and 2015) and the African Region (from 73% in 2010 to 80% in 2013, and 83% in 2015). The use of health insurance funds to support NCD-related activities increased from 42% of countries identifying this as a major source of NCD funding in 2010, to 54% in 2013 and 61% in 2015 (see Figure 3b). Countries in the African Region, the Region of the Americas, the
TABLE 5:
Major funding sources for NCDs
FUNDING SOURCES FOR NCDS (Percentage of countries with funding source)
General government revenues
Health insurance
International donors
Earmarked taxes on alcohol, tobacco, etc.
Other
WHO region
AFR 86 31 86 20 17
AMR 97 85 76 50 32
EMR 90 60 55 15 15
EUR 98 75 35 33 21
SEAR 100 45 91 36 9
WPR 96 52 76 52 24
World Bank income group
Low-income 77 15 77 8 15
Lower-middle-income 93 53 87 33 20
Upper-middle-income 100 82 78 50 16
High-income 98 71 29 34 30
ALL 94 62 64 34 21
30
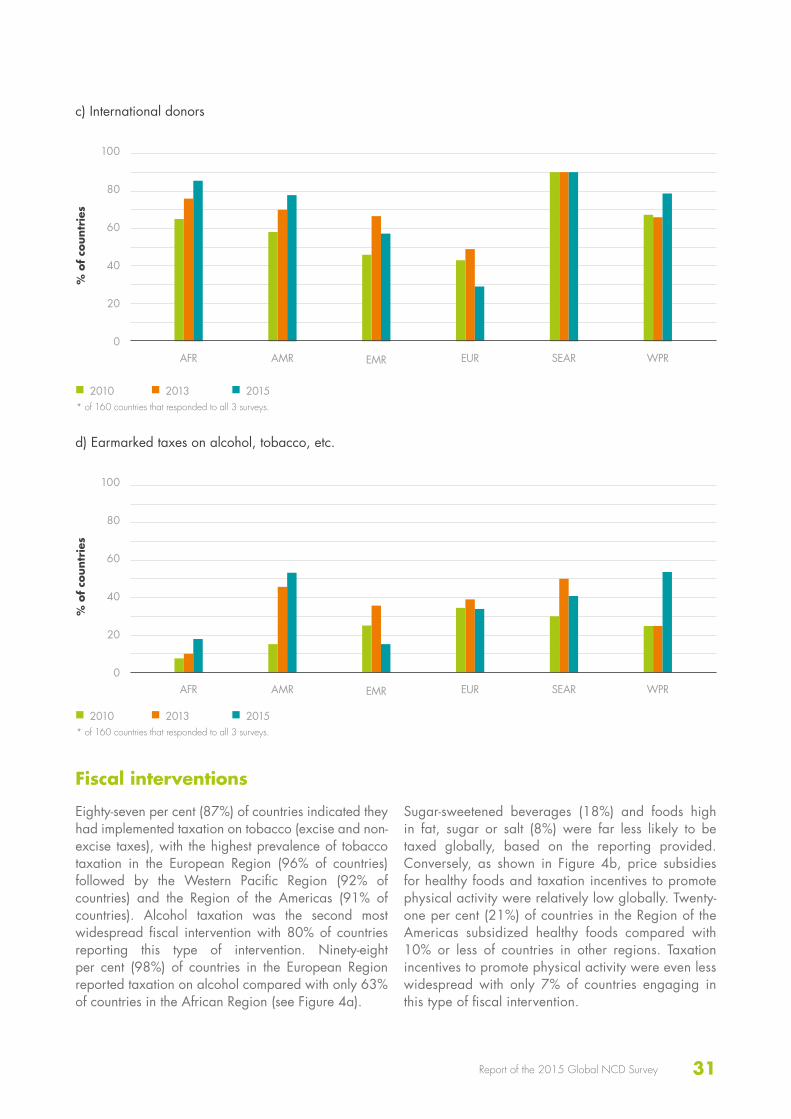
European Region and the Western Pacific Region saw the greatest increases in the use of health insurance as a source of NCD funding. The reliance on international donors for funding NCD prevention and control activities increased marginally overall (from 56% in 2010 to 63% in 2015). These increases were most notable among countries in the Region of the Americas and the African Region (see Figure 3c). Countries in the European Region showed a slight reduction in their reliance on international donors for funding NCD
activities (from 42% in 2010 and 48% in 2013, to 29% in 2015). Finally, although available in only one third of the countries, the use of earmarked taxes as a source of funding to support NCD prevention and control increased to 34% in 2015 compared with 23% in 2010 (see Figure 3d). Countries in the Region of the Americas and the Western Pacific Region reported the largest increases in the use of earmarked taxes to fund NCD prevention and control activities (from 15% to 52% and 24% to 52%, respectively).
2010
2010
2013
2013
2015
2015
FIGURE 3:
Percentage of countries* ranking each of the following sources of funding in the top three major funding sources for NCDs, by WHO region, 2010, 2013 and 2015
a) General government revenues
% o
f co
untr
ies
AFR AMR EMR EUR SEAR WPR
b) Health insurance
% o
f co
untr
ies
AFR AMR EMR EUR SEAR WPR
100
80
60
40
20
0
100
80
60
40
20
0
* of 160 countries that responded to all 3 surveys.
* of 160 countries that responded to all 3 surveys.
31Report of the 2015 Global NCD Survey
* of 160 countries that responded to all 3 surveys.
* of 160 countries that responded to all 3 surveys.
100
80
60
40
20
0
100
80
60
40
20
0
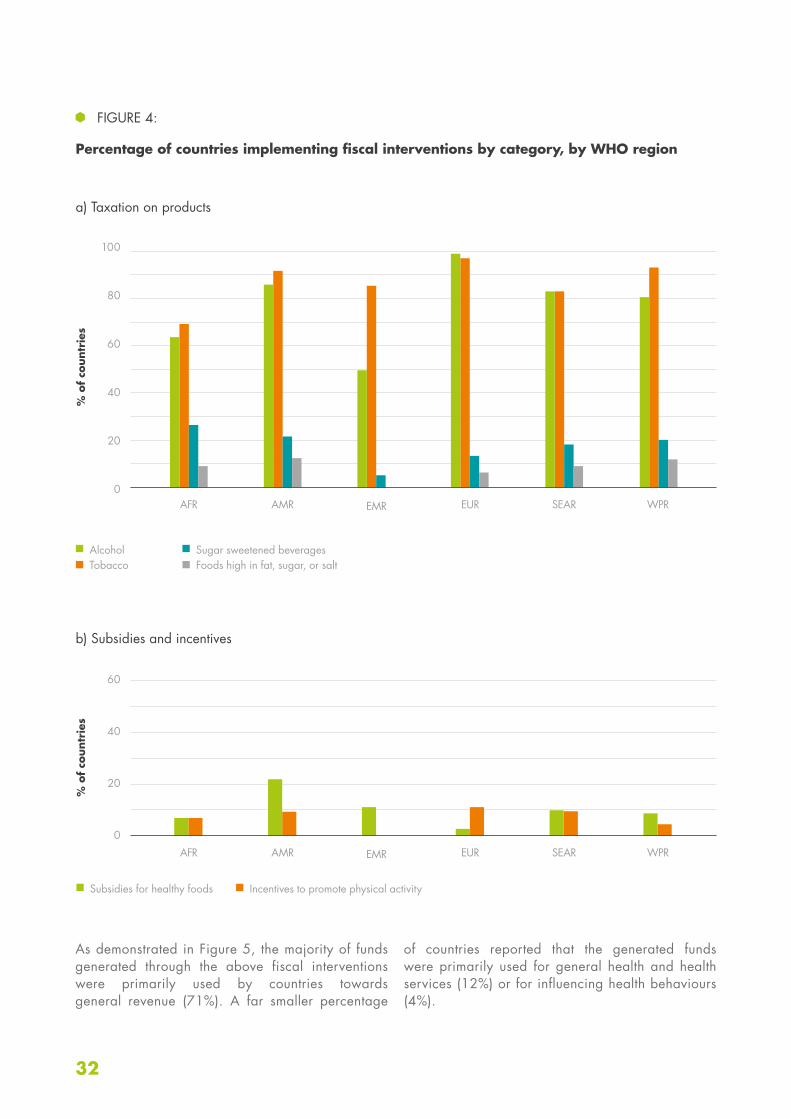
Fiscal interventions
Eighty-seven per cent (87%) of countries indicated they had implemented taxation on tobacco (excise and non-excise taxes), with the highest prevalence of tobacco taxation in the European Region (96% of countries) followed by the Western Pacific Region (92% of countries) and the Region of the Americas (91% of countries). Alcohol taxation was the second most widespread fiscal intervention with 80% of countries reporting this type of intervention. Ninety-eight per cent (98%) of countries in the European Region reported taxation on alcohol compared with only 63% of countries in the African Region (see Figure 4a).
Sugar-sweetened beverages (18%) and foods high in fat, sugar or salt (8%) were far less likely to be taxed globally, based on the reporting provided. Conversely, as shown in Figure 4b, price subsidies for healthy foods and taxation incentives to promote physical activity were relatively low globally. Twenty-one per cent (21%) of countries in the Region of the Americas subsidized healthy foods compared with 10% or less of countries in other regions. Taxation incentives to promote physical activity were even less widespread with only 7% of countries engaging in this type of fiscal intervention.
2010
2010
2013
2013
2015
2015
c) International donors
d) Earmarked taxes on alcohol, tobacco, etc.
% o
f co
untr
ies
% o
f co
untr
ies
AFR
AFR
AMR
AMR
EMR
EMR
EUR
EUR
SEAR
SEAR
WPR
WPR
32
100
80
60
40
20
0
60
40
20
0
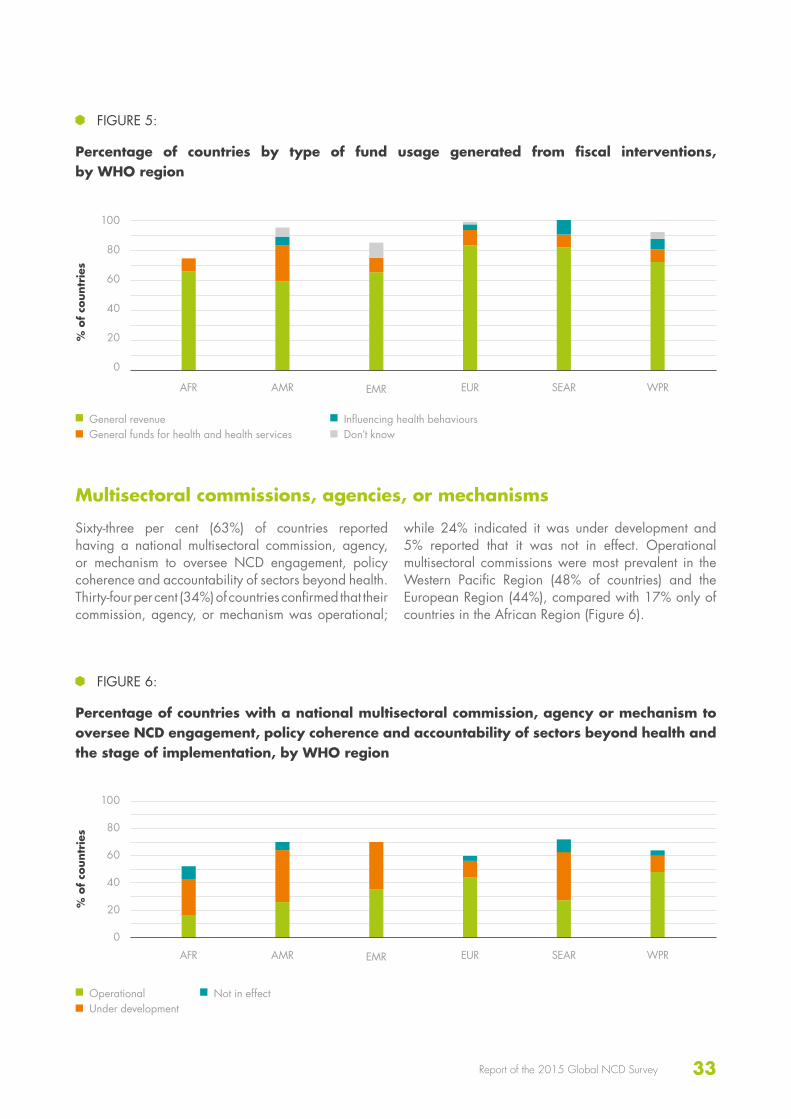
As demonstrated in Figure 5, the majority of funds generated through the above fiscal interventions were primarily used by countries towards general revenue (71%). A far smaller percentage
of countries reported that the generated funds were primarily used for general health and health services (12%) or for influencing health behaviours (4%).
Subsidies for healthy foods Incentives to promote physical activity
FIGURE 4:
Percentage of countries implementing fiscal interventions by category, by WHO region
a) Taxation on products
b) Subsidies and incentives
% o
f co
untr
ies
% o
f co
untr
ies
AFR
AFR
AMR
AMR
EMR
EMR
EUR
EUR
SEAR
SEAR
WPR
WPR
AlcoholTobacco
Sugar sweetened beveragesFoods high in fat, sugar, or salt
33Report of the 2015 Global NCD Survey
Multisectoral commissions, agencies, or mechanisms
Sixty-three per cent (63%) of countries reported having a national multisectoral commission, agency, or mechanism to oversee NCD engagement, policy coherence and accountability of sectors beyond health. Thirty-four per cent (34%) of countries confirmed that their commission, agency, or mechanism was operational;
while 24% indicated it was under development and 5% reported that it was not in effect. Operational multisectoral commissions were most prevalent in the Western Pacific Region (48% of countries) and the European Region (44%), compared with 17% only of countries in the African Region (Figure 6).
FIGURE 5:
Percentage of countries by type of fund usage generated from fiscal interventions, by WHO region
% o
f co
untr
ies
AFR AMR EMR EUR SEAR WPR
General revenueGeneral funds for health and health services
Influencing health behavioursDon’t know
FIGURE 6:
Percentage of countries with a national multisectoral commission, agency or mechanism to oversee NCD engagement, policy coherence and accountability of sectors beyond health and the stage of implementation, by WHO region
% o
f co
untr
ies
AFR AMR EMR EUR SEAR WPR
OperationalUnder development
Not in effect
100
80
60
40
20
0
100
80
60
40
20
0
34
100
80
60
40
20
0
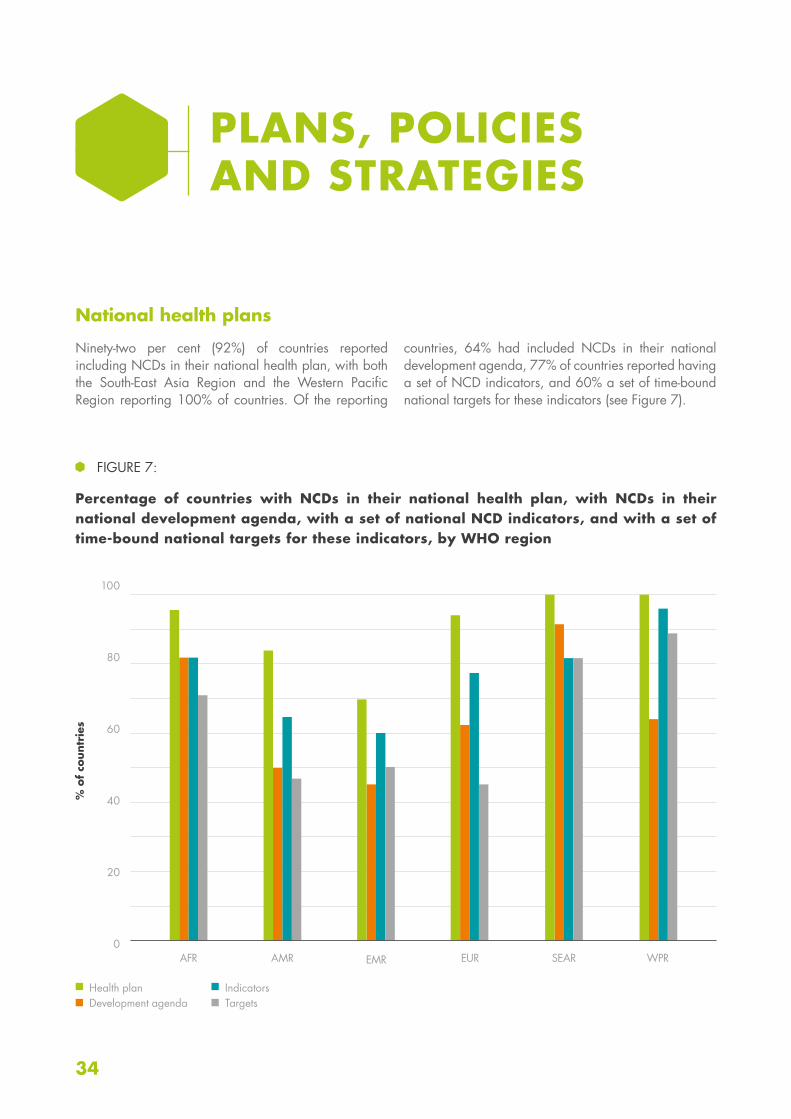
National health plans
Ninety-two per cent (92%) of countries reported including NCDs in their national health plan, with both the South-East Asia Region and the Western Pacific Region reporting 100% of countries. Of the reporting
countries, 64% had included NCDs in their national development agenda, 77% of countries reported having a set of NCD indicators, and 60% a set of time-bound national targets for these indicators (see Figure 7).
PLANS, POLICIES AND STRATEGIES
FIGURE 7:
Percentage of countries with NCDs in their national health plan, with NCDs in their national development agenda, with a set of national NCD indicators, and with a set of time-bound national targets for these indicators, by WHO region
% o
f co
untr
ies
AFR AMR EMR EUR SEAR WPR
Health planDevelopment agenda
IndicatorsTargets
35Report of the 2015 Global NCD Survey
100
80
60
40
20
0
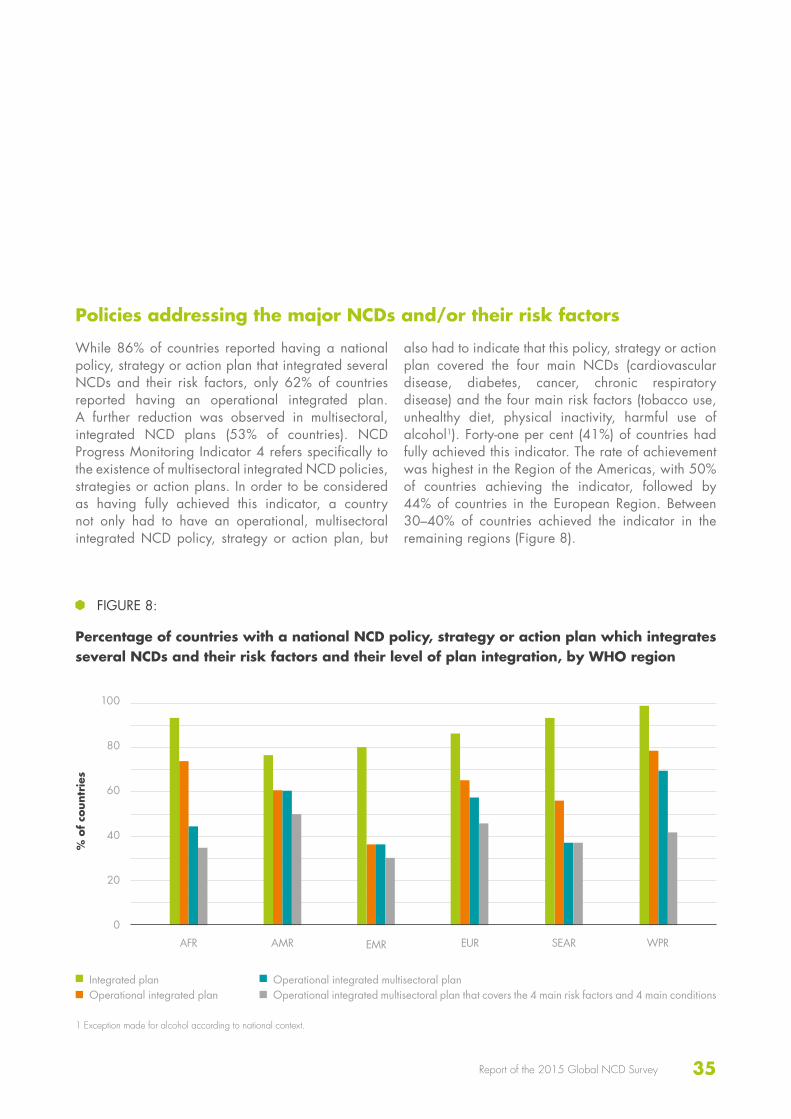
Policies addressing the major NCDs and/or their risk factors
While 86% of countries reported having a national policy, strategy or action plan that integrated several NCDs and their risk factors, only 62% of countries reported having an operational integrated plan. A further reduction was observed in multisectoral, integrated NCD plans (53% of countries). NCD Progress Monitoring Indicator 4 refers specifically to the existence of multisectoral integrated NCD policies, strategies or action plans. In order to be considered as having fully achieved this indicator, a country not only had to have an operational, multisectoral integrated NCD policy, strategy or action plan, but
also had to indicate that this policy, strategy or action plan covered the four main NCDs (cardiovascular disease, diabetes, cancer, chronic respiratory disease) and the four main risk factors (tobacco use, unhealthy diet, physical inactivity, harmful use of alcohol1). Forty-one per cent (41%) of countries had fully achieved this indicator. The rate of achievement was highest in the Region of the Americas, with 50% of countries achieving the indicator, followed by 44% of countries in the European Region. Between 30–40% of countries achieved the indicator in the remaining regions (Figure 8).
FIGURE 8:
Percentage of countries with a national NCD policy, strategy or action plan which integrates several NCDs and their risk factors and their level of plan integration, by WHO region
% o
f co
untr
ies
AFR AMR EMR EUR SEAR WPR
Integrated planOperational integrated plan
Operational integrated multisectoral planOperational integrated multisectoral plan that covers the 4 main risk factors and 4 main conditions
1 Exception made for alcohol according to national context.
36
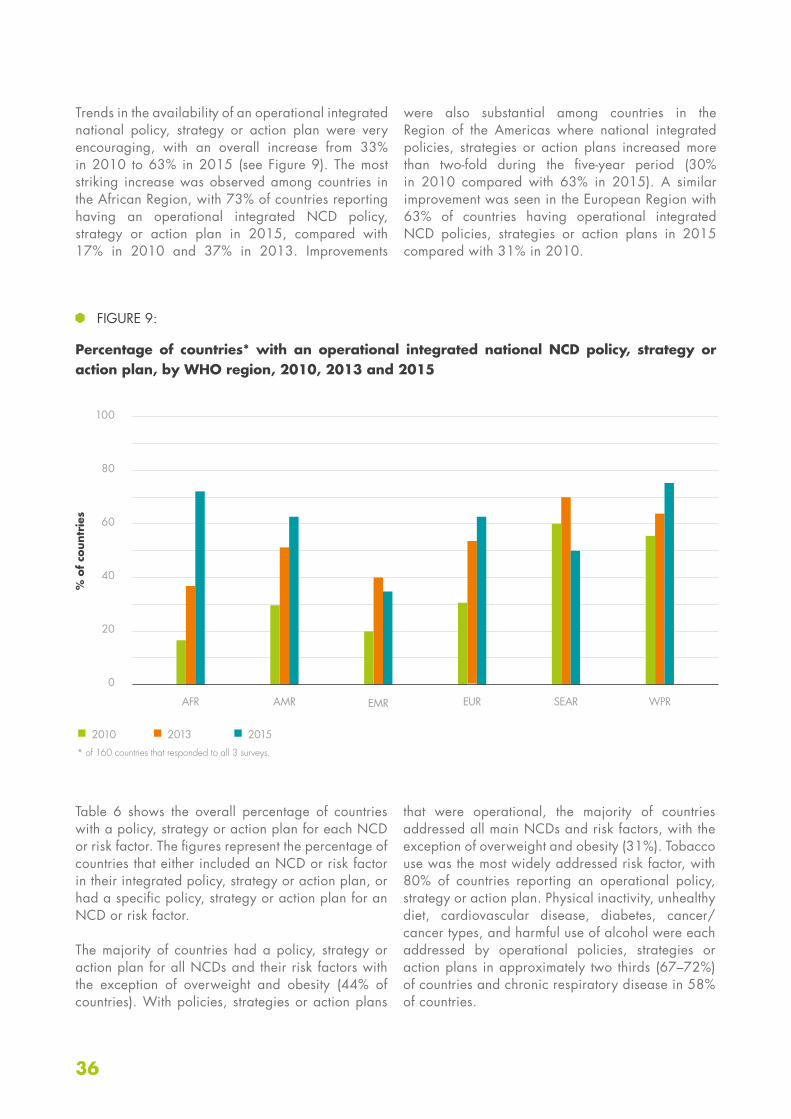
Trends in the availability of an operational integrated national policy, strategy or action plan were very encouraging, with an overall increase from 33% in 2010 to 63% in 2015 (see Figure 9). The most striking increase was observed among countries in the African Region, with 73% of countries reporting having an operational integrated NCD policy, strategy or action plan in 2015, compared with 17% in 2010 and 37% in 2013. Improvements
were also substantial among countries in the Region of the Americas where national integrated policies, strategies or action plans increased more than two-fold during the five-year period (30% in 2010 compared with 63% in 2015). A similar improvement was seen in the European Region with 63% of countries having operational integrated NCD policies, strategies or action plans in 2015 compared with 31% in 2010.
2010* of 160 countries that responded to all 3 surveys.
2013 2015
FIGURE 9:
Percentage of countries* with an operational integrated national NCD policy, strategy or action plan, by WHO region, 2010, 2013 and 2015
% o
f co
untr
ies
AFR AMR EMR EUR SEAR WPR
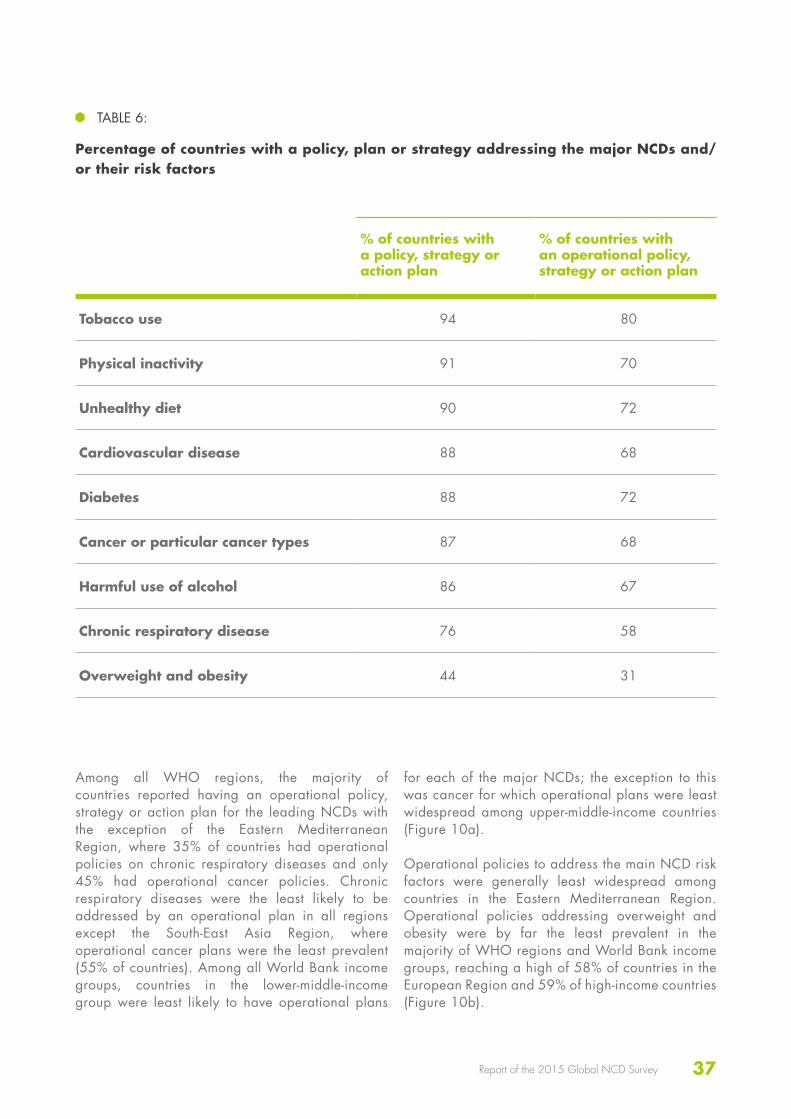
Table 6 shows the overall percentage of countries with a policy, strategy or action plan for each NCD or risk factor. The figures represent the percentage of countries that either included an NCD or risk factor in their integrated policy, strategy or action plan, or had a specific policy, strategy or action plan for an NCD or risk factor.
The majority of countries had a policy, strategy or action plan for all NCDs and their risk factors with the exception of overweight and obesity (44% of countries). With policies, strategies or action plans
that were operational, the majority of countries addressed all main NCDs and risk factors, with the exception of overweight and obesity (31%). Tobacco use was the most widely addressed risk factor, with 80% of countries reporting an operational policy, strategy or action plan. Physical inactivity, unhealthy diet, cardiovascular disease, diabetes, cancer/cancer types, and harmful use of alcohol were each addressed by operational policies, strategies or action plans in approximately two thirds (67–72%) of countries and chronic respiratory disease in 58% of countries.
100
80
60
40
20
0
37Report of the 2015 Global NCD Survey
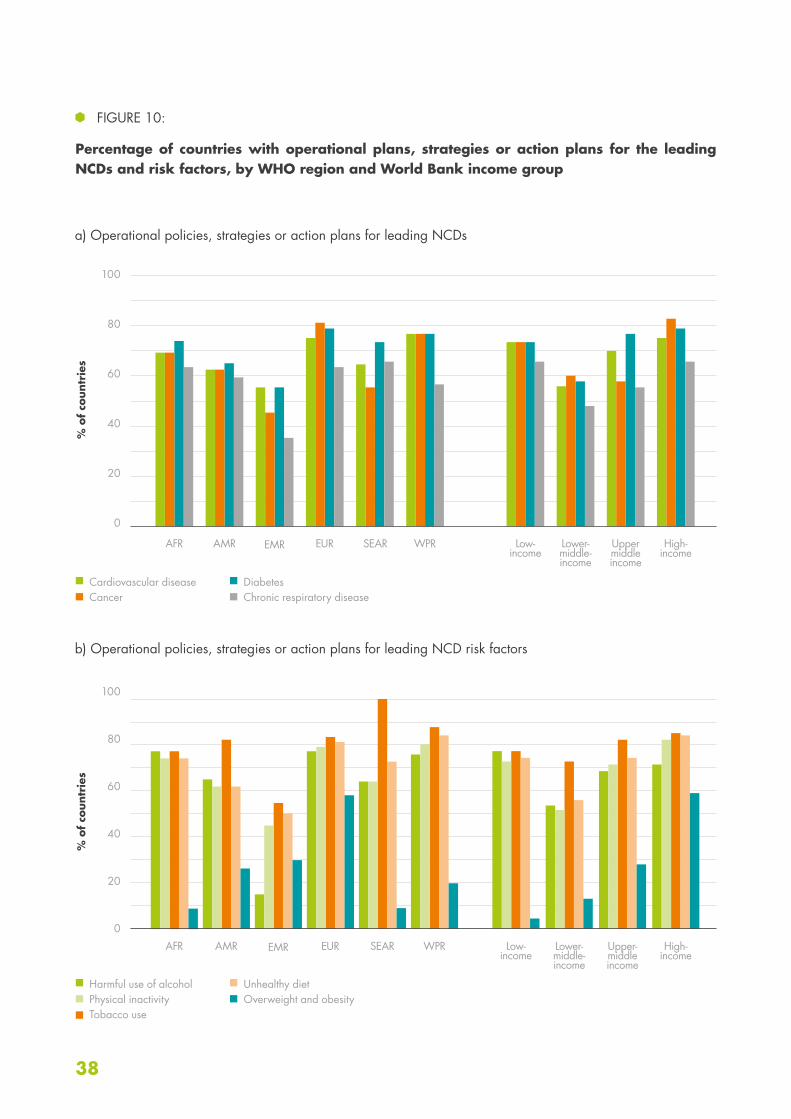
Among all WHO regions, the majority of countries reported having an operational policy, strategy or action plan for the leading NCDs with the exception of the Eastern Mediterranean Region, where 35% of countries had operational policies on chronic respiratory diseases and only 45% had operational cancer policies. Chronic respiratory diseases were the least likely to be addressed by an operational plan in all regions except the South-East Asia Region, where operational cancer plans were the least prevalent (55% of countries). Among all World Bank income groups, countries in the lower-middle-income group were least likely to have operational plans
for each of the major NCDs; the exception to this was cancer for which operational plans were least widespread among upper-middle-income countries (Figure 10a).
Operational policies to address the main NCD risk factors were generally least widespread among countries in the Eastern Mediterranean Region. Operational policies addressing overweight and obesity were by far the least prevalent in the majority of WHO regions and World Bank income groups, reaching a high of 58% of countries in the European Region and 59% of high-income countries (Figure 10b).
TABLE 6:
Percentage of countries with a policy, plan or strategy addressing the major NCDs and/or their risk factors
% of countries with a policy, strategy or action plan
% of countries with an operational policy, strategy or action plan
Tobacco use 94 80
Physical inactivity 91 70
Unhealthy diet 90 72
Cardiovascular disease 88 68
Diabetes 88 72
Cancer or particular cancer types 87 68
Harmful use of alcohol 86 67
Chronic respiratory disease 76 58
Overweight and obesity 44 31
38
100
80
60
40
20
0
100
80
60
40
20
0
FIGURE 10:
Percentage of countries with operational plans, strategies or action plans for the leading NCDs and risk factors, by WHO region and World Bank income group
% o
f co
untr
ies
% o
f co
untr
ies
AFR
AFR
Low- income
Low- income
AMR
AMR
Lower- middle- income
Lower- middle- income
EMR
EMR
Upper middle income
Upper- middle income
EUR
EUR
High- income
High- income
SEAR
SEAR
WPR
WPR
a) Operational policies, strategies or action plans for leading NCDs
b) Operational policies, strategies or action plans for leading NCD risk factors
Cardiovascular diseaseCancer
Harmful use of alcoholPhysical inactivityTobacco use
DiabetesChronic respiratory disease
Unhealthy dietOverweight and obesity
39Report of the 2015 Global NCD Survey
100
80
60
40
20
0
100
80
60
40
20
0
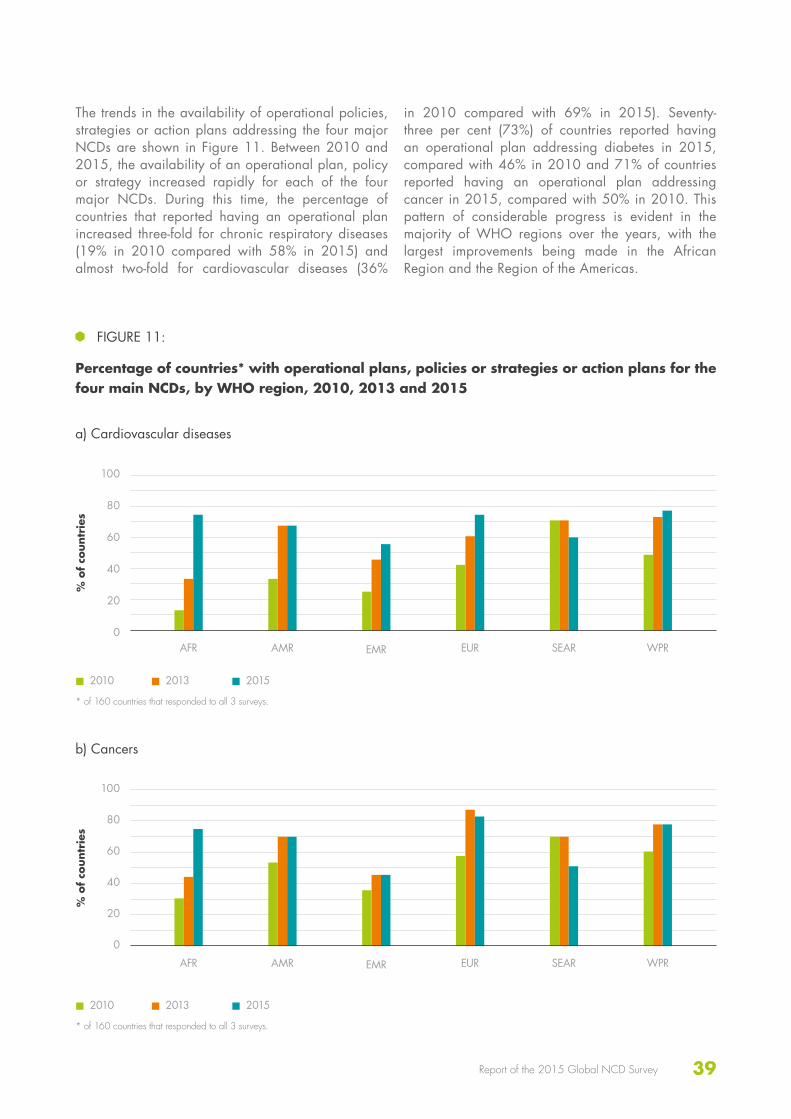
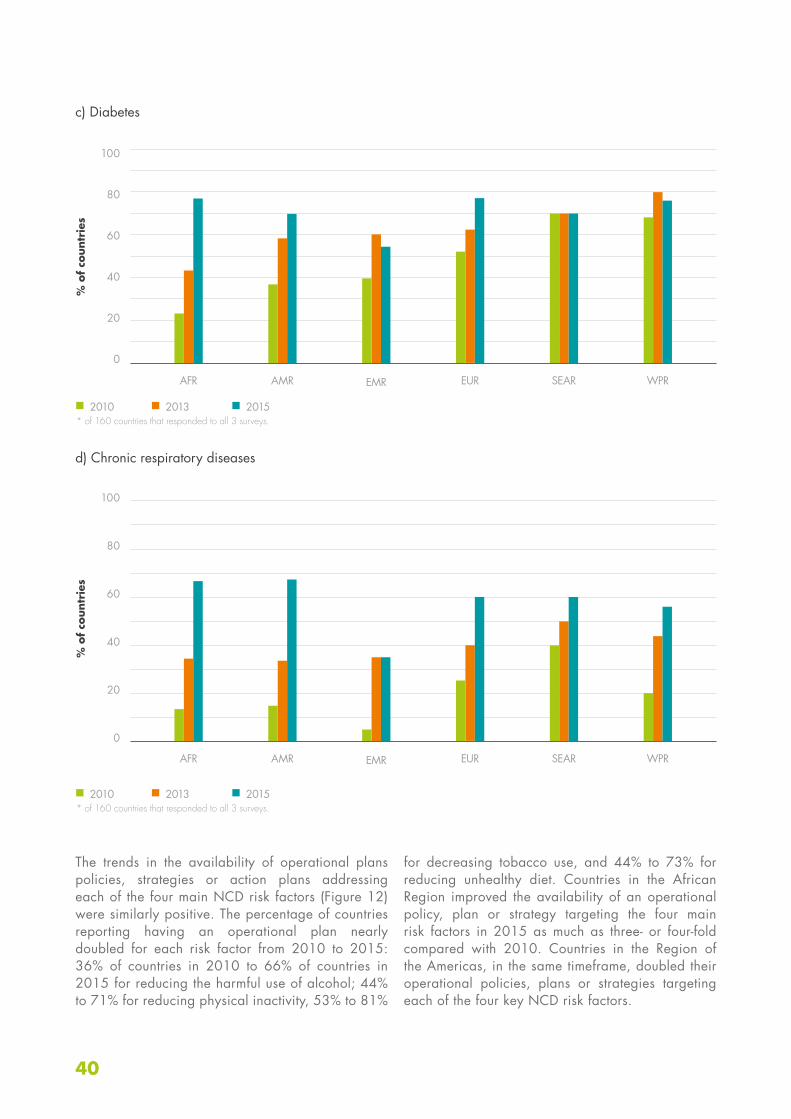
The trends in the availability of operational policies, strategies or action plans addressing the four major NCDs are shown in Figure 11. Between 2010 and 2015, the availability of an operational plan, policy or strategy increased rapidly for each of the four major NCDs. During this time, the percentage of countries that reported having an operational plan increased three-fold for chronic respiratory diseases (19% in 2010 compared with 58% in 2015) and almost two-fold for cardiovascular diseases (36%
in 2010 compared with 69% in 2015). Seventy-three per cent (73%) of countries reported having an operational plan addressing diabetes in 2015, compared with 46% in 2010 and 71% of countries reported having an operational plan addressing cancer in 2015, compared with 50% in 2010. This pattern of considerable progress is evident in the majority of WHO regions over the years, with the largest improvements being made in the African Region and the Region of the Americas.
2010
2010
2013
2013
2015
2015
FIGURE 11:
Percentage of countries* with operational plans, policies or strategies or action plans for the four main NCDs, by WHO region, 2010, 2013 and 2015
a) Cardiovascular diseases
b) Cancers
% o
f co
untr
ies
% o
f co
untr
ies
AFR
AFR
AMR
AMR
EMR
EMR
EUR
EUR
SEAR
SEAR
WPR
WPR
* of 160 countries that responded to all 3 surveys.
* of 160 countries that responded to all 3 surveys.
40
100
80
60
40
20
0
100
80
60
40
20
0
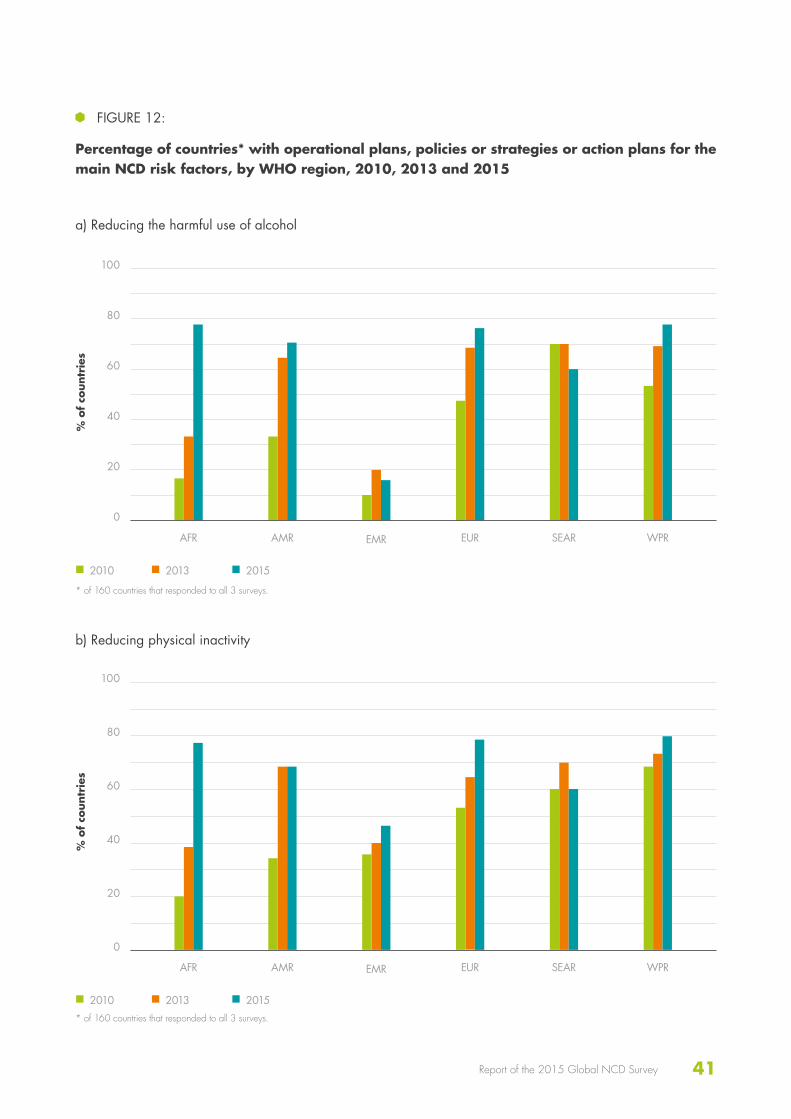
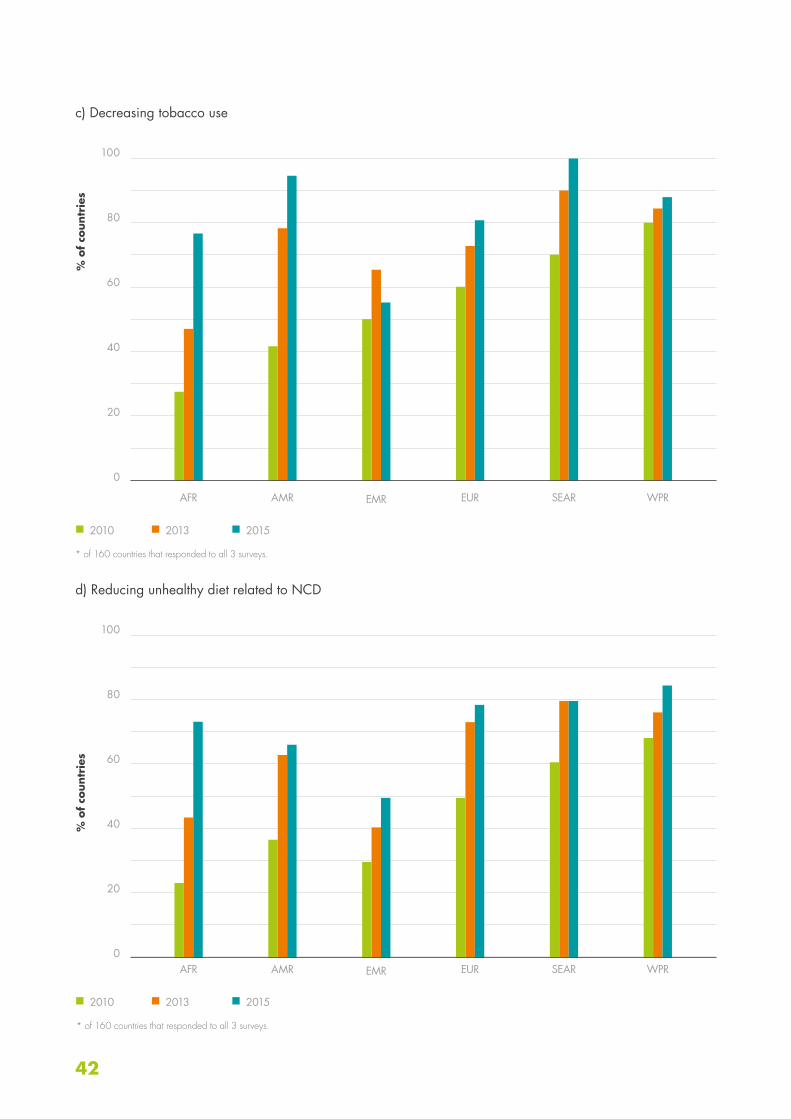
The trends in the availability of operational plans policies, strategies or action plans addressing each of the four main NCD risk factors (Figure 12) were similarly positive. The percentage of countries reporting having an operational plan nearly doubled for each risk factor from 2010 to 2015: 36% of countries in 2010 to 66% of countries in 2015 for reducing the harmful use of alcohol; 44% to 71% for reducing physical inactivity, 53% to 81%
for decreasing tobacco use, and 44% to 73% for reducing unhealthy diet. Countries in the African Region improved the availability of an operational policy, plan or strategy targeting the four main risk factors in 2015 as much as three- or four-fold compared with 2010. Countries in the Region of the Americas, in the same timeframe, doubled their operational policies, plans or strategies targeting each of the four key NCD risk factors.
2010
2010
2013
2013
2015
2015
c) Diabetes
d) Chronic respiratory diseases
% o
f co
untr
ies
% o
f co
untr
ies
AFR
AFR
AMR
AMR
EMR
EMR
EUR
EUR
SEAR
SEAR
WPR
WPR
* of 160 countries that responded to all 3 surveys.
* of 160 countries that responded to all 3 surveys.
41Report of the 2015 Global NCD Survey
100
80
60
40
20
0
100
80
60
40
20
0
2010
2010
2013
2013
2015
2015
FIGURE 12:
Percentage of countries* with operational plans, policies or strategies or action plans for the main NCD risk factors, by WHO region, 2010, 2013 and 2015
a) Reducing the harmful use of alcohol
b) Reducing physical inactivity
% o
f co
untr
ies
% o
f co
untr
ies
AFR
AFR
AMR
AMR
EMR
EMR
EUR
EUR
SEAR
SEAR
WPR
WPR
* of 160 countries that responded to all 3 surveys.
* of 160 countries that responded to all 3 surveys.
42
100
80
60
40
20
0
100
80
60
40
20
0
2010
2010
2013
2013
2015
2015
c) Decreasing tobacco use
d) Reducing unhealthy diet related to NCD
% o
f co
untr
ies
% o
f co
untr
ies
AFR
AFR
AMR
AMR
EMR
EMR
EUR
EUR
SEAR
SEAR
WPR
WPR
* of 160 countries that responded to all 3 surveys.
* of 160 countries that responded to all 3 surveys.
43Report of the 2015 Global NCD Survey
60
40
20
0
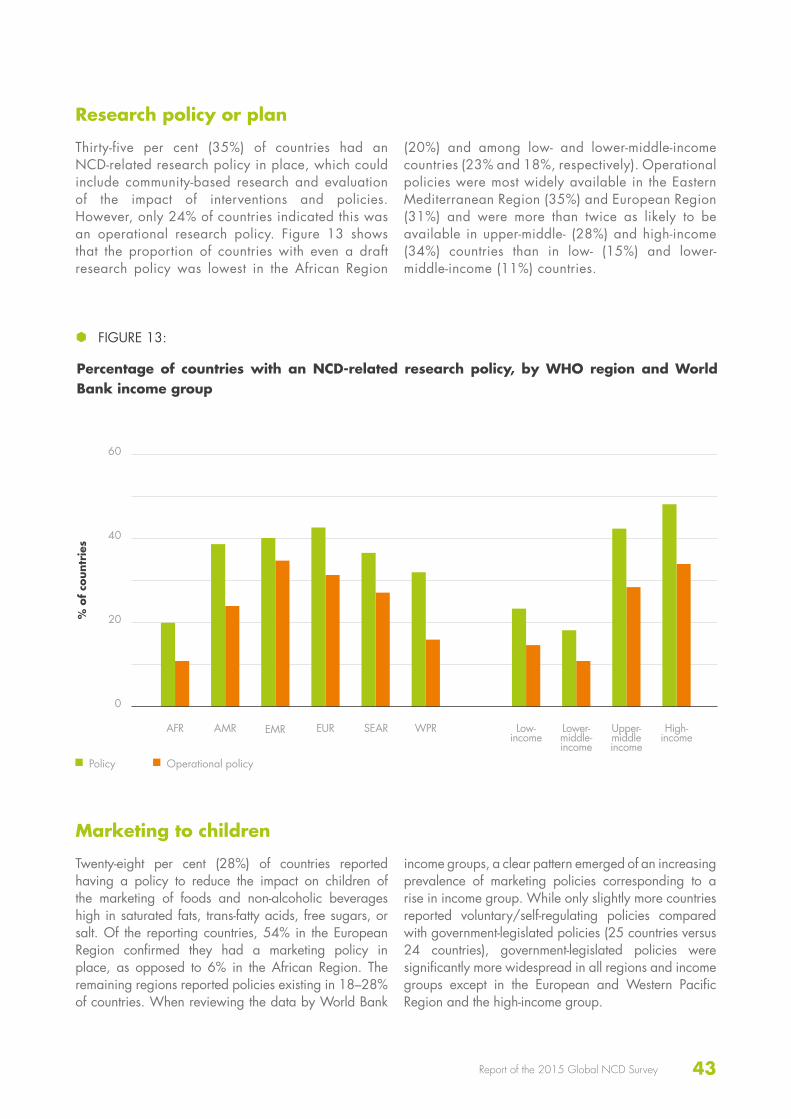
Research policy or plan
Thirty-five per cent (35%) of countries had an NCD-related research policy in place, which could include community-based research and evaluation of the impact of interventions and policies. However, only 24% of countries indicated this was an operational research policy. Figure 13 shows that the proportion of countries with even a draft research policy was lowest in the African Region
(20%) and among low- and lower-middle-income countries (23% and 18%, respectively). Operational policies were most widely available in the Eastern Mediterranean Region (35%) and European Region (31%) and were more than twice as likely to be available in upper-middle- (28%) and high-income (34%) countries than in low- (15%) and lower-middle-income (11%) countries.
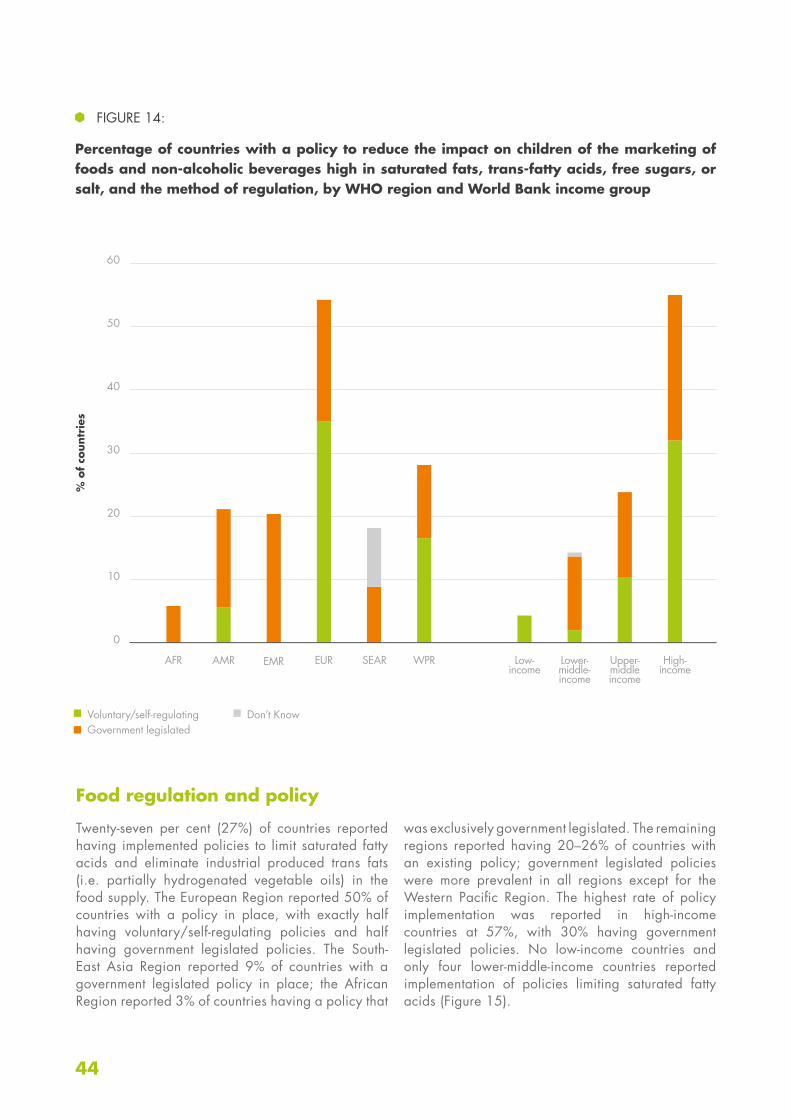
Marketing to children
Twenty-eight per cent (28%) of countries reported having a policy to reduce the impact on children of the marketing of foods and non-alcoholic beverages high in saturated fats, trans-fatty acids, free sugars, or salt. Of the reporting countries, 54% in the European Region confirmed they had a marketing policy in place, as opposed to 6% in the African Region. The remaining regions reported policies existing in 18–28% of countries. When reviewing the data by World Bank
income groups, a clear pattern emerged of an increasing prevalence of marketing policies corresponding to a rise in income group. While only slightly more countries reported voluntary/self-regulating policies compared with government-legislated policies (25 countries versus 24 countries), government-legislated policies were significantly more widespread in all regions and income groups except in the European and Western Pacific Region and the high-income group.
FIGURE 13:
Percentage of countries with an NCD-related research policy, by WHO region and World Bank income group
% o
f co
untr
ies
AFR Low- income
AMR Lower- middle- income
EMR Upper- middle income
EUR High- income
SEAR WPR
Policy Operational policy
44
60
50
40
30
20
10
0
Food regulation and policy
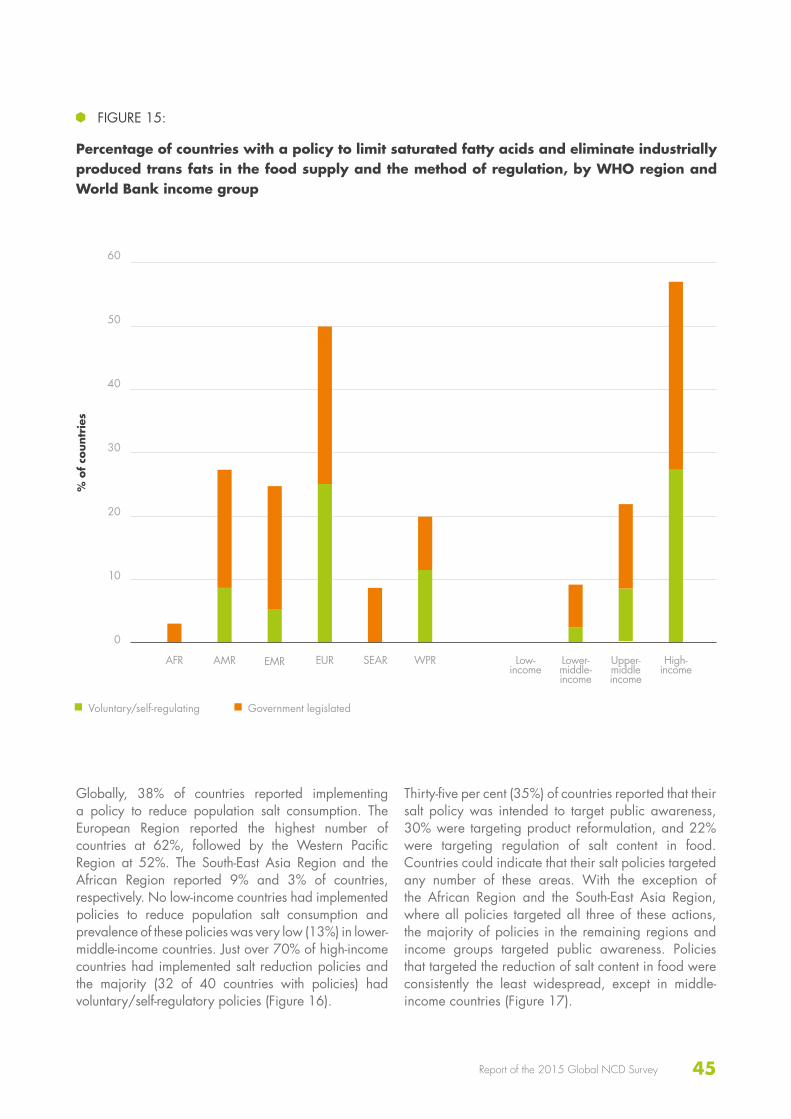
Twenty-seven per cent (27%) of countries reported having implemented policies to limit saturated fatty acids and eliminate industrial produced trans fats (i.e. partially hydrogenated vegetable oils) in the food supply. The European Region reported 50% of countries with a policy in place, with exactly half having voluntary/self-regulating policies and half having government legislated policies. The South-East Asia Region reported 9% of countries with a government legislated policy in place; the African Region reported 3% of countries having a policy that
was exclusively government legislated. The remaining regions reported having 20–26% of countries with an existing policy; government legislated policies were more prevalent in all regions except for the Western Pacific Region. The highest rate of policy implementation was reported in high-income countries at 57%, with 30% having government legislated policies. No low-income countries and only four lower-middle-income countries reported implementation of policies limiting saturated fatty acids (Figure 15).
FIGURE 14:
Percentage of countries with a policy to reduce the impact on children of the marketing of foods and non-alcoholic beverages high in saturated fats, trans-fatty acids, free sugars, or salt, and the method of regulation, by WHO region and World Bank income group
% o
f co
untr
ies
AFR Low- income
AMR Lower- middle- income
EMR Upper- middle income
EUR High- income
SEAR WPR
Voluntary/self-regulatingGovernment legislated
Don’t Know
45Report of the 2015 Global NCD Survey
60
50
40
30
20
10
0
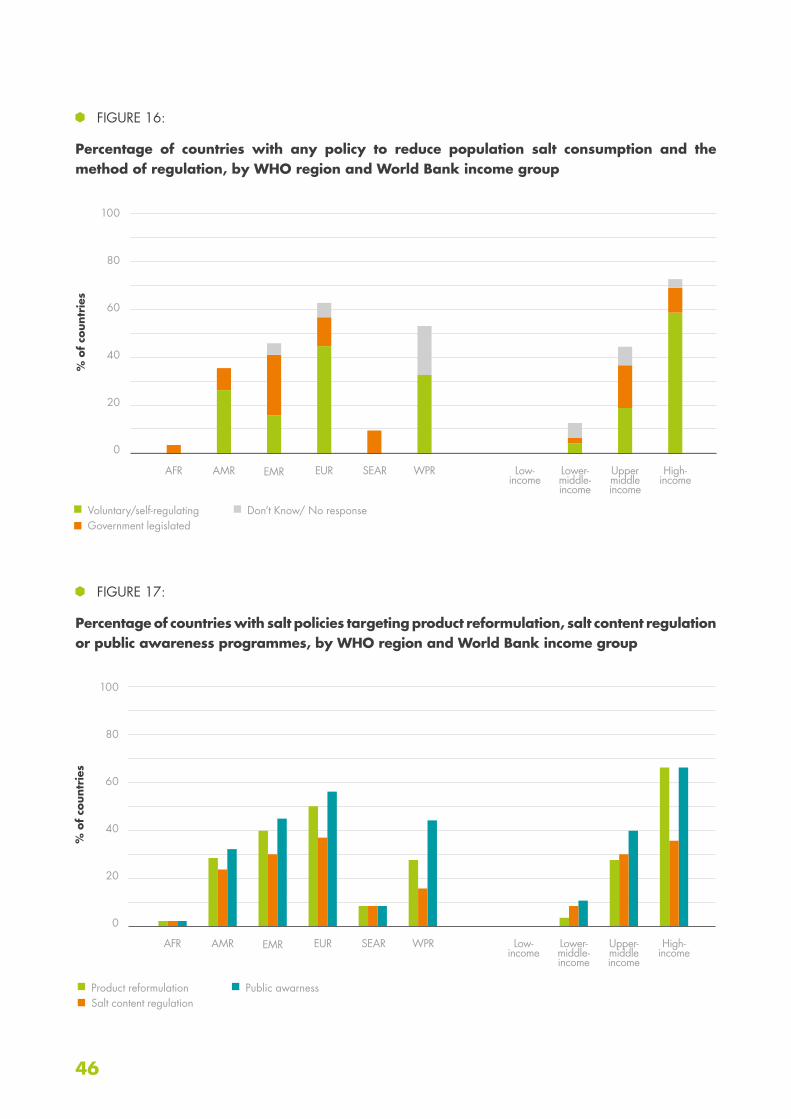
Globally, 38% of countries reported implementing a policy to reduce population salt consumption. The European Region reported the highest number of countries at 62%, followed by the Western Pacific Region at 52%. The South-East Asia Region and the African Region reported 9% and 3% of countries, respectively. No low-income countries had implemented policies to reduce population salt consumption and prevalence of these policies was very low (13%) in lower-middle-income countries. Just over 70% of high-income countries had implemented salt reduction policies and the majority (32 of 40 countries with policies) had voluntary/self-regulatory policies (Figure 16).
Thirty-five per cent (35%) of countries reported that their salt policy was intended to target public awareness, 30% were targeting product reformulation, and 22% were targeting regulation of salt content in food. Countries could indicate that their salt policies targeted any number of these areas. With the exception of the African Region and the South-East Asia Region, where all policies targeted all three of these actions, the majority of policies in the remaining regions and income groups targeted public awareness. Policies that targeted the reduction of salt content in food were consistently the least widespread, except in middle-income countries (Figure 17).
FIGURE 15:
Percentage of countries with a policy to limit saturated fatty acids and eliminate industrially produced trans fats in the food supply and the method of regulation, by WHO region and World Bank income group
% o
f co
untr
ies
AFR Low- income
AMR Lower- middle- income
EMR Upper- middle income
EUR High- income
SEAR WPR
Voluntary/self-regulating Government legislated
46
100
80
60
40
20
0
100
80
60
40
20
0
FIGURE 16:
Percentage of countries with any policy to reduce population salt consumption and the method of regulation, by WHO region and World Bank income group
% o
f co
untr
ies
AFR Low- income
AMR Lower- middle- income
EMR Upper middle income
EUR High- income
SEAR WPR
Voluntary/self-regulatingGovernment legislated
Don’t Know/ No response
FIGURE 17:
Percentage of countries with salt policies targeting product reformulation, salt content regulation or public awareness programmes, by WHO region and World Bank income group
% o
f co
untr
ies
AFR Low- income
AMR Lower- middle- income
EMR Upper- middle income
EUR High- income
SEAR WPR
Product reformulationSalt content regulation
Public awarness
47Report of the 2015 Global NCD Survey
100
80
60
40
20
0
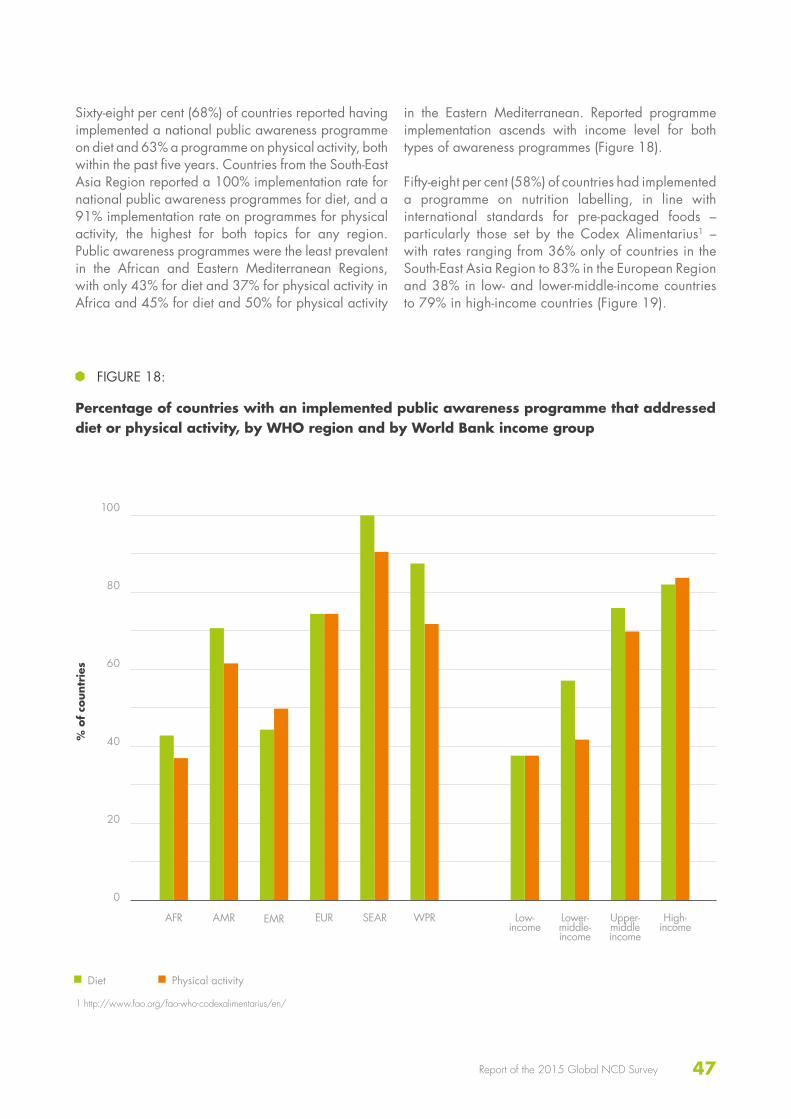
Sixty-eight per cent (68%) of countries reported having implemented a national public awareness programme on diet and 63% a programme on physical activity, both within the past five years. Countries from the South-East Asia Region reported a 100% implementation rate for national public awareness programmes for diet, and a 91% implementation rate on programmes for physical activity, the highest for both topics for any region. Public awareness programmes were the least prevalent in the African and Eastern Mediterranean Regions, with only 43% for diet and 37% for physical activity in Africa and 45% for diet and 50% for physical activity
in the Eastern Mediterranean. Reported programme implementation ascends with income level for both types of awareness programmes (Figure 18).
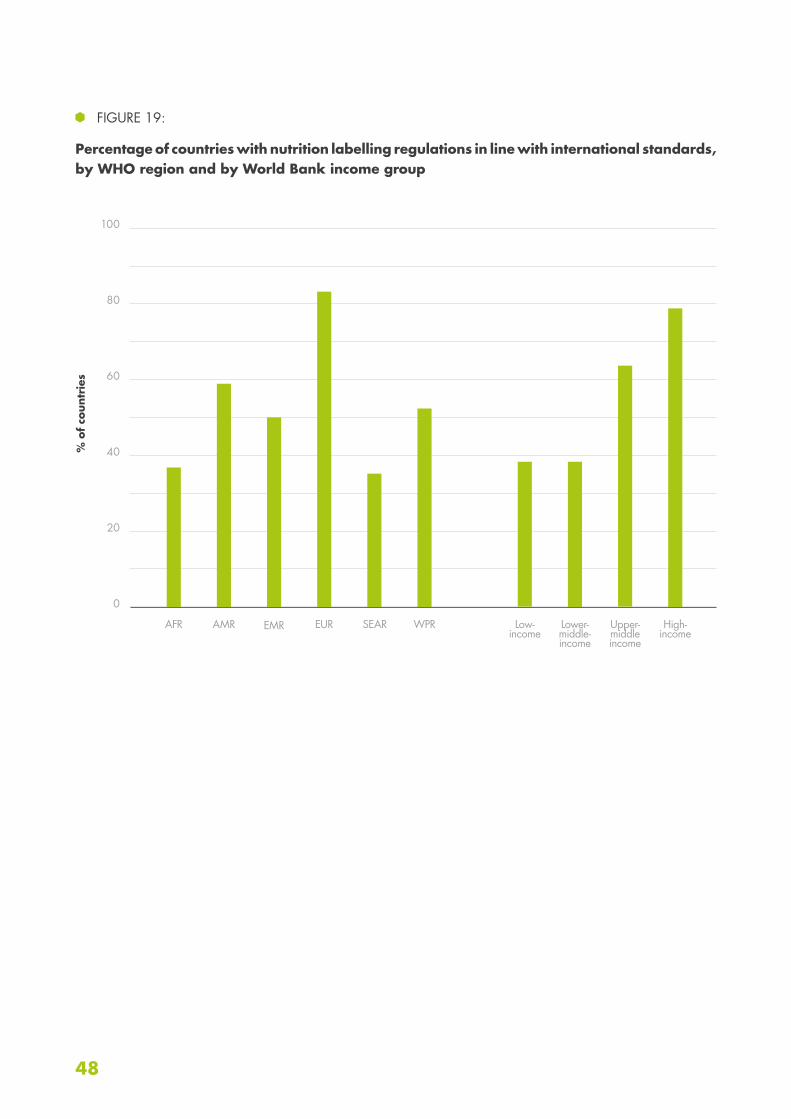
Fifty-eight per cent (58%) of countries had implemented a programme on nutrition labelling, in line with international standards for pre-packaged foods – particularly those set by the Codex Alimentarius1 – with rates ranging from 36% only of countries in the South-East Asia Region to 83% in the European Region and 38% in low- and lower-middle-income countries to 79% in high-income countries (Figure 19).
FIGURE 18:
Percentage of countries with an implemented public awareness programme that addressed diet or physical activity, by WHO region and by World Bank income group
% o
f co
untr
ies
AFR Low- income
AMR Lower- middle- income
EMR Upper- middle income
EUR High- income
SEAR WPR
Diet Physical activity
1 http://www.fao.org/fao-who-codexalimentarius/en/
48
100
80
60
40
20
0
FIGURE 19:
Percentage of countries with nutrition labelling regulations in line with international standards, by WHO region and by World Bank income group
% o
f co
untr
ies
AFR Low- income
AMR Lower- middle- income
EMR Upper- middle income
EUR High- income
SEAR WPR

49Report of the 2015 Global NCD Survey
50
60
50
40
30
20
10
0
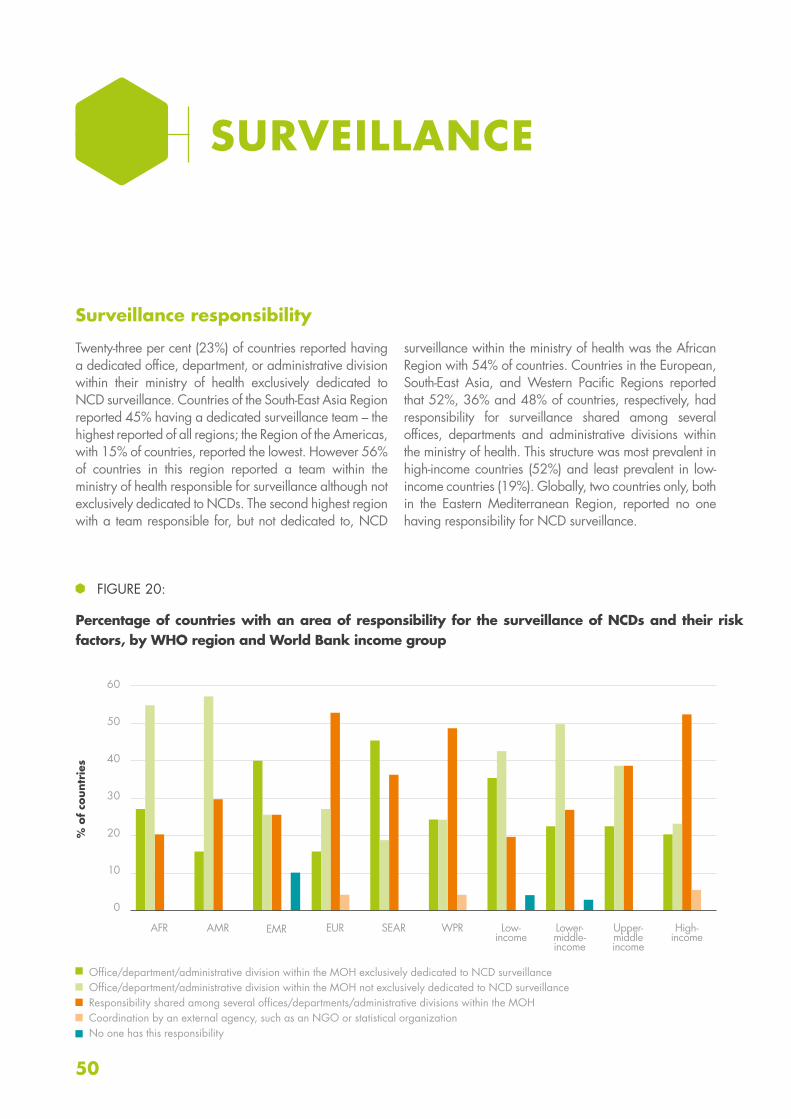
Surveillance responsibility
Twenty-three per cent (23%) of countries reported having a dedicated office, department, or administrative division within their ministry of health exclusively dedicated to NCD surveillance. Countries of the South-East Asia Region reported 45% having a dedicated surveillance team – the highest reported of all regions; the Region of the Americas, with 15% of countries, reported the lowest. However 56% of countries in this region reported a team within the ministry of health responsible for surveillance although not exclusively dedicated to NCDs. The second highest region with a team responsible for, but not dedicated to, NCD
surveillance within the ministry of health was the African Region with 54% of countries. Countries in the European, South-East Asia, and Western Pacific Regions reported that 52%, 36% and 48% of countries, respectively, had responsibility for surveillance shared among several offices, departments and administrative divisions within the ministry of health. This structure was most prevalent in high-income countries (52%) and least prevalent in low-income countries (19%). Globally, two countries only, both in the Eastern Mediterranean Region, reported no one having responsibility for NCD surveillance.
SURVEILLANCE
FIGURE 20:
Percentage of countries with an area of responsibility for the surveillance of NCDs and their risk factors, by WHO region and World Bank income group
% o
f co
untr
ies
AFR Low- income
AMR Lower- middle- income
EMR Upper- middle income
EUR High- income
SEAR WPR
Office/department/administrative division within the MOH exclusively dedicated to NCD surveillanceOffice/department/administrative division within the MOH not exclusively dedicated to NCD surveillanceResponsibility shared among several offices/departments/administrative divisions within the MOHCoordination by an external agency, such as an NGO or statistical organizationNo one has this responsibility
51Report of the 2015 Global NCD Survey
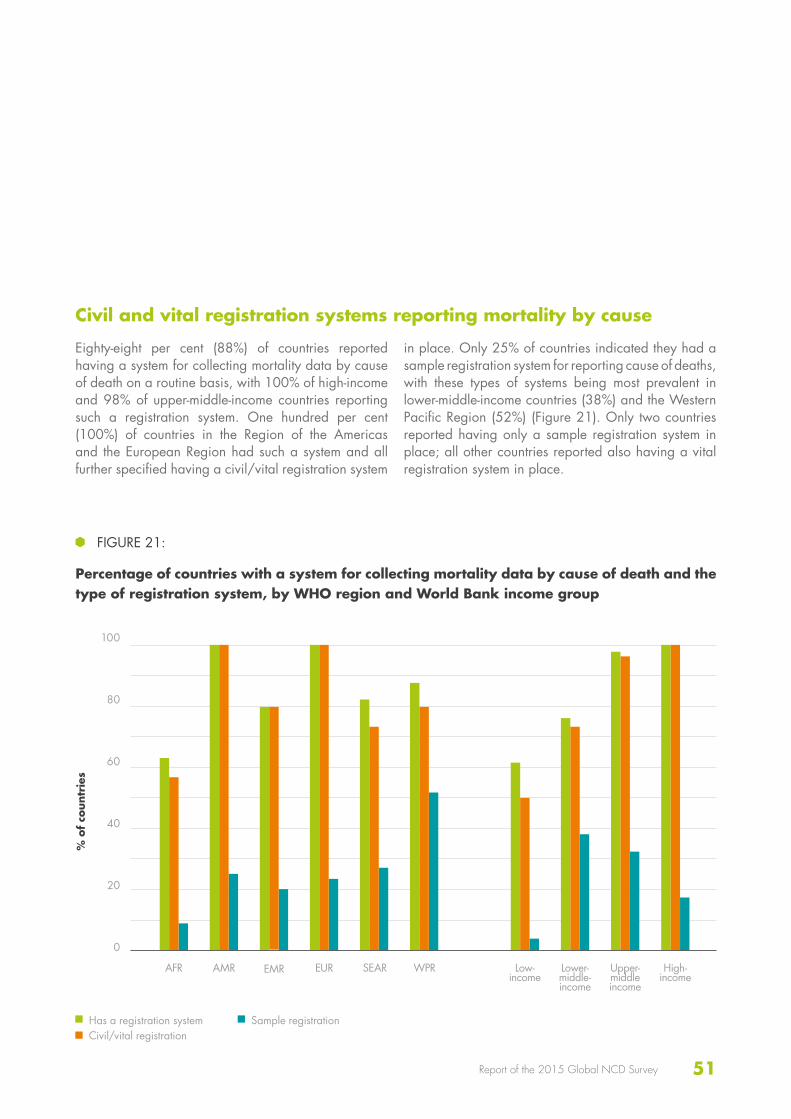
Civil and vital registration systems reporting mortality by cause
Eighty-eight per cent (88%) of countries reported having a system for collecting mortality data by cause of death on a routine basis, with 100% of high-income and 98% of upper-middle-income countries reporting such a registration system. One hundred per cent (100%) of countries in the Region of the Americas and the European Region had such a system and all further specified having a civil/vital registration system
in place. Only 25% of countries indicated they had a sample registration system for reporting cause of deaths, with these types of systems being most prevalent in lower-middle-income countries (38%) and the Western Pacific Region (52%) (Figure 21). Only two countries reported having only a sample registration system in place; all other countries reported also having a vital registration system in place.
100
80
60
40
20
0
FIGURE 21:
Percentage of countries with a system for collecting mortality data by cause of death and the type of registration system, by WHO region and World Bank income group
% o
f co
untr
ies
AFR Low- income
AMR Lower- middle- income
EMR Upper- middle income
EUR High- income
SEAR WPR
Has a registration systemCivil/vital registration
Sample registration
52
100
80
60
40
20
0
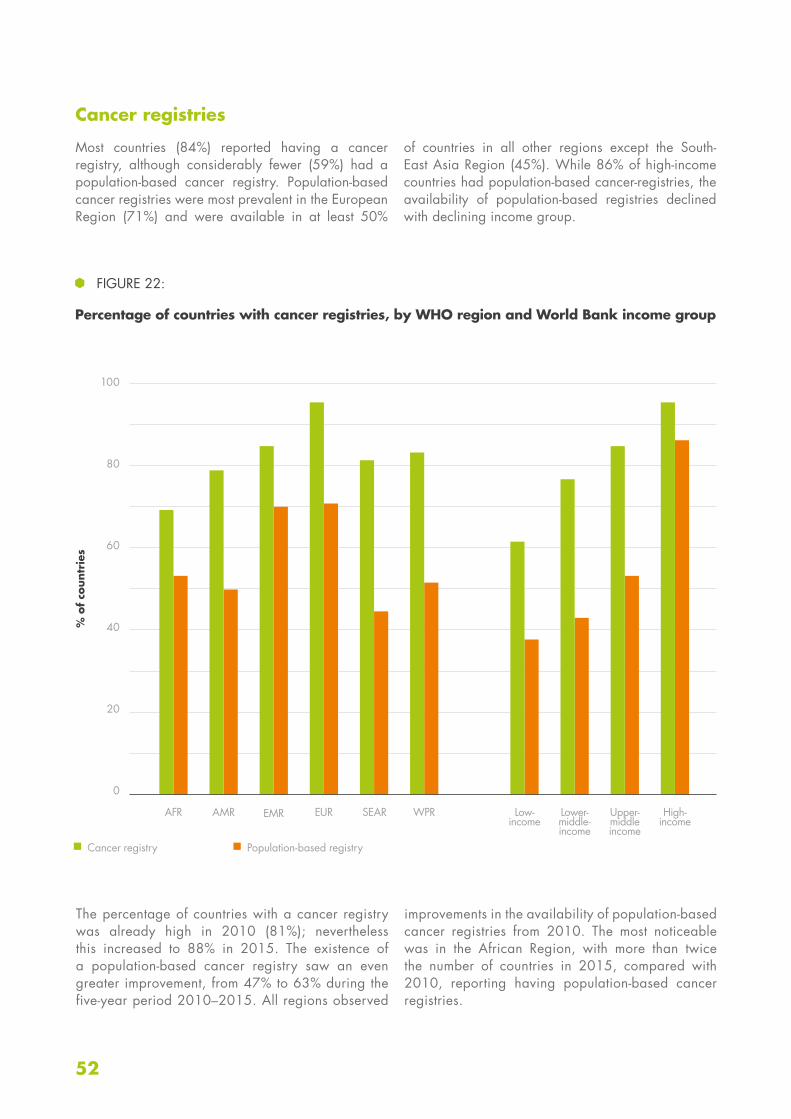
Cancer registries
Most countries (84%) reported having a cancer registry, although considerably fewer (59%) had a population-based cancer registry. Population-based cancer registries were most prevalent in the European Region (71%) and were available in at least 50%
of countries in all other regions except the South-East Asia Region (45%). While 86% of high-income countries had population-based cancer-registries, the availability of population-based registries declined with declining income group.
FIGURE 22:
Percentage of countries with cancer registries, by WHO region and World Bank income group
% o
f co
untr
ies
AFR Low- income
AMR Lower- middle- income
EMR Upper- middle income
EUR High- income
SEAR WPR
Cancer registry Population-based registry
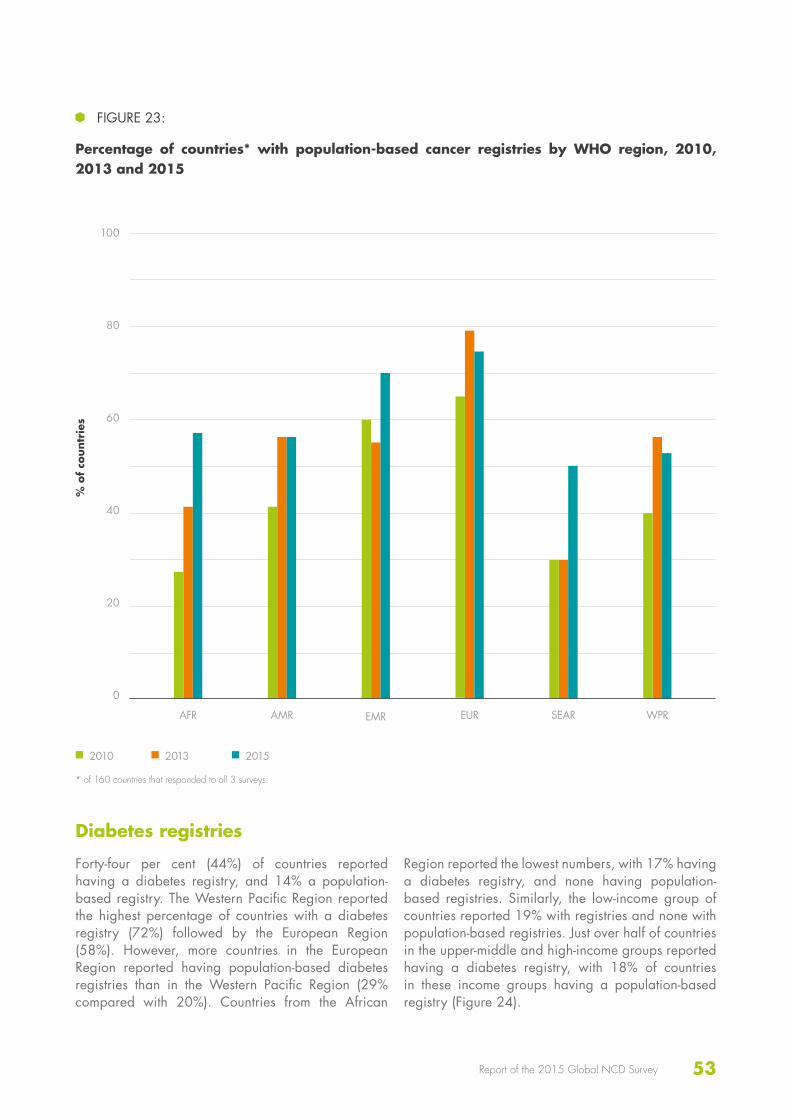
The percentage of countries with a cancer registry was already high in 2010 (81%); nevertheless this increased to 88% in 2015. The existence of a population-based cancer registry saw an even greater improvement, from 47% to 63% during the five-year period 2010–2015. All regions observed
improvements in the availability of population-based cancer registries from 2010. The most noticeable was in the African Region, with more than twice the number of countries in 2015, compared with 2010, reporting having population-based cancer registries.
53Report of the 2015 Global NCD Survey
100
80
60
40
20
0
2010 2013 2015
FIGURE 23:
Percentage of countries* with population-based cancer registries by WHO region, 2010, 2013 and 2015
% o
f co
untr
ies
AFR AMR EMR EUR SEAR WPR
* of 160 countries that responded to all 3 surveys.
Diabetes registries
Forty-four per cent (44%) of countries reported having a diabetes registry, and 14% a population-based registry. The Western Pacific Region reported the highest percentage of countries with a diabetes registry (72%) followed by the European Region (58%). However, more countries in the European Region reported having population-based diabetes registries than in the Western Pacific Region (29% compared with 20%). Countries from the African
Region reported the lowest numbers, with 17% having a diabetes registry, and none having population-based registries. Similarly, the low-income group of countries reported 19% with registries and none with population-based registries. Just over half of countries in the upper-middle and high-income groups reported having a diabetes registry, with 18% of countries in these income groups having a population-based registry (Figure 24).
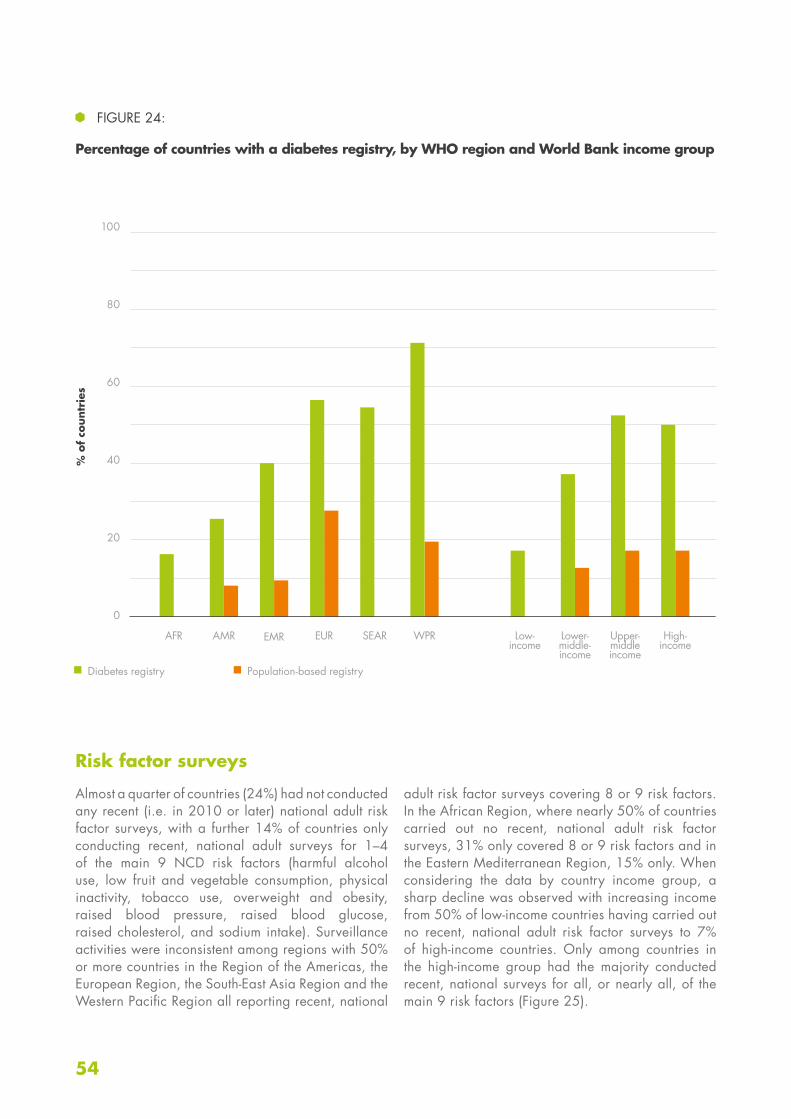
54
100
80
60
40
20
0
Risk factor surveys
Almost a quarter of countries (24%) had not conducted any recent (i.e. in 2010 or later) national adult risk factor surveys, with a further 14% of countries only conducting recent, national adult surveys for 1–4 of the main 9 NCD risk factors (harmful alcohol use, low fruit and vegetable consumption, physical inactivity, tobacco use, overweight and obesity, raised blood pressure, raised blood glucose, raised cholesterol, and sodium intake). Surveillance activities were inconsistent among regions with 50% or more countries in the Region of the Americas, the European Region, the South-East Asia Region and the Western Pacific Region all reporting recent, national
adult risk factor surveys covering 8 or 9 risk factors. In the African Region, where nearly 50% of countries carried out no recent, national adult risk factor surveys, 31% only covered 8 or 9 risk factors and in the Eastern Mediterranean Region, 15% only. When considering the data by country income group, a sharp decline was observed with increasing income from 50% of low-income countries having carried out no recent, national adult risk factor surveys to 7% of high-income countries. Only among countries in the high-income group had the majority conducted recent, national surveys for all, or nearly all, of the main 9 risk factors (Figure 25).
FIGURE 24:
Percentage of countries with a diabetes registry, by WHO region and World Bank income group
% o
f co
untr
ies
AFR Low- income
AMR Lower- middle- income
EMR Upper- middle income
EUR High- income
SEAR WPR
Diabetes registry Population-based registry
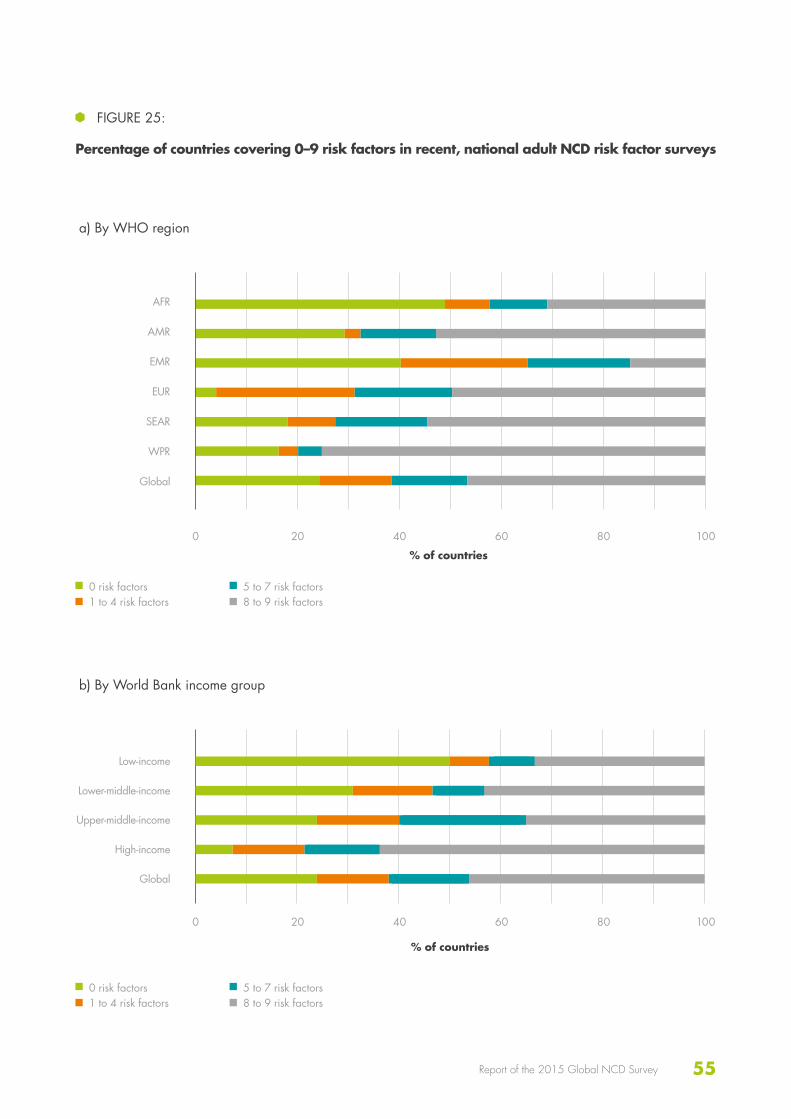
55Report of the 2015 Global NCD Survey
FIGURE 25:
Percentage of countries covering 0–9 risk factors in recent, national adult NCD risk factor surveys
Low-income
Lower-middle-income
Upper-middle-income
High-income
Global
% of countries
0 risk factors1 to 4 risk factors
5 to 7 risk factors 8 to 9 risk factors
b) By World Bank income group
AFR
AMR
EMR
EUR
SEAR
WPR
Global
0
0
20
20
60
60
40
40
80
80
100
100
% of countries
0 risk factors1 to 4 risk factors
5 to 7 risk factors 8 to 9 risk factors
a) By WHO region
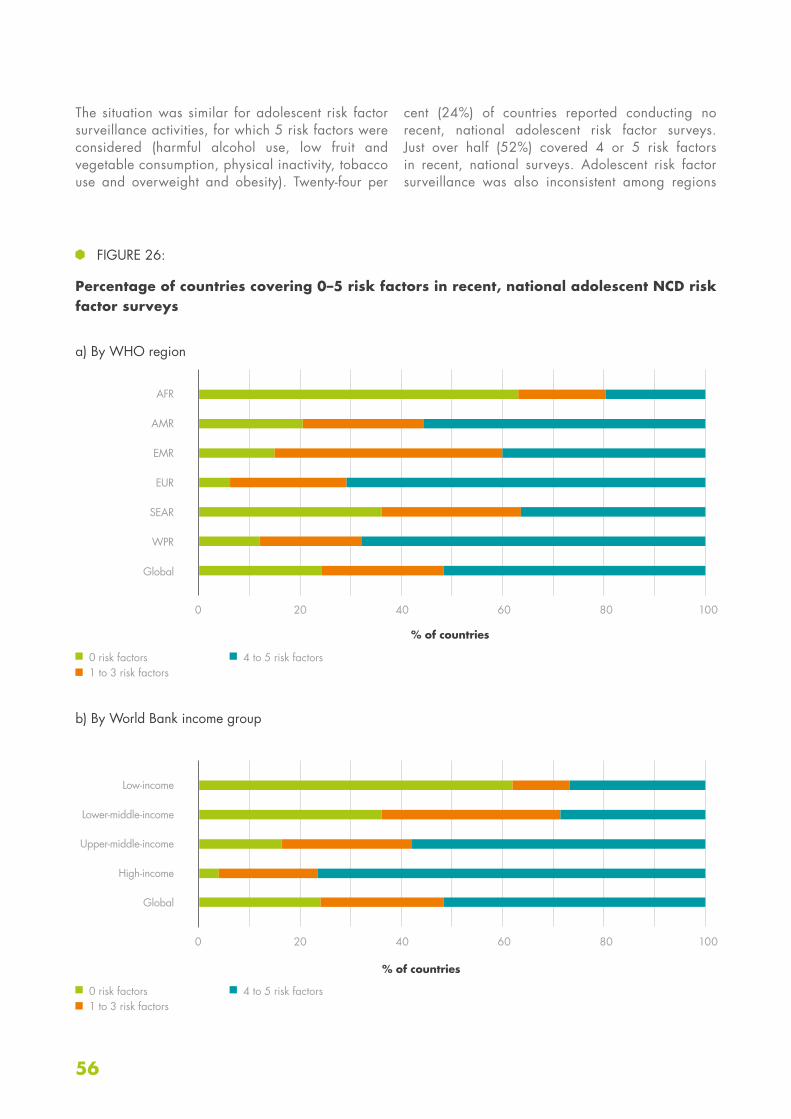
56
The situation was similar for adolescent risk factor surveillance activities, for which 5 risk factors were considered (harmful alcohol use, low fruit and vegetable consumption, physical inactivity, tobacco use and overweight and obesity). Twenty-four per
cent (24%) of countries reported conducting no recent, national adolescent risk factor surveys. Just over half (52%) covered 4 or 5 risk factors in recent, national surveys. Adolescent risk factor surveillance was also inconsistent among regions
FIGURE 26:
Percentage of countries covering 0–5 risk factors in recent, national adolescent NCD risk factor surveys
AFR
AMR
EMR
EUR
SEAR
WPR
Global
% of countries
% of countries
0 risk factors1 to 3 risk factors
0 risk factors1 to 3 risk factors
4 to 5 risk factors
4 to 5 risk factors
a) By WHO region
b) By World Bank income group
Low-income
Lower-middle-income
Upper-middle-income
High-income
Global
0 20 6040 80 100
0 20 6040 80 100
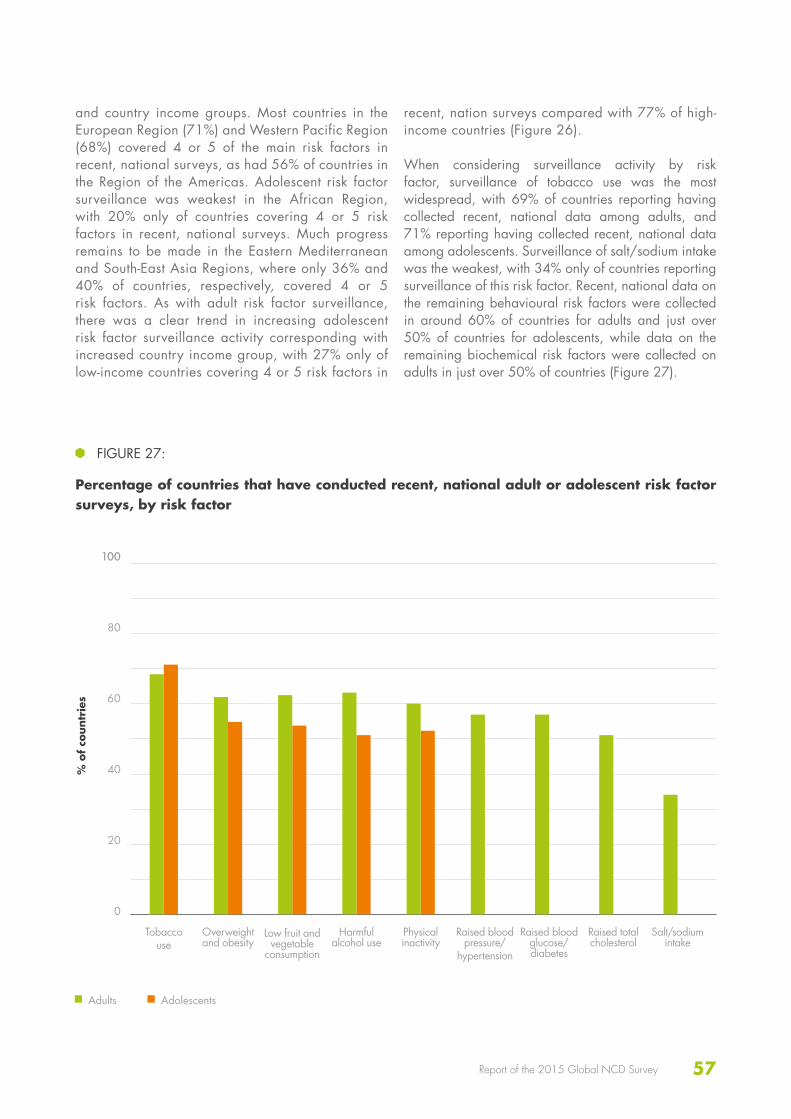
57Report of the 2015 Global NCD Survey
and country income groups. Most countries in the European Region (71%) and Western Pacific Region (68%) covered 4 or 5 of the main risk factors in recent, national surveys, as had 56% of countries in the Region of the Americas. Adolescent risk factor surveillance was weakest in the African Region, with 20% only of countries covering 4 or 5 risk factors in recent, national surveys. Much progress remains to be made in the Eastern Mediterranean and South-East Asia Regions, where only 36% and 40% of countries, respectively, covered 4 or 5 risk factors. As with adult risk factor surveillance, there was a clear trend in increasing adolescent risk factor surveillance activity corresponding with increased country income group, with 27% only of low-income countries covering 4 or 5 risk factors in
recent, nation surveys compared with 77% of high-income countries (Figure 26).
When considering surveillance activity by risk factor, surveillance of tobacco use was the most widespread, with 69% of countries reporting having collected recent, national data among adults, and 71% reporting having collected recent, national data among adolescents. Surveillance of salt/sodium intake was the weakest, with 34% only of countries reporting surveillance of this risk factor. Recent, national data on the remaining behavioural risk factors were collected in around 60% of countries for adults and just over 50% of countries for adolescents, while data on the remaining biochemical risk factors were collected on adults in just over 50% of countries (Figure 27).
FIGURE 27:
Percentage of countries that have conducted recent, national adult or adolescent risk factor surveys, by risk factor
100
% o
f co
untr
ies
Tobacco use
Raised blood glucose/diabetes
Overweight and obesity
Raised total cholesterol
Low fruit and vegetable
consumption
Salt/sodium intake
Harmful alcohol use
Physical inactivity
Raised blood pressure/
hypertension
Adults Adolescents
100
80
60
40
20
0
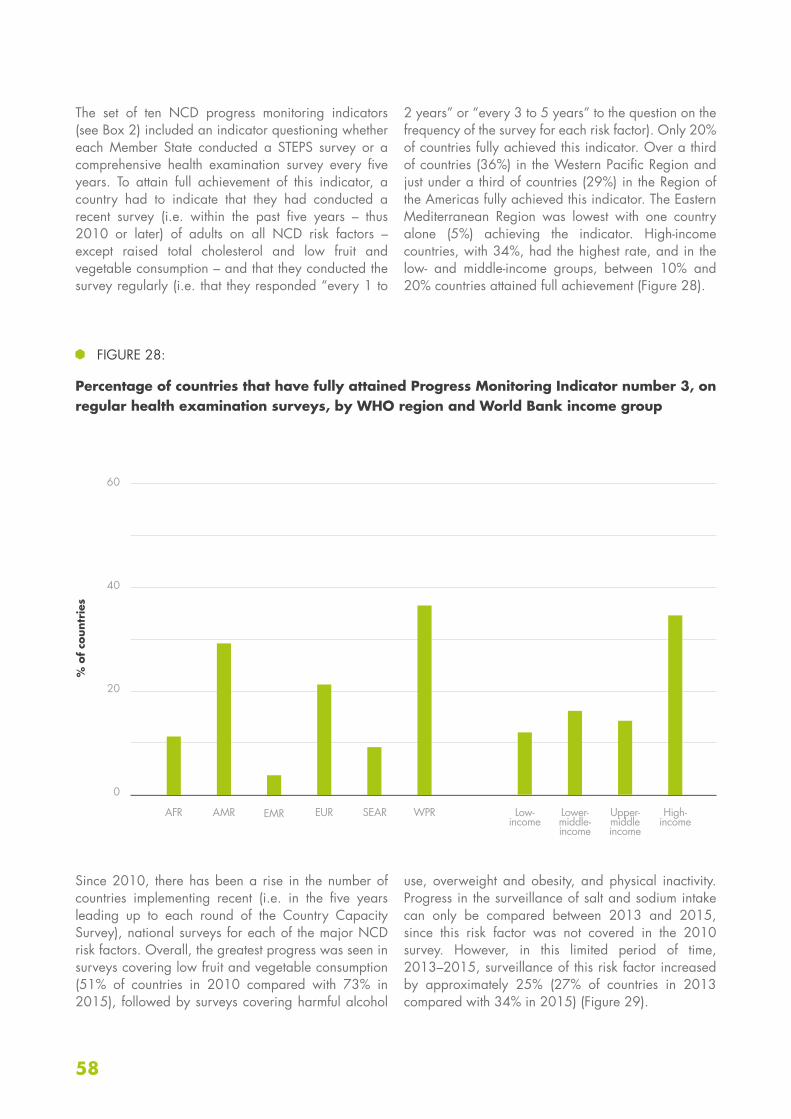
58
60
40
20
0
The set of ten NCD progress monitoring indicators (see Box 2) included an indicator questioning whether each Member State conducted a STEPS survey or a comprehensive health examination survey every five years. To attain full achievement of this indicator, a country had to indicate that they had conducted a recent survey (i.e. within the past five years – thus 2010 or later) of adults on all NCD risk factors – except raised total cholesterol and low fruit and vegetable consumption – and that they conducted the survey regularly (i.e. that they responded “every 1 to
2 years” or “every 3 to 5 years” to the question on the frequency of the survey for each risk factor). Only 20% of countries fully achieved this indicator. Over a third of countries (36%) in the Western Pacific Region and just under a third of countries (29%) in the Region of the Americas fully achieved this indicator. The Eastern Mediterranean Region was lowest with one country alone (5%) achieving the indicator. High-income countries, with 34%, had the highest rate, and in the low- and middle-income groups, between 10% and 20% countries attained full achievement (Figure 28).
Since 2010, there has been a rise in the number of countries implementing recent (i.e. in the five years leading up to each round of the Country Capacity Survey), national surveys for each of the major NCD risk factors. Overall, the greatest progress was seen in surveys covering low fruit and vegetable consumption (51% of countries in 2010 compared with 73% in 2015), followed by surveys covering harmful alcohol
use, overweight and obesity, and physical inactivity. Progress in the surveillance of salt and sodium intake can only be compared between 2013 and 2015, since this risk factor was not covered in the 2010 survey. However, in this limited period of time, 2013–2015, surveillance of this risk factor increased by approximately 25% (27% of countries in 2013 compared with 34% in 2015) (Figure 29).
FIGURE 28:
Percentage of countries that have fully attained Progress Monitoring Indicator number 3, on regular health examination surveys, by WHO region and World Bank income group
% o
f co
untr
ies
AFR Low- income
AMR Lower- middle- income
EMR Upper- middle income
EUR High- income
SEAR WPR
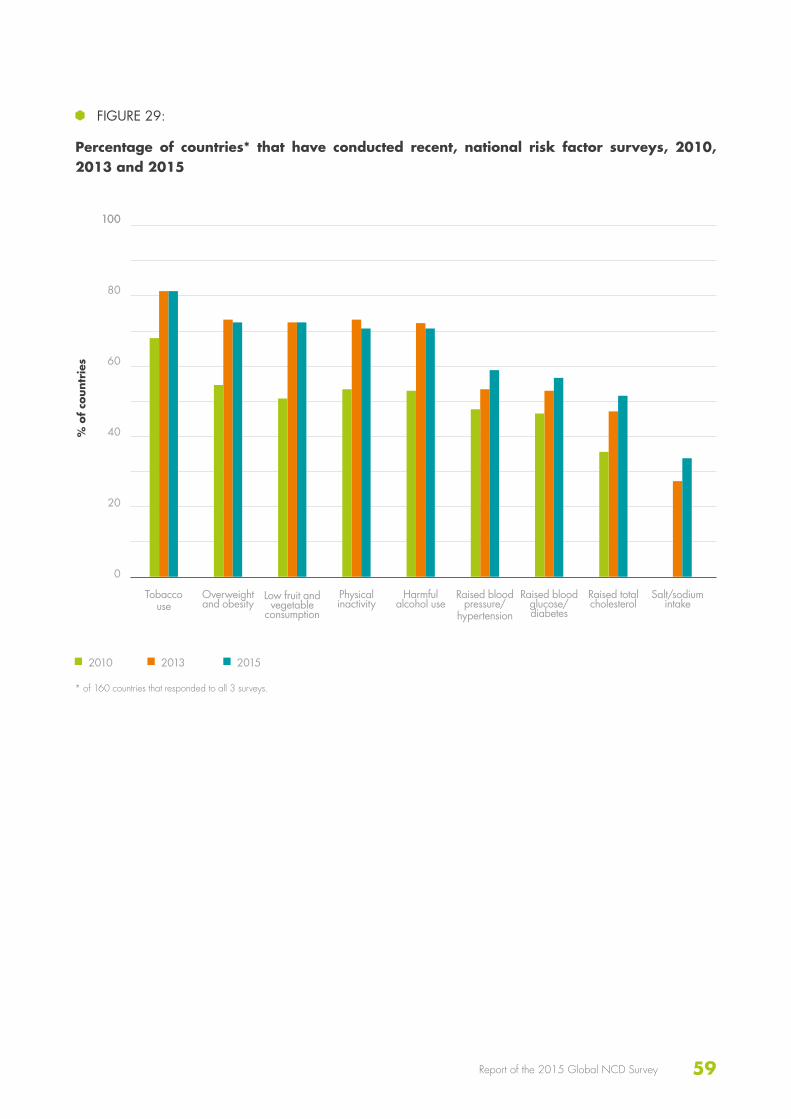
59Report of the 2015 Global NCD Survey
100
80
60
40
20
0
FIGURE 29:
Percentage of countries* that have conducted recent, national risk factor surveys, 2010, 2013 and 2015
100
% o
f co
untr
ies
Tobacco use
Raised blood glucose/diabetes
Overweight and obesity
Raised total cholesterol
Low fruit and vegetable
consumption
Salt/sodium intake
Physical inactivity
Raised blood pressure/
hypertension
2010 2013 2015
Harmful alcohol use
* of 160 countries that responded to all 3 surveys.
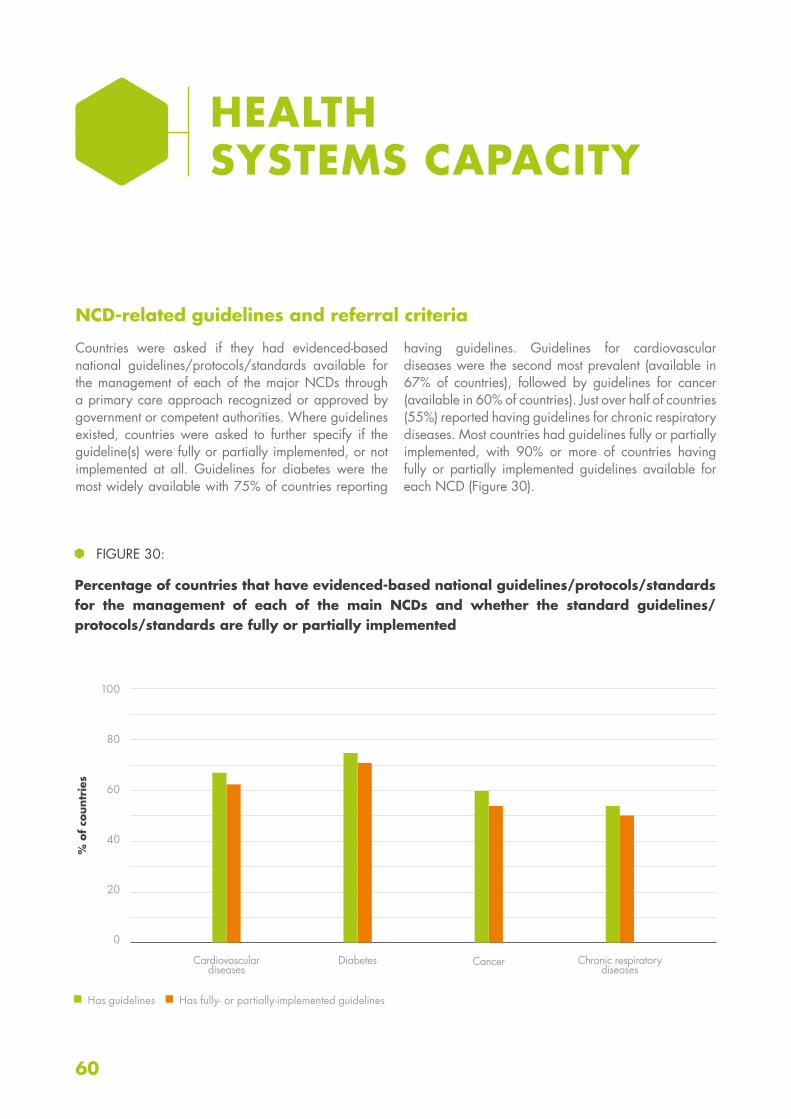
60
100
80
60
40
20
0
NCD-related guidelines and referral criteria
Countries were asked if they had evidenced-based national guidelines/protocols/standards available for the management of each of the major NCDs through a primary care approach recognized or approved by government or competent authorities. Where guidelines existed, countries were asked to further specify if the guideline(s) were fully or partially implemented, or not implemented at all. Guidelines for diabetes were the most widely available with 75% of countries reporting
having guidelines. Guidelines for cardiovascular diseases were the second most prevalent (available in 67% of countries), followed by guidelines for cancer (available in 60% of countries). Just over half of countries (55%) reported having guidelines for chronic respiratory diseases. Most countries had guidelines fully or partially implemented, with 90% or more of countries having fully or partially implemented guidelines available for each NCD (Figure 30).
HEALTH SYSTEMS CAPACITY
FIGURE 30:
Percentage of countries that have evidenced-based national guidelines/protocols/standards for the management of each of the main NCDs and whether the standard guidelines/protocols/standards are fully or partially implemented
% o
f co
untr
ies
Cardiovascular diseases
Diabetes Cancer Chronic respiratory diseases
Has guidelines Has fully- or partially-implemented guidelines
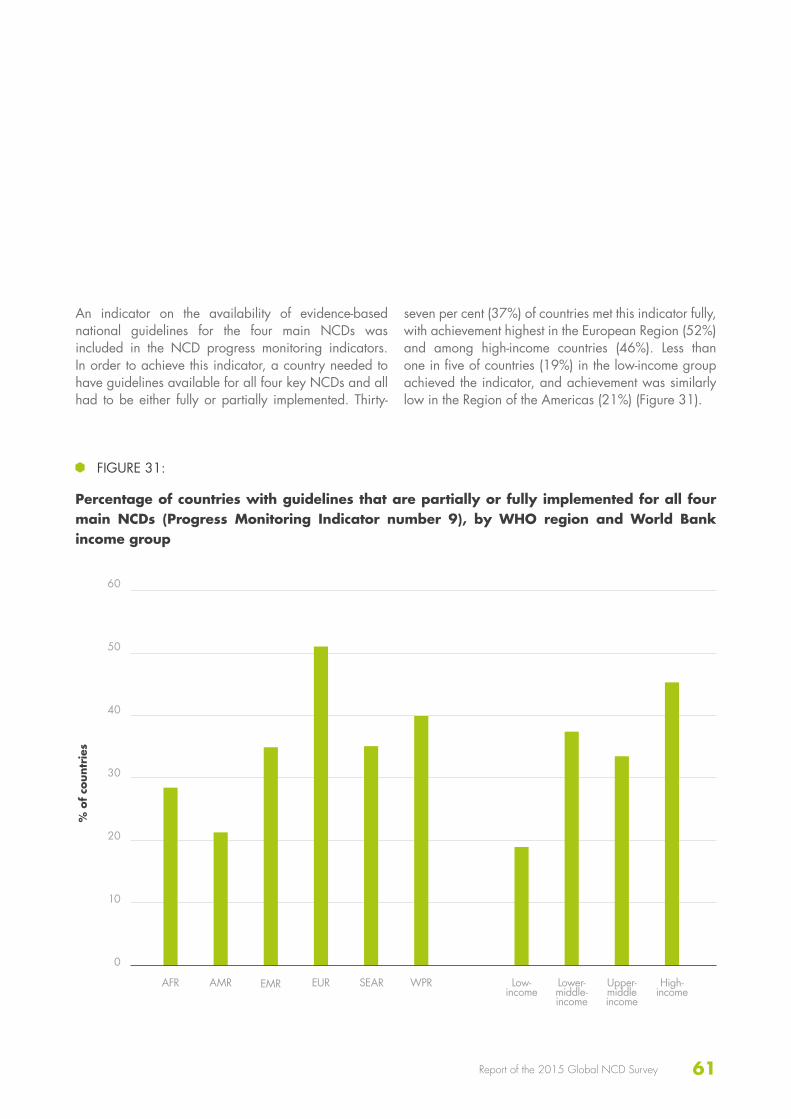
61Report of the 2015 Global NCD Survey
60
50
40
30
20
10
0
An indicator on the availability of evidence-based national guidelines for the four main NCDs was included in the NCD progress monitoring indicators. In order to achieve this indicator, a country needed to have guidelines available for all four key NCDs and all had to be either fully or partially implemented. Thirty-
seven per cent (37%) of countries met this indicator fully, with achievement highest in the European Region (52%) and among high-income countries (46%). Less than one in five of countries (19%) in the low-income group achieved the indicator, and achievement was similarly low in the Region of the Americas (21%) (Figure 31).
FIGURE 31:
Percentage of countries with guidelines that are partially or fully implemented for all four main NCDs (Progress Monitoring Indicator number 9), by WHO region and World Bank income group
% o
f co
untr
ies
AFR Low- income
AMR Lower- middle- income
EMR Upper- middle income
EUR High- income
SEAR WPR
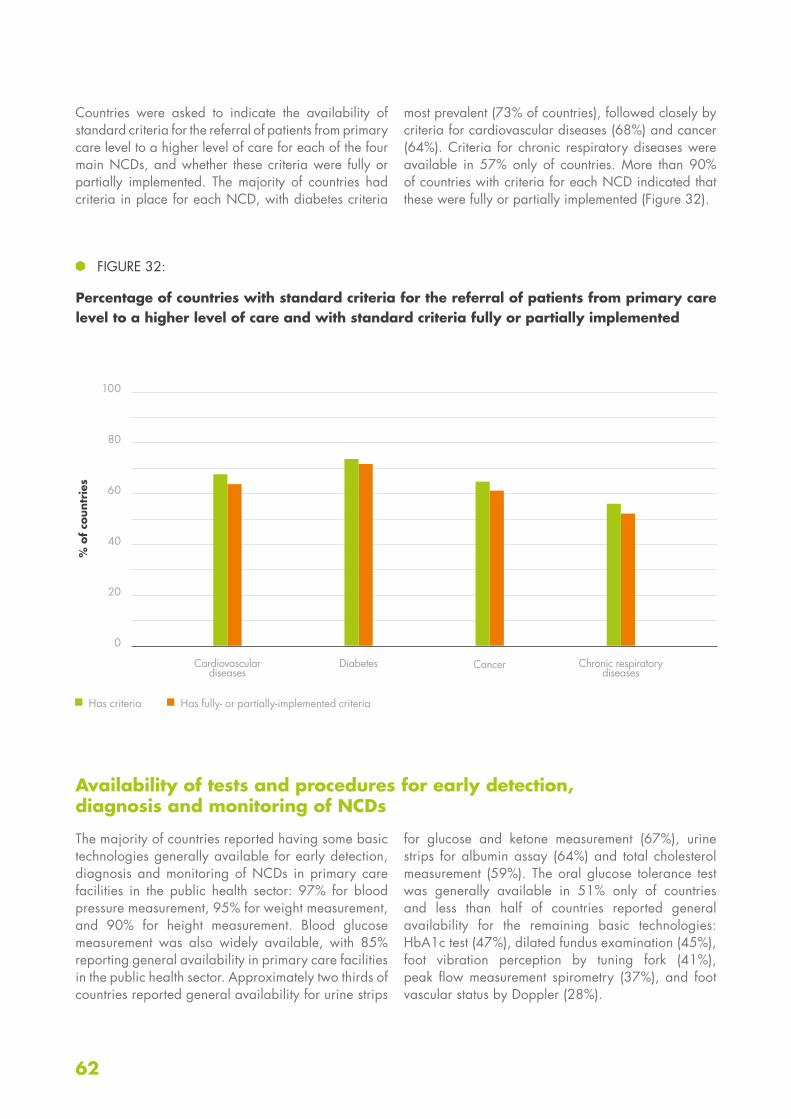
62
100
80
60
40
20
0
Countries were asked to indicate the availability of standard criteria for the referral of patients from primary care level to a higher level of care for each of the four main NCDs, and whether these criteria were fully or partially implemented. The majority of countries had criteria in place for each NCD, with diabetes criteria
most prevalent (73% of countries), followed closely by criteria for cardiovascular diseases (68%) and cancer (64%). Criteria for chronic respiratory diseases were available in 57% only of countries. More than 90% of countries with criteria for each NCD indicated that these were fully or partially implemented (Figure 32).
Availability of tests and procedures for early detection, diagnosis and monitoring of NCDs
The majority of countries reported having some basic technologies generally available for early detection, diagnosis and monitoring of NCDs in primary care facilities in the public health sector: 97% for blood pressure measurement, 95% for weight measurement, and 90% for height measurement. Blood glucose measurement was also widely available, with 85% reporting general availability in primary care facilities in the public health sector. Approximately two thirds of countries reported general availability for urine strips
for glucose and ketone measurement (67%), urine strips for albumin assay (64%) and total cholesterol measurement (59%). The oral glucose tolerance test was generally available in 51% only of countries and less than half of countries reported general availability for the remaining basic technologies: HbA1c test (47%), dilated fundus examination (45%), foot vibration perception by tuning fork (41%), peak flow measurement spirometry (37%), and foot vascular status by Doppler (28%).
FIGURE 32:
Percentage of countries with standard criteria for the referral of patients from primary care level to a higher level of care and with standard criteria fully or partially implemented
% o
f co
untr
ies
Cardiovascular diseases
Diabetes Cancer Chronic respiratory diseases
Has criteria Has fully- or partially-implemented criteria
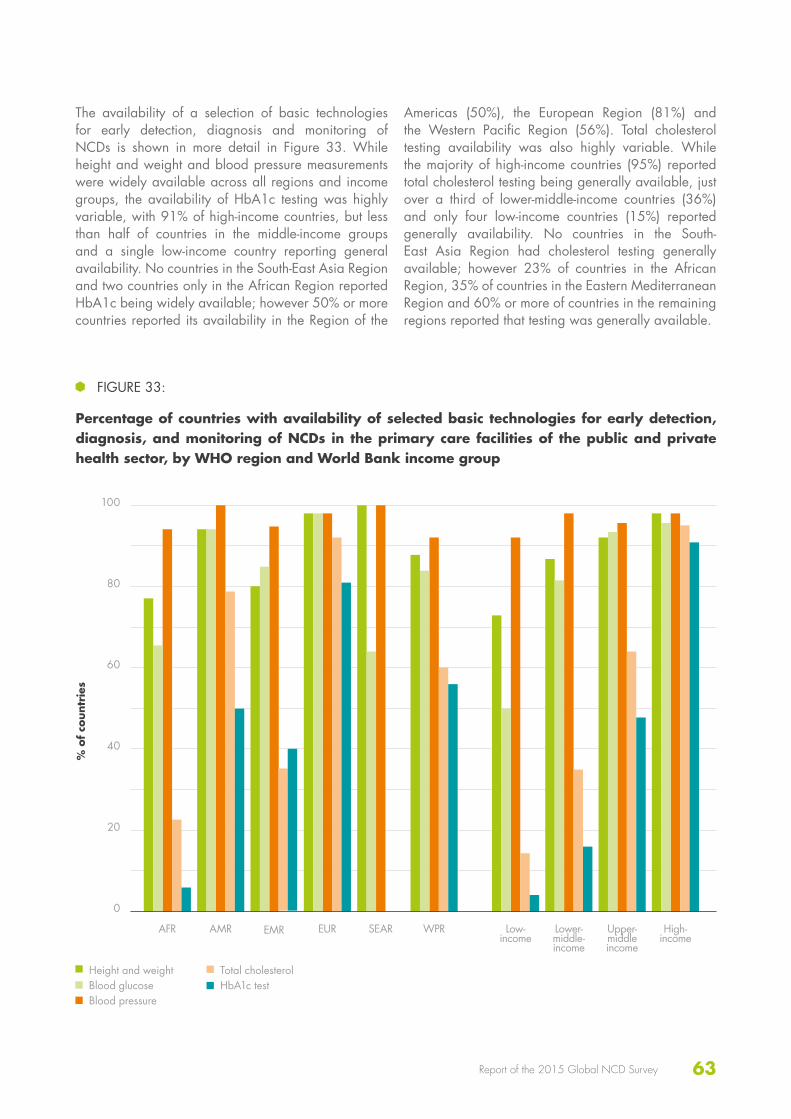
63Report of the 2015 Global NCD Survey
100
80
60
40
20
0
The availability of a selection of basic technologies for early detection, diagnosis and monitoring of NCDs is shown in more detail in Figure 33. While height and weight and blood pressure measurements were widely available across all regions and income groups, the availability of HbA1c testing was highly variable, with 91% of high-income countries, but less than half of countries in the middle-income groups and a single low-income country reporting general availability. No countries in the South-East Asia Region and two countries only in the African Region reported HbA1c being widely available; however 50% or more countries reported its availability in the Region of the
Americas (50%), the European Region (81%) and the Western Pacific Region (56%). Total cholesterol testing availability was also highly variable. While the majority of high-income countries (95%) reported total cholesterol testing being generally available, just over a third of lower-middle-income countries (36%) and only four low-income countries (15%) reported generally availability. No countries in the South-East Asia Region had cholesterol testing generally available; however 23% of countries in the African Region, 35% of countries in the Eastern Mediterranean Region and 60% or more of countries in the remaining regions reported that testing was generally available.
FIGURE 33:
Percentage of countries with availability of selected basic technologies for early detection, diagnosis, and monitoring of NCDs in the primary care facilities of the public and private health sector, by WHO region and World Bank income group
% o
f co
untr
ies
AFR Low- income
AMR Lower- middle- income
EMR Upper- middle income
EUR High- income
SEAR WPR
Height and weightBlood glucoseBlood pressure
Total cholesterolHbA1c test
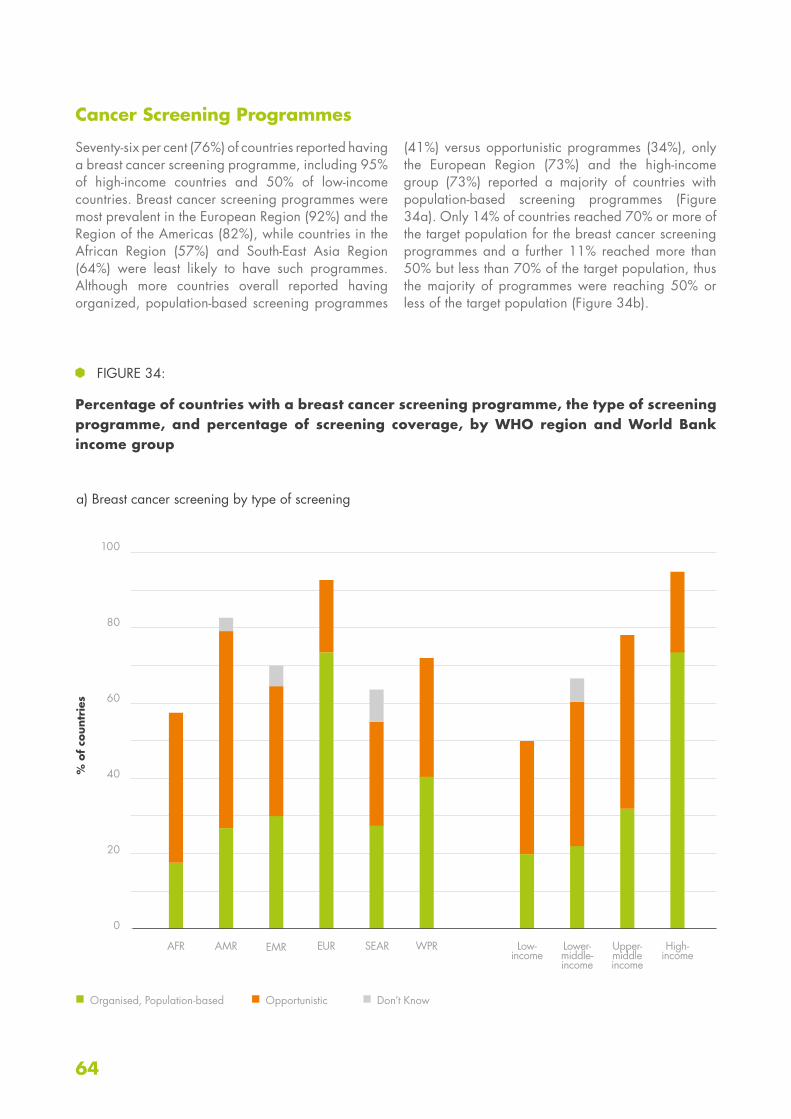
64
100
80
60
40
20
0
Cancer Screening Programmes
Seventy-six per cent (76%) of countries reported having a breast cancer screening programme, including 95% of high-income countries and 50% of low-income countries. Breast cancer screening programmes were most prevalent in the European Region (92%) and the Region of the Americas (82%), while countries in the African Region (57%) and South-East Asia Region (64%) were least likely to have such programmes. Although more countries overall reported having organized, population-based screening programmes
(41%) versus opportunistic programmes (34%), only the European Region (73%) and the high-income group (73%) reported a majority of countries with population-based screening programmes (Figure 34a). Only 14% of countries reached 70% or more of the target population for the breast cancer screening programmes and a further 11% reached more than 50% but less than 70% of the target population, thus the majority of programmes were reaching 50% or less of the target population (Figure 34b).
FIGURE 34:
Percentage of countries with a breast cancer screening programme, the type of screening programme, and percentage of screening coverage, by WHO region and World Bank income group
% o
f co
untr
ies
AFR Low- income
AMR Lower- middle- income
EMR Upper- middle income
EUR High- income
SEAR WPR
Organised, Population-based Opportunistic Don’t Know
a) Breast cancer screening by type of screening
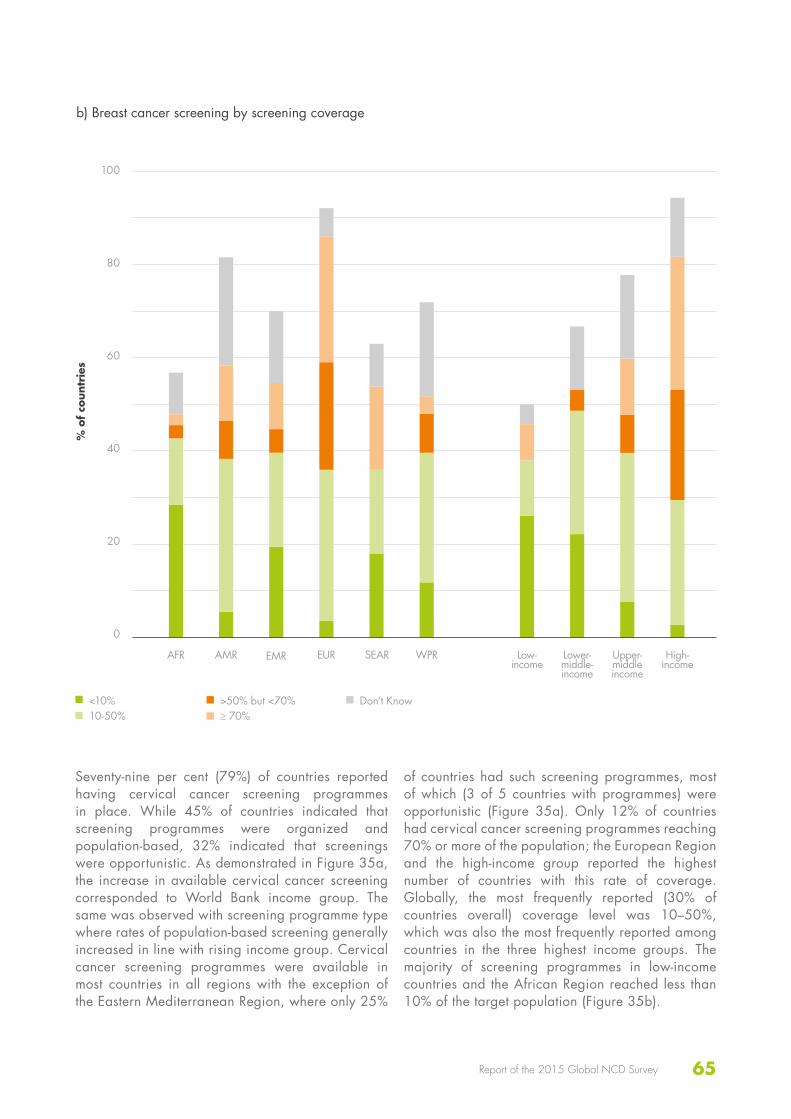
65Report of the 2015 Global NCD Survey
100
80
60
40
20
0
% o
f co
untr
ies
AFR Low- income
AMR Lower- middle- income
EMR Upper- middle income
EUR High- income
SEAR WPR
b) Breast cancer screening by screening coverage
<10%10-50%
>50% but <70%≥ 70%
Don’t Know
Seventy-nine per cent (79%) of countries reported having cervical cancer screening programmes in place. While 45% of countries indicated that screening programmes were organized and population-based, 32% indicated that screenings were opportunistic. As demonstrated in Figure 35a, the increase in available cervical cancer screening corresponded to World Bank income group. The same was observed with screening programme type where rates of population-based screening generally increased in line with rising income group. Cervical cancer screening programmes were available in most countries in all regions with the exception of the Eastern Mediterranean Region, where only 25%
of countries had such screening programmes, most of which (3 of 5 countries with programmes) were opportunistic (Figure 35a). Only 12% of countries had cervical cancer screening programmes reaching 70% or more of the population; the European Region and the high-income group reported the highest number of countries with this rate of coverage. Globally, the most frequently reported (30% of countries overall) coverage level was 10–50%, which was also the most frequently reported among countries in the three highest income groups. The majority of screening programmes in low-income countries and the African Region reached less than 10% of the target population (Figure 35b).
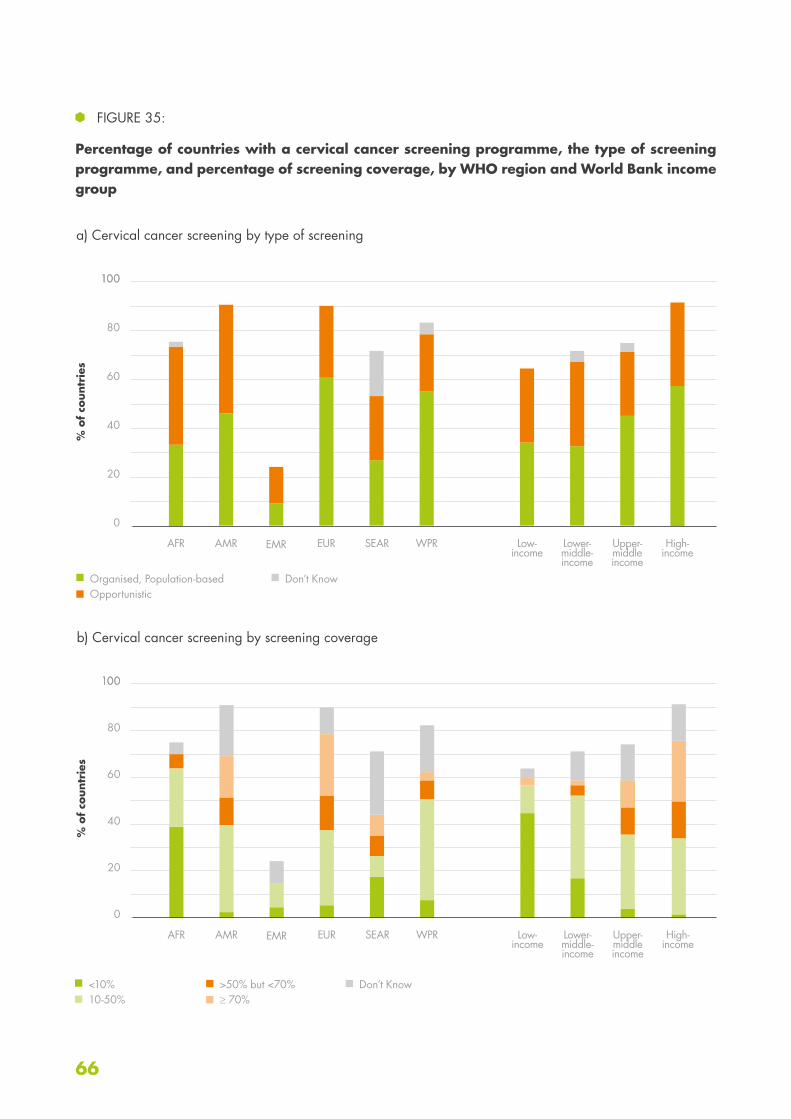
66
FIGURE 35:
Percentage of countries with a cervical cancer screening programme, the type of screening programme, and percentage of screening coverage, by WHO region and World Bank income group
100
% o
f co
untr
ies
AFR Low- income
AMR Lower- middle- income
EMR Upper- middle income
EUR High- income
SEAR WPR
Organised, Population-basedOpportunistic
Don’t Know
a) Cervical cancer screening by type of screening
100
80
60
40
20
0
100
80
60
40
20
0
100
% o
f co
untr
ies
AFR Low- income
AMR Lower- middle- income
EMR Upper- middle income
EUR High- income
SEAR WPR
b) Cervical cancer screening by screening coverage
<10%10-50%
>50% but <70%≥ 70%
Don’t Know
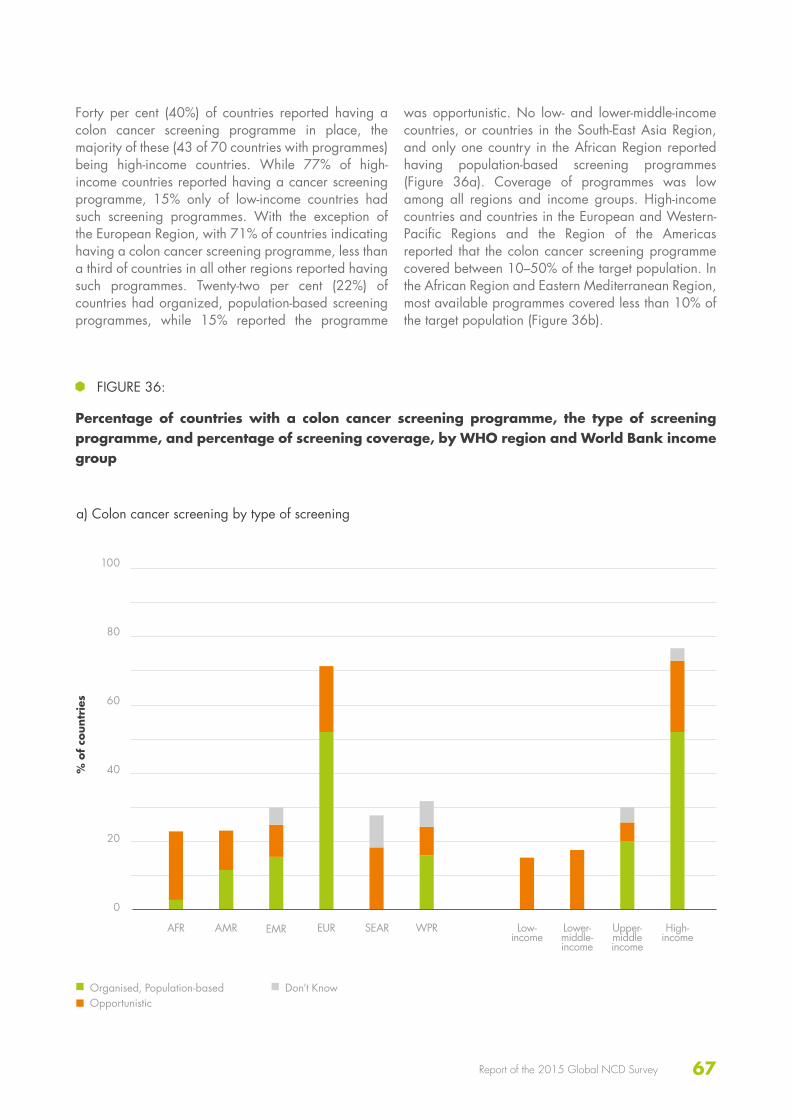
67Report of the 2015 Global NCD Survey
Forty per cent (40%) of countries reported having a colon cancer screening programme in place, the majority of these (43 of 70 countries with programmes) being high-income countries. While 77% of high-income countries reported having a cancer screening programme, 15% only of low-income countries had such screening programmes. With the exception of the European Region, with 71% of countries indicating having a colon cancer screening programme, less than a third of countries in all other regions reported having such programmes. Twenty-two per cent (22%) of countries had organized, population-based screening programmes, while 15% reported the programme
was opportunistic. No low- and lower-middle-income countries, or countries in the South-East Asia Region, and only one country in the African Region reported having population-based screening programmes (Figure 36a). Coverage of programmes was low among all regions and income groups. High-income countries and countries in the European and Western-Pacific Regions and the Region of the Americas reported that the colon cancer screening programme covered between 10–50% of the target population. In the African Region and Eastern Mediterranean Region, most available programmes covered less than 10% of the target population (Figure 36b).
100
80
60
40
20
0
FIGURE 36:
Percentage of countries with a colon cancer screening programme, the type of screening programme, and percentage of screening coverage, by WHO region and World Bank income group
% o
f co
untr
ies
AFR Low- income
AMR Lower- middle- income
EMR Upper- middle income
EUR High- income
SEAR WPR
Organised, Population-basedOpportunistic
Don’t Know
a) Colon cancer screening by type of screening
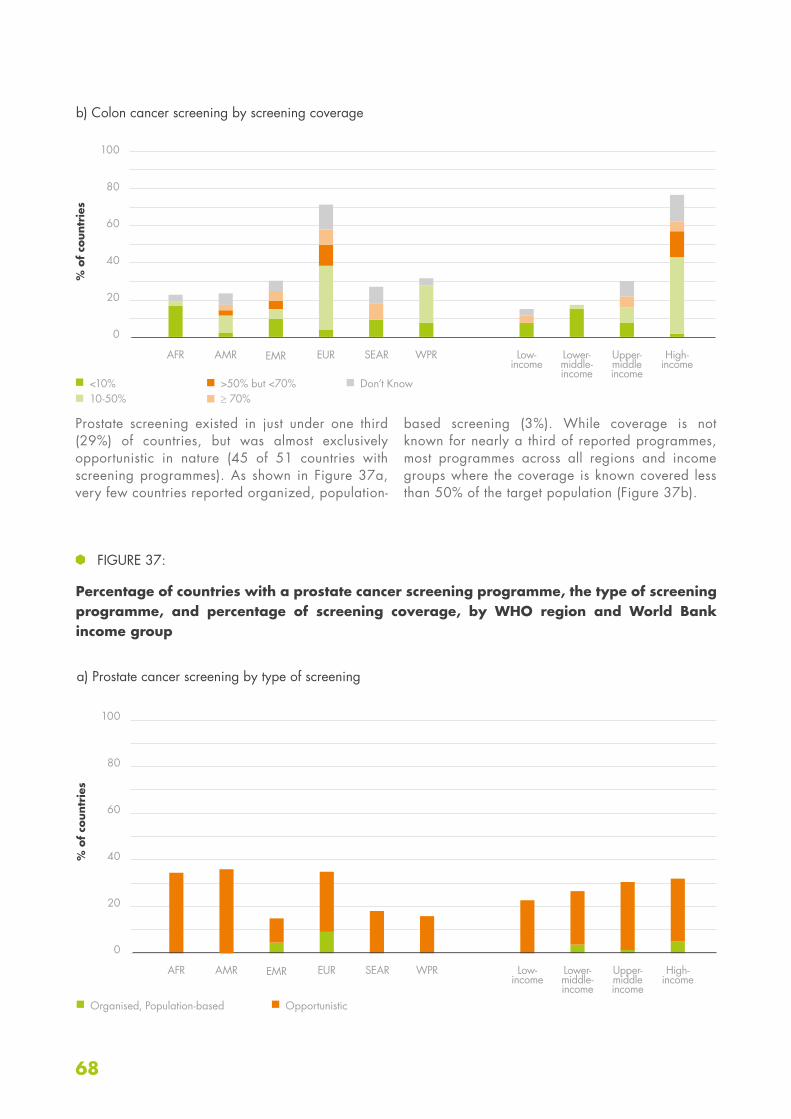
68
100
80
60
40
20
0
100
80
60
40
20
0
Prostate screening existed in just under one third (29%) of countries, but was almost exclusively opportunistic in nature (45 of 51 countries with screening programmes). As shown in Figure 37a, very few countries reported organized, population-
based screening (3%). While coverage is not known for nearly a third of reported programmes, most programmes across all regions and income groups where the coverage is known covered less than 50% of the target population (Figure 37b).
FIGURE 37:
Percentage of countries with a prostate cancer screening programme, the type of screening programme, and percentage of screening coverage, by WHO region and World Bank income group
% o
f co
untr
ies
% o
f co
untr
ies
AFR
AFR
Low- income
Low- income
AMR
AMR
Lower- middle- income
Lower- middle- income
EMR
EMR
Upper- middle income
Upper-middle income
EUR
EUR
High- income
High- income
SEAR
SEAR
WPR
WPR
Organised, Population-based Opportunistic
a) Prostate cancer screening by type of screening
b) Colon cancer screening by screening coverage
<10%10-50%
>50% but <70%≥ 70%
Don’t Know
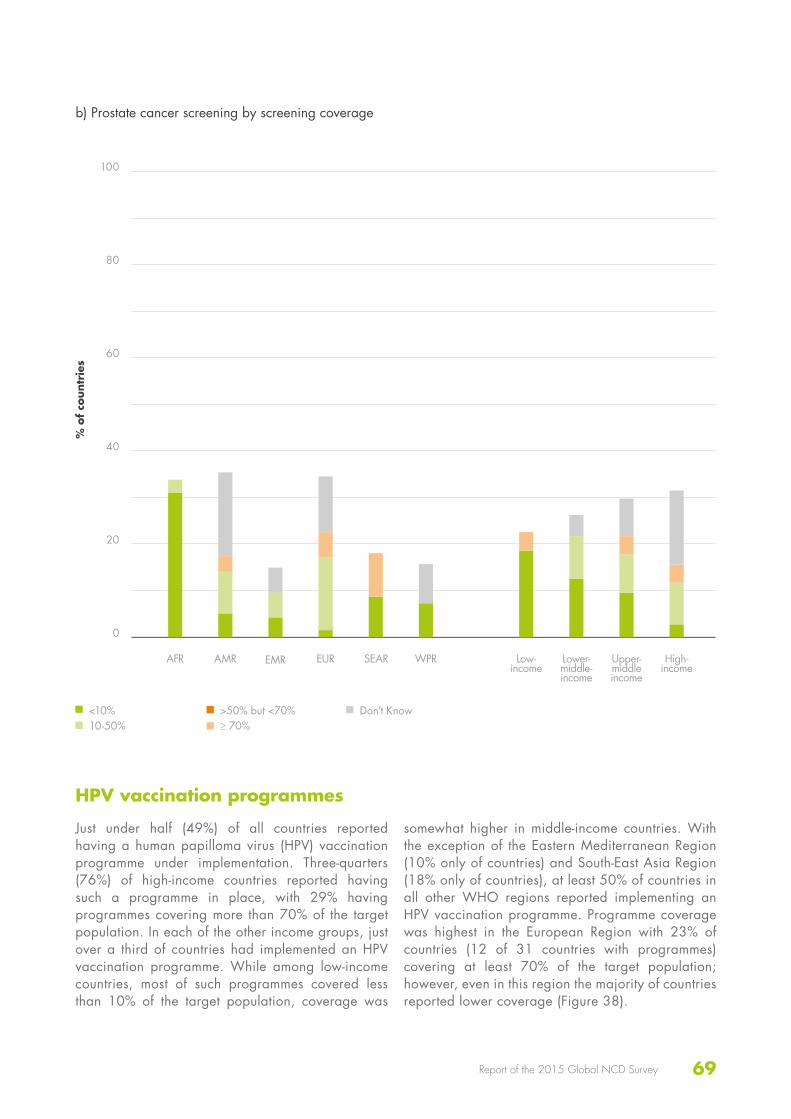
69Report of the 2015 Global NCD Survey
100
80
60
40
20
0
% o
f co
untr
ies
AFR Low- income
AMR Lower- middle- income
EMR Upper- middle income
EUR High- income
SEAR WPR
b) Prostate cancer screening by screening coverage
HPV vaccination programmes
Just under half (49%) of all countries reported having a human papilloma virus (HPV) vaccination programme under implementation. Three-quarters (76%) of high-income countries reported having such a programme in place, with 29% having programmes covering more than 70% of the target population. In each of the other income groups, just over a third of countries had implemented an HPV vaccination programme. While among low-income countries, most of such programmes covered less than 10% of the target population, coverage was
somewhat higher in middle-income countries. With the exception of the Eastern Mediterranean Region (10% only of countries) and South-East Asia Region (18% only of countries), at least 50% of countries in all other WHO regions reported implementing an HPV vaccination programme. Programme coverage was highest in the European Region with 23% of countries (12 of 31 countries with programmes) covering at least 70% of the target population; however, even in this region the majority of countries reported lower coverage (Figure 38).
<10%10-50%
>50% but <70%≥ 70%
Don’t Know
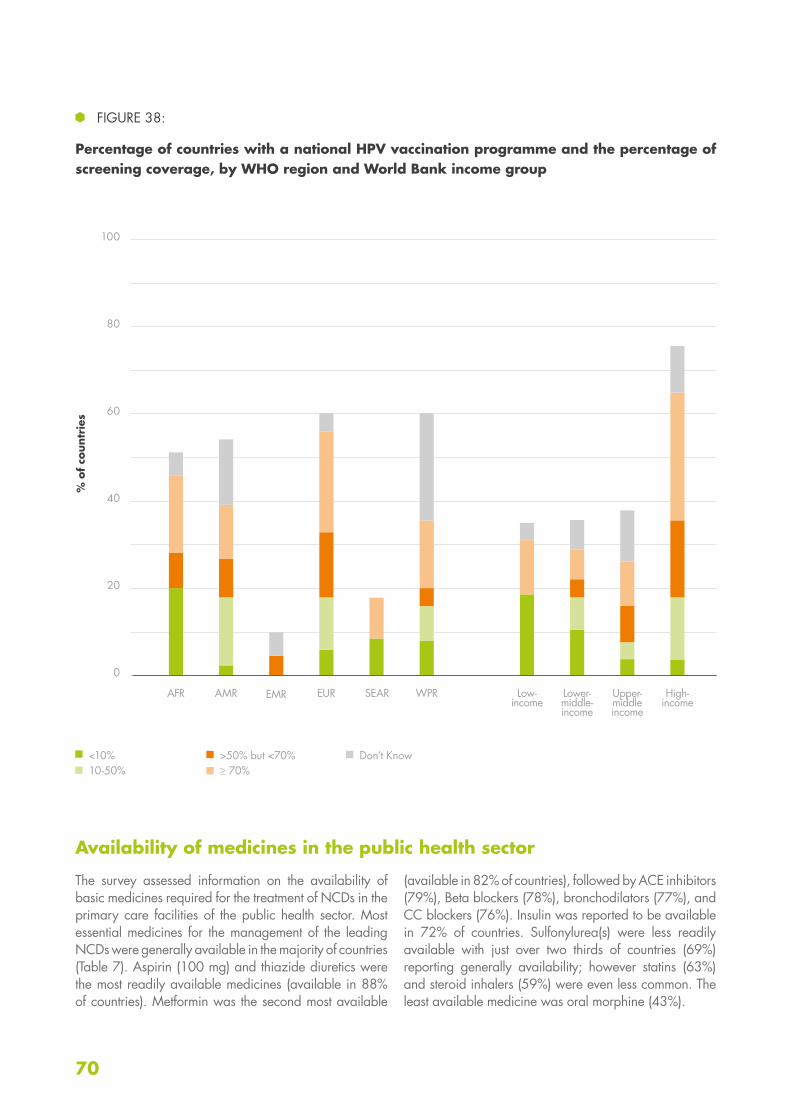
70
100
80
60
40
20
0
Availability of medicines in the public health sector
The survey assessed information on the availability of basic medicines required for the treatment of NCDs in the primary care facilities of the public health sector. Most essential medicines for the management of the leading NCDs were generally available in the majority of countries (Table 7). Aspirin (100 mg) and thiazide diuretics were the most readily available medicines (available in 88% of countries). Metformin was the second most available
(available in 82% of countries), followed by ACE inhibitors (79%), Beta blockers (78%), bronchodilators (77%), and CC blockers (76%). Insulin was reported to be available in 72% of countries. Sulfonylurea(s) were less readily available with just over two thirds of countries (69%) reporting generally availability; however statins (63%) and steroid inhalers (59%) were even less common. The least available medicine was oral morphine (43%).
FIGURE 38:
Percentage of countries with a national HPV vaccination programme and the percentage of screening coverage, by WHO region and World Bank income group
% o
f co
untr
ies
AFR Low- income
AMR Lower- middle- income
EMR Upper- middle income
EUR High- income
SEAR WPR
<10%10-50%
>50% but <70%≥ 70%
Don’t Know

71Report of the 2015 Global NCD Survey
Beta Blockers
Statins Oral morphine
Steroid inhaler
Broncho-dilator
Sulphonyl-urea(s)
WHO region
AFR 46 11 14 31 46 23
AMR 88 76 41 71 88 85
EMR 70 50 15 55 90 75
EUR 96 90 77 87 88 90
SEAR 73 55 18 0 73 36
WPR 80 72 48 56 72 80
World Bankincome group
Low-income 38 8 15 23 38 15
Lower-middle-income 67 40 13 31 73 67
Upper-middle-income 86 74 46 70 82 74
High-income 98 96 77 89 93 93
ALL 78 63 43 59 77 69
Insulin Aspirin (100 mg)
Metformin Thiazide Diuretics
ACE Inhibitors
CC Blockers
WHO region
AFR 40 71 51 66 49 46
AMR 91 94 94 94 91 88
EMR 70 80 85 90 75 75
EUR 92 98 92 98 96 96
SEAR 36 91 73 73 55 45
WPR 68 88 88 92 80 72
World Bankincome group
Low-income 23 69 42 65 35 31
Lower-middle-income 53 82 73 80 73 64
Upper-middle-income 88 92 94 94 86 86
High-income 96 98 96 98 96 96
ALL 72 88 82 88 79 76
TABLE 7:
Percentage of countries with medicines generally available in the public health sector, by WHO region and World Bank income group
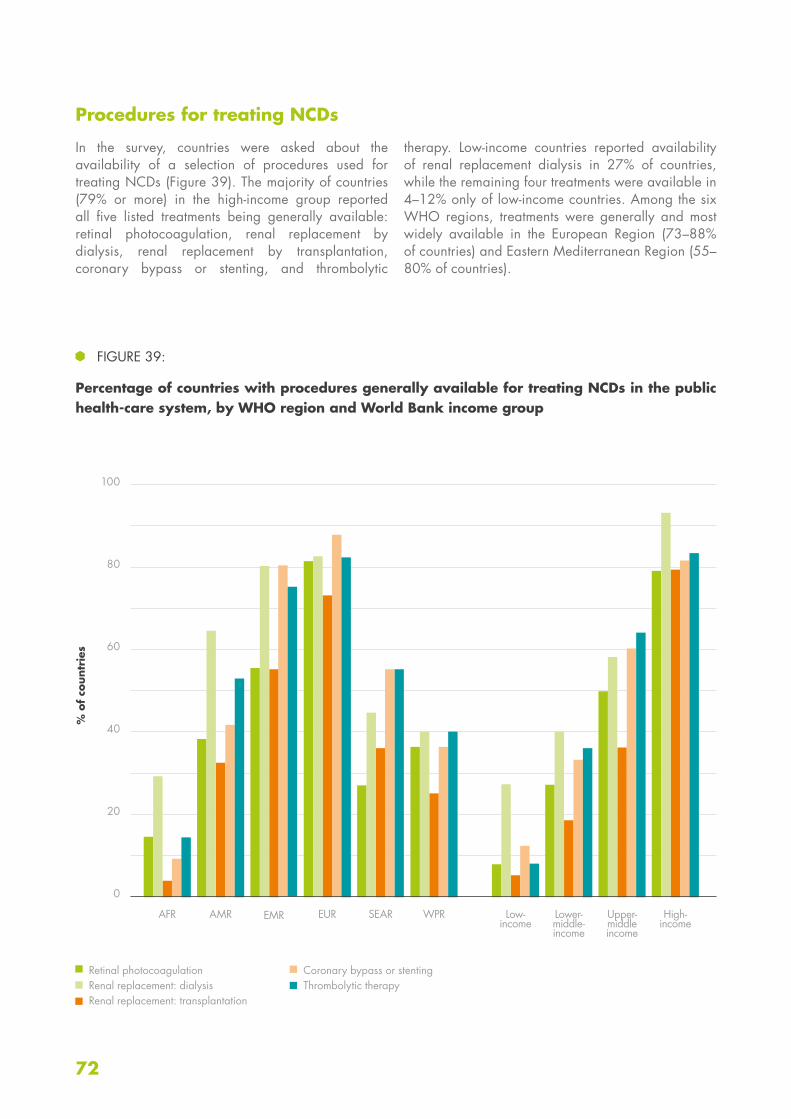
72
100
80
60
40
20
0
Procedures for treating NCDs
In the survey, countries were asked about the availability of a selection of procedures used for treating NCDs (Figure 39). The majority of countries (79% or more) in the high-income group reported all five listed treatments being generally available: retinal photocoagulation, renal replacement by dialysis, renal replacement by transplantation, coronary bypass or stenting, and thrombolytic
therapy. Low-income countries reported availability of renal replacement dialysis in 27% of countries, while the remaining four treatments were available in 4–12% only of low-income countries. Among the six WHO regions, treatments were generally and most widely available in the European Region (73–88% of countries) and Eastern Mediterranean Region (55–80% of countries).
FIGURE 39:
Percentage of countries with procedures generally available for treating NCDs in the public health-care system, by WHO region and World Bank income group
% o
f co
untr
ies
AFR Low- income
AMR Lower- middle- income
EMR Upper- middle income
EUR High- income
SEAR WPR
Retinal photocoagulationRenal replacement: dialysisRenal replacement: transplantation
Coronary bypass or stenting Thrombolytic therapy

73Report of the 2015 Global NCD Survey
Cancer diagnosis and treatment
Sixty-seven per cent (67%) of countries reported that cancer centres or cancer departments at the tertiary level were generally available in the public sector. Pathology services were generally available in the public health sector in three-quarters (75%) of countries. Cancer surgery (69% of countries) and subsidized chemotherapy (63% of countries) were less widely available. A distinct decline in availability
that corresponded to a decrease in income group was observed for all four diagnosis and treatment services. Countries in the European Region (92% or more of countries) and Eastern Mediterranean Region (80% or more of countries) were the most likely to provide these services, while they were less readily available in the African Region (31–37% of countries) (Figure 40).
100
80
60
40
20
0
FIGURE 40:
Percentage of countries with generally available cancer diagnosis and treatment services in the public sector, by WHO region and World Bank income group
% o
f co
untr
ies
AFR Low- income
AMR Lower- middle- income
EMR Upper- middle income
EUR High- income
SEAR WPR
Cancer centres or cancer departments at a tertiary levelPathology services (laboratories)
Cancer surgerySubsidized chemotherapy
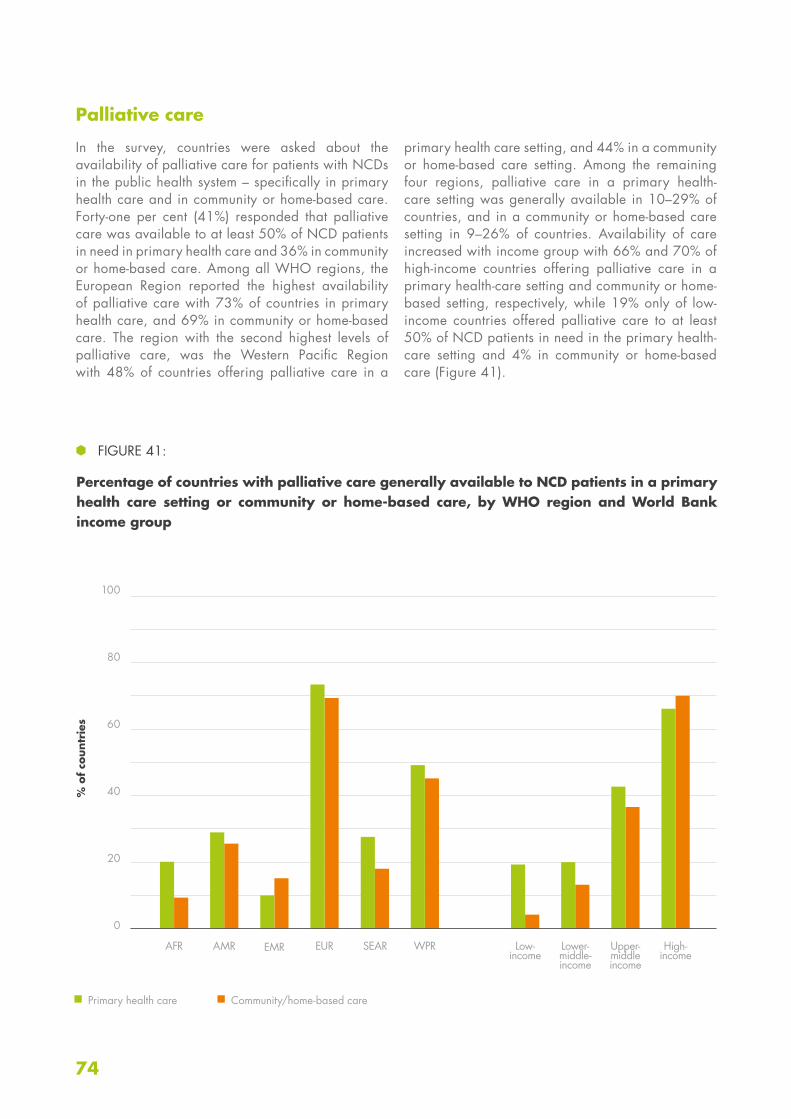
74
100
80
60
40
20
0
Palliative care
In the survey, countries were asked about the availability of palliative care for patients with NCDs in the public health system – specifically in primary health care and in community or home-based care. Forty-one per cent (41%) responded that palliative care was available to at least 50% of NCD patients in need in primary health care and 36% in community or home-based care. Among all WHO regions, the European Region reported the highest availability of palliative care with 73% of countries in primary health care, and 69% in community or home-based care. The region with the second highest levels of palliative care, was the Western Pacific Region with 48% of countries offering palliative care in a
primary health care setting, and 44% in a community or home-based care setting. Among the remaining four regions, palliative care in a primary health-care setting was generally available in 10–29% of countries, and in a community or home-based care setting in 9–26% of countries. Availability of care increased with income group with 66% and 70% of high-income countries offering palliative care in a primary health-care setting and community or home-based setting, respectively, while 19% only of low-income countries offered palliative care to at least 50% of NCD patients in need in the primary health-care setting and 4% in community or home-based care (Figure 41).
FIGURE 41:
Percentage of countries with palliative care generally available to NCD patients in a primary health care setting or community or home-based care, by WHO region and World Bank income group
% o
f co
untr
ies
AFR Low- income
AMR Lower- middle- income
EMR Upper- middle income
EUR High- income
SEAR WPR
Primary health care Community/home-based care
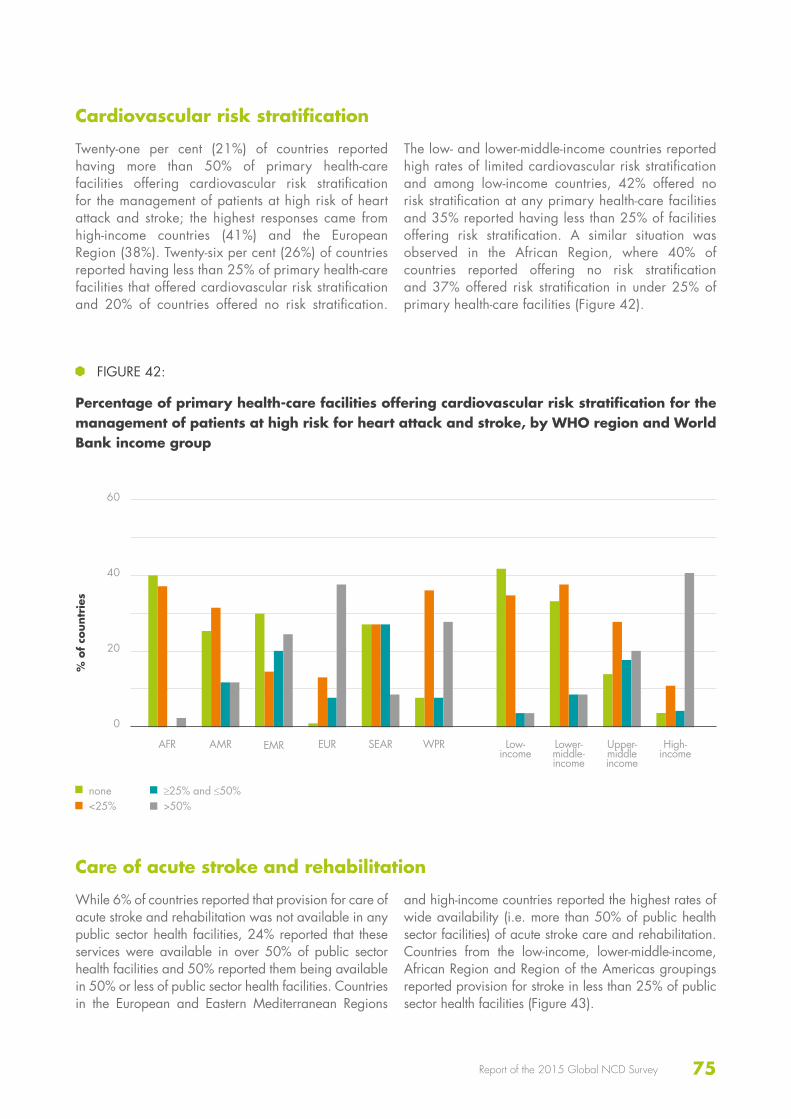
75Report of the 2015 Global NCD Survey
60
40
20
0
Cardiovascular risk stratification
Twenty-one per cent (21%) of countries reported having more than 50% of primary health-care facilities offering cardiovascular risk stratification for the management of patients at high risk of heart attack and stroke; the highest responses came from high-income countries (41%) and the European Region (38%). Twenty-six per cent (26%) of countries reported having less than 25% of primary health-care facilities that offered cardiovascular risk stratification and 20% of countries offered no risk stratification.
The low- and lower-middle-income countries reported high rates of limited cardiovascular risk stratification and among low-income countries, 42% offered no risk stratification at any primary health-care facilities and 35% reported having less than 25% of facilities offering risk stratification. A similar situation was observed in the African Region, where 40% of countries reported offering no risk stratification and 37% offered risk stratification in under 25% of primary health-care facilities (Figure 42).
Care of acute stroke and rehabilitation
While 6% of countries reported that provision for care of acute stroke and rehabilitation was not available in any public sector health facilities, 24% reported that these services were available in over 50% of public sector health facilities and 50% reported them being available in 50% or less of public sector health facilities. Countries in the European and Eastern Mediterranean Regions
and high-income countries reported the highest rates of wide availability (i.e. more than 50% of public health sector facilities) of acute stroke care and rehabilitation. Countries from the low-income, lower-middle-income, African Region and Region of the Americas groupings reported provision for stroke in less than 25% of public sector health facilities (Figure 43).
FIGURE 42:
Percentage of primary health-care facilities offering cardiovascular risk stratification for the management of patients at high risk for heart attack and stroke, by WHO region and World Bank income group
% o
f co
untr
ies
AFR Low- income
AMR Lower- middle- income
EMR Upper- middle income
EUR High- income
SEAR WPR
none<25%
≥25% and ≤50%>50%
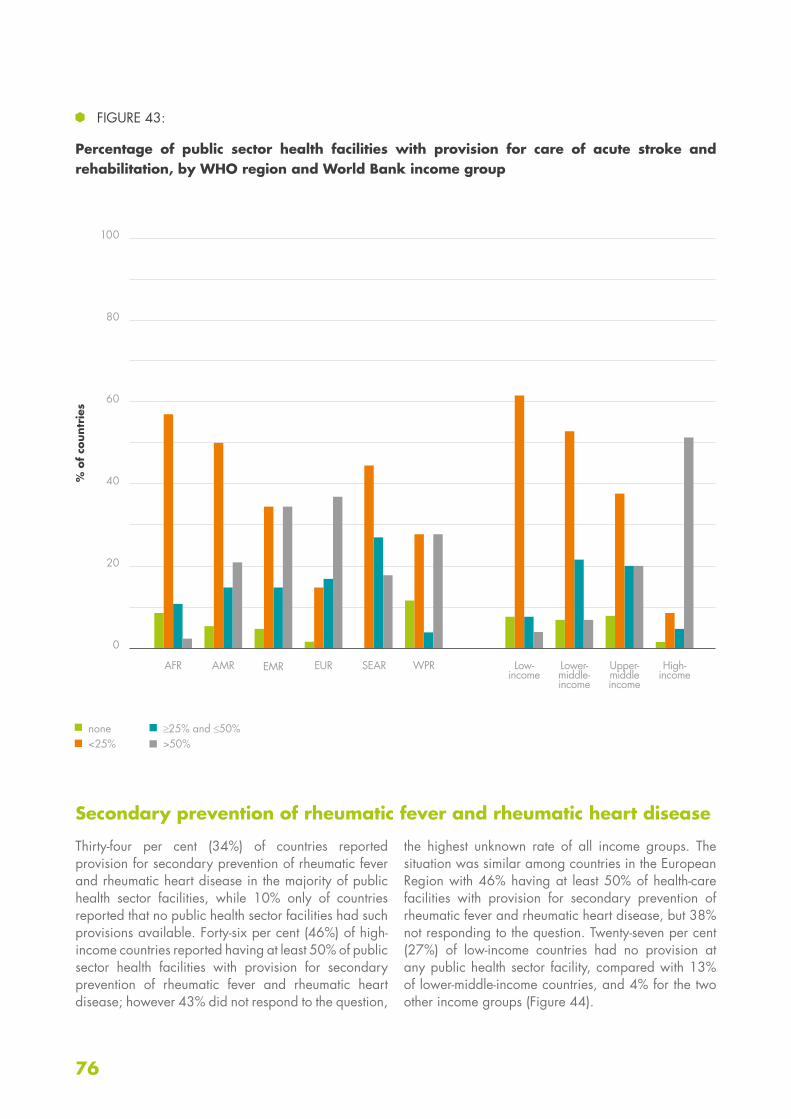
76
100
80
60
40
20
0
FIGURE 43:
Percentage of public sector health facilities with provision for care of acute stroke and rehabilitation, by WHO region and World Bank income group
% o
f co
untr
ies
AFR Low- income
AMR Lower- middle- income
EMR Upper- middle income
EUR High- income
SEAR WPR
none<25%
≥25% and ≤50%>50%
Secondary prevention of rheumatic fever and rheumatic heart disease
Thirty-four per cent (34%) of countries reported provision for secondary prevention of rheumatic fever and rheumatic heart disease in the majority of public health sector facilities, while 10% only of countries reported that no public health sector facilities had such provisions available. Forty-six per cent (46%) of high-income countries reported having at least 50% of public sector health facilities with provision for secondary prevention of rheumatic fever and rheumatic heart disease; however 43% did not respond to the question,
the highest unknown rate of all income groups. The situation was similar among countries in the European Region with 46% having at least 50% of health-care facilities with provision for secondary prevention of rheumatic fever and rheumatic heart disease, but 38% not responding to the question. Twenty-seven per cent (27%) of low-income countries had no provision at any public health sector facility, compared with 13% of lower-middle-income countries, and 4% for the two other income groups (Figure 44).
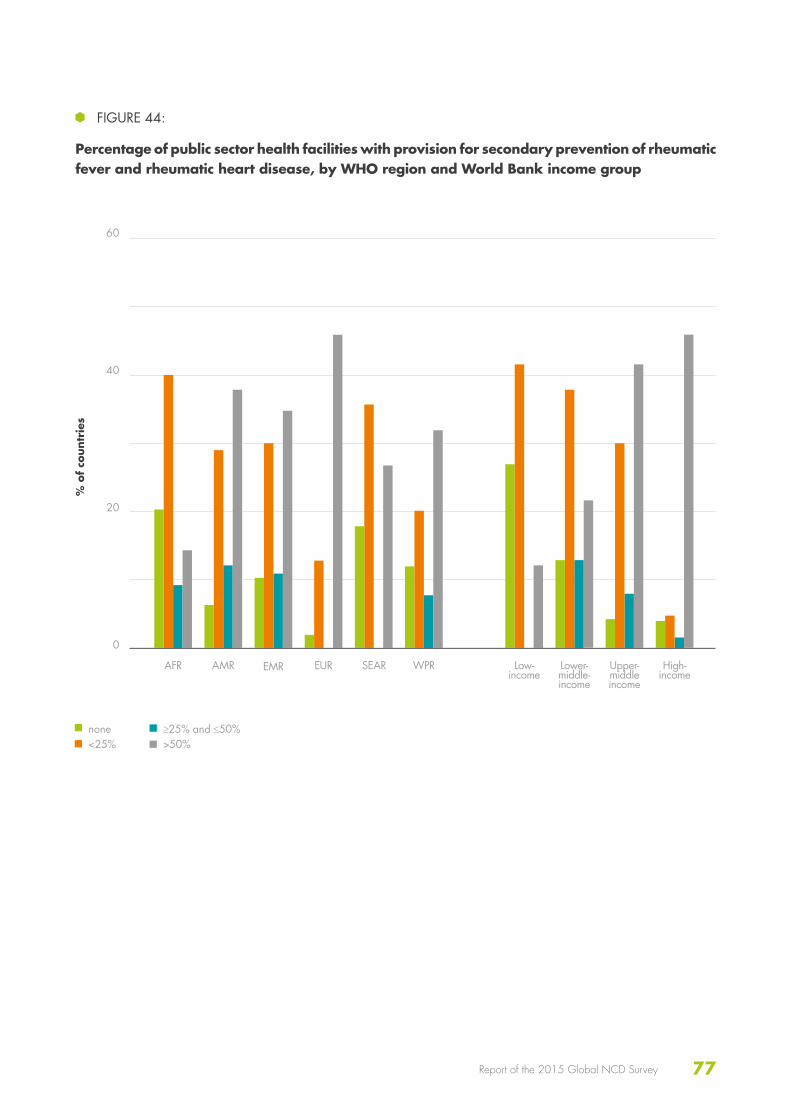
77Report of the 2015 Global NCD Survey
60
40
20
0
FIGURE 44:
Percentage of public sector health facilities with provision for secondary prevention of rheumatic fever and rheumatic heart disease, by WHO region and World Bank income group
% o
f co
untr
ies
AFR Low- income
AMR Lower- middle- income
EMR Upper- middle income
EUR High- income
SEAR WPR
none<25%
≥25% and ≤50%>50%

78

79Report of the 2015 Global NCD Survey
DISCUSSION
80
Infrastructure, governance and financing
The availability of NCD units with full-time staff was high – staffing, in particular, showed considerable improvement from 2010. However, funding for NCD activities, although available in most countries, remained inadequate. Funding for primary prevention, screening and health promotion lagged considerably behind funding for other areas, and funding for palliative care, surveillance and capacity-building was even less widely available. Government revenues were the most widespread source of funding for NCDs among countries. They were also the most widely reported of the top three funding sources in all income groups and regions except among countries in the African Region and low-income countries, both of which reported that funding from international
donors was equally prevalent. Although considerably more countries reported health insurance and earmarked taxes as a funding source for NCDs in 2015 compared with 2010, these were still far less prevalent, especially in low-income countries and countries in the Region of the Americas and the Western Pacific Region. While tobacco and alcohol taxation was fairly widespread, other possible fiscal interventions, such as price subsidies for healthy foods or taxation of sugar-sweetened beverages, were rare. Multisectoral NCD commissions to oversee NCD engagement, policy coherence and accountability of sectors beyond health were operational in only a third of countries and under development in another quarter of countries.
Policies, action plans and strategies
NCDs have been widely adopted in national health plans (92% of countries) with 60% of countries having a set of time-bound national targets for their NCD indicators. Significant progress was made in the availability of operational integrated plans, with figures being almost double those of 2010. However, while 62% of countries reported having an operational integrated NCD plan, only 41% achieved NCD Progress Monitoring Indicator 4 (see Box 2) in having an operational multisectoral
integrated plan covering the four main NCDs and their risk factors. While 35% of countries reported having NCD-related research policies, only 24% reported such policies being operational, the prevalence being notably low in low-income (15%) and lower-middle-income (11%) countries. Implementation of cost-effective policies for NCDs related to diet was relatively low with approximately a third or less of countries overall, and almost no low-income countries, implementing a policy.
NCD surveillance
The majority of countries reported having an office, or offices, within their ministry of health with responsibility for NCD surveillance. Only five countries reported either that NCD surveillance was the responsibility of
an external agency, or that no one had responsibility for NCD surveillance. While just under two-thirds of countries had population-based cancer registries, there has been considerable improvement in five years, particularly
KEY FINDINGS
81Report of the 2015 Global NCD Survey
in the African Region which has seen the number of countries with population-based cancer registries more than double. Diabetes registries, however, were less prevalent (44% of countries) and 14% only of all countries had population-based diabetes registries.
Over half of all countries had conducted recent, national risk factor surveys on each of the main NCD risk factors
in adults, except for salt/sodium intake, which had been surveyed in just over a third of countries. There is still considerable work to be done in many countries to establish surveillance systems which conduct national multi-risk factor surveys on a regular basis: 34% only of countries fully achieved NCD Progress Monitoring Indicator 3 on regular, comprehensive health examination surveys.
NCD management
Much progress is still to be made in NCD management guidelines. While diabetes and cardiovascular disease guidelines were available in approximately two thirds of countries (64% and 71% respectively), guidelines for cancer and chronic respiratory diseases were less prevalent worldwide. Just over a third of countries (37%) had implemented guidelines for all four of the major NCDs. Although certain basic technologies, such as height, weight and blood pressure measurement, were widely available in most countries, other technologies, such as cholesterol and HbA1c testing, were less widely available, with a marked decline in availability corresponding to decreasing income group. Breast and cervical cancer screening programmes were widely available even in low-income countries, the Eastern Mediterranean Region being the notable exception to this. Many programmes were opportunistic only, and reached
50% or less of the target population. HPV vaccination programmes were available in approximately one third of middle- and low-income countries only; however they were widely available in high-income countries. While programme coverage improved with increasing income group, many programmes in low-income countries reached less than 10% of the target population. The availability of medicines and procedures for treating NCDs showed a clear relationship with income group; this applied also to palliative care which was only widely available among high-income countries. Much progress remains to be made in the areas of availability for cardiovascular risk stratification and provision of care of acute stroke and stroke rehabilitation with well under a third of countries (21% and 24% respectively) worldwide offering these services in the majority of primary health-care facilities.
82
As the product of a broad collaboration across various technical areas, the NCD CCS questionnaire is a unique tool that offers a wide-ranging view of the global response to NCDs. The breadth of the questionnaire, however, is not without its disadvantages. It was not possible, for example, to go into detail on any given topic or request documentation from countries for every response. However, the high response rate and high quantities of supporting documents submitted for selected questions lends strength to the survey results. Country responses were reviewed and validated against reliable data sources, where available, and most countries responded well to feedback from the WHO Secretariat. While the results were ultimately
the response of a single focal point in the ministry of health, joint collaboration between focal point and local colleagues to complete the questionnaire was strongly encouraged. Most countries succeeded in following these instructions; nevertheless those with highly decentralized health systems may have found completing specific sections challenging and considered their responses to give an incomplete national picture. Although a glossary was available and the WHO Secretariat highly responsive to requests for clarification, there remained the possibility of variable interpretation of certain terminology throughout the questionnaire, which would negatively impact the accuracy of the results.
STRENGTHS AND LIMITATIONS OF THE SURVEY

83Report of the 2015 Global NCD Survey

84

85Report of the 2015 Global NCD Survey
CONCLUSION
86
The results of the 2015 NCD CCS highlight significant areas of growth and improvement in national responses to address the growing NCD burden. Significant achievement and progress has been made since the 2014 survey with a continuation in the positive trend
in stronger national level capacity since the initial survey of 2010. However, while overall progress is encouraging, there remain areas of concern where actions need to be prioritized. The following six key priorities are highlighted:
Funding for NCD activities
Greater leveraging of resources to fund essential programmatic work is still required in many low- and middle-income countries, particularly funding for primary prevention, screening and health promotion, palliative care, surveillance and capacity-building.
Multisectoral coordination
Strengthened governance mechanisms are needed, in particular multisectoral NCD commissions or similar mechanisms to help oversee NCD engagement, policy coherence and accountability of sectors beyond health to bring about policy and programme coherence.
Policy implementation
Tangible progress in the availability of operational national integrated plans has been made, reflecting the increased importance countries are placing on the need to address NCDs and their risk factors. Efforts are still needed to ensure these plans are fully implemented and further focus is required to ensure the content of the plans reflect a comprehensive approach to addressing the four main NCDs and the four main risk factors. Policy implementation in the area of unhealthy diet in particular needs strengthening.
I
II
III
PRIORITIES FOR FURTHER ACTION
87Report of the 2015 Global NCD Survey
Detection, treatment and care for those with existing NCDs
Improvements are still needed in the availability of guidelines for managing the main NCDs, particularly with cancer and chronic respiratory diseases. Broader availability of basic technologies to detect NCDs is needed, particularly in low-income countries. Cancer screening programmes need to become more systematic and reach a larger proportion of their target populations.
Strengthen palliative care
Provision of palliative care for people suffering with end-stage NCDs in the public health system needs strengthening, specifically in primary health care and in community or home-based care.
V
VI
Sustained surveillance
Considerable work is still needed in many countries to establish robust surveillance systems capable of conducting national multi-risk factor surveys at least every five years to track national targets and indicators, and check that interventions remain on course.
IV
88
1. Global Health Estimates: Deaths by Cause, Age, Sex and Country, 2000–2012. Geneva, World Health Organization, 2014.
2. United Nations, General Assembly. Political declaration of the High-level Meeting of the General Assembly on the Prevention and Control of Non-communicable Diseases, A/66/L.1, 16 September 2011 (http://www.un.org/ga/search/view_doc.asp?symbol=A/66/L.1, accessed 6 June 2016).
3. United Nations, General Assembly. Outcome document of the High-level Meeting of the General Assembly on the Review of the Progress Achieved in the Prevention and Control of Non-communicable Diseases, 8 July 2014 (http://www.un.org/en/ga/president/68/pdf/letters/782014Non-communicable%20diseases_Outcome%20Doc-8%20July%202014.pdf, accessed 9 June 2016).
4. Resolution WHA66.10. Follow-up to the Political Declaration of the High-level Meeting of the General Assembly on the Prevention and Control of Non-communicable Diseases. In: Sixty-sixth World Health Assembly, 20–28 May 2013. Geneva: World Health Organization, 2013 (http://apps.who.int/gb/ebwha/pdf_files/WHA66/A66_R10-en.pdf?ua=1 , accessed 9 June, 2016).
5. Alwan AD, Maclean D, Mandil A. Assessment of national capacity for noncommunicable disease prevention and control: the report of a global survey, Geneva: World Health Organization, 2001 (http://apps.who.int/iris/bitstream/10665/67305/1/WHO_MNC_01.2.pdf, accessed 6 June 2016).
6. Global action plan for the prevention and control of noncommunicable diseases 2013–2020. Geneva, World Health Organiza-tion, 2013 (http://apps.who.int/iris/bitstre-am/10665/94384/1/9789241506236_eng.pdf, accessed 6 June 2016).
REFERENCES

89Report of the 2015 Global NCD Survey

90

91Report of the 2015 Global NCD Survey
ANNEXES
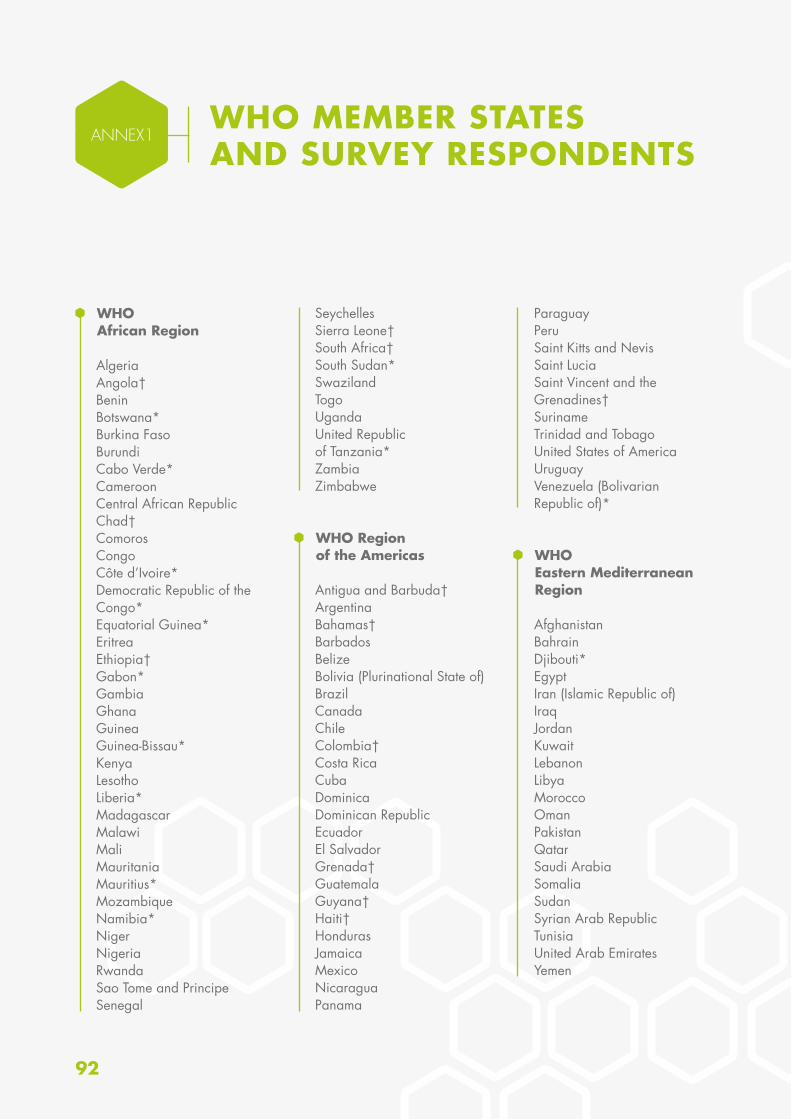
92
WHO African Region
AlgeriaAngola†BeninBotswana*Burkina FasoBurundiCabo Verde*CameroonCentral African RepublicChad†ComorosCongoCôte d’Ivoire*Democratic Republic of the Congo*Equatorial Guinea*EritreaEthiopia†Gabon*GambiaGhanaGuineaGuinea-Bissau*KenyaLesothoLiberia*MadagascarMalawiMaliMauritaniaMauritius*MozambiqueNamibia*NigerNigeriaRwandaSao Tome and PrincipeSenegal
SeychellesSierra Leone†South Africa†South Sudan*SwazilandTogoUgandaUnited Republic of Tanzania*ZambiaZimbabwe
WHO Region of the Americas
Antigua and Barbuda†ArgentinaBahamas†BarbadosBelizeBolivia (Plurinational State of)BrazilCanadaChileColombia†Costa RicaCubaDominicaDominican RepublicEcuadorEl SalvadorGrenada†GuatemalaGuyana†Haiti†HondurasJamaicaMexicoNicaraguaPanama
ParaguayPeruSaint Kitts and NevisSaint LuciaSaint Vincent and the Grenadines†SurinameTrinidad and TobagoUnited States of AmericaUruguayVenezuela (Bolivarian Republic of)*
WHO Eastern Mediterranean Region
AfghanistanBahrainDjibouti*EgyptIran (Islamic Republic of)IraqJordanKuwaitLebanonLibyaMoroccoOmanPakistanQatarSaudi ArabiaSomaliaSudanSyrian Arab RepublicTunisiaUnited Arab EmiratesYemen
ANNEX1WHO MEMBER STATES AND SURVEY RESPONDENTS
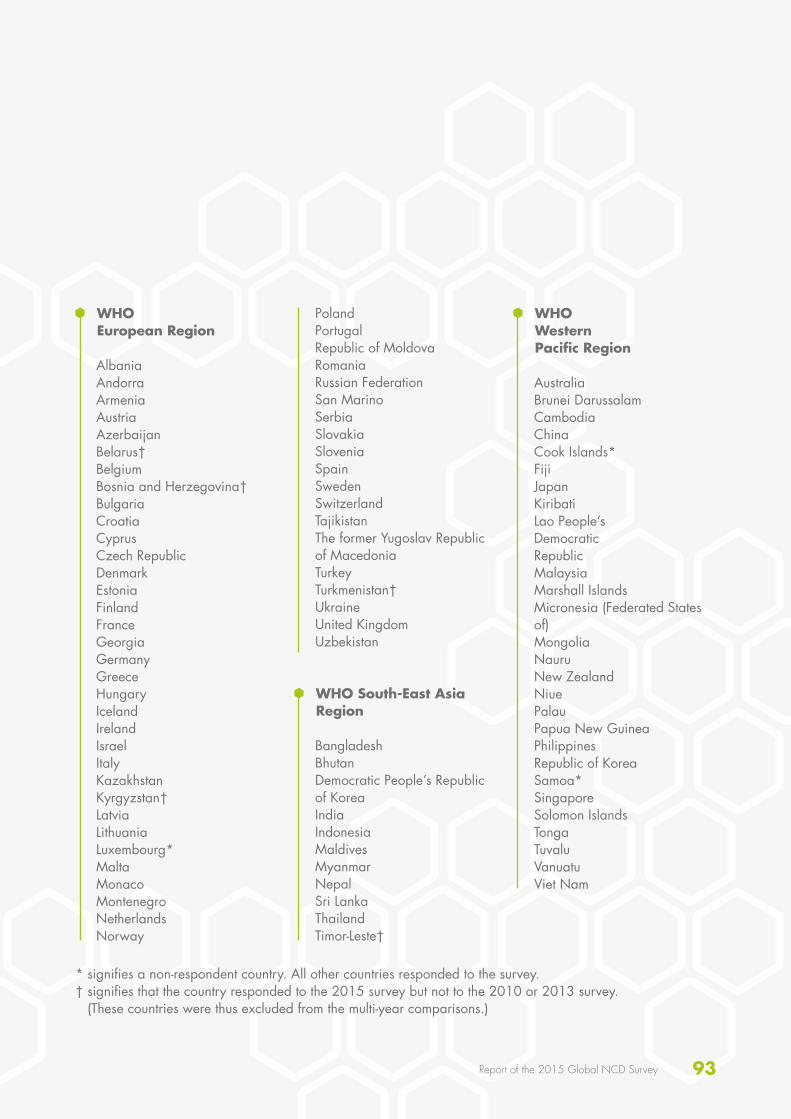
93Report of the 2015 Global NCD Survey
WHO European Region
AlbaniaAndorraArmeniaAustriaAzerbaijanBelarus†BelgiumBosnia and Herzegovina†BulgariaCroatiaCyprusCzech RepublicDenmarkEstoniaFinlandFranceGeorgiaGermanyGreeceHungaryIcelandIrelandIsraelItalyKazakhstanKyrgyzstan†LatviaLithuaniaLuxembourg*MaltaMonacoMontenegroNetherlandsNorway
PolandPortugalRepublic of MoldovaRomaniaRussian FederationSan MarinoSerbiaSlovakiaSloveniaSpainSwedenSwitzerlandTajikistanThe former Yugoslav Republic of MacedoniaTurkeyTurkmenistan†UkraineUnited KingdomUzbekistan
WHO South-East Asia Region
BangladeshBhutanDemocratic People’s Republic of KoreaIndiaIndonesiaMaldivesMyanmarNepalSri LankaThailandTimor-Leste†
WHO Western Pacific Region
AustraliaBrunei DarussalamCambodiaChinaCook Islands*FijiJapanKiribatiLao People’s Democratic RepublicMalaysiaMarshall IslandsMicronesia (Federated States of)MongoliaNauruNew ZealandNiuePalauPapua New GuineaPhilippinesRepublic of KoreaSamoa*SingaporeSolomon IslandsTongaTuvaluVanuatuViet Nam
* signifies a non-respondent country. All other countries responded to the survey.† signifies that the country responded to the 2015 survey but not to the 2010 or 2013 survey.
(These countries were thus excluded from the multi-year comparisons.)
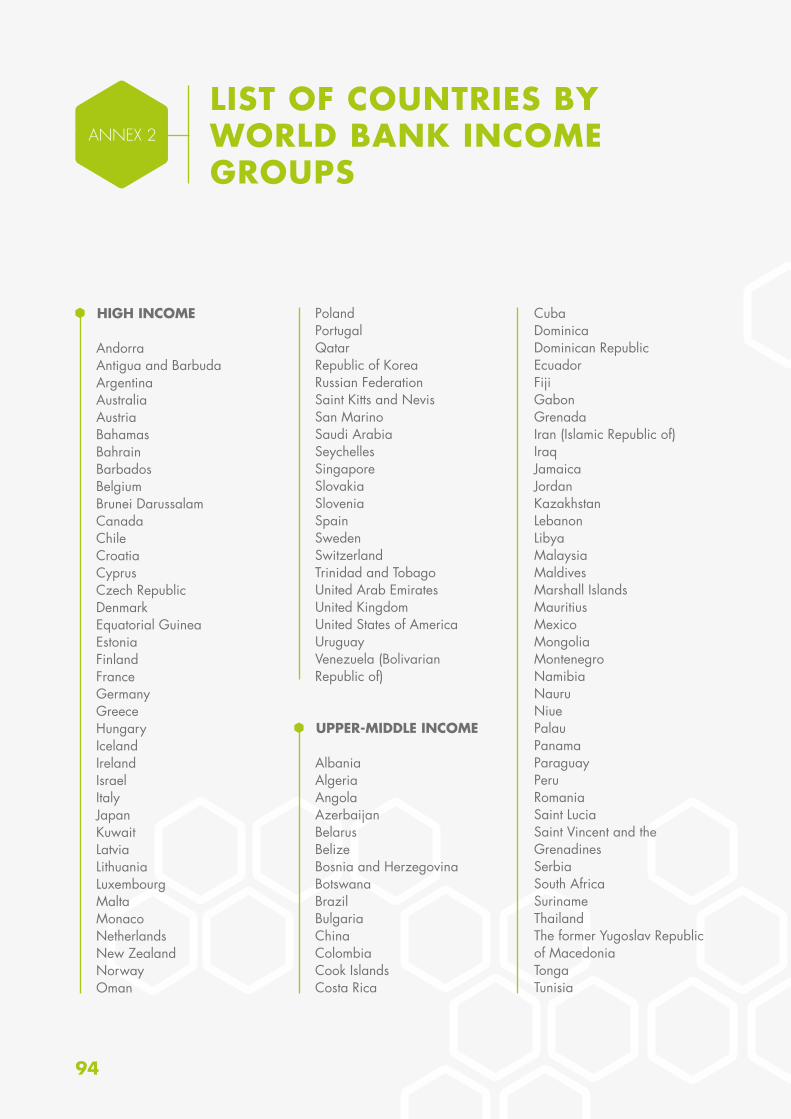
94
ANNEX 2
LIST OF COUNTRIES BY WORLD BANK INCOME GROUPS
HIGH INCOME
AndorraAntigua and BarbudaArgentinaAustraliaAustriaBahamasBahrainBarbadosBelgiumBrunei DarussalamCanadaChileCroatiaCyprusCzech RepublicDenmarkEquatorial GuineaEstoniaFinlandFranceGermanyGreeceHungaryIcelandIrelandIsraelItalyJapanKuwaitLatviaLithuaniaLuxembourgMaltaMonacoNetherlandsNew ZealandNorwayOman
PolandPortugalQatarRepublic of KoreaRussian FederationSaint Kitts and NevisSan MarinoSaudi ArabiaSeychellesSingaporeSlovakiaSloveniaSpainSwedenSwitzerlandTrinidad and TobagoUnited Arab EmiratesUnited KingdomUnited States of AmericaUruguayVenezuela (Bolivarian Republic of)
UPPER-MIDDLE INCOME
AlbaniaAlgeriaAngolaAzerbaijanBelarusBelizeBosnia and HerzegovinaBotswanaBrazilBulgariaChinaColombiaCook IslandsCosta Rica
CubaDominicaDominican RepublicEcuadorFijiGabonGrenadaIran (Islamic Republic of)IraqJamaicaJordanKazakhstanLebanonLibyaMalaysiaMaldivesMarshall IslandsMauritiusMexicoMongoliaMontenegroNamibiaNauruNiuePalauPanamaParaguayPeruRomaniaSaint LuciaSaint Vincent and the GrenadinesSerbiaSouth AfricaSurinameThailandThe former Yugoslav Republic of MacedoniaTongaTunisia
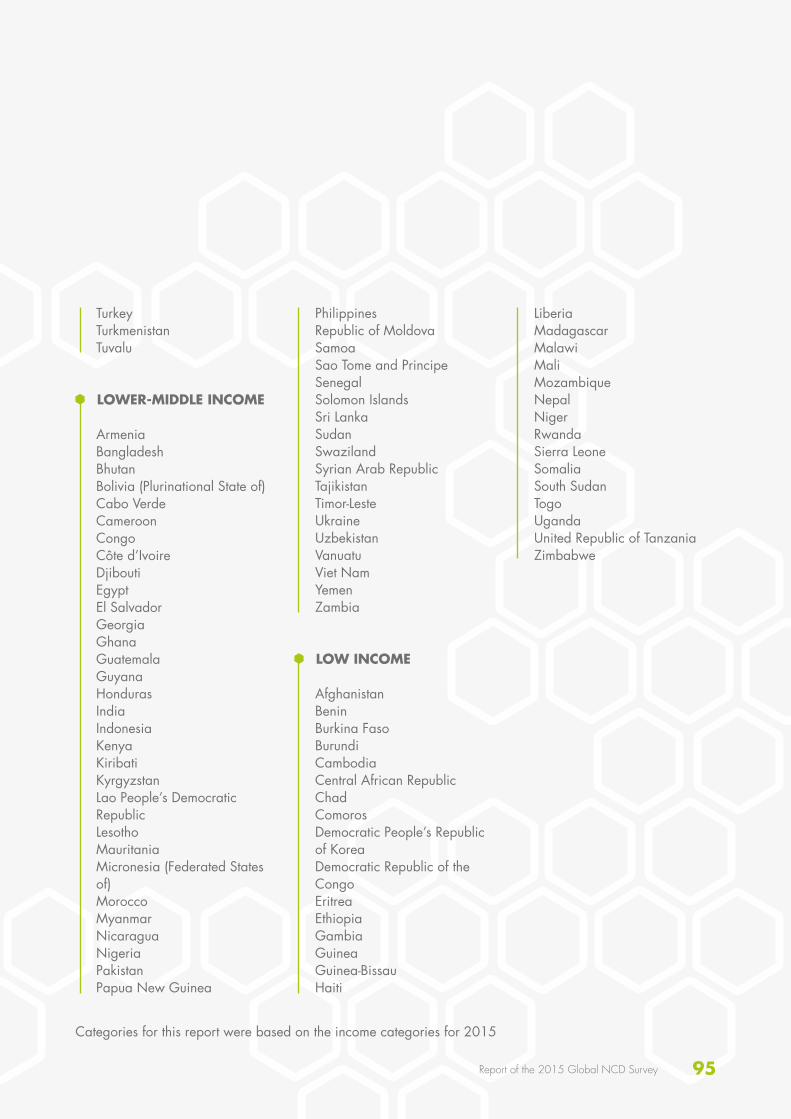
95Report of the 2015 Global NCD Survey
TurkeyTurkmenistanTuvalu
LOWER-MIDDLE INCOME
ArmeniaBangladeshBhutanBolivia (Plurinational State of)Cabo VerdeCameroonCongoCôte d’IvoireDjiboutiEgyptEl SalvadorGeorgiaGhanaGuatemalaGuyanaHondurasIndiaIndonesiaKenyaKiribatiKyrgyzstanLao People’s Democratic RepublicLesothoMauritaniaMicronesia (Federated States of)MoroccoMyanmarNicaraguaNigeriaPakistanPapua New Guinea
PhilippinesRepublic of MoldovaSamoaSao Tome and PrincipeSenegalSolomon IslandsSri LankaSudanSwazilandSyrian Arab RepublicTajikistanTimor-LesteUkraineUzbekistanVanuatuViet NamYemenZambia
LOW INCOME
AfghanistanBeninBurkina FasoBurundiCambodiaCentral African RepublicChadComorosDemocratic People’s Republic of KoreaDemocratic Republic of the CongoEritreaEthiopiaGambiaGuineaGuinea-BissauHaiti
LiberiaMadagascarMalawiMaliMozambiqueNepalNigerRwandaSierra LeoneSomaliaSouth SudanTogoUgandaUnited Republic of TanzaniaZimbabwe
Categories for this report were based on the income categories for 2015
96
ANNEX 3 QUESTIONNAIRE
MODULES:
Country Profile of Capacity and Response to Noncommunicable Diseases (NCDs)
I
III
PUBLIC HEALTH INFRASTRUCTURE,
PARTNERSHIPS AND MULTISECTORAL
COLLABORATION FOR NCDs AND THEIR RISK FACTORS
HEALTH INFORMATION SYSTEMS, SURVEILLANCE AND
SURVEYS FOR NCDs AND THEIR RISK FACTORS
STATUS OF NCD-RELEVANT POLICIES, STRATEGIES AND
ACTION PLANS
CAPACITY FOR NCD EARLY DETECTION, TREATMENT AND
CARE WITHIN THE HEALTH SYSTEM
II
IV
Purpose
• The purpose of this survey is to gauge your country capacity for responding to noncommunicable diseases. The four main types of noncommunicable diseases are cardiovascular diseases (such as heart attack and stroke), cancers, chronic respiratory diseases (such as chronic obstructed pulmonary disease and asthma) and diabetes. The main risk factors for NCDs are harmful use of alcohol, tobacco use, unhealthy diet, and physical inactivity. The term NCDs in this document includes prevention, control, and management of NCDs, including major risk factors. The objective of the survey is to guide WHO Member States, WHO regional offices and WHO headquarters in planning future actions and technical assistance required to address NCDs.
• This survey also will provide the basis for ongoing assessment of changes in country capacity and response.
• The use of standardized questions allows for comparisons of country capacities and responses. This survey is divided into four modules which assess the four key aspects of NCD prevention and control.
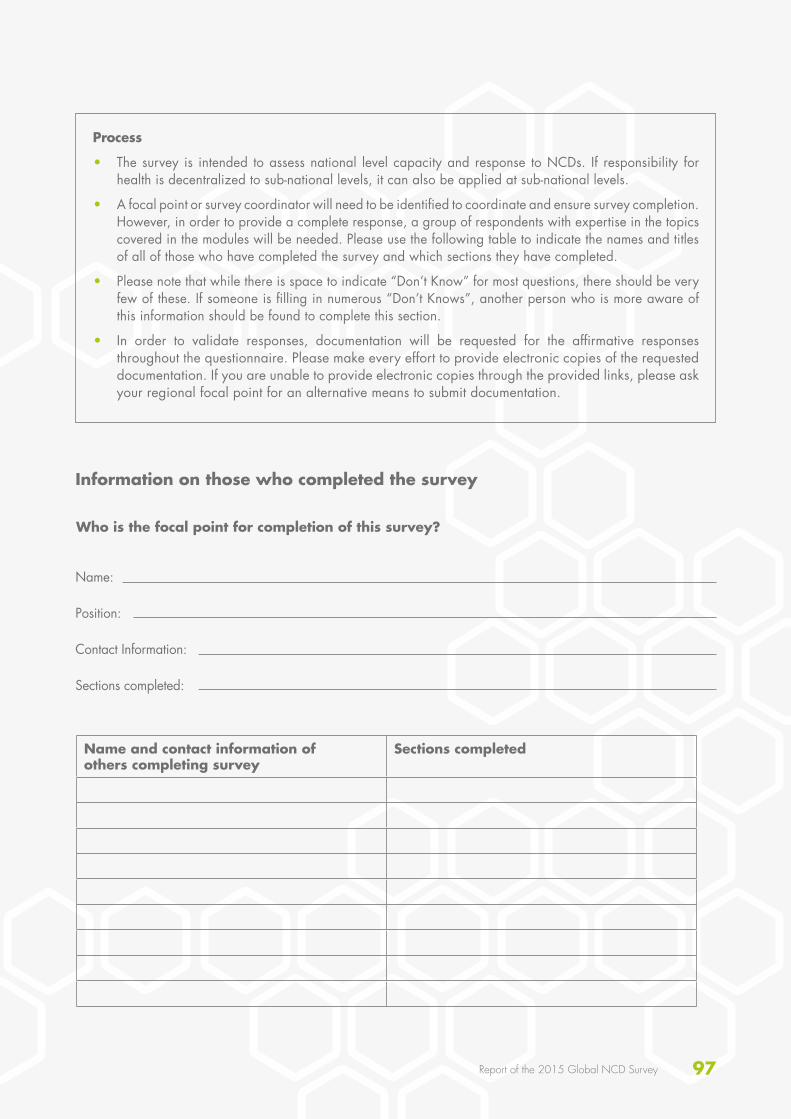
97Report of the 2015 Global NCD Survey
Process
• The survey is intended to assess national level capacity and response to NCDs. If responsibility for health is decentralized to sub-national levels, it can also be applied at sub-national levels.
• A focal point or survey coordinator will need to be identified to coordinate and ensure survey completion. However, in order to provide a complete response, a group of respondents with expertise in the topics covered in the modules will be needed. Please use the following table to indicate the names and titles of all of those who have completed the survey and which sections they have completed.
• Please note that while there is space to indicate “Don’t Know” for most questions, there should be very few of these. If someone is filling in numerous “Don’t Knows”, another person who is more aware of this information should be found to complete this section.
• In order to validate responses, documentation will be requested for the affirmative responses throughout the questionnaire. Please make every effort to provide electronic copies of the requested documentation. If you are unable to provide electronic copies through the provided links, please ask your regional focal point for an alternative means to submit documentation.
Information on those who completed the survey
Who is the focal point for completion of this survey?
Name:
Position:
Contact Information:
Sections completed:
Name and contact information of others completing survey
Sections completed
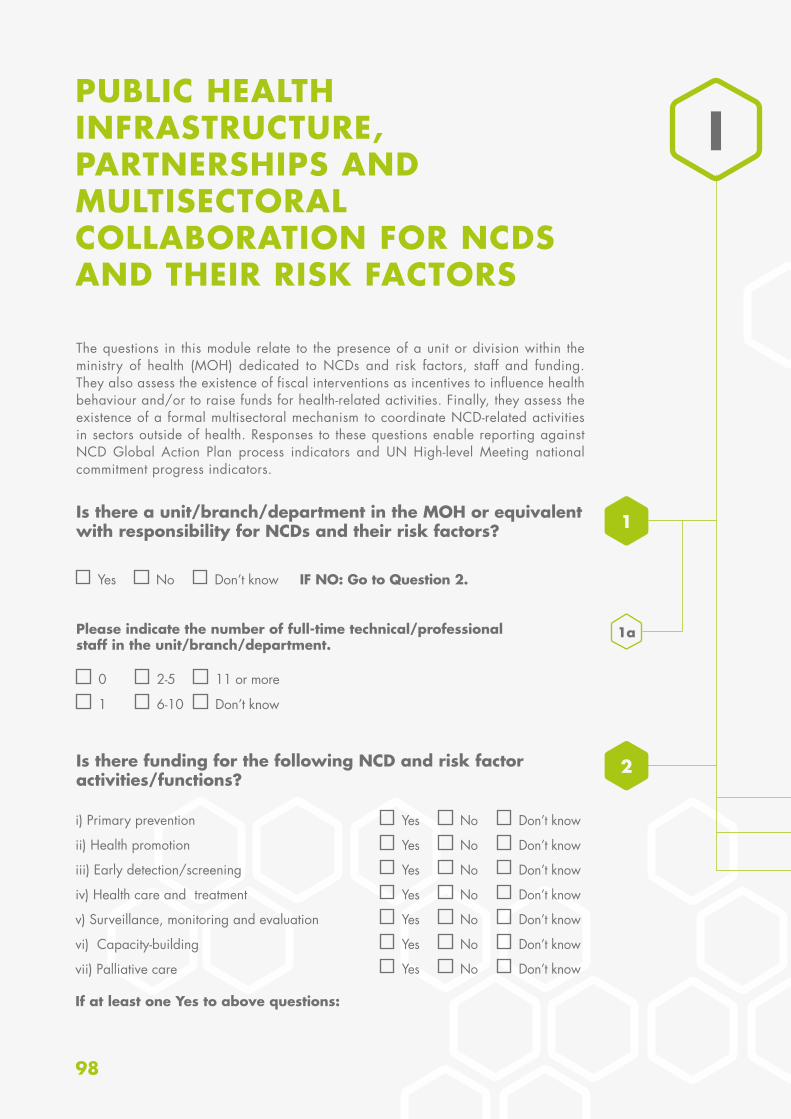
98
PUBLIC HEALTH INFRASTRUCTURE, PARTNERSHIPS AND MULTISECTORAL COLLABORATION FOR NCDS AND THEIR RISK FACTORS
1a
Is there a unit/branch/department in the MOH or equivalent with responsibility for NCDs and their risk factors?
The questions in this module relate to the presence of a unit or division within the ministry of health (MOH) dedicated to NCDs and risk factors, staff and funding. They also assess the existence of fiscal interventions as incentives to influence health behaviour and/or to raise funds for health-related activities. Finally, they assess the existence of a formal multisectoral mechanism to coordinate NCD-related activities in sectors outside of health. Responses to these questions enable reporting against NCD Global Action Plan process indicators and UN High-level Meeting national commitment progress indicators.
Please indicate the number of full-time technical/professional staff in the unit/branch/department.
Is there funding for the following NCD and risk factor activities/functions?
Yes
i) Primary prevention
ii) Health promotion
iii) Early detection/screening
iv) Health care and treatment
v) Surveillance, monitoring and evaluation
vi) Capacity-building
vii) Palliative care
No Don’t know IF NO: Go to Question 2.
0 2-5 11 or more
Yes No Don’t know
Yes No Don’t know
Yes No Don’t know
Yes No Don’t know
Yes No Don’t know
Yes No Don’t know
Yes No Don’t know
1 6-10 Don’t know
1
2
I
If at least one Yes to above questions:
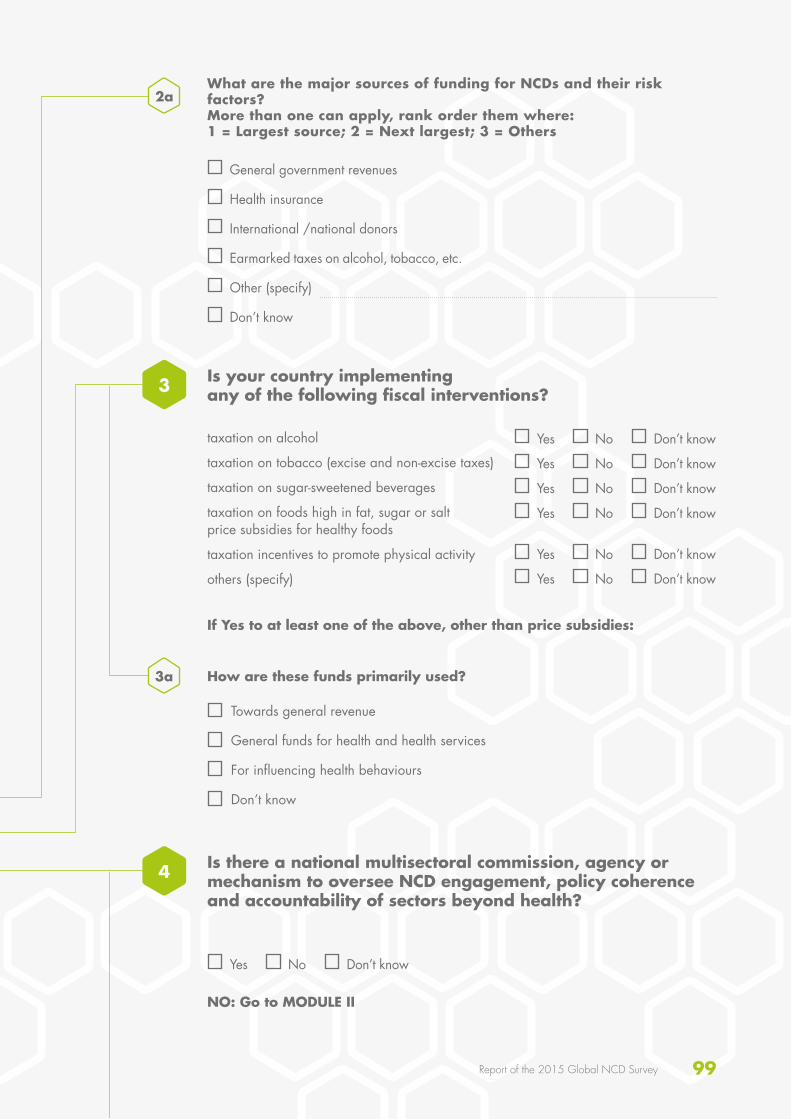
99Report of the 2015 Global NCD Survey
3a
Is your country implementing any of the following fiscal interventions?
Is there a national multisectoral commission, agency or mechanism to oversee NCD engagement, policy coherence and accountability of sectors beyond health?
3
4
2aWhat are the major sources of funding for NCDs and their risk factors? More than one can apply, rank order them where: 1 = Largest source; 2 = Next largest; 3 = Others
How are these funds primarily used?
NO: Go to MODULE II
General government revenues
Health insurance
International /national donors
Earmarked taxes on alcohol, tobacco, etc.
Other (specify)
Don’t know
taxation on alcohol
taxation on tobacco (excise and non-excise taxes)
taxation on sugar-sweetened beverages
taxation on foods high in fat, sugar or salt price subsidies for healthy foods
taxation incentives to promote physical activity
others (specify)
Towards general revenue
General funds for health and health services
For influencing health behaviours
Don’t know
Yes No Don’t know
Yes No Don’t know
Yes No Don’t know
Yes No Don’t know
Yes No Don’t know
Yes No Don’t know
Yes No Don’t know
If Yes to at least one of the above, other than price subsidies:
100
4b
4c
Which of the following are members?
Indicate its stage:
What settings are covered by the commission, agency or mechanism?
Other non-health government ministries (e.g.ministry of sport, ministry of education)
United Nations agencies
Other international institutions
Academia (including research centres)
Nongovernmental organizations/community-based organizations/civil society
Private sector
Other (specify)
Don’t know
Operational
Under development
Not in effect
Don’t know
(Check all that apply)
Schools
Worksites
Cities
Yes No Don’t know
Yes No Don’t know
Yes No Don’t know
4a
101Report of the 2015 Global NCD Survey
Please note that disease- and risk factor-specific policies, strategies, and action plans will be reported in other questions later in this module.
Are NCDs included in your national development agenda?
Are there a set of time-bound national targets for these indicators?
Yes
Yes
Yes
Yes
No
No
No
No
Don’t know
Don’t know
Don’t know
Don’t know
STATUS OF NCD-RELEVANT POLICIES, STRATEGIES, AND ACTION PLANS
The questions in this module relate to the presence of policies, strategies, or action plans. Questions differentiate between integrated policies/strategies/action plans that address several risk factors or diseases, and policies/strategies/action plans that address a specific disease or risk factor. Additional questions address the existence of specific policies related to the cost-effective interventions for NCDs. Responses to these questions enable reporting against NCD Global Action Plan process indicators and UN High-level Meeting national commitment progress indicators.
Are NCDs included in your national health plan?
Yes No Don’t know
II
IIa
1a
1b
2a
Are there a set of national NCD indicators?
Does your country have a national NCD policy, strategy or action plan which integrates several NCDs and their risk factors?
IF Yes:
IF NO: Go to Question 4
2
3
INTEGRATED POLICIES, STRATEGIES, AND ACTION PLANS
102
Does it combine early detection, treatment and care for:
Does it include palliative care for patients with NCDs?
Cancer
Cardiovascular diseases
Chronic respiratory diseases
Diabetes
Yes No Don’t know
Yes No Don’t know
Yes No Don’t know
Yes No Don’t know
Yes No Don’t know
3c
3d
3eIndicate its stage:
Operational
Under development
Not in effect
Don’t know
If Operational:
3e-i) What was the first year of implementation?
3e-ii) What year will it expire?
Please provide the following information about the policy, strategy or action plan:
Title:
Does it address one or more of the following major risk factors?
Harmful use of alcohol
Unhealthy diet
Physical inactivity
Tobacco
Yes No Don’t know
Yes No Don’t know
Yes No Don’t know
Yes No Don’t know
3a
3b
Is it a policy/strategy?
Is it an action plan?
Is it multisectoral?
Is it multistakeholder?
Yes No Don’t know
Yes No Don’t know
Yes No Don’t know
Yes No Don’t know
IF Yes:
103Report of the 2015 Global NCD Survey
Indicate its stage:
Operational
Under development
Not in effect
Don’t know
Yes for all cancers or cancer in general
Yes but only for specific cancers (specify: )
No
Don’t Know
If Operational:
4b-i) What was the first year of implementation?
4b-ii) What year will it expire?
IIbPOLICIES, STRATEGIES, ACTION PLANS FOR MAJOR DISEASES
4
5
The questions in this sub-section only refer to policies, strategies and action plans that are specific to a major NCD. If your integrated policy, strategy or action plan addresses the NCD, you do not need to re-enter that information.
Write the title 4a
4b
Is it a policy/strategy?
Is it an action plan?
Yes No Don’t know
Yes No Don’t know
IF Yes:
Is there a policy, strategy, or action plan for cardiovascular diseases in your country?
Is there a policy, strategy, or action plan for cancer or someparticular cancer types in your country?
Yes No Don’t know IF NO: Go to Question 5
IF NO: Go to Question 6
104
Is it a policy/strategy?
Is it an action plan?
Yes No Don’t know
Yes No Don’t know
If yes, provide the following for the general cancer policy/strategy/action plan or, if there isn’t one, for the most important specific cancer policy/strategy/action plan:
Indicate its stage:
Operational
Under development
Not in effect
Don’t know
If Operational:
5b-i) What was the first year of implementation?
5b-ii) What year will it expire?
Write the title 5a
6a
5b
6bIndicate its stage:
Operational
Under development
Not in effect
Don’t know
If Operational:
6b-i) What was the first year of implementation?
6b-ii) What year will it expire?
Write the title
Is it a policy/strategy?
Is it an action plan?
Yes No Don’t know
Yes No Don’t know
IF Yes:
Is there a policy, strategy, or action plan for diabetes in your country?
Yes No Don’t know IF NO: Go to Question 7
6

105Report of the 2015 Global NCD Survey
7a
7b
8a
Indicate its stage:
Operational
Under development
Not in effect
Don’t know
If Operational:
7b-i) What was the first year of implementation?
7b-ii) What year will it expire?
Write the title
Is it a policy/strategy?
Is it an action plan?
Is it a policy/strategy?
Is it an action plan?
Yes No Don’t know
Yes No Don’t know
Yes No Don’t know
Yes No Don’t know
IF Yes:
IF Yes:
Is there a policy, strategy, or action plan for chronic respiratory diseases in your country?
Is there a policy, strategy, or action plan for another non-communicable disease of importance in your country?
Yes
Yes
No
No
Don’t know
Don’t know
IF NO: Go to Question 8
IF NO: Go to Question 9
7
8
Please provide the following information about the policy/strategy /action plan. If there is more than one, please provide the information for the most recent one.
Write the title
Please specify which NCD:
106
Indicate its stage:
Operational
Under development
Not in effect
Don’t know
If Operational:
8b-i) What was the first year of implementation?
8b-ii) What year will it expire?
8b
Indicate its stage:
Operational
Under development
Not in effect
Don’t know
If Operational:
9b-i) What was the first year of implementation?
9b-ii) What year will it expire?
POLICIES, ACTION PLANS, STRATEGIES FOR NCD RISK FACTORS
The questions in this sub-section only refer to policies, strategies and action plans that are specific to an NCD risk factor. If your integrated policy, strategy or action plan addresses the risk factor, you do not need to re-enter that information.
Write the title
Is it a policy/strategy?
Is it an action plan?
Yes No Don’t know
Yes No Don’t know
IF yes:
Is there a policy, strategy, or action plan for for reducing the harmful use of alcohol in your country?
Yes No Don’t know IF NO: Go to Question 10
IIc
9a
9b
9
107Report of the 2015 Global NCD Survey
10a
11a
10b
11b
10
11
Indicate its stage:
Indicate its stage:
Operational
Under development
Not in effect
Don’t know
Operational
Under development
Not in effect
Don’t know
If Operational:
If Operational:
10 b-i) What was the first year of implementation?
11 b-i) What was the first year of implementation?
10 b-ii) What year will it expire?
11 b-ii) What year will it expire?
Write the title
Write the title
Is it a policy/strategy?
Is it an action plan?
Is it a policy/strategy?
Is it an action plan?
Yes No Don’t know
Yes No Don’t know
Yes No Don’t know
Yes No Don’t know
IF yes:
IF yes:
Is there a policy, strategy, or action plan for reducing overweight/obesity in your country?
Is there a policy, strategy, or action plan for reducing physical inactivity and/or promoting physical activity in your country?
Yes
Yes
No
No
Don’t know
Don’t know
IF NO: Go to Question 11
IF NO: Go to Question 12
108
Indicate its stage:
Operational
Under development
Not in effect
Don’t know
If Operational:
12 b-i) What was the first year of implementation?
12 b-ii) What year will it expire?
Write the title
Is it a policy/strategy?
Is it an action plan?
Yes No Don’t know
Yes No Don’t know
IF yes:
Is there a policy, strategy, or action plan to decrease tobacco use in your country?
Yes No Don’t know IF NO: Go to Question 13
12a
12b
12
Indicate its stage:
Operational
Under development
Not in effect
Don’t know
If Operational:
13 b-i) What was the first year of implementation?
13 b-ii) What year will it expire?
Write the title
Is it a policy/strategy?
Is it an action plan?
Yes No Don’t know
Yes No Don’t know
IF yes:
Is there a policy, strategy, or action plan for reducing unhealthy diet related to NCD and/or promoting a healthy diet in your country?
Yes No Don’t know IF NO: Go to Question 14
13a
13b
13
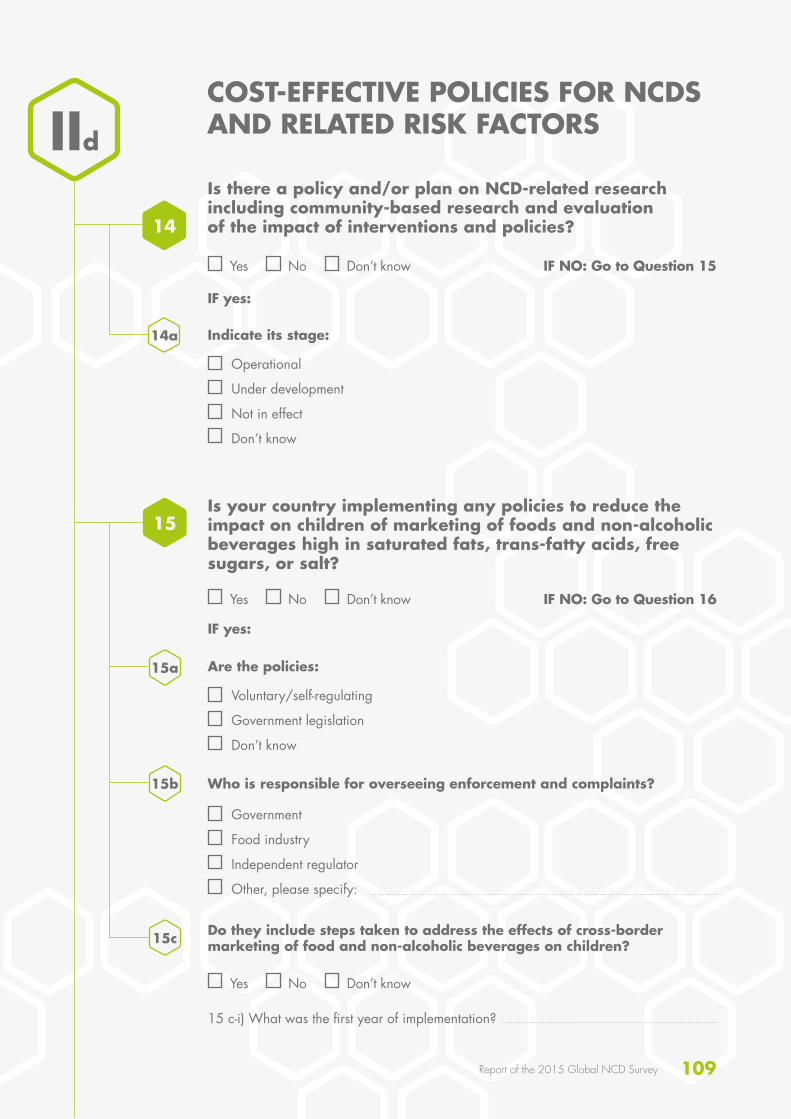
109Report of the 2015 Global NCD Survey
Indicate its stage:
Operational
Under development
Not in effect
Don’t know
COST-EFFECTIVE POLICIES FOR NCDS AND RELATED RISK FACTORS
IF yes:
Is there a policy and/or plan on NCD-related research including community-based research and evaluation of the impact of interventions and policies?
Yes No Don’t know IF NO: Go to Question 15
14a
14
IId
Who is responsible for overseeing enforcement and complaints?
Government
Food industry
Independent regulator
Other, please specify:
15a
15b
15
Are the policies:
Voluntary/self-regulating
Government legislation
Don’t know
IF yes:
Is your country implementing any policies to reduce the impact on children of marketing of foods and non-alcoholic beverages high in saturated fats, trans-fatty acids, free sugars, or salt?
Yes No Don’t know
Do they include steps taken to address the effects of cross-border marketing of food and non-alcoholic beverages on children?
15 c-i) What was the first year of implementation?
15c
Yes No Don’t know
IF NO: Go to Question 16
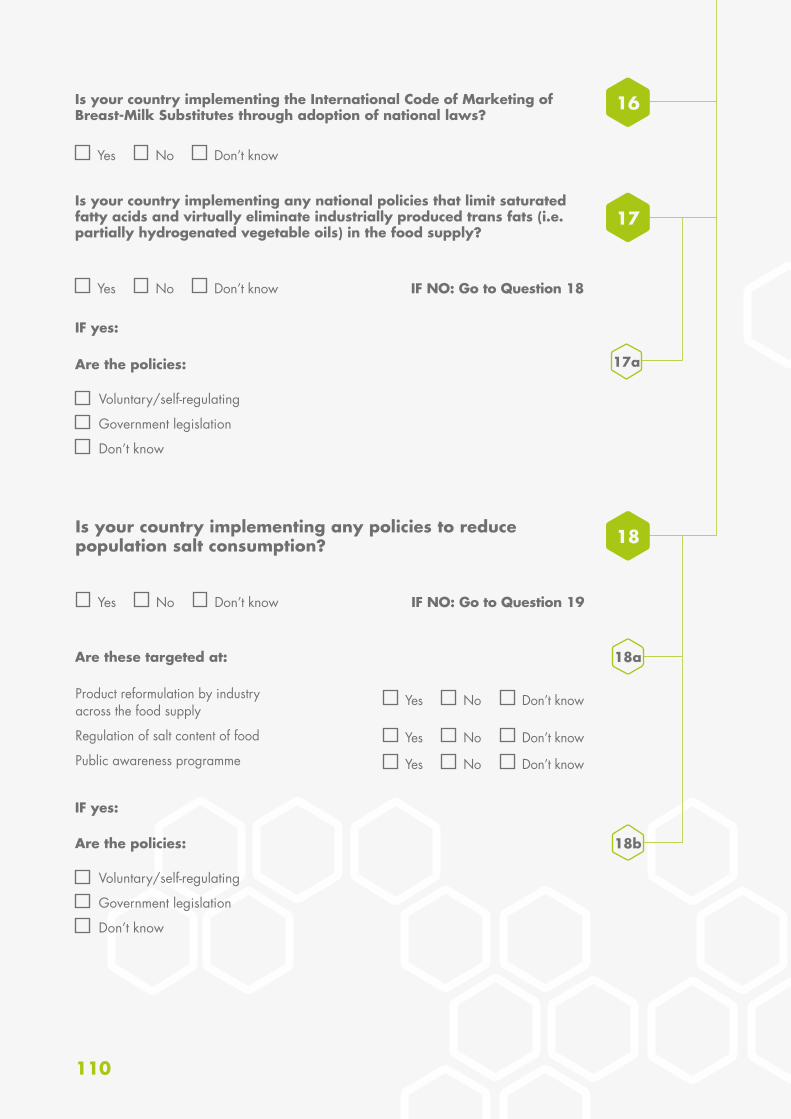
110
Is your country implementing the International Code of Marketing of Breast-Milk Substitutes through adoption of national laws?
Is your country implementing any national policies that limit saturated fatty acids and virtually eliminate industrially produced trans fats (i.e. partially hydrogenated vegetable oils) in the food supply?
17a
16
17
Are the policies:
Voluntary/self-regulating
Government legislation
Don’t know
IF yes:
Yes
Yes
No
No
Don’t know
Don’t know IF NO: Go to Question 18
Is your country implementing any policies to reduce population salt consumption?
Yes No Don’t know IF NO: Go to Question 19
Product reformulation by industry across the food supply
Regulation of salt content of food
Public awareness programme
Yes No Don’t know
Yes No Don’t know
Yes No Don’t know
Are these targeted at: 18a
18b
18
Are the policies:
Voluntary/self-regulating
Government legislation
Don’t know
IF yes:
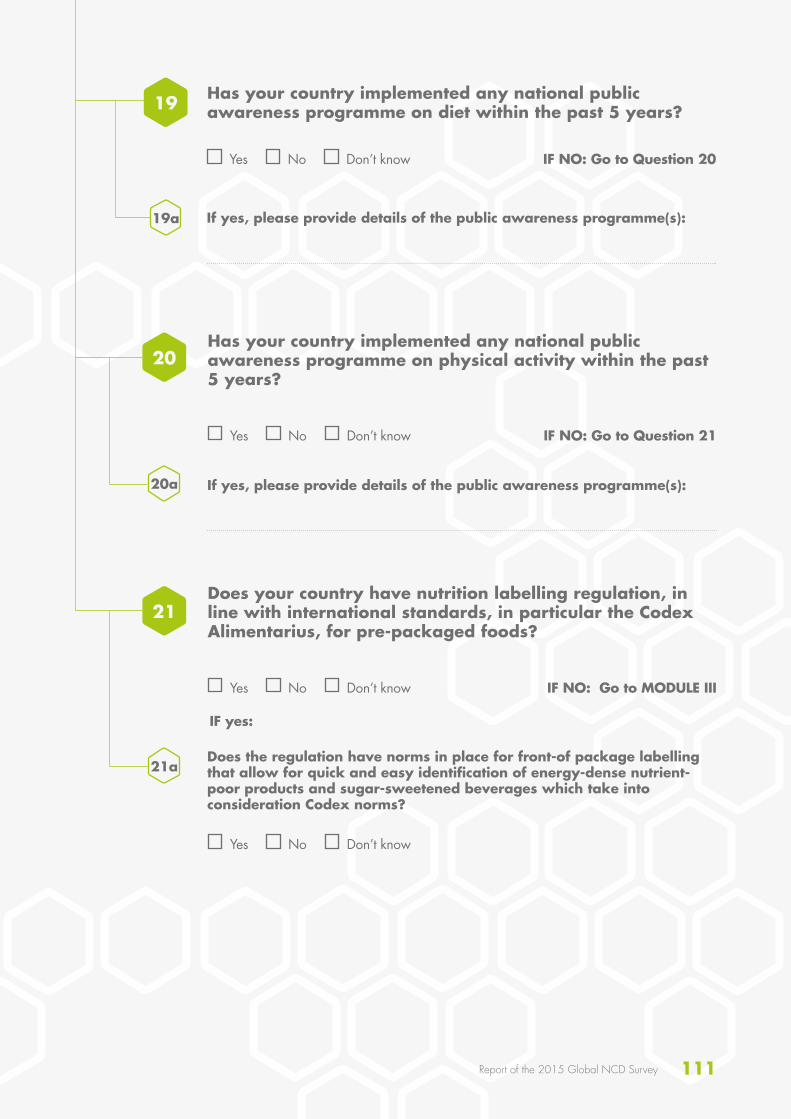
111Report of the 2015 Global NCD Survey
Has your country implemented any national public awareness programme on diet within the past 5 years?
Yes No Don’t know IF NO: Go to Question 20
If yes, please provide details of the public awareness programme(s):19a
19
Has your country implemented any national public awareness programme on physical activity within the past 5 years?
Yes No Don’t know IF NO: Go to Question 21
If yes, please provide details of the public awareness programme(s):20a
20
21a
Does your country have nutrition labelling regulation, in line with international standards, in particular the Codex Alimentarius, for pre-packaged foods?
Yes
Yes
No
No
Don’t know
Don’t know
IF NO: Go to MODULE III
Does the regulation have norms in place for front-of package labelling that allow for quick and easy identification of energy-dense nutrient-poor products and sugar-sweetened beverages which take into consideration Codex norms?
IF yes:
21
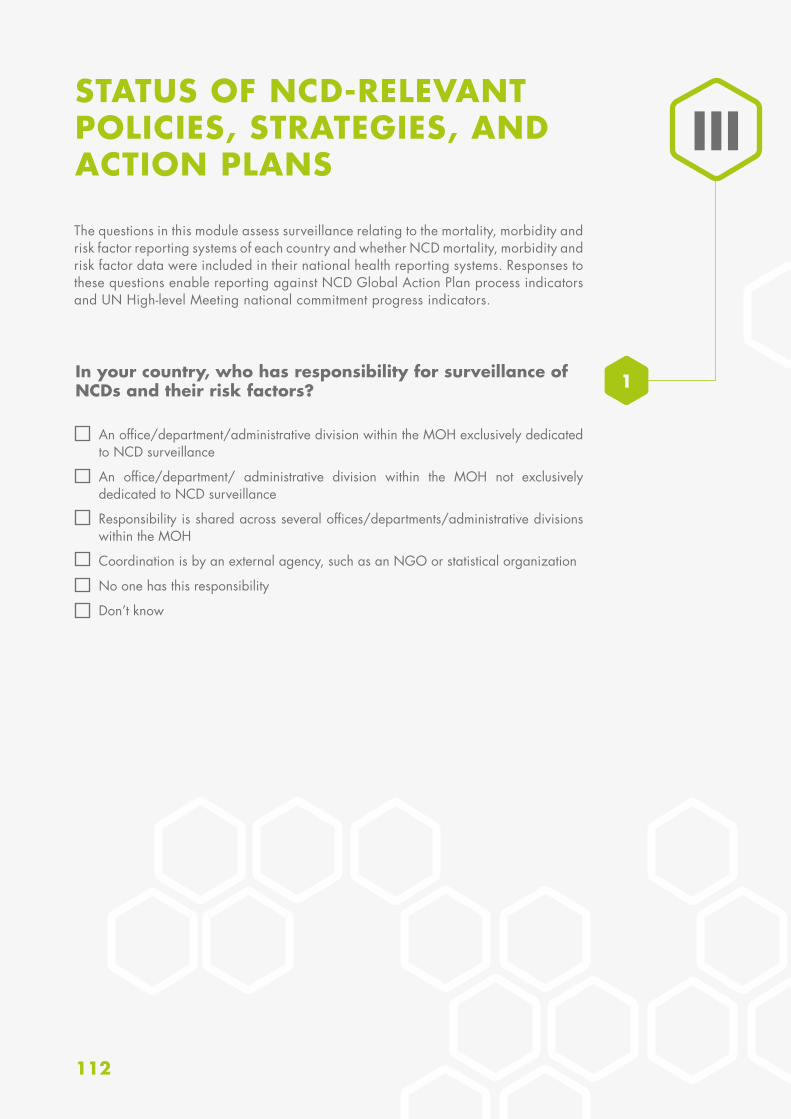
112
In your country, who has responsibility for surveillance of NCDs and their risk factors? 1
IIISTATUS OF NCD-RELEVANT POLICIES, STRATEGIES, AND ACTION PLANS
The questions in this module assess surveillance relating to the mortality, morbidity and risk factor reporting systems of each country and whether NCD mortality, morbidity and risk factor data were included in their national health reporting systems. Responses to these questions enable reporting against NCD Global Action Plan process indicators and UN High-level Meeting national commitment progress indicators.
An office/department/administrative division within the MOH exclusively dedicated to NCD surveillance
An office/department/ administrative division within the MOH not exclusively dedicated to NCD surveillance
Responsibility is shared across several offices/departments/administrative divisions within the MOH
Coordination is by an external agency, such as an NGO or statistical organization
No one has this responsibility
Don’t know
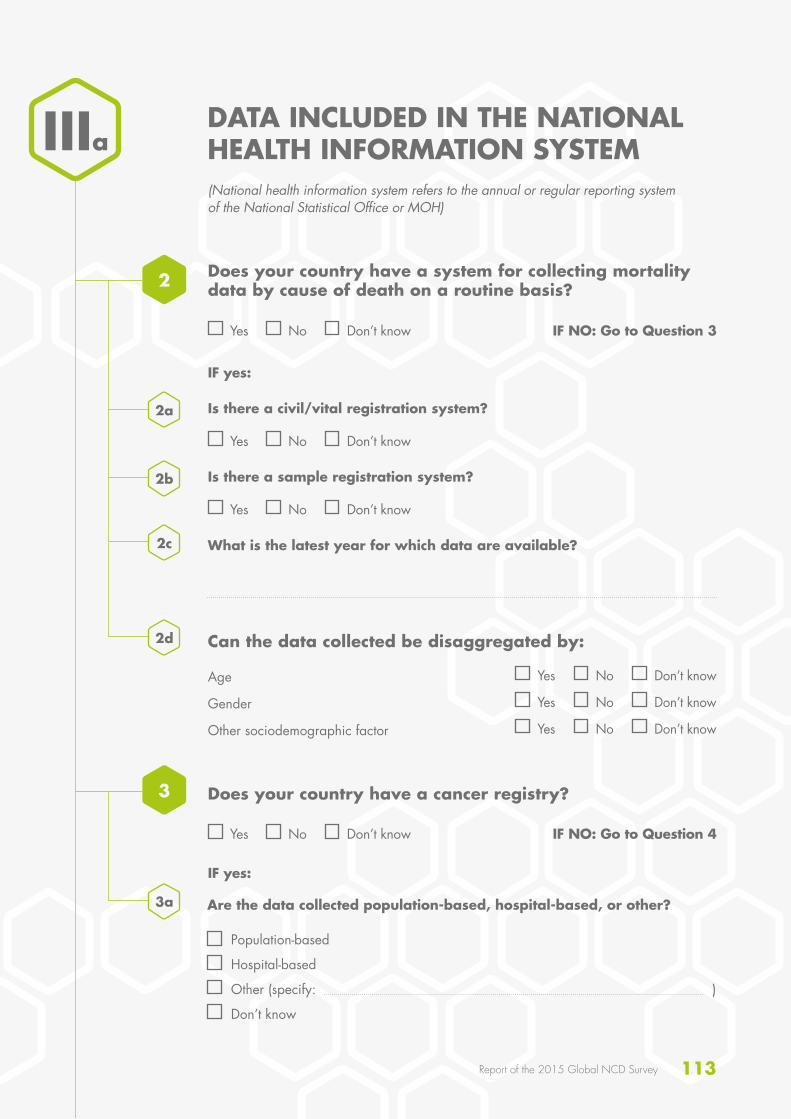
113Report of the 2015 Global NCD Survey
DATA INCLUDED IN THE NATIONAL HEALTH INFORMATION SYSTEM (National health information system refers to the annual or regular reporting system of the National Statistical Office or MOH)
Does your country have a system for collecting mortality data by cause of death on a routine basis?
Does your country have a cancer registry?
Is there a civil/vital registration system?
Is there a sample registration system?
What is the latest year for which data are available?
Yes
Yes
Yes
Yes
No
No
No
No
Don’t know
Don’t know
Don’t know
Don’t know
IF NO: Go to Question 3
IF NO: Go to Question 4
IF yes:
IF yes:
Can the data collected be disaggregated by:
Age
Gender
Other sociodemographic factor
Are the data collected population-based, hospital-based, or other?
Population-based
Hospital-based
Other (specify: )
Don’t know
Yes No Don’t know
Yes No Don’t know
Yes No Don’t know
IIIa
2a
3a
2b
2c
2d
2
3
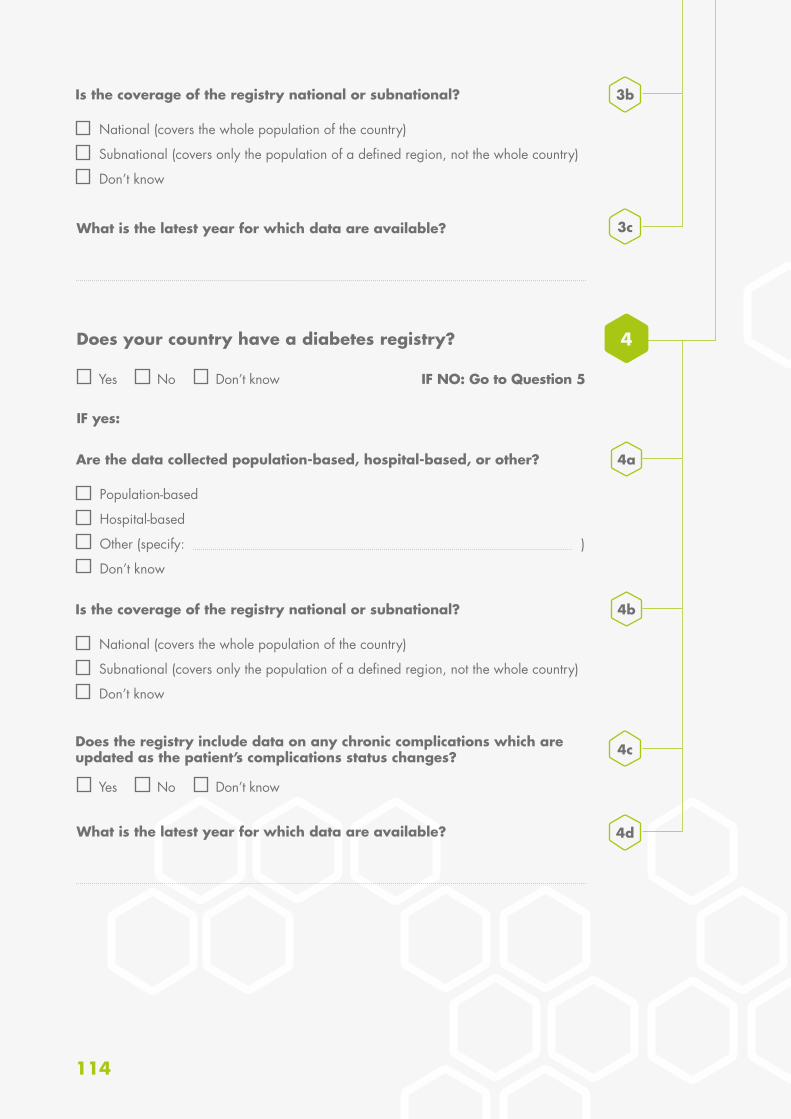
114
What is the latest year for which data are available?
What is the latest year for which data are available?
4a
4b
4d
3b
4c
3c
4
Is the coverage of the registry national or subnational?
Does the registry include data on any chronic complications which are updated as the patient’s complications status changes?
Is the coverage of the registry national or subnational?
National (covers the whole population of the country)
Subnational (covers only the population of a defined region, not the whole country)
Don’t know
National (covers the whole population of the country)
Subnational (covers only the population of a defined region, not the whole country)
Don’t know
Does your country have a diabetes registry?
Yes
Yes
No
No
Don’t know
Don’t know
IF NO: Go to Question 5
IF yes:
Are the data collected population-based, hospital-based, or other?
Population-based
Hospital-based
Other (specify: )
Don’t know
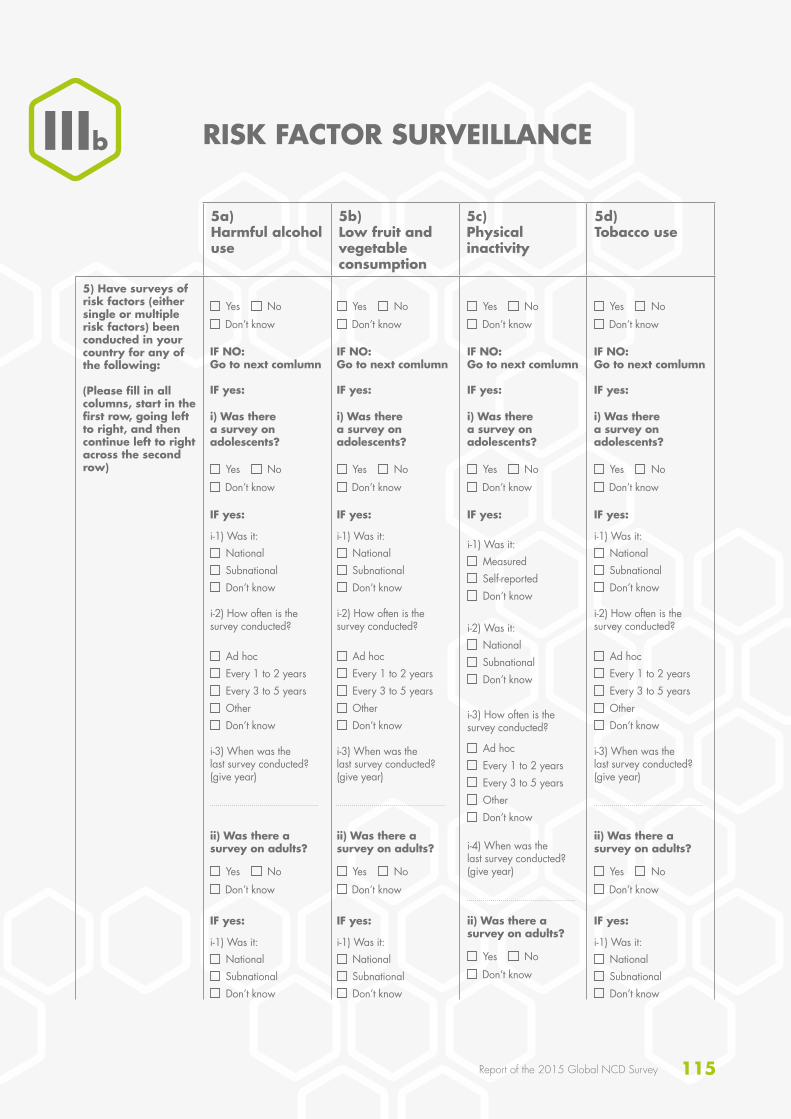
115Report of the 2015 Global NCD Survey
IIIb RISK FACTOR SURVEILLANCE
5a) Harmful alcohol use
5b) Low fruit and vegetable consumption
5c) Physical inactivity
5d) Tobacco use
5) Have surveys of risk factors (either single or multiple risk factors) been conducted in your country for any of the following:
(Please fill in all columns, start in the first row, going left to right, and then continue left to right across the second row)
No No NoNo
Don’t know Don’t know Don’t knowDon’t know
Yes Yes YesYes
National SubnationalDon’t know
National SubnationalDon’t know
National SubnationalDon’t know
National SubnationalDon’t know
MeasuredSelf-reportedDon’t know
National SubnationalDon’t know
National SubnationalDon’t know
National SubnationalDon’t know
i-1) Was it: i-1) Was it: i-1) Was it:
i-2) Was it:
i-1) Was it:
i-1) Was it: i-1) Was it: i-1) Was it:
i-3) When was the last survey conducted? (give year)
i-3) When was the last survey conducted? (give year)
i-3) When was the last survey conducted? (give year)
i-4) When was the last survey conducted? (give year)
Ad hocEvery 1 to 2 yearsEvery 3 to 5 yearsOtherDon’t know
Ad hocEvery 1 to 2 yearsEvery 3 to 5 yearsOtherDon’t know
Ad hocEvery 1 to 2 yearsEvery 3 to 5 yearsOtherDon’t know
Ad hocEvery 1 to 2 yearsEvery 3 to 5 yearsOtherDon’t know
i-2) How often is the survey conducted?
i-2) How often is the survey conducted?
i-2) How often is the survey conducted?
i-3) How often is the survey conducted?
No
Don’t know
Yes No
Don’t know
Yes No
Don’t know
YesNo
Don’t know
Yes
No
Don’t know
Yes No
Don’t know
Yes No
Don’t know
Yes
No
Don’t know
Yes
IF NO: Go to next comlumn
IF yes:
IF NO: Go to next comlumn
IF yes:
IF NO: Go to next comlumn
IF yes:
IF NO: Go to next comlumn
IF yes:
IF yes: IF yes: IF yes:IF yes:
IF yes: IF yes: IF yes:
i) Was there a survey on adolescents?
i) Was there a survey on adolescents?
i) Was there a survey on adolescents?
i) Was there a survey on adolescents?
ii) Was there a survey on adults?
ii) Was there a survey on adults?
ii) Was there a survey on adults?
ii) Was there a survey on adults?
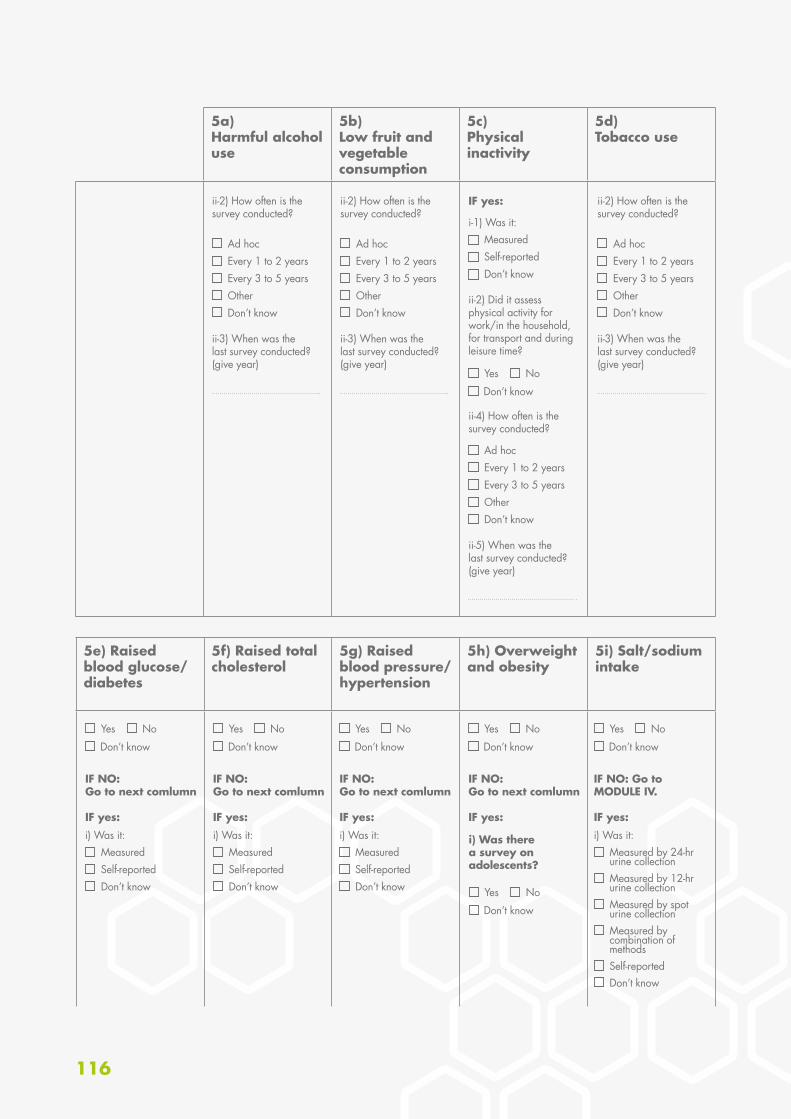
116
5e) Raised blood glucose/diabetes
5f) Raised total cholesterol
5g) Raised blood pressure/hypertension
5h) Overweight and obesity
5i) Salt/sodium intake
5a) Harmful alcohol use
5b) Low fruit and vegetable consumption
5c) Physical inactivity
5d) Tobacco use
No No No No No
Don’t know Don’t know Don’t know Don’t know Don’t know
Yes Yes Yes Yes Yes
MeasuredSelf-reportedDon’t know
MeasuredSelf-reportedDon’t know
MeasuredSelf-reportedDon’t know
Measured by 24-hr urine collectionMeasured by 12-hr urine collectionMeasured by spot urine collectionMeasured by combination of methodsSelf-reportedDon’t know
i) Was it: i) Was it: i) Was it: i) Was it:
ii-3) When was the last survey conducted? (give year)
ii-3) When was the last survey conducted? (give year)
ii-5) When was the last survey conducted? (give year)
ii-3) When was the last survey conducted? (give year)
Ad hocEvery 1 to 2 yearsEvery 3 to 5 yearsOtherDon’t know
Ad hocEvery 1 to 2 yearsEvery 3 to 5 yearsOtherDon’t know
Ad hocEvery 1 to 2 yearsEvery 3 to 5 yearsOtherDon’t know
Ad hocEvery 1 to 2 yearsEvery 3 to 5 yearsOtherDon’t know
ii-2) How often is the survey conducted?
ii-2) How often is the survey conducted?
ii-4) How often is the survey conducted?
ii-2) How often is the survey conducted?
No
Don’t know
Yes
IF NO: Go to next comlumn
IF yes:
IF NO: Go to next comlumn
IF yes:
IF NO: Go to next comlumn
IF yes:
IF NO: Go to next comlumn
IF yes:
IF NO: Go to MODULE IV.
IF yes:
MeasuredSelf-reportedDon’t know
i-1) Was it:
IF yes:
i) Was there a survey on adolescents?
ii-2) Did it assess physical activity for work/in the household, for transport and during leisure time?
No
Don’t know
Yes
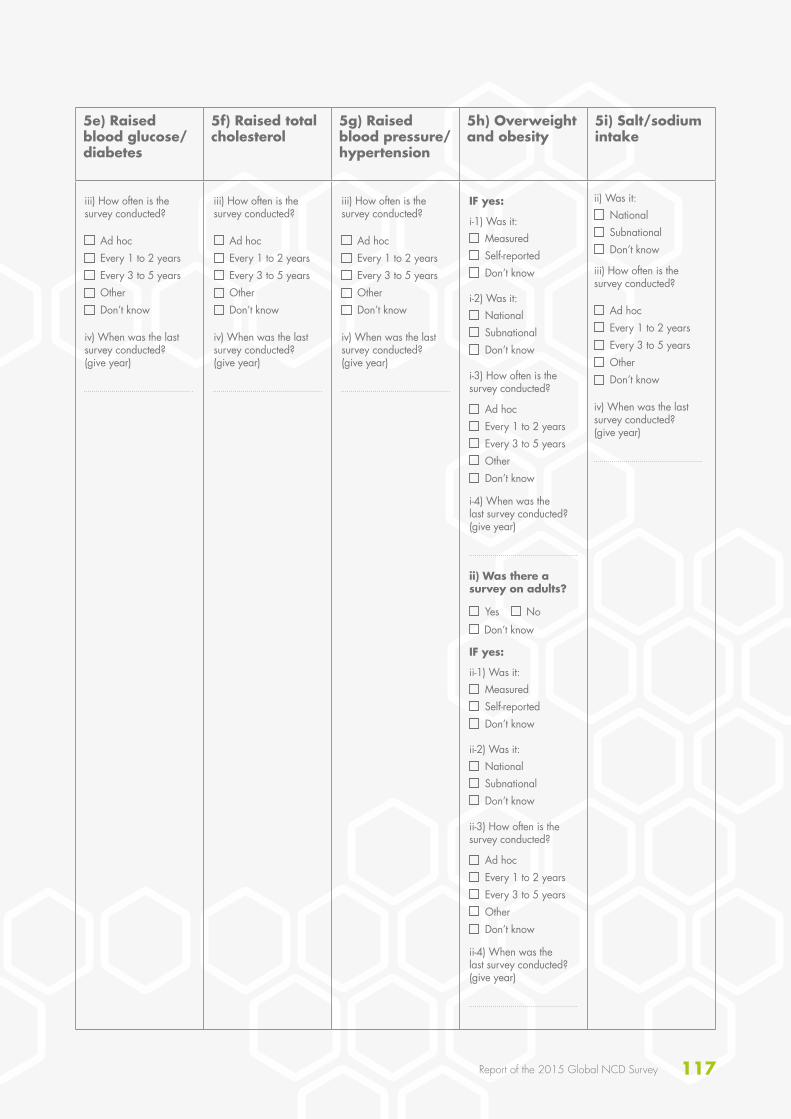
117Report of the 2015 Global NCD Survey
5e) Raised blood glucose/diabetes
5f) Raised total cholesterol
5g) Raised blood pressure/hypertension
5h) Overweight and obesity
5i) Salt/sodium intake
Ad hocEvery 1 to 2 yearsEvery 3 to 5 yearsOther Don’t know
Ad hocEvery 1 to 2 yearsEvery 3 to 5 yearsOther Don’t know
Ad hocEvery 1 to 2 yearsEvery 3 to 5 yearsOther Don’t know Ad hoc
Every 1 to 2 yearsEvery 3 to 5 yearsOther Don’t know
iii) How often is the survey conducted?
iii) How often is the survey conducted?
iii) How often is the survey conducted?
iii) How often is the survey conducted?
iv) When was the last survey conducted? (give year)
iv) When was the last survey conducted? (give year)
iv) When was the last survey conducted? (give year)
iv) When was the last survey conducted? (give year)
National SubnationalDon’t know
National SubnationalDon’t know
MeasuredSelf-reportedDon’t know
MeasuredSelf-reportedDon’t know
i-2) Was it:
ii-2) Was it:
i-1) Was it:
ii-1) Was it:
i-4) When was the last survey conducted? (give year)
ii-4) When was the last survey conducted? (give year)
Ad hocEvery 1 to 2 yearsEvery 3 to 5 yearsOtherDon’t know
Ad hocEvery 1 to 2 yearsEvery 3 to 5 yearsOtherDon’t know
i-3) How often is the survey conducted?
ii-3) How often is the survey conducted?
No
Don’t know
Yes
IF yes:
IF yes:
ii) Was there a survey on adults?
National SubnationalDon’t know
ii) Was it:
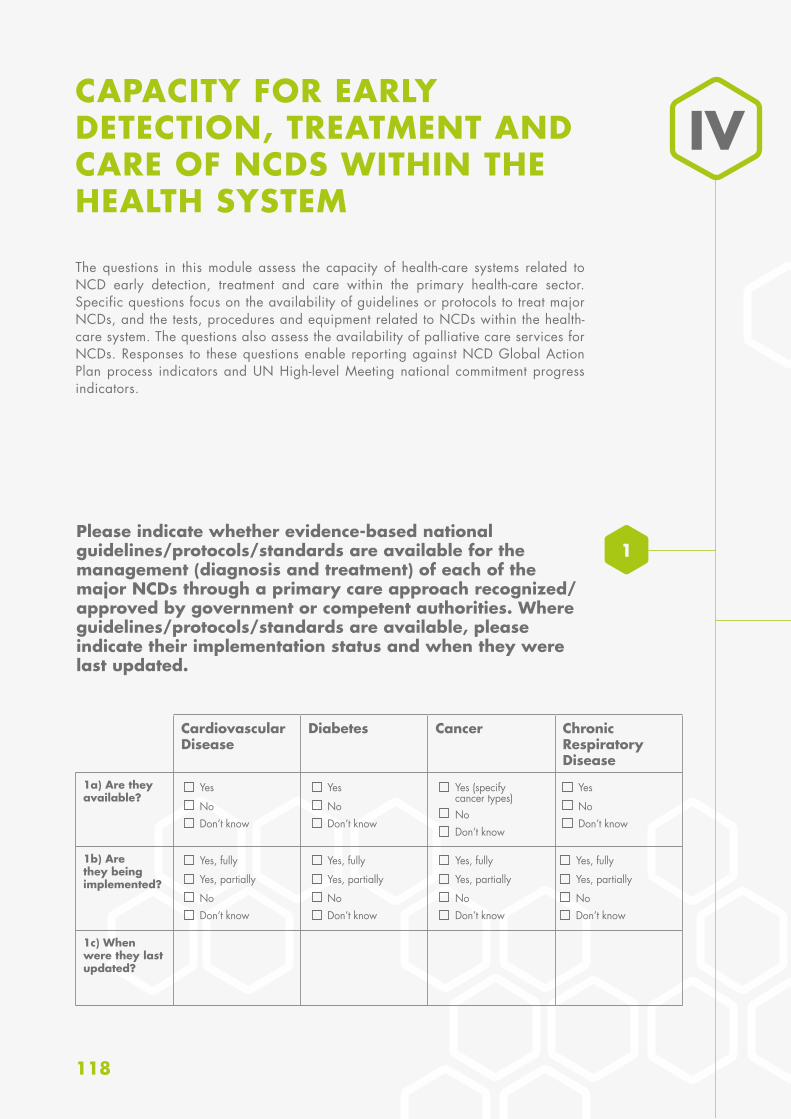
118
NoDon’t know
Yes
NoDon’t know
Yes (specify cancer types)
NoDon’t know
Yes
NoDon’t know
Yes
NoDon’t know
Yes, fully
Yes, partially
NoDon’t know
Yes, fully
Yes, partially
NoDon’t know
Yes, fully
Yes, partially
NoDon’t know
Yes, fully
Yes, partially
CAPACITY FOR EARLY DETECTION, TREATMENT AND CARE OF NCDS WITHIN THE HEALTH SYSTEM
The questions in this module assess the capacity of health-care systems related to NCD early detection, treatment and care within the primary health-care sector. Specific questions focus on the availability of guidelines or protocols to treat major NCDs, and the tests, procedures and equipment related to NCDs within the health-care system. The questions also assess the availability of palliative care services for NCDs. Responses to these questions enable reporting against NCD Global Action Plan process indicators and UN High-level Meeting national commitment progress indicators.
IV
1Please indicate whether evidence-based national guidelines/protocols/standards are available for the management (diagnosis and treatment) of each of the major NCDs through a primary care approach recognized/approved by government or competent authorities. Where guidelines/protocols/standards are available, please indicate their implementation status and when they were last updated.
Cardiovascular Disease
Diabetes Cancer Chronic Respiratory Disease
1a) Are they available?
1b) Are they being implemented?
1c) When were they last updated?
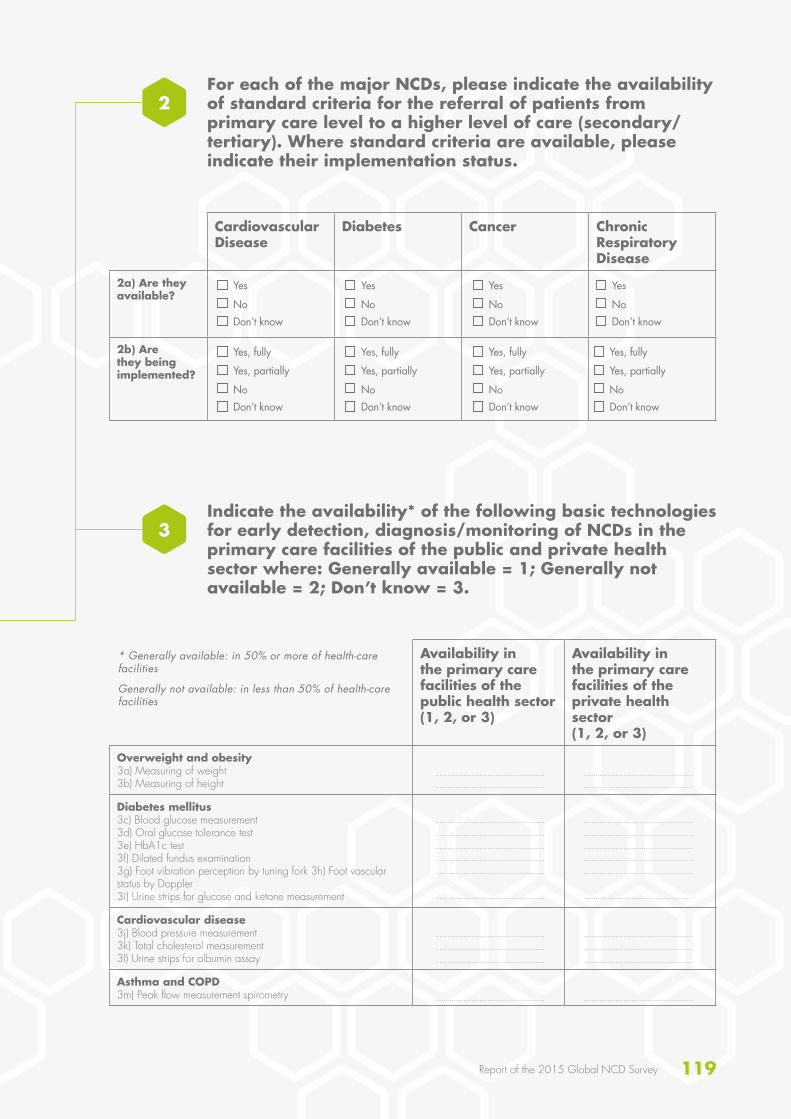
119Report of the 2015 Global NCD Survey
NoDon’t know
Yes
NoDon’t know
Yes
NoDon’t know
Yes
NoDon’t know
Yes
NoDon’t know
Yes, fully
Yes, partially
NoDon’t know
Yes, fully
Yes, partially
NoDon’t know
Yes, fully
Yes, partially
NoDon’t know
Yes, fully
Yes, partially
For each of the major NCDs, please indicate the availability of standard criteria for the referral of patients from primary care level to a higher level of care (secondary/tertiary). Where standard criteria are available, please indicate their implementation status.
Indicate the availability* of the following basic technologies for early detection, diagnosis/monitoring of NCDs in the primary care facilities of the public and private health sector where: Generally available = 1; Generally not available = 2; Don’t know = 3.
Cardiovascular Disease
Diabetes Cancer Chronic Respiratory Disease
2a) Are they available?
2b) Are they being implemented?
Availability in the primary care facilities of the public health sector(1, 2, or 3)
Availability in the primary care facilities of the private health sector (1, 2, or 3)
Overweight and obesity3a) Measuring of weight3b) Measuring of height
Diabetes mellitus3c) Blood glucose measurement3d) Oral glucose tolerance test3e) HbA1c test3f) Dilated fundus examination3g) Foot vibration perception by tuning fork 3h) Foot vascular status by Doppler3i) Urine strips for glucose and ketone measurement
Cardiovascular disease3j) Blood pressure measurement3k) Total cholesterol measurement3l) Urine strips for albumin assay
Asthma and COPD3m) Peak flow measurement spirometry
* Generally available: in 50% or more of health-care facilities
Generally not available: in less than 50% of health-care facilities
2
3
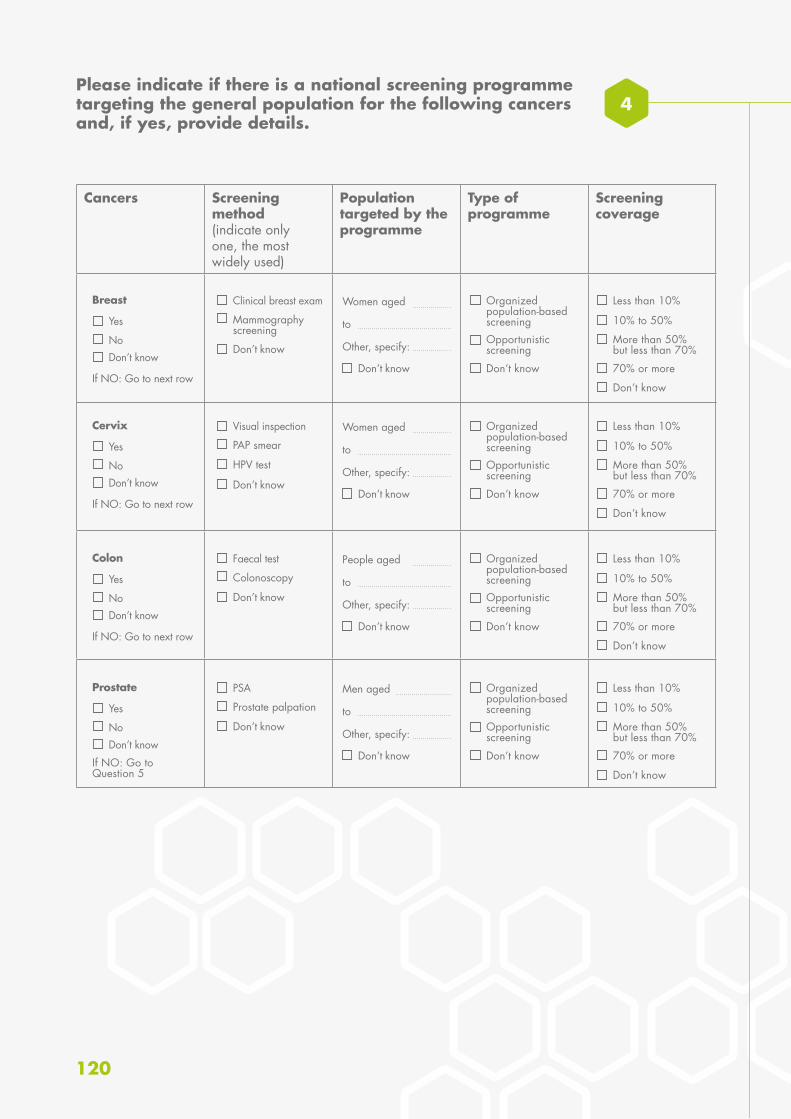
120
Please indicate if there is a national screening programme targeting the general population for the following cancers and, if yes, provide details.
4
Cancers Screening method (indicate only one, the most widely used)
Population targeted by the programme
Type of programme
Screening coverage
NoDon’t know
Yes
Breast
If NO: Go to next row
NoDon’t know
Yes
Cervix
If NO: Go to next row
NoDon’t know
Yes
Colon
If NO: Go to next row
NoDon’t know
Yes
Prostate
If NO: Go to Question 5
Mammography screening
PAP smear
Colonoscopy
Prostate palpation
Don’t know
HPV test
Don’t know
Don’t know
Don’t know
Don’t know
Don’t know
Don’t know
Don’t know
Don’t know
Don’t know
Don’t know
Don’t know
Less than 10%
Less than 10%
Less than 10%
Less than 10%
10% to 50%
10% to 50%
10% to 50%
10% to 50%
70% or more
70% or more
70% or more
70% or more
Don’t know
Don’t know
Don’t know
Don’t know
More than 50% but less than 70%
More than 50% but less than 70%
More than 50% but less than 70%
More than 50% but less than 70%
Opportunistic screening
Opportunistic screening
Opportunistic screening
Opportunistic screening
Organized population-based screening
Organized population-based screening
Organized population-based screening
Organized population-based screening
Clinical breast exam
Visual inspection
Faecal test
PSA
Women aged
to
Other, specify:
Women aged
to
Other, specify:
People aged
to
Other, specify:
Men aged
to
Other, specify:
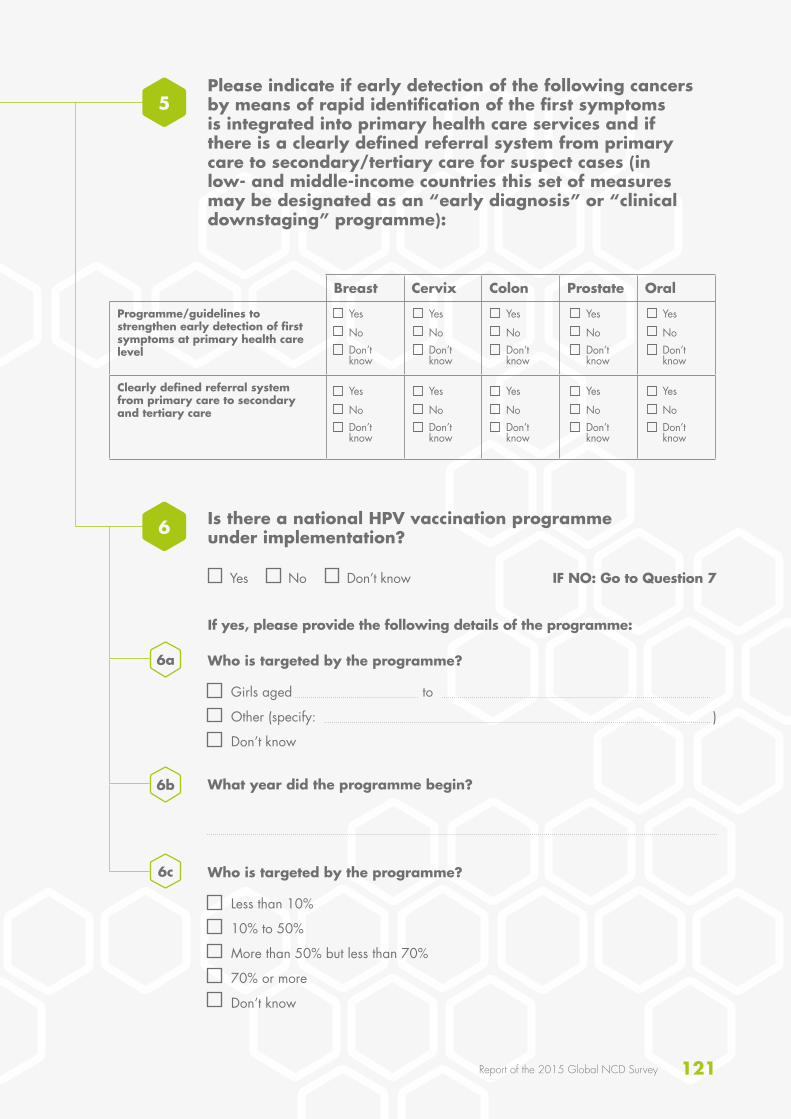
121Report of the 2015 Global NCD Survey
Breast Cervix Colon Prostate Oral
Programme/guidelines to strengthen early detection of first symptoms at primary health care level
Clearly defined referral system from primary care to secondary and tertiary care
NoDon’t know
Yes
NoDon’t know
Yes
NoDon’t know
Yes
NoDon’t know
Yes
NoDon’t know
Yes
NoDon’t know
Yes
NoDon’t know
Yes
NoDon’t know
Yes
NoDon’t know
Yes
NoDon’t know
Yes
Please indicate if early detection of the following cancers by means of rapid identification of the first symptoms is integrated into primary health care services and if there is a clearly defined referral system from primary care to secondary/tertiary care for suspect cases (in low- and middle-income countries this set of measures may be designated as an “early diagnosis” or “clinical downstaging” programme):
Is there a national HPV vaccination programme under implementation?
Who is targeted by the programme?
Who is targeted by the programme?
What year did the programme begin?
Yes No Don’t know IF NO: Go to Question 7
If yes, please provide the following details of the programme:
Girls aged to
Other (specify: )
Don’t know
Less than 10%
10% to 50%
More than 50% but less than 70%
70% or more
Don’t know
5
6
6a
6b
6c
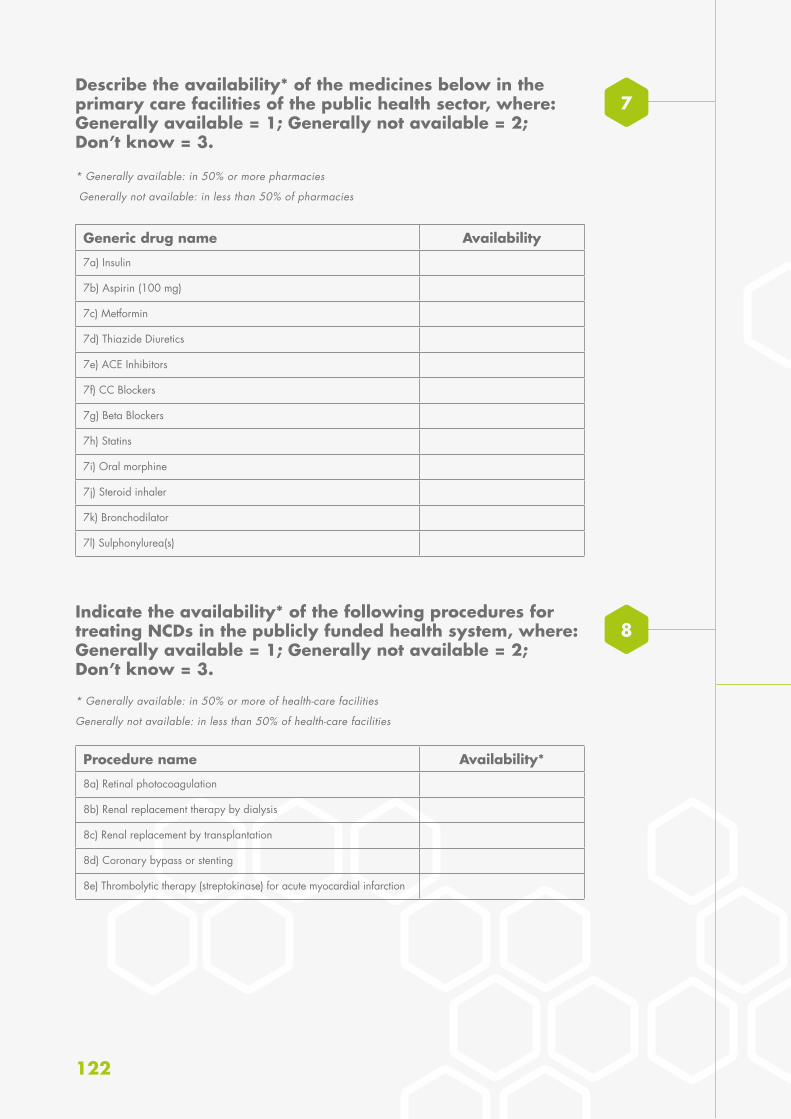
122
Describe the availability* of the medicines below in the primary care facilities of the public health sector, where: Generally available = 1; Generally not available = 2; Don’t know = 3.
Indicate the availability* of the following procedures for treating NCDs in the publicly funded health system, where: Generally available = 1; Generally not available = 2; Don’t know = 3.
7
8
* Generally available: in 50% or more pharmacies
Generally not available: in less than 50% of pharmacies
* Generally available: in 50% or more of health-care facilities
Generally not available: in less than 50% of health-care facilities
Generic drug name Availability
7a) Insulin
7b) Aspirin (100 mg)
7c) Metformin
7d) Thiazide Diuretics
7e) ACE Inhibitors
7f) CC Blockers
7g) Beta Blockers
7h) Statins
7i) Oral morphine
7j) Steroid inhaler
7k) Bronchodilator
7l) Sulphonylurea(s)
Procedure name Availability*
8a) Retinal photocoagulation
8b) Renal replacement therapy by dialysis
8c) Renal replacement by transplantation
8d) Coronary bypass or stenting
8e) Thrombolytic therapy (streptokinase) for acute myocardial infarction
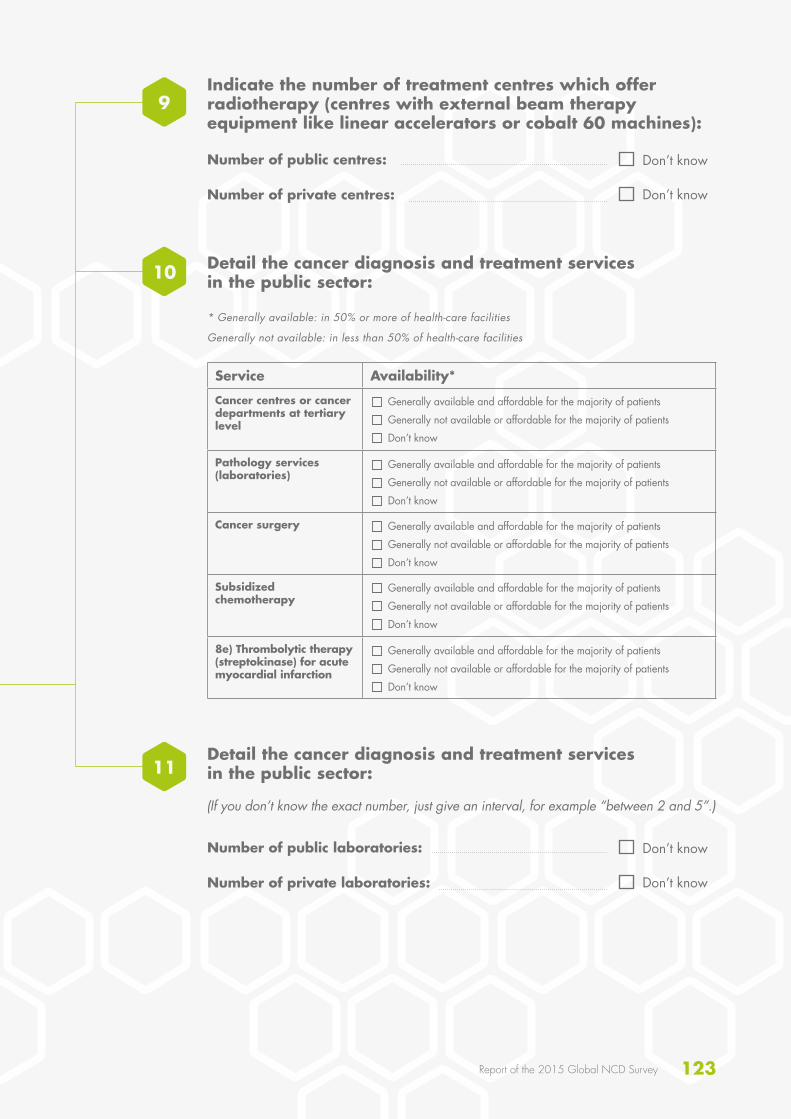
123Report of the 2015 Global NCD Survey
Indicate the number of treatment centres which offer radiotherapy (centres with external beam therapy equipment like linear accelerators or cobalt 60 machines):
Detail the cancer diagnosis and treatment services in the public sector:
Detail the cancer diagnosis and treatment services in the public sector:
Number of public centres:
Number of public laboratories:
Number of private centres:
Number of private laboratories:
Don’t know
Don’t know
Don’t know
Don’t know
* Generally available: in 50% or more of health-care facilities
Generally not available: in less than 50% of health-care facilities
Service Availability*
Cancer centres or cancer departments at tertiary level
Pathology services (laboratories)
Cancer surgery
Subsidized chemotherapy
8e) Thrombolytic therapy (streptokinase) for acute myocardial infarction
Generally available and affordable for the majority of patients
Generally not available or affordable for the majority of patients
Don’t know
Generally available and affordable for the majority of patients
Generally not available or affordable for the majority of patients
Don’t know
Generally available and affordable for the majority of patients
Generally not available or affordable for the majority of patients
Don’t know
Generally available and affordable for the majority of patients
Generally not available or affordable for the majority of patients
Don’t know
Generally available and affordable for the majority of patients
Generally not available or affordable for the majority of patients
Don’t know
9
11
10
(If you don’t know the exact number, just give an interval, for example “between 2 and 5”.)
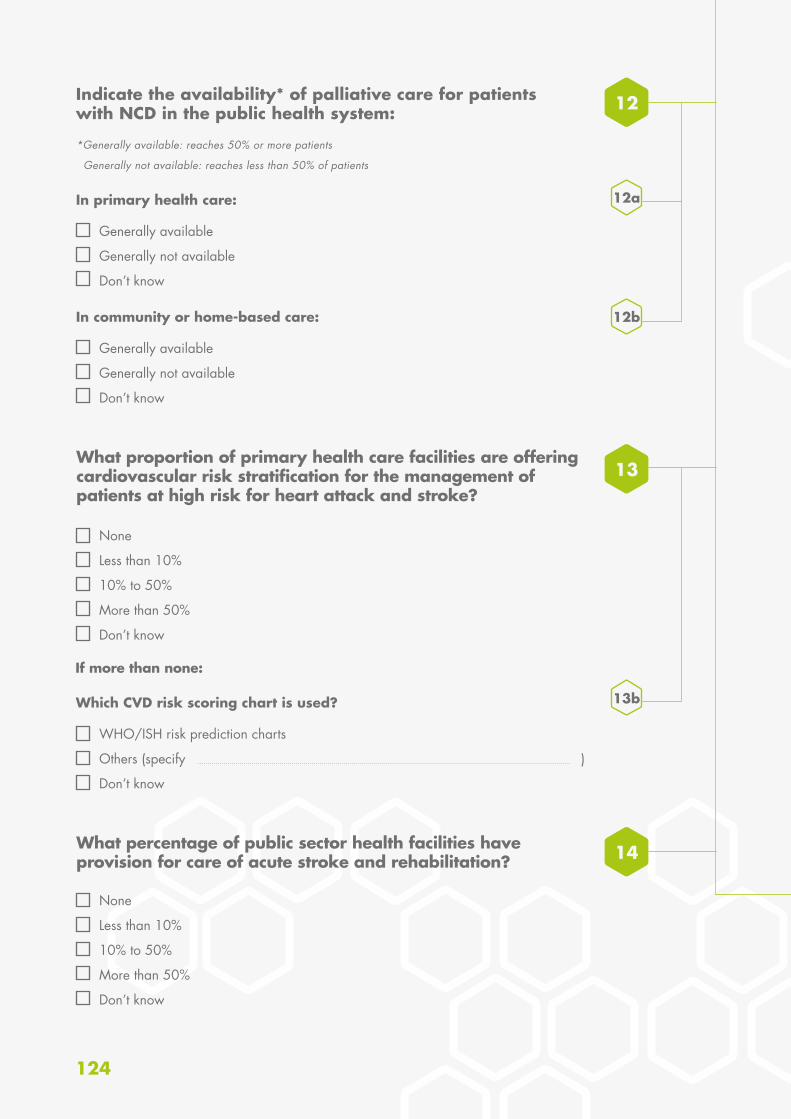
124
12Indicate the availability* of palliative care for patients with NCD in the public health system:
*Generally available: reaches 50% or more patients
Generally not available: reaches less than 50% of patients
In primary health care:
In community or home-based care:
Generally available
Generally not available
Don’t know
Generally available
Generally not available
Don’t know
12a
12b
13b
What proportion of primary health care facilities are offering cardiovascular risk stratification for the management of patients at high risk for heart attack and stroke?
What percentage of public sector health facilities have provision for care of acute stroke and rehabilitation?
13
14
Which CVD risk scoring chart is used?
None
Less than 10%
10% to 50%
More than 50%
Don’t know
None
Less than 10%
10% to 50%
More than 50%
Don’t know
WHO/ISH risk prediction charts
Others (specify )
Don’t know
If more than none:
125Report of the 2015 Global NCD Survey
What percentage of public sector health facilities have provision for secondary prevention of rheumatic fever and rheumatic heart disease?
None
Less than 10%
10% to 50%
More than 50%
Don’t know
15
126
ANNEX 4GLOSSARY OF TERMS USED IN THE SURVEY
Academia: Educational institutions, especially those for higher education.
Broadcast media: Media which is broadcast to the public through radio and television.
Cancer: A generic term for a large group of diseases that can affect any part of the body. Other terms used are malignant tumours and neoplasms. One defining feature of cancer is the rapid creation of abnormal cells that grow beyond their usual boundaries, and which can then invade adjoining parts of the body and spread to other organs.
Cancer registry: A systematic collection of data on cancer cases in a certain region or a certain hospital, the initial aim being to count the number of cancer cases to clarify the magnitude of the problem. WHO advises national coverage by population-based registry in small countries only.
Capacity-building: The development of knowledge, skills, commitment, structures, systems and leadership to enable effective action.
Cardiovascular disease: A group of disorders of the heart and blood vessels that includes coronary heart disease, cerebrovascular disease, peripheral arterial disease, rheumatic heart disease, congenital heart disease, deep vein thrombosis and pulmonary embolism.
Cardiovascular risk assessment: Use of risk prediction charts to indicate the risk of a fatal or non-fatal major cardiovascular event in the next 5–10 years. Based on the assessment, people can be stratified into different levels of risk which will helps in management and follow up.
Chronic respiratory diseases: Diseases of the airways and other structures of the lung, the most widespread being: asthma, chronic obstructive pulmonary disease, occupational lung diseases and pulmonary hypertension.
Civil registration: The system by which a government records the vital events of its citizens and residents, such as births, deaths and marital status, and cause of death.
Collaboration: A recognized relationship between different groups with a defined purpose.
Community: A specific group of people, often living in a defined geographical area, who share a common culture, values and norms and are arranged in a social structure according to relationships which the community has developed over a period of time. Members of a community exhibit some awareness of their identity as a group, and share common needs and a commitment to meeting them.
Cross-border marketing: Marketing originated in one country that crosses national borders through broadcast media and internet, print media, sponsorship of events and programmes or any other media or communication channel. It includes both in-flowing and out-flowing cross-border marketing.
Determinants of health: The range of personal, social, economic and environmental factors which determine the health status of individuals or populations.
Diabetes: A disease that occurs either when the pancreas does not produce enough insulin or when the body cannot effectively use the insulin it produces.
127Report of the 2015 Global NCD Survey
Early detection/screening: Measures preformed in order to identify individuals who have early stages of disease (with apparent symptoms in the case or early detection and without in the case of screening).
Earmarked taxes: Taxes which are collected and used for a specific purpose.
Fiscal interventions: Measures taken by the government such as taxes and subsidies.
Free sugars: Monosaccharides and disaccharides added to foods by the manufacturer, cook or consumer, plus sugars naturally present in honey, syrups and fruit juices.
Full immunization coverage: The proportion of people in the population targeted by the programme who actually received the full dose(s) of vaccine.
General government revenue: The money received from taxation, and other sources, such as privatization of government assets, to help finance expenditures.
Health: A state of complete physical, social and mental well-being, and not merely the absence of disease or infirmity. A resource for everyday life which permits people to lead an individually, socially and economically productive life. A positive concept emphasizing social and personal resources as well as physical capabilities.
Health behaviour: Any activity undertaken by an individual, regardless of actual or perceived health status, for the purpose of promoting, protecting or maintaining health, whether or not such behaviour is objectively effective towards that end.
Health care and treatment: The diagnosis and treatment of diseases.
Health-care facility: Facilities which provide health services. These may include mobile clinics, pharmacies, laboratories, primary health-care clinics, specialty clinics, and private and faith-based establishments.
Health promotion: The process of enabling people to increase control over, and to improve their health.
Healthy diet: A diet throughout the life-course which helps prevent malnutrition in all its forms as well as a range of noncommunicable diseases (NCDs) and conditions. The exact make-up of a healthy, balanced diet varies depending on the individual needs, such as age, sex, lifestyle, degree of physical activity). For adults a healthy diet contains fruits, vegetables, legumes, nuts and whole grains and should be limited in free sugars, salt, total fat, saturated fats and free of industrial trans fats.
International Code of Marketing of Breast-milk Substitutes: An international health policy framework that recommends restrictions on the marketing of breast-milk substitutes, such as infant formula, to ensure that mothers are not discouraged from breastfeeding and that substitutes are used safely if needed.
International donors: Organizations which extend across national boundaries and which give funds for projects of a developmental nature.
Intervention: Any measure whose purpose is to improve health or alter the course of disease.
128
Legislation: A law, or laws, enacted by the governing bodies in a country.
Marketing: Any form of commercial communication or message that is designed to, or has the effect of, increasing the recognition, appeal and/or consumption of particular products and services. It comprises anything that acts to advertise or otherwise promote a product or service.
Multisectoral: Involving different sectors, such as health, agriculture, education, finance, infrastructure, transport, trade, etc.
Multisectoral collaboration: A recognized relationship between part of parts of different sectors of society, such as ministries (e.g. of health or education), agencies, NGOs, private for-profit sector and community representation) which have been formed to take action to achieve health outcomes in a way which is more effective, efficient or sustainable than might be achieved by the health sector acting alone.
Multistakeholder: Involving stakeholders from across the public sector, civil society, NGOs and the private sector.
National Cancer Screening Programme: A government-endorsed programme whereby screening is offered. (NGO-led programmes or national recommendations for screening at the patient’s cost, do not qualify as a national screening programme.)
National focal point, unit/department:I. National focal point: the person responsible
for prevention and control of chronic diseases within a ministry of health or national institute.
II. Unit or department: a unit or department with responsibility for NCD disease prevention and control within a ministry of health or national institute.
National health reporting system, survey and surveillance:
I. National health reporting system: the process by which a ministry of health produces annual health reports that summarize data on, for example, national health human resources, population demographics, health expenditures,
health indicators such as mortality and morbidity. This includes the process of collecting data from various health information sources e.g. disease registries, hospital admission or discharge data.
II. National survey: a survey, of fixed or unfixed time interval, on the main chronic diseases, or major risk factors common to chronic diseases.
III. Surveillance: the systematic collection of data (through survey or registration) on risk factors, chronic diseases and their determinants for continuous analysis, interpretation and feed-back.
National integrated action plan: A concerted approach to addressing a multiplicity of issues within a chronic disease prevention and health promotion framework, targeting the major risk factors common to the main chronic diseases, including the integration of primary, secondary and tertiary prevention, health promotion and diseases prevention programmes across sectors and disciplines.
National policy, strategy or action plan:I. Policy: a specific official decision or set of
decisions designed to carry out a course of action endorsed by a political body, including a set of goals, priorities and main directions for attaining these goals. The policy document may include a strategy to give effect to the policy.
II. Strategy: a long term plan designed to achieve a particular goal.
III. Action plan: a scheme or course of action, which may correspond to a policy or strategy, with defined activities indicating who does what (type of activities and people responsible for implementation), when (timeframe), how, and with what resources to accomplish an objective.
National protocols, guidelines or standards for chronic diseases and conditions: A recommended evidence-based course of action to prevent a chronic disease or condition or to treat or manage a chronic disease or condition with the aim of preventing complications and improving outcomes and the quality of life of patients.
NGO: Nongovernmental organization.
129Report of the 2015 Global NCD Survey
Noncommunicable diseases (NCDs): The four main types of noncommunicable diseases – cardiovascular diseases (such as heart attacks and stroke), cancers, chronic respiratory diseases (such as chronic obstructed pulmonary disease and asthma), and diabetes.
Noncommunicable diseases prevention and control: All activities related to surveillance, prevention and management of the chronic NCDs.
Not in effect: Any policy, strategy or plan of action which has been previously developed, and is either no longer under development, or for various reasons is not being implemented.
Nutrition labelling: A description intended to inform consumers of nutritional properties of food, consisting of two components: (i) nutrient declaration; (ii) supplementary nutrition information.
Operational: A policy, strategy or plan of action which is being used and implemented in the country, and has resources and funding available for implementation.
Partnership for health: An agreement between two or more partners to work cooperatively towards a set of shared health outcomes.
Price subsidies: Economic benefit provided by the government (such as a tax allowance or duty rebate) to keep the price of healthy foods low.
Primary prevention: Measures directed towards preventing the initial occurrence of a disease or disorder.
Print media: Communicating with the public through printed materials such as magazines, newspapers and billboards.
Product reformulation by industry: The process of changing the composition of processed foods to be healthier, with a reduced salt content.
Public awareness programme: A comprehensive effort that includes multiple components (messaging, grassroots outreach, media relations, government affairs, budget, etc.) to help increase public understanding about the importance of an issue.
Public health sector: Publicly funded health-care sector.
Rehabilitation: A set of measures that assist individuals who experience, or are likely to experience, disability to achieve and maintain optimal functioning in interaction with their environments.
Rehabilitation services: services that include rehabilitation medicine, therapy and assistive technology.
Risk factors associated with NCDs: The four main risk factors for NCDs – tobacco use, harmful use of alcohol, unhealthy diet, and low levels of physical activity.
Sample registration system: A method and procedure for estimating vital statistics in national and regional populations by intensively registering and verifying vital events in population samples. In India, for example, more than 4000 rural and 2000 urban sample units, with a total of more than 6 million individuals (i.e. less than 1% of the total national population) are included in a sample registration system that provides a reasonably reliable picture of the national pattern of vital events at a cost that is feasible and realistic.
Saturated fats: Fats found in animal products, including meat and whole milk dairy products, as well as certain plant oils such as palm, palm kernel and coconut oils.
Screening: Measures preformed across an apparently healthy population in order to identify individuals who have risk factor or early stages of disease, but do not yet show symptoms.
Screening coverage: The proportion of people in the population targeted by the programme who actually received screening in the timeframe defined by the programme. (For example, if a country recommends mammography screening every 2 years for women aged 50–60 years, the screening coverage is the number of women in the 50–60 age group who benefitted from mammography in the past 2 years as a result of the programme, divided by the total number of women in the country aged 50–60 years.)
Self-regulation: In the context of this survey refers to when group or private sector entity governs or polices itself without outside assistance or influence.
Target: A specific aim to be achieved that should be time-bound, and define a “desired”, “promised”, “minimum” or “aspirational” level of achievement.
Taxation incentives to promote physical activity: Incentives that involve removing the tax (or a portion of the tax) in order to promote increased use of goods or services to encourage physical activity.
Trans-fatty acids (trans fats): A form of fatty acids. While trans fats occur in tiny amounts in some foods, almost all trans fats result from an industrial process that partially hydrogenates (adds hydrogen to) unsaturated fatty acids. Trans fats are thus a form of processed vegetable oils.
Under development: Something, such as a policy, action plan or strategy, which is still being developed or finalized and is not yet being implemented in the country.
130


ISBN 978 92 4 156536 3