Embed Size (px)
Citation preview

Global Trends AffectingGlobal Trends Affectingthe U.S. Forest Sectorthe U.S. Forest Sector
Jim L. BowyerUniversity of Minnesota
Department of Bio-based ProductsSt. Paul, MN
Global Trends Affecting the U.S. ForestGlobal Trends Affecting the U.S. ForestSectorSector
nn Global mega-trends that will impact theGlobal mega-trends that will impact the forest sector forest sectornn National trends important to forestry National trends important to forestrynn Implications of global and national trends Implications of global and national trends
for the forest products industry of the N.E. for the forest products industry of the N.E.nn The emerging bio-economy The emerging bio-economynn The bio-economy, bio-energy and the N.E. The bio-economy, bio-energy and the N.E. forest products industry forest products industry –– threat or threat or opportunity? opportunity?nn Positioning for the future Positioning for the future
Global Mega-Trends thatGlobal Mega-Trends thatwill Impact the Forestwill Impact the Forest
SectorSector
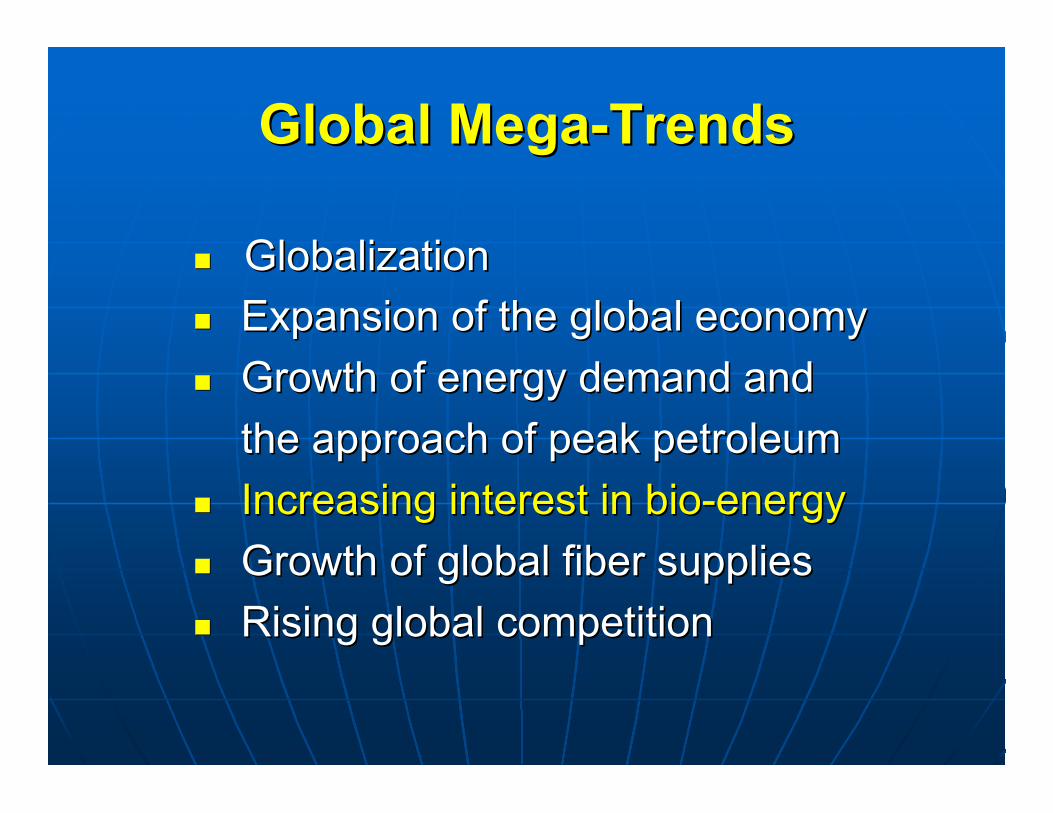
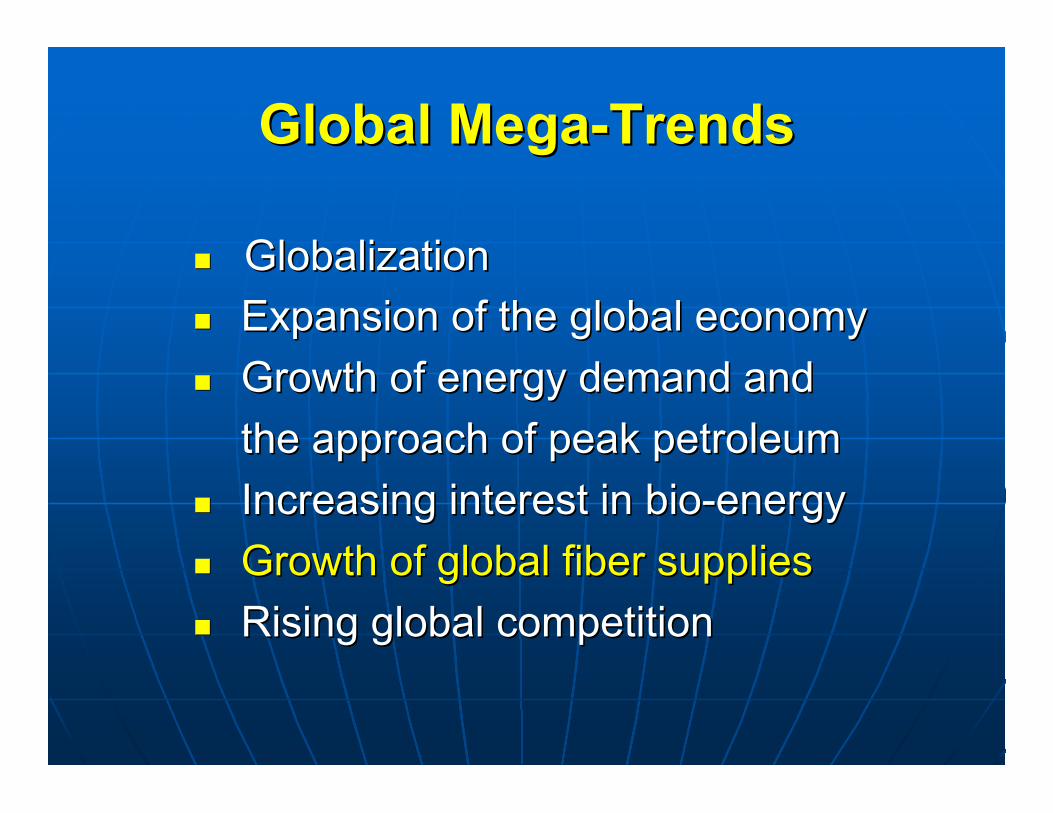
Global Mega-TrendsGlobal Mega-Trends
nn Globalization Globalization
nn Expansion of the global economy Expansion of the global economy
nn Growth of energy demand and Growth of energy demand and
the approach of peak petroleum the approach of peak petroleum
nn Increasing interest in bio-energy Increasing interest in bio-energy
nn Growth of global fiber supplies Growth of global fiber supplies
nn Rising global competition Rising global competition

Global Mega-TrendsGlobal Mega-Trends
nn GlobalizationGlobalization
nn Expansion of the global economy Expansion of the global economy
nn Growth of energy demand and Growth of energy demand and
the approach of peak petroleum the approach of peak petroleum
nn Increasing interest in bio-energy Increasing interest in bio-energy
nn Growth of global fiber supplies Growth of global fiber supplies
nn Rising global competition Rising global competition
Global Mega-TrendsGlobal Mega-Trends
nn Globalization Globalization
nn Expansion of the global economyExpansion of the global economy
nn Growth of energy demand and Growth of energy demand and
the approach of peak petroleum the approach of peak petroleum
nn Increasing interest in bio-energy Increasing interest in bio-energy
nn Growth of global fiber supplies Growth of global fiber supplies
nn Rising global competition Rising global competition
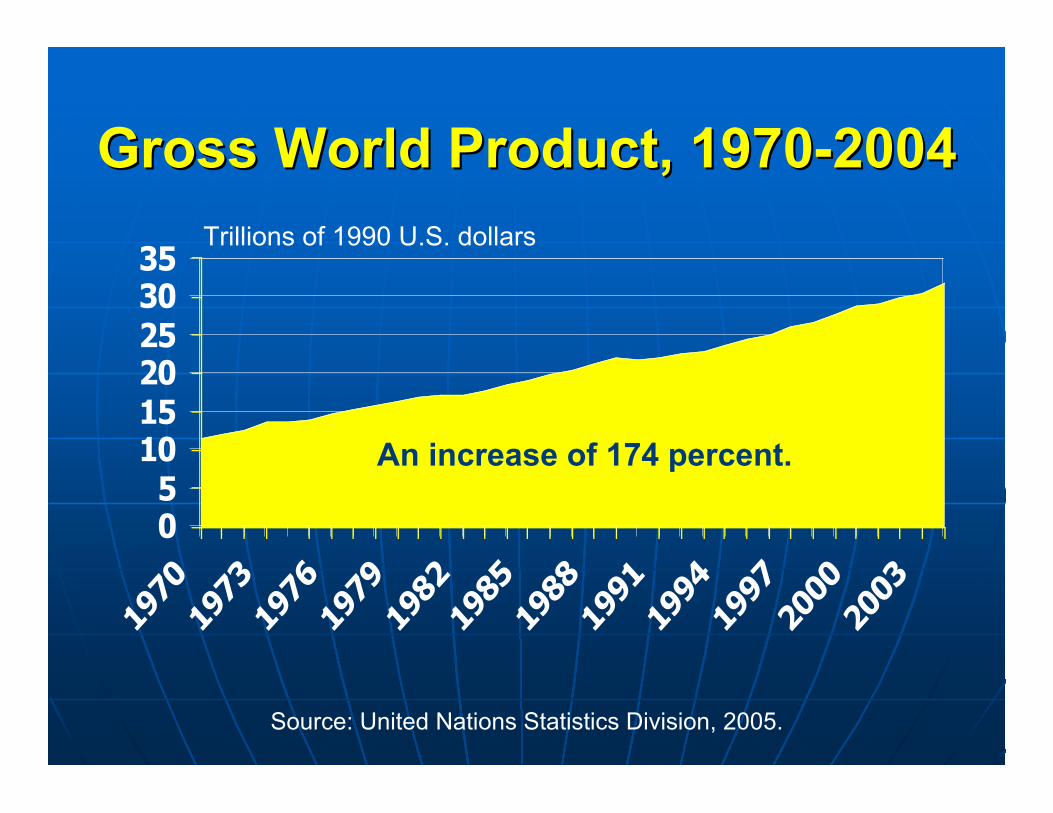
Gross World Product, 1970-2004Gross World Product, 1970-2004
05
101520253035
1970
1973
1976
1979
1982
1985
1988
1991
1994
1997
2000
2003
Trillions of 1990 U.S. dollars
Source: United Nations Statistics Division, 2005.
An increase of 174 percent.
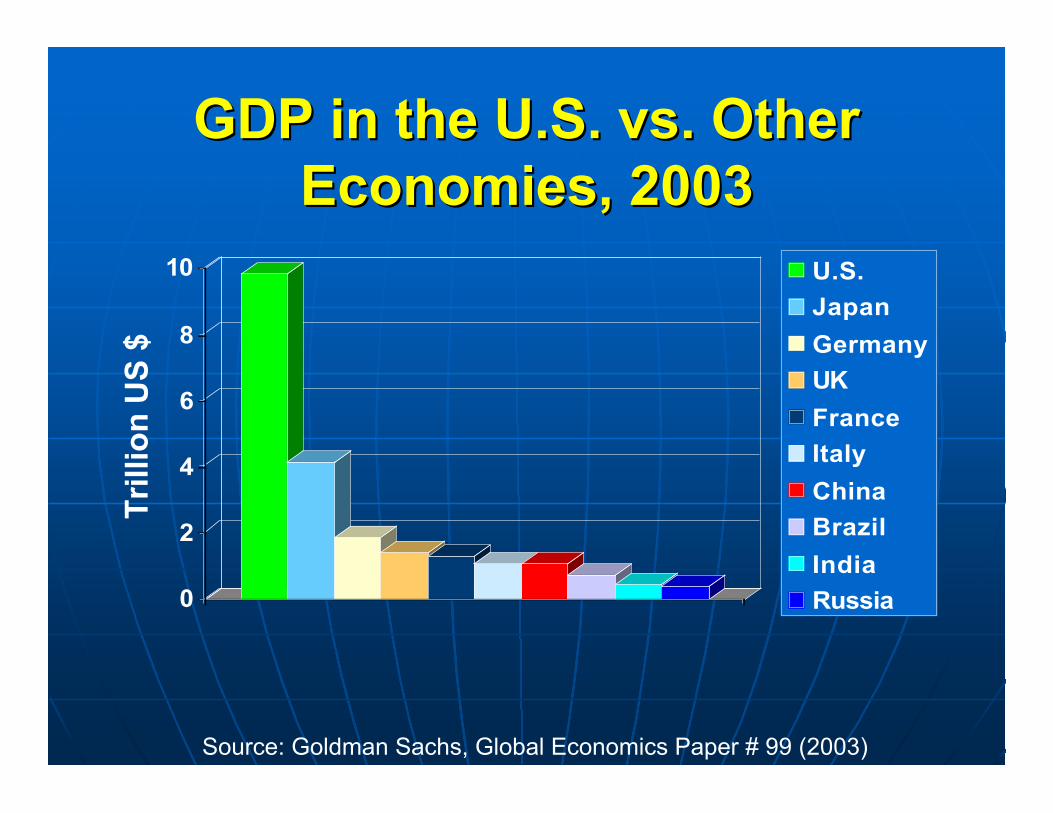
GDP in the U.S. vs. OtherGDP in the U.S. vs. OtherEconomies, 2003Economies, 2003
0
2
4
6
8
10 U.S.
Japan
Germany
UK
France
Italy
China
Brazil
India
Russia
Source: Goldman Sachs, Global Economics Paper # 99 (2003)
Tri
llio
n U
S $
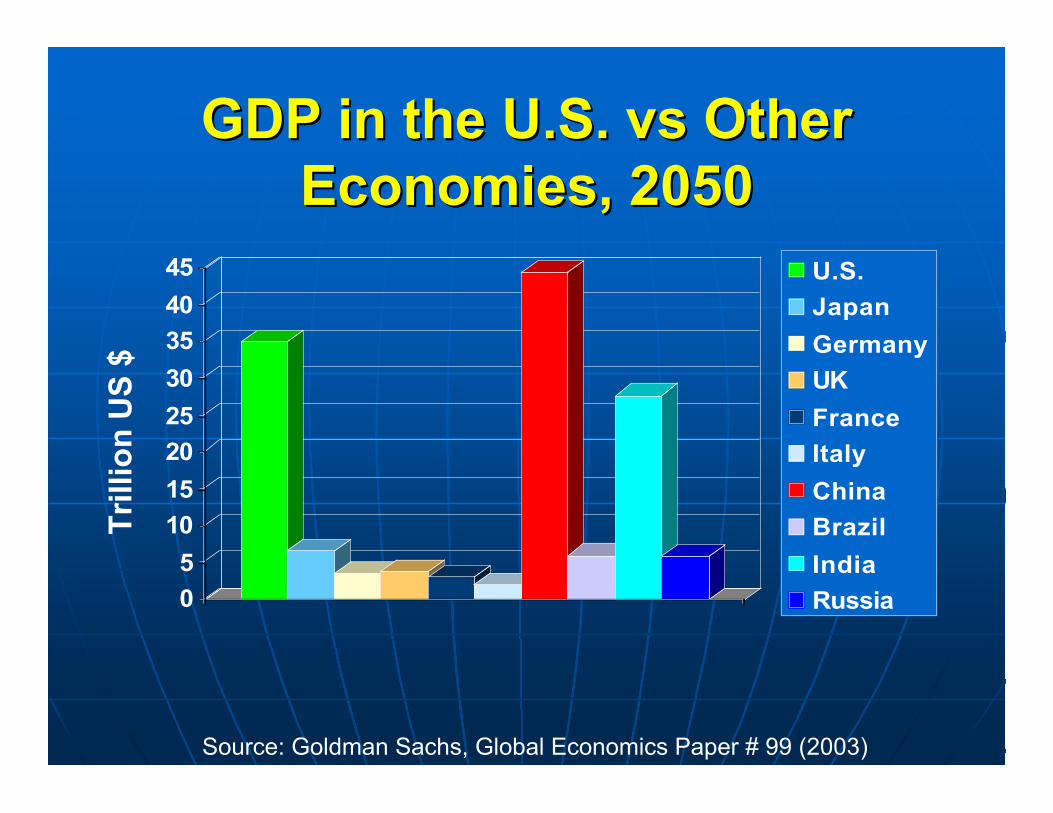
GDP in the U.S. GDP in the U.S. vsvs Other OtherEconomies, 2050Economies, 2050
0
5
10
15
20
25
30
35
40
45 U.S.
Japan
Germany
UK
France
Italy
China
Brazil
India
Russia
Source: Goldman Sachs, Global Economics Paper # 99 (2003)
Tri
llio
n U
S $
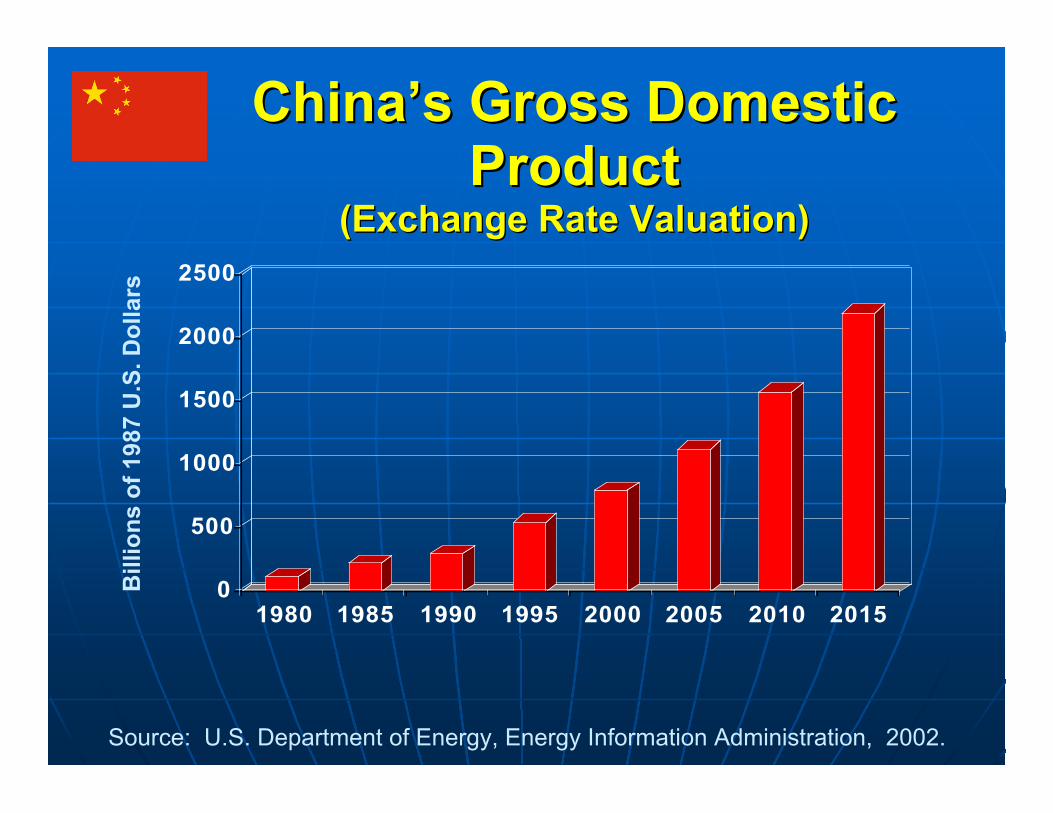
ChinaChina’’s Gross Domestics Gross DomesticProductProduct
(Exchange Rate Valuation)(Exchange Rate Valuation)
0
500
1000
1500
2000
2500
1980 1985 1990 1995 2000 2005 2010 2015
Bill
ion
s o
f 19
87 U
.S. D
olla
rs
Source: U.S. Department of Energy, Energy Information Administration, 2002.
The result is unprecedentedThe result is unprecedentedgrowth of consumptiongrowth of consumption
worldwide.worldwide.
Considering the combinedConsidering the combinedeffect of population growtheffect of population growth
and economic growth withinand economic growth withindeveloping nations, developing nations, demanddemand
forfor new housing unitsnew housing unitsglobally over the next 50globally over the next 50
years is likely to exceed years is likely to exceed oneonebillion.billion.
Global Mega-TrendsGlobal Mega-Trends
nn GlobalizationGlobalization
nn Expansion of the global economy Expansion of the global economy
nn Growth of energy demand andGrowth of energy demand and
the approach of peak petroleum the approach of peak petroleum
nn Increasing interest in bio-energy Increasing interest in bio-energy
nn Growth of global fiber supplies Growth of global fiber supplies
nn Rising global competition Rising global competition
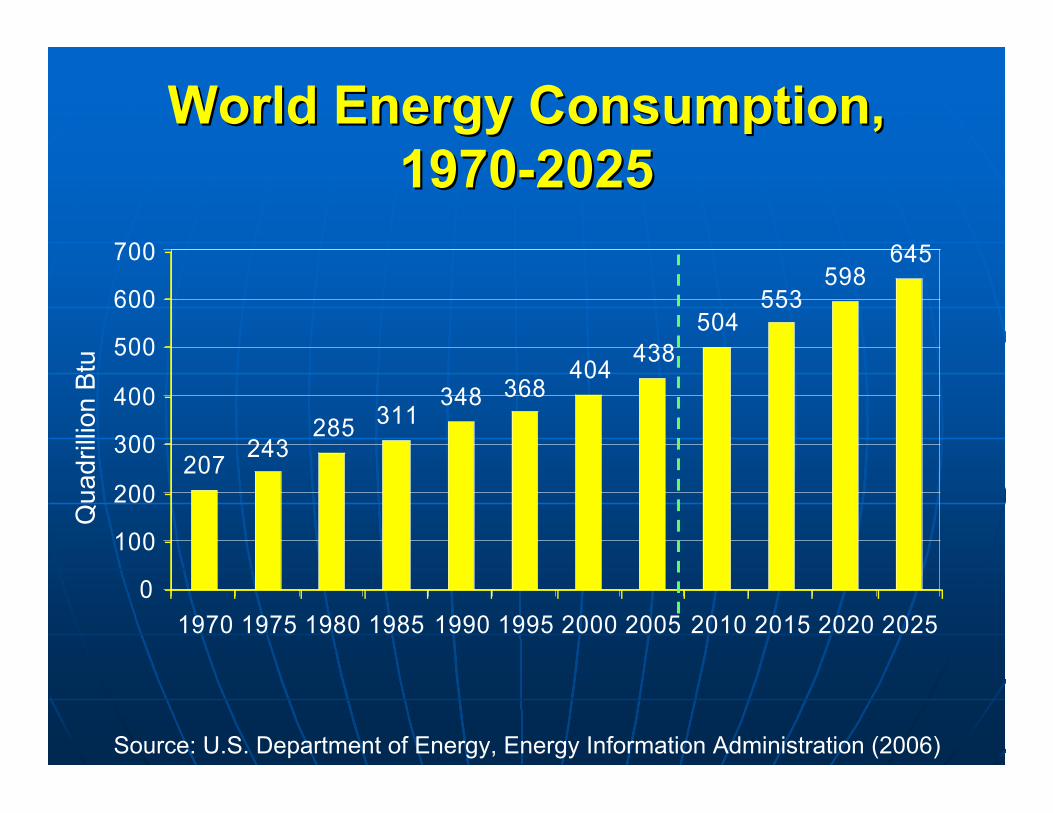
World Energy Consumption,World Energy Consumption,1970-20251970-2025
207243
285 311348 368
404
645598
553504
438
0
100
200
300
400
500
600
700
1970 1975 1980 1985 1990 1995 2000 2005 2010 2015 2020 2025
Qua
drill
ion
Btu
Source: U.S. Department of Energy, Energy Information Administration (2006)
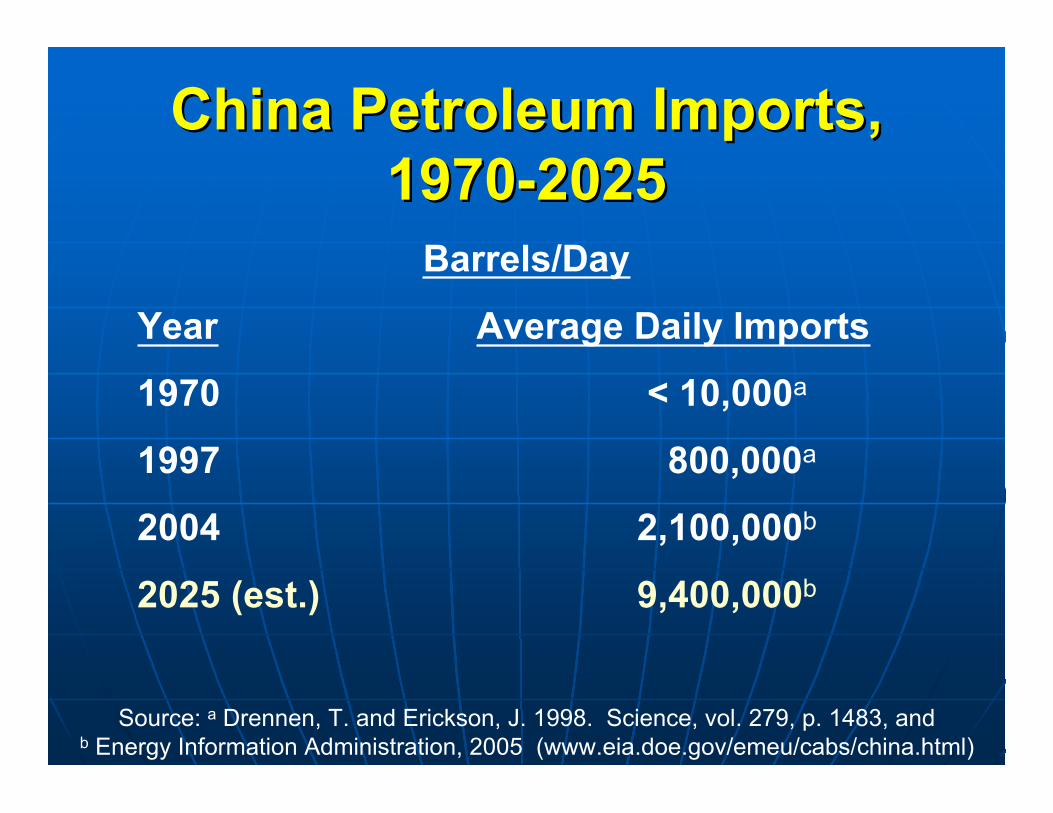
China Petroleum Imports,China Petroleum Imports,1970-20251970-2025
Barrels/Day
Year Average Daily Imports
1970 < 10,000a
1997 800,000a
2004 2,100,000b
2025 (est.) 9,400,000b
Source: a Drennen, T. and Erickson, J. 1998. Science, vol. 279, p. 1483, andb Energy Information Administration, 2005 (www.eia.doe.gov/emeu/cabs/china.html)
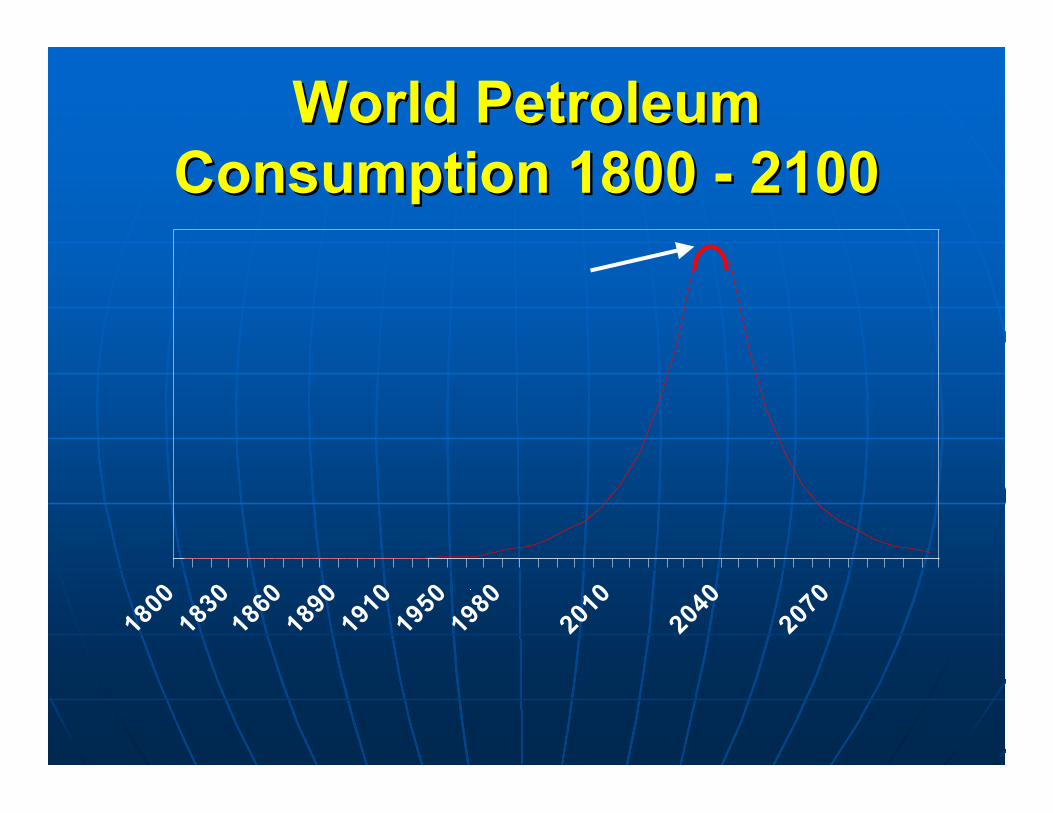
World PetroleumWorld PetroleumConsumption 1800 - 2100Consumption 1800 - 2100
18001830
18601890
19101950
19802010
20402070
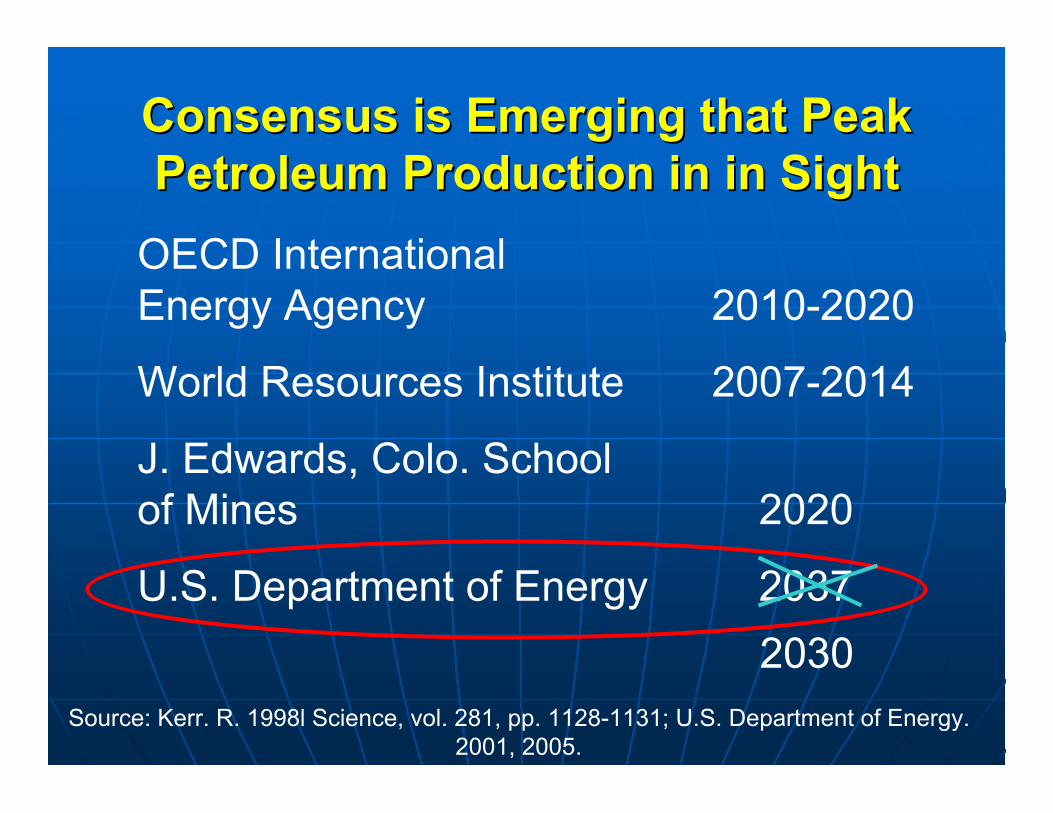
Consensus is Emerging that PeakConsensus is Emerging that PeakPetroleum Production in in SightPetroleum Production in in Sight
OECD InternationalEnergy Agency 2010-2020
World Resources Institute 2007-2014
J. Edwards, Colo. Schoolof Mines 2020
U.S. Department of Energy 2037
2030Source: Kerr. R. 1998l Science, vol. 281, pp. 1128-1131; U.S. Department of Energy.
2001, 2005.
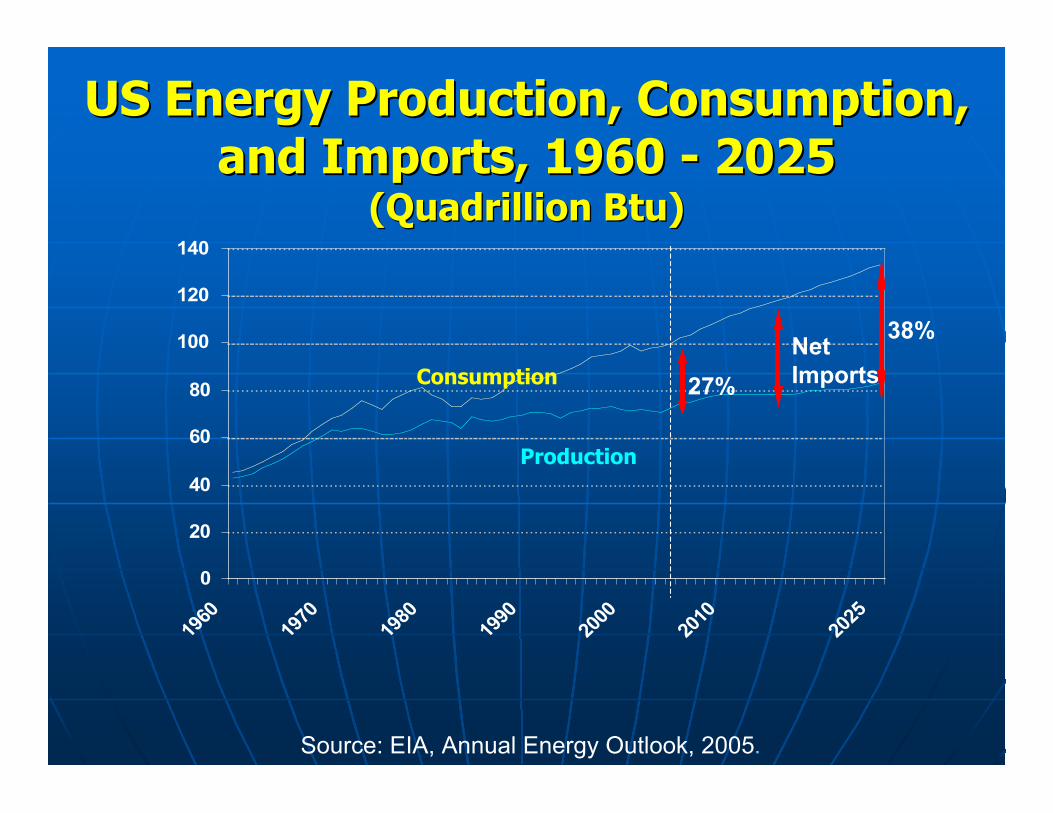
US Energy Production, Consumption,US Energy Production, Consumption,and Imports, 1960 - 2025and Imports, 1960 - 2025
(Quadrillion Btu)(Quadrillion Btu)
0
20
40
60
80
100
120
140
1960
1970
1980
1990
2000
2010
2025
Source: EIA, Annual Energy Outlook, 2005.
Consumption
Production
NetImports27%
38%
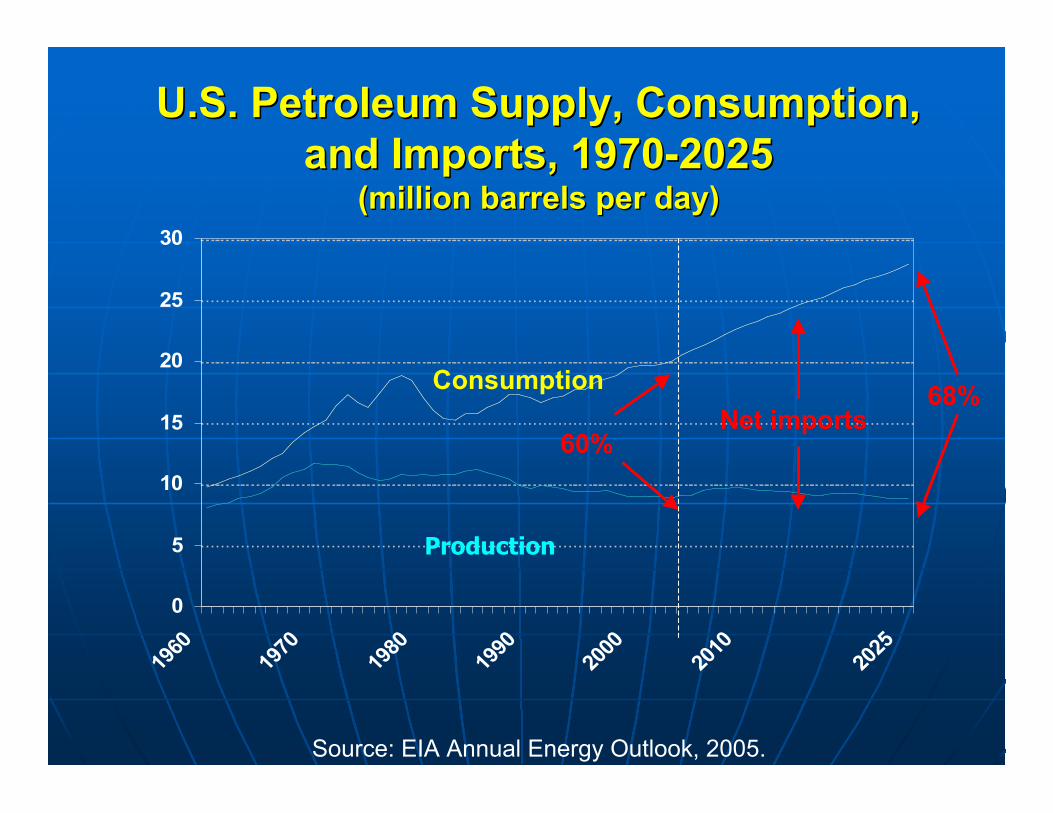
U.S. Petroleum Supply, Consumption,U.S. Petroleum Supply, Consumption,and Imports, 1970-2025and Imports, 1970-2025
(million barrels per day)(million barrels per day)
0
5
10
15
20
25
30
1960
1970
1980
1990
2000
2010
2025
Source: EIA Annual Energy Outlook, 2005.
Production
Consumption
Net imports60%
68%
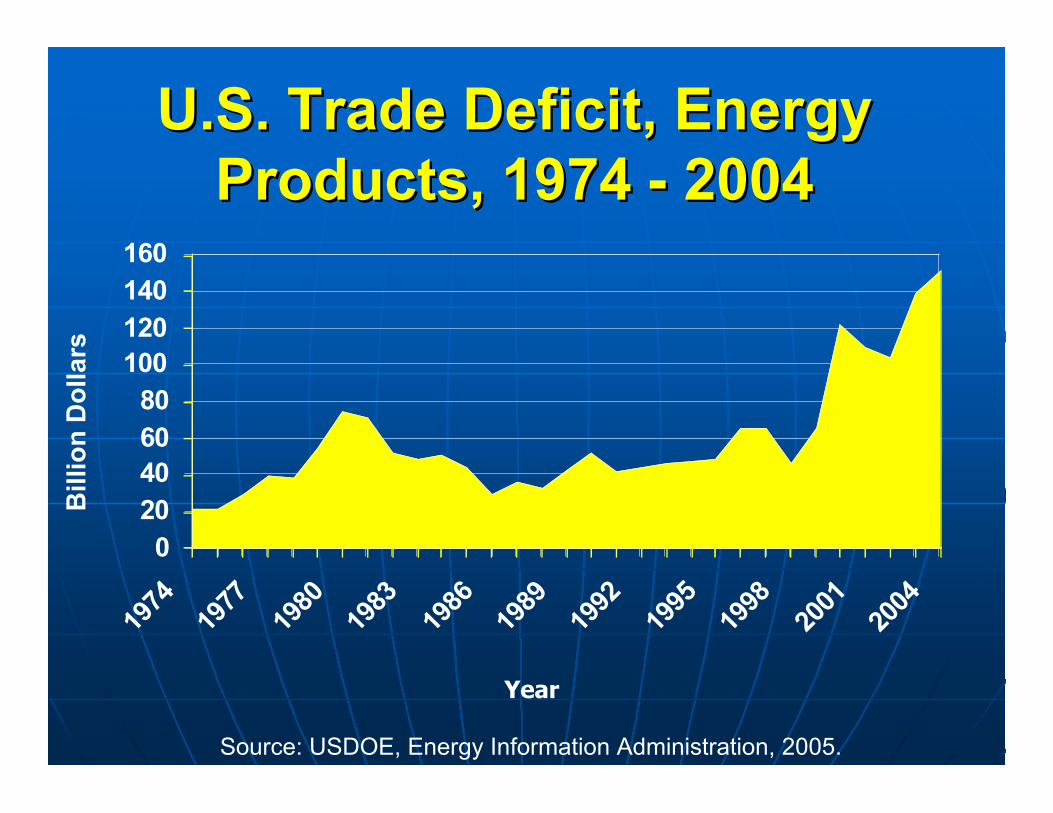
U.S. Trade Deficit, EnergyU.S. Trade Deficit, EnergyProducts, 1974 - 2004Products, 1974 - 2004
020406080
100120140160
1974
1977
1980
1983
1986
1989
1992
1995
1998
2001
2004
Bill
ion
Do
llars
Year
Source: USDOE, Energy Information Administration, 2005.
Global Mega-TrendsGlobal Mega-Trends
nn GlobalizationGlobalization
nn Expansion of the global economy Expansion of the global economy
nn Growth of energy demand and Growth of energy demand and
the approach of peak petroleum the approach of peak petroleum
nn Increasing interest in bio-energyIncreasing interest in bio-energy
nn Growth of global fiber supplies Growth of global fiber supplies
nn Rising global competition Rising global competition
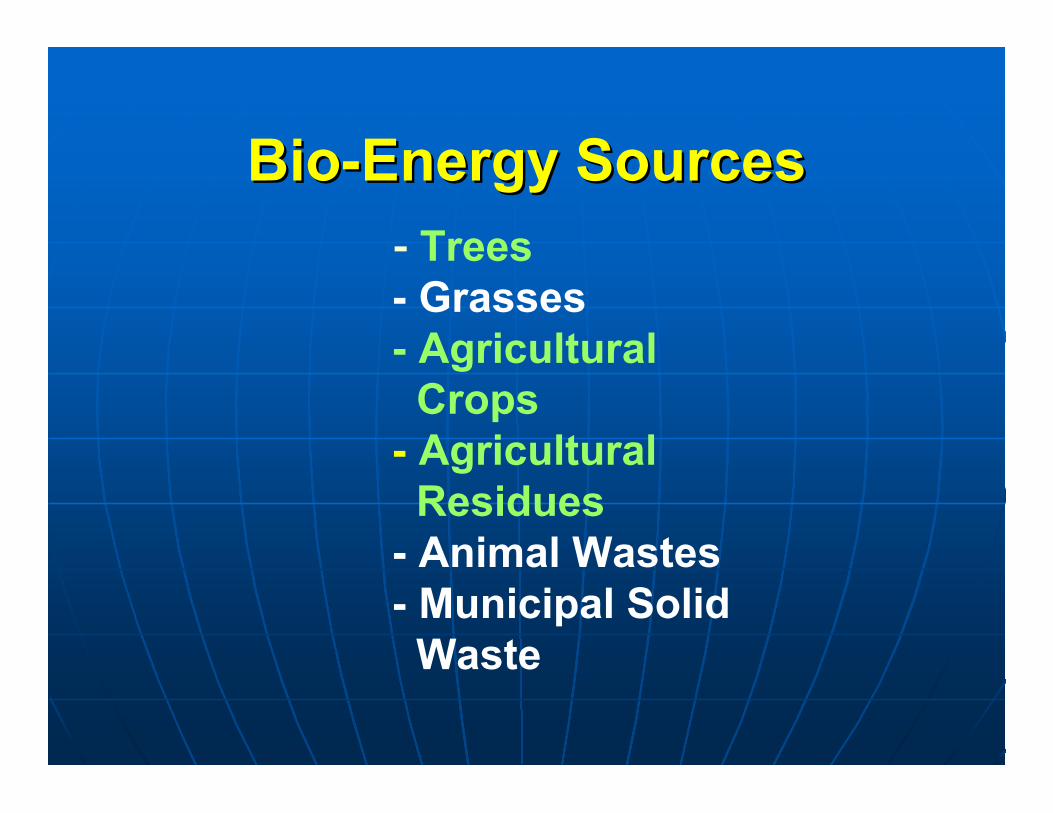
Bio-Energy SourcesBio-Energy Sources - Trees - Grasses - Agricultural Crops - Agricultural Residues - Animal Wastes - Municipal Solid Waste
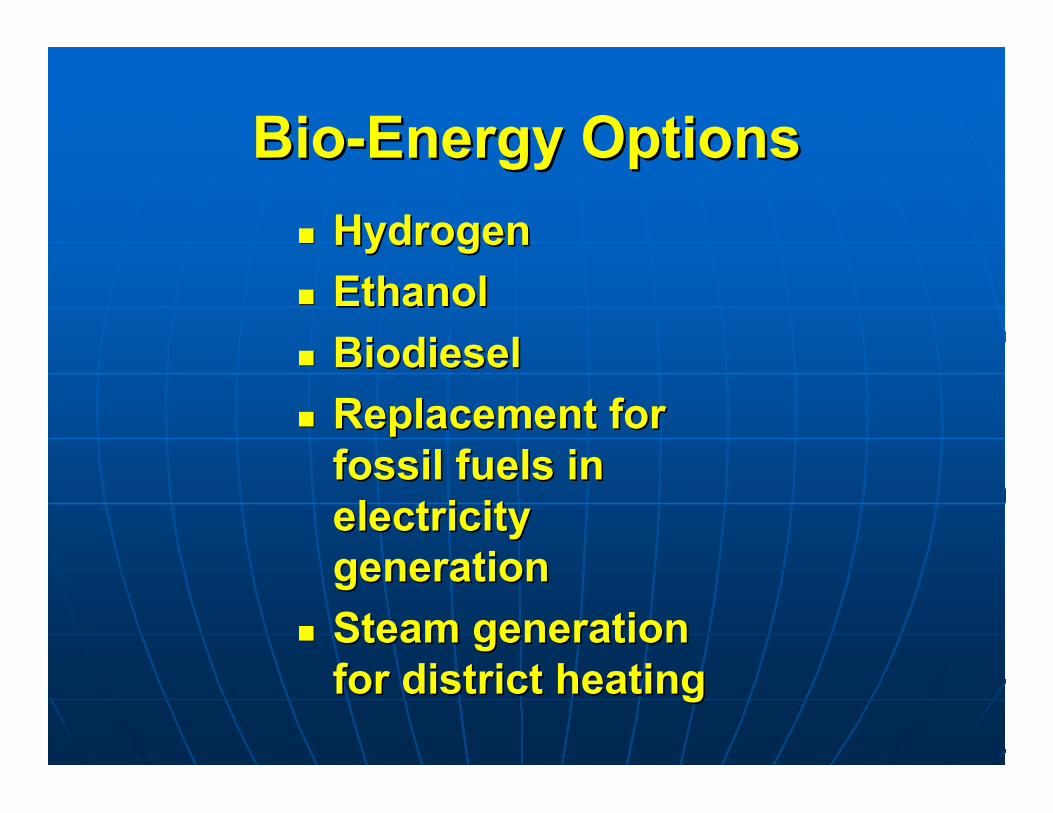
Bio-Energy OptionsBio-Energy Options
nn HydrogenHydrogen
nn EthanolEthanol
nn BiodieselBiodiesel
nn Replacement forReplacement forfossil fuels infossil fuels inelectricityelectricitygenerationgeneration
nn Steam generationSteam generationfor district heatingfor district heating
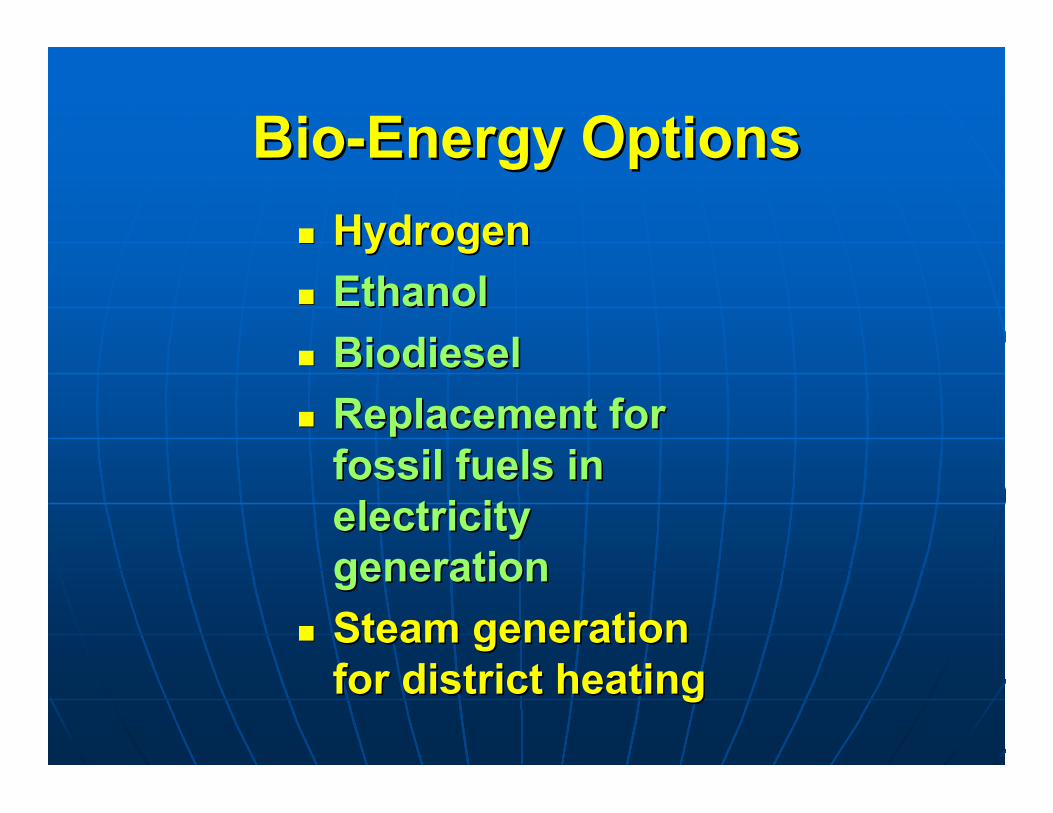
Bio-Energy OptionsBio-Energy Options
nn HydrogenHydrogen
nn EthanolEthanol
nn BiodieselBiodiesel
nn Replacement forReplacement forfossil fuels infossil fuels inelectricityelectricitygenerationgeneration
nn Steam generationSteam generationfor district heatingfor district heating
Beyond energy, there areBeyond energy, there areopportunities for producingopportunities for producinga wide range of chemicalsa wide range of chemicalsand industrial and industrial feedstocksfeedstocks
from biomass.from biomass.
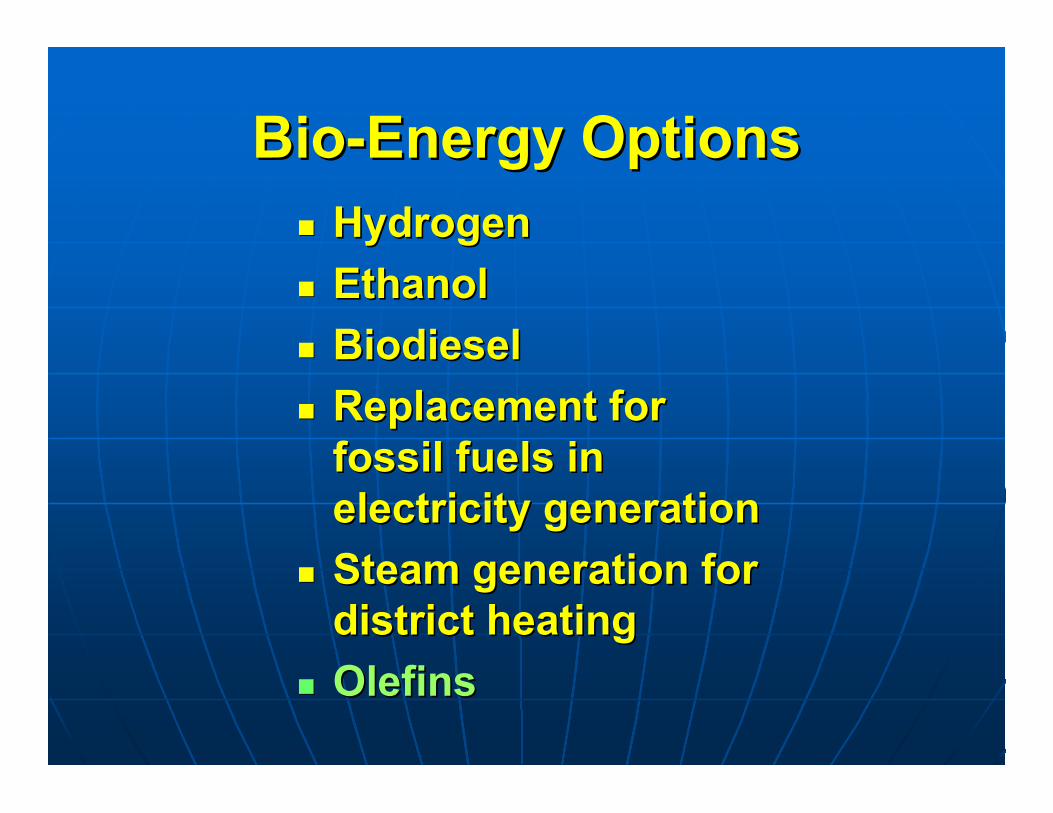
Bio-Energy OptionsBio-Energy Optionsnn HydrogenHydrogen
nn EthanolEthanol
nn BiodieselBiodiesel
nn Replacement forReplacement forfossil fuels infossil fuels inelectricity generationelectricity generation
nn Steam generation forSteam generation fordistrict heatingdistrict heating
nn OlefinsOlefins
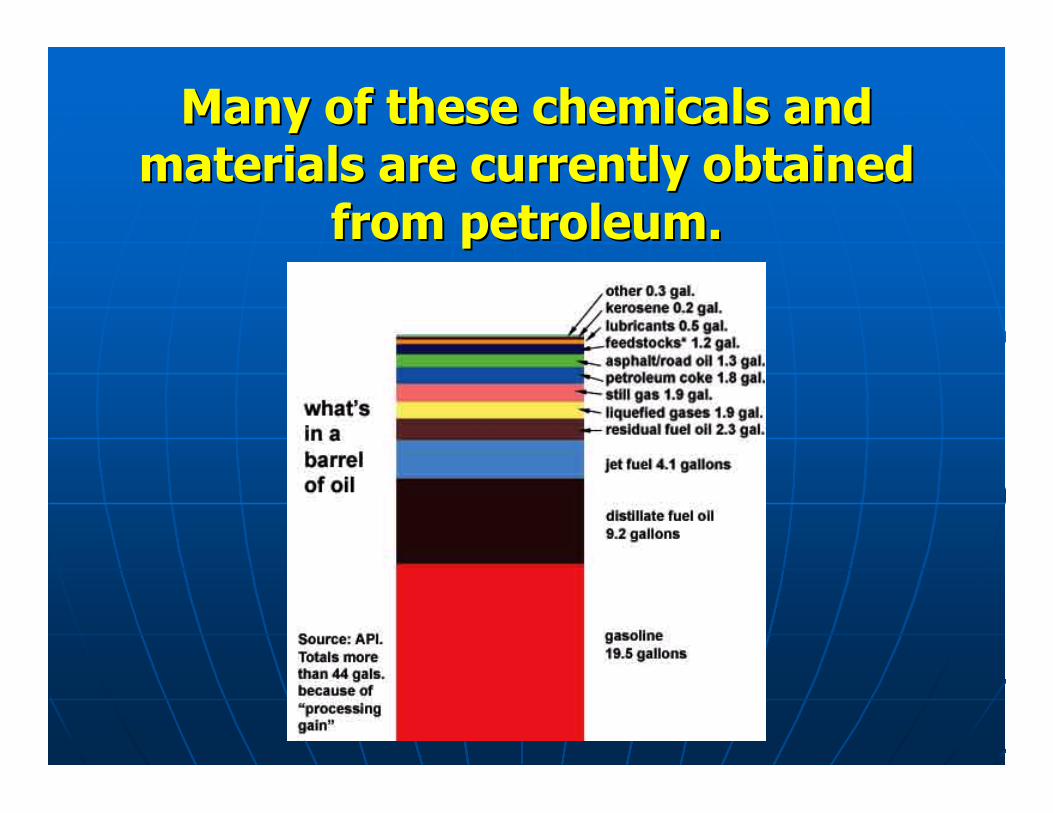
Many of these chemicals andMany of these chemicals andmaterials are currently obtainedmaterials are currently obtained
from petroleum.from petroleum.
Many are predicting the emergenceMany are predicting the emergenceof aof a Bio-economy - Bio-economy -
an economy where basic an economy where basic buildingbuildingblocks for industryblocks for industry and the and the rawraw
materials for energymaterials for energyare derived from are derived from plantplant/crop-based/crop-based
(i.e. renewable) sources.(i.e. renewable) sources.
Source: Iowa Industries of the Future, 2004.Source: Iowa Industries of the Future, 2004.
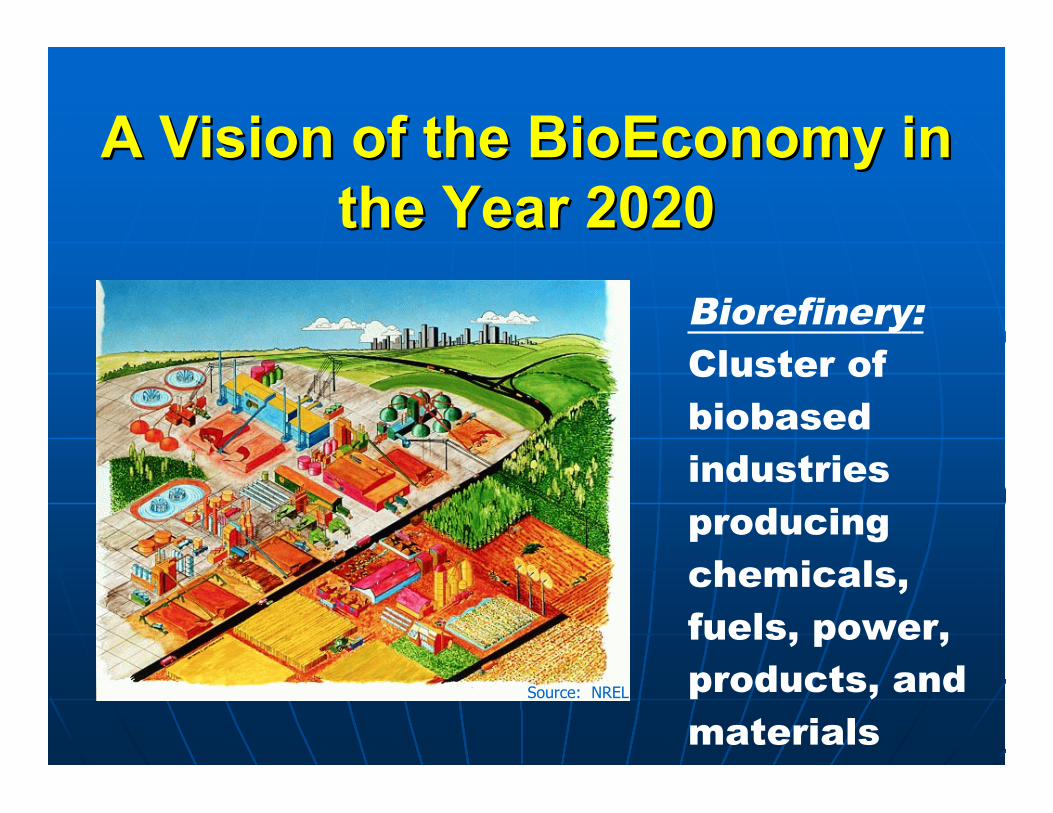
A Vision of the BioEconomy inA Vision of the BioEconomy inthe Year 2020the Year 2020
Biorefinery:Cluster ofbiobasedindustriesproducingchemicals,fuels, power,products, andmaterials
Source: NREL
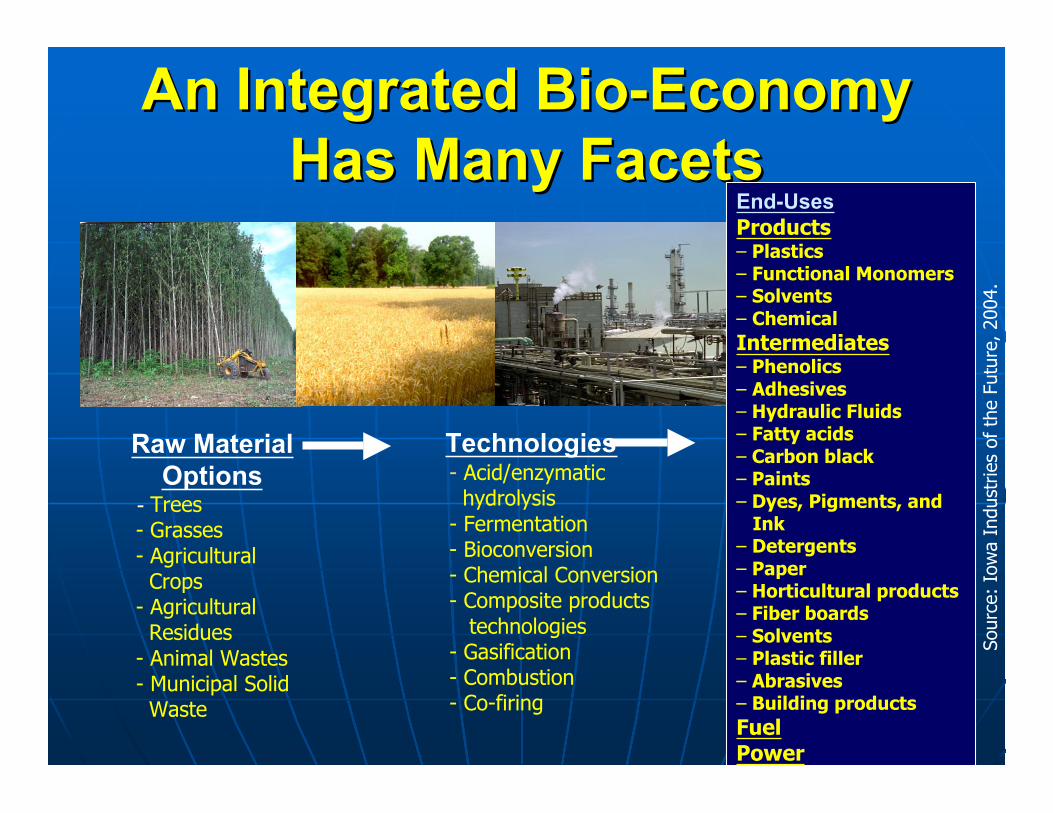
An Integrated Bio-EconomyAn Integrated Bio-EconomyHas Many FacetsHas Many Facets
Raw MaterialOptions
- Trees - Grasses - Agricultural Crops - Agricultural Residues - Animal Wastes - Municipal Solid Waste
Technologies- Acid/enzymatic hydrolysis- Fermentation- Bioconversion- Chemical Conversion- Composite products technologies- Gasification- Combustion- Co-firing
Sour
ce:
Iow
a In
dust
ries
of t
he F
utur
e, 2
004.
End-UsesProducts– Plastics– Functional Monomers– Solvents– ChemicalIntermediates– Phenolics– Adhesives– Hydraulic Fluids– Fatty acids– Carbon black– Paints– Dyes, Pigments, and Ink– Detergents– Paper– Horticultural products– Fiber boards– Solvents– Plastic filler– Abrasives– Building productsFuelPower
In the future, products nowIn the future, products nowderived from petroleum willderived from petroleum willbe made from a variety ofbe made from a variety of
biochemicalsbiochemicals and andbiofeedstocksbiofeedstocks arising from arising from
biorefineriesbiorefineries..
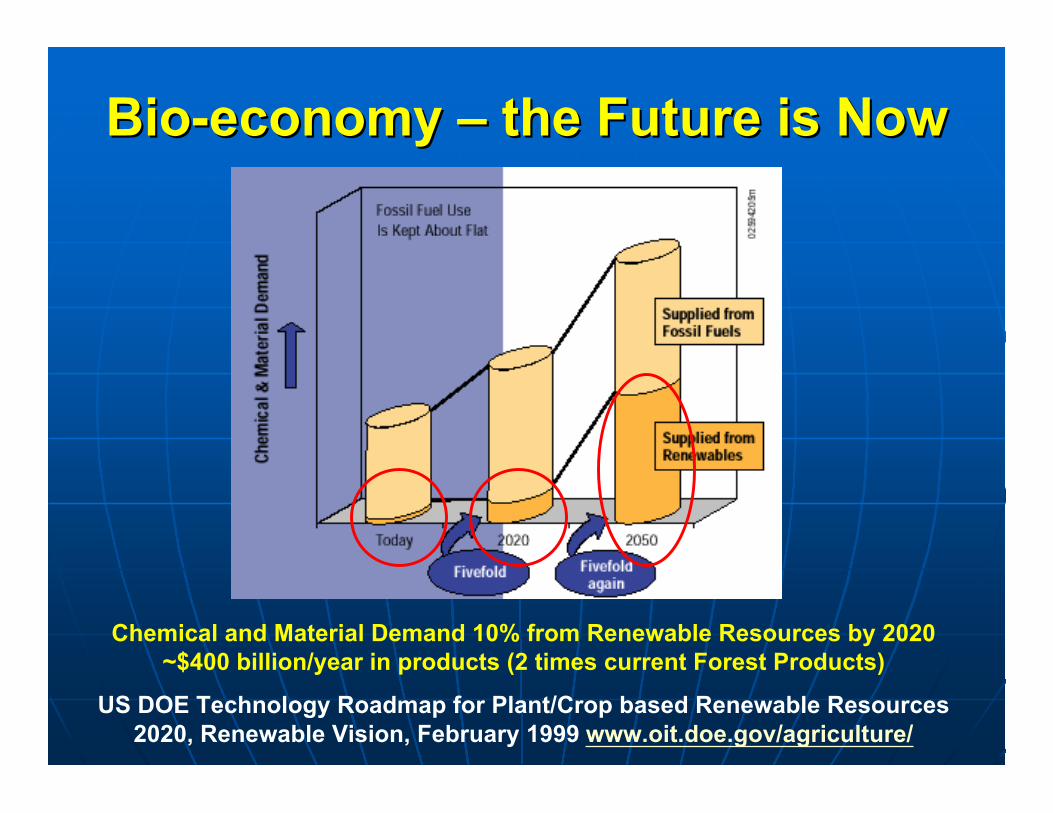
Chemical and Material Demand 10% from Renewable Resources by 2020~$400 billion/year in products (2 times current Forest Products)
US DOE Technology Roadmap for Plant/Crop based Renewable Resources2020, Renewable Vision, February 1999 www.oit.doe.gov/agriculture/
Bio-economy Bio-economy –– the Future is Now the Future is Now
Increasing economicIncreasing economicimportance of biomassimportance of biomasshas major implicationshas major implicationsfor the forest productsfor the forest products
industry.industry.
Global Mega-TrendsGlobal Mega-Trends
nn GlobalizationGlobalization
nn Expansion of the global economy Expansion of the global economy
nn Growth of energy demand and Growth of energy demand and
the approach of peak petroleum the approach of peak petroleum
nn Increasing interest in bio-energy Increasing interest in bio-energy
nn Growth of global fiber suppliesGrowth of global fiber supplies
nn Rising global competition Rising global competition

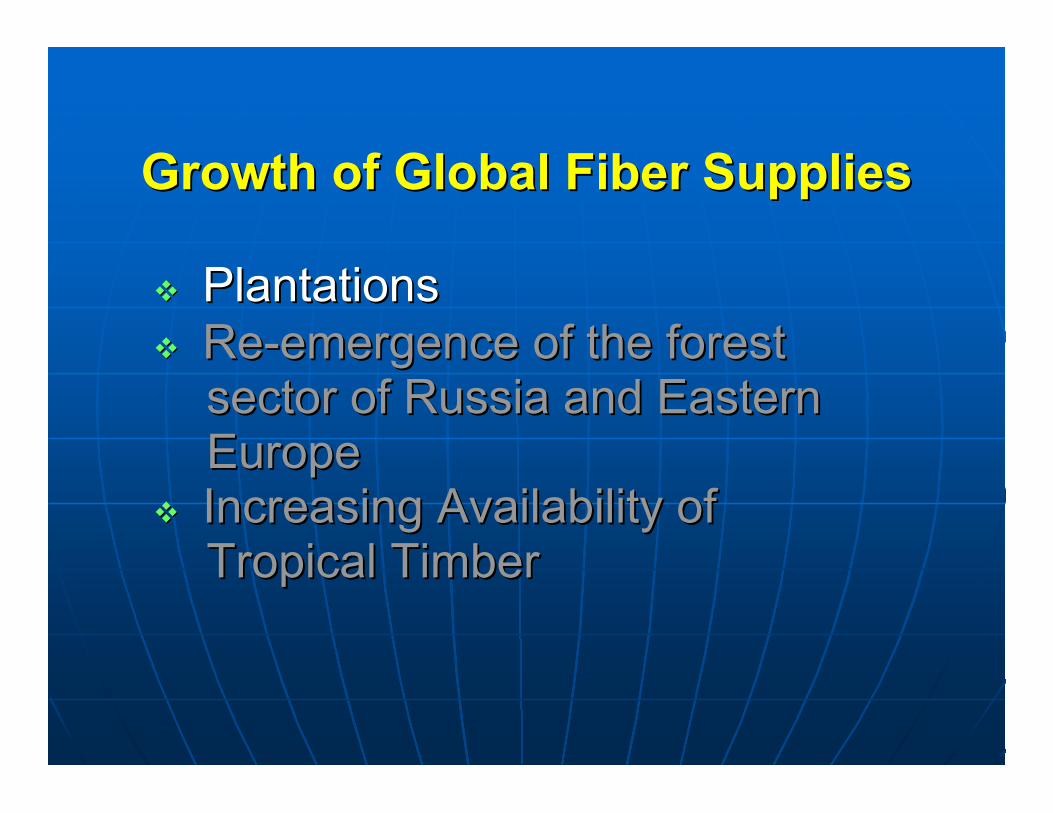
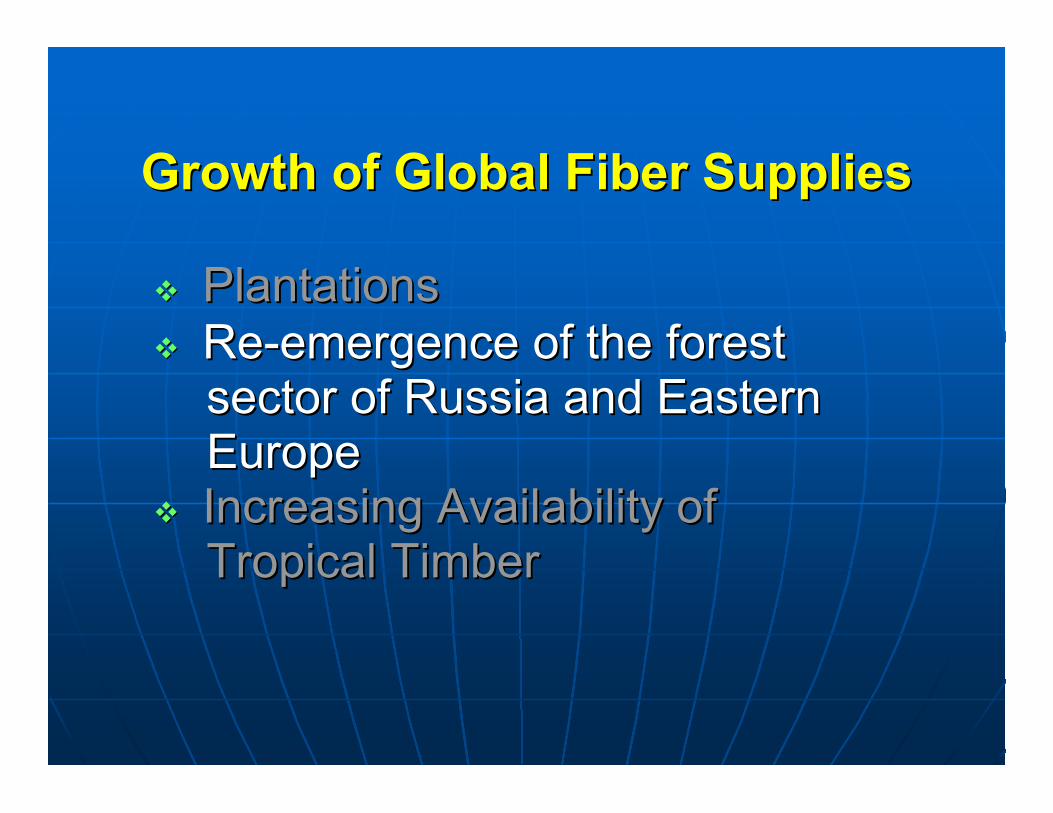
Growth of Global Fiber SuppliesGrowth of Global Fiber Supplies
vv PlantationsPlantationsvv Re-emergence of the forest Re-emergence of the forest sector of Russia and Eastern sector of Russia and Eastern Europe Europevv Increasing Availability ofIncreasing Availability of Tropical Timber Tropical Timber
Growth of Global Fiber SuppliesGrowth of Global Fiber Supplies
vv PlantationsPlantationsvv Re-emergence of the forestRe-emergence of the forest sector of Russia and Eastern sector of Russia and Eastern Europe Europevv Increasing Availability of Increasing Availability of Tropical Timber Tropical Timber
Productive industrial woodProductive industrial woodplantations globally coveredplantations globally covered
109 million hectares (269109 million hectares (269million acres) in 2005. This ismillion acres) in 2005. This is
2.8% of the forest area2.8% of the forest areaglobally.globally.
Source: FAO, Global Forest Resources Assessment (2005).
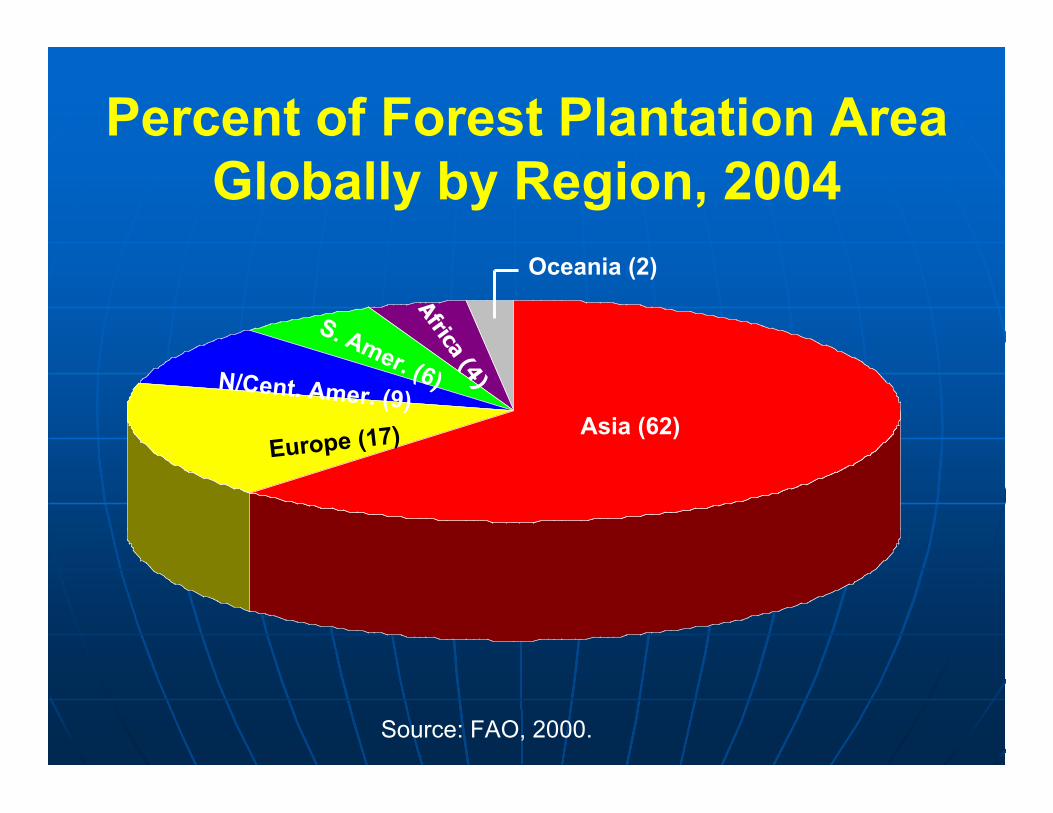
Percent of Forest Plantation AreaGlobally by Region, 2004
Source: FAO, 2000.
Asia (62)Europe (17)
N/Cent. Amer. (9)
S. Amer. (6)
Africa (4)
Oceania (2)
0
10
20
30
40
50
Percent
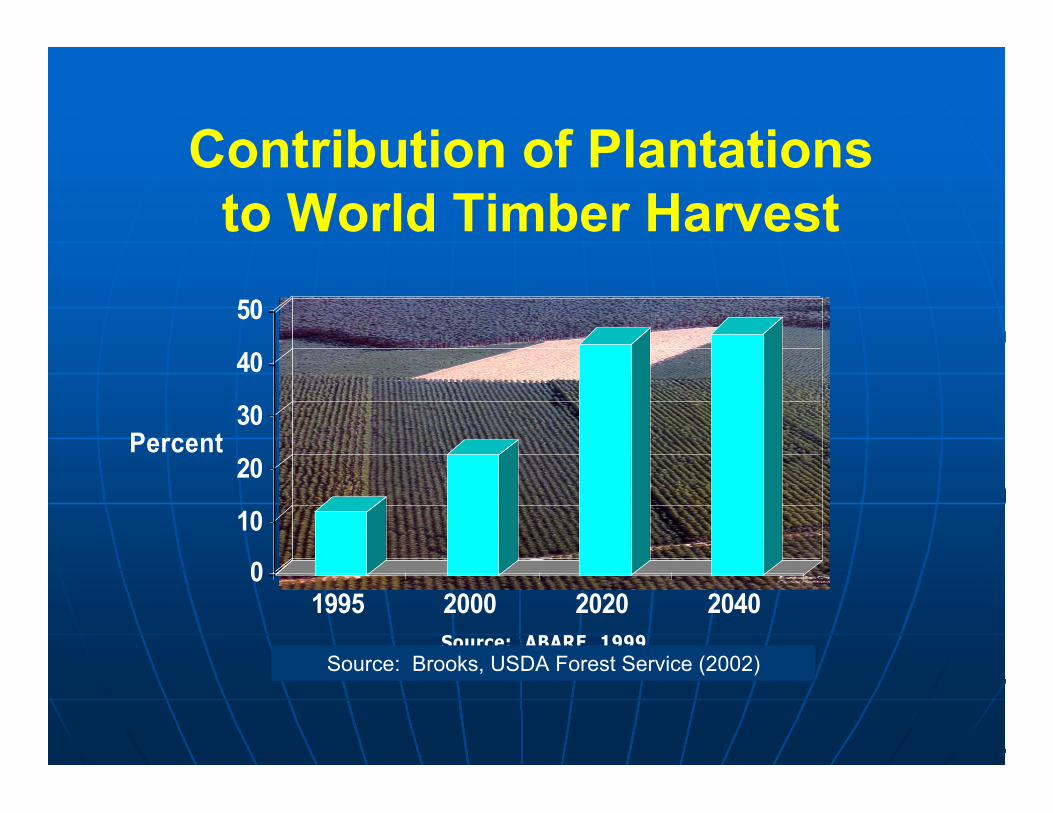
1995 2000 2020 2040Source: ABARE 1999
Contribution of Plantationsto World Timber Harvest
Source: Brooks, USDA Forest Service (2002)
The impact of thisThe impact of thisdevelopment on thedevelopment on the
forest products industryforest products industryglobally will be profound.globally will be profound.
Growth of Global Fiber SuppliesGrowth of Global Fiber Supplies
vv Plantations Plantationsvv Re-emergence of the forest Re-emergence of the forest sector of Russia and Eastern sector of Russia and Eastern Europe Europevv Increasing Availability of Increasing Availability of Tropical Timber Tropical Timber
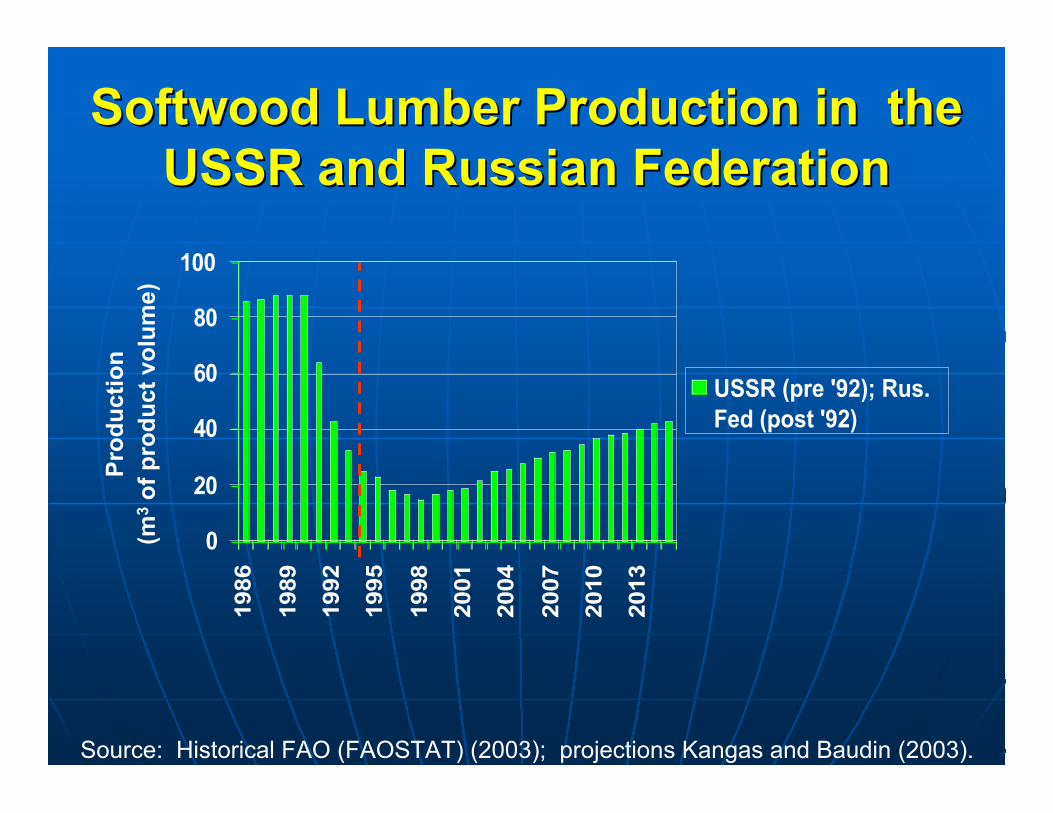
Softwood Lumber Production in theSoftwood Lumber Production in theUSSR and Russian FederationUSSR and Russian Federation
0
20
40
60
80
1001986
1989
1992
1995
1998
2001
2004
2007
2010
2013
USSR (pre '92); Rus.Fed (post '92)
Pro
du
ctio
n(m
3 o
f p
rod
uct
vo
lum
e)
Source: Historical FAO (FAOSTAT) (2003); projections Kangas and Baudin (2003).
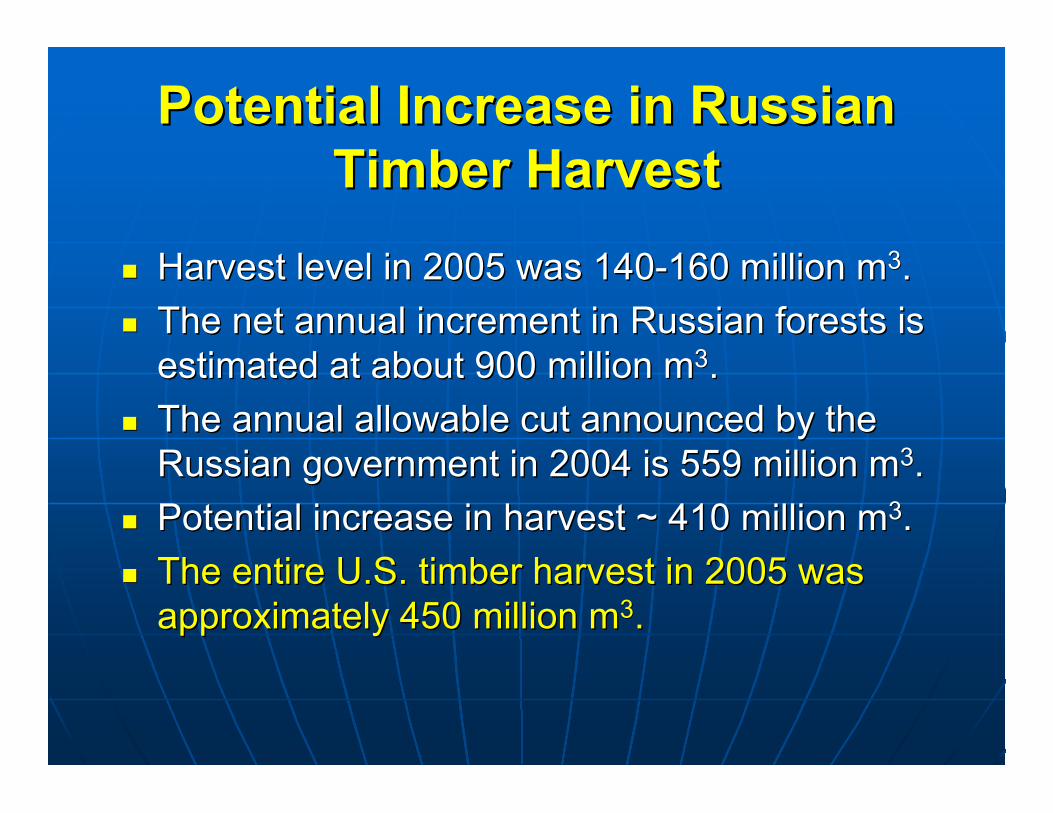
Potential Increase in RussianPotential Increase in RussianTimber HarvestTimber Harvest
nn Harvest level in 2005 was 140-160 million mHarvest level in 2005 was 140-160 million m33..
nn The net annual increment in Russian forests isThe net annual increment in Russian forests isestimated at about 900 million mestimated at about 900 million m33..
nn The annual allowable cut announced by theThe annual allowable cut announced by theRussian government in 2004 is 559 million mRussian government in 2004 is 559 million m33..
nn Potential increase in harvest ~ 410 million mPotential increase in harvest ~ 410 million m33..
nn The entire U.S. timber harvest in 2005 wasThe entire U.S. timber harvest in 2005 wasapproximately 450 million mapproximately 450 million m33..
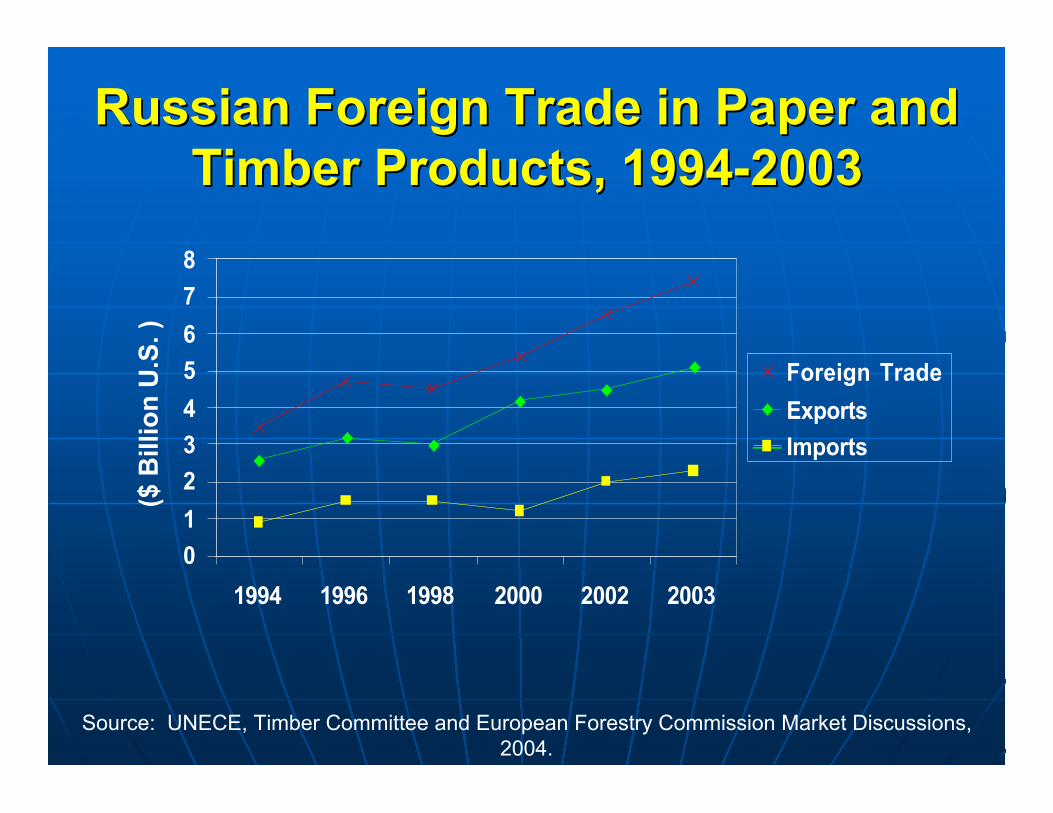
Russian Foreign Trade in Paper andRussian Foreign Trade in Paper andTimber Products, 1994-2003Timber Products, 1994-2003
0
1
2
3
4
5
6
7
8
1994 1996 1998 2000 2002 2003
Foreign Trade
Exports
Imports
($ B
illio
n U
.S. )
Source: UNECE, Timber Committee and European Forestry Commission Market Discussions,2004.
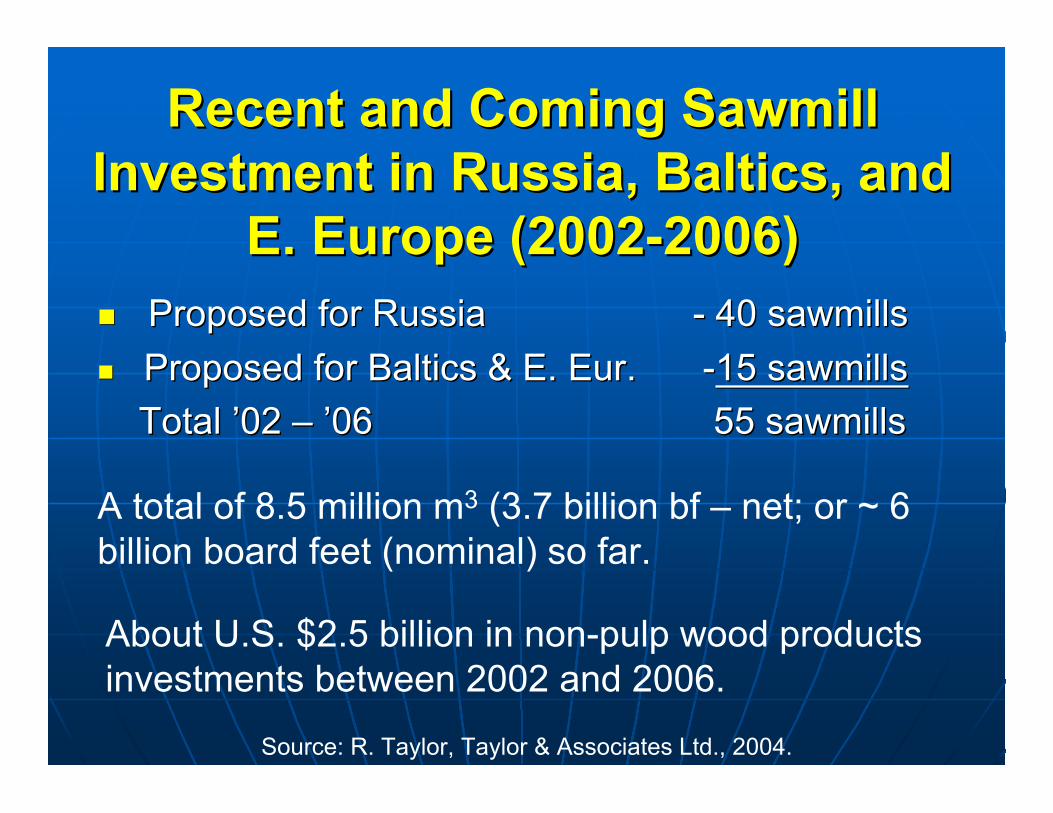
Recent and Coming SawmillRecent and Coming SawmillInvestment in Russia, Investment in Russia, BalticsBaltics, and, and
E. Europe (2002-2006)E. Europe (2002-2006)nn Proposed for RussiaProposed for Russia - 40 sawmills - 40 sawmills
nn Proposed for Proposed for BalticsBaltics & E. & E. EurEur. . - -15 sawmills15 sawmills
Total Total ’’02 02 –– ’’06 06 55 sawmills 55 sawmills
Source: R. Taylor, Taylor & Associates Ltd., 2004.
A total of 8.5 million m3 (3.7 billion bf – net; or ~ 6billion board feet (nominal) so far.
About U.S. $2.5 billion in non-pulp wood productsinvestments between 2002 and 2006.
Growth of Global Fiber SuppliesGrowth of Global Fiber Supplies
vv Plantations Plantationsvv Re-emergence of the forestRe-emergence of the forest sector of Russia and Eastern sector of Russia and Eastern Europe Europevv Increasing Availability ofIncreasing Availability of Tropical Timber Tropical Timber
Global Mega-TrendsGlobal Mega-Trends
nn GlobalizationGlobalization
nn Expansion of the global economy Expansion of the global economy
nn Growth of energy demand and Growth of energy demand and
the approach of peak petroleum the approach of peak petroleum
nn Increasing interest in bio-energy Increasing interest in bio-energy
nn Growth of global fiber supplies Growth of global fiber supplies
nn Rising global competitionRising global competition
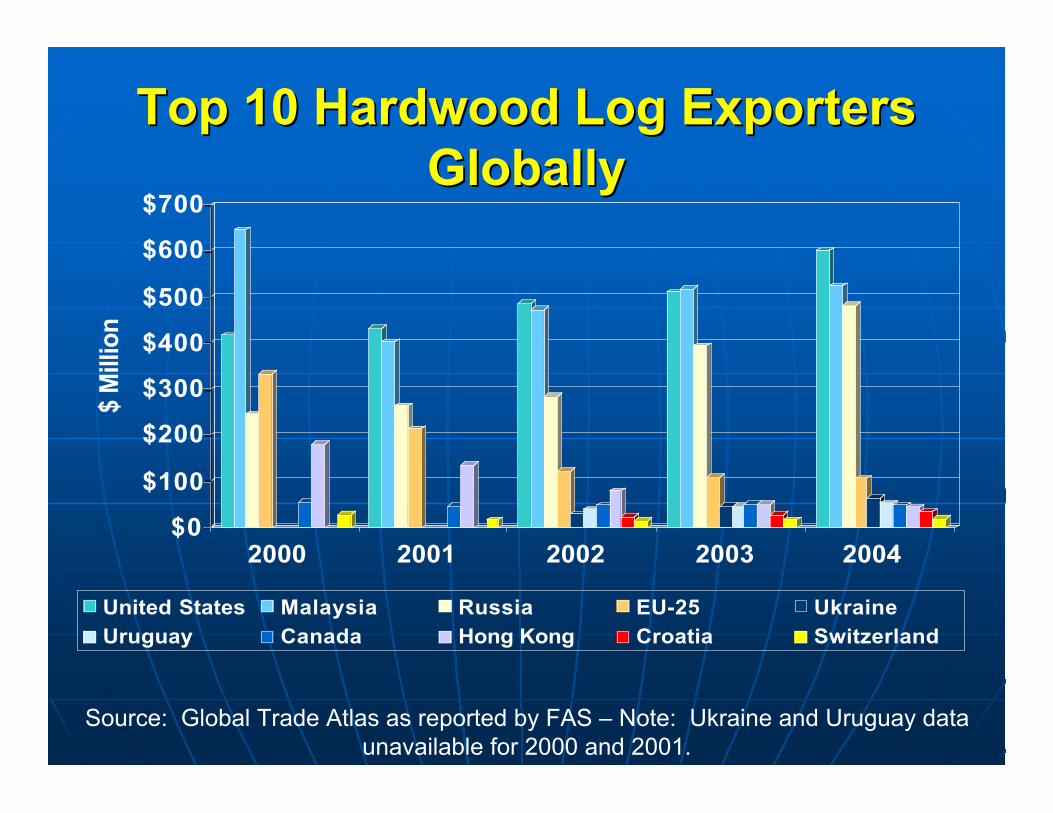
Top 10 Hardwood Log ExportersTop 10 Hardwood Log ExportersGloballyGlobally
$0
$100
$200
$300
$400
$500
$600
$700
$ M
illio
n
2000 2001 2002 2003 2004
United States Malaysia Russia EU-25 UkraineUruguay Canada Hong Kong Croatia Switzerland
Source: Global Trade Atlas as reported by FAS – Note: Ukraine and Uruguay dataunavailable for 2000 and 2001.
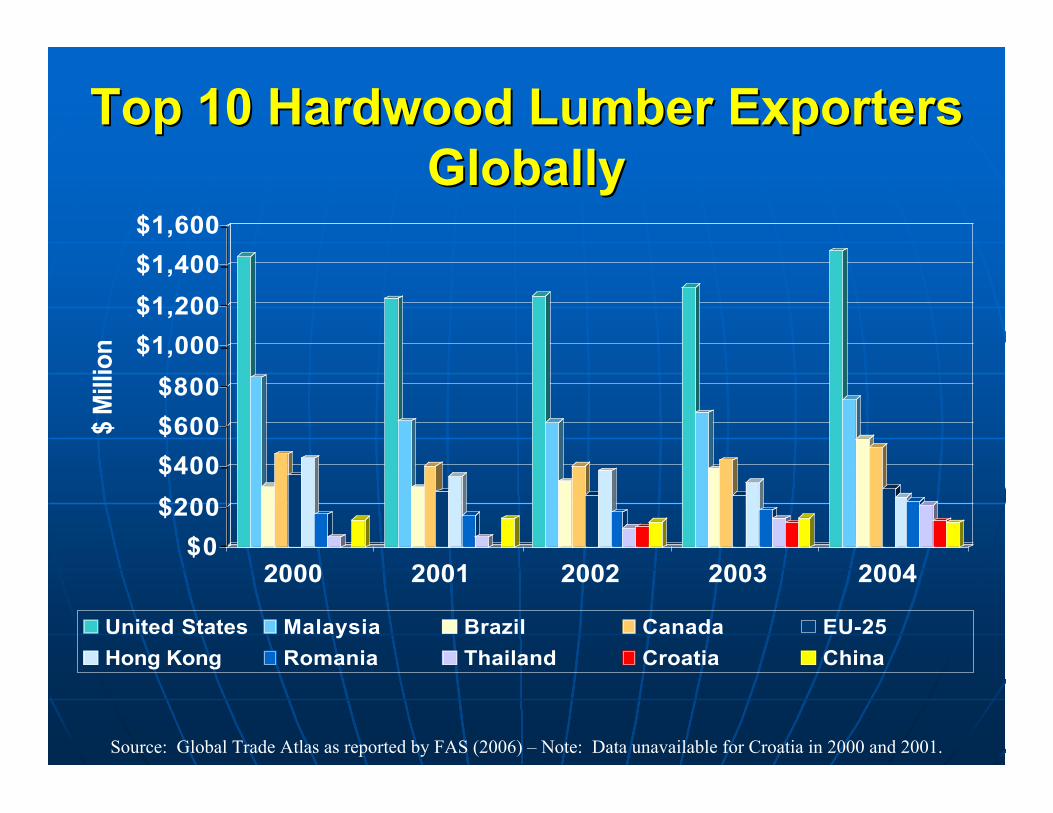
Top 10 Hardwood Lumber ExportersTop 10 Hardwood Lumber ExportersGloballyGlobally
$0
$200
$400
$600
$800
$1,000
$1,200
$1,400
$1,600
$ M
illio
n
2000 2001 2002 2003 2004
United States Malaysia Brazil Canada EU-25
Hong Kong Romania Thailand Croatia China
Source: Global Trade Atlas as reported by FAS (2006) – Note: Data unavailable for Croatia in 2000 and 2001.
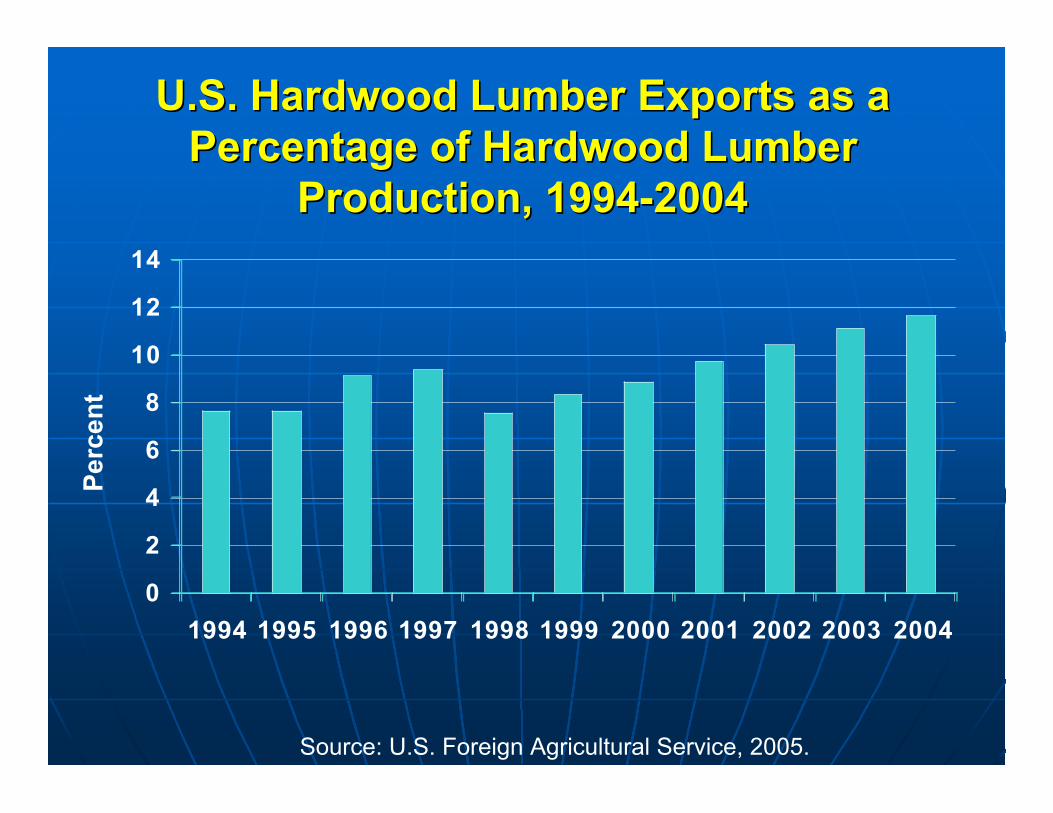
U.S. Hardwood Lumber Exports as aU.S. Hardwood Lumber Exports as aPercentage of Hardwood LumberPercentage of Hardwood Lumber
Production, 1994-2004Production, 1994-2004
0
2
4
6
8
10
12
14
1994 1995 1996 1997 1998 1999 2000 2001 2002 2003 2004
Per
cen
t
Source: U.S. Foreign Agricultural Service, 2005.
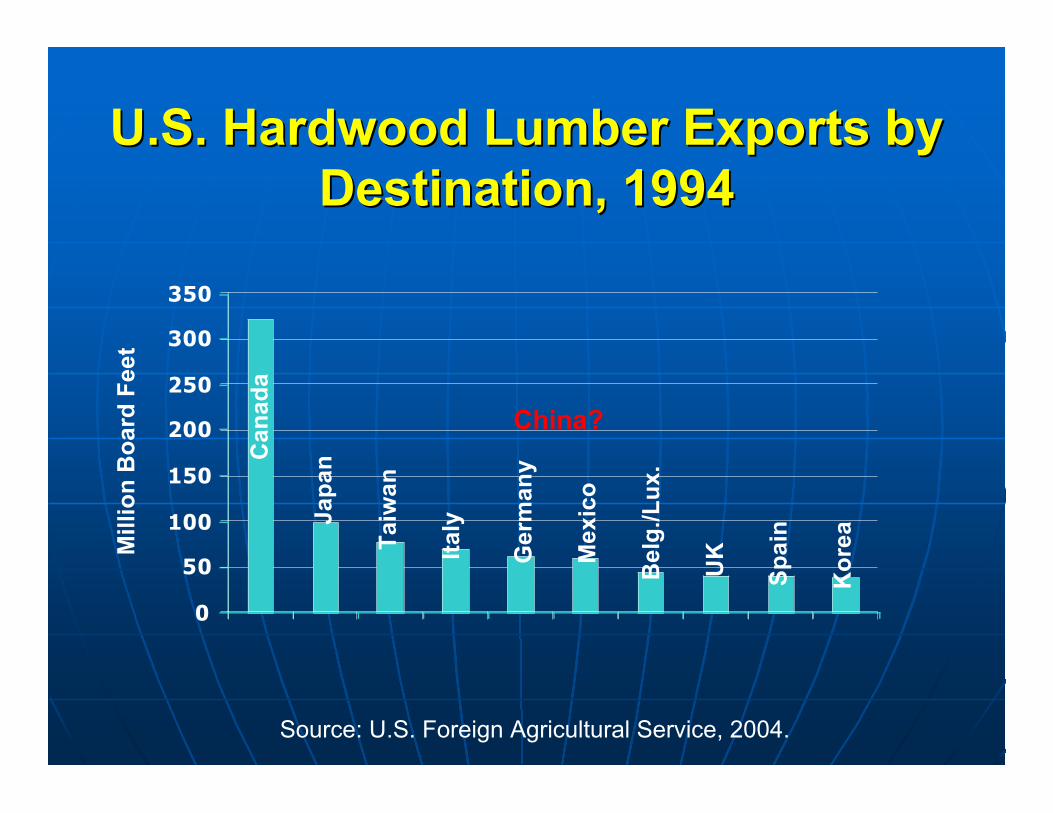
U.S. Hardwood Lumber Exports byU.S. Hardwood Lumber Exports byDestination, 1994Destination, 1994
0
50
100
150
200
250
300
350
Mill
ion
Bo
ard
Fee
t
Source: U.S. Foreign Agricultural Service, 2004.
Can
ada
Jap
an
Tai
wan
Ital
y
Ger
man
y
Bel
g./L
ux.
Mex
ico
Ko
rea
Sp
ain
UK
China?
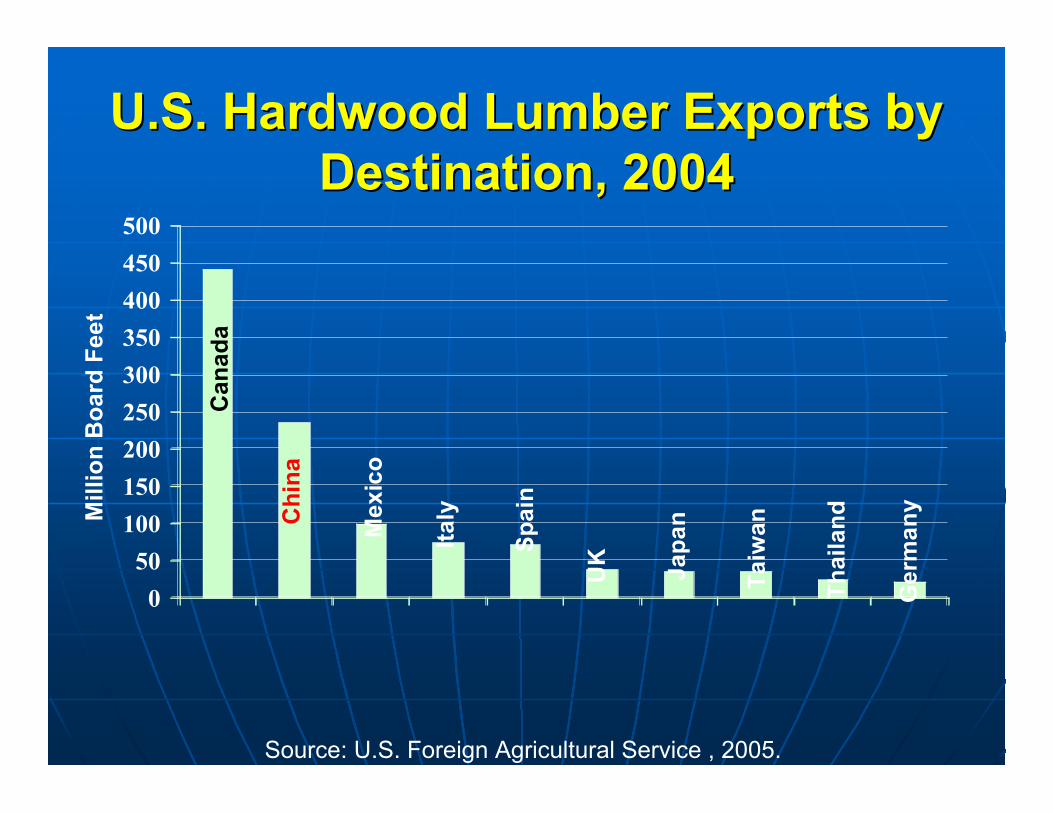
U.S. Hardwood Lumber Exports byU.S. Hardwood Lumber Exports byDestination, 2004Destination, 2004
0
50
100
150
200
250
300
350
400
450
500
Mill
ion
Bo
ard
Fee
t
Source: U.S. Foreign Agricultural Service , 2005.
Can
ada
Ch
ina
Mex
ico
Sp
ain
Ital
y
Jap
an
UK
Ger
man
y
Th
aila
nd
Tai
wan
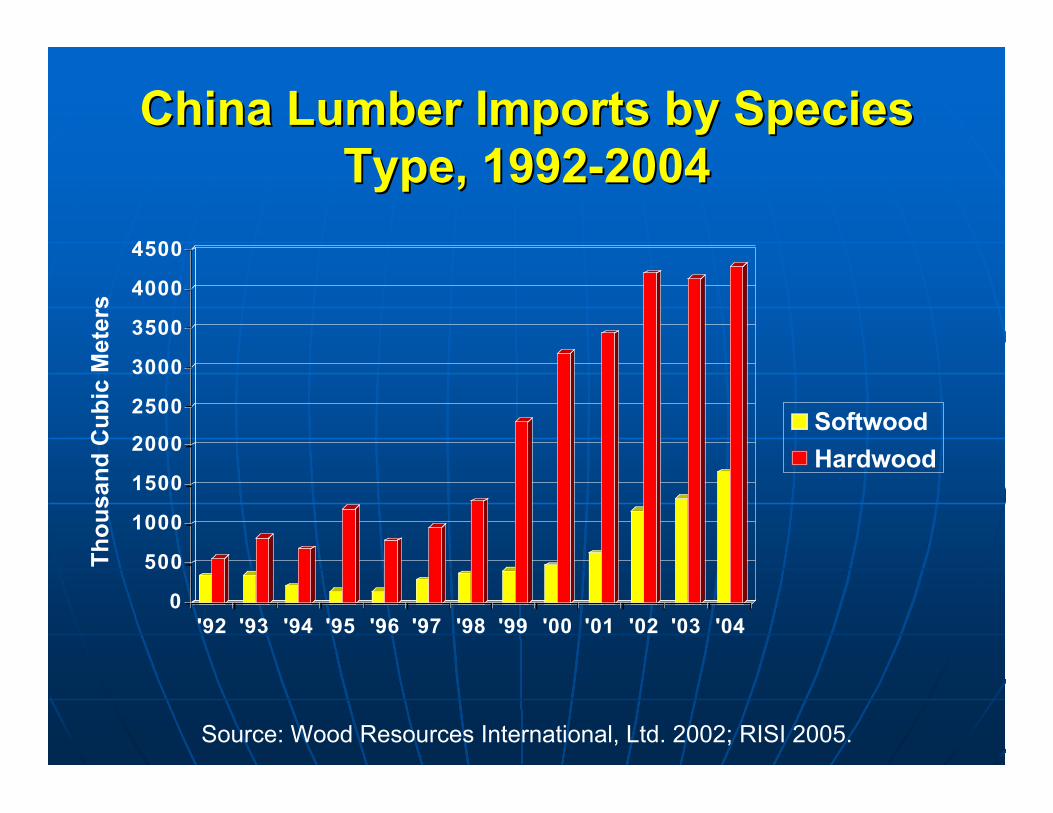
0
500
1000
1500
2000
2500
3000
3500
4000
4500
'92 '93 '94 '95 '96 '97 '98 '99 '00 '01 '02 '03 '04
Softwood
Hardwood
Source: Wood Resources International, Ltd. 2002; RISI 2005.
China Lumber Imports by SpeciesChina Lumber Imports by SpeciesType, 1992-2004Type, 1992-2004
Th
ou
san
d C
ub
ic M
eter
s
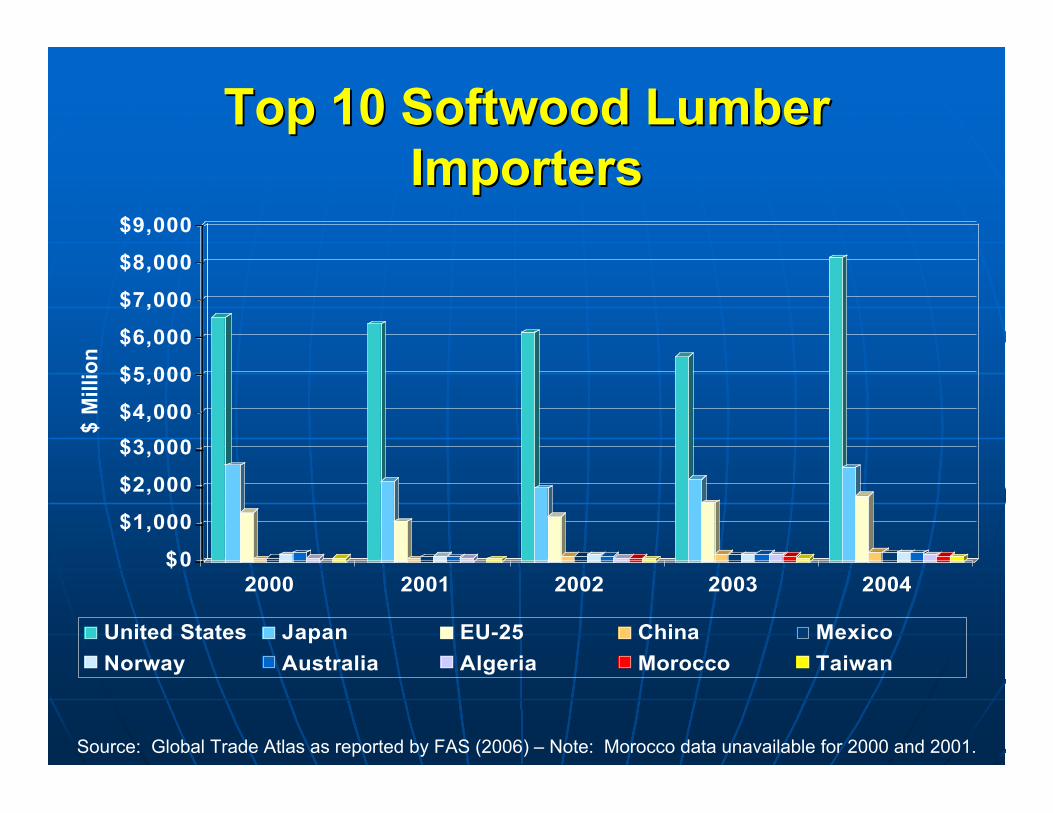
Top 10 Softwood LumberTop 10 Softwood LumberImportersImporters
$0
$1,000
$2,000
$3,000
$4,000
$5,000
$6,000
$7,000
$8,000
$9,000
$ M
illio
n
2000 2001 2002 2003 2004
United States Japan EU-25 China Mexico
Norway Australia Algeria Morocco Taiwan
Source: Global Trade Atlas as reported by FAS (2006) – Note: Morocco data unavailable for 2000 and 2001.
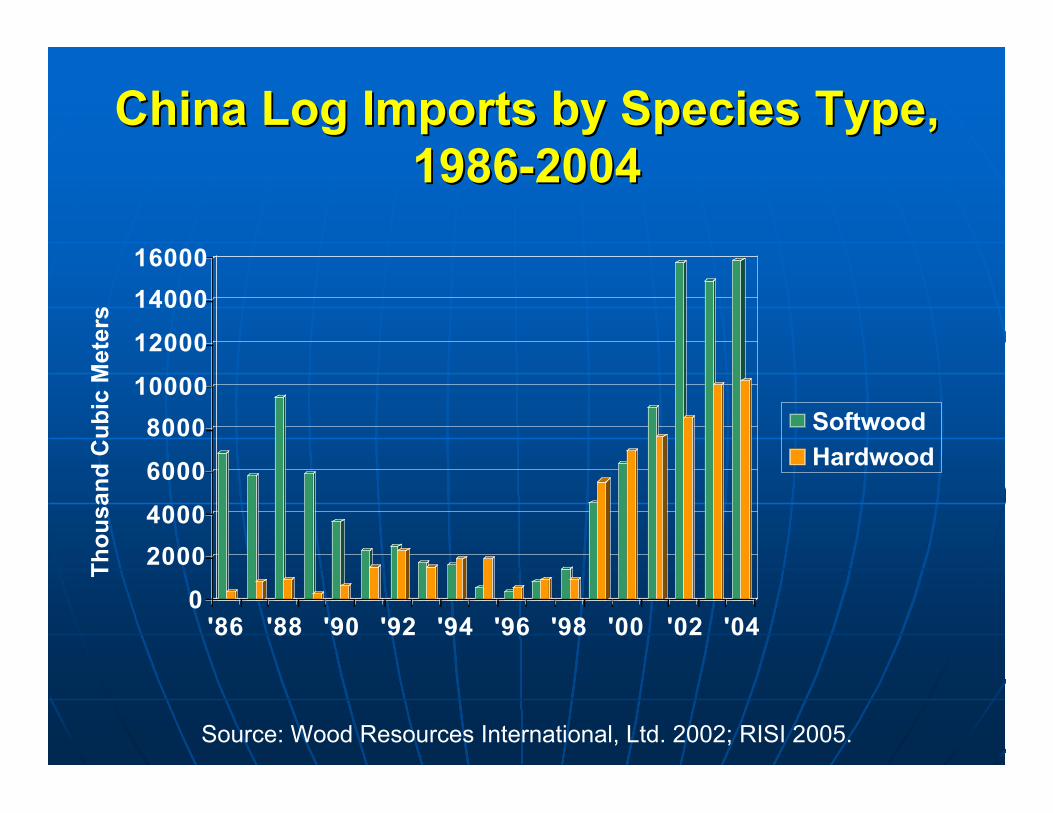
0
2000
4000
6000
8000
10000
12000
14000
16000
'86 '88 '90 '92 '94 '96 '98 '00 '02 '04
Softwood
Hardwood
Source: Wood Resources International, Ltd. 2002; RISI 2005.
China Log Imports by Species Type,China Log Imports by Species Type,1986-20041986-2004
Th
ou
san
d C
ub
ic M
eter
s
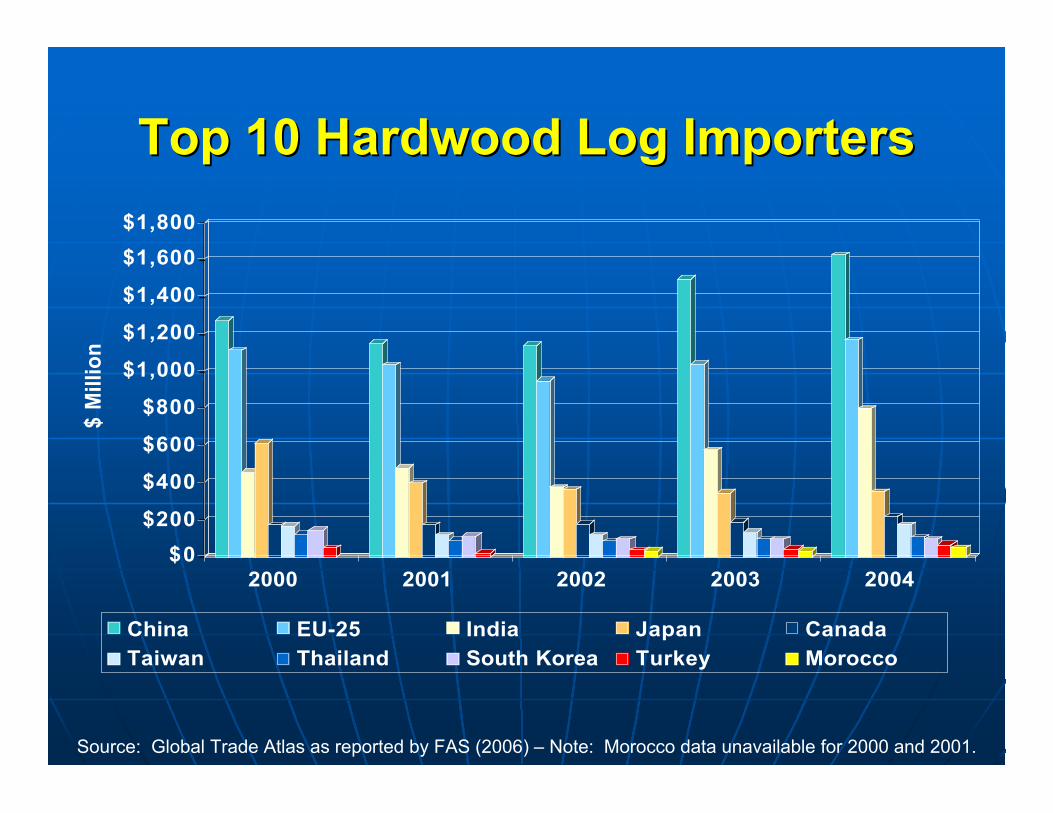
Top 10 Hardwood Log ImportersTop 10 Hardwood Log Importers
$0
$200
$400
$600
$800
$1,000
$1,200
$1,400
$1,600
$1,800
$ M
illio
n
2000 2001 2002 2003 2004
China EU-25 India Japan CanadaTaiwan Thailand South Korea Turkey Morocco
Source: Global Trade Atlas as reported by FAS (2006) – Note: Morocco data unavailable for 2000 and 2001.
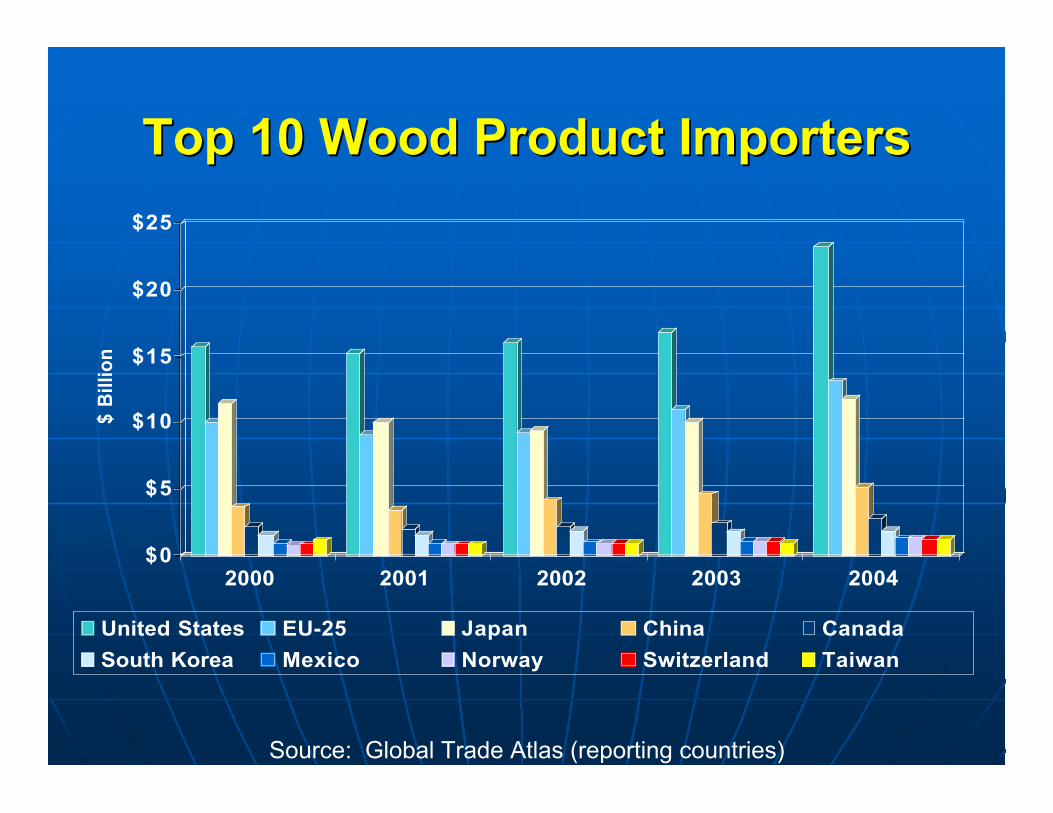
Top 10 Wood Product ImportersTop 10 Wood Product Importers
$0
$5
$10
$15
$20
$25
$ B
illio
n
2000 2001 2002 2003 2004
United States EU-25 Japan China Canada
South Korea Mexico Norway Switzerland Taiwan
Source: Global Trade Atlas (reporting countries)
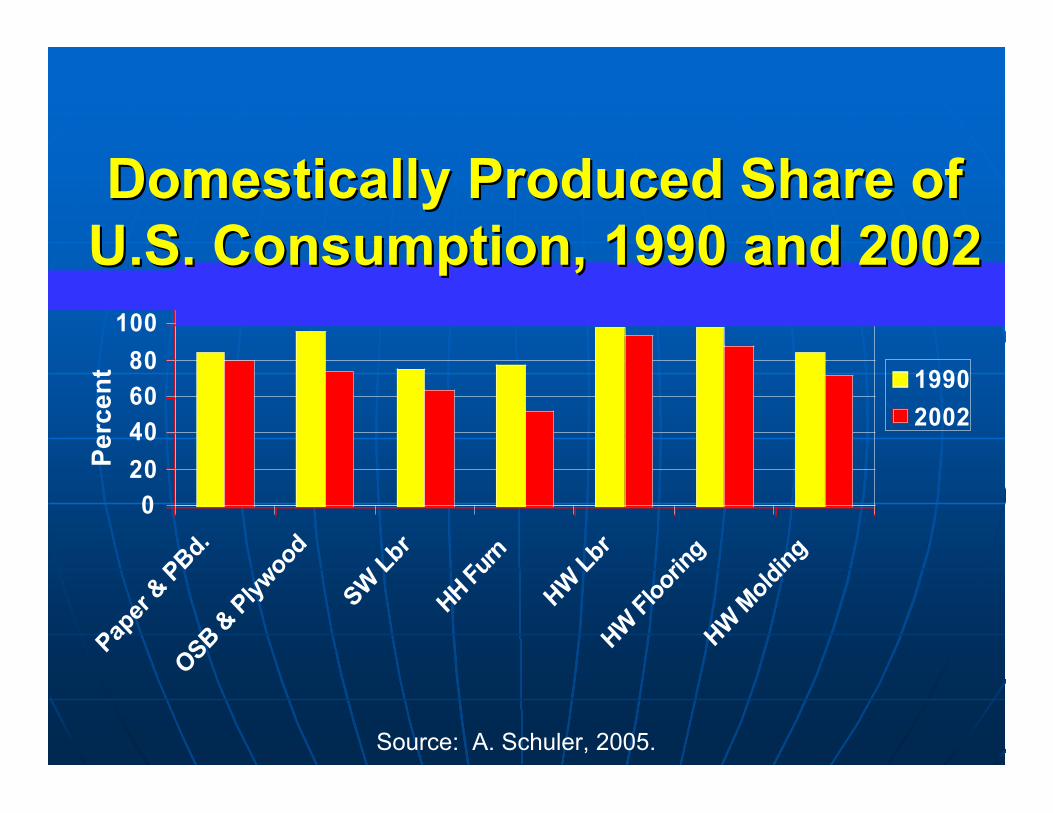
0
20
40
60
80
100
120
Paper
& P
Bd.
OSB & P
lywoo
d
SW L
br
HH Fur
n
HW L
br
HW F
loor
ing
HW M
oldi
ng
1990
2002
Source: A. Schuler, 2005.
Per
cen
t
Domestically Produced Share ofDomestically Produced Share ofU.S. Consumption, 1990 and 2002U.S. Consumption, 1990 and 2002
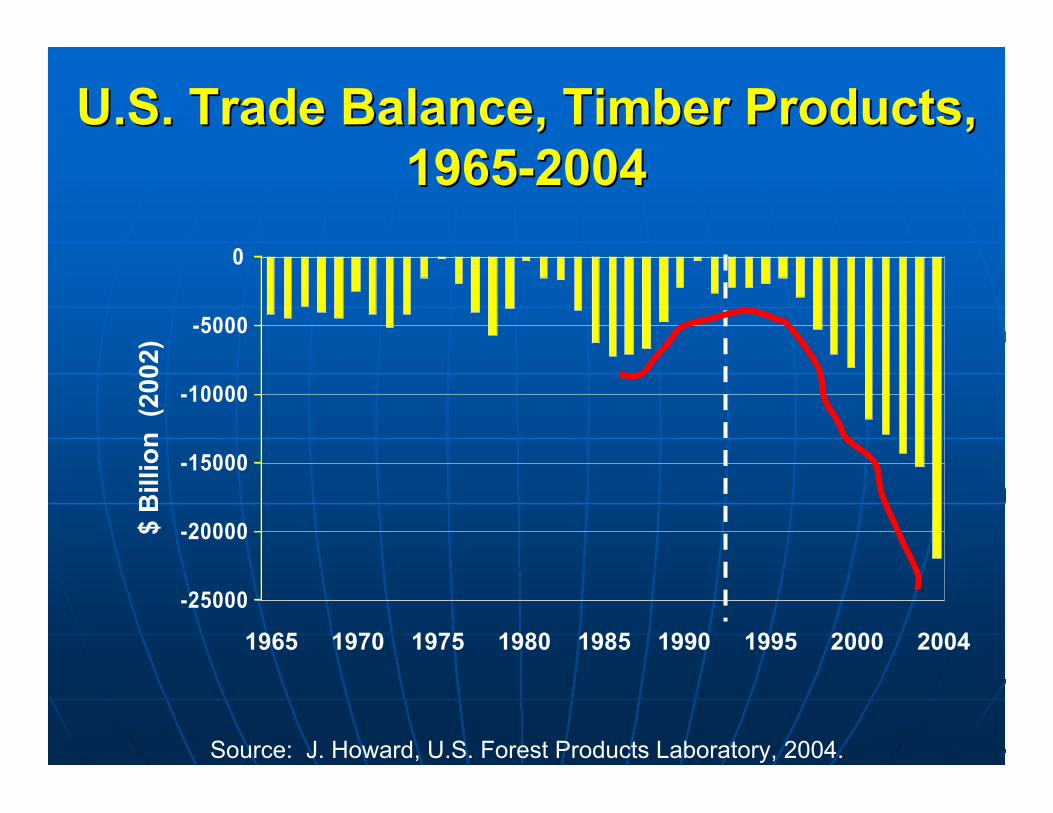
U.S. Trade Balance, Timber Products,U.S. Trade Balance, Timber Products,1965-20041965-2004
-25000
-20000
-15000
-10000
-5000
0
$ B
illio
n (
2002
)
Source: J. Howard, U.S. Forest Products Laboratory, 2004.
1965 1970 1975 1980 1985 1990 1995 2000 2004
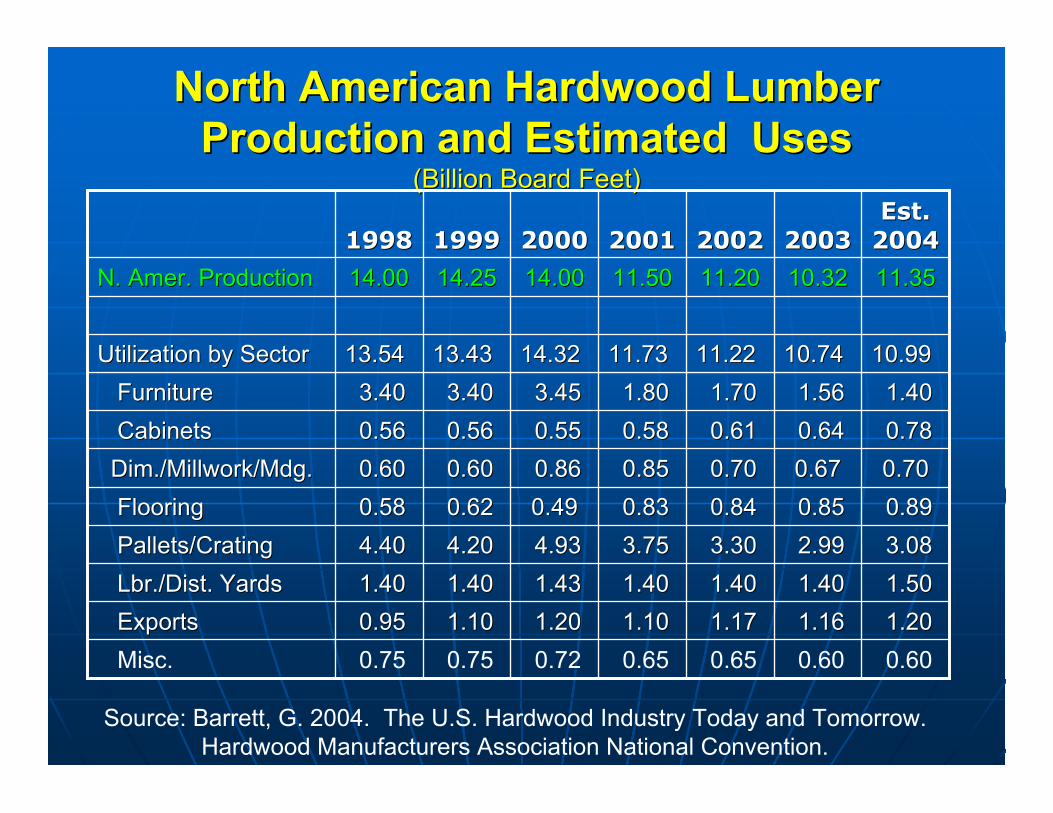
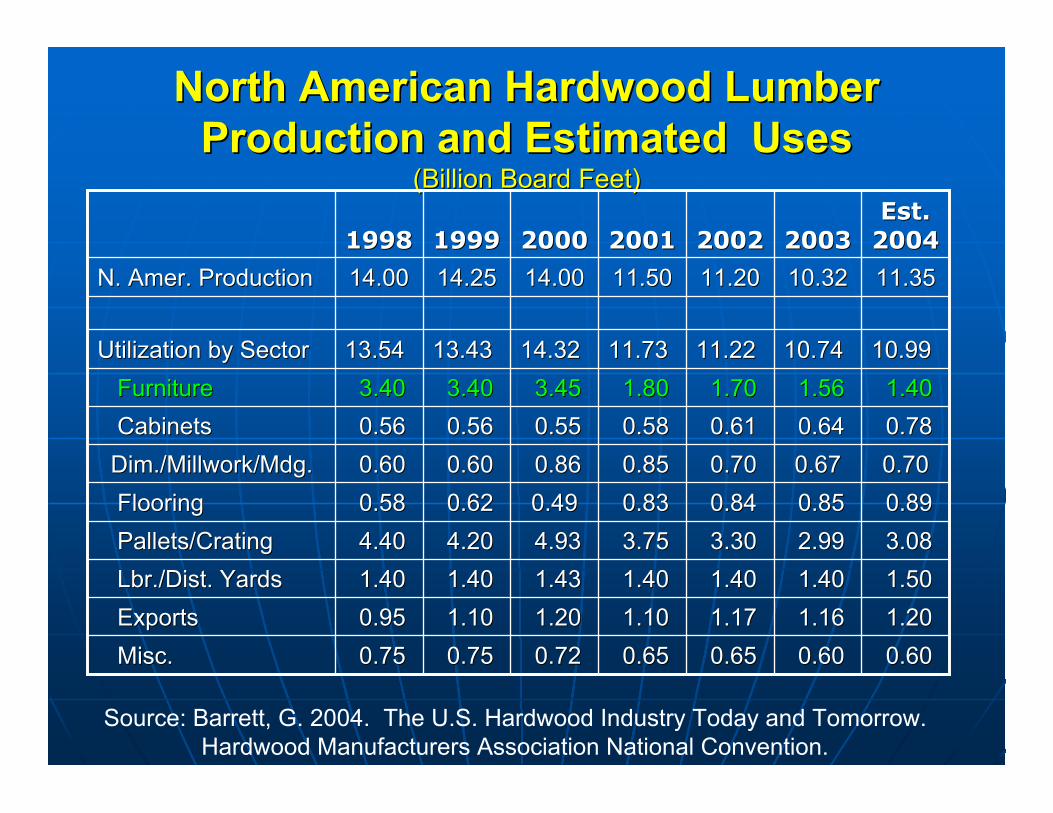
North American Hardwood LumberNorth American Hardwood LumberProduction and Estimated UsesProduction and Estimated Uses
(Billion Board Feet)(Billion Board Feet)
0.60 0.60 0.65 0.65 0.72 0.75 0.75 Misc.
1.20 1.20 1.16 1.16 1.17 1.17 1.10 1.10 1.20 1.20 1.10 1.10 0.95 0.95 Exports Exports
1.50 1.50 1.40 1.40 1.40 1.40 1.40 1.40 1.43 1.43 1.40 1.40 1.40 1.40 LbrLbr./Dist. Yards./Dist. Yards
3.08 3.08 2.99 2.99 3.30 3.30 3.75 3.75 4.93 4.93 4.20 4.20 4.40 4.40 Pallets/Crating Pallets/Crating
0.89 0.89 0.85 0.85 0.84 0.84 0.83 0.830.490.49 0.62 0.62 0.58 0.58 Flooring Flooring
0.700.700.670.67 0.70 0.70 0.85 0.85 0.86 0.86 0.60 0.60 0.60 0.60 Dim./Millwork/ Dim./Millwork/MdgMdg..
0.78 0.78 0.64 0.64 0.61 0.61 0.58 0.58 0.55 0.55 0.56 0.56 0.56 0.56 Cabinets Cabinets
1.40 1.40 1.56 1.56 1.70 1.70 1.80 1.80 3.45 3.45 3.40 3.40 3.40 3.40 Furniture Furniture
10.9910.9910.7410.7411.2211.2211.7311.7314.3214.3213.4313.4313.5413.54Utilization by SectorUtilization by Sector
11.3511.3510.3210.3211.2011.2011.5011.5014.0014.0014.2514.2514.0014.00N. Amer. ProductionN. Amer. Production
Est.Est.20042004200320032002200220012001200020001999199919981998
Source: Barrett, G. 2004. The U.S. Hardwood Industry Today and Tomorrow.Hardwood Manufacturers Association National Convention.
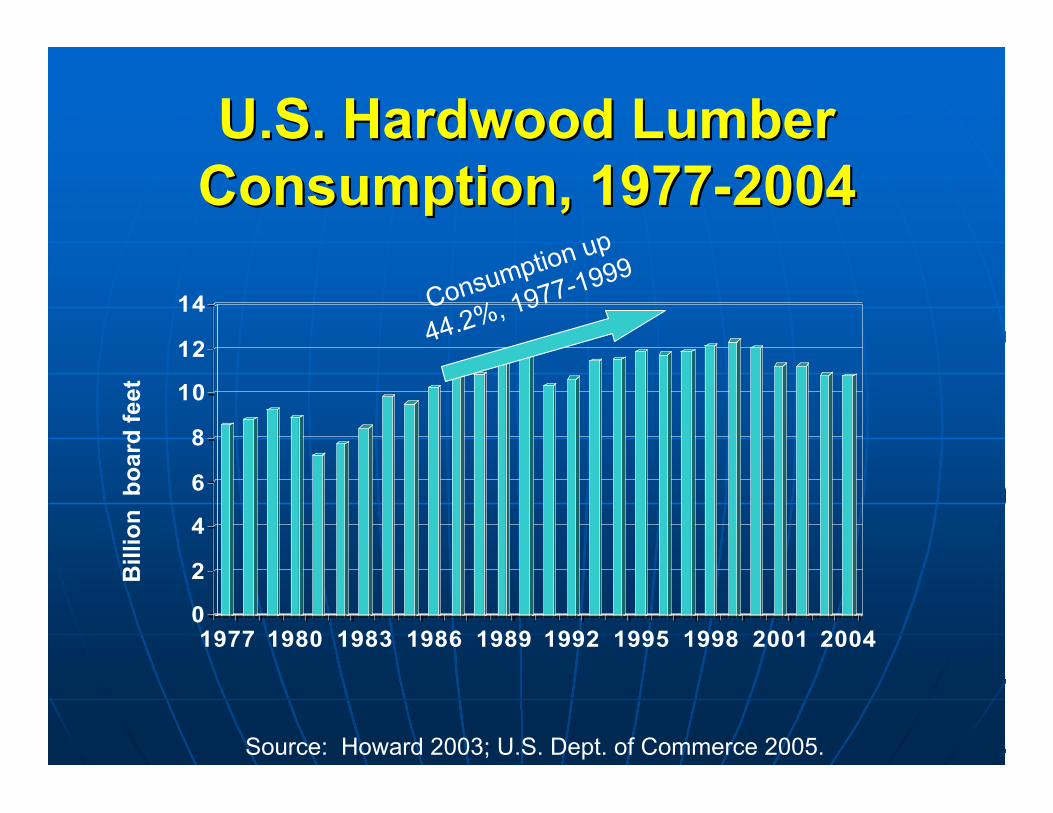
U.S. Hardwood LumberU.S. Hardwood LumberConsumption, 1977-2004Consumption, 1977-2004
0
2
4
6
8
10
12
14
1977 1980 1983 1986 1989 1992 1995 1998 2001 2004
Bill
ion
bo
ard
fee
t
Source: Howard 2003; U.S. Dept. of Commerce 2005.
Consumption up
44.2%, 1977-1999
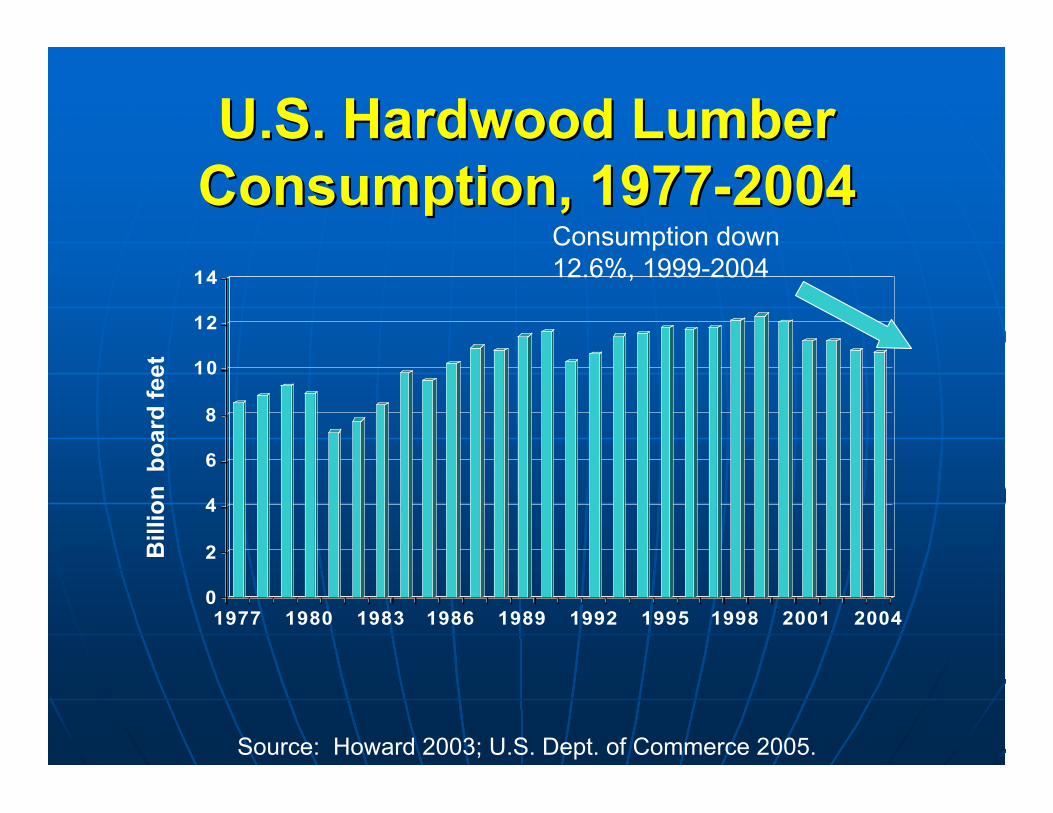
U.S. Hardwood LumberU.S. Hardwood LumberConsumption, 1977-2004Consumption, 1977-2004
0
2
4
6
8
10
12
14
1977 1980 1983 1986 1989 1992 1995 1998 2001 2004
Bill
ion
bo
ard
fee
t
Source: Howard 2003; U.S. Dept. of Commerce 2005.
Consumption down12.6%, 1999-2004
North American Hardwood LumberNorth American Hardwood LumberProduction and Estimated UsesProduction and Estimated Uses
(Billion Board Feet)(Billion Board Feet)
0.60 0.60 0.60 0.60 0.65 0.65 0.65 0.65 0.72 0.72 0.75 0.75 0.75 0.75 Misc. Misc.
1.20 1.20 1.16 1.16 1.17 1.17 1.10 1.10 1.20 1.20 1.10 1.10 0.95 0.95 Exports Exports
1.50 1.50 1.40 1.40 1.40 1.40 1.40 1.40 1.43 1.43 1.40 1.40 1.40 1.40 LbrLbr./Dist. Yards./Dist. Yards
3.08 3.08 2.99 2.99 3.30 3.30 3.75 3.75 4.93 4.93 4.20 4.20 4.40 4.40 Pallets/Crating Pallets/Crating
0.89 0.89 0.85 0.85 0.84 0.84 0.83 0.830.490.49 0.62 0.62 0.58 0.58 Flooring Flooring
0.700.700.670.67 0.70 0.70 0.85 0.85 0.86 0.86 0.60 0.60 0.60 0.60 Dim./Millwork/ Dim./Millwork/MdgMdg..
0.78 0.78 0.64 0.64 0.61 0.61 0.58 0.58 0.55 0.55 0.56 0.56 0.56 0.56 Cabinets Cabinets
1.40 1.40 1.56 1.56 1.70 1.70 1.80 1.80 3.45 3.45 3.40 3.40 3.40 3.40 Furniture Furniture
10.9910.9910.7410.7411.2211.2211.7311.7314.3214.3213.4313.4313.5413.54Utilization by SectorUtilization by Sector
11.3511.3510.3210.3211.2011.2011.5011.5014.0014.0014.2514.2514.0014.00N. Amer. ProductionN. Amer. Production
Est.Est.20042004200320032002200220012001200020001999199919981998
Source: Barrett, G. 2004. The U.S. Hardwood Industry Today and Tomorrow.Hardwood Manufacturers Association National Convention.
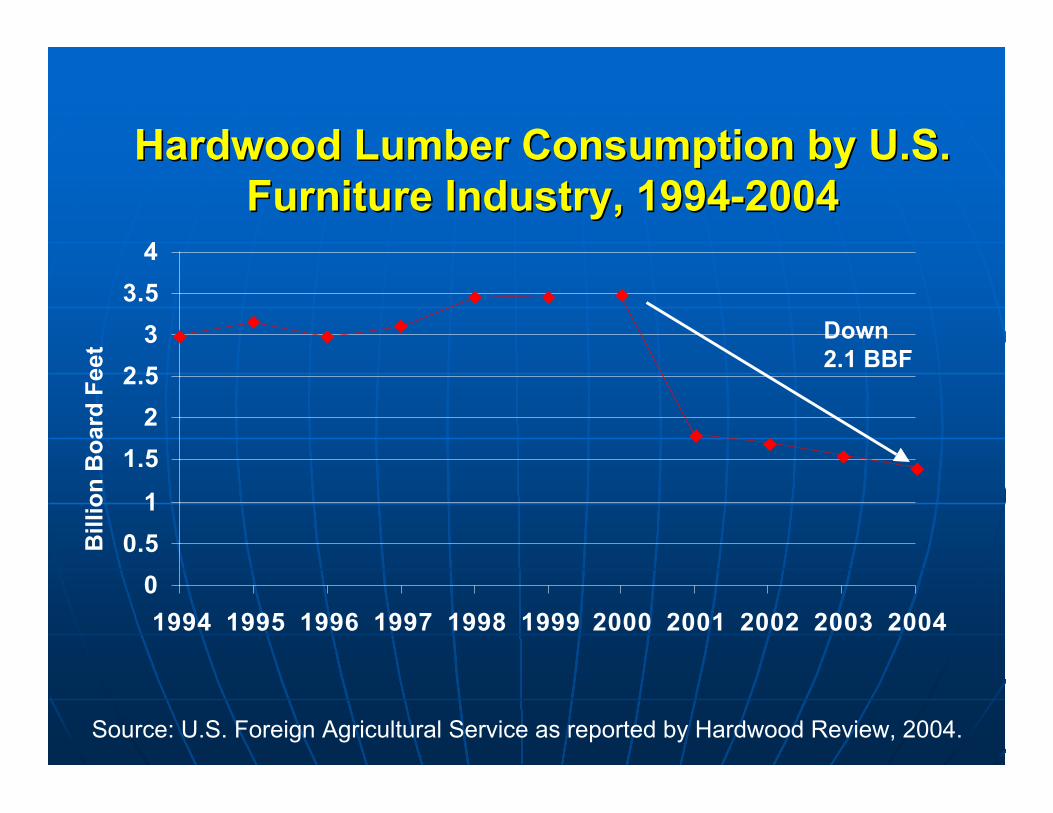
Hardwood Lumber Consumption by U.S.Hardwood Lumber Consumption by U.S.Furniture Industry, 1994-2004Furniture Industry, 1994-2004
0
0.5
1
1.5
2
2.5
3
3.5
4
1994 1995 1996 1997 1998 1999 2000 2001 2002 2003 2004
Bill
ion
Bo
ard
Fee
t
Source: U.S. Foreign Agricultural Service as reported by Hardwood Review, 2004.
Down2.1 BBF
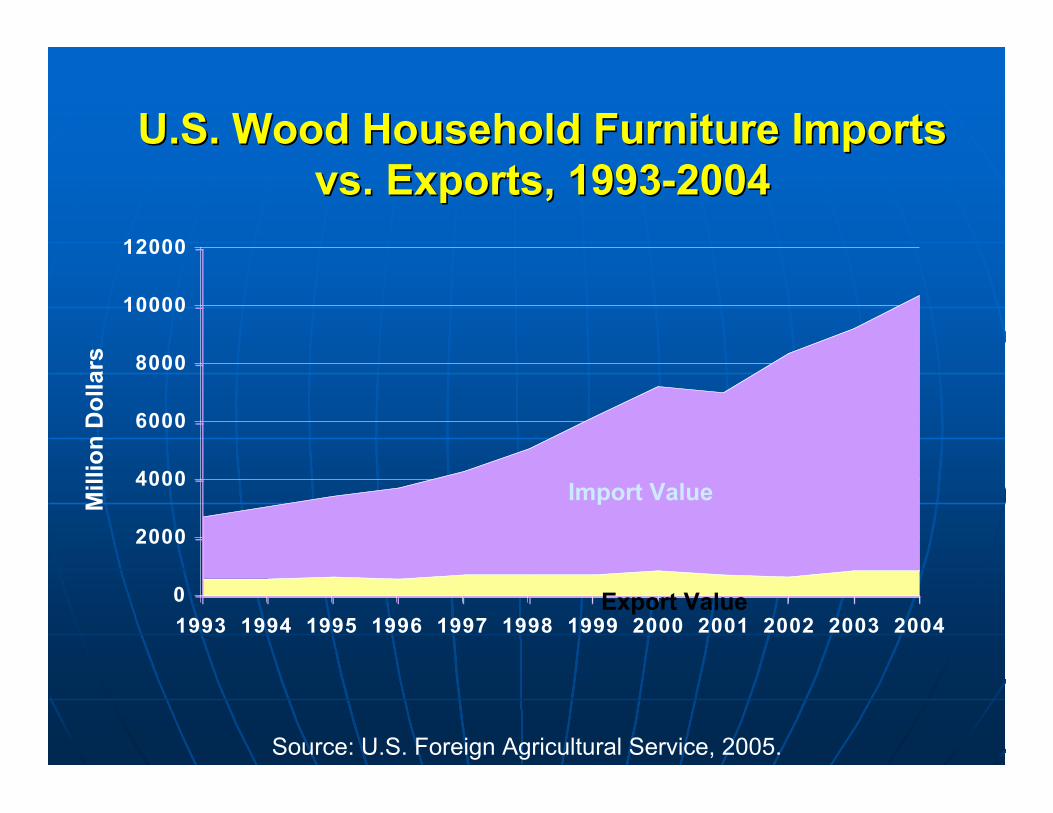
U.S. Wood Household Furniture ImportsU.S. Wood Household Furniture Importsvs. Exports, 1993-2004vs. Exports, 1993-2004
0
2000
4000
6000
8000
10000
12000
1993 1994 1995 1996 1997 1998 1999 2000 2001 2002 2003 2004
Mill
ion
Do
llars
Source: U.S. Foreign Agricultural Service, 2005.
Export Value
Import Value
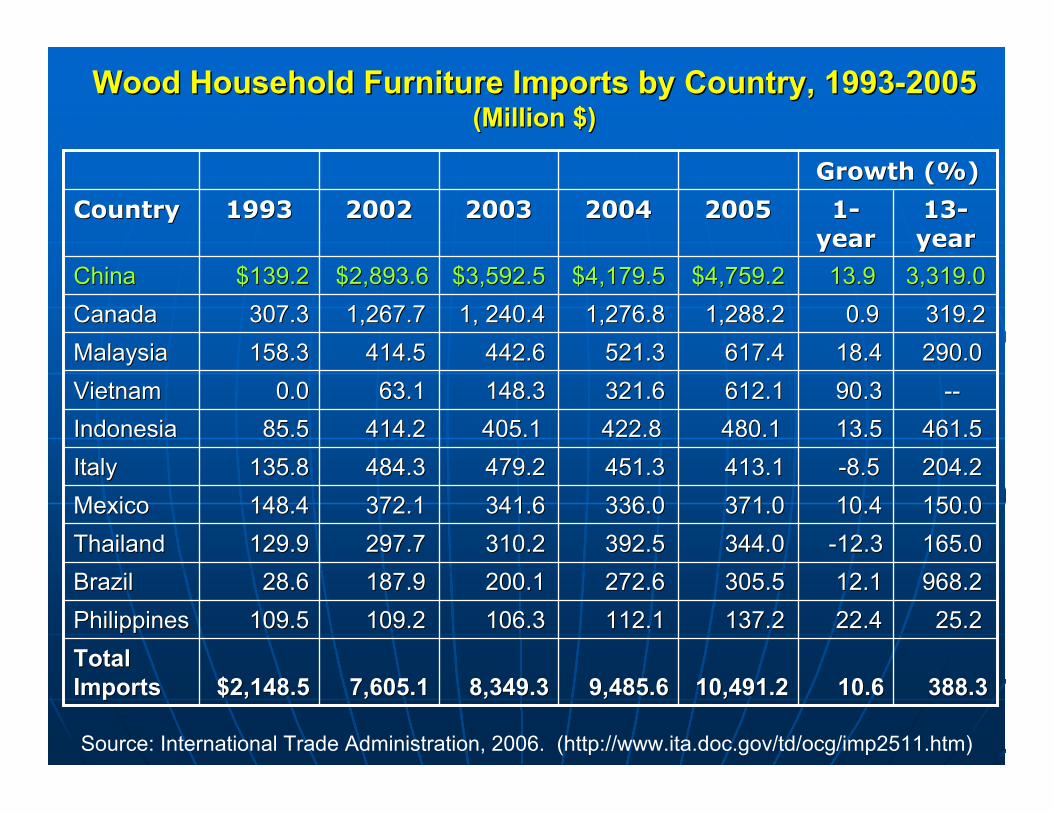
Wood Household Furniture Imports by Country, 1993-2005Wood Household Furniture Imports by Country, 1993-2005(Million $)(Million $)
290.0 290.0 18.4 18.4 617.4 617.4 521.3 521.3 442.6 442.6 414.5 414.5 158.3 158.3MalaysiaMalaysia
9,485.69,485.6
112.1 112.1
272.6 272.6
392.5 392.5
336.0 336.0
451.3 451.3
422.8 422.8
321.6 321.6
1,276.8 1,276.8
$4,179.5$4,179.5
20042004
8,349.38,349.3
106.3 106.3
200.1 200.1
310.2 310.2
341.6 341.6
479.2 479.2
405.1 405.1
148.3 148.3
1, 240.4 1, 240.4
$3,592.5$3,592.5
20032003 13-13-yearyear
1-1-yearyear
200520052002200219931993CountryCountry
10.610.6
22.4 22.4
12.1 12.1
-12.3 -12.3
10.4 10.4
-8.5 -8.5
13.5 13.5
90.3 90.3
0.9 0.9
13.9 13.9
Growth (%)Growth (%)
388.3388.310,491.210,491.27,605.17,605.1$2,148.5$2,148.5TotalTotalImportsImports
25.2 25.2 137.2 137.2 109.2 109.2 109.5 109.5PhilippinesPhilippines
968.2 968.2 305.5 305.5 187.9 187.9 28.6 28.6BrazilBrazil
165.0 165.0 344.0 344.0 297.7 297.7 129.9 129.9ThailandThailand
150.0 150.0 371.0 371.0 372.1 372.1 148.4 148.4MexicoMexico
204.2 204.2 413.1 413.1 484.3 484.3 135.8 135.8ItalyItaly
461.5 461.5 480.1 480.1 414.2 414.2 85.5 85.5IndonesiaIndonesia
-- -- 612.1 612.1 63.1 63.1 0.0 0.0VietnamVietnam
319.2 319.2 1,288.2 1,288.2 1,267.7 1,267.7 307.3 307.3CanadaCanada
3,319.03,319.0$4,759.2$4,759.2 $2,893.6 $2,893.6 $139.2 $139.2ChinaChina
Source: International Trade Administration, 2006. (http://www.ita.doc.gov/td/ocg/imp2511.htm)

North American Hardwood LumberNorth American Hardwood LumberProduction and Estimated UsesProduction and Estimated Uses
(Billion Board Feet)(Billion Board Feet)
0.60 0.60 0.60 0.60 0.65 0.65 0.65 0.65 0.72 0.72 0.75 0.75 0.75 0.75 Misc. Misc.
1.20 1.20 1.16 1.16 1.17 1.17 1.10 1.10 1.20 1.20 1.10 1.10 0.95 0.95 Exports Exports
1.50 1.50 1.40 1.40 1.40 1.40 1.40 1.40 1.43 1.43 1.40 1.40 1.40 1.40 LbrLbr./Dist. Yards./Dist. Yards
3.08 3.08 2.99 2.99 3.30 3.30 3.75 3.75 4.93 4.93 4.20 4.20 4.40 4.40 Pallets/Crating Pallets/Crating
0.89 0.89 0.85 0.85 0.84 0.84 0.83 0.830.490.49 0.62 0.62 0.58 0.58 Flooring Flooring
0.700.700.670.67 0.70 0.70 0.85 0.85 0.86 0.86 0.60 0.60 0.60 0.60 Dim./Millwork/ Dim./Millwork/MldgMldg..
0.78 0.78 0.64 0.64 0.61 0.61 0.58 0.58 0.55 0.55 0.56 0.56 0.56 0.56 Cabinets Cabinets
1.40 1.40 1.56 1.56 1.70 1.70 1.80 1.80 3.45 3.45 3.40 3.40 3.40 3.40 Furniture Furniture
10.9910.9910.7410.7411.2211.2211.7311.7314.3214.3213.4313.4313.5413.54Utilization by SectorUtilization by Sector
11.3511.3510.3210.3211.2011.2011.5011.5014.0014.0014.2514.2514.0014.00N. Amer. ProductionN. Amer. Production
Est.Est.20042004200320032002200220012001200020001999199919981998
Source: Barrett, G. 2004. The U.S. Hardwood Industry Today and Tomorrow.Hardwood Manufacturers Association National Convention.
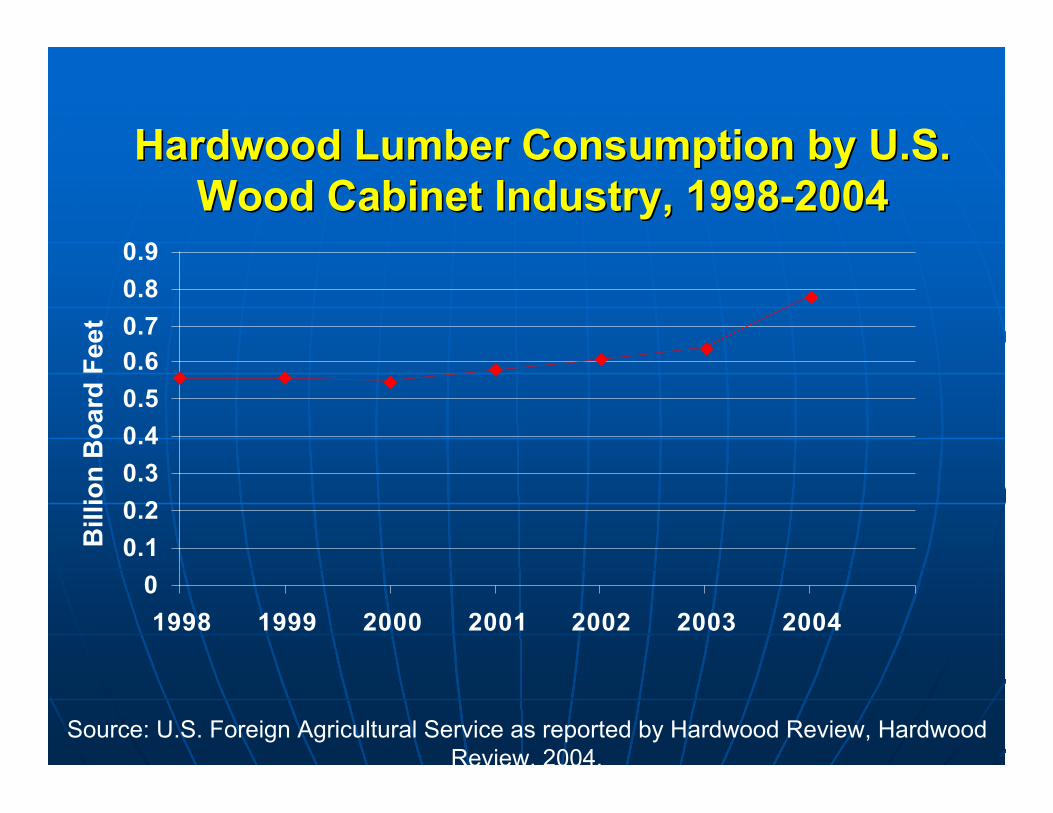
Hardwood Lumber Consumption by U.S.Hardwood Lumber Consumption by U.S.Wood Cabinet Industry, 1998-2004Wood Cabinet Industry, 1998-2004
0
0.1
0.2
0.3
0.4
0.5
0.6
0.7
0.8
0.9
1998 1999 2000 2001 2002 2003 2004
Bill
ion
Bo
ard
Fee
t
Source: U.S. Foreign Agricultural Service as reported by Hardwood Review, HardwoodReview, 2004.
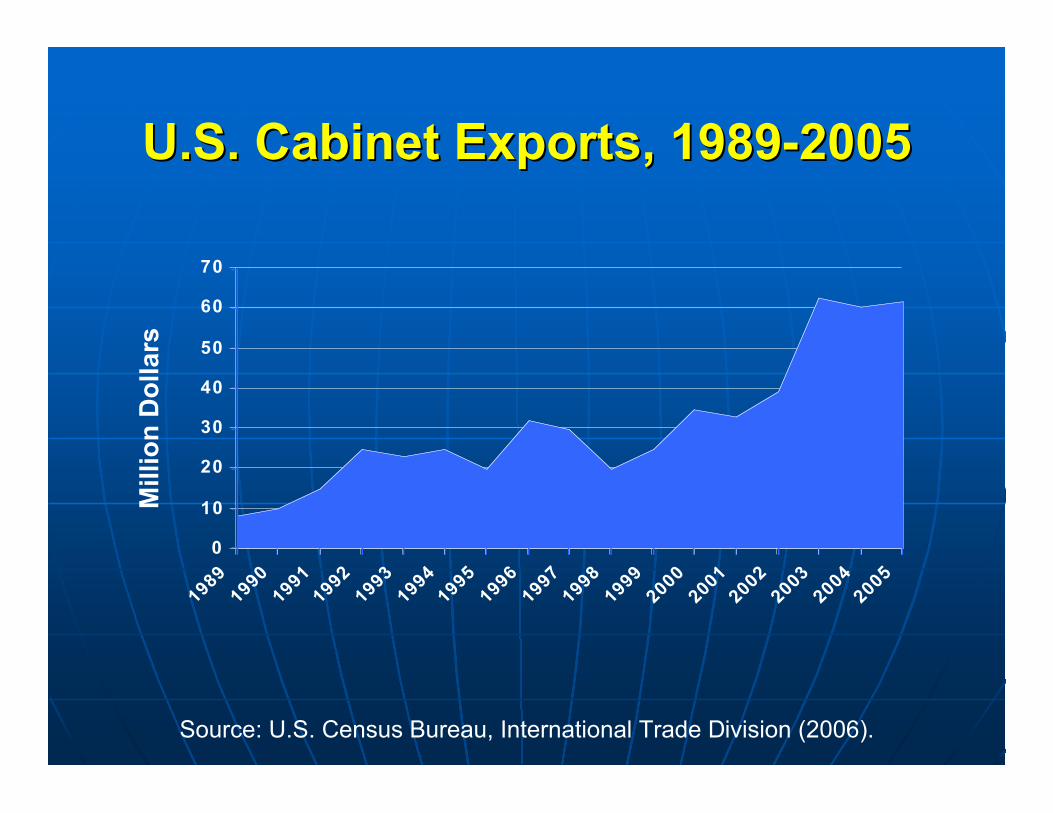
U.S. Cabinet Exports, 1989-2005U.S. Cabinet Exports, 1989-2005
0
10
20
30
40
50
60
70
19891990
19911992
19931994
19951996
19971998
19992000
20012002
20032004
2005
Mill
ion
Do
llars
Source: U.S. Census Bureau, International Trade Division (2006).
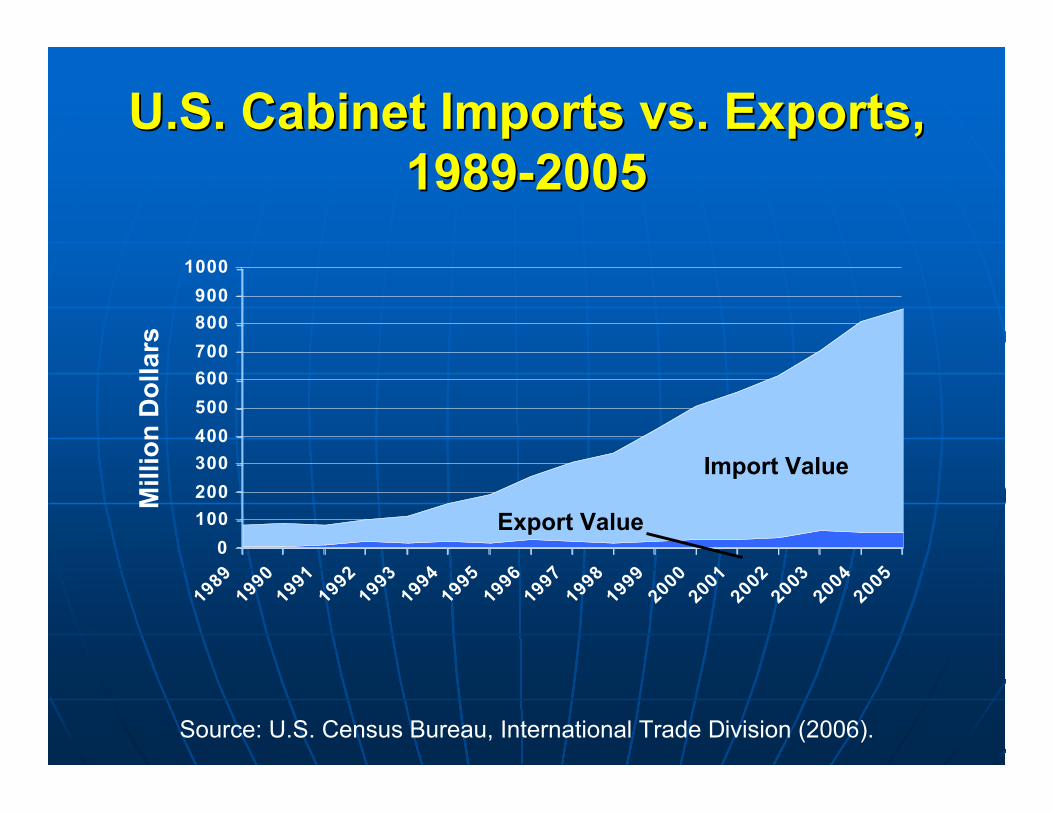
U.S. Cabinet Imports vs. Exports,U.S. Cabinet Imports vs. Exports,1989-20051989-2005
0
100
200
300
400
500
600
700
800
900
1000
19891990
19911992
19931994
19951996
19971998
19992000
20012002
20032004
2005
Mill
ion
Do
llars
Source: U.S. Census Bureau, International Trade Division (2006).
Export Value
Import Value
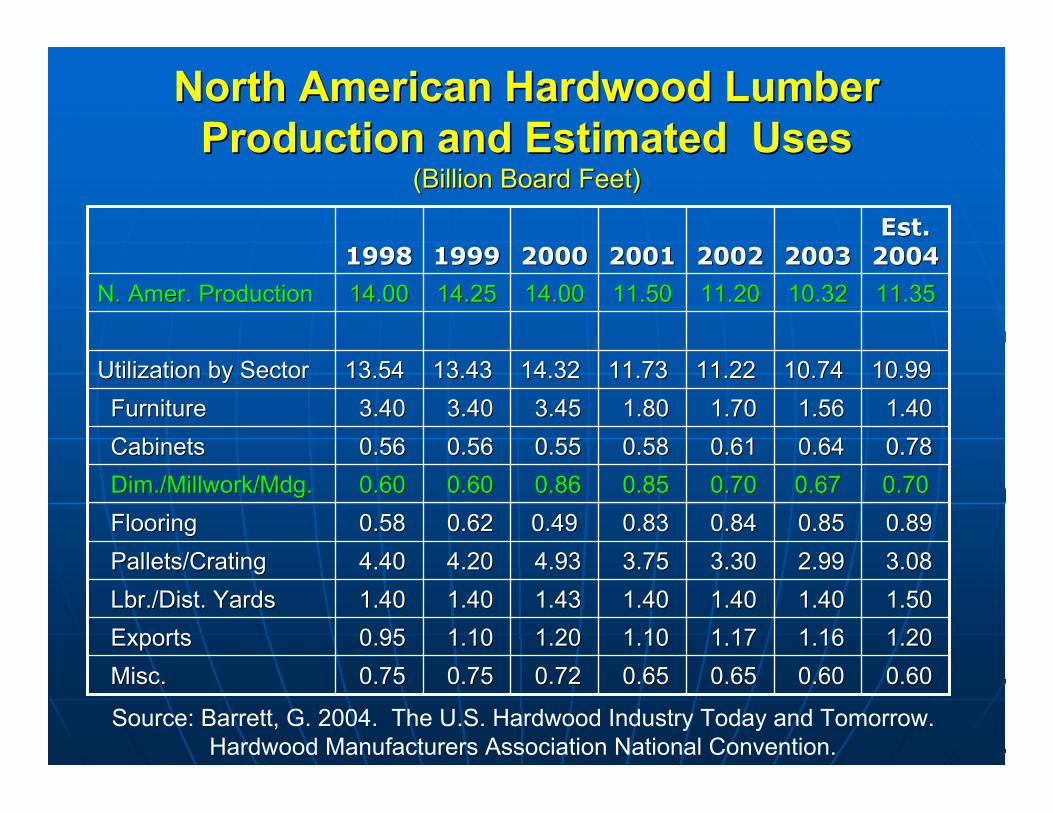
North American Hardwood LumberNorth American Hardwood LumberProduction and Estimated UsesProduction and Estimated Uses
(Billion Board Feet)(Billion Board Feet)
0.60 0.60 0.60 0.60 0.65 0.65 0.65 0.65 0.72 0.72 0.75 0.75 0.75 0.75 Misc. Misc.
1.20 1.20 1.16 1.16 1.17 1.17 1.10 1.10 1.20 1.20 1.10 1.10 0.95 0.95 Exports Exports
1.50 1.50 1.40 1.40 1.40 1.40 1.40 1.40 1.43 1.43 1.40 1.40 1.40 1.40 LbrLbr./Dist. Yards./Dist. Yards
3.08 3.08 2.99 2.99 3.30 3.30 3.75 3.75 4.93 4.93 4.20 4.20 4.40 4.40 Pallets/Crating Pallets/Crating
0.89 0.89 0.85 0.85 0.84 0.84 0.83 0.830.490.49 0.62 0.62 0.58 0.58 Flooring Flooring
0.700.700.670.67 0.70 0.70 0.85 0.85 0.86 0.86 0.60 0.60 0.60 0.60 Dim./Millwork/ Dim./Millwork/MdgMdg..
0.78 0.78 0.64 0.64 0.61 0.61 0.58 0.58 0.55 0.55 0.56 0.56 0.56 0.56 Cabinets Cabinets
1.40 1.40 1.56 1.56 1.70 1.70 1.80 1.80 3.45 3.45 3.40 3.40 3.40 3.40 Furniture Furniture
10.9910.9910.7410.7411.2211.2211.7311.7314.3214.3213.4313.4313.5413.54Utilization by SectorUtilization by Sector
11.3511.3510.3210.3211.2011.2011.5011.5014.0014.0014.2514.2514.0014.00N. Amer. ProductionN. Amer. Production
Est.Est.20042004200320032002200220012001200020001999199919981998
Source: Barrett, G. 2004. The U.S. Hardwood Industry Today and Tomorrow.Hardwood Manufacturers Association National Convention.
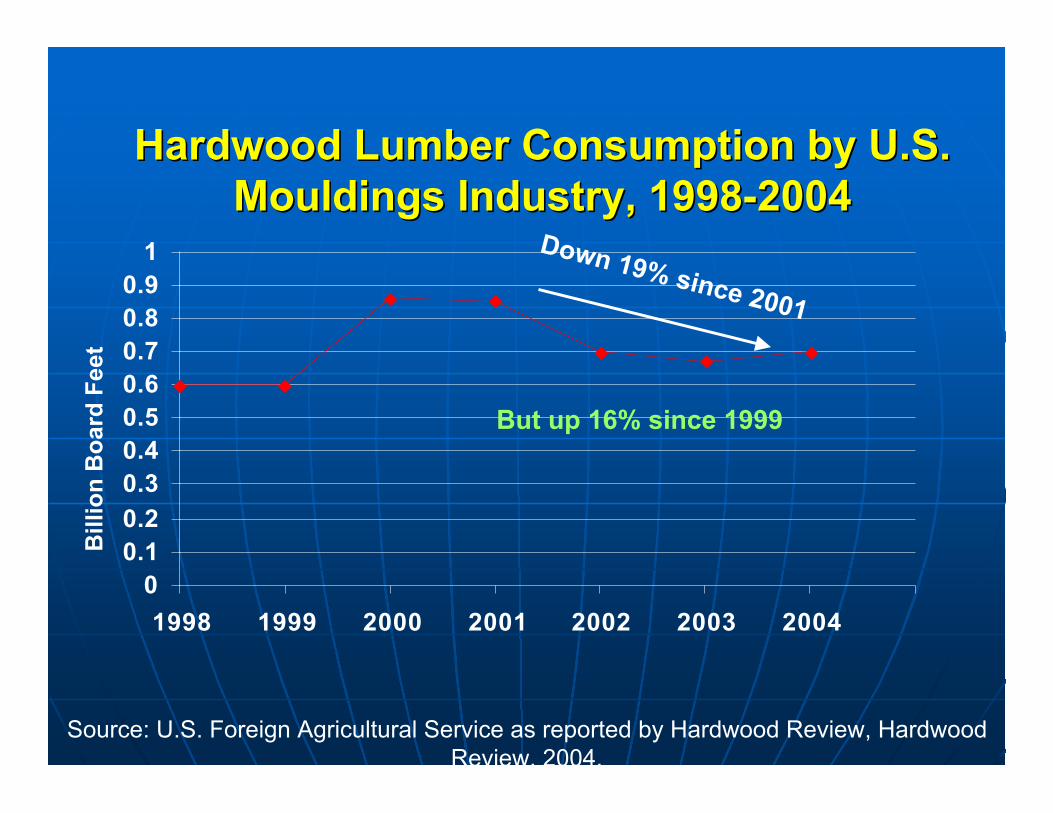
Hardwood Lumber Consumption by U.S.Hardwood Lumber Consumption by U.S.MouldingsMouldings Industry, 1998-2004 Industry, 1998-2004
00.10.2
0.30.40.50.60.70.80.9
1
1998 1999 2000 2001 2002 2003 2004
Bill
ion
Bo
ard
Fee
t
Source: U.S. Foreign Agricultural Service as reported by Hardwood Review, HardwoodReview, 2004.
Down 19% since 2001
But up 16% since 1999
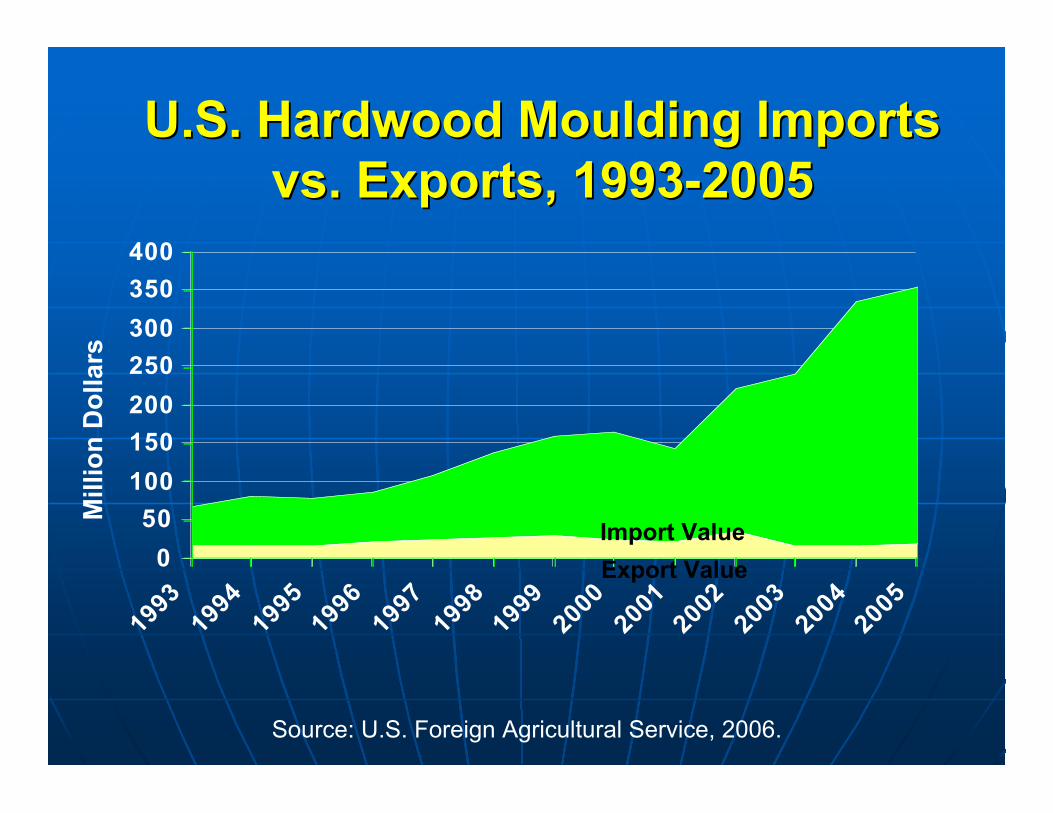
U.S. Hardwood U.S. Hardwood MouldingMoulding Imports Importsvs. Exports, 1993-2005vs. Exports, 1993-2005
0
50
100
150
200
250
300
350
400
19931994
19951996
19971998
19992000
20012002
20032004
2005
Mill
ion
Do
llars
Source: U.S. Foreign Agricultural Service, 2006.
Export Value
Import Value
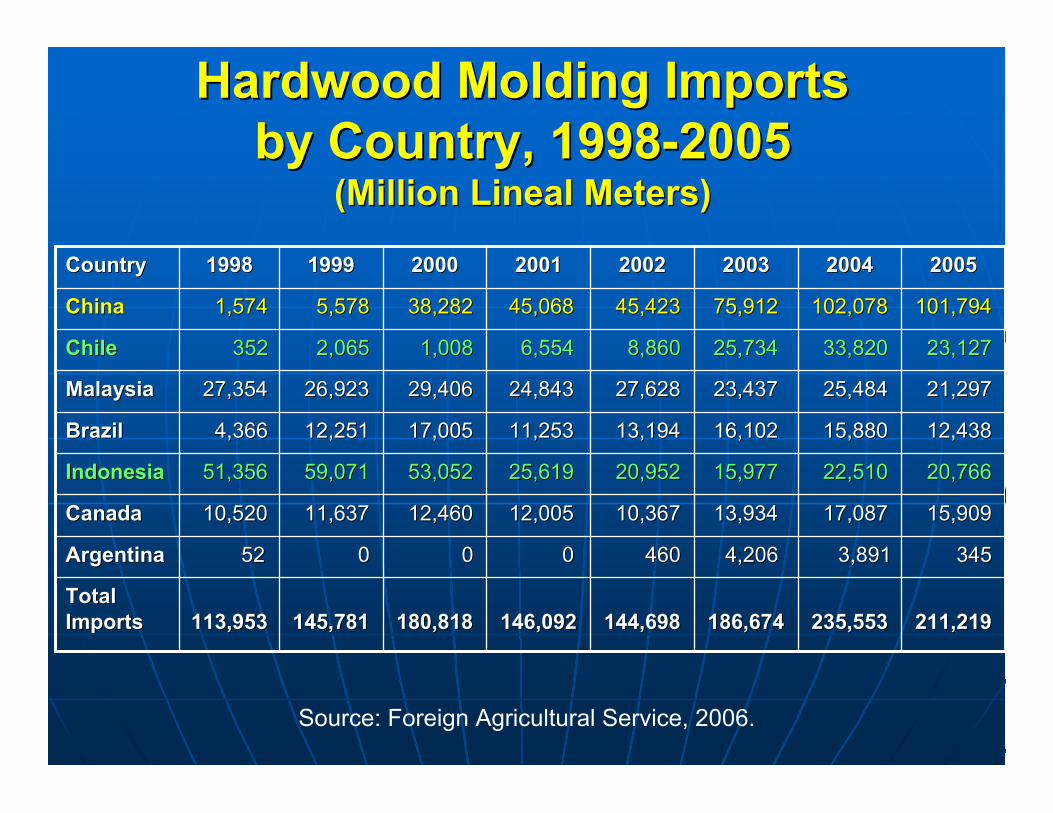
Hardwood Molding ImportsHardwood Molding Importsby Country, 1998-2005by Country, 1998-2005
(Million Lineal Meters)(Million Lineal Meters)
186,674186,674
4,206 4,206
13,93413,934
15,97715,977
16,10216,102
23,43723,437
25,73425,734
75,91275,912
20032003
235,553235,553
3,891 3,891
17,087 17,087
22,510 22,510
15,880 15,880
25,484 25,484
33,820 33,820
102,078102,078
20042004
144,698144,698
460 460
10,367 10,367
20,952 20,952
13,194 13,194
27,628 27,628
8,860 8,860
45,423 45,423
20022002 2005200520012001200020001999199919981998CountryCountry
146,092146,092
0 0
12,005 12,005
25,619 25,619
11,253 11,253
24,843 24,843
6,554 6,554
45,068 45,068
211,219211,219180,818180,818145,781145,781113,953113,953TotalTotalImportsImports
345 345 0 0 0 0 52 52ArgentinaArgentina
15,909 15,909 12,460 12,460 11,637 11,637 10,520 10,520CanadaCanada
20,766 20,766 53,052 53,052 59,071 59,071 51,356 51,356IndonesiaIndonesia
12,438 12,438 17,005 17,005 12,251 12,251 4,366 4,366BrazilBrazil
21,297 21,297 29,406 29,406 26,923 26,923 27,354 27,354MalaysiaMalaysia
23,127 23,127 1,008 1,008 2,065 2,065 352 352ChileChile
101,794101,794 38,282 38,282 5,578 5,578 1,574 1,574ChinaChina
Source: Foreign Agricultural Service, 2006.
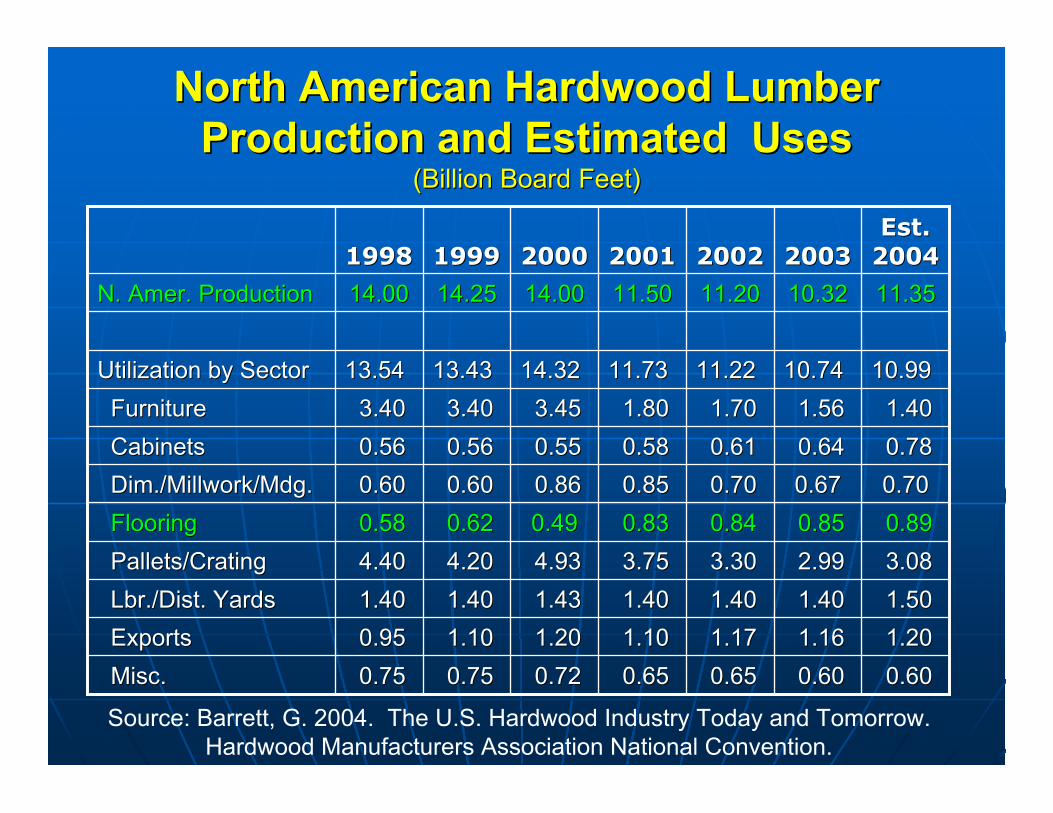
North American Hardwood LumberNorth American Hardwood LumberProduction and Estimated UsesProduction and Estimated Uses
(Billion Board Feet)(Billion Board Feet)
0.60 0.60 0.60 0.60 0.65 0.65 0.65 0.65 0.72 0.72 0.75 0.75 0.75 0.75 Misc. Misc.
1.20 1.20 1.16 1.16 1.17 1.17 1.10 1.10 1.20 1.20 1.10 1.10 0.95 0.95 Exports Exports
1.50 1.50 1.40 1.40 1.40 1.40 1.40 1.40 1.43 1.43 1.40 1.40 1.40 1.40 LbrLbr./Dist. Yards./Dist. Yards
3.08 3.08 2.99 2.99 3.30 3.30 3.75 3.75 4.93 4.93 4.20 4.20 4.40 4.40 Pallets/Crating Pallets/Crating
0.89 0.89 0.85 0.85 0.84 0.84 0.83 0.830.490.49 0.62 0.62 0.58 0.58 Flooring Flooring
0.700.700.670.67 0.70 0.70 0.85 0.85 0.86 0.86 0.60 0.60 0.60 0.60 Dim./Millwork/ Dim./Millwork/MdgMdg..
0.78 0.78 0.64 0.64 0.61 0.61 0.58 0.58 0.55 0.55 0.56 0.56 0.56 0.56 Cabinets Cabinets
1.40 1.40 1.56 1.56 1.70 1.70 1.80 1.80 3.45 3.45 3.40 3.40 3.40 3.40 Furniture Furniture
10.9910.9910.7410.7411.2211.2211.7311.7314.3214.3213.4313.4313.5413.54Utilization by SectorUtilization by Sector
11.3511.3510.3210.3211.2011.2011.5011.5014.0014.0014.2514.2514.0014.00N. Amer. ProductionN. Amer. Production
Est.Est.20042004200320032002200220012001200020001999199919981998
Source: Barrett, G. 2004. The U.S. Hardwood Industry Today and Tomorrow.Hardwood Manufacturers Association National Convention.
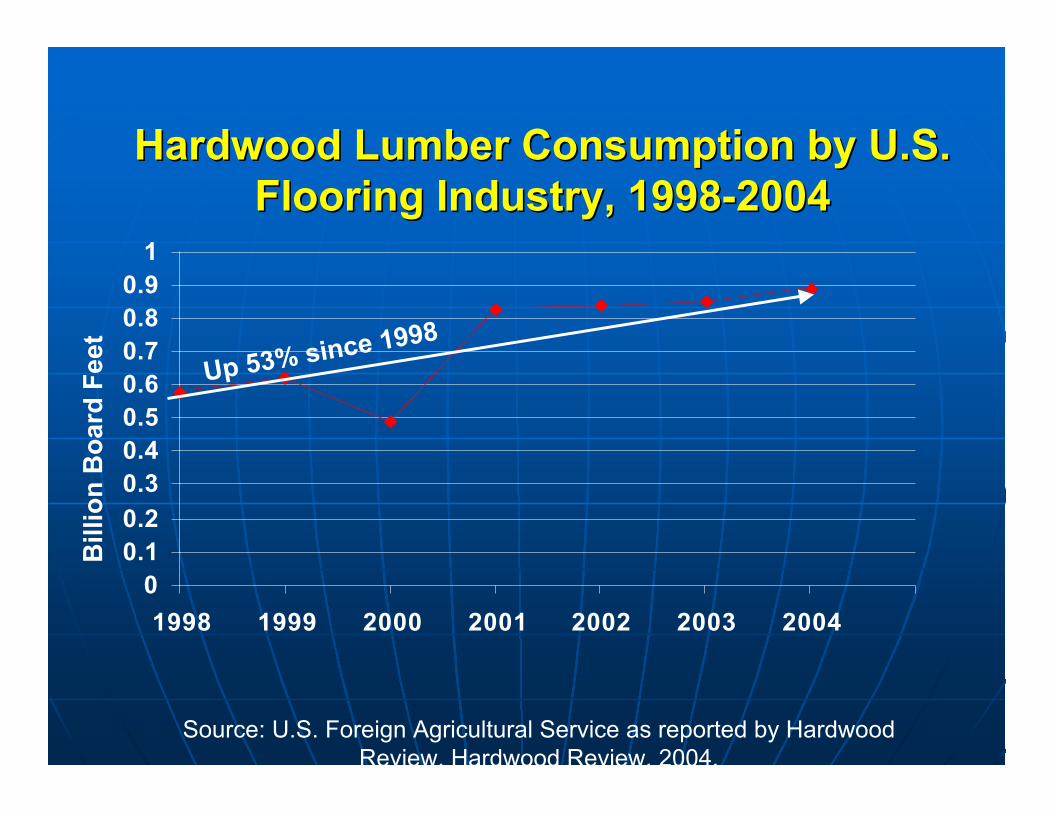
Hardwood Lumber Consumption by U.S.Hardwood Lumber Consumption by U.S.Flooring Industry, 1998-2004Flooring Industry, 1998-2004
00.10.2
0.30.40.50.60.70.80.9
1
1998 1999 2000 2001 2002 2003 2004
Bill
ion
Bo
ard
Fee
t
Source: U.S. Foreign Agricultural Service as reported by HardwoodReview, Hardwood Review, 2004.
Up 53% since 1998
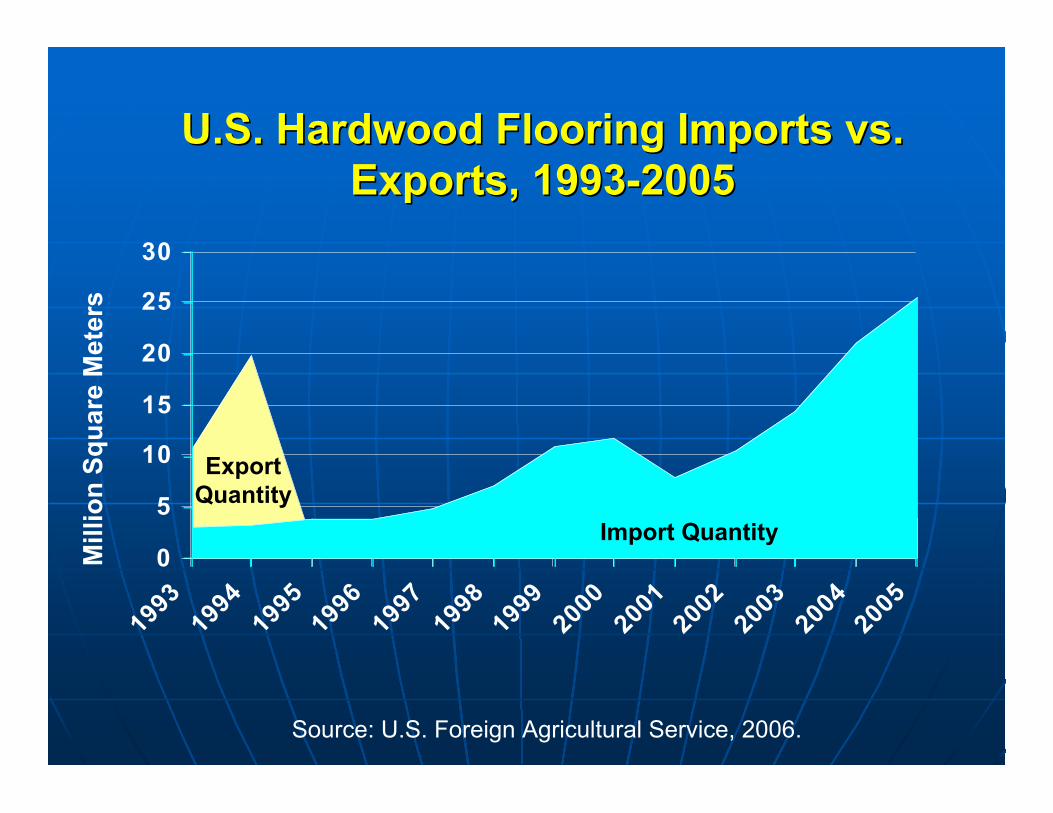
U.S. Hardwood Flooring Imports vs.U.S. Hardwood Flooring Imports vs.Exports, 1993-2005Exports, 1993-2005
0
5
10
15
20
25
30
19931994
19951996
19971998
19992000
20012002
20032004
2005
Mill
ion
Sq
uar
e M
eter
s
Source: U.S. Foreign Agricultural Service, 2006.
ExportQuantity
Import Quantity
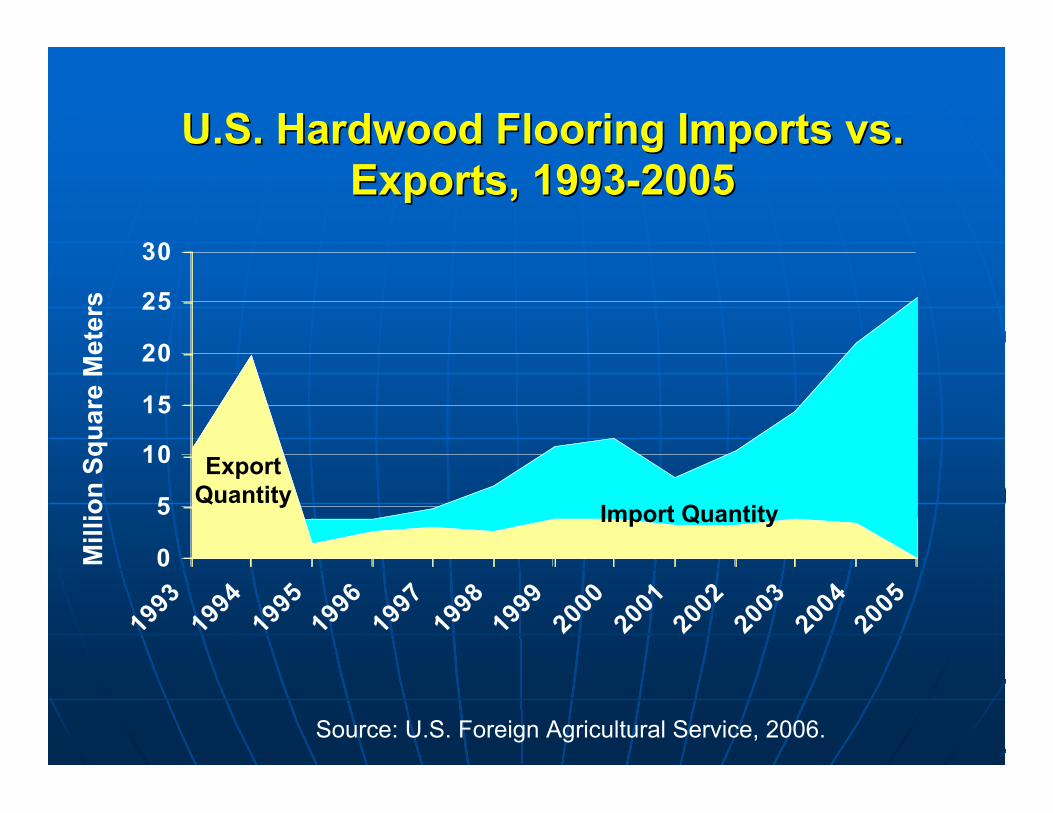
U.S. Hardwood Flooring Imports vs.U.S. Hardwood Flooring Imports vs.Exports, 1993-2005Exports, 1993-2005
0
5
10
15
20
25
30
19931994
19951996
19971998
19992000
20012002
20032004
2005
Mill
ion
Sq
uar
e M
eter
s
Source: U.S. Foreign Agricultural Service, 2006.
ExportQuantity
Import Quantity
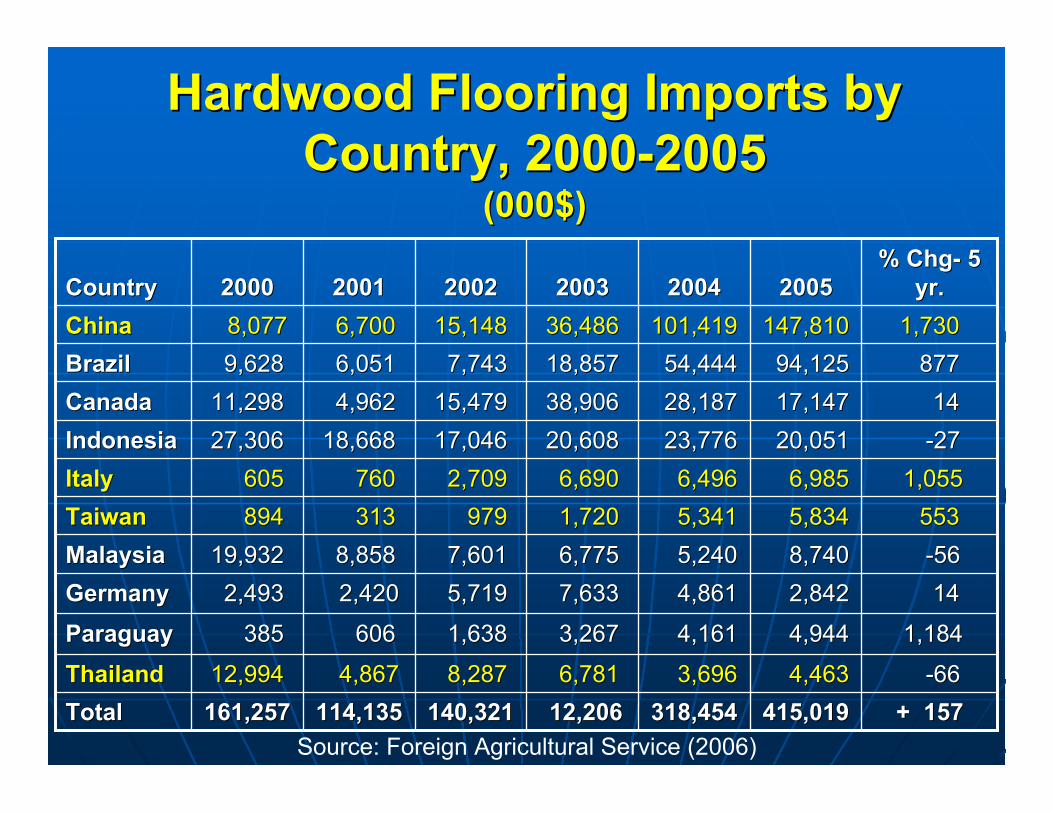
Hardwood Flooring Imports byHardwood Flooring Imports byCountry, 2000-2005Country, 2000-2005
(000$)(000$)
318,454318,454
3,696 3,696
4,161 4,161
4,861 4,861
5,240 5,240
5,341 5,341
6,496 6,496
23,776 23,776
28,187 28,187
54,444 54,444
101,419101,419
20042004
14 14 2,842 2,842 7,633 7,633 5,719 5,719 2,420 2,420 2,493 2,493GermanyGermany
553 553 5,834 5,834 1,720 1,720 979 979 313 313 894 894TaiwanTaiwan
-66 -66 4,463 4,463 6,781 6,781 8,287 8,287 4,867 4,86712,99412,994ThailandThailand
140,321140,321
1,638 1,638
7,601 7,601
2,709 2,709
17,04617,046
15,47915,479
7,743 7,743
15,14815,148
20022002
12,206 12,206
3,267 3,267
6,775 6,775
6,690 6,690
20,60820,608
38,90638,906
18,85718,857
36,48636,486
20032003
415,019415,019
4,944 4,944
8,740 8,740
6,985 6,985
20,051 20,051
17,147 17,147
94,125 94,125
147,810147,810
20052005% Chg- 5% Chg- 5
yr.yr.2001200120002000CountryCountry
+ 157+ 157
1,184 1,184
-56 -56
1,055 1,055
-27 -27
14 14
877 877
1,7301,730
114,135114,135161,257161,257TotalTotal
606 606 385 385ParaguayParaguay
8,858 8,85819,93219,932MalaysiaMalaysia
760 760 605 605ItalyItaly
18,66818,66827,30627,306IndonesiaIndonesia
4,962 4,96211,29811,298CanadaCanada
6,051 6,051 9,628 9,628BrazilBrazil
6,700 6,700 8,077 8,077ChinaChina
Source: Foreign Agricultural Service (2006)
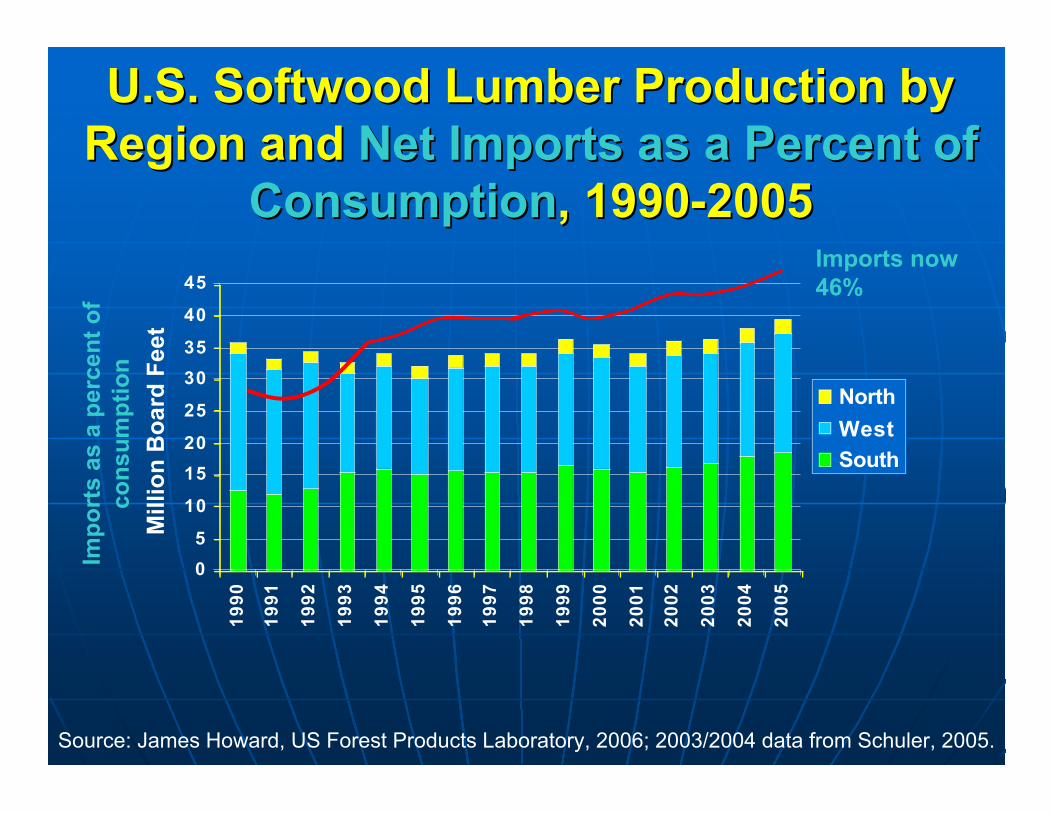
U.S. Softwood Lumber Production byU.S. Softwood Lumber Production byRegion and Region and Net Imports as a Percent ofNet Imports as a Percent of
ConsumptionConsumption, 1990-2005, 1990-2005
0
5
10
15
20
25
30
35
40
45
19
90
19
91
19
92
19
93
19
94
19
95
19
96
19
97
19
98
19
99
20
00
20
01
20
02
20
03
20
04
20
05
North
West
South
Mill
ion
Bo
ard
Fee
t
Source: James Howard, US Forest Products Laboratory, 2006; 2003/2004 data from Schuler, 2005.
Imports now46%
Imp
ort
s as
a p
erce
nt
of
con
sum
pti
on
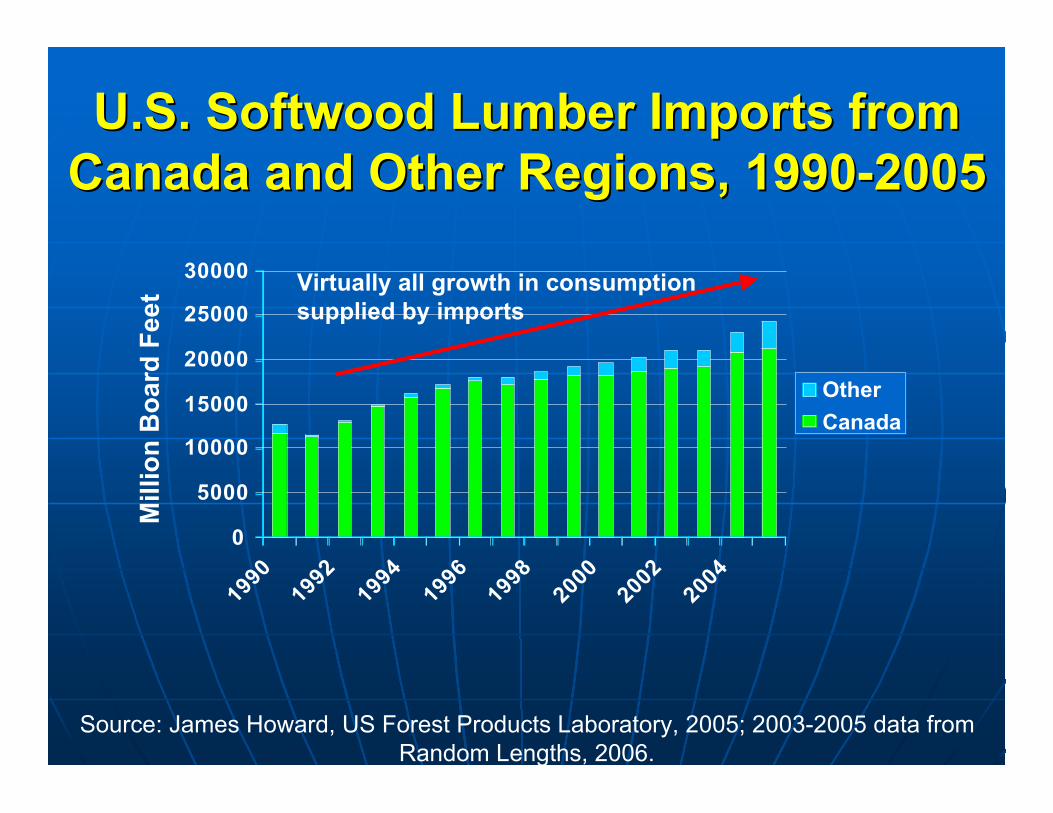
U.S. Softwood Lumber Imports fromU.S. Softwood Lumber Imports fromCanada and Other Regions, 1990-2005Canada and Other Regions, 1990-2005
0
5000
10000
15000
20000
25000
30000
19901992
19941996
19982000
20022004
Other
Canada
Mill
ion
Bo
ard
Fee
t
Source: James Howard, US Forest Products Laboratory, 2005; 2003-2005 data fromRandom Lengths, 2006.
Virtually all growth in consumptionsupplied by imports
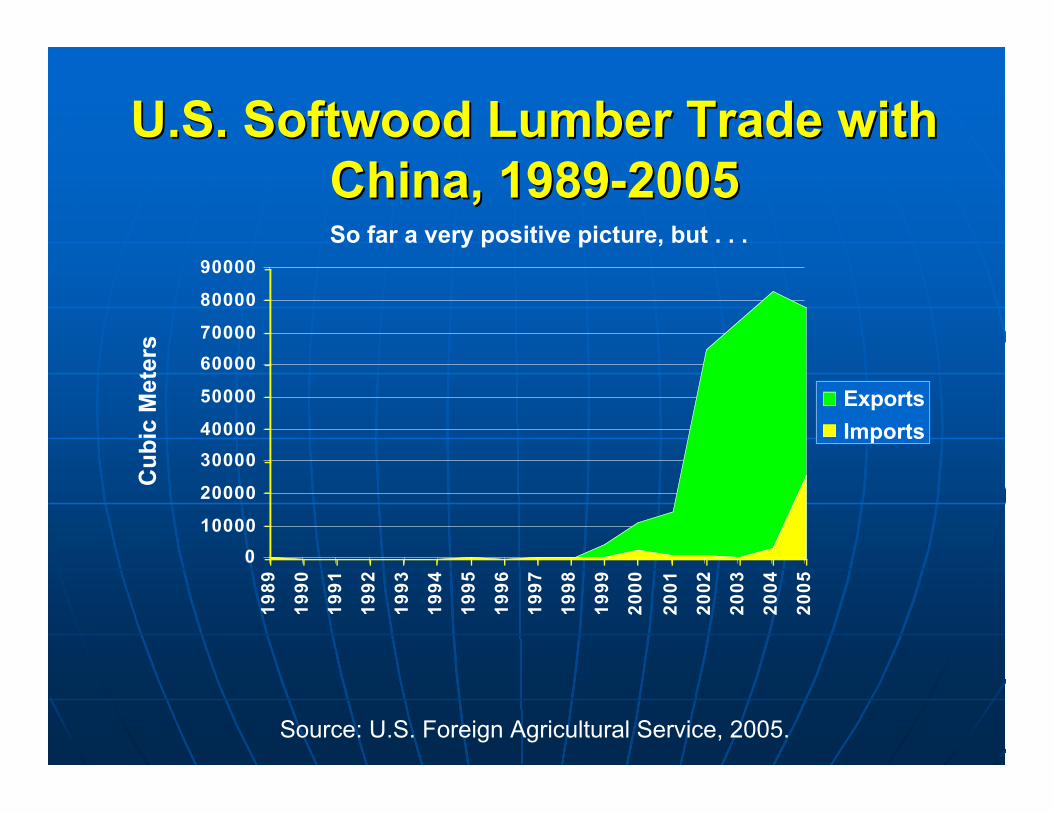
U.S. Softwood Lumber Trade withU.S. Softwood Lumber Trade withChina, 1989-2005China, 1989-2005
0
10000
20000
30000
40000
50000
60000
70000
80000
900001
98
9
19
90
19
91
19
92
19
93
19
94
19
95
19
96
19
97
19
98
19
99
20
00
20
01
20
02
20
03
20
04
20
05
Exports
Imports
Cu
bic
Met
ers
Source: U.S. Foreign Agricultural Service, 2005.
So far a very positive picture, but . . .
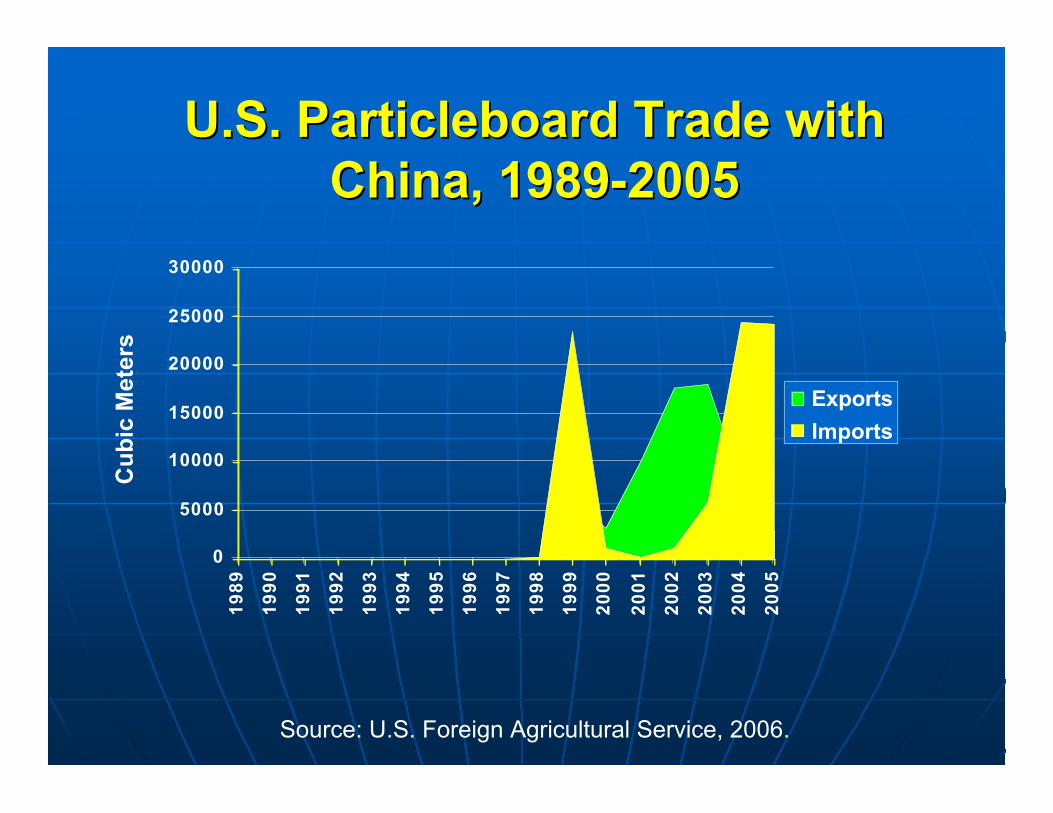
U.S. Particleboard Trade withU.S. Particleboard Trade withChina, 1989-2005China, 1989-2005
0
5000
10000
15000
20000
25000
30000
19
89
19
90
19
91
19
92
19
93
19
94
19
95
19
96
19
97
19
98
19
99
20
00
20
01
20
02
20
03
20
04
20
05
Exports
Imports
Cu
bic
Met
ers
Source: U.S. Foreign Agricultural Service, 2006.
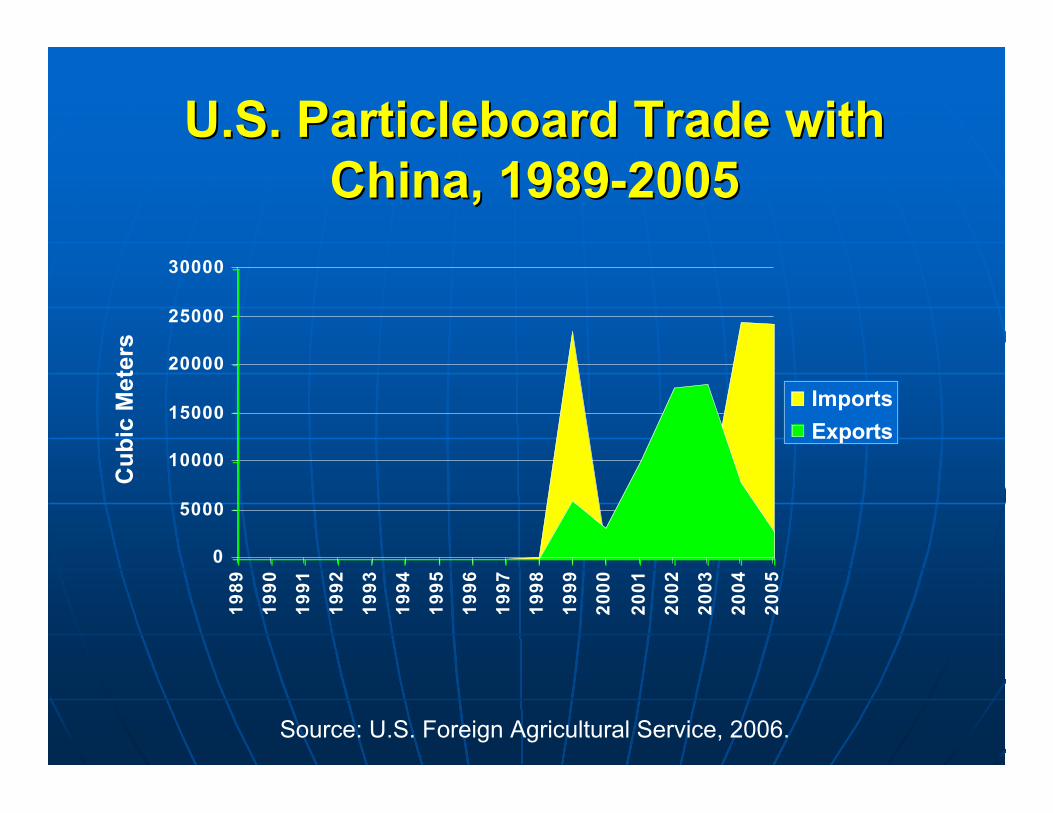
U.S. Particleboard Trade withU.S. Particleboard Trade withChina, 1989-2005China, 1989-2005
0
5000
10000
15000
20000
25000
30000
19
89
19
90
19
91
19
92
19
93
19
94
19
95
19
96
19
97
19
98
19
99
20
00
20
01
20
02
20
03
20
04
20
05
Imports
Exports
Cu
bic
Met
ers
Source: U.S. Foreign Agricultural Service, 2006.
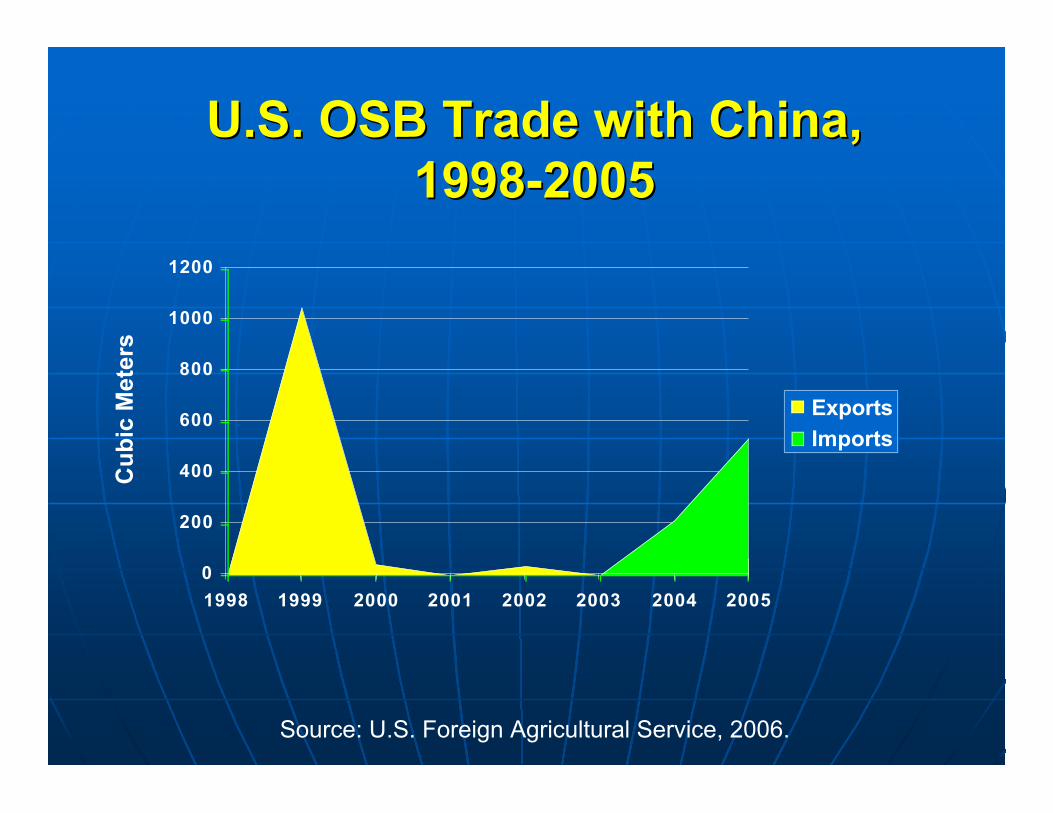
U.S. OSB Trade with China,U.S. OSB Trade with China,1998-20051998-2005
0
200
400
600
800
1000
1200
1998 1999 2000 2001 2002 2003 2004 2005
Exports
Imports
Cu
bic
Met
ers
Source: U.S. Foreign Agricultural Service, 2006.
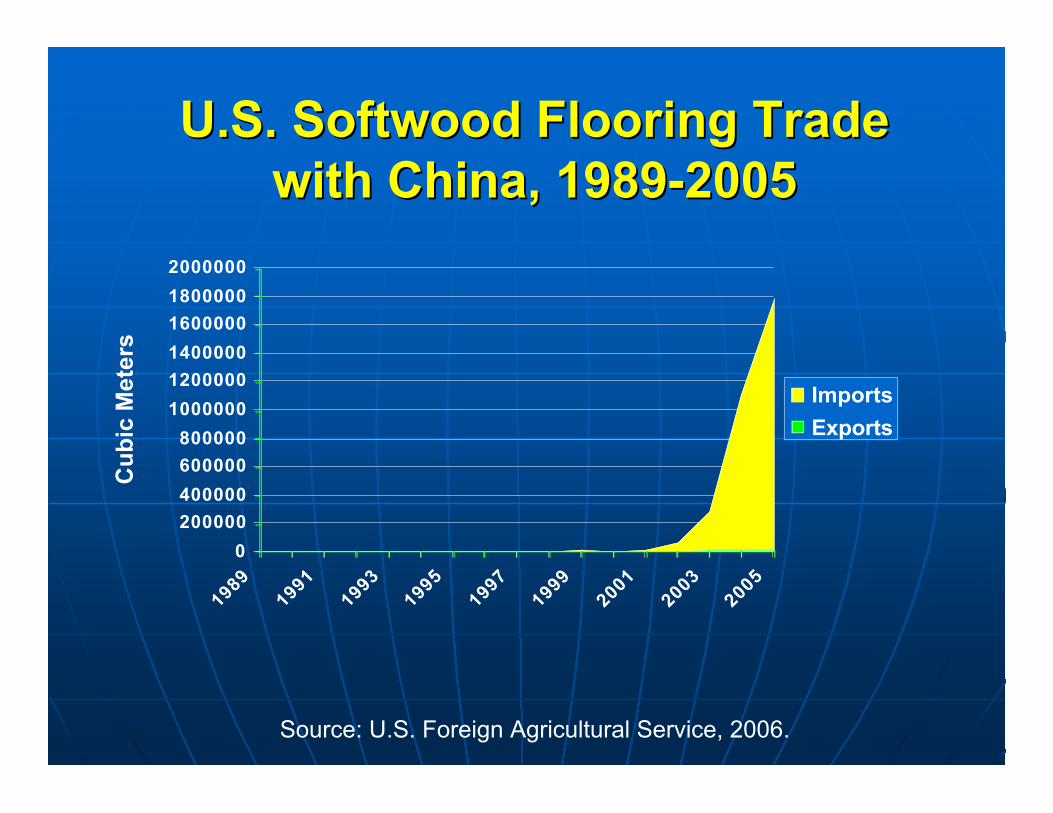
U.S. Softwood Flooring TradeU.S. Softwood Flooring Tradewith China, 1989-2005with China, 1989-2005
0
200000
400000
600000
800000
1000000
1200000
1400000
1600000
1800000
2000000
19891991
19931995
19971999
20012003
2005
Imports
Exports
Cu
bic
Met
ers
Source: U.S. Foreign Agricultural Service, 2006.
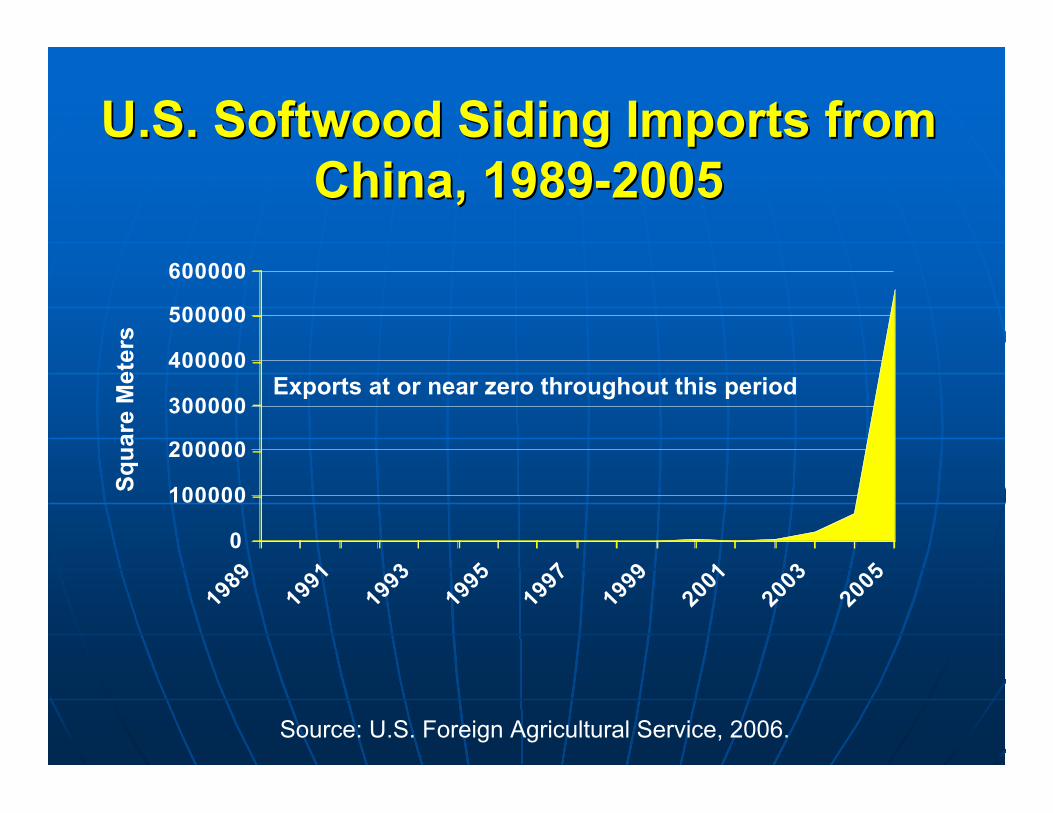
U.S. Softwood SidingU.S. Softwood Siding Imports fromImports fromChina, 1989-2005China, 1989-2005
0
100000
200000
300000
400000
500000
600000
19891991
19931995
19971999
20012003
2005
Sq
uar
e M
eter
s
Source: U.S. Foreign Agricultural Service, 2006.
Exports at or near zero throughout this period
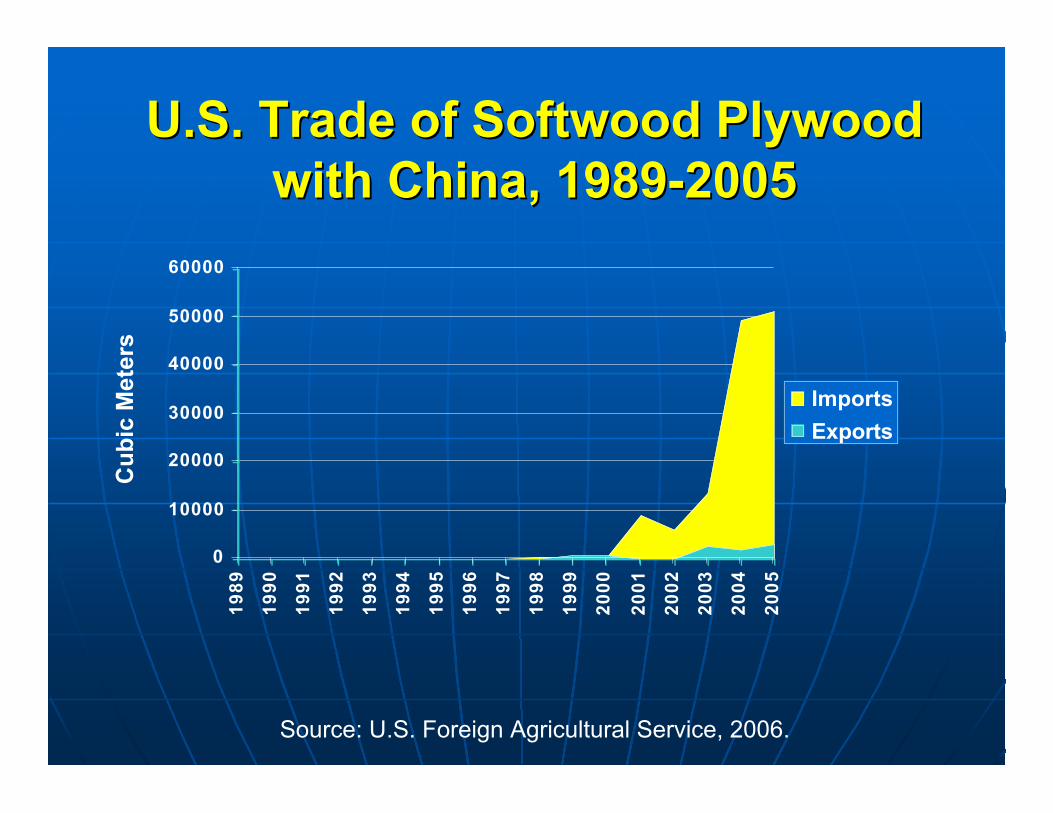
U.S. Trade of Softwood PlywoodU.S. Trade of Softwood Plywoodwith China, 1989-2005with China, 1989-2005
0
10000
20000
30000
40000
50000
60000
19
89
19
90
19
91
19
92
19
93
19
94
19
95
19
96
19
97
19
98
19
99
20
00
20
01
20
02
20
03
20
04
20
05
Imports
Exports
Cu
bic
Met
ers
Source: U.S. Foreign Agricultural Service, 2006.
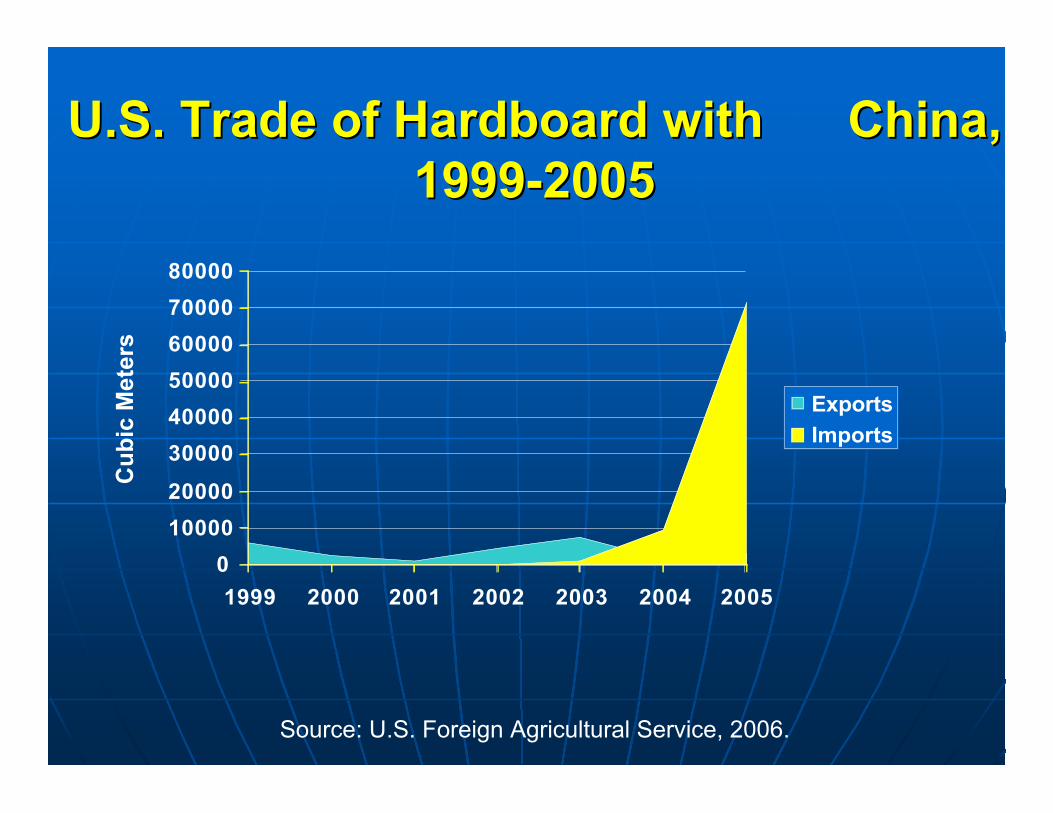
U.S. Trade of Hardboard with China,U.S. Trade of Hardboard with China,1999-20051999-2005
0
10000
20000
30000
40000
50000
60000
70000
80000
1999 2000 2001 2002 2003 2004 2005
Exports
Imports
Cu
bic
Met
ers
Source: U.S. Foreign Agricultural Service, 2006.
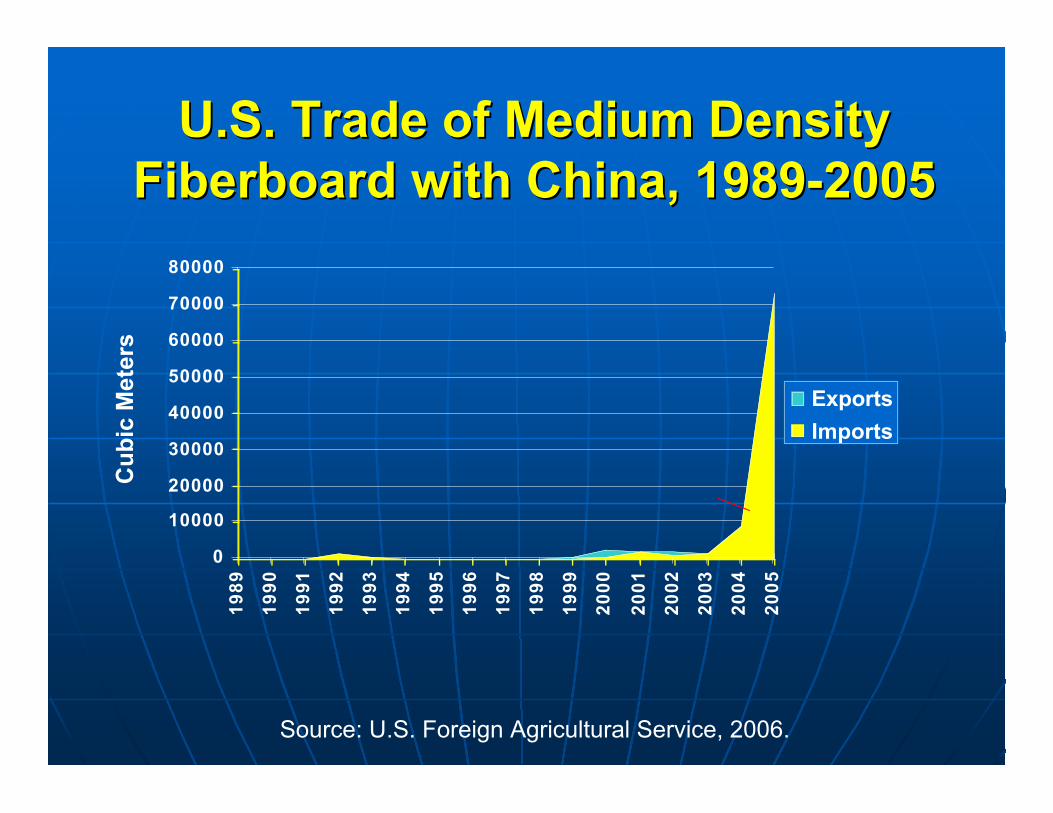
U.S. Trade of Medium DensityU.S. Trade of Medium DensityFiberboard with China, 1989-2005Fiberboard with China, 1989-2005
0
10000
20000
30000
40000
50000
60000
70000
80000
19
89
19
90
19
91
19
92
19
93
19
94
19
95
19
96
19
97
19
98
19
99
20
00
20
01
20
02
20
03
20
04
20
05
Exports
Imports
Cu
bic
Met
ers
Source: U.S. Foreign Agricultural Service, 2006.
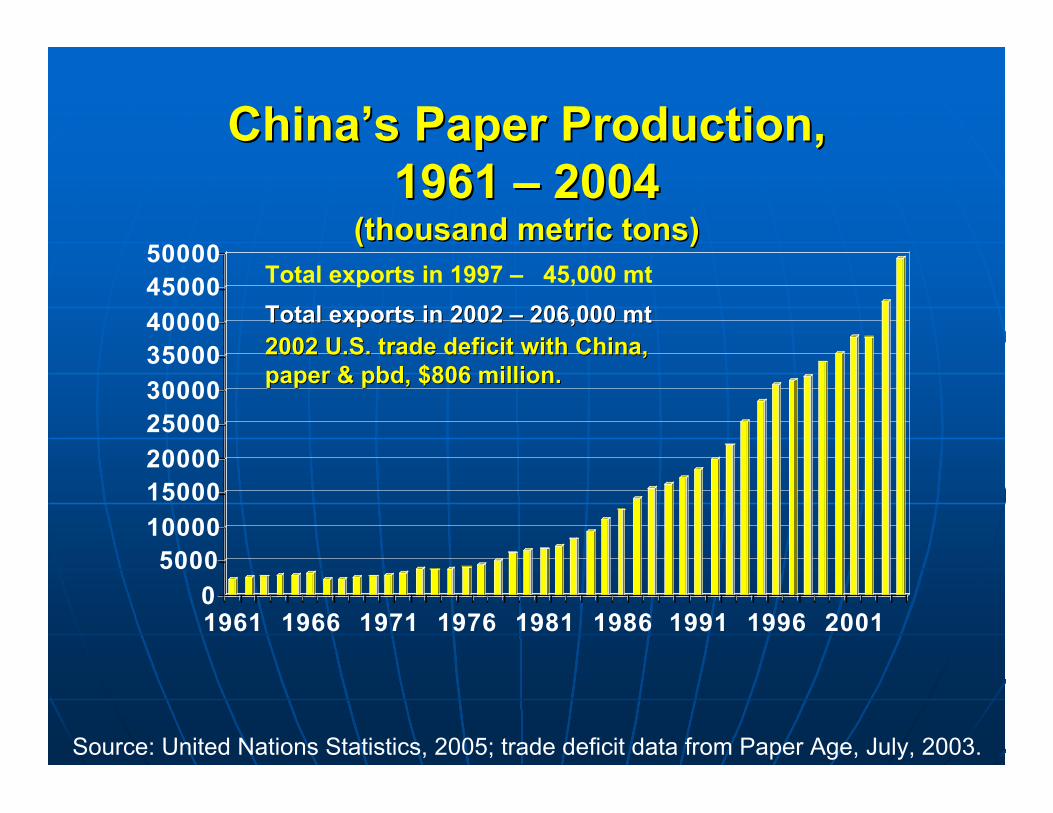
ChinaChina’’s Paper Production,s Paper Production,1961 1961 –– 2004 2004
(thousand metric tons)(thousand metric tons)
0
500010000
1500020000
2500030000
3500040000
4500050000
1961 1966 1971 1976 1981 1986 1991 1996 2001
Source: United Nations Statistics, 2005; trade deficit data from Paper Age, July, 2003.
Total exports in 1997 – 45,000 mt
Total exports in 2002 Total exports in 2002 –– 206,000 206,000 mtmt20022002 U.S. trade deficit with China,U.S. trade deficit with China,paper & paper & pbdpbd, $806 million., $806 million.
Implications of GlobalImplications of GlobalTrends for the ForestTrends for the Forest
Sector of theSector of the United States United States
Implications of Global TrendsImplications of Global Trendsfor the Forest Sector of the U.S.for the Forest Sector of the U.S.nn Expanding global economies areExpanding global economies are
stimulating consumption worldwide,stimulating consumption worldwide,creating market opportunities.creating market opportunities.
nn Global demand for housing is growingGlobal demand for housing is growingmore rapidly than population.more rapidly than population.
nn U.S. population growth will ensureU.S. population growth will ensuregrowing domestic consumption.growing domestic consumption.
nn Expanding middle classes in developingExpanding middle classes in developingeconomies around the world will lead toeconomies around the world will lead toincreasing demand for quality goods.increasing demand for quality goods.
Implications of Global TrendsImplications of Global Trendsfor the Forest Sectorfor the Forest Sector
nn Supplies of low-cost fiber are increasing asSupplies of low-cost fiber are increasing asfast-growing forest plantations expandfast-growing forest plantations expandglobally.globally.
nn In the near term, raw materials will flow toIn the near term, raw materials will flow toinstalled capacity. In the longer term,installed capacity. In the longer term,capital will flow to regions with abundant,capital will flow to regions with abundant,low cost fiber.low cost fiber.
nn The reemergence of Russia as a woodThe reemergence of Russia as a woodproducts producer will add to global timberproducts producer will add to global timberand wood fiber supplies.and wood fiber supplies.
Implications of Global TrendsImplications of Global Trendsfor the Forest Sectorfor the Forest Sector
nn China and other developing nations areChina and other developing nations areaggressively seeking to compete in theaggressively seeking to compete in thewood products arena, severely challengingwood products arena, severely challengingtraditional producing regions.traditional producing regions.
nn Little of the wood flowing through AsianLittle of the wood flowing through Asianwood products industries is certified.wood products industries is certified.Considerable quantities are from illegalConsiderable quantities are from illegalsources.sources.
Implications of Global TrendsImplications of Global Trendsfor the Forest Sectorfor the Forest Sector
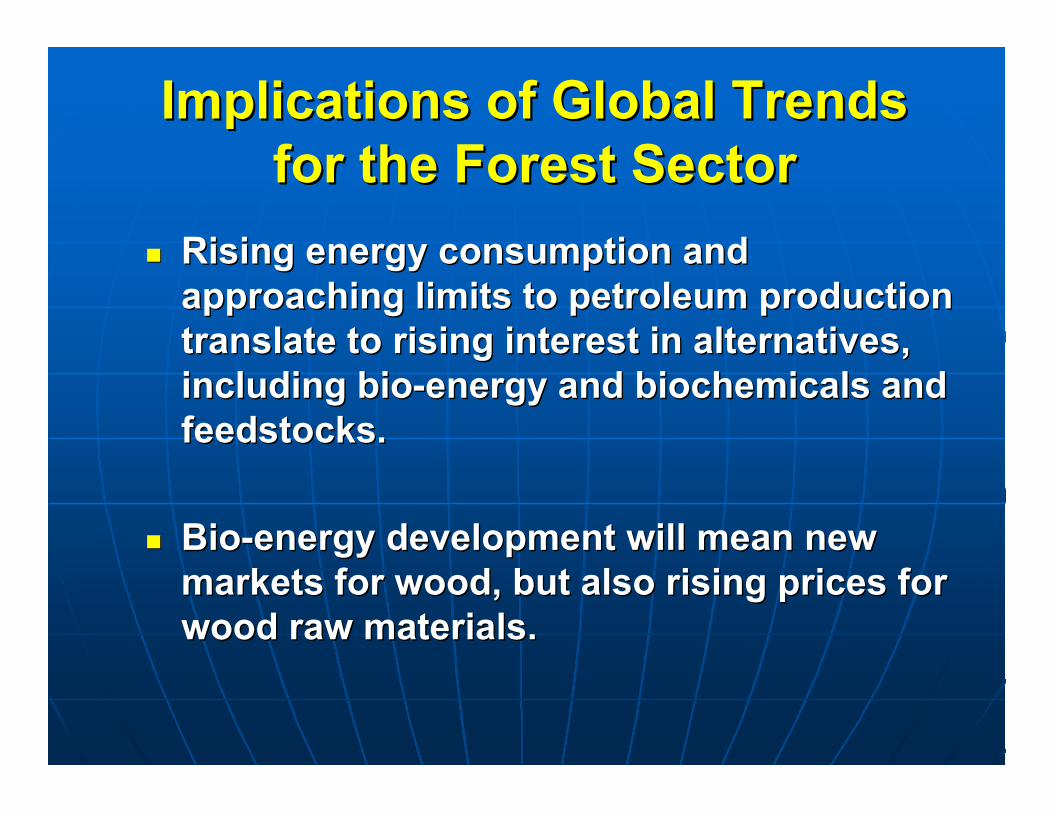
nn Rising energy consumption andRising energy consumption andapproaching limits to petroleum productionapproaching limits to petroleum productiontranslate to rising interest in alternatives,translate to rising interest in alternatives,including bio-energy and including bio-energy and biochemicalsbiochemicals and andfeedstocksfeedstocks..
nn Bio-energy development will mean newBio-energy development will mean newmarkets for wood, but also rising prices formarkets for wood, but also rising prices forwood raw materials.wood raw materials.

From a number of perspectives,From a number of perspectives,the changing situation presentsthe changing situation presents
a clear and substantiala clear and substantialopportunity.opportunity.

The Bio-Economy,The Bio-Economy,Bio-EnergyBio-Energy
and the U.S. Forestand the U.S. ForestSector Sector –– Threat or Threat or
Opportunity?Opportunity?

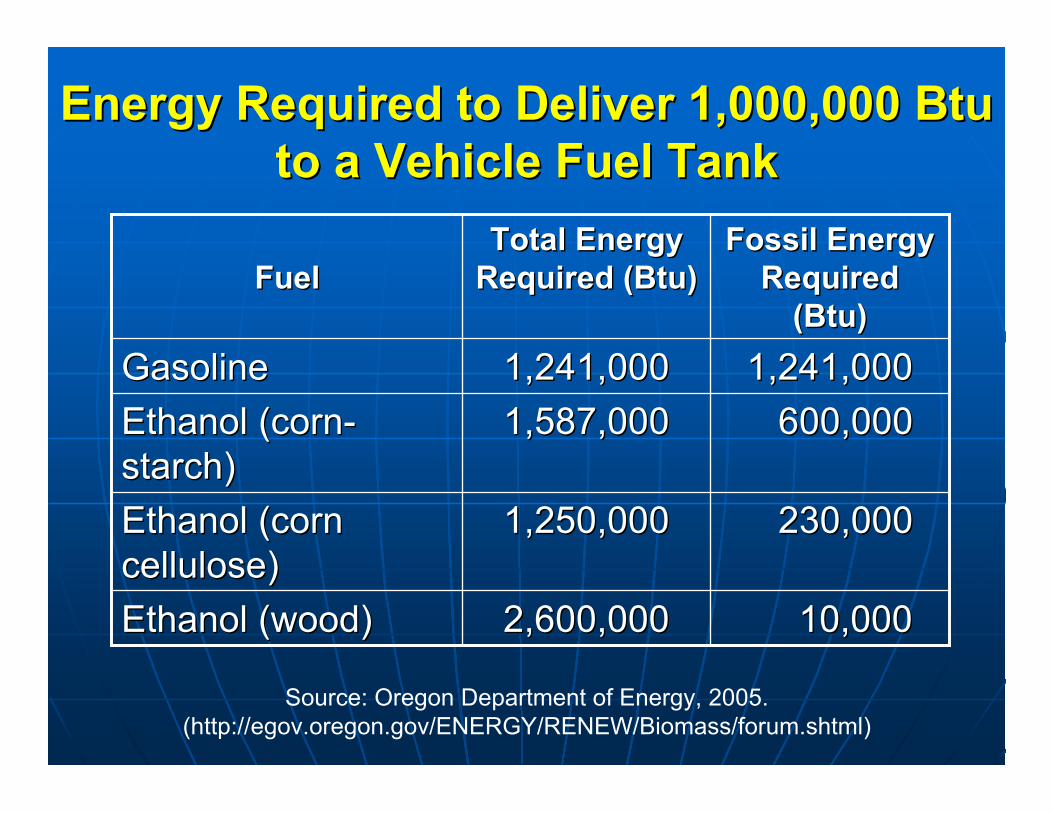
Liquid Fuels Represent anLiquid Fuels Represent anEnormous Opportunity forEnormous Opportunity for
the Forest Sectorthe Forest Sector
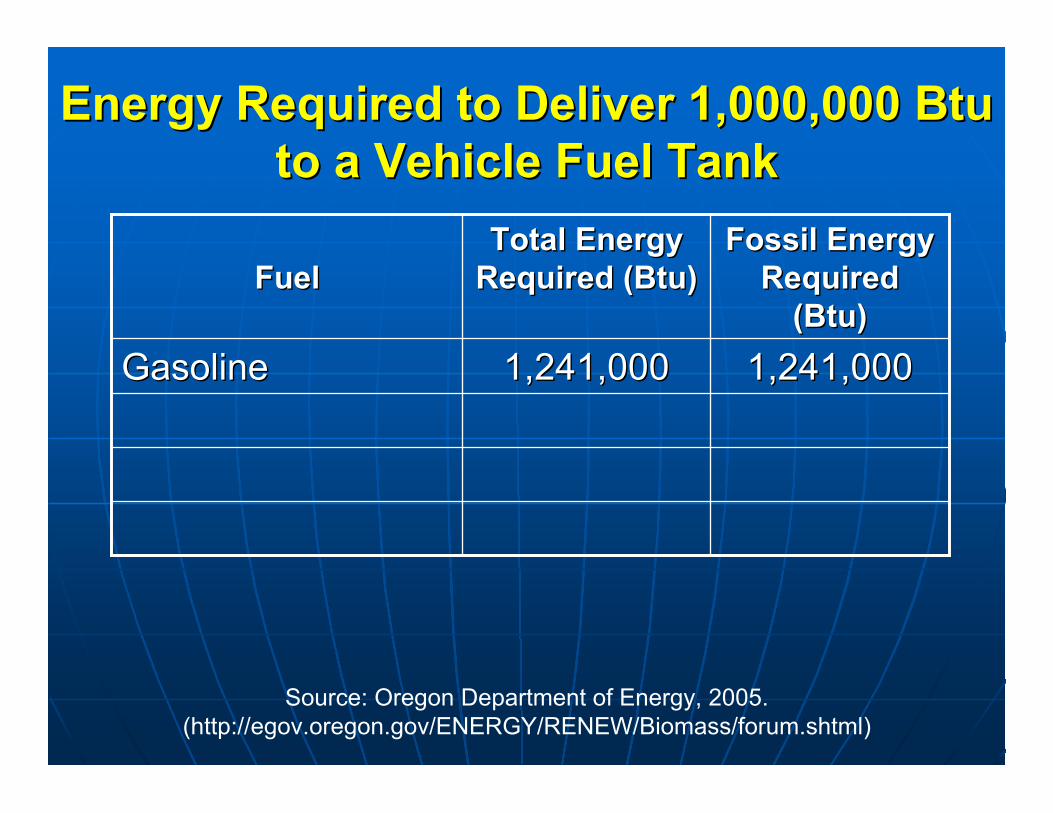
Energy Required to Deliver 1,000,000 BtuEnergy Required to Deliver 1,000,000 Btuto a Vehicle Fuel Tankto a Vehicle Fuel Tank
1,241,0001,241,0001,241,0001,241,000GasolineGasoline
Fossil EnergyFossil EnergyRequiredRequired
(Btu)(Btu)
Total EnergyTotal EnergyRequired (Btu)Required (Btu)FuelFuel
Source: Oregon Department of Energy, 2005.(http://egov.oregon.gov/ENERGY/RENEW/Biomass/forum.shtml)
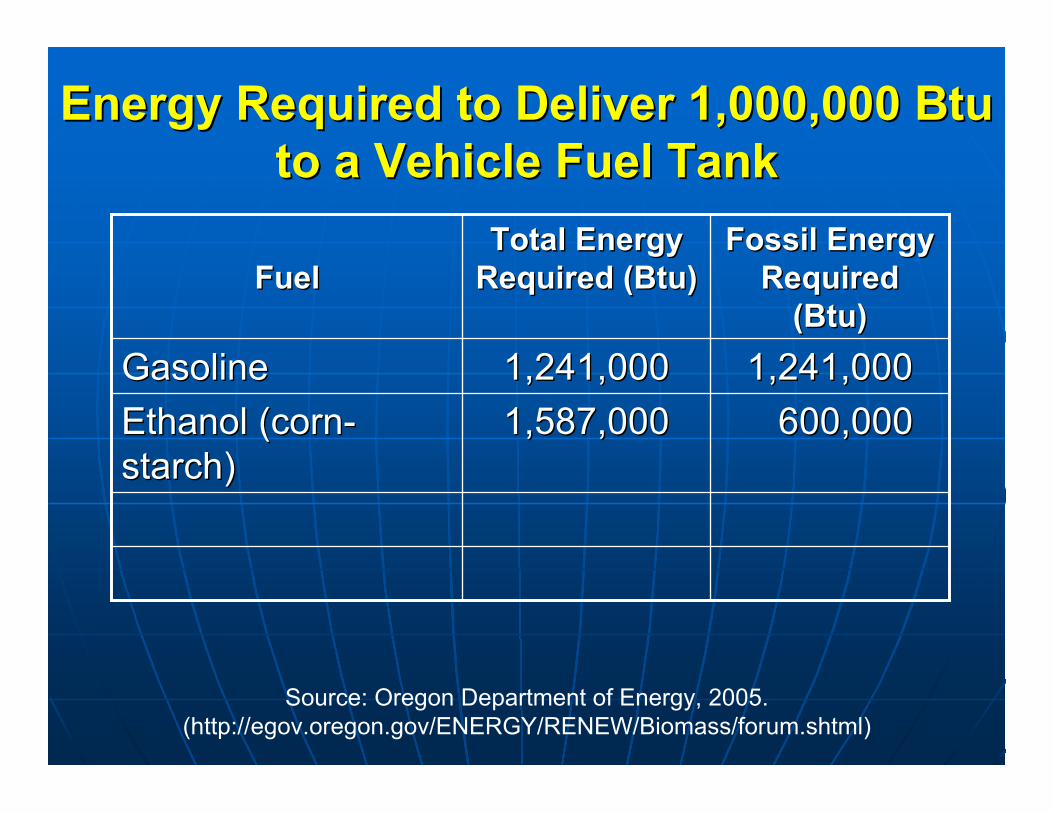
Energy Required to Deliver 1,000,000 BtuEnergy Required to Deliver 1,000,000 Btuto a Vehicle Fuel Tankto a Vehicle Fuel Tank
600,000 600,0001,587,0001,587,000Ethanol (corn-Ethanol (corn-starch)starch)
1,241,0001,241,0001,241,0001,241,000GasolineGasoline
Fossil EnergyFossil EnergyRequiredRequired
(Btu)(Btu)
Total EnergyTotal EnergyRequired (Btu)Required (Btu)FuelFuel
Source: Oregon Department of Energy, 2005.(http://egov.oregon.gov/ENERGY/RENEW/Biomass/forum.shtml)
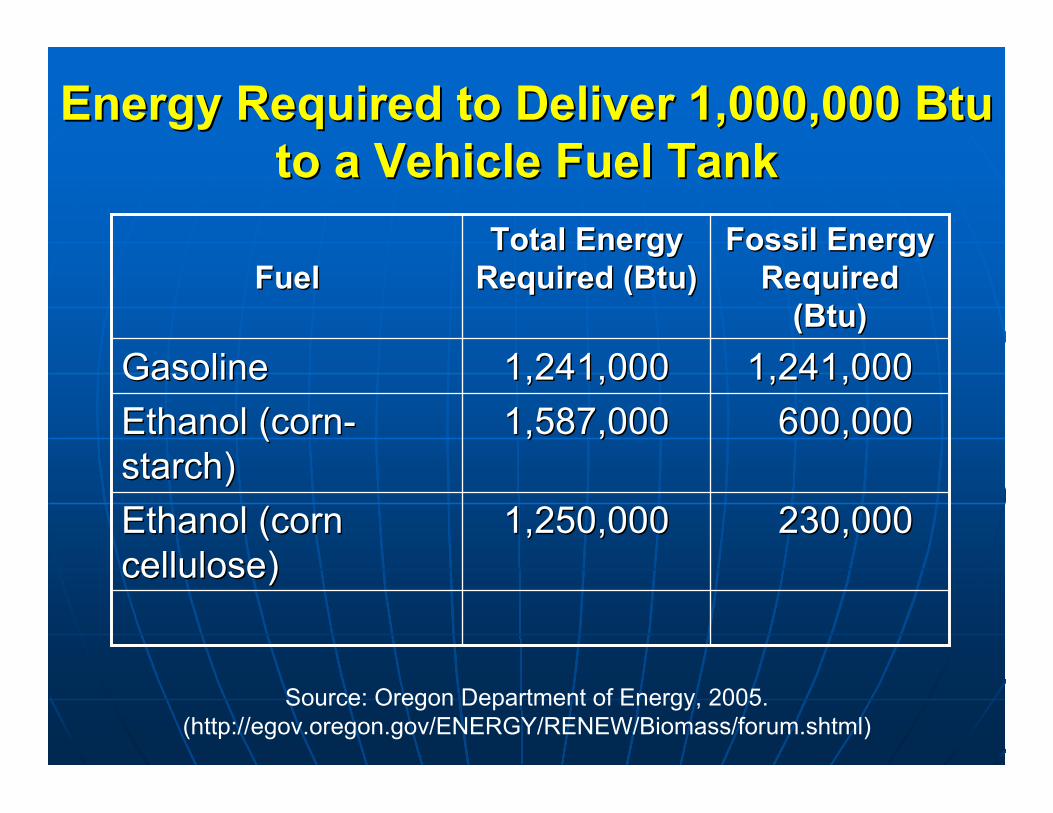
Energy Required to Deliver 1,000,000 BtuEnergy Required to Deliver 1,000,000 Btuto a Vehicle Fuel Tankto a Vehicle Fuel Tank
230,000 230,0001,250,0001,250,000Ethanol (cornEthanol (corncellulose)cellulose)
600,000 600,0001,587,0001,587,000Ethanol (corn-Ethanol (corn-starch)starch)
1,241,0001,241,0001,241,0001,241,000GasolineGasoline
Fossil EnergyFossil EnergyRequiredRequired
(Btu)(Btu)
Total EnergyTotal EnergyRequired (Btu)Required (Btu)FuelFuel
Source: Oregon Department of Energy, 2005.(http://egov.oregon.gov/ENERGY/RENEW/Biomass/forum.shtml)
Energy Required to Deliver 1,000,000 BtuEnergy Required to Deliver 1,000,000 Btuto a Vehicle Fuel Tankto a Vehicle Fuel Tank
10,000 10,0002,600,0002,600,000Ethanol (wood)Ethanol (wood)
230,000 230,0001,250,0001,250,000Ethanol (cornEthanol (corncellulose)cellulose)
600,000 600,0001,587,0001,587,000Ethanol (corn-Ethanol (corn-starch)starch)
1,241,0001,241,0001,241,0001,241,000GasolineGasoline
Fossil EnergyFossil EnergyRequiredRequired
(Btu)(Btu)
Total EnergyTotal EnergyRequired (Btu)Required (Btu)FuelFuel
Source: Oregon Department of Energy, 2005.(http://egov.oregon.gov/ENERGY/RENEW/Biomass/forum.shtml)
The potential forThe potential forproduction of production of biochemicalsbiochemicalsand and biofeedstocksbiofeedstocks presents presents
a further opportunity.a further opportunity.
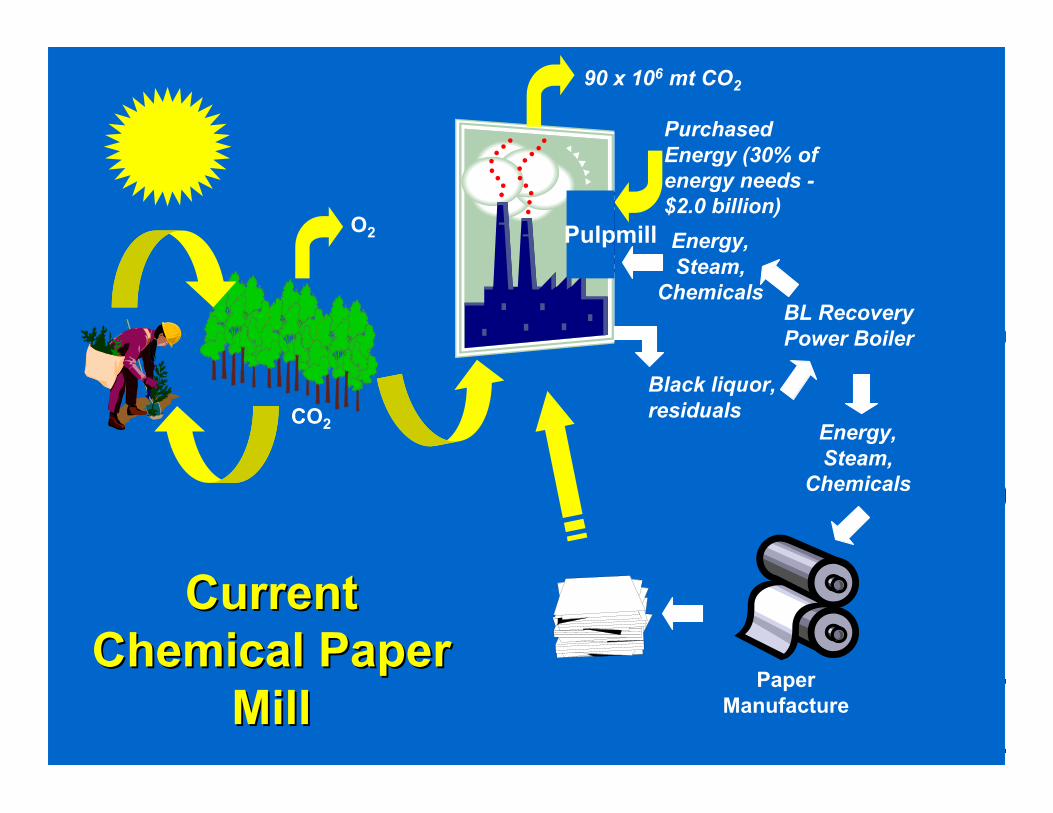
O2
CO2
BL RecoveryPower Boiler
PaperManufacture
Black liquor,residuals
90 x 106 mt CO2
PurchasedEnergy (30% ofenergy needs -$2.0 billion)
Pulpmill Energy,Steam,
Chemicals
Energy,Steam,
Chemicals
CurrentCurrentChemical PaperChemical Paper
MillMill
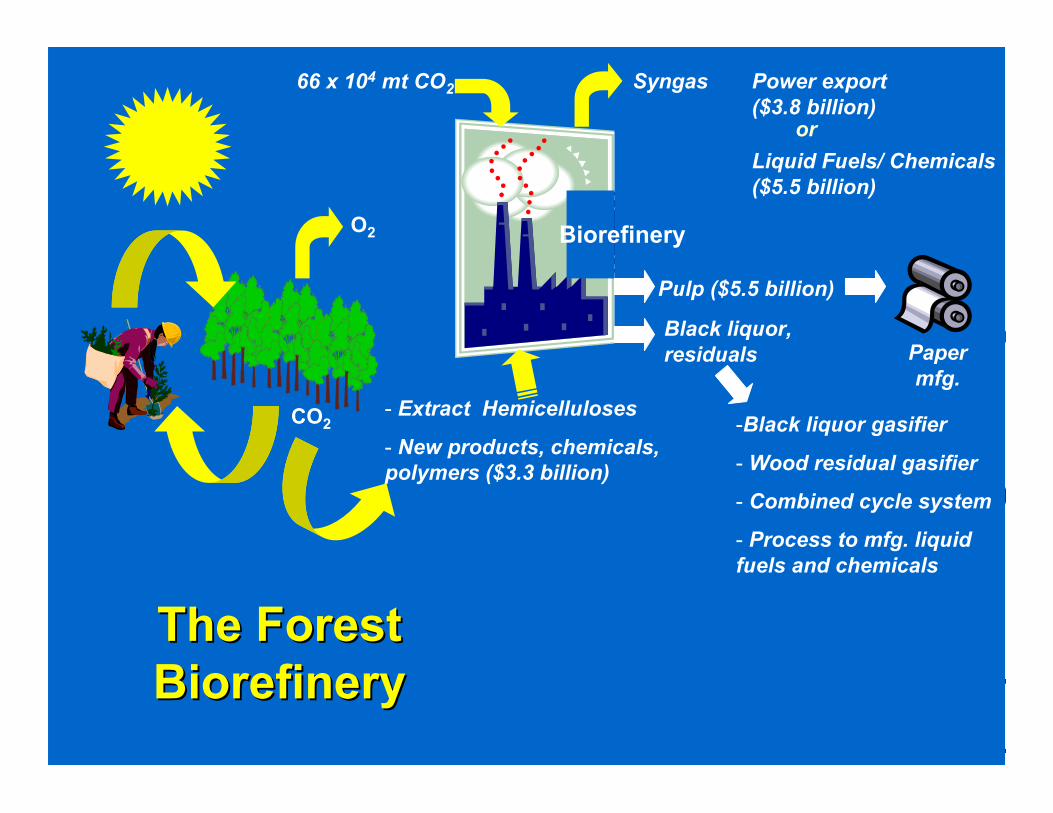
O2
CO2
Black liquor,residuals
66 x 104 mt CO2 Power export($3.8 billion)
Biorefinery
Pulp ($5.5 billion)
The ForestThe ForestBiorefineryBiorefinery
- Extract Hemicelluloses
- New products, chemicals,polymers ($3.3 billion)
-Black liquor gasifier
- Wood residual gasifier
- Combined cycle system
- Process to mfg. liquidfuels and chemicals
or
Liquid Fuels/ Chemicals($5.5 billion)
Syngas
Papermfg.

PositioningPositioning
for thefor theFutureFuture
Positioning for the FuturePositioning for the Future
nn Develop a revitalized program of wood productsDevelop a revitalized program of wood productsresearch and developmentresearch and developmentßß Industry, academia, governmentIndustry, academia, governmentßß Fast, nimble, appliedFast, nimble, appliedßß ProprietaryProprietary
nn Position research establishment for morePosition research establishment for moreeffective monitoring of R&D globally.effective monitoring of R&D globally.
nn Seek to understand foreign competitors on anSeek to understand foreign competitors on anongoing basisongoing basisßß BenchmarkBenchmarkßß MonitorMonitorßß Profile consumer trends, market trendsProfile consumer trends, market trends
Positioning for the Future (Cont.)Positioning for the Future (Cont.)
nn Strategically plan on a region-wide basis.Strategically plan on a region-wide basis.
nn Carefully consider the role of northeasternCarefully consider the role of northeasternforests in bio-fuels initiatives forests in bio-fuels initiatives –– take steps to take steps toproactively anticipate the future.proactively anticipate the future.
nn Ensure that opportunities for production of bio-Ensure that opportunities for production of bio-chemicals/bio-chemicals/bio-feedstocksfeedstocks are part of bio-fuels are part of bio-fuelsdevelopment.development.
nn Seek win-win opportunities between agriculturalSeek win-win opportunities between agriculturaland wood products sectors.and wood products sectors.
The bottom line is that theThe bottom line is that theexistence and vitality of aexistence and vitality of a
future wood products industryfuture wood products industryin the northeastern U.S. will bein the northeastern U.S. will be
largely determined by thelargely determined by theregionregion’’s residents and leaders.s residents and leaders.

For More Information on thisFor More Information on thisTopic:Topic:
nn http://www.cnr.umn.edu/bp/publications/http://www.cnr.umn.edu/bp/publications/index.phpindex.php
nn www.dovetailinc.orgwww.dovetailinc.org


![INDEPENDENT MARKET REPORT FOR SOFTWOOD PLANTATION … · INDEPENDENT MARKET REPORT FOR SOFTWOOD PLANTATION PRODUCTS ... ...]'/!,4./*!!!](https://img.pdfslide.net/doc/110x75/5f2e5de272f6a91abe7a3a7d/independent-market-report-for-softwood-plantation-independent-market-report-for.jpg)