Embed Size (px)
Citation preview
GLOBAL UNIVERSITY ENTREPRENEURIAL SPIRIT STUDENTS’
SURVEY
National Report 2016 FINLAND
Timo Pihkala
Elena Ruskovaara
Ulla Hytti

Citation:
Pihkala T., Ruskovaara, E. & Hytti, U. (2016). GLOBAL UNIVERSITY
ENTREPRENEURIAL SPIRIT STUDENTS’ SURVEY, National Report 2016 FINLAND.
LUT Scientific and Expertise Publications, Reports, 69, Lappeenranta University of
Technology.
LUT
Lappeenranta University of Technology
School of Business and Management
P.O. Box 20
FI-53851 Lappeenranta
Finland
Tel. +358 294 462 111
http://www.lut.fi/
ISBN-numero:
Sähköinen julkaisu 978-952-335-051-9 (PDF)
LUT Scientific and Expertise Publications Raportit ja selvitykset – Reports, ISSN-L 2243-
3384, ISSN 2243-3384
Järjestysnumero sarjassa: 69

Preface
Student entrepreneurship is booming and along with the boom, also interest for student
entrepreneurship has awakened. The Global University Entrepreneurship Student Spirit Survey
GUESSS focuses on student entrepreneurship. This is now the fourth time when Finland is
participating the GUESSS survey. The first one took place year 2006, and later on studies were
carried out in 2008 and 2011. This GUESSS report highlights the state of the art of student
entrepreneurship in Finland in 2016.
We express our gratitude to all those students that spent their time answering our questions.
Furthermore, the active participation of Finnish HEIs is decisive for the success of student
surveys. The Global team of GUESSS has operated as the core for the survey design, data
purification and project management. Finally, Ernst & Young (EY) has been the international
project partner for GUESSS. Our sincere thanks!
National and international GUESSS reports can be found at:
http://www.guesssurvey.org/publications

Table of Contents
1 INTRODUCTION ............................................................................................................ 5
1.1 Aim and purpose of the report ................................................................................. 5
1.2 The GUESSS project: key information .................................................................... 6
2 DEMOGRAPHIC INFORMATION ABOUT THE SAMPLE .............................................. 7
3 CAREER CHOICE INTENTIONS AND ENTREPRENEURIAL INTENTIONS ................. 9
3.1 General overview .................................................................................................... 9
3.2 Factors explaining entrepreneurial intentions .........................................................11
4 DRIVERS OF ENTREPRENEURIAL INTENTIONS ......................................................15
4.1 University context ...................................................................................................15
4.2 Locus of control, attitude, and entrepreneurial self-efficacy ....................................17
4.3 The reaction of social network ................................................................................19
5 NASCENT AND ACTIVE ENTREPRENEURS ..............................................................20
6 IMPLICATIONS AND SUMMARY .................................................................................23
6.1 Main findings and key messages............................................................................23
6.2 Recommendations .................................................................................................24

1 INTRODUCTION
Entrepreneurship continues to grow in popularity among university students. It has become a
serious choice for students that consider their career options and who make choices about their
study directions and subjects. This trend has been dominant for the last ten years and is growing
stronger and influential. This development could be explained in many ways:
1) change in common attitudes towards entrepreneurship. The supporting climate and
culture for entrepreneurship are influential for the growth of entrepreneurial intentions.
2) entrepreneurship education. Entrepreneurship education has been included in the
curriculum of Finnish general education since 1994. From that perspective, practically
all present HEI students have been affected by entrepreneurship education.
3) the visibility of entrepreneurial role models. The new forms of media have strongly
supported the visibility of entrepreneurial success stories. That is, the prominent self-
made people are living proofs that it can be done.
4) changing work and career prospects. Changing professions and changing careers many
times during one’s working life has become normal at the same time the possibilities
for having a ‘traditional career’ have grown weaker.
5) digitalization. Along with the digitalization and new ICT-tools, the initial capital
requirements for establishing a business have dropped dramatically. As a result from
this, students have engaged into entrepreneurial projects.
At present in Finland, student entrepreneurship has already important implications on the
national entrepreneurship policy. It has also been recognized in the indicators measuring the
impact of higher education, as well as it has become one of the most important tools for
renewing regional competitiveness.
1.1 Aim and purpose of the report
This report highlights the overall picture of the current student entrepreneurship in Finland.
Doing this, it
- provides a systematic and long term analysis of the development of entrepreneurial
intentions among Finnish students;
- analyses some of the background factors determining the level of intention; and
- evaluates the role of the entrepreneurial education and climate offered by the HEI on
the level of entrepreneurial activities.

1.2 The GUESSS project: key information
GUESSS is a global project, with 50 countries participating. The project started in 2002, the
second survey took place in 2004, the third in 2006, fourth 2008 and fifth in 2011. Year 2016,
122 509 students responded in the GUESSS questionnaire. So far, Finland has taken part in the
GUESSS study four times: 2006, 2008, 2011 and now in 2016. In this report we highlight the
results of the GUESSS survey in Finland. The survey was undertaken during the spring 2016.
GUESSS 2016 survey measured the entrepreneurial intentions of Finnish university students.
In Finland, Lappeenranta University of Technology has been responsible for the collection of
the data and the country report. February 2016 an invitation letter was sent to all Finnish HEIs,
to president of the HEIs or contact person for entrepreneurship. Later on, the survey link was
opened and the contact persons was contacted and provided with information which they could
forward to students. The survey opened in the beginning of April 2016 and the responses were
asked by mid-May. Moreover, a reminder email was sent to contact persons in the end of April.
The Finnish GUESSS team includes Professor Timo Pihkala (LUT), Director of
Entrepreneurship Education Elena Ruskovaara (LUT) and Research Director Ulla Hytti
(University of Turku).

2 DEMOGRAPHIC INFORMATION ABOUT THE SAMPLE
For the survey, all Finnish HEIs were contacted. Altogether, there are 14 universities and 24
universities of applied sciences in Finland. The results suggest that only some of the HEIs
succeeded to participate in the survey with a significant number of respondents. The data
contains respondents from 15 different universities or universities of applied sciences. The most
impressive participation came from the cities of Turku, Lappeenranta, Jyväskylä and Lahti. On
the other hand, the large HEIs operative in Helsinki metropolitan area showed minimal interest
in the survey.
The Finnish survey received 532 full responses. Table 1 presents the distribution of respondents
according to their study place.
Table 1: Universities and universities of applied sciences represented in the sample
N %
University of Turku 200 37,6
Lappeenranta University of Technology 118 22,2
Åbo Akademi 46 8,6
University of Jyväskylä 44 8,3
Lahti university of applied sciences 32 6,0
Seinäjoki university of applied sciences 27 5,1
Yrkeshögskolan Novia 21 3,9
University of Lapland 17 3,2
Metropolia university of applied sciences 8 1,1
University of Oulu 5 0,9
Häme university of applied sciences 4 0,8
Aalto university 3 0,6
Haaga-Helia university of applied sciences 3 0,6
University of Helsinki 2 0,4
University of Vaasa 2 0,4
Others 2 0,4
532 100,0
Even if the response from different HEIs was not very high, the respondent profile matches
very well with the Finnish student population. Table 2 shows that women were slightly more
active in responding than men, with 54% and 45% shares, respectively. This corresponds
extremely well to the overall situation among Finnish university students. According to the

recent statistics, 45% of Finnish HEI students them are men and 55% are women (Statistics
Finland, 2016).
Also in terms of age, the data matches very well with the student population. Table 2 shows
that the largest age group is 25-29 years with 32% of respondents, while the age groups of 22-
24 and 36 or more have roughly the same shares with 23% of respondents. According to the
recent student survey by Finnish Ministry of Education and Culture (Opetus- ja
kulttuuriministeriö, 2014), in Finland, the average university student and foreign student is 26
years old, whereas the average universities of applied science student is 25 years.
Table 2: Descriptive statistics of the respondents (n 532)
Respondents N %
Gender Men 241 45,3
Women 289 54,3
no response 2 0,4
Age 19- 21 45 8,5
22-24 123 23,1
25-29 153 32,7
30-35 68 12,8
36 or more 118 22,2
Nationality Finnish 467 87,8
Russian 12 2,3
German 4 0,8
Swedish 1 0,2
Other 44 8,3
No response 1 0,2
532 100%
Table 2 further shows that the distribution of different nationalities follows the Finnish
university students’ profile. The vast majority or 88% have Finnish nationality while the rest
12% come from abroad. The low number of responses can relate to number of reasons. One
reason may be that the questionnaire of the study was in English to ensure the access of the
foreign students. It seems that the study failed to meet its target in inviting the foreign students
to participate actively. At the same time, it may have cut down the Finnish students’ willingness
to participate, as some of the issues dealt with in the questionnaire requires good management
of English.

3 CAREER CHOICE INTENTIONS AND
ENTREPRENEURIAL INTENTIONS
3.1 General overview
Students’ occupational preferences guide their educational choices and they also play a major
role as the motivators for the studies. Traditionally, Finnish university studies have prepared
students for their careers in public service or employees in the private sector. On the other hand,
an entrepreneurial career has not been the students’ primary choice. From this perspective the
occupational preferences in the Finnish survey are as expected – the large majority of the
respondents prefer a traditional career as an employee. As table 3 shows, immediately after
studies about 80% of the students prefer to become employees, while about 10% prefer
entrepreneurship, and roughly 8% do not know yet.
The attractiveness of different organization types seems interesting. Small businesses, medium
sized businesses, large businesses and public service all receive rather similar interest with 15-
19%. In the earlier Finnish GUESSS surveys the attractiveness of SMEs (1-249 employees) has
been 44,0% (2006), 52,3% (2008) and 39,1% (2011). In year 2016 only 34% of students prefer
SMEs, which indicates a steady and continued decline. Similarly, the attractiveness of large
businesses is in decline with 15,2% preferring the employment in large businesses. In the survey
2011 the corresponding share was 23,9%. One reason for the decline may be the rise of the new
non-profit sector. The current and growing interest on more sustainable and ethical businesses
has been noticed as the introduction of socially oriented and non-profit businesses. However,
non-profit movement does not fully explain the shift. It seems that in the big picture there is a
transfer of interest from private employment to public and academic sectors. Finding
employment in the public sector and the academia have increased their shares dramatically.
From the 2011 survey the share of students opting for academic career path has tripled. This
line of development may be a convenient choice for present students. That is, selecting an
academic career could raise the possibility of getting a job, raise the expectations of future
earnings and simultaneously postpone the need to enter the job market immediately after
graduation.

Table 3: Students’ occupational preferences immediately after studies (%)
2006 2008 2011 2016
an employee in a small business (1-49 employees) 15,0
an employee in a medium-sized business (50-249 employees) 44,0* 52,3* 39,1* 19,0
an employee in a large business (250 or more employees) 14,3 17,3 23,9 15,2
an employee in a non-profit organization** 4,5
an employee in Academia (academic career path) 1,7 1,0 3,7 11,5
an employee in public service 4,3 4,3 6,4 16,0
a founder (entrepreneur) working in my own business 5,1 5,1 3,0 9,8
a successor in my parents' / family's business 1,7 2,0 1,3 0,4
a successor in a business currently not controlled by my family 1,5 2,9 3,1 0,4
Other / do not know yet 14,2 6,0 11,2 8,3
* The Small and medium sized businesses together
** The non-profit organization were not included in earlier surveys
While the attractiveness of traditional careers seems to be in decline, entrepreneurship continues
steady growth. Compared to the earlier GUESSS surveys, the share of students intending to
become entrepreneurs immediately after studies has grown two-three times. This result is well
in line with some other studies about students’ entrepreneurial intentions. Also based on the
recent GEM study it was found out that individuals with at least a post-secondary degree
perceive opportunities for entrepreneurship more often than their less educated counterparts
(see table 4). Even if Finns are far from their counterparts in Baltic countries, the younger
generations today are more active in entrepreneurship than the older generations. (Suomalainen
et al., 2016)
Table 4: Early-stage entrepreneurial activity by age in selected member states in 2015 (as % of
population in each age group) (Suomalainen et al., 2016)
Country 18–24 25–34 35–44 45–54 55–64 Total
Estonia 14.7 21.5 17.1 7.3 4.6 13.1
Finland 5.2 8.6 9.7 5.2 4.4 6.6
Germany 4.6 6.3 5.0 5.4 2.0 4.7
Latvia 16.0 22.3 17.6 9.6 4.2 14.1
Sweden 5.6 9.3 7.3 7.0 6.0 7.2
United Kingdom 3.9 7.3 8.9 7.9 5.4 6.9
Average (EU) 7.5 10.7 9.7 7.1 4.3 8.0
The students’ career expectations seem to develop considerably during the first five years after
studies (see table 5). It seems that the students’ aspirations to stay as employees drop from 80%

to 52%. The 30% shift is directed from private sector employee positions to academic and
public careers and entrepreneurship. The attractiveness of SMEs seems to be stable at 16%,
while the share of large businesses drops from 21% to 13%. It is likely that the financial
difficulties during the recent years that especially the large businesses have reported is now
highlighted in the survey results. For a few years, practically all net jobs are created in SMEs
and the large business sector is losing jobs. On the other hand, the both academic career and
public sector career have more than doubled their shares. This development could be understood
as the risk-avoiding choices.
Table 5: Students’ occupational preferences after 5 years
2006 2008 2011 2016
an employee in a small business (1-49 employees) 6,0
an employee in a medium-sized business (50-249 employees) 17,3* 29,5* 15,2* 10,2
an employee in a large business (250 or more employees) 12,6 16,8 21,4 13,2
an employee in a non-profit organization** 4,5
an employee in Academia (academic career path) 1,3 1,7 3,4 8,1
an employee in public service 3,6 3,6 4,0 10,5
a founder (entrepreneur) working in my own business 16,1 20,1 20,1 30,8
a successor in my parents' / family's business 3,5 2,7 2,4 0,4
a successor in a business currently not controlled by my family 3,5 6,3 2,2 1,7
Other / do not know yet 17,3 6,5 15,8 14,7
* The Small and medium sized businesses together
** The non-profit organization were not included in earlier surveys
In table 5, the share of intending entrepreneurs grows significantly. In 2006, entrepreneurship
was still in par with employment within SME sector and employment within large businesses.
Since 2006, the level of entrepreneurial intentions has doubled. It seems that entrepreneurship
is by far the most attractive career option for students with 31% share. Earlier studies support
this finding. For example, according to a recent study focusing on the Finnish citizens’ basic
values (Sutinen et al, 2015), 34% of Finns are interested in, in some stage of their life,
establishing one’s own business. Moreover, amongst 25 to 34 year-old Finns, the figure is as
high as 45% (Sutinen et al, 2015).
3.2 Factors explaining entrepreneurial intentions
The career choices were analyzed according to the students’ background. Table 6 shows the
comparison between Finnish students and students with foreign nationality. It seems that

foreign students rate entrepreneurship immediately after studies somewhat less attractive than
Finnish students. This may reflect their lack of networks and limited social capital in Finland
making it difficult to consider an entrepreneurial career in Finland immediately after the studies.
However interestingly, while entrepreneurship grows in popularity for Finnish students almost
threefold, it seems even more interesting for foreign students, with 47% of foreign students
wanting to become entrepreneurs after five years. This development could be understood as the
process of integration into the Finnish society. For foreign students, starting a business right
after graduation could require extensive resources. Instead, first effectively integrating and
establishing themselves to Finnish culture and business life would be necessary for successful
entrepreneurship. After five years this process would be successfully passed. Moreover, the role
of networks seems to gain ground in entrepreneurship discussions, and therefore, the foreign
students might think that the next coming years after graduation is for networking and later on
for establishing one’s own business.
Table 6: Students’ occupational preferences depending their nationality %
Finnish Foreign
Directly 5 years Directly 5 Years
Employee 80,9 53,7 83,1 43,1
Founder 10,5 28,5 4,6 47,7
Successor 0,9 2,1 0,0 1,5
Other 7,7 15,6 12,3 7,7
The career options were analyzed also according to the students’ gender. Table 7 shows the
comparison between male students and female students. It seems that female students rate
entrepreneurship immediately after studies decisively less attractive than male students. The
difference is rather large – only 5% of female students report entrepreneurial intention
immediately after studies, while almost 16% of men intend to become entrepreneurs. The
gender gap is well-identified in other studies as well, for example in the GEM report
(Suomalainen et al., 2016). In Finland, the share of female early-stage entrepreneurs is 4,2% as
opposed to 8,9% of men who are engaged in early-stage entrepreneurship. Men are also more
active in established business ownership than women. The share of female established business
owners is 6,1% while simultaneously 14,2% of men are established business owners in Finland.
(Suomalainen et al., 2016) The reasons for this difference may be versatile. However, it is likely
that female students consider entrepreneurship riskier than their male colleagues. Especially for
women choosing an entrepreneurial career has important implications in terms of weakened
social policy benefits that are often related to family and children. Thus the personal and social
risks are higher for women than for men. In the GEM report the results suggest that the fear of

failure is higher among women than among men (Suomalainen et al., 2016). But it is necessary
to exert caution when offering gender-based individualistic explanations for lower
entrepreneurial activity rates for women. Research has documented several structural reasons
for this such as gendered educational and occupational choices that are related to attractiveness
of entrepreneurship for women and men (Ahl and Nelson, 2010).
For male students the share of intending entrepreneurs more than doubles after five years, to
35%. This figure is remarkably high. However, for women the attractiveness of
entrepreneurship rises also dramatically, with 27% of women intending to be entrepreneur after
five years. It seems that the first five years after graduation are very significant for female
entrepreneurship. Liles (1974) suggested that for selecting the entrepreneurial career, there is a
special period of free choice that is associated with gaining experience in working life and
saving initial capital for the forthcoming start-up. If Lyles’ hypothesis would concern women
especially, can’t be tested in this context. However, we suggest that this finding should be
studied further.
Table 7: Intentional founders by gender %
Directly After 5 years
Men 15,8 35,3
Women 4,8 27,0
Traditionally, having entrepreneurial parents has been one of the best indicators to predict the
entrepreneurial career. In this present study, analyzing intentions from this perspective brings
out interesting results. Based on research, role models are important in entrepreneurship. The
role of paternal role models is emphasized for example in a study by van Auken et al (2006).
They demonstrate that the majority of students both in Mexico and the United States report
their father to be the most important role model (about 62% of respondents compared to 7-10%
naming their mother as the most important role model). Table 8 presents the levels of
entrepreneurship intention for those students whose parents are entrepreneurs. For comparison,
we added the level of intention of all respondents in the table. It seems that especially father’s
entrepreneurship is associated with student’s entrepreneurial intentions. That is, compared to
all respondents, for those students who have an entrepreneurial father the level of intention is
more than two times stronger. On the other hand, mother’s entrepreneurship seems to lower
students’ entrepreneurship, the level of intentions drop to 5,8%. In cases that student’s both
parents are entrepreneurs, the level of intention is roughly the same as for all respondents.
Bosma et al (2012) provide some preliminary evidence that entrepreneurs and their role models
tend to resemble each other in terms of the characteristics that facilitate role identification
including gender. Thus, when male students are more active in their entrepreneurial intentions,
it is strengthened by the male role model, i.e. father. In a study by Chlosta et al (2012) it was
discovered that the personality of the offspring – i.e. their openness - is an important factor in
explaining why some children choose to join the family business while others do not. The more
open the individual, the weaker the effect of parental and paternal role models. The study,
however, showed that the effect of paternal role models depends on the openness of those
individuals, whereas the effect of maternal role models does not. Thus our findings related to
previous research that suggest the effects of paternal and maternal role models on
entrepreneurial intentions may diverge.
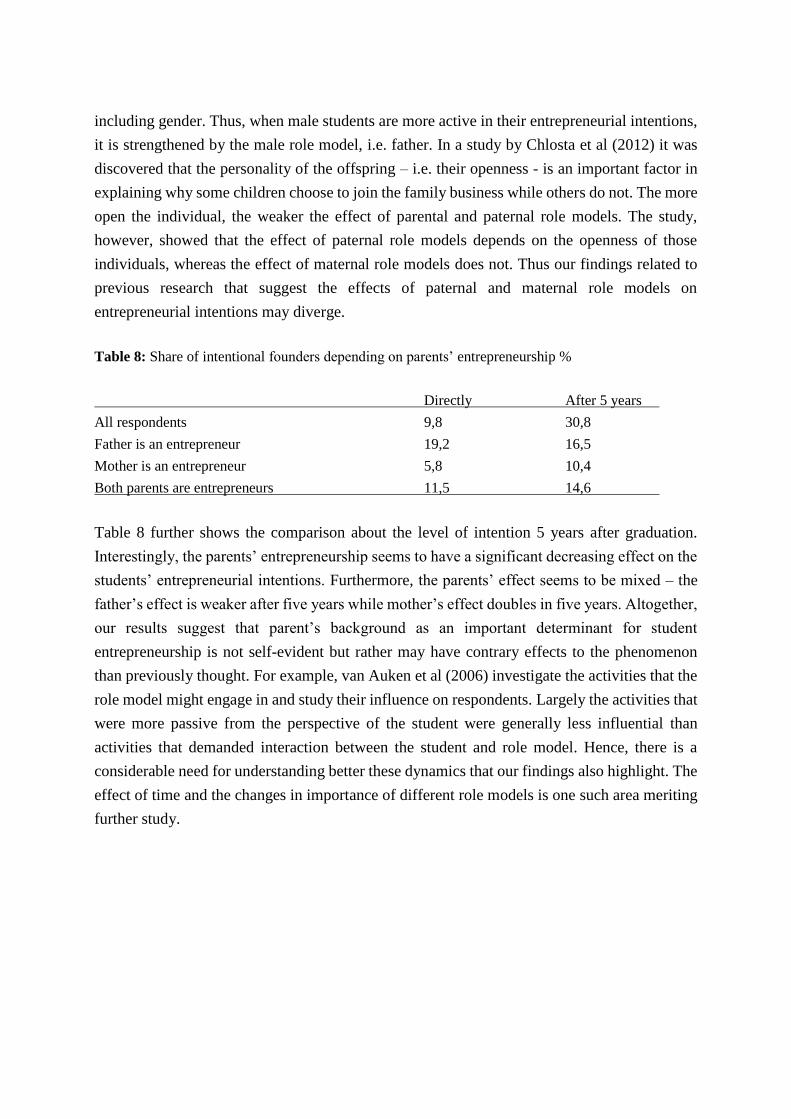
Table 8: Share of intentional founders depending on parents’ entrepreneurship %
Directly After 5 years
All respondents 9,8 30,8
Father is an entrepreneur 19,2 16,5
Mother is an entrepreneur 5,8 10,4
Both parents are entrepreneurs 11,5 14,6
Table 8 further shows the comparison about the level of intention 5 years after graduation.
Interestingly, the parents’ entrepreneurship seems to have a significant decreasing effect on the
students’ entrepreneurial intentions. Furthermore, the parents’ effect seems to be mixed – the
father’s effect is weaker after five years while mother’s effect doubles in five years. Altogether,
our results suggest that parent’s background as an important determinant for student
entrepreneurship is not self-evident but rather may have contrary effects to the phenomenon
than previously thought. For example, van Auken et al (2006) investigate the activities that the
role model might engage in and study their influence on respondents. Largely the activities that
were more passive from the perspective of the student were generally less influential than
activities that demanded interaction between the student and role model. Hence, there is a
considerable need for understanding better these dynamics that our findings also highlight. The
effect of time and the changes in importance of different role models is one such area meriting
further study.

4 DRIVERS OF ENTREPRENEURIAL INTENTIONS
In this section we analyze some of the possible drivers for students’ entrepreneurial intentions.
These aspects are related to the university context and the student’s psychological
characteristics.
4.1 University context
To understand the relationship between entrepreneurship education in the universities and the
students’ entrepreneurship intentions, we analyze the students’ attendance to different
entrepreneurship offerings. The availability of entrepreneurship education within universities
has risen fast in Finland, and this development can be identified in the results. According to
recent study by Finnish Ministry of Education and Culture (2016), Finnish HEIs provide
entrepreneurship-related training and courses widely. That is, almost all Finnish HEIs organize
at least some individual courses about entrepreneurship. For students, there may be both
elective and compulsory courses about entrepreneurship, and some students may have chosen
a specific program on entrepreneurship. Table 9 shows that roughly 52% of the respondents
have not taken any entrepreneurship education in the university. On the other hand, 21% of
respondents have taken an elective entrepreneurship course, 25% report that they have
participated a compulsory course and almost 12% are participating a specific program on
entrepreneurship.
Table 9: Attendance of entrepreneurship offerings %
%
I have not attended a course on entrepreneurship so far 52,1
I have attended at least one entrepreneurship course as elective 21,4
I have attended at least one entrepreneurship course as compulsory 25,4
I am studying in a specific program on entrepreneurship 11,7
Table 10 shows that entrepreneurship education in HEIs seems to be associated with the
students’ entrepreneurial intentions. Of the students reporting not to have participated in
entrepreneurship education so far only 7,6% report entrepreneurial intentions and 21% of them
intend to be entrepreneurs after five years. On the other hand, of the students that have taken
either an elective or a compulsory course on entrepreneurship roughly 10–13% report
entrepreneurial intentions immediately after studies, and for students taken an elective course,
almost 47% report entrepreneurial intentions after five years. Finally, students that have elected
a specific program on entrepreneurship seem to form a special group. A total of 24% of the
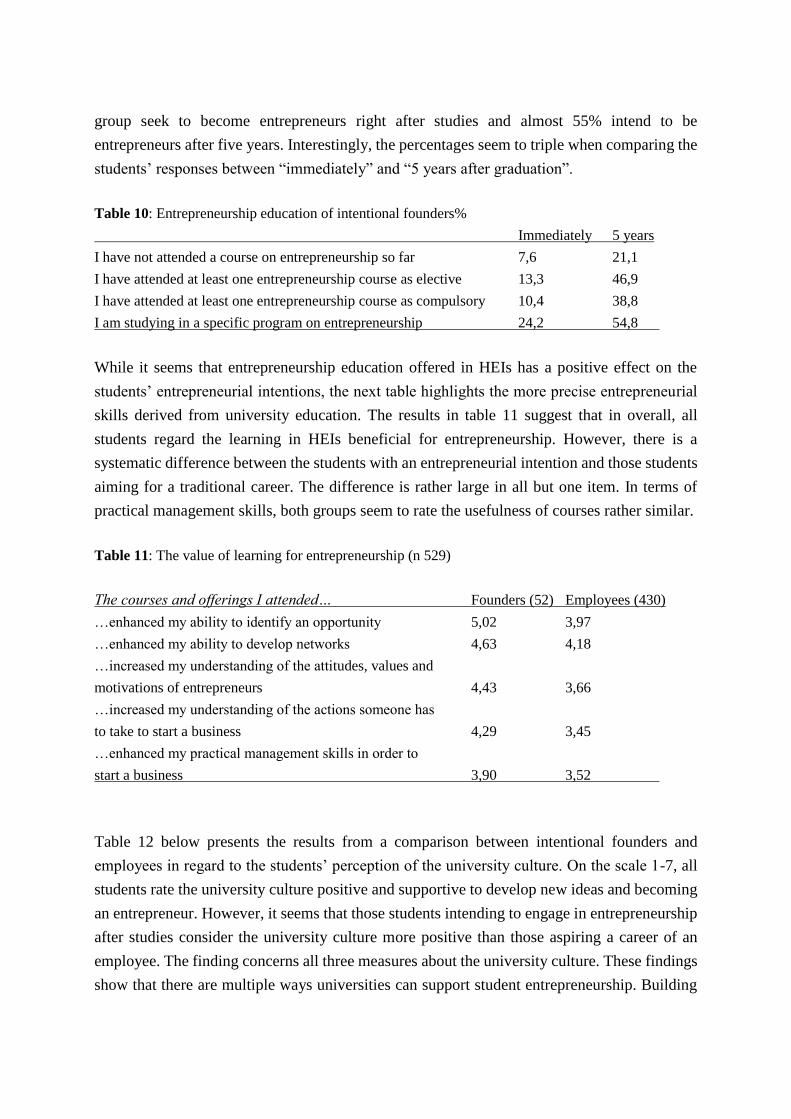
group seek to become entrepreneurs right after studies and almost 55% intend to be
entrepreneurs after five years. Interestingly, the percentages seem to triple when comparing the
students’ responses between “immediately” and “5 years after graduation”.
Table 10: Entrepreneurship education of intentional founders%
Immediately 5 years
I have not attended a course on entrepreneurship so far 7,6 21,1
I have attended at least one entrepreneurship course as elective 13,3 46,9
I have attended at least one entrepreneurship course as compulsory 10,4 38,8
I am studying in a specific program on entrepreneurship 24,2 54,8
While it seems that entrepreneurship education offered in HEIs has a positive effect on the
students’ entrepreneurial intentions, the next table highlights the more precise entrepreneurial
skills derived from university education. The results in table 11 suggest that in overall, all
students regard the learning in HEIs beneficial for entrepreneurship. However, there is a
systematic difference between the students with an entrepreneurial intention and those students
aiming for a traditional career. The difference is rather large in all but one item. In terms of
practical management skills, both groups seem to rate the usefulness of courses rather similar.
Table 11: The value of learning for entrepreneurship (n 529)
The courses and offerings I attended… Founders (52) Employees (430)
…enhanced my ability to identify an opportunity 5,02 3,97
…enhanced my ability to develop networks 4,63 4,18
…increased my understanding of the attitudes, values and
motivations of entrepreneurs 4,43 3,66
…increased my understanding of the actions someone has
to take to start a business 4,29 3,45
…enhanced my practical management skills in order to
start a business 3,90 3,52
Table 12 below presents the results from a comparison between intentional founders and
employees in regard to the students’ perception of the university culture. On the scale 1-7, all
students rate the university culture positive and supportive to develop new ideas and becoming
an entrepreneur. However, it seems that those students intending to engage in entrepreneurship
after studies consider the university culture more positive than those aspiring a career of an
employee. The finding concerns all three measures about the university culture. These findings
show that there are multiple ways universities can support student entrepreneurship. Building

an entrepreneurial atmosphere, communicating about the desirability of student
entrepreneurship and encouraging students to take entrepreneurial careers seem to have an
effect on the students’ choices.
Table 12: The university entrepreneurial culture/climate (n 529) (scale 1-7)
Founders (52) Employees (430)
The atmosphere at my university inspires me to
develop ideas for new businesses. 4,71 3,89
There is a favorable climate for becoming an entrepreneur at
my university. 4,81 4,15
At my university, students are encouraged to engage in
entrepreneurial activities. 4,69 4,11
4.2 Locus of control, attitude, and entrepreneurial self-efficacy
Attitudes, locus of control and self-efficacy reflect the person’s psychological stance towards
his/her own abilities to guide his/her own life. Based on the theory of planned behavior (Ajzen,
2002), the person’s behavioral control, norms and attitudes affect the person’s level of
intentions towards certain types of behavior. Earlier studies suggest that respondents that
operate as entrepreneurs score high on various entrepreneurial dimensions. For example, they
score higher on locus of control and being able to influence their own life and future. Not
surprisingly they also score high on entrepreneurial returns: they view entrepreneurship in a
positive light and source of satisfaction, and prefer it as a career option. This fits well with the
profile of academic entrepreneurship and entrepreneurship among the HEI graduates in Finland.
Becoming an entrepreneur is mainly influenced by the opportunities available and necessity-
driven entrepreneurship driven by lack of other alternatives remains rare (Suomalainen et al.,
2016).
In this survey, we analyze the role of locus of control, attitude and self-efficacy on the
entrepreneurial intention (see Table 14). It seems that in terms of psychological stance towards
entrepreneurship, all respondents score rather high. However, the results suggest that there is a
large and systematic difference between those student having entrepreneurial intention to start
a business and those of intending to be employees. The comparison suggests that the intentional
founders consider entrepreneurship significantly more attractive and satisfactory than their
colleagues intending to become employees. These results suggest that the students’ attitudes,
norms and behavioral control are associated with their level of entrepreneurial intentions.

Furthermore, it seems that the entrepreneurial intentions reported by the respondents seems to
be opportunity-driven rather than necessity-based.
Table 14: Locus of control, attitude, and entrepreneurial self-efficacy (n 454) (scale 1-7)
Founders Employees
If I had the opportunity and resources, I would become an entrepreneur 6,40 4,23
Being an entrepreneur would entail great satisfactions for me 6,16 3,77
A career as entrepreneur is attractive for me 6,16 3,73
Among various options, I would rather become an entrepreneur 5,80 3,32
I am usually able to protect my personal interests 5,72 4,98
Being an entrepreneur implies more advantages than disadvantages to me 5,64 3,76
When I make plans, I am almost certain to make them work 5,33 5,12
I can pretty much determine what will happen in my life 5,28 4,27
The students were asked about the perception of their personal skills and competences related
to creating and running a business. In table 15 below the results suggest that there are systematic
differences in the skills between founder students and employee students. It seems that in
overall, the students reporting entrepreneurial intentions score higher in all listed
entrepreneurial skills. We suggest that this difference may stem from the different educational
choice that the students have made. Earlier in this report (Table 11) we showed that the
intentional founders have participated in entrepreneurship education more than their colleagues.
In other words, students that demonstrate entrepreneurial intentions when enrolling to the
university may be more inclined to develop entrepreneurial skills during the university studies,
and thus enroll for the studies and acquire these skills considered necessary for the
entrepreneurial future.
Table 15: Skills among intentional founders and intentional employees (1-7 scale) (immediately)
Founders Employees Identifying new business opportunities 5,84 3,75
Creating new products and services 5,72 3,67
Managing innovation within a firm 5,56 3,75
Being a leader and communicator 5,92 4,68
Building up a professional network 5,32 4,22
Commercializing a new idea or development 5,32 3,73
Successfully managing a business 5,20 3,88
There may be also another explanation for the high self-efficacy of the intentional founders: By
using a large sample from population surveys in 18 countries Koellinger et al (2007) found
strong evidence that subjective – and often biased – perceptions influence greatly on new

business formation. The strongest factor of an individual’s entrepreneurial propensity was
found to be whether the individual believes herself to have the sufficient skills, knowledge and
ability to start a business. Additionally, the study also found a negative correlation between this
entrepreneurial confidence and the survival chances of nascent entrepreneurs across countries.
4.3 The reaction of social network
The students were asked about the social support for their possible entrepreneurial activities. It
could be argued that social networks and support play a decisive role in the formation of
personal intention to start. Without a possibility to share interests, ideas, development plans,
and start-up plans the entrepreneurial venture may lack the essential social capital resources. In
overall, it seems that the respondents regard their social network as supportive towards
entrepreneurial engagements.
Table 16: Social network support among intentional founders and intentional employees (1-7 scale)
(immediately)
Founder Employee
Your friends 6,13 5,30
Your fellow students 5,87 5,21
Your close family 5,87 5,05
The results in table 16 suggest that those students with an entrepreneurial intention seem to
score systematically higher in all measures. This result can be understood in multiple ways:
first, the entrepreneurial students are better in creating supporting networks and social capital.
Second, the intentional founders for some reason consider their network more useful than their
colleagues. Finally, the intentional founders have selected more entrepreneurial networks and
learned about the supporting capacity of the networks for entrepreneurship. On the other hand,
the students without entrepreneurial intentions have not spent time in entrepreneurial networks
and thereby can’t trust in their support.

5 NASCENT AND ACTIVE ENTREPRENEURS
A step towards more concrete entrepreneurial activity is to analyze the level of nascent
entrepreneurs among students. Table 17 shows that 19,0% or 101 students report that they are
currently trying to start an own business. This figure can be considered rather high and can be
seen to reflect the current entrepreneurial spirit in Finnish HEIs.
Table 17: Students currently trying to start an own business/to become self-employed
No % Yes %
All 430 80,8 101 19,0
Men 41,4 61,4
Women 58,4 37,6
Father is an entrepreneur 18,8 18,8
Mother is an entrepreneur 6,3 8,9
Both parents are entrepreneurs 5,8 16,8
It seems that nascent entrepreneurship in HEIs is dominantly a male phenomenon. Of these
students 61% are men and 38% are women. This reflects quite well the overall entrepreneur
population. Out of all entrepreneurs about 1/3 is female but this changes with education.
Women represent about 40% of all entrepreneurs with a higher education: 15% of all female
entrepreneurs have a higher education while the comparative share for male entrepreneurs is
10%. (MEE 2014) The increase in number of graduates from HEIs is already one reason for the
increasing interest for entrepreneurship. The traditional career paths for HEI graduates are not
able to absorb all graduates and on the other hand the graduates are better equipped to identify
and exploit many entrepreneurial opportunities linked to technology and expertise than their
less educated counterparts. This was also reflected in the GEM report where individuals with a
better educational level were able to see more entrepreneurial opportunities than other people
(Suomalainen et al., 2016).
On the other hand, the students’ parents’ entrepreneurship does not seem to explain but a modest
share – only a minority of the nascent entrepreneurs report their parents to be entrepreneurs. In
comparison with non-entrepreneurial students the share of entrepreneurial parents seems equal.
That means, that their entrepreneurial drive arises from somewhere else than home.

The next table 18 presents the distribution of those students that are currently running their own
business at the same time as they are studying. This figure includes the self-employed. Partly
due to the students’ difficulties of financing their studies, all the more students take part time
jobs or select entrepreneurship during their studies. As such dividing student time with work
has not been considered optimum for the HEIs, the students or the business. However, due to
the rise of the entrepreneurial boom, the picture of student entrepreneurs has changed and it
seems that study-time entrepreneurship may support learning outcomes, facilitate employment
after graduation and predict entrepreneurial career after graduation (Suomen yrittäjät, 2015).
Table 18 shows that altogether 76 or 14,3% of the respondents reported that they have been
running a business alongside their studies. Our results suggest that running a business at the
same time is becoming more usual. Compared to the Finnish survey 2001, the share of
entrepreneurs was 3,8% and during the five years the share of entrepreneurs has grown four
times.
Table 18: Students currently running an own business/already self-employed
No % Yes %
All 456 85,7 76 14,3
Men 42,3 63,2
Women 57,2 36,8
Father is an entrepreneur 17,5 26,3
Mother is an entrepreneur 6,8 7,9
Both parents are entrepreneurs 7,5 10,5
Table 18 further shows that the male dominance in student entrepreneurship prevails also in
this analysis. About 63% of the entrepreneurship practicing students are men. This reflects well
the existing gender gaps in entrepreneurship discussed earlier. It is also noteworthy that the
Student Entrepreneurship Societies that have been launched in most university cities in Finland
and that have become important drivers and networks of student and graduate entrepreneurs in
many universities and surrounding entrepreneurial ecosystems, also started as predominantly
male phenomena. For example, the local student entrepreneurship society in Turku
(BoostTurku) self-diagnosed a challenge a few years ago that their events and particularly their
accelerator program attracted nearly exclusively male students. By organizing events targeting
at female audiences and featuring women entrepreneurs and female business angels they were
able to attract more female participants in their events and programs.

It seems that for these entrepreneurs, the parents’ entrepreneurial background plays a modest
role. Comparing between the entrepreneurs and the non-entrepreneurs, it seems that their
parents’ entrepreneurship is more of less equal. However, fathers have some effect on the
students’ entrepreneurship. Roughly every fourth practicing entrepreneur reported that their
father is an entrepreneur. In a general view it seems that student entrepreneurship is not
inherited – rather it grows from other sources. These sources may be the e.g. school culture,
team formation, entrepreneurship education.
Finally, we analyze the entrepreneurship education of nascent and active entrepreneurs (see
table 19). It seems that student entrepreneurs are more active taking entrepreneurship education
in their studies. While 51% of the all respondents report not to have studied entrepreneurship,
only 31% of nascent and 39% of active entrepreneurial students have not taken entrepreneurship
courses. On the other hand, nascent entrepreneurs seem to be the most active students to take
entrepreneurship courses – elective or compulsory while active entrepreneurs take them only
somewhat more than the respondents in general.
Table 19: Entrepreneurship education of nascent and active entrepreneur students
all nascent active
I have not attended a course on entrepreneurship so far 51,7 31,7 39,5
I have attended at least one entrepreneurship course as elective 21,1 36,6 22,4
I have attended at least one entrepreneurship course as compulsory 25,2 31,7 27,6
I am studying in a specific program on entrepreneurship 11,7 25,7 27,6

6 IMPLICATIONS AND SUMMARY
6.1 Main findings and key messages
The survey results brings new information about the student entrepreneurship in Finland. There
seems to be a lot of entrepreneurship in Finnish HEIs. Even if the number of responses stayed
rather low, the results give an interesting view on the entrepreneurial activities. The main
numbers are as follows:
14,3% of students are currently running a business or are self-employed
19,0% of students are currently preparing a start-up
9,8 % of students are intending to start directly after graduation
30,8% of students are intending to start 5 years after graduation
On the basis of our results, entrepreneurship has become an important part of the HEI student
profile. The share of practicing and nascent entrepreneurs is large and that has implications on
the organization and contents of the education offered to students. It is likely that these students’
expectations are likely to be different than with those not running businesses or starting up.
Furthermore, the career expectations of these students are in fast change, as well as they expect
their studies to benefit in a different way.
Students’ entrepreneurship seems to grow from their own interests, studies, HEI entrepreneurial
culture and opportunities rather than the traditional sources. That is, the parents’ entrepreneurial
background explains only a part of student entrepreneurship. These line of development can be
interpreted as a positive sign – the entrepreneurial drive arises from opportunity driven interest
rather than necessity to earn one’s living.
While student entrepreneurship is a renewing force for HEIs and the economy, it seems to pass
on the traditions concerning the division between genders. Student entrepreneurship is
predominantly a male phenomenon. New insights are needed to understand, how this line of
development could be changed.

6.2 Recommendations
For HEIs: The entrepreneurial student movement challenges HEIs. The entrepreneurial
activities are about to change the institutions from inside. This is good news as it means that
the education, research and societal interaction are constantly developing and in need to stay
up to date. HEIs should be aware of this development, and rather than neglecting the
development, notice the opportunities for creating the supporting and facilitating
entrepreneurial culture for the students.
For student entrepreneurs: Studying and doing business at the same time form a challenging
combination. While it challenges the student, it also provides a unique possibility to engage
into entrepreneurial learning. That is, creating new businesses in the HEI platform means the
availability of newest research findings, professional guidance and the best opportunities for
networking. However, as an entrepreneurial learning opportunity, it may mean that the
venturing projects may prove unsuccessful. Assuming the entrepreneurial risk should be made
consciously.
For public and regional authorities: Having a HEI in the region means an opportunity for
having an entrepreneurship accelerator. The entrepreneurial student need the local, regional,
national and international interaction for their ventured to succeed. In terms of entrepreneurship
education offerings, the context of the HEIs plays an important role.
For researchers: The fast growth of student entrepreneurship raises a set of new questions to
be studied. Among other things, the practicing and nascent student entrepreneurs form an
interesting group for further inquiry. They form the basic group for academic entrepreneurship
coevolving with the research-based spin-offs. However, they constitute a more autonomous and
elusive part of the phenomenon. Additionally, the emergence of the entrepreneurial drive seems
to base on other than family background of the students. We encourage new studies about the
emergence of entrepreneurial motivation and/or intentions during the studies.

References
Ahl, H., & Nelson, T. (2010). Moving forward: institutional perspectives on gender and
entrepreneurship. International Journal of Gender and Entrepreneurship, 2(1), 5-9.
Akava (2016).
http://www.akava.fi/akavalainen/ajassa/viikon_luku/korkeakoulutettujen_naisyrittajien_maara
_kasvoi_82_prosenttia_vuosina_2008_2015
Bosma, N., Hessels, J., Schutjens, V., Van Praag, M., & Verheul, I. (2012). Entrepreneurship
and role models. Journal of Economic Psychology, 33(2), 410-424.
Chlosta, S., Patzelt, H., Klein, S. B., & Dormann, C. (2012). Parental role models and the
decision to become self-employed: The moderating effect of personality. Small Business
Economics, 38(1), 121-138.
Koellinger, P., Minniti, M., & Schade, C. (2007). “I think I can, I think I can”:
Overconfidence and entrepreneurial behavior. Journal of Economic Psychology, 28(4), 502-
527.
Liles, P (1974). Who are entrepreneurs? MSU Business Topics, Michigan State University.
MEE (2014). Business Review [Yrityskatsaus 2014]. Ministry of Employment and of the
Economy.
Opetus- ja kulttuuriministeriö (2014). Opiskelijatutkimus 2014. Korkeakouluopiskelijoiden
toimeentulo ja opiskelu, Opetus- ja kulttuuriministeriön julkaisuja 2014:10.
http://www.minedu.fi/export/sites/default/OPM/Julkaisut/2014/liitteet/okm10.pdf?lang=fi
Opetus- ja kulttuuriministeriö (2016). Yrittäjyyden tukemisen hyvät käytänteet
korkeakouluissa 2016. Opetus- ja kulttuuriministeriön julkaisuja 2016:14.
http://www.minedu.fi/export/sites/default/OPM/Julkaisut/2016/liitteet/okm14.pdf?lang=fi
Suomalainen, S., Stenholm, P., Kovalainen, A., Heinonen, J. & Pukkinen, T. (2016). Global
Entrepreneurship Monitor. Finnish 2015 Report. Series A Research Reports A 1/2016
University of Turku. https://tem.fi/documents/1410877/2132284/GEM+2015/272cebde-1b2c-
4fef-949e-f3609f0fbfa3
Suomen Yrittäjät (2015). Opiskelijasta yrittäjäksi 2015.
Sutinen, R., Maunula, S., Leinikka, H. & Tarpila, J. (2015). Kansan arvot 2015. T-media.
Van Auken, H., Stephens, P., Fry, F. L., & Silva, J. (2006). Role model influences on
entrepreneurial intentions: A comparison between USA and Mexico. The International
Entrepreneurship and Management Journal, 2(3), 325-336.