Embed Size (px)
Citation preview
anno 90 - year 90Supplemento al n. 23 - Supplement to n.23
Lunedì 17 Luglio 2017Monday, July 17, 2017
. . . s i n c e 1 9 2 8
EditricE UnionE italiana Vini sede: 20123 Milano, via san Vittore al teatro 3, tel. 02 72 22 281, fax 02 86 62 26 abbonamento 2017 per l’italia: versamento ccp n. 508200, 120,00 euro (iva assolta); 90,00 euro versione on-line (iva inclusa); versione cartacea + on-line 150,00 euro - Una copia 5,00 euro, arretrati 6,00 euro - area internet: www.corrierevinicolo.com
associazione per la tutela generale delle attività del ciclo economico del settore vitivinicolo
registrazione tribunale di Milano n. 1132 del 10/02/1949 tariffa r.o.c.: Poste italiane spa, spedizione in abbonamento postale d.l. 353/2003 (conv. in l. 27/02/2004 n. 46) art. 1, comma 1, dcB Milano stampa: sigraf, treviglio (Bergamo) - associato all’Uspi, Unione stampa Periodica italiana.
BYNUWBERSWINE W
a project by il corriere vinicolo
P r e s s m e d i a o f U n i o n e I t a l i a n a V i n i
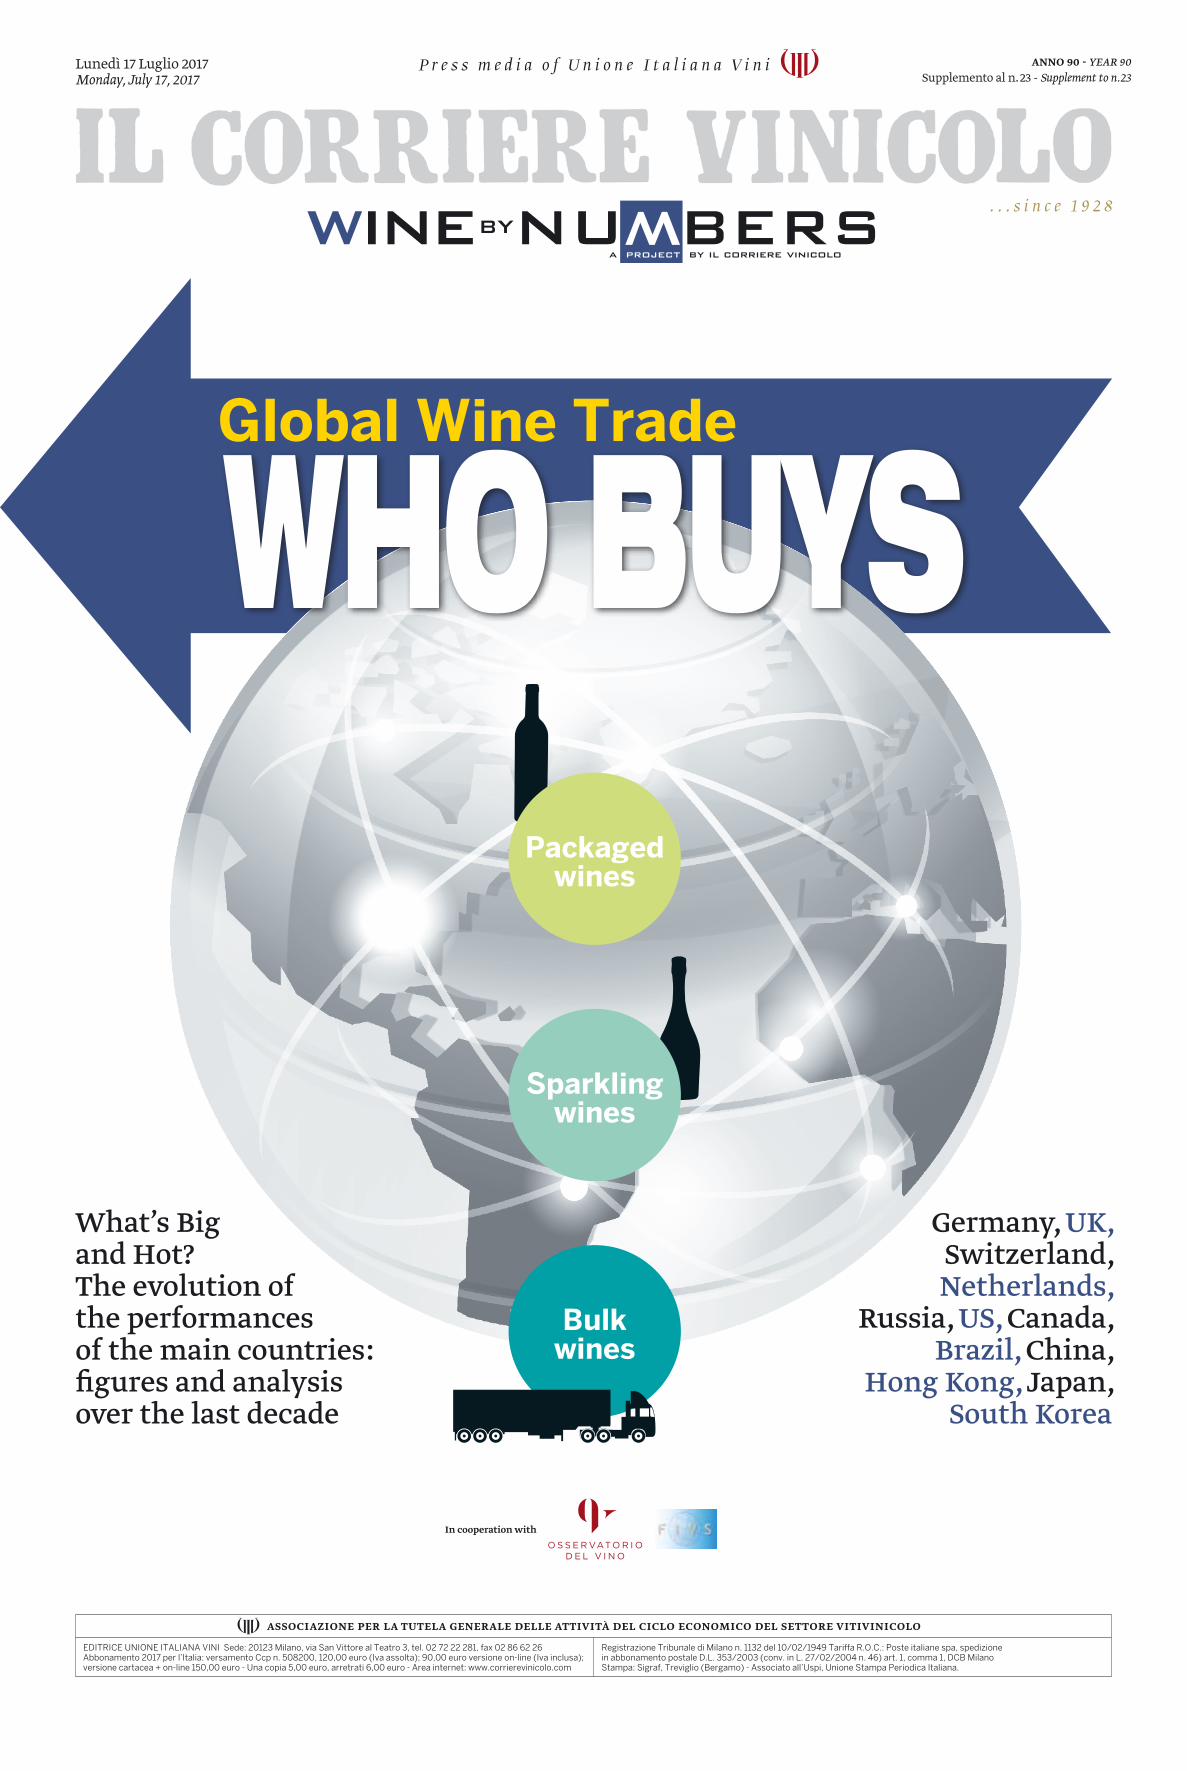
Global Wine Trade
who buys
in cooperation with
What’s Big and Hot? The evolution ofthe performancesof the main countries:figures and analysis over the last decade
Germany, UK, Switzerland, Netherlands,
Russia, US, Canada, Brazil, China,
Hong Kong, Japan, South Korea
Packagedwines
Sparklingwines
Bulkwines
il corriere vinicolo n. 23July 17, 20172
by Mike Veseth, editor, The Wine Economist
What’sBig and Hotin the Global Wine Markets
win
e co
nsum
ptio
ne a
nd t
rade
2017 forecasts
2004 2005 2006 2007 2008 2009 2010 2011 2012 2013 2014 2015 2016
2004 2005 2006 2007 2008 2009 2010 2011 2012 2013 2014 2015 2016
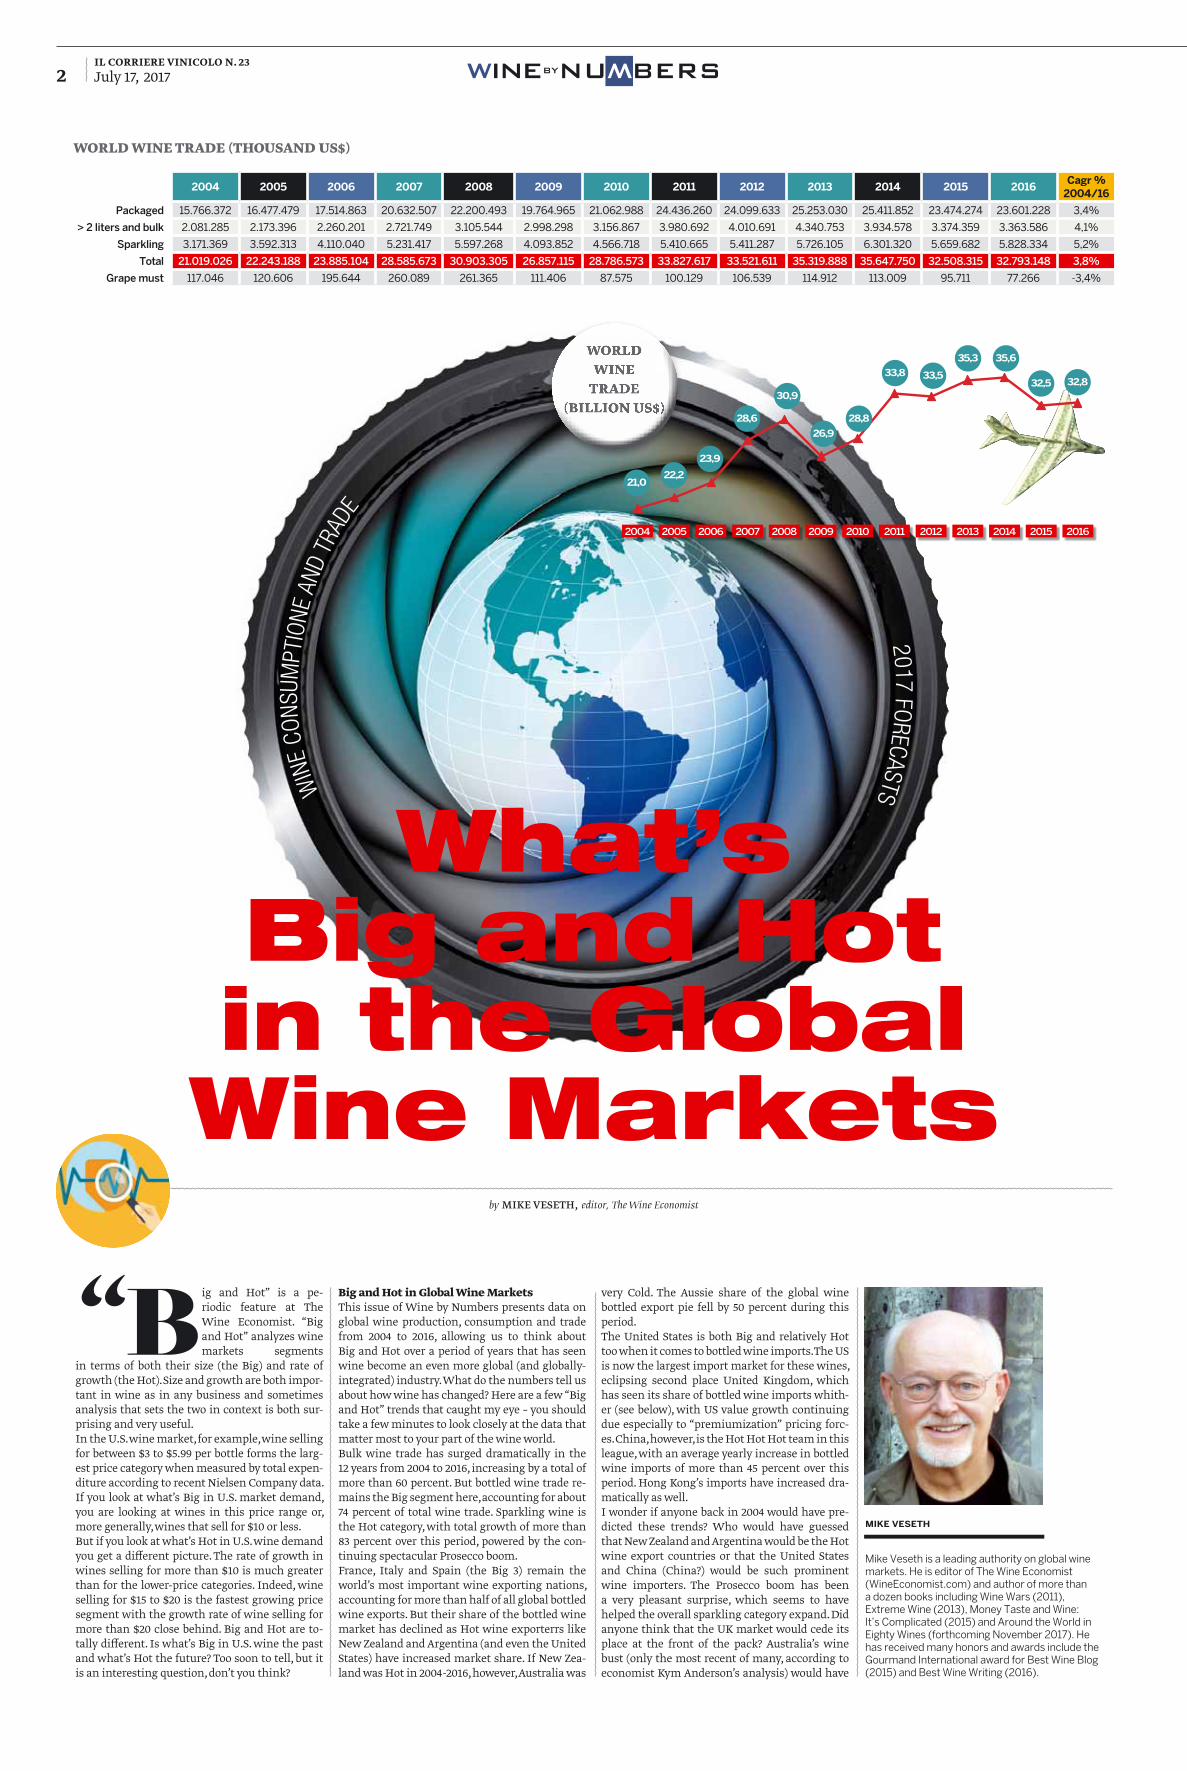
World wine trade (billion US$)
21,022,2
30,9
33,832,5 32,8
35,635,3
33,5
28,6 28,8
26,9
23,9
world wine
trade(billion US$)
world wine trade (thousand us$)
2004 2005 2006 2007 2008 2009 2010 2011 2012 2013 2014 2015 2016Cagr %
2004/16
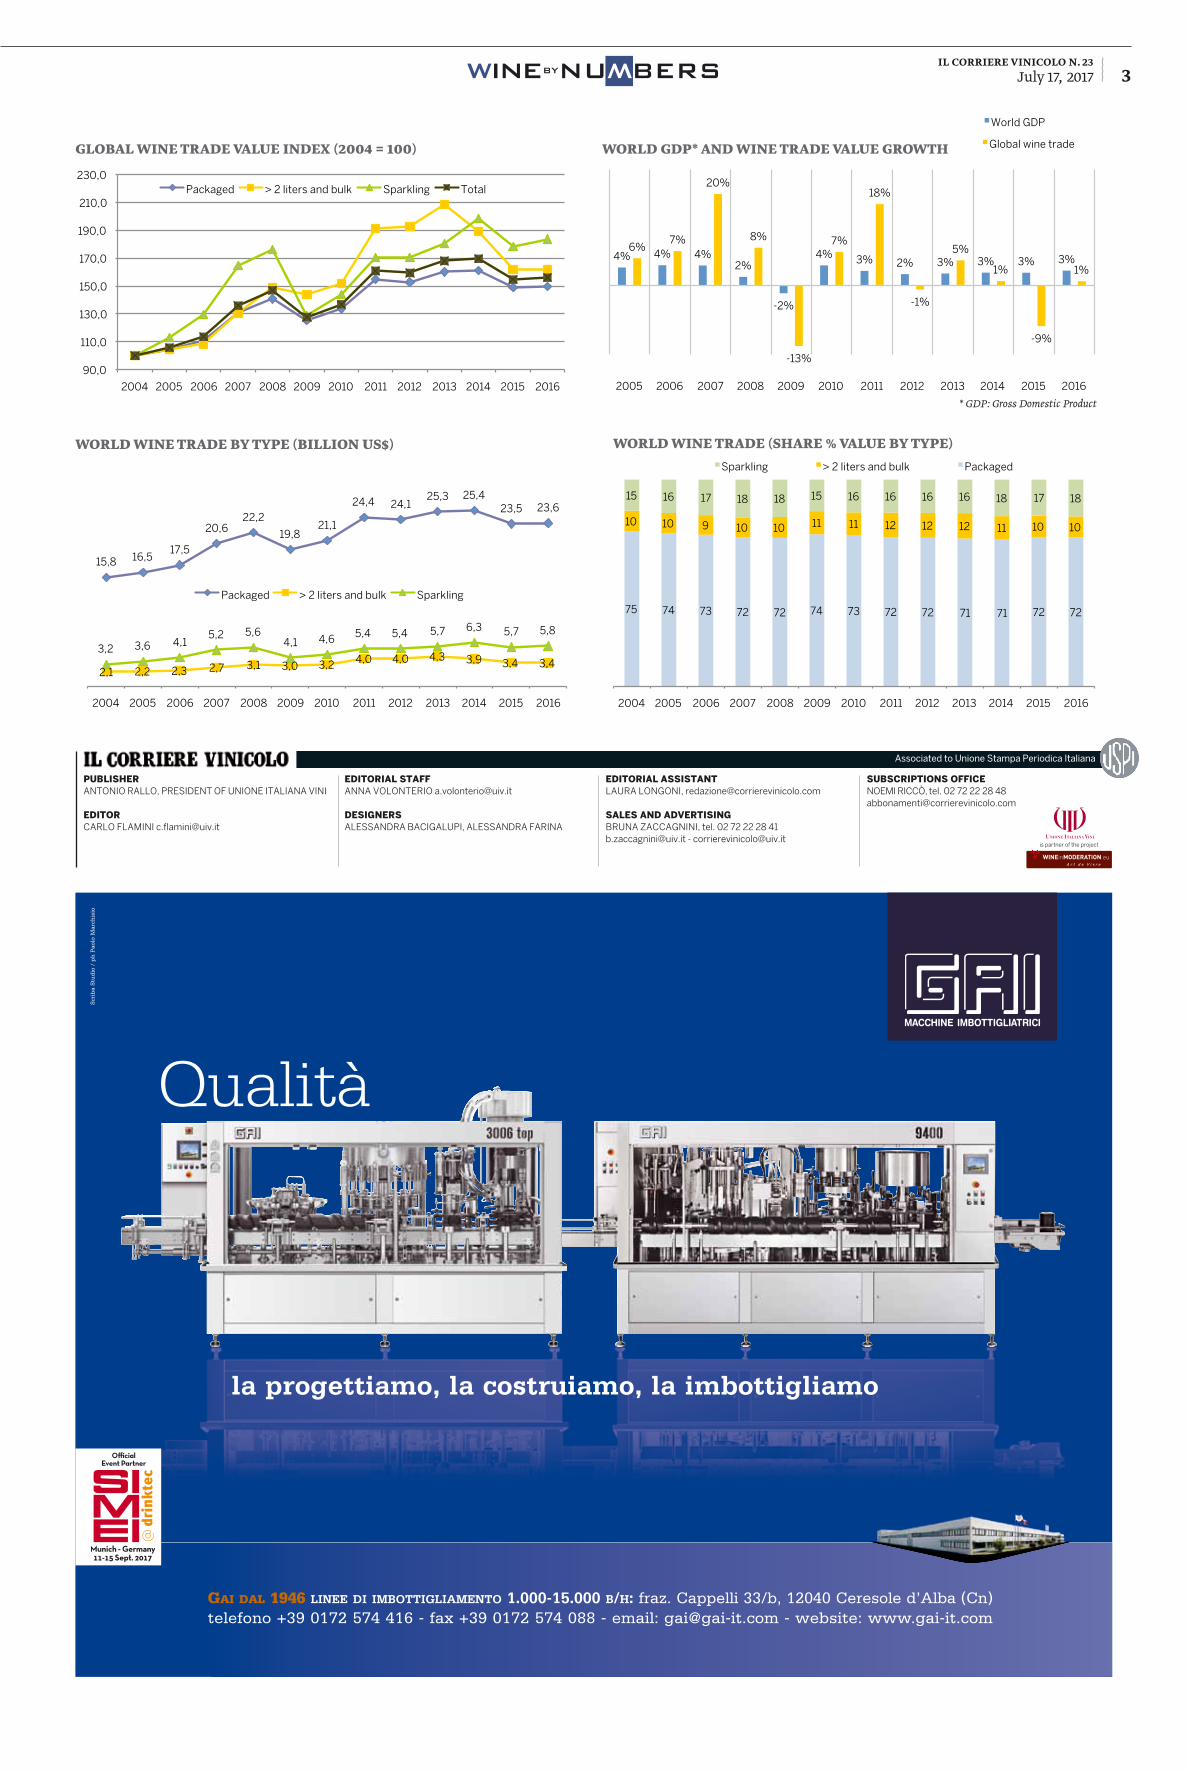
Packaged 15.766.372 16.477.479 17.514.863 20.632.507 22.200.493 19.764.965 21.062.988 24.436.260 24.099.633 25.253.030 25.411.852 23.474.274 23.601.228 3,4%
> 2 liters and bulk 2.081.285 2.173.396 2.260.201 2.721.749 3.105.544 2.998.298 3.156.867 3.980.692 4.010.691 4.340.753 3.934.578 3.374.359 3.363.586 4,1%
Sparkling 3.171.369 3.592.313 4.110.040 5.231.417 5.597.268 4.093.852 4.566.718 5.410.665 5.411.287 5.726.105 6.301.320 5.659.682 5.828.334 5,2%
Total 21.019.026 22.243.188 23.885.104 28.585.673 30.903.305 26.857.115 28.786.573 33.827.617 33.521.611 35.319.888 35.647.750 32.508.315 32.793.148 3,8%
Grape must 117.046 120.606 195.644 260.089 261.365 111.406 87.575 100.129 106.539 114.912 113.009 95.711 77.266 -3,4%
“B ig and Hot” is a pe-riodic feature at The Wine Economist. “Big and Hot” analyzes wine markets segments
in terms of both their size (the Big) and rate of growth (the Hot). Size and growth are both impor-tant in wine as in any business and sometimes analysis that sets the two in context is both sur-prising and very useful.In the U.S. wine market, for example, wine selling for between $3 to $5.99 per bottle forms the larg-est price category when measured by total expen-diture according to recent Nielsen Company data. If you look at what’s Big in U.S. market demand, you are looking at wines in this price range or, more generally, wines that sell for $10 or less.But if you look at what’s Hot in U.S. wine demand you get a different picture. The rate of growth in wines selling for more than $10 is much greater than for the lower-price categories. Indeed, wine selling for $15 to $20 is the fastest growing price segment with the growth rate of wine selling for more than $20 close behind. Big and Hot are to-tally different. Is what’s Big in U.S. wine the past and what’s Hot the future? Too soon to tell, but it is an interesting question, don’t you think?
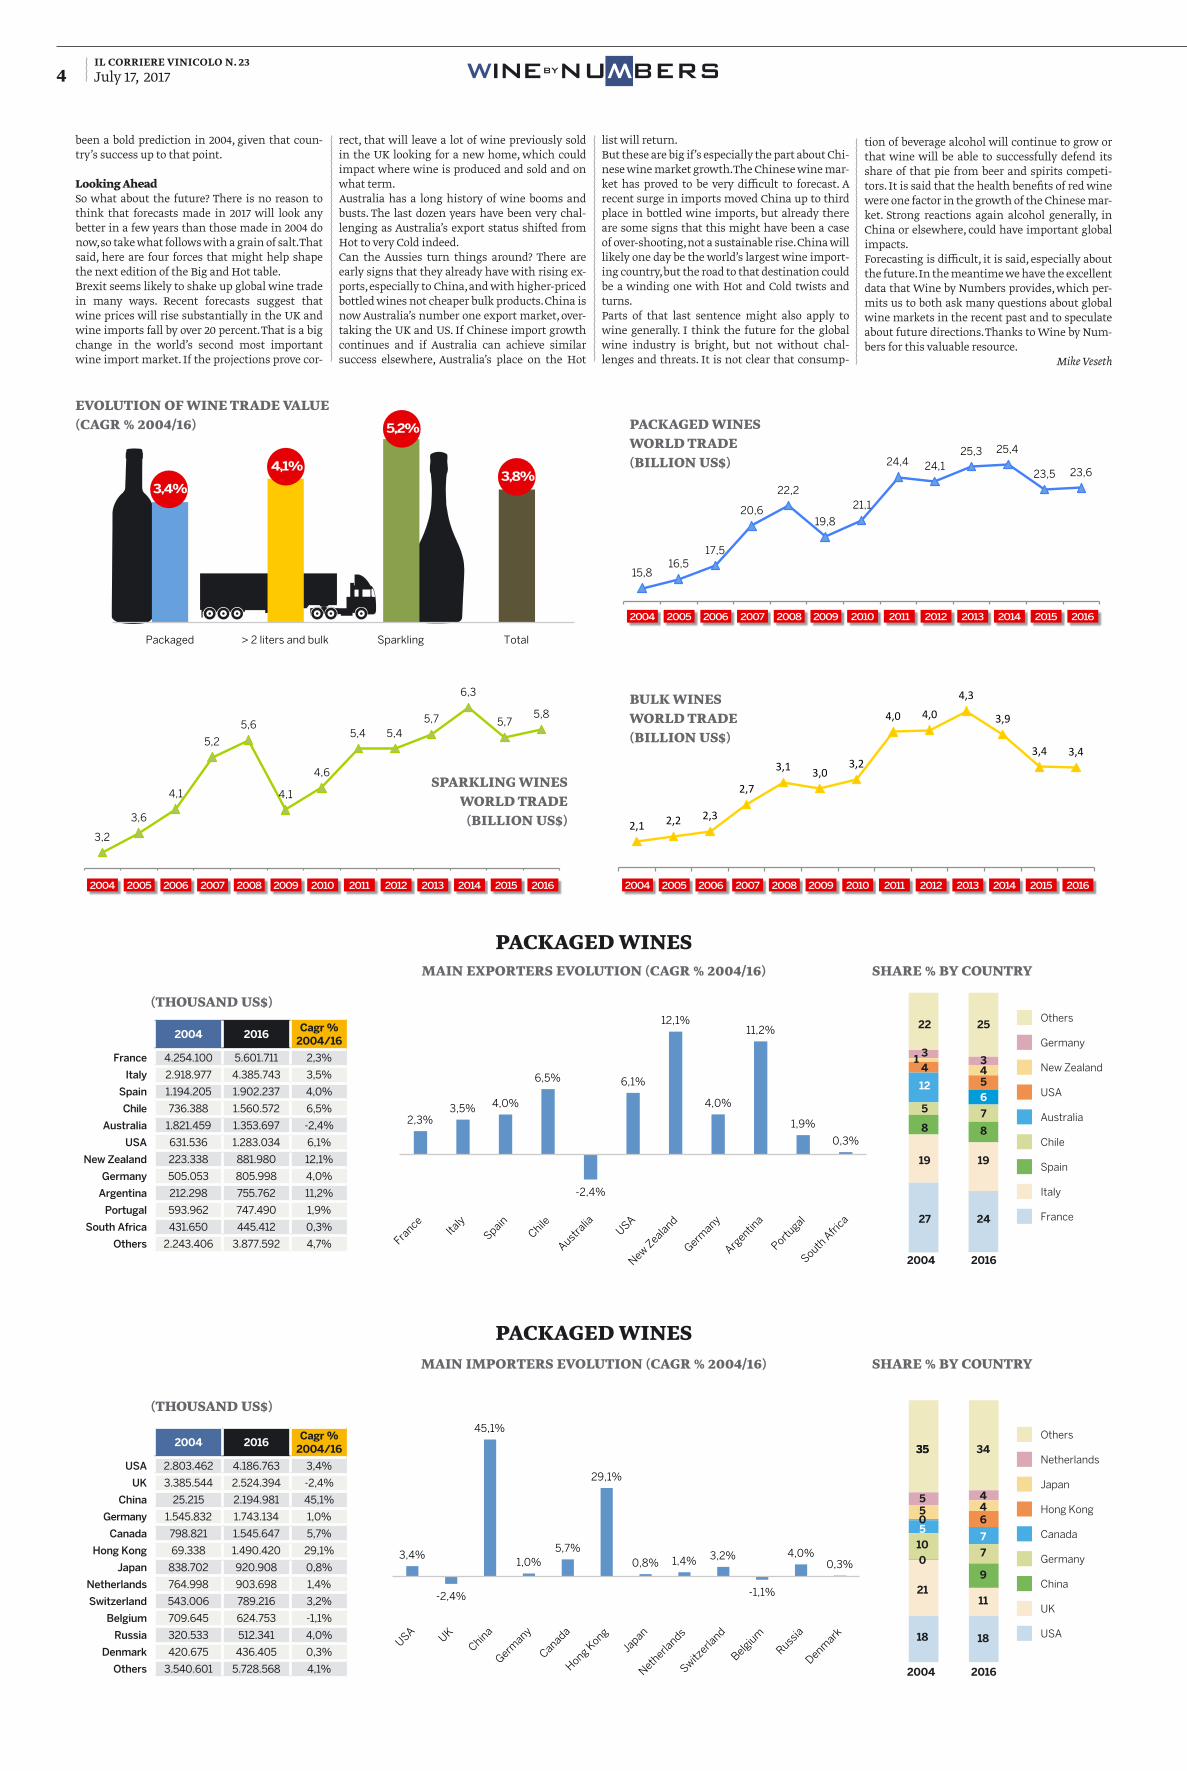
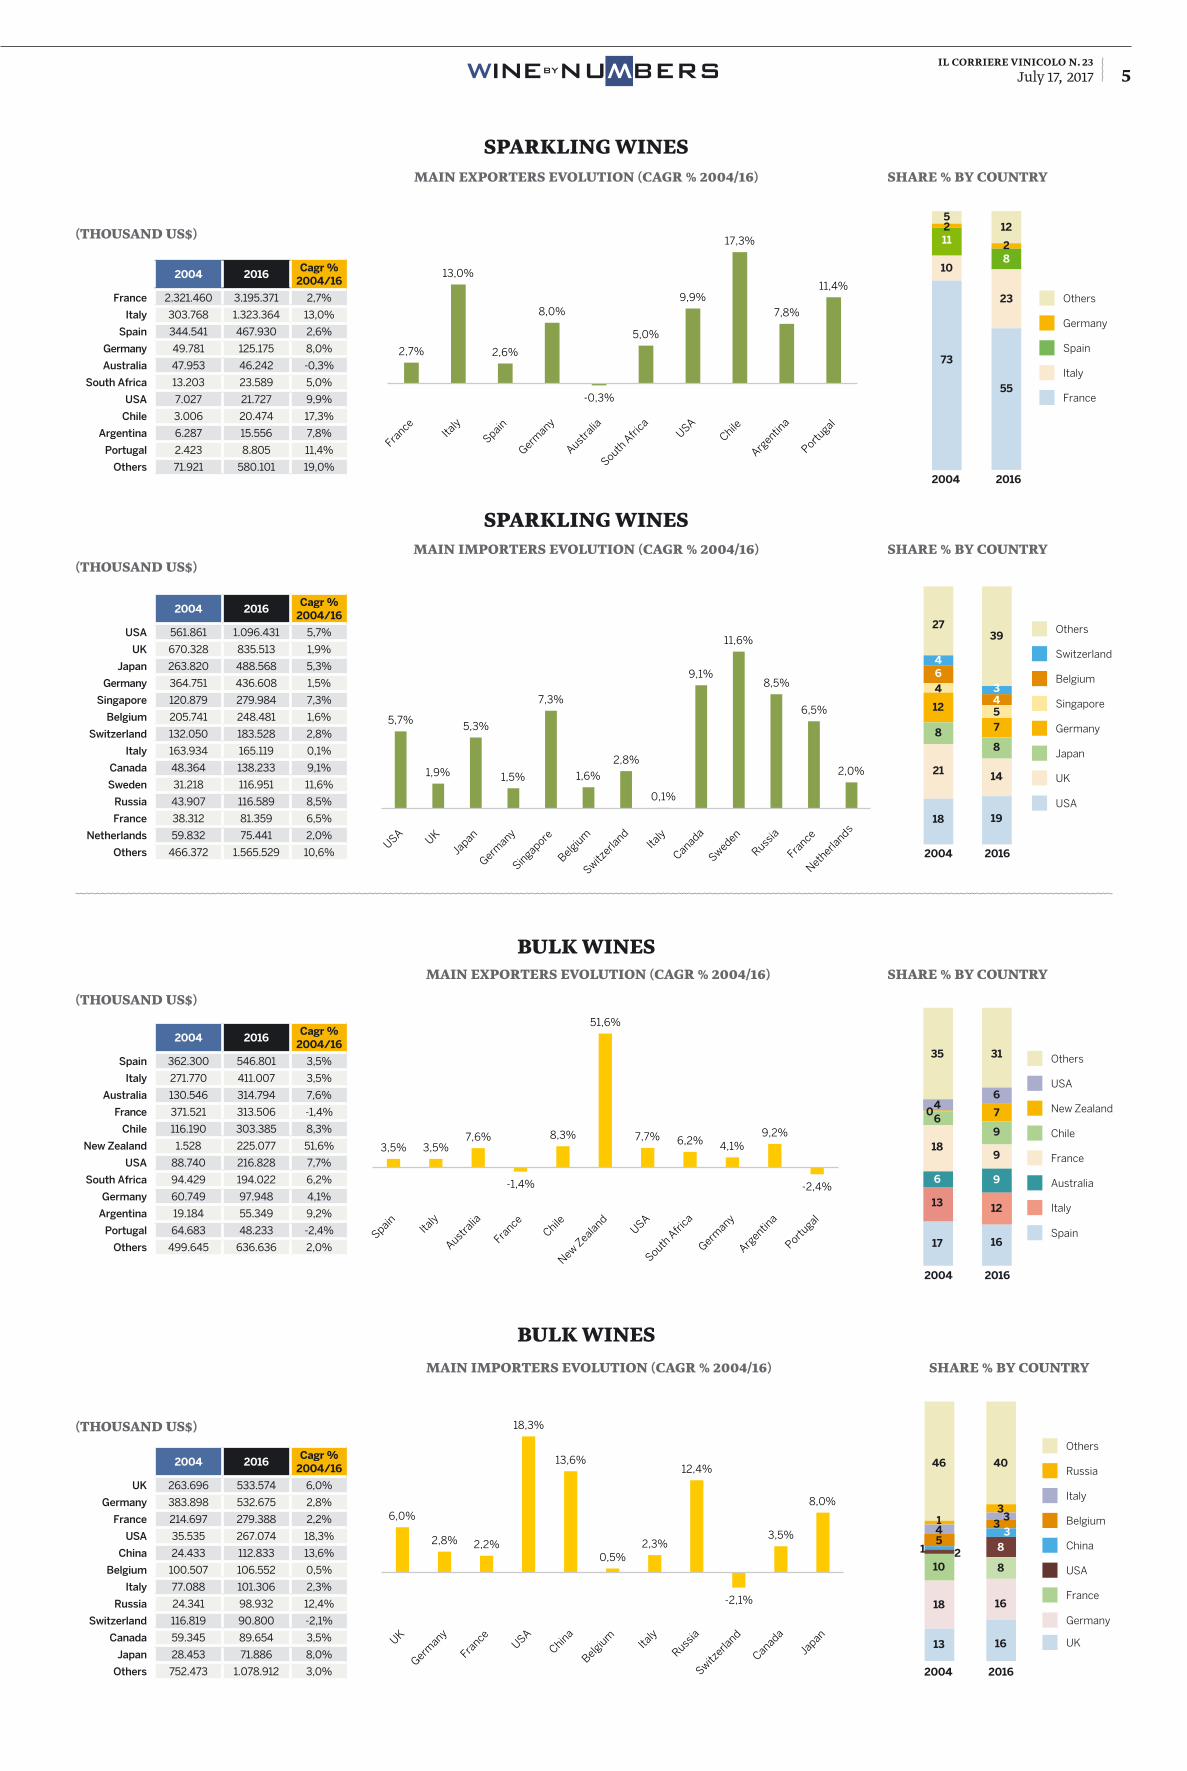
Big and Hot in Global Wine MarketsThis issue of Wine by Numbers presents data on global wine production, consumption and trade from 2004 to 2016, allowing us to think about Big and Hot over a period of years that has seen wine become an even more global (and globally-integrated) industry. What do the numbers tell us about how wine has changed? Here are a few “Big and Hot” trends that caught my eye – you should take a few minutes to look closely at the data that matter most to your part of the wine world.Bulk wine trade has surged dramatically in the 12 years from 2004 to 2016, increasing by a total of more than 60 percent. But bottled wine trade re-mains the Big segment here, accounting for about 74 percent of total wine trade. Sparkling wine is the Hot category, with total growth of more than 83 percent over this period, powered by the con-tinuing spectacular Prosecco boom.France, Italy and Spain (the Big 3) remain the world’s most important wine exporting nations, accounting for more than half of all global bottled wine exports. But their share of the bottled wine market has declined as Hot wine exporterrs like New Zealand and Argentina (and even the United States) have increased market share. If New Zea-land was Hot in 2004-2016, however, Australia was
very Cold. The Aussie share of the global wine bottled export pie fell by 50 percent during this period.The United States is both Big and relatively Hot too when it comes to bottled wine imports. The US is now the largest import market for these wines, eclipsing second place United Kingdom, which has seen its share of bottled wine imports whith-er (see below), with US value growth continuing due especially to “premiumization” pricing forc-es. China, however, is the Hot Hot Hot team in this league, with an average yearly increase in bottled wine imports of more than 45 percent over this period. Hong Kong’s imports have increased dra-matically as well. I wonder if anyone back in 2004 would have pre-dicted these trends? Who would have guessed that New Zealand and Argentina would be the Hot wine export countries or that the United States and China (China?) would be such prominent wine importers. The Prosecco boom has been a very pleasant surprise, which seems to have helped the overall sparkling category expand. Did anyone think that the UK market would cede its place at the front of the pack? Australia’s wine bust (only the most recent of many, according to economist Kym Anderson’s analysis) would have
Mike Veseth is a leading authority on global wine markets. He is editor of The Wine Economist (WineEconomist.com) and author of more than a dozen books including Wine Wars (2011), Extreme Wine (2013), Money Taste and Wine: It’s Complicated (2015) and Around the World in Eighty Wines (forthcoming November 2017). He has received many honors and awards include the Gourmand International award for Best Wine Blog (2015) and Best Wine Writing (2016).
mike veseth
BYNUWBERSWINE
W
il corriere vinicolo n. 23July 17, 2017 3
world wine trade by type (billion us$) world wine trade (share % value by type)
15,8 16,5 17,5
20,6 22,2
19,8 21,1
24,4 24,1 25,3 25,4
23,5 23,6
2,1 2,2 2,3 2,7 3,1 3,0 3,2 4,0 4,0 4,3 3,9 3,4 3,4 3,2 3,6 4,1
5,2 5,6 4,1 4,6 5,4 5,4 5,7 6,3 5,7 5,8
2004 2005 2006 2007 2008 2009 2010 2011 2012 2013 2014 2015 2016
World wine trade by type (billion US$)
Packaged > 2 liters and bulk Sparkling
15,8 16,5 17,5
20,6 22,2
19,8 21,1
24,4 24,1 25,3 25,4
23,5 23,6
2,1 2,2 2,3 2,7 3,1 3,0 3,2 4,0 4,0 4,3 3,9 3,4 3,4 3,2 3,6 4,1
5,2 5,6 4,1 4,6 5,4 5,4 5,7 6,3 5,7 5,8
2004 2005 2006 2007 2008 2009 2010 2011 2012 2013 2014 2015 2016
World wine trade by type (billion US$)
Packaged > 2 liters and bulk Sparkling 75 74 73 72 72 74 73 72 72 71 71 72 72
10 10 9 10 10 11 11 12 12 12 11 10 10
15 16 17 18 18 15 16 16 16 16 18 17 18
2004 2005 2006 2007 2008 2009 2010 2011 2012 2013 2014 2015 2016
World wine trade (share % by type)
Sparkling > 2 liters and bulk Packaged
75 74 73 72 72 74 73 72 72 71 71 72 72
10 10 9 10 10 11 11 12 12 12 11 10 10
15 16 17 18 18 15 16 16 16 16 18 17 18
2004 2005 2006 2007 2008 2009 2010 2011 2012 2013 2014 2015 2016
World wine trade (share % by type)
Sparkling > 2 liters and bulk Packaged
GAI DAL 1946 LINEE DI IMBOTTIGLIAMENTO 1.000-15.000 B/H: fraz. Cappelli 33/b, 12040 Ceresole d’Alba (Cn)telefono +39 0172 574 416 - fax +39 0172 574 088 - email: [email protected] - website: www.gai-it.com
Scri
ba
Stu
dio
/p
hP
aolo
Mar
chis
io
MACCHINE IMBOTTIGLIATRICI
Qualità
la progettiamo, la costruiamo, la imbottigliamo
CORRIERE VINICOLO 275x208 [2017] 1/2 pag.:Layout 1 19-01-2017 16:51 Pagina 1
global wine trade value index (2004 = 100)
90,0
110,0
130,0
150,0
170,0
190,0
210,0
230,0
2004 2005 2006 2007 2008 2009 2010 2011 2012 2013 2014 2015 2016
Wine trade value global index (2004=100)
Packaged > 2 liters and bulk Sparkling Total
90,0
110,0
130,0
150,0
170,0
190,0
210,0
230,0
2004 2005 2006 2007 2008 2009 2010 2011 2012 2013 2014 2015 2016
Wine trade value global index (2004=100)
Packaged > 2 liters and bulk Sparkling Total
4% 4% 4% 2%
-2%
4% 3% 2% 3% 3% 3% 3% 6%
7%
20%
8%
-13%
7%
18%
-1%
5%
1%
-9%
1%
2005 2006 2007 2008 2009 2010 2011 2012 2013 2014 2015 2016
World GDP and wine trade value growth
World GDP Global wine trade value
4% 4% 4% 2%
-2%
4% 3% 2% 3% 3% 3% 3% 6%
7%
20%
8%
-13%
7%
18%
-1%
5%
1%
-9%
1%
2005 2006 2007 2008 2009 2010 2011 2012 2013 2014 2015 2016
World GDP and wine trade value growth
World GDP Global wine trade value
4% 4% 4% 2%
-2%
4% 3% 2% 3% 3% 3% 3% 6%
7%
20%
8%
-13%
7%
18%
-1%
5%
1%
-9%
1%
2005 2006 2007 2008 2009 2010 2011 2012 2013 2014 2015 2016
World GDP and wine trade value growth
World GDP Global wine trade value world gdp* and wine trade value growth
PublisherANTONIO RALLO, pREsIdENT Of UNIONE ITALIANA VINI
editorCARLO fLAMINI [email protected]
editorial staff ANNA VOLONTERIO [email protected]
designersALEssANdRA BACIGALUpI, ALEssANdRA fARINA
editorial assistantLAURA LONGONI, [email protected]
sales and advertisingBRUNA ZACCAGNINI, tel. 02 72 22 28 41 [email protected] - [email protected]
subscriPtions officeNOEMI RICCò, tel. 02 72 22 28 [email protected]
Associated to Unione Stampa Periodica Italiana
is partner of the project
BYNUWBERSWINE
W
* GDP: Gross Domestic Product
il corriere vinicolo n. 23July 17, 20174
packaged wines world trade(billion us$)
Ẃ ̃3,4%
4,1%
5,2%
3,8%
Packaged > 2 liters and bulk Sparkling Total
Evolution of wine trade value (Cagr 2004/16)
3,4%
4,1%
5,2%
3,8%
been a bold prediction in 2004, given that coun-try’s success up to that point.
Looking AheadSo what about the future? There is no reason to think that forecasts made in 2017 will look any better in a few years than those made in 2004 do now, so take what follows with a grain of salt. That said, here are four forces that might help shape the next edition of the Big and Hot table.Brexit seems likely to shake up global wine trade in many ways. Recent forecasts suggest that wine prices will rise substantially in the UK and wine imports fall by over 20 percent. That is a big change in the world’s second most important wine import market. If the projections prove cor-
rect, that will leave a lot of wine previously sold in the UK looking for a new home, which could impact where wine is produced and sold and on what term. Australia has a long history of wine booms and busts. The last dozen years have been very chal-lenging as Australia’s export status shifted from Hot to very Cold indeed. Can the Aussies turn things around? There are early signs that they already have with rising ex-ports, especially to China, and with higher-priced bottled wines not cheaper bulk products. China is now Australia’s number one export market, over-taking the UK and US. If Chinese import growth continues and if Australia can achieve similar success elsewhere, Australia’s place on the Hot
list will return.But these are big if’s especially the part about Chi-nese wine market growth. The Chinese wine mar-ket has proved to be very difficult to forecast. A recent surge in imports moved China up to third place in bottled wine imports, but already there are some signs that this might have been a case of over-shooting, not a sustainable rise. China will likely one day be the world’s largest wine import-ing country, but the road to that destination could be a winding one with Hot and Cold twists and turns.Parts of that last sentence might also apply to wine generally. I think the future for the global wine industry is bright, but not without chal-lenges and threats. It is not clear that consump-
tion of beverage alcohol will continue to grow or that wine will be able to successfully defend its share of that pie from beer and spirits competi-tors. It is said that the health benefits of red wine were one factor in the growth of the Chinese mar-ket. Strong reactions again alcohol generally, in China or elsewhere, could have important global impacts.Forecasting is difficult, it is said, especially about the future. In the meantime we have the excellent data that Wine by Numbers provides, which per-mits us to both ask many questions about global wine markets in the recent past and to speculate about future directions. Thanks to Wine by Num-bers for this valuable resource.
Mike Veseth
Main exporters evolution (cagr % 2004/16) share % by country
share % by countryMain iMporters evolution (cagr % 2004/16)
(thousand us$)
2004 2016Cagr %
2004/16
France 4.254.100 5.601.711 2,3%
Italy 2.918.977 4.385.743 3,5%
Spain 1.194.205 1.902.237 4,0%
Chile 736.388 1.560.572 6,5%
Australia 1.821.459 1.353.697 -2,4%
USA 631.536 1.283.034 6,1%
New Zealand 223.338 881.980 12,1%
Germany 505.053 805.998 4,0%
Argentina 212.298 755.762 11,2%
Portugal 593.962 747.490 1,9%
South Africa 431.650 445.412 0,3%
Others 2.243.406 3.877.592 4,7%
(thousand us$)
2004 2016Cagr %
2004/16
USA 2.803.462 4.186.763 3,4%
UK 3.385.544 2.524.394 -2,4%
China 25.215 2.194.981 45,1%
Germany 1.545.832 1.743.134 1,0%
Canada 798.821 1.545.647 5,7%
Hong Kong 69.338 1.490.420 29,1%
Japan 838.702 920.908 0,8%
Netherlands 764.998 903.698 1,4%
Switzerland 543.006 789.216 3,2%
Belgium 709.645 624.753 -1,1%
Russia 320.533 512.341 4,0%
Denmark 420.675 436.405 0,3%
Others 3.540.601 5.728.568 4,1%
2,3% 3,5% 4,0%
6,5%
-2,4%
6,1%
12,1%
4,0%
11,2%
1,9%
0,3%
France
Italy
Spain
Chile
Australia
USA
New Zealand
Germany
Argentin
a
Portugal
South A
frica
Main exporters evolution (Cagr % 2004/16)
3,4%
-2,4%
45,1%
1,0% 5,7%
29,1%
0,8% 1,4% 3,2%
-1,1%
4,0% 0,3%
USA UK
China
Germany
Canada
Hong Kong
Japan
Netherla
nds
Switzerla
nd
Belgium
Russia
Denmark
Main exporters evolution (Cagr % 2004/16)
2004 2016
22
34
12
5
8
19
27
1
25
3456
7
8
19
24
Others
Germany
New Zealand
UsA
Australia
Chile
spain
Italy
france
packaged wines
packaged wines
2004 2016
Others
Netherlands
Japan
Hong Kong
Canada
Germany
China
UK
UsA
3535
55
50
0
10
21
18
34
446
7
7
9
11
18
15,8 16,5
17,5
20,6
22,2
19,8
21,1
24,4 24,1 25,3 25,4
23,5 23,6
2004 2005 2006 2007 2008 2009 2010 2011 2012 2013 2014 2015 2016
Packaged wines world trade (billion US$)
15,8 16,5
17,5
20,6
22,2
19,8
21,1
24,4 24,1 25,3 25,4
23,5 23,6
2004 2005 2006 2007 2008 2009 2010 2011 2012 2013 2014 2015 2016
Packaged wines world trade (billion US$)
2004 2005 2006 2007 2008 2009 2010 2011 2012 2013 2014 2015 2016
2,1 2,2
2,3
2,7
3,1 3,0
3,2
4,0 4,0
4,3
3,9
3,4 3,4
2004 2005 2006 2007 2008 2009 2010 2011 2012 2013 2014 2015 2016
Bulk wines world trade (billion US$)
2,1 2,2
2,3
2,7
3,1 3,0
3,2
4,0 4,0
4,3
3,9
3,4 3,4
2004 2005 2006 2007 2008 2009 2010 2011 2012 2013 2014 2015 2016
Bulk wines world trade (billion US$)
3,2
3,6
4,1
5,2
5,6
4,1
4,6
5,4 5,4 5,7
6,3
5,7 5,8
2004 2005 2006 2007 2008 2009 2010 2011 2012 2013 2014 2015 2016
Sparkling wines world trade (billion US$)
3,2
3,6
4,1
5,2
5,6
4,1
4,6
5,4 5,4 5,7
6,3
5,7 5,8
2004 2005 2006 2007 2008 2009 2010 2011 2012 2013 2014 2015 2016
Sparkling wines world trade (billion US$)
2004 2005 2006 2007 2008 2009 2010 2011 2012 2013 2014 2015 2016 2004 2005 2006 2007 2008 2009 2010 2011 2012 2013 2014 2015 2016
sparkling wines world trade
(billion us$)
bulk wines world trade(billion us$)
BYNUWBERSWINE
W
evolution of wine trade value (cagr % 2004/16)
il corriere vinicolo n. 23July 17, 2017 5
2004 2016
Main exporters evolution (cagr % 2004/16) share % by country
share % by countryMain iMporters evolution (cagr % 2004/16)
(thousand us$)
2004 2016Cagr %
2004/16
France 2.321.460 3.195.371 2,7%
Italy 303.768 1.323.364 13,0%
Spain 344.541 467.930 2,6%
Germany 49.781 125.175 8,0%
Australia 47.953 46.242 -0,3%
South Africa 13.203 23.589 5,0%
USA 7.027 21.727 9,9%
Chile 3.006 20.474 17,3%
Argentina 6.287 15.556 7,8%
Portugal 2.423 8.805 11,4%
Others 71.921 580.101 19,0%
(thousand us$)
2004 2016Cagr %
2004/16
USA 561.861 1.096.431 5,7%
UK 670.328 835.513 1,9%
Japan 263.820 488.568 5,3%
Germany 364.751 436.608 1,5%
Singapore 120.879 279.984 7,3%
Belgium 205.741 248.481 1,6%
Switzerland 132.050 183.528 2,8%
Italy 163.934 165.119 0,1%
Canada 48.364 138.233 9,1%
Sweden 31.218 116.951 11,6%
Russia 43.907 116.589 8,5%
France 38.312 81.359 6,5%
Netherlands 59.832 75.441 2,0%
Others 466.372 1.565.529 10,6%
2,7%
13,0%
2,6%
8,0%
-0,3%
5,0%
9,9%
17,3%
7,8%
11,4%
France
Italy
Spain
Germany
Australia
South A
frica
USA
Chile
Argentin
a
Portugal
Main exporters evolution (Cagr % 2004/16)
5,7%
1,9%
5,3%
1,5%
7,3%
1,6%
2,8%
0,1%
9,1%
11,6%
8,5%
6,5%
2,0%
USA UK
Japan
Germany
Singapore
Belgium
Switzerla
nd Ita
ly
Canada
Sweden
Russia
France
Netherla
nd
s
Main importers evolution (Cagr % 2004/16)
Others
Germany
spain
Italy
france
2004 2016
5211
10
73
12
2
23
55
8
Others
switzerland
Belgium
singapore
Germany
Japan
UK
UsA
Others
UsA
New Zealand
Chile
france
Australia
Italy
spain
2004 2016
27
464
12
8
21
18
39
3457
8
14
19
Main exporters evolution (cagr % 2004/16) share % by country
share % by countryMain iMporters evolution (cagr % 2004/16)
(thousand us$)
2004 2016Cagr %
2004/16
Spain 362.300 546.801 3,5%
Italy 271.770 411.007 3,5%
Australia 130.546 314.794 7,6%
France 371.521 313.506 -1,4%
Chile 116.190 303.385 8,3%
New Zealand 1.528 225.077 51,6%
USA 88.740 216.828 7,7%
South Africa 94.429 194.022 6,2%
Germany 60.749 97.948 4,1%
Argentina 19.184 55.349 9,2%
Portugal 64.683 48.233 -2,4%
Others 499.645 636.636 2,0%
(thousand us$)
2004 2016Cagr %
2004/16
UK 263.696 533.574 6,0%
Germany 383.898 532.675 2,8%
France 214.697 279.388 2,2%
USA 35.535 267.074 18,3%
China 24.433 112.833 13,6%
Belgium 100.507 106.552 0,5%
Italy 77.088 101.306 2,3%
Russia 24.341 98.932 12,4%
Switzerland 116.819 90.800 -2,1%
Canada 59.345 89.654 3,5%
Japan 28.453 71.886 8,0%
Others 752.473 1.078.912 3,0% 2004 2016
Others
Russia
Italy
Belgium
China
UsA
france
Germany
UK
sparkling wines
bulk wines
sparkling wines
bulk wines
3,5% 3,5% 7,6%
-1,4%
8,3%
51,6%
7,7% 6,2% 4,1% 9,2%
-2,4%
Spain
Italy
Australia
France
Chile
New Zealand
USA
South A
frica
Germany
Argentin
a
Portugal
Main exporters evolution (Cagr % 2004/16)
6,0%
2,8% 2,2%
18,3%
13,6%
0,5% 2,3%
12,4%
-2,1%
3,5%
8,0%
UK
Germany
France
USA
China
Belgium
Ita
ly
Russia
Switzerla
nd
Canada
Japan
Main importers evolution (Cagr % 2004/16)
35
46
18
13
17
6
0
31
6
7
9
9
9
12
16
46 40
33
33
8
8
16
16
145
10
18
13
1 2
BYNUWBERSWINE
W
s
il corriere vinicolo n. 23July 17, 2017 6 BYNUWBERSWINE
W
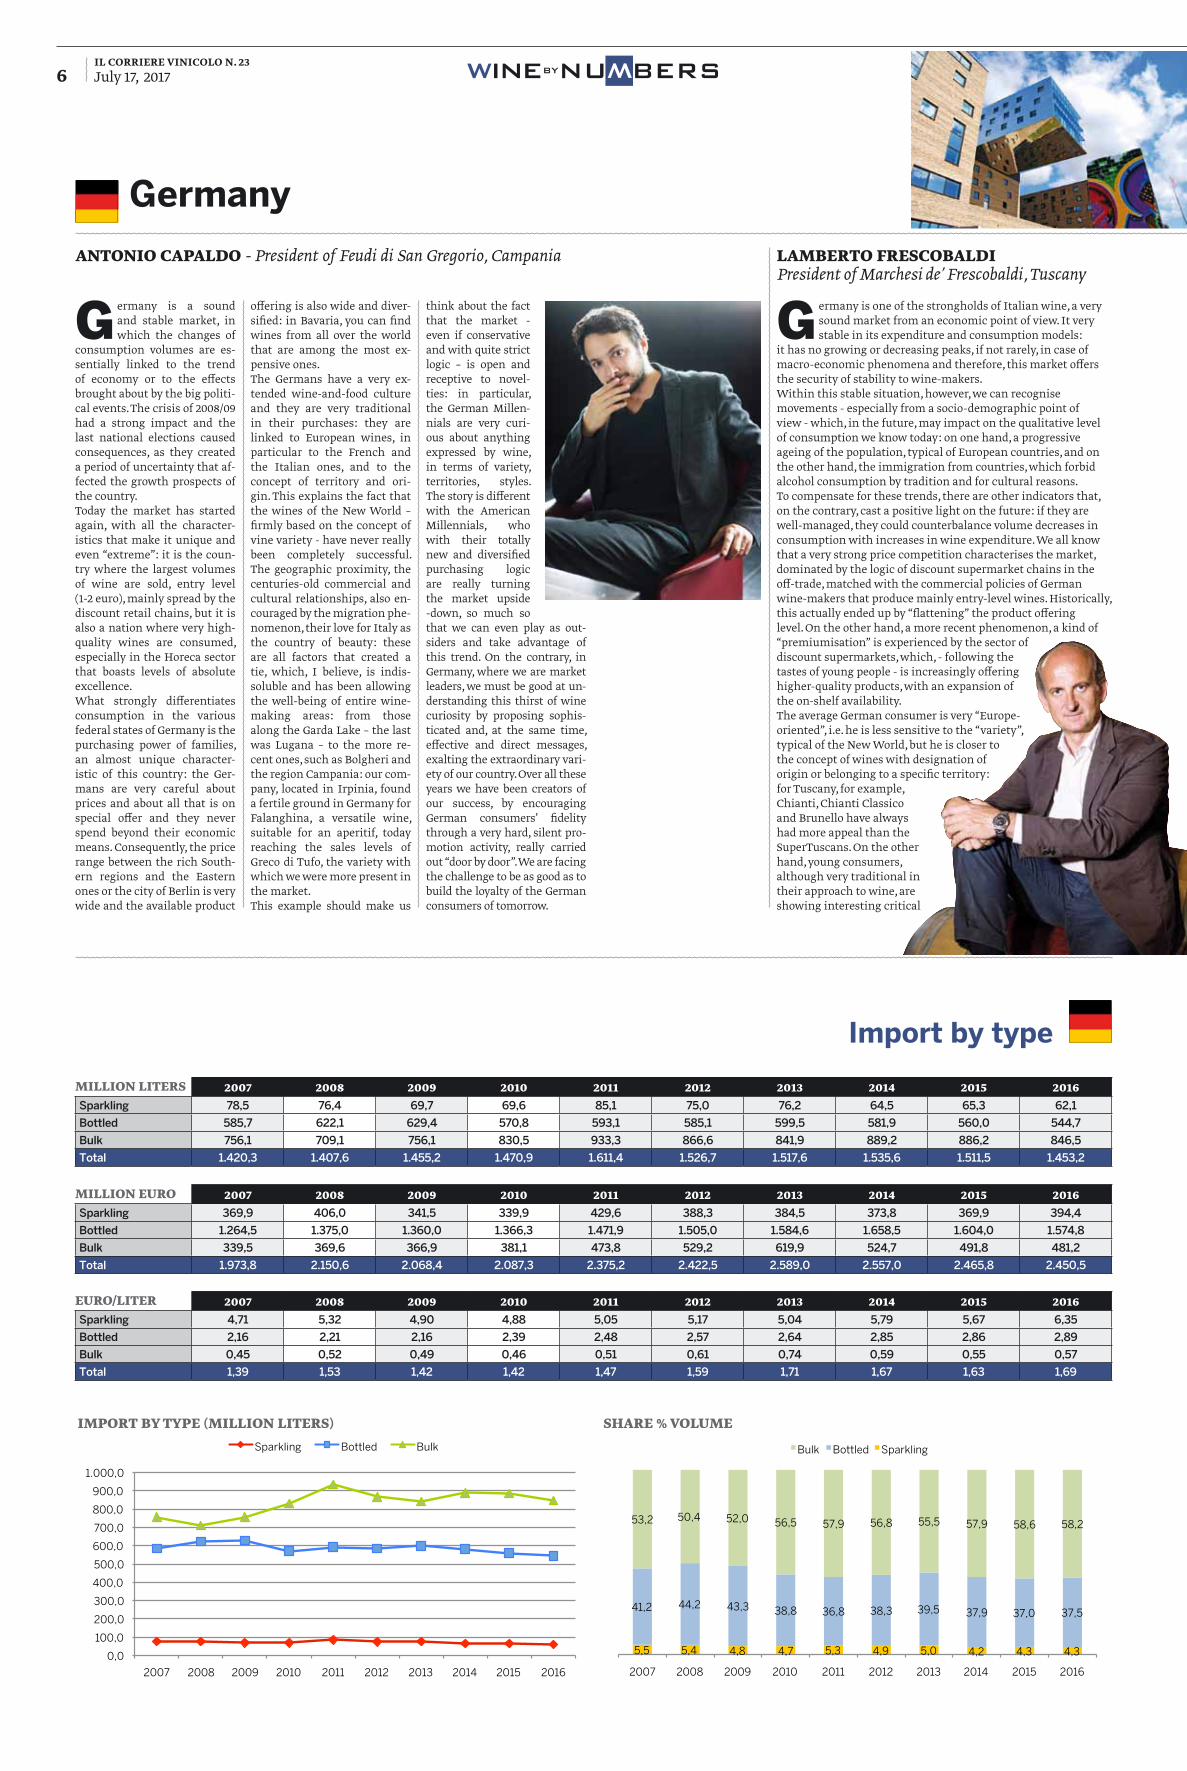
million liters 2007 2008 2009 2010 2011 2012 2013 2014 2015 2016Sparkling 78,5 76,4 69,7 69,6 85,1 75,0 76,2 64,5 65,3 62,1
Bottled 585,7 622,1 629,4 570,8 593,1 585,1 599,5 581,9 560,0 544,7
Bulk 756,1 709,1 756,1 830,5 933,3 866,6 841,9 889,2 886,2 846,5
Total 1.420,3 1.407,6 1.455,2 1.470,9 1.611,4 1.526,7 1.517,6 1.535,6 1.511,5 1.453,2
million eUro 2007 2008 2009 2010 2011 2012 2013 2014 2015 2016Sparkling 369,9 406,0 341,5 339,9 429,6 388,3 384,5 373,8 369,9 394,4
Bottled 1.264,5 1.375,0 1.360,0 1.366,3 1.471,9 1.505,0 1.584,6 1.658,5 1.604,0 1.574,8
Bulk 339,5 369,6 366,9 381,1 473,8 529,2 619,9 524,7 491,8 481,2
Total 1.973,8 2.150,6 2.068,4 2.087,3 2.375,2 2.422,5 2.589,0 2.557,0 2.465,8 2.450,5
eUro/liter 2007 2008 2009 2010 2011 2012 2013 2014 2015 2016Sparkling 4,71 5,32 4,90 4,88 5,05 5,17 5,04 5,79 5,67 6,35
Bottled 2,16 2,21 2,16 2,39 2,48 2,57 2,64 2,85 2,86 2,89
Bulk 0,45 0,52 0,49 0,46 0,51 0,61 0,74 0,59 0,55 0,57
Total 1,39 1,53 1,42 1,42 1,47 1,59 1,71 1,67 1,63 1,69
import by type (million liters)
0,0
100,0
200,0
300,0
400,0
500,0
600,0
700,0
800,0
900,0
1.000,0
2007 2008 2009 2010 2011 2012 2013 2014 2015 2016
Import by type (million liters)
Sparkling Bottled Bulk
share % volUme
5,5 5,4 4,8 4,7 5,3 4,9 5,0 4,2 4,3 4,3
41,2 44,2 43,3 38,8 36,8 38,3 39,5 37,9 37,0 37,5
53,2 50,4 52,0 56,5 57,9 56,8 55,5 57,9 58,6 58,2
2007 2008 2009 2010 2011 2012 2013 2014 2015 2016
Share % volume
Bulk Bottled Sparkling
Germany
Import by type
Germany is a sound and stable market, in which the changes of
consumption volumes are es-sentially linked to the trend of economy or to the effects brought about by the big politi-cal events. The crisis of 2008/09 had a strong impact and the last national elections caused consequences, as they created a period of uncertainty that af-fected the growth prospects of the country.Today the market has started again, with all the character-istics that make it unique and even “extreme”: it is the coun-try where the largest volumes of wine are sold, entry level (1-2 euro), mainly spread by the discount retail chains, but it is also a nation where very high-quality wines are consumed, especially in the Horeca sector that boasts levels of absolute excellence. What strongly differentiates consumption in the various federal states of Germany is the purchasing power of families, an almost unique character-istic of this country: the Ger-mans are very careful about prices and about all that is on special offer and they never spend beyond their economic means. Consequently, the price range between the rich South-ern regions and the Eastern ones or the city of Berlin is very wide and the available product
offering is also wide and diver-sified: in Bavaria, you can find wines from all over the world that are among the most ex-pensive ones. The Germans have a very ex-tended wine-and-food culture and they are very traditional in their purchases: they are linked to European wines, in particular to the French and the Italian ones, and to the concept of territory and ori-gin. This explains the fact that the wines of the New World – firmly based on the concept of vine variety - have never really been completely successful. The geographic proximity, the centuries-old commercial and cultural relationships, also en-couraged by the migration phe-nomenon, their love for Italy as the country of beauty: these are all factors that created a tie, which, I believe, is indis-soluble and has been allowing the well-being of entire wine-making areas: from those along the Garda Lake – the last was Lugana – to the more re-cent ones, such as Bolgheri and the region Campania: our com-pany, located in Irpinia, found a fertile ground in Germany for Falanghina, a versatile wine, suitable for an aperitif, today reaching the sales levels of Greco di Tufo, the variety with which we were more present in the market. This example should make us
Germany is one of the strongholds of Italian wine, a very sound market from an economic point of view. It very stable in its expenditure and consumption models:
it has no growing or decreasing peaks, if not rarely, in case of macro-economic phenomena and therefore, this market offers the security of stability to wine-makers.Within this stable situation, however, we can recognise movements - especially from a socio-demographic point of view - which, in the future, may impact on the qualitative level of consumption we know today: on one hand, a progressive ageing of the population, typical of European countries, and on the other hand, the immigration from countries, which forbid alcohol consumption by tradition and for cultural reasons. To compensate for these trends, there are other indicators that, on the contrary, cast a positive light on the future: if they are well-managed, they could counterbalance volume decreases in consumption with increases in wine expenditure. We all know that a very strong price competition characterises the market, dominated by the logic of discount supermarket chains in the off-trade, matched with the commercial policies of German wine-makers that produce mainly entry-level wines. Historically, this actually ended up by “flattening” the product offering level. On the other hand, a more recent phenomenon, a kind of “premiumisation” is experienced by the sector of discount supermarkets, which, - following the tastes of young people - is increasingly offering higher-quality products, with an expansion of the on-shelf availability.The average German consumer is very “Europe-oriented”, i.e. he is less sensitive to the “variety”, typical of the New World, but he is closer to the concept of wines with designation of origin or belonging to a specific territory: for Tuscany, for example, Chianti, Chianti Classico and Brunello have always had more appeal than the SuperTuscans. On the other hand, young consumers, although very traditional in their approach to wine, are showing interesting critical
antonio Capaldo - President of Feudi di San Gregorio, Campania lamberto FresCobaldi President of Marchesi de’ Frescobaldi, Tuscany
think about the fact that the market - even if conservative and with quite strict logic – is open and receptive to novel-ties: in particular, the German Millen-nials are very curi-ous about anything expressed by wine, in terms of variety, territories, styles. The story is different with the American Millennials, who with their totally new and diversified purchasing logic are really turning the market upside -down, so much so that we can even play as out-siders and take advantage of this trend. On the contrary, in Germany, where we are market leaders, we must be good at un-derstanding this thirst of wine curiosity by proposing sophis-ticated and, at the same time, effective and direct messages, exalting the extraordinary vari-ety of our country. Over all these years we have been creators of our success, by encouraging German consumers’ fidelity through a very hard, silent pro-motion activity, really carried out “door by door”. We are facing the challenge to be as good as to build the loyalty of the German consumers of tomorrow.

il corriere vinicolo n. 23July 17, 2017 7BYNUWBERSWINE
W
import by type (eUro/liter)
0,00
1,00
2,00
3,00
4,00
5,00
6,00
7,00
2007 2008 2009 2010 2011 2012 2013 2014 2015 2016
Import by type (euro/liter)
Sparkling Bottled Bulk
share % valUe
18,7 18,9 16,5 16,3 18,1 16,0 14,9 14,6 15,0 16,1
64,1 63,9 65,8 65,5 62,0 62,1 61,2 64,9 65,1 64,3
17,2 17,2 17,7 18,3 19,9 21,8 23,9 20,5 19,9 19,6
2007 2008 2009 2010 2011 2012 2013 2014 2015 2016
Share % value
Bulk Bottled Sparkling
Imp
ort b
y type
import by type (million eUro)
0,0
200,0
400,0
600,0
800,0
1.000,0
1.200,0
1.400,0
1.600,0
1.800,0
0,0
100,0
200,0
300,0
400,0
500,0
600,0
700,0
2007 2008 2009 2010 2011 2012 2013 2014 2015 2016
Import by type (million euro)
Bottled (right axis) Sparkling Bulk
capacities and evolutionary distinctiveness that need to be properly understood and identified. I think that these two phenomena that are linked to one another - expansion of communication receptiveness by the young people and evolution of the discount supermarket chains towards a logic of traditional large-scale retail trade – may offer interesting opportunities for Italian wine-makers in general and in particular for all those that are operating in the areas with a higher wine-making vocation, such as the hill regions or in difficult zones, which till now, due to averagely higher production costs, have had trouble in penetrating this important market.
DISTRIBUITO IN ESCLUSIVA IN ITALIA DA
www.hts-enologia.com
DISTRIBUITO IN ESCLUSIVA IN ITALIA DA
www.hts-enologia.com
Think Sparkling
THE OBVIOUS CHOICE FOR BEVERAGE FERMENTATION
SafŒnoTM
BC S103É un lievito Saccharomyces bayanus,
a inoculo diretto o reidratabile a freddo selezionato per la produzione di vini tranquilli,
frizzanti e spumanti di pregio. Si distingue per fi nezza aromatica, resistenza ad alcol,
pressione e basse temperature.
Spring’FinerTM
Purissimo estratto proteico da lievito, agente chiarifi cante
allergen free totalmente connaturato al vino.
SpringFermTM
XtremAttivatore di fermentazione autolisato totale
da lievito, ricco in amminoacidi, per l’ottimale nutrizione del lievito e l’aumento della
complessità aromatica.
SpringCellTM
Purissime scorze di lievito ad alto
potere adsorbente. Elevata effi cacia sull’attività funzionale del lievito.
SpringAromTM
Innovativo derivato di lievito ricco in glutatione ad alto potere antiossidante e protettivo degli
aromi e della tonalità.
THE OBVIOUS CHOICE FOR BEVERAGE FERMENTATION
18,7 18,9 16,5 16,3 18,1 16,0 14,9 14,6 15,0 16,1
64,1 63,9 65,8 65,5 62,0 62,1 61,2 64,9 65,1 64,3
17,2 17,2 17,7 18,3 19,9 21,8 23,9 20,5 19,9 19,6
2007 2008 2009 2010 2011 2012 2013 2014 2015 2016
Share % value
Bulk Bottled Sparkling
il corriere vinicolo n. 23July 17, 2017 8 BYNUWBERSWINE
W
Sp
ark
ling
by co
un
try
10,0
15,0
20,0
25,0
30,0
35,0
2007 2008 2009 2010 2011 2012 2013 2014 2015 2016
Sparkling (million liters)
France Italy Spain
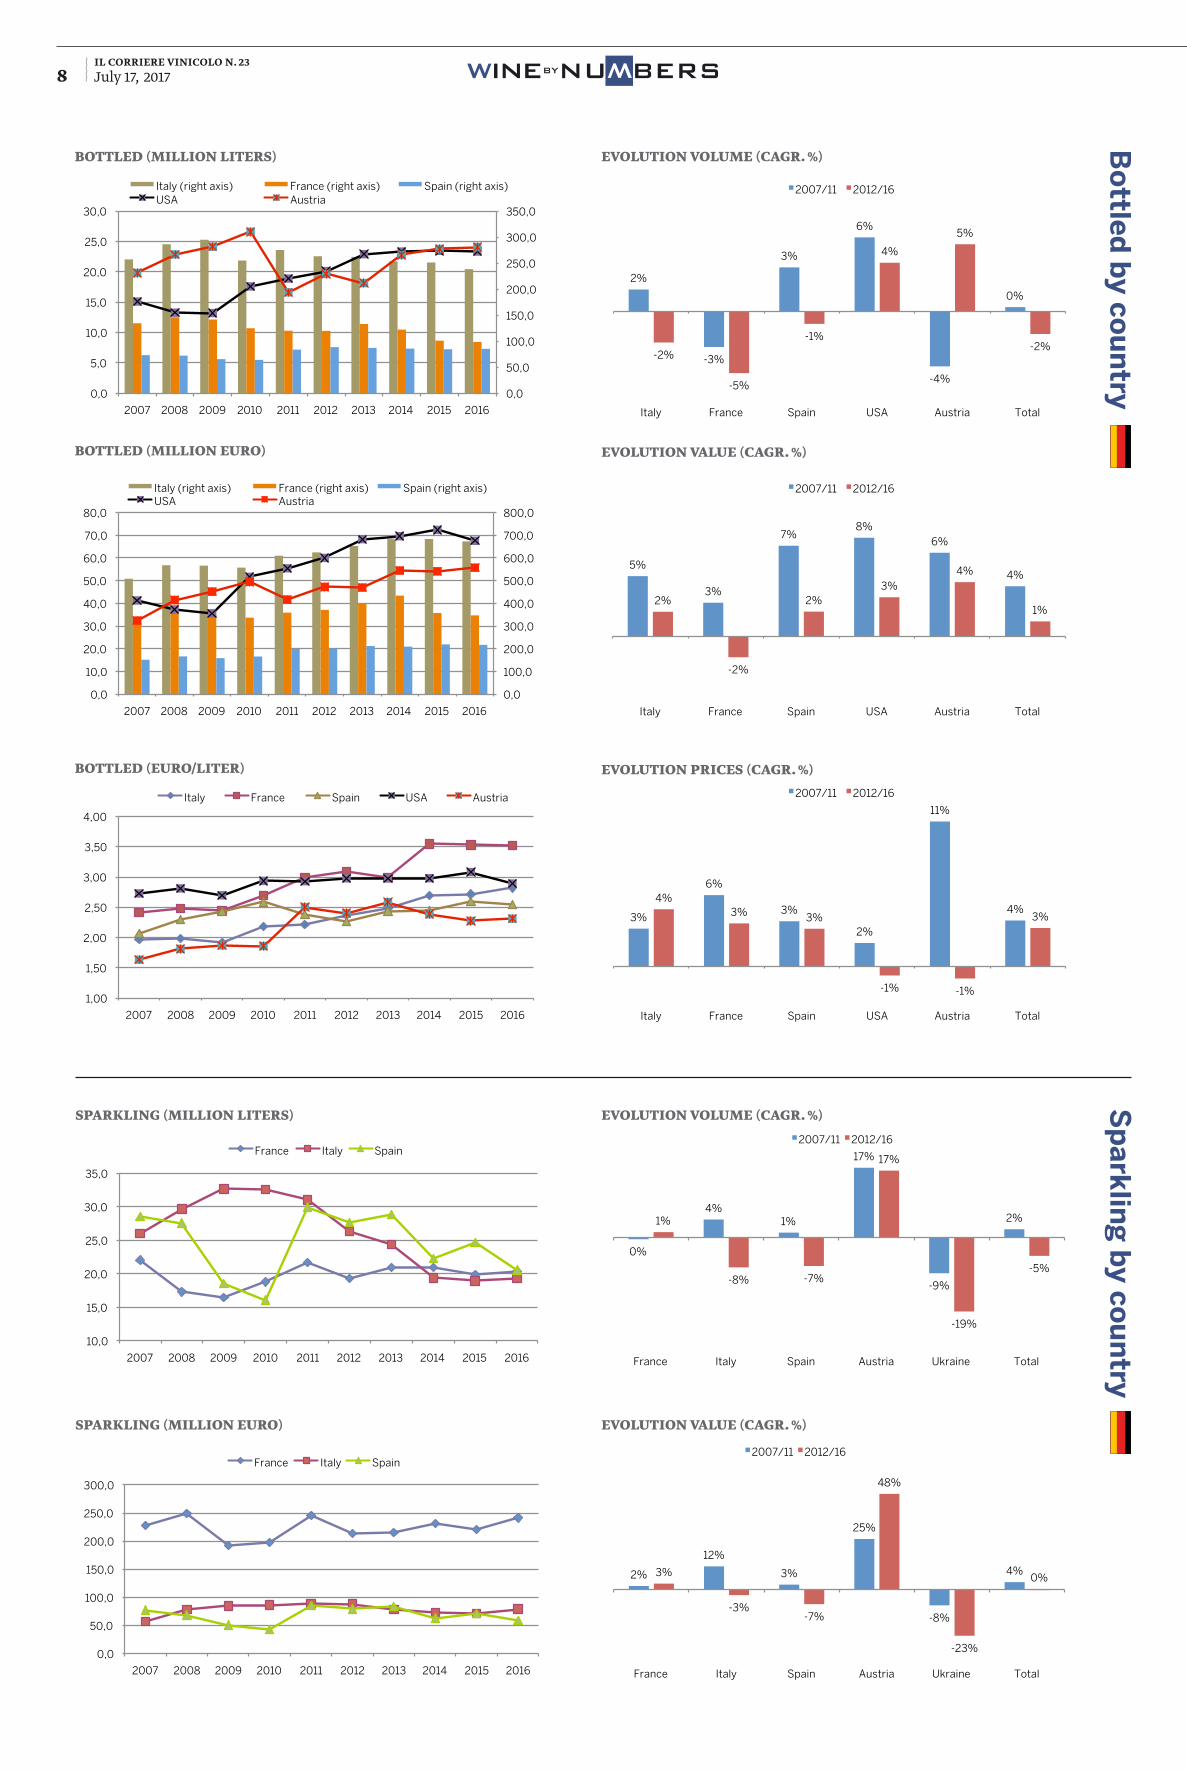
sparkling (million liters) evolUtion volUme (Cagr. %)
sparkling (million eUro) evolUtion valUe (Cagr. %)
0,0
50,0
100,0
150,0
200,0
250,0
300,0
2007 2008 2009 2010 2011 2012 2013 2014 2015 2016
Sparkling (million euro)
France Italy Spain
Bo
ttled
by co
un
try
evolUtion valUe (Cagr. %)
evolUtion priCes (Cagr. %)
bottled (million eUro)
bottled (eUro/liter)
bottled (million liters) evolUtion volUme (Cagr. %)
0,0
50,0
100,0
150,0
200,0
250,0
300,0
350,0
0,0
5,0
10,0
15,0
20,0
25,0
30,0
2007 2008 2009 2010 2011 2012 2013 2014 2015 2016
Bottled (million liters)
Italy (right axis) France (right axis) Spain (right axis) USA Austria
0,0
100,0
200,0
300,0
400,0
500,0
600,0
700,0
800,0
0,0
10,0
20,0
30,0
40,0
50,0
60,0
70,0
80,0
2007 2008 2009 2010 2011 2012 2013 2014 2015 2016
Bottled (million euro)
Italy (right axis) France (right axis) Spain (right axis) USA Austria
1,00
1,50
2,00
2,50
3,00
3,50
4,00
2007 2008 2009 2010 2011 2012 2013 2014 2015 2016
Bottled (euro/liter)
Italy France Spain USA Austria
2%
-3%
3%
6%
-4%
0%
-2%
-5%
-1%
4%
5%
-2%
Italy France Spain USA Austria Total
Evolution volume (Cagr %)
2007/11 2012/16
5%
3%
7% 8%
6%
4%
2%
-2%
2% 3%
4%
1%
Italy France Spain USA Austria Total
Evolution value (Cagr %)
2007/11 2012/16
3%
6%
3%
2%
11%
4% 4%
3% 3%
-1% -1%
3%
Italy France Spain USA Austria Total
Evolution prices (Cagr %)
2007/11 2012/16
0%
4% 1%
17%
-9%
2% 1%
-8% -7%
17%
-19%
-5%
France Italy Spain Austria Ukraine Total
Evolution volume (Cagr %)
2007/11 2012/16
2%
12%
3%
25%
-8%
4% 3%
-3% -7%
48%
-23%
0%
France Italy Spain Austria Ukraine Total
Evolution value (Cagr %)
2007/11 2012/16
il corriere vinicolo n. 23July 17, 2017 9BYNUWBERSWINE
W
Sp
ark
ling
by co
un
try
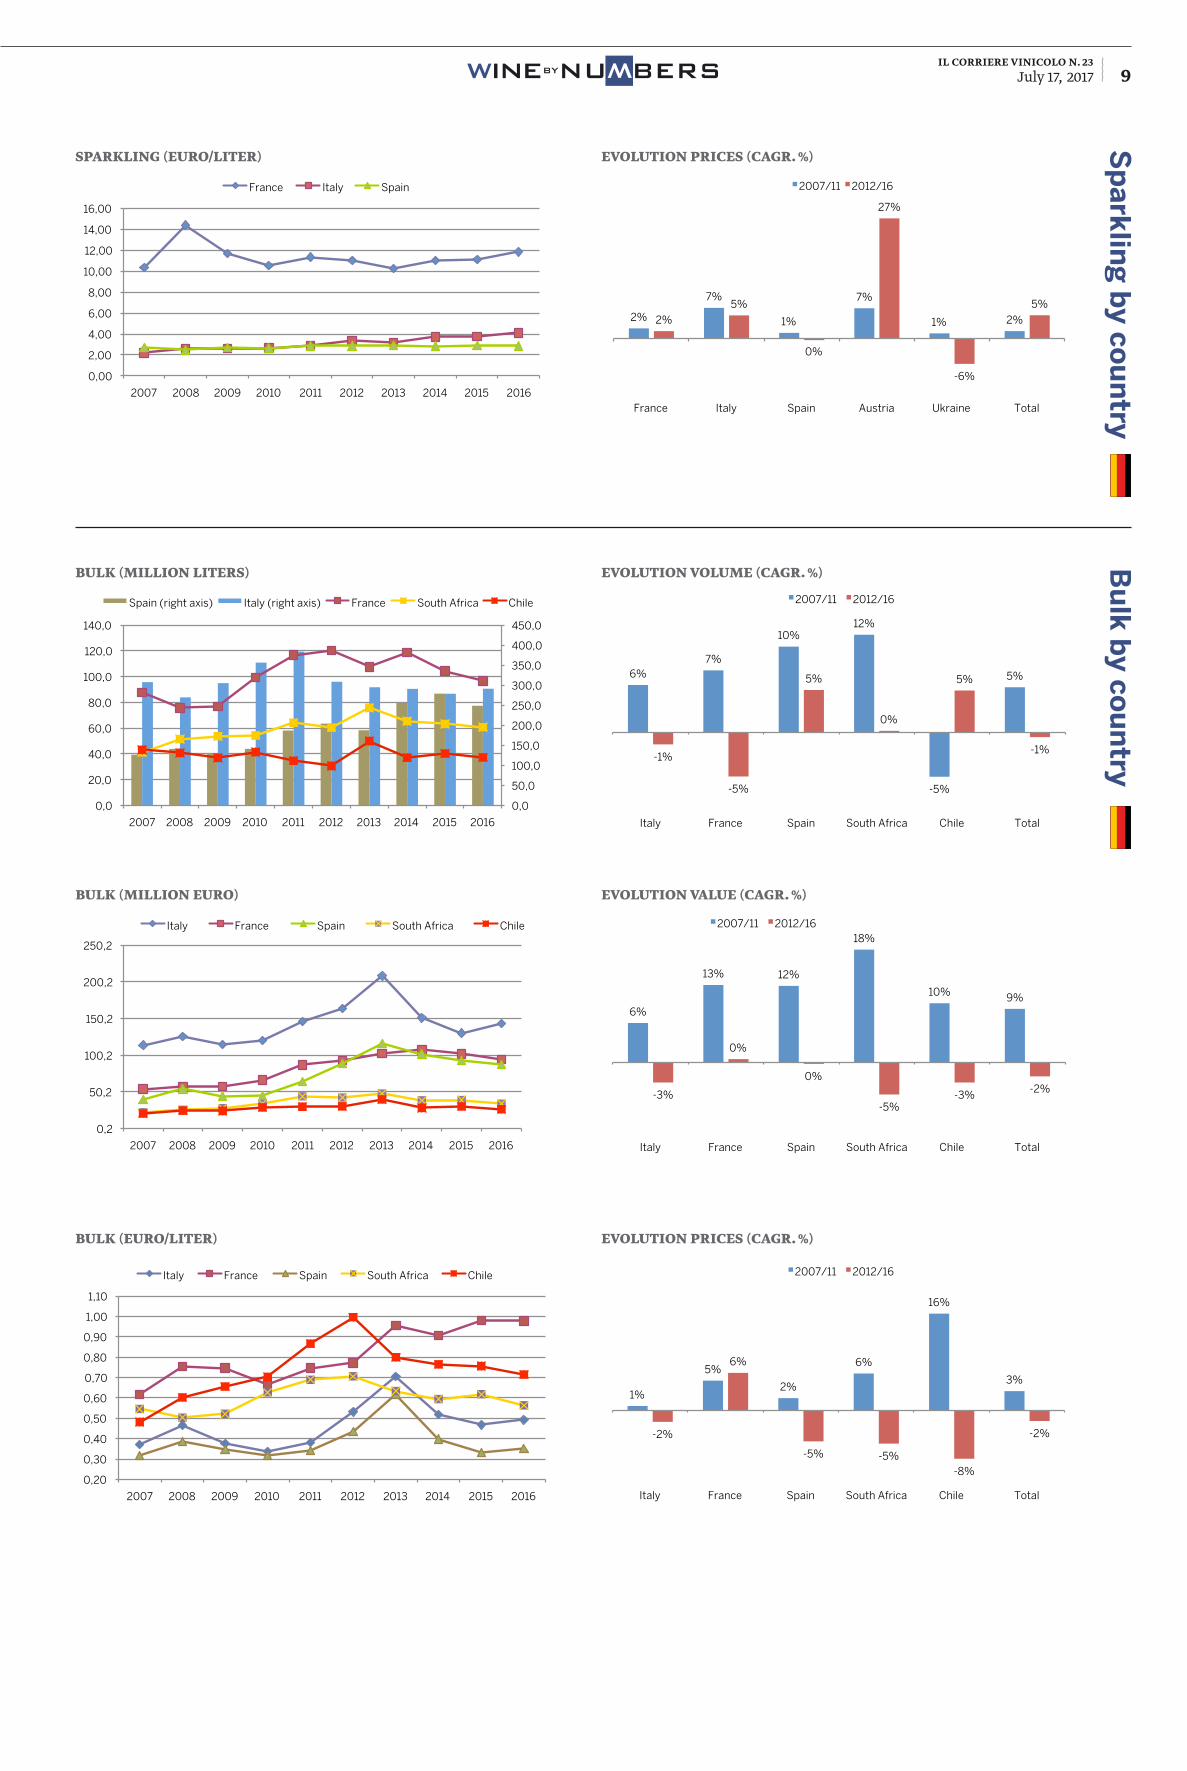
sparkling (eUro/liter) evolUtion priCes (Cagr. %)
0,00
2,00
4,00
6,00
8,00
10,00
12,00
14,00
16,00
2007 2008 2009 2010 2011 2012 2013 2014 2015 2016
Sparkling (euro/liter)
France Italy Spain
Bu
lk b
y cou
ntry
evolUtion volUme (Cagr. %)
evolUtion valUe (Cagr. %)
evolUtion priCes (Cagr. %)
bUlk (million liters)
bUlk (million eUro)
bUlk (eUro/liter)
0,0
50,0
100,0
150,0
200,0
250,0
300,0
350,0
400,0
450,0
0,0
20,0
40,0
60,0
80,0
100,0
120,0
140,0
2007 2008 2009 2010 2011 2012 2013 2014 2015 2016
Bulk (million liters)
Spain (right axis) Italy (right axis) France South Africa Chile
0,2
50,2
100,2
150,2
200,2
250,2
2007 2008 2009 2010 2011 2012 2013 2014 2015 2016
Bulk (million euro)
Italy France Spain South Africa Chile
0,20
0,30
0,40
0,50
0,60
0,70
0,80
0,90
1,00
1,10
2007 2008 2009 2010 2011 2012 2013 2014 2015 2016
Bulk (euro/liter)
Italy France Spain South Africa Chile
2%
7%
1%
7%
1% 2% 2%
5%
0%
27%
-6%
5%
France Italy Spain Austria Ukraine Total
Evolution prices (Cagr %)
2007/11 2012/16
6% 7%
10% 12%
-5%
5%
-1%
-5%
5%
0%
5%
-1%
Italy France Spain South Africa Chile Total
Evolution volume (Cagr %)
2007/11 2012/16
6%
13% 12%
18%
10% 9%
-3%
0%
0%
-5% -3% -2%
Italy France Spain South Africa Chile Total
Evolution value (Cagr %)
2007/11 2012/16
1%
5%
2%
6%
16%
3%
-2%
6%
-5% -5% -8%
-2%
Italy France Spain South Africa Chile Total
Evolution prices (Cagr %)
2007/11 2012/16
il corriere vinicolo n. 23July 17, 2017 10 BYNUWBERSWINE
W
million liters 2007 2008 2009 2010 2011 2012 2013 2014 2015 2016Sparkling 83,1 81,3 74,3 78,2 75,0 83,6 83,6 120,4 130,9 148,3
Bottled 890,9 869,0 876,4 867,9 812,2 793,0 761,3 805,1 767,5 734,3
Bulk 198,4 207,3 240,6 340,4 404,8 434,7 459,1 476,9 477,0 477,7
Total 1.172,4 1.157,6 1.191,3 1.286,5 1.292,0 1.311,3 1.304,0 1.402,5 1.375,4 1.360,2
million £ 2007 2008 2009 2010 2011 2012 2013 2014 2015 2016Sparkling 448,0 455,0 455,9 487,8 507,3 519,8 524,3 606,1 576,1 616,6
Bottled 1.918,1 2.118,4 2.117,2 2.084,5 2.174,6 2.298,2 2.242,5 2.062,1 1.877,5 1.863,0
Bulk 159,9 168,8 212,1 214,3 337,1 374,0 402,2 393,5 367,9 393,8
Total 2.526,0 2.742,2 2.785,2 2.786,6 3.019,0 3.192,0 3.169,0 3.061,7 2.821,5 2.873,4
£/liter 2007 2008 2009 2010 2011 2012 2013 2014 2015 2016Sparkling 5,39 5,60 6,13 6,24 6,76 6,22 6,27 5,03 4,40 4,16
Bottled 2,15 2,44 2,42 2,40 2,68 2,90 2,95 2,56 2,45 2,54
Bulk 0,81 0,81 0,88 0,63 0,83 0,86 0,88 0,83 0,77 0,82
Total 2,15 2,37 2,34 2,17 2,34 2,43 2,43 2,18 2,05 2,11
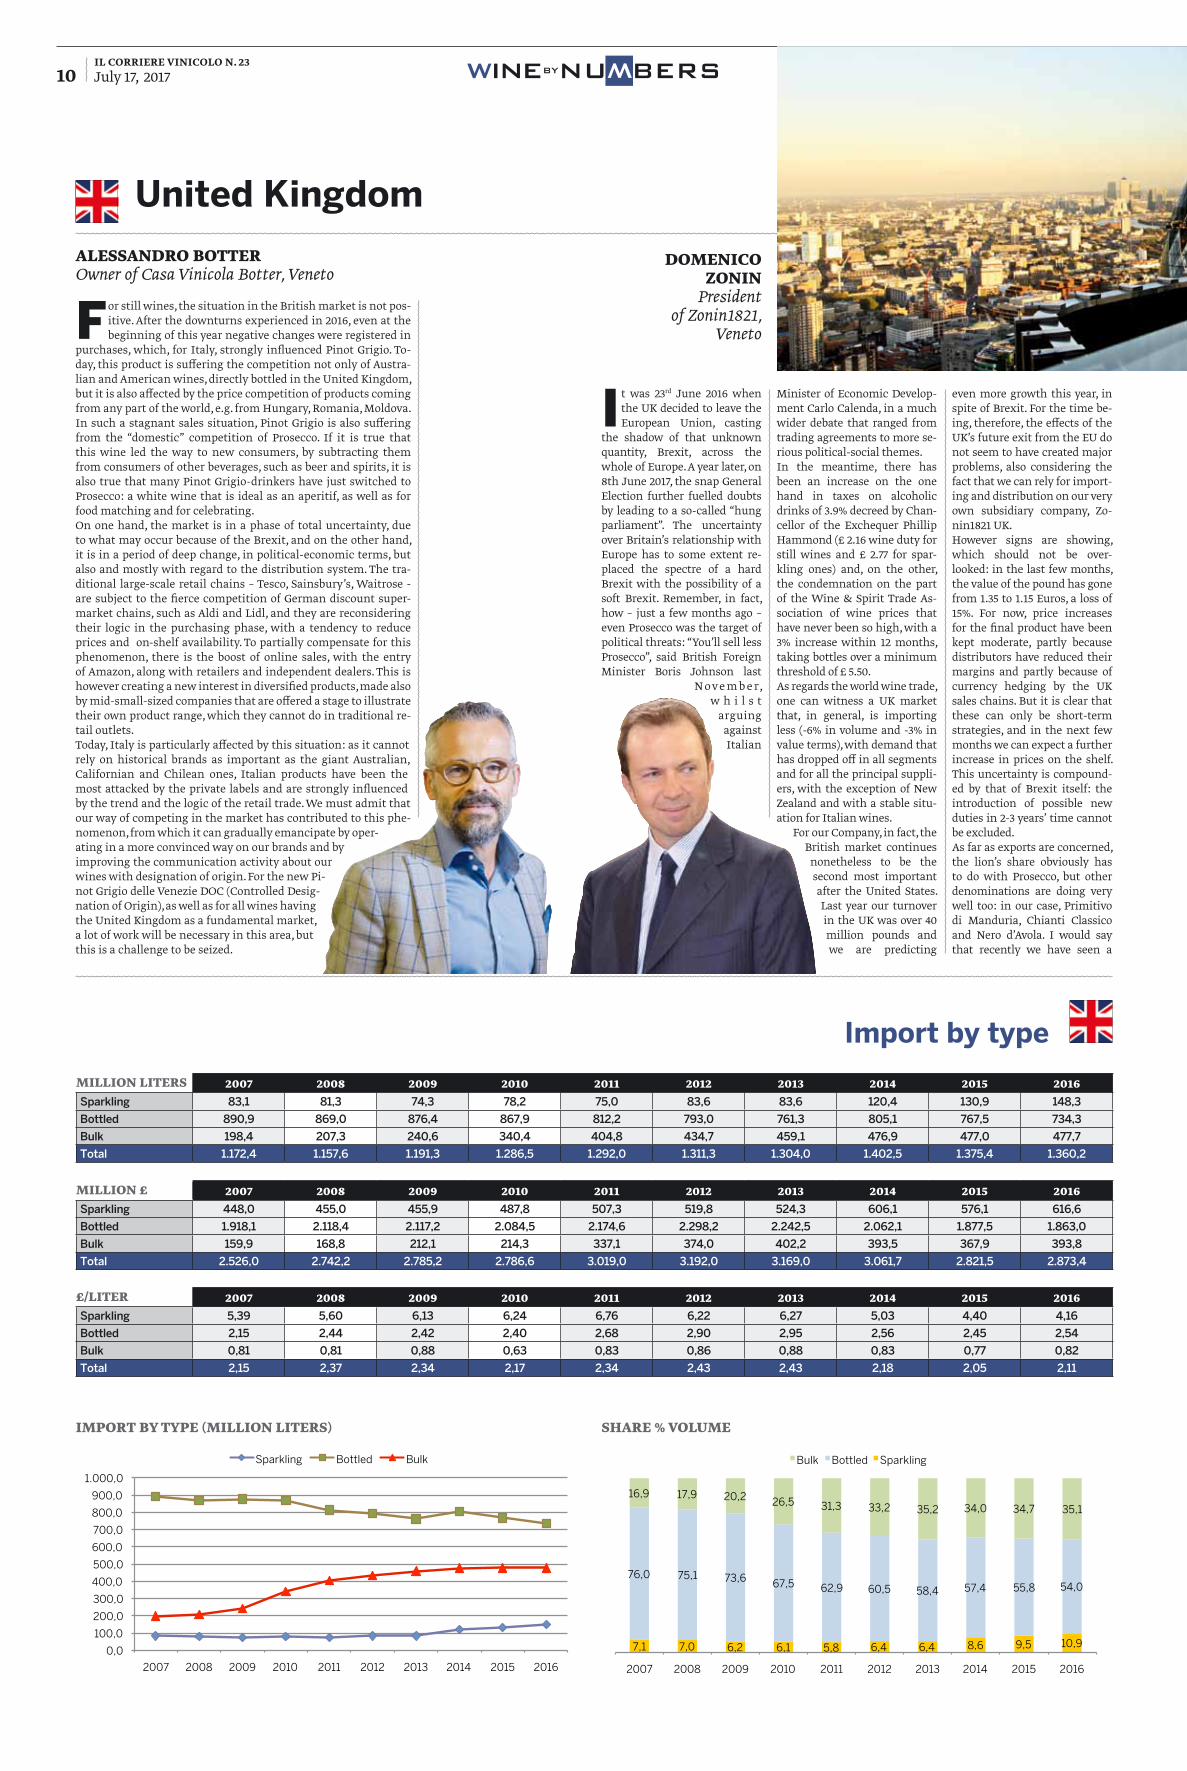
Import by type
import by type (million liters) share % volUme
0,0
100,0
200,0
300,0
400,0
500,0
600,0
700,0
800,0
900,0
1.000,0
2007 2008 2009 2010 2011 2012 2013 2014 2015 2016
Import by type (million liters)
Sparkling Bottled Bulk
7,1 7,0 6,2 6,1 5,8 6,4 6,4 8,6 9,5 10,9
76,0 75,1 73,6 67,5 62,9 60,5 58,4 57,4 55,8 54,0
16,9 17,9 20,2 26,5 31,3 33,2 35,2 34,0 34,7 35,1
2007 2008 2009 2010 2011 2012 2013 2014 2015 2016
Share % volume
Bulk Bottled Sparkling
United Kingdom
For still wines, the situation in the British market is not pos-itive. After the downturns experienced in 2016, even at the beginning of this year negative changes were registered in
purchases, which, for Italy, strongly influenced Pinot Grigio. To-day, this product is suffering the competition not only of Austra-lian and American wines, directly bottled in the United Kingdom, but it is also affected by the price competition of products coming from any part of the world, e.g. from Hungary, Romania, Moldova.In such a stagnant sales situation, Pinot Grigio is also suffering from the “domestic” competition of Prosecco. If it is true that this wine led the way to new consumers, by subtracting them from consumers of other beverages, such as beer and spirits, it is also true that many Pinot Grigio-drinkers have just switched to Prosecco: a white wine that is ideal as an aperitif, as well as for food matching and for celebrating. On one hand, the market is in a phase of total uncertainty, due to what may occur because of the Brexit, and on the other hand, it is in a period of deep change, in political-economic terms, but also and mostly with regard to the distribution system. The tra-ditional large-scale retail chains – Tesco, Sainsbury’s, Waitrose - are subject to the fierce competition of German discount super-market chains, such as Aldi and Lidl, and they are reconsidering their logic in the purchasing phase, with a tendency to reduce prices and on-shelf availability. To partially compensate for this phenomenon, there is the boost of online sales, with the entry of Amazon, along with retailers and independent dealers. This is however creating a new interest in diversified products, made also by mid-small-sized companies that are offered a stage to illustrate their own product range, which they cannot do in traditional re-tail outlets.Today, Italy is particularly affected by this situation: as it cannot rely on historical brands as important as the giant Australian, Californian and Chilean ones, Italian products have been the most attacked by the private labels and are strongly influenced by the trend and the logic of the retail trade. We must admit that our way of competing in the market has contributed to this phe-nomenon, from which it can gradually emancipate by oper-ating in a more convinced way on our brands and by improving the communication activity about our wines with designation of origin. For the new Pi-not Grigio delle Venezie DOC (Controlled Desig-nation of Origin), as well as for all wines having the United Kingdom as a fundamental market, a lot of work will be necessary in this area, but this is a challenge to be seized.
I t was 23rd June 2016 when the UK decided to leave the European Union, casting
the shadow of that unknown quantity, Brexit, across the whole of Europe. A year later, on 8th June 2017, the snap General Election further fuelled doubts by leading to a so-called “hung parliament”. The uncertainty over Britain’s relationship with Europe has to some extent re-placed the spectre of a hard Brexit with the possibility of a soft Brexit. Remember, in fact, how – just a few months ago – even Prosecco was the target of political threats: “You’ll sell less Prosecco”, said British Foreign Minister Boris Johnson last
N o ve m b e r, w h i l s t
arguing against Italian
Minister of Economic Develop-ment Carlo Calenda, in a much wider debate that ranged from trading agreements to more se-rious political-social themes.In the meantime, there has been an increase on the one hand in taxes on alcoholic drinks of 3.9% decreed by Chan-cellor of the Exchequer Phillip Hammond (£ 2.16 wine duty for still wines and £ 2.77 for spar-kling ones) and, on the other, the condemnation on the part of the Wine & Spirit Trade As-sociation of wine prices that have never been so high, with a 3% increase within 12 months, taking bottles over a minimum threshold of £ 5.50.As regards the world wine trade, one can witness a UK market that, in general, is importing less (-6% in volume and -3% in value terms), with demand that has dropped off in all segments and for all the principal suppli-ers, with the exception of New Zealand and with a stable situ-ation for Italian wines.
For our Company, in fact, the British market continues
nonetheless to be the second most important after the United States. Last year our turnover in the UK was over 40 million pounds and we are predicting
even more growth this year, in spite of Brexit. For the time be-ing, therefore, the effects of the UK’s future exit from the EU do not seem to have created major problems, also considering the fact that we can rely for import-ing and distribution on our very own subsidiary company, Zo-nin1821 UK.However signs are showing, which should not be over-looked: in the last few months, the value of the pound has gone from 1.35 to 1.15 Euros, a loss of 15%. For now, price increases for the final product have been kept moderate, partly because distributors have reduced their margins and partly because of currency hedging by the UK sales chains. But it is clear that these can only be short-term strategies, and in the next few months we can expect a further increase in prices on the shelf. This uncertainty is compound-ed by that of Brexit itself: the introduction of possible new duties in 2-3 years’ time cannot be excluded.As far as exports are concerned, the lion’s share obviously has to do with Prosecco, but other denominations are doing very well too: in our case, Primitivo di Manduria, Chianti Classico and Nero d’Avola. I would say that recently we have seen a
alessandro botter Owner of Casa Vinicola Botter, Veneto
domeniCo Zonin
President of Zonin1821,
Veneto
il corriere vinicolo n. 23July 17, 2017 11BYNUWBERSWINE
W
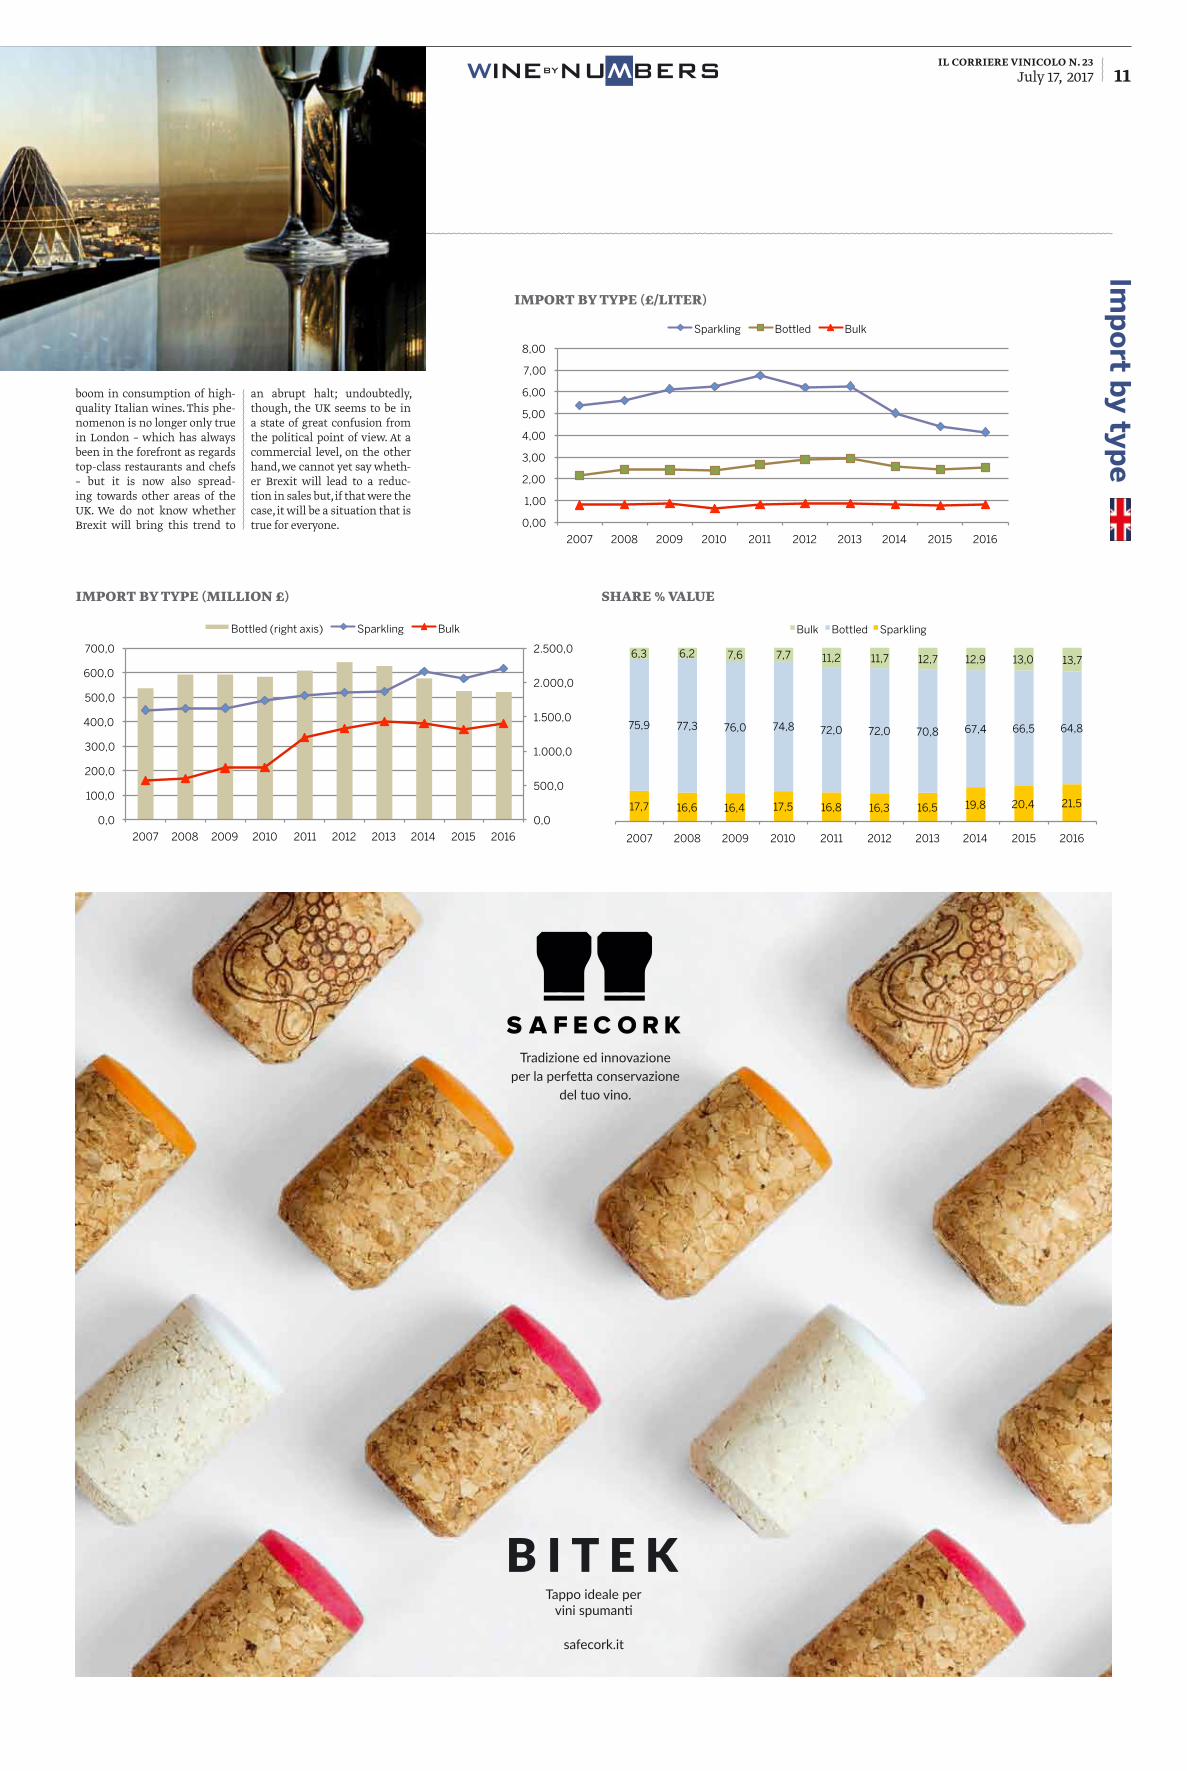
import by type (million £)
import by type (£/liter)
share % valUe
0,0
500,0
1.000,0
1.500,0
2.000,0
2.500,0
0,0
100,0
200,0
300,0
400,0
500,0
600,0
700,0
2007 2008 2009 2010 2011 2012 2013 2014 2015 2016
Import by type (million £)
Bottled (right axis) Sparkling Bulk
0,00
1,00
2,00
3,00
4,00
5,00
6,00
7,00
8,00
2007 2008 2009 2010 2011 2012 2013 2014 2015 2016
Import by type (£/liter)
Sparkling Bottled Bulk
17,7 16,6 16,4 17,5 16,8 16,3 16,5 19,8 20,4 21,5
75,9 77,3 76,0 74,8 72,0 72,0 70,8 67,4 66,5 64,8
6,3 6,2 7,6 7,7 11,2 11,7 12,7 12,9 13,0 13,7
2007 2008 2009 2010 2011 2012 2013 2014 2015 2016
Share % value
Bulk Bottled Sparkling
Tradizione ed innovazione per la perfetta conservazione
del tuo vino.
safecork.it
Tappo ideale per vini spumanti
boom in consumption of high-quality Italian wines. This phe-nomenon is no longer only true in London – which has always been in the forefront as regards top-class restaurants and chefs – but it is now also spread-ing towards other areas of the UK. We do not know whether Brexit will bring this trend to
Imp
ort b
y type
an abrupt halt; undoubtedly, though, the UK seems to be in a state of great confusion from the political point of view. At a commercial level, on the other hand, we cannot yet say wheth-er Brexit will lead to a reduc-tion in sales but, if that were the case, it will be a situation that is true for everyone.
il corriere vinicolo n. 23July 17, 2017 12 BYNUWBERSWINE
W
Bo
ttled
by co
un
tryS
pa
rklin
g b
y cou
ntry
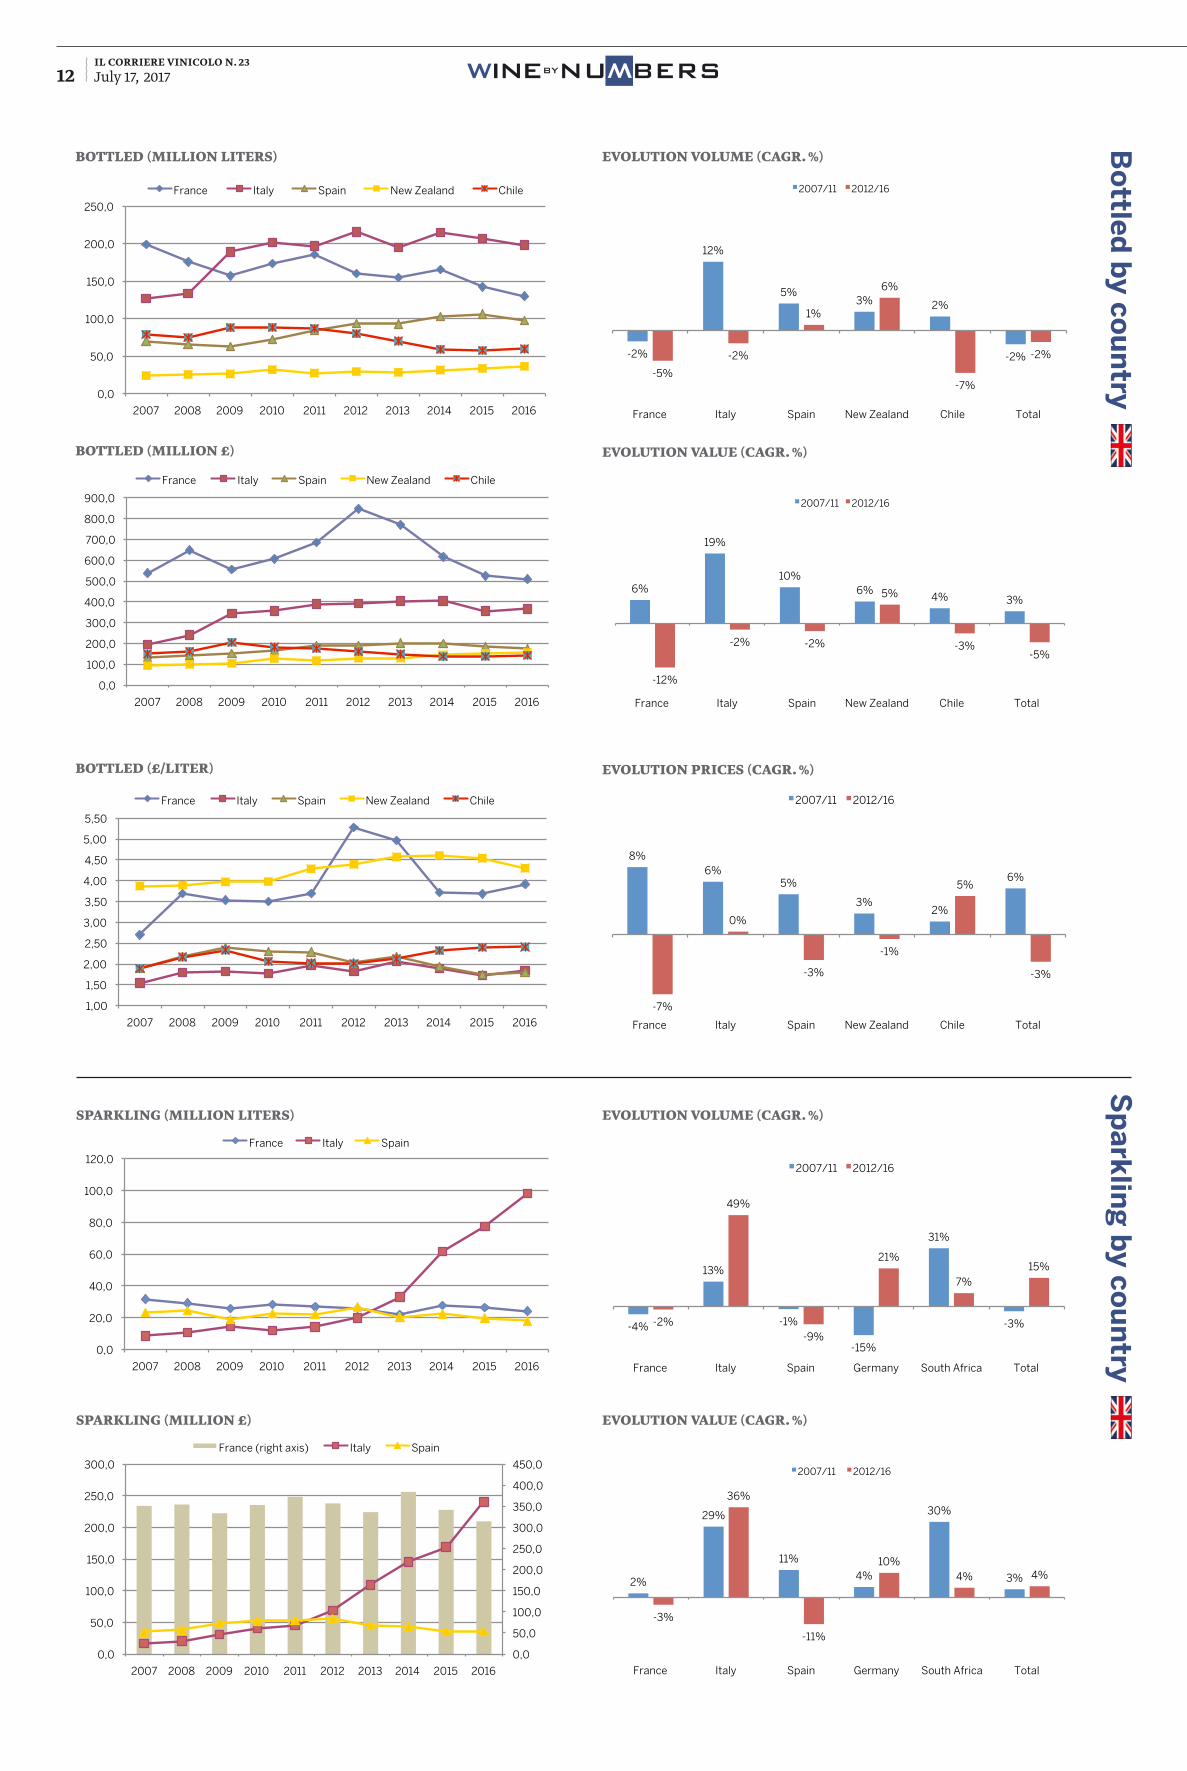
bottled (million liters) evolUtion volUme (Cagr. %)
evolUtion valUe (Cagr. %)
evolUtion priCes (Cagr. %)
bottled (million £)
bottled (£/liter)
sparkling (million liters) evolUtion volUme (Cagr. %)
sparkling (million £) evolUtion valUe (Cagr. %)
0,0
50,0
100,0
150,0
200,0
250,0
2007 2008 2009 2010 2011 2012 2013 2014 2015 2016
Bottled (million liters)
France Italy Spain New Zealand Chile
0,0
100,0
200,0
300,0
400,0
500,0
600,0
700,0
800,0
900,0
2007 2008 2009 2010 2011 2012 2013 2014 2015 2016
Bottled (million £)
France Italy Spain New Zealand Chile
1,00
1,50
2,00
2,50
3,00
3,50
4,00
4,50
5,00
5,50
2007 2008 2009 2010 2011 2012 2013 2014 2015 2016
Bottled (£/liter)
France Italy Spain New Zealand Chile
0,0
50,0
100,0
150,0
200,0
250,0
300,0
350,0
400,0
450,0
0,0
50,0
100,0
150,0
200,0
250,0
300,0
2007 2008 2009 2010 2011 2012 2013 2014 2015 2016
Sparkling (million £)
France (right axis) Italy Spain
0,0
20,0
40,0
60,0
80,0
100,0
120,0
2007 2008 2009 2010 2011 2012 2013 2014 2015 2016
Sparkling (million liters)
France Italy Spain
-2%
12%
5% 3% 2%
-2%
-5%
-2%
1%
6%
-7%
-2%
France Italy Spain New Zealand Chile Total
Evolution volume (Cagr %)
2007/11 2012/16
6%
19%
10% 6%
4% 3%
-12%
-2% -2%
5%
-3% -5%
France Italy Spain New Zealand Chile Total
Evolution value (Cagr %)
2007/11 2012/16
8% 6%
5%
3% 2%
6%
-7%
0%
-3%
-1%
5%
-3%
France Italy Spain New Zealand Chile Total
Evolution prices (Cagr %)
2007/11 2012/16
-4%
13%
-1%
-15%
31%
-3% -2%
49%
-9%
21%
7% 15%
France Italy Spain Germany South Africa Total
Evolution volume (Cagr %)
2007/11 2012/16
2%
29%
11%
4%
30%
3%
-3%
36%
-11%
10% 4% 4%
France Italy Spain Germany South Africa Total
Evolution value (Cagr %)
2007/11 2012/16
il corriere vinicolo n. 23July 17, 2017 13BYNUWBERSWINE
W
Sp
ark
ling
by co
un
try
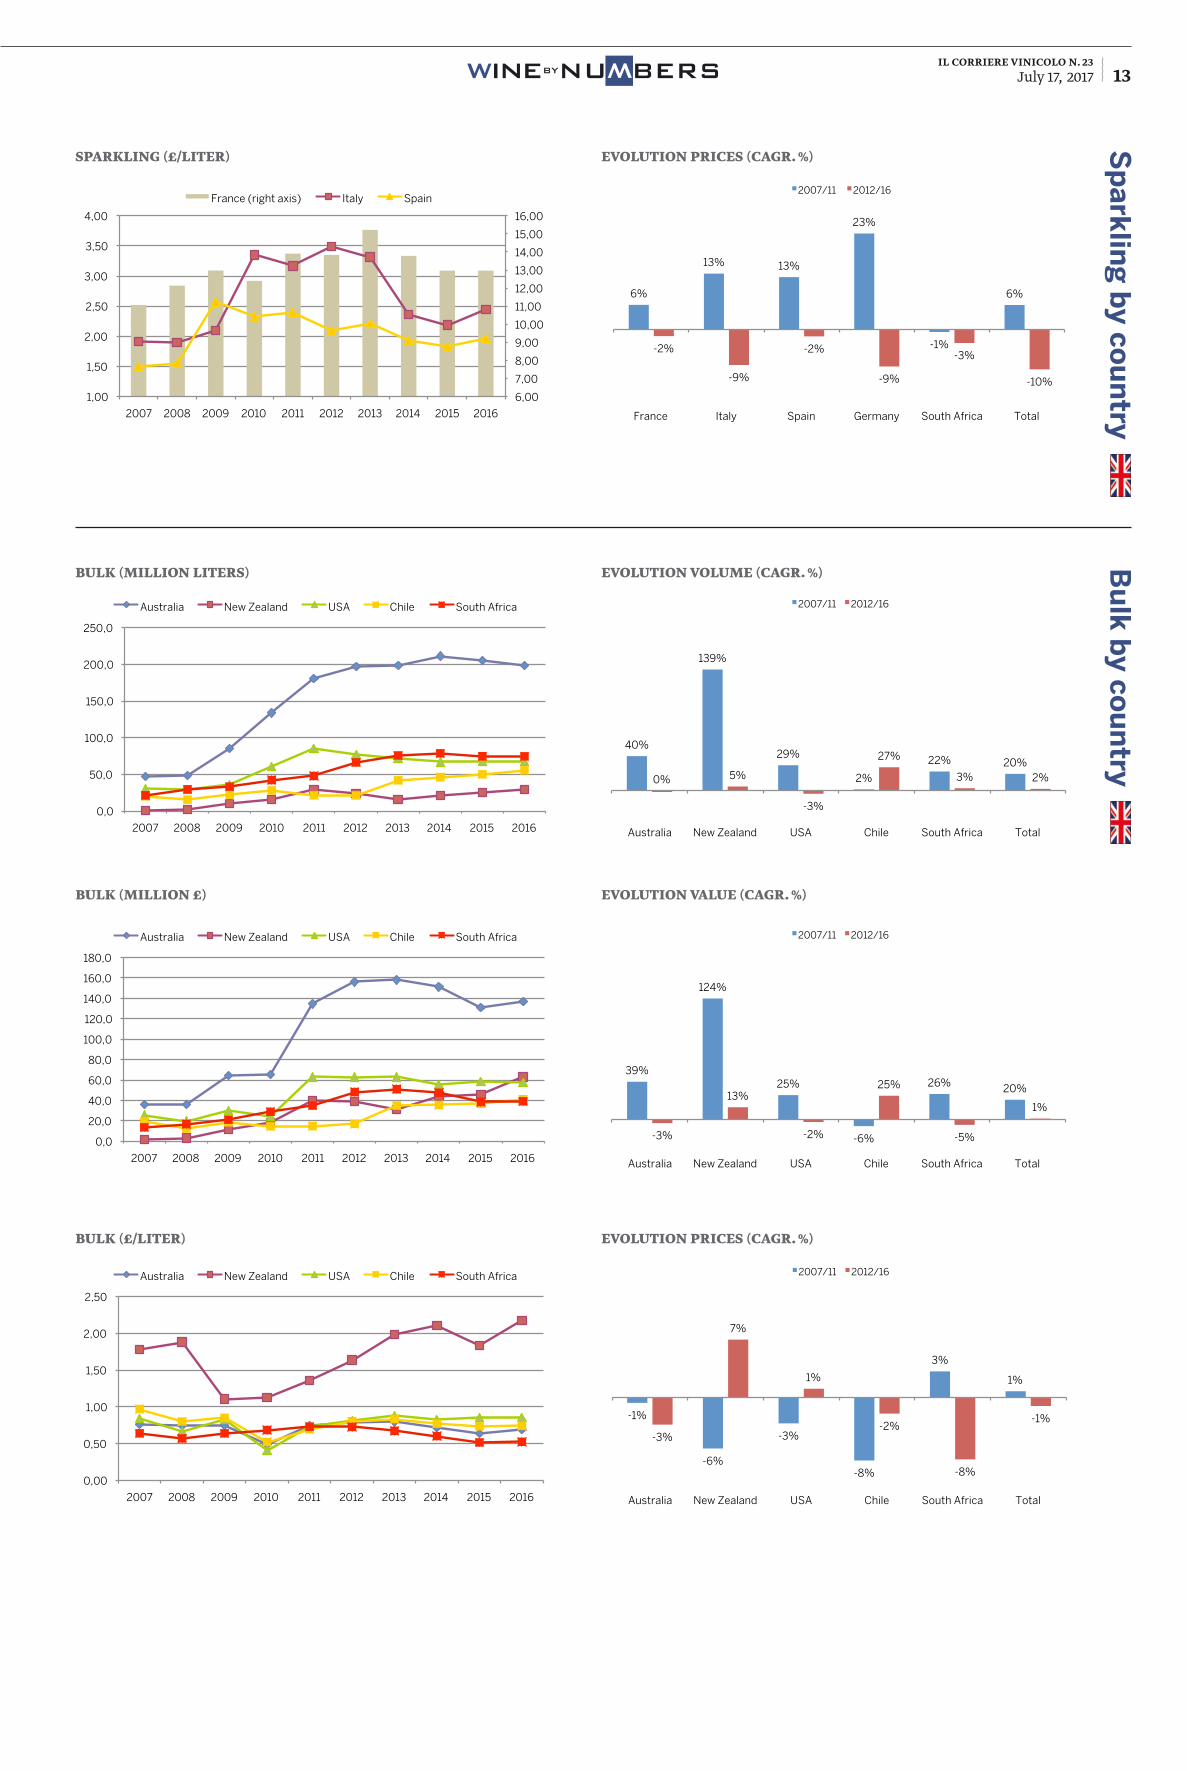
sparkling (£/liter) evolUtion priCes (Cagr. %)
0,0
50,0
100,0
150,0
200,0
250,0
300,0
350,0
400,0
450,0
0,0
50,0
100,0
150,0
200,0
250,0
300,0
2007 2008 2009 2010 2011 2012 2013 2014 2015 2016
Sparkling (million £)
France (right axis) Italy Spain
6,00
7,00
8,00
9,00
10,00
11,00
12,00
13,00
14,00
15,00
16,00
1,00
1,50
2,00
2,50
3,00
3,50
4,00
2007 2008 2009 2010 2011 2012 2013 2014 2015 2016
Sparkling (£/liter)
France Italy Spain
Bu
lk b
y cou
ntry
evolUtion volUme (Cagr. %)
evolUtion valUe (Cagr. %)
evolUtion priCes (Cagr. %)
bUlk (million liters)
bUlk (million £)
bUlk (£/liter)
0,0
50,0
100,0
150,0
200,0
250,0
2007 2008 2009 2010 2011 2012 2013 2014 2015 2016
Bulk (million liters)
Australia New Zealand USA Chile South Africa
0,0
20,0
40,0
60,0
80,0
100,0
120,0
140,0
160,0
180,0
2007 2008 2009 2010 2011 2012 2013 2014 2015 2016
Bulk (million £)
Australia New Zealand USA Chile South Africa
0,00
0,50
1,00
1,50
2,00
2,50
2007 2008 2009 2010 2011 2012 2013 2014 2015 2016
Bulk (£/liter)
Australia New Zealand USA Chile South Africa
6%
13% 13%
23%
-1%
6%
-2%
-9%
-2%
-9%
-3%
-10%
France Italy Spain Germany South Africa Total
Evolution prices (Cagr %)
2007/11 2012/16
40%
139%
29%
2%
22% 20%
0% 5%
-3%
27%
3% 2%
Australia New Zealand USA Chile South Africa Total
Evolution volume (Cagr %)
2007/11 2012/16
39%
124%
25%
-6%
26% 20%
-3%
13%
-2%
25%
-5%
1%
Australia New Zealand USA Chile South Africa Total
Evolution value (Cagr %)
2007/11 2012/16
-1%
-6%
-3%
-8%
3%
1%
-3%
7%
1%
-2%
-8%
-1%
Australia New Zealand USA Chile South Africa Total
Evolution prices (Cagr %)
2007/11 2012/16
il corriere vinicolo n. 23July 17, 2017 15BYNUWBERSWINE
W
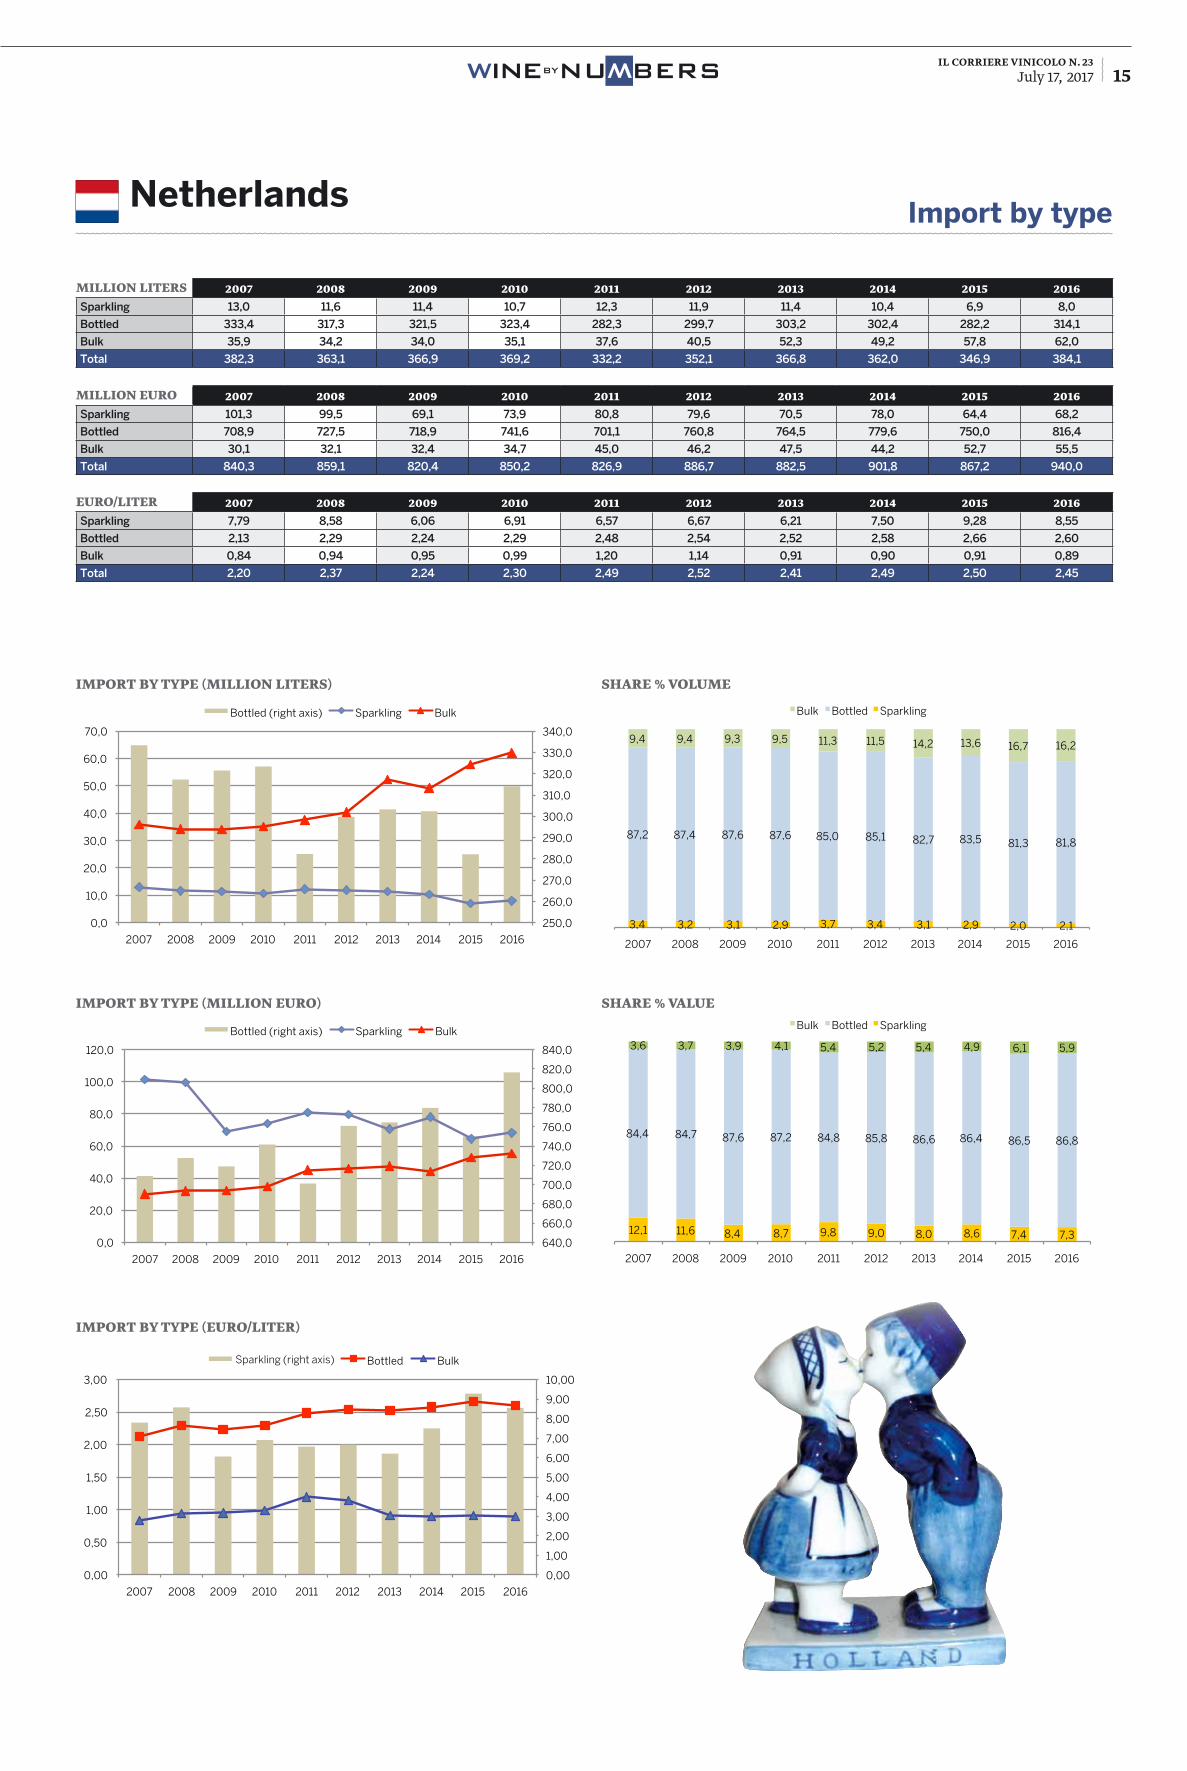
million liters 2007 2008 2009 2010 2011 2012 2013 2014 2015 2016Sparkling 13,0 11,6 11,4 10,7 12,3 11,9 11,4 10,4 6,9 8,0
Bottled 333,4 317,3 321,5 323,4 282,3 299,7 303,2 302,4 282,2 314,1
Bulk 35,9 34,2 34,0 35,1 37,6 40,5 52,3 49,2 57,8 62,0
Total 382,3 363,1 366,9 369,2 332,2 352,1 366,8 362,0 346,9 384,1
million eUro 2007 2008 2009 2010 2011 2012 2013 2014 2015 2016Sparkling 101,3 99,5 69,1 73,9 80,8 79,6 70,5 78,0 64,4 68,2
Bottled 708,9 727,5 718,9 741,6 701,1 760,8 764,5 779,6 750,0 816,4
Bulk 30,1 32,1 32,4 34,7 45,0 46,2 47,5 44,2 52,7 55,5
Total 840,3 859,1 820,4 850,2 826,9 886,7 882,5 901,8 867,2 940,0
eUro/liter 2007 2008 2009 2010 2011 2012 2013 2014 2015 2016Sparkling 7,79 8,58 6,06 6,91 6,57 6,67 6,21 7,50 9,28 8,55
Bottled 2,13 2,29 2,24 2,29 2,48 2,54 2,52 2,58 2,66 2,60
Bulk 0,84 0,94 0,95 0,99 1,20 1,14 0,91 0,90 0,91 0,89
Total 2,20 2,37 2,24 2,30 2,49 2,52 2,41 2,49 2,50 2,45
Import by typeNetherlands
import by type (million eUro)
import by type (million liters)
import by type (eUro/liter)
share % valUe
share % volUme
3,4 3,2 3,1 2,9 3,7 3,4 3,1 2,9 2,0 2,1
87,2 87,4 87,6 87,6 85,0 85,1 82,7 83,5 81,3 81,8
9,4 9,4 9,3 9,5 11,3 11,5 14,2 13,6 16,7 16,2
2007 2008 2009 2010 2011 2012 2013 2014 2015 2016
Share % volume
Bulk Bottled Sparklng
12,1 11,6 8,4 8,7 9,8 9,0 8,0 8,6 7,4 7,3
84,4 84,7 87,6 87,2 84,8 85,8 86,6 86,4 86,5 86,8
3,6 3,7 3,9 4,1 5,4 5,2 5,4 4,9 6,1 5,9
2007 2008 2009 2010 2011 2012 2013 2014 2015 2016
Share % value
Bulk Bottled Sparklng
17,7 16,6 16,4 17,5 16,8 16,3 16,5 19,8 20,4 21,5
75,9 77,3 76,0 74,8 72,0 72,0 70,8 67,4 66,5 64,8
6,3 6,2 7,6 7,7 11,2 11,7 12,7 12,9 13,0 13,7
2007 2008 2009 2010 2011 2012 2013 2014 2015 2016
Share % value
Bulk Bottled Sparkling
17,7 16,6 16,4 17,5 16,8 16,3 16,5 19,8 20,4 21,5
75,9 77,3 76,0 74,8 72,0 72,0 70,8 67,4 66,5 64,8
6,3 6,2 7,6 7,7 11,2 11,7 12,7 12,9 13,0 13,7
2007 2008 2009 2010 2011 2012 2013 2014 2015 2016
Share % value
Bulk Bottled Sparkling
640,0
660,0
680,0
700,0
720,0
740,0
760,0
780,0
800,0
820,0
840,0
0,0
20,0
40,0
60,0
80,0
100,0
120,0
2007 2008 2009 2010 2011 2012 2013 2014 2015 2016
Import by type (million euro)
Bottled (right axis) Sparkling Bulk
250,0
260,0
270,0
280,0
290,0
300,0
310,0
320,0
330,0
340,0
0,0
10,0
20,0
30,0
40,0
50,0
60,0
70,0
2007 2008 2009 2010 2011 2012 2013 2014 2015 2016
Import by type (million liters)
Bottled (right axis) Sparkling Bulk
0,00
1,00
2,00
3,00
4,00
5,00
6,00
7,00
8,00
9,00
10,00
0,00
0,50
1,00
1,50
2,00
2,50
3,00
2007 2008 2009 2010 2011 2012 2013 2014 2015 2016
Import by type (euro/liter)
Spumante (asse dx) Bottled Bulk Sparkling (right axis)
il corriere vinicolo n. 23July 17, 2017 16 BYNUWBERSWINE
W
sparkling (million eUro) evolUtion valUe (Cagr. %)
Bo
ttled
by co
un
tryS
pa
rklin
g b
y cou
ntry
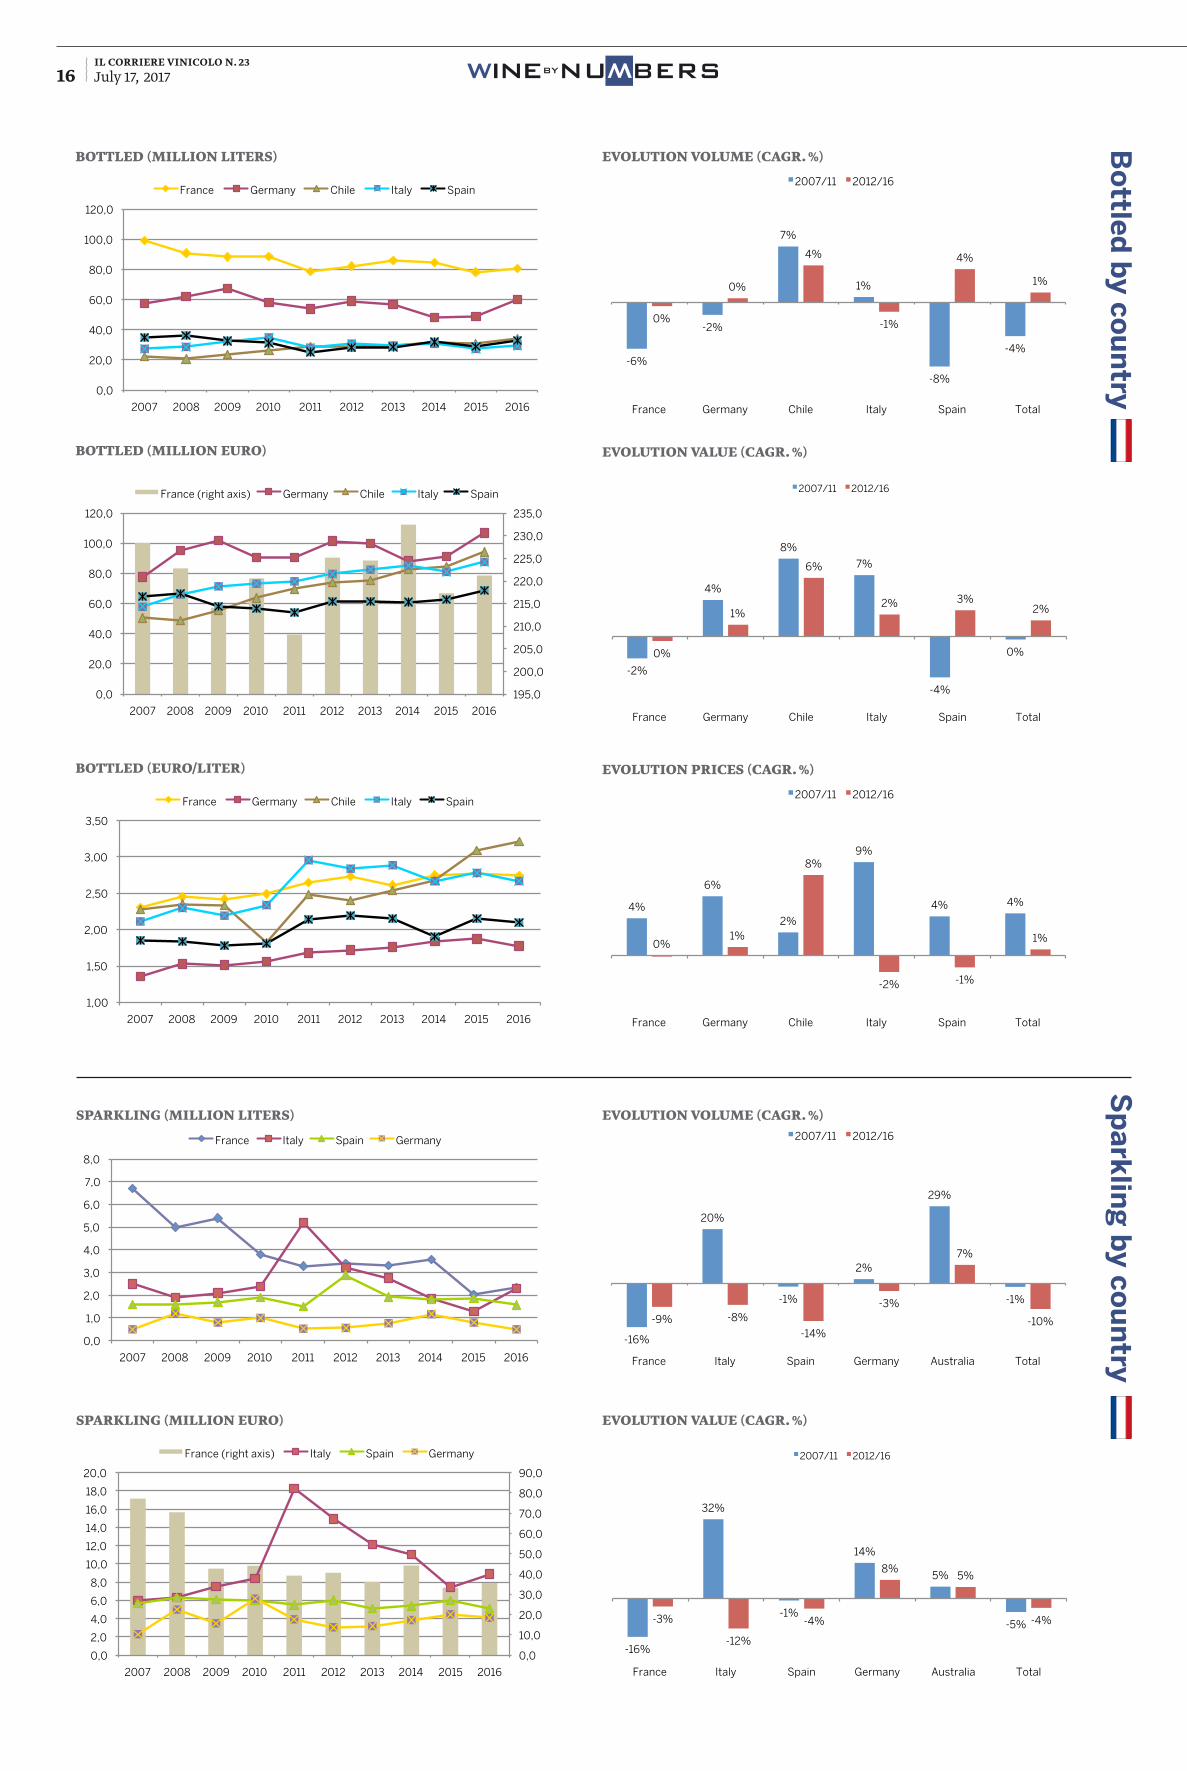
bottled (million liters) evolUtion volUme (Cagr. %)
evolUtion valUe (Cagr. %)
evolUtion priCes (Cagr. %)
bottled (million eUro)
bottled (eUro/liter)
sparkling (million liters) evolUtion volUme (Cagr. %)
0,0
20,0
40,0
60,0
80,0
100,0
120,0
2007 2008 2009 2010 2011 2012 2013 2014 2015 2016
Bottled (million liters)
France Germany Chile Italy Spain
195,0
200,0
205,0
210,0
215,0
220,0
225,0
230,0
235,0
0,0
20,0
40,0
60,0
80,0
100,0
120,0
2007 2008 2009 2010 2011 2012 2013 2014 2015 2016
Bottled (million euro)
France (right axis) Germany Chile Italy Spain
1,00
1,50
2,00
2,50
3,00
3,50
2007 2008 2009 2010 2011 2012 2013 2014 2015 2016
Bottled (euro/liter)
France Germany Chile Italy Spain
0,0
1,0
2,0
3,0
4,0
5,0
6,0
7,0
8,0
2007 2008 2009 2010 2011 2012 2013 2014 2015 2016
Sparkling (million liters)
France Italy Spain Germany
0,0
10,0
20,0
30,0
40,0
50,0
60,0
70,0
80,0
90,0
0,0
2,0
4,0
6,0
8,0
10,0
12,0
14,0
16,0
18,0
20,0
2007 2008 2009 2010 2011 2012 2013 2014 2015 2016
Sparkling (million euro)
France (right axis) Italy Spain Germany
-6%
-2%
7%
1%
-8%
-4%
0%
0%
4%
-1%
4%
1%
France Germany Chile Italy Spain Total
Evolution volume (Cagr %)
2007/11 2012/16
-2%
4%
8%
7%
-4%
0% 0%
1%
6%
2% 3% 2%
France Germany Chile Italy Spain Total
Evolution value (Cagr %)
2007/11 2012/16
4%
6%
2%
9%
4% 4%
0% 1%
8%
-2% -1%
1%
France Germany Chile Italy Spain Total
Evolution prices (Cagr %)
2007/11 2012/16
-16%
20%
-1%
2%
29%
-1%
-9% -8%
-14%
-3%
7%
-10%
France Italy Spain Germany Australia Total
Evolution volume (Cagr %)
2007/11 2012/16
-16%
32%
-1%
14%
5%
-5% -3%
-12%
-4%
8% 5%
-4%
France Italy Spain Germany Australia Total
Evolution value (Cagr %)
2007/11 2012/16
il corriere vinicolo n. 23July 17, 2017 17BYNUWBERSWINE
W
Bu
lk b
y cou
ntry
evolUtion volUme (Cagr. %)
evolUtion valUe (Cagr. %)
evolUtion priCes (Cagr. %)
bUlk (million liters)
bUlk (million eUro)
bUlk (eUro/liter)
Sp
ark
ling
by co
un
try
sparkling (eUro/liter) evolUtion priCes (Cagr. %)
0,00
2,00
4,00
6,00
8,00
10,00
12,00
14,00
16,00
18,00
2007 2008 2009 2010 2011 2012 2013 2014 2015 2016
Sparkling (euro/liter)
France Italy Spain Germany
0,0
5,0
10,0
15,0
20,0
25,0
2007 2008 2009 2010 2011 2012 2013 2014 2015 2016
Bulk (million liters)
France Germany Chile Australia South Africa
0,0
2,0
4,0
6,0
8,0
10,0
12,0
14,0
16,0
18,0
20,0
2007 2008 2009 2010 2011 2012 2013 2014 2015 2016
Bulk (million euro)
France Germany Chile Australia South Africa
0,00
0,50
1,00
1,50
2,00
2,50
2007 2008 2009 2010 2011 2012 2013 2014 2015 2016
Bulk (euro/liter)
France Germany Chile Australia South Africa
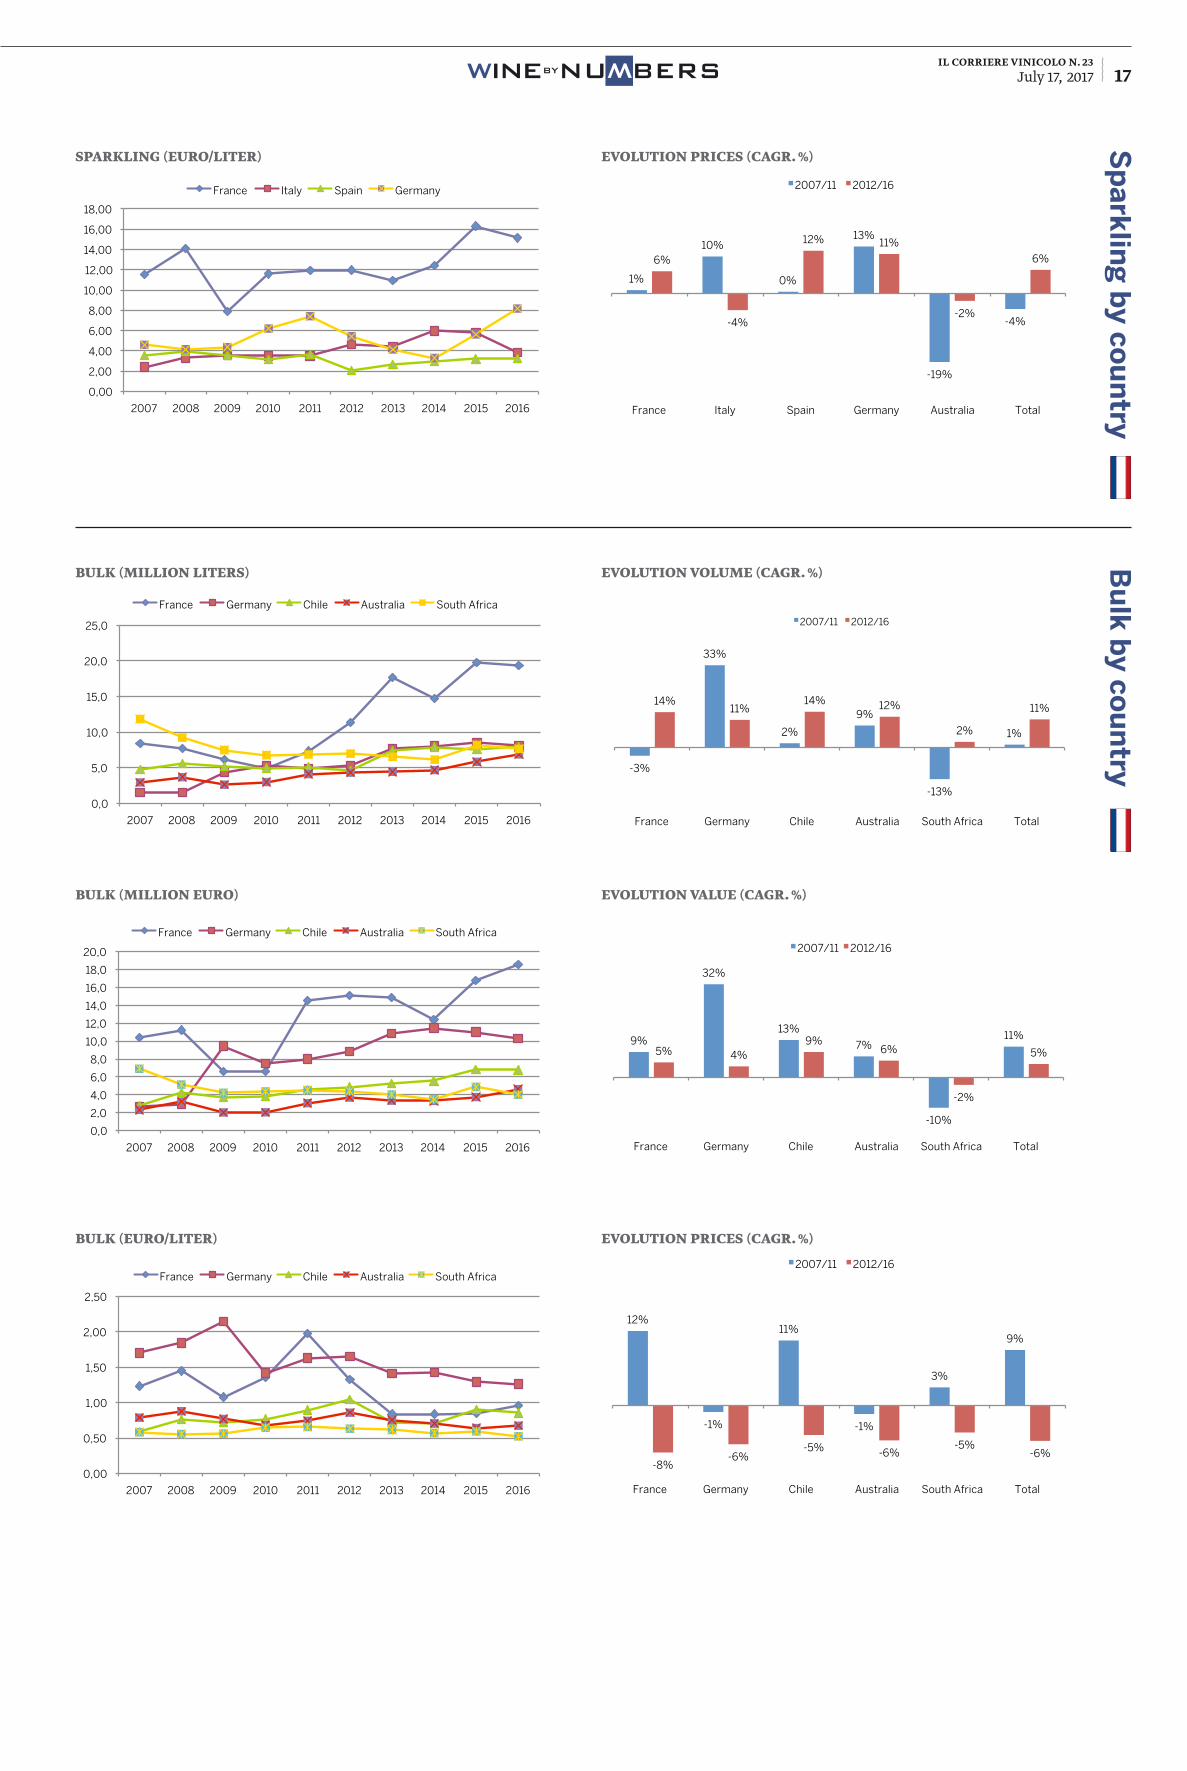
1%
10%
0%
13%
-19%
-4%
6%
-4%
12% 11%
-2%
6%
France Italy Spain Germany Australia Total
Evolution prices (Cagr %)
2007/11 2012/16
-3%
33%
2%
9%
-13%
1%
14% 11%
14% 12%
2%
11%
France Germany Chile Australia South Africa Total
Evolution volume (Cagr %)
2007/11 2012/16
9%
32%
13%
7%
-10%
11%
5% 4% 9%
6%
-2%
5%
France Germany Chile Australia South Africa Total
Evolution value (Cagr %)
2007/11 2012/16
12%
-1%
11%
-1%
3%
9%
-8% -6%
-5% -6% -5%
-6%
France Germany Chile Australia South Africa Total
Evolution prices (Cagr %)
2007/11 2012/16
il corriere vinicolo n. 23July 17, 2017 19BYNUWBERSWINE
W
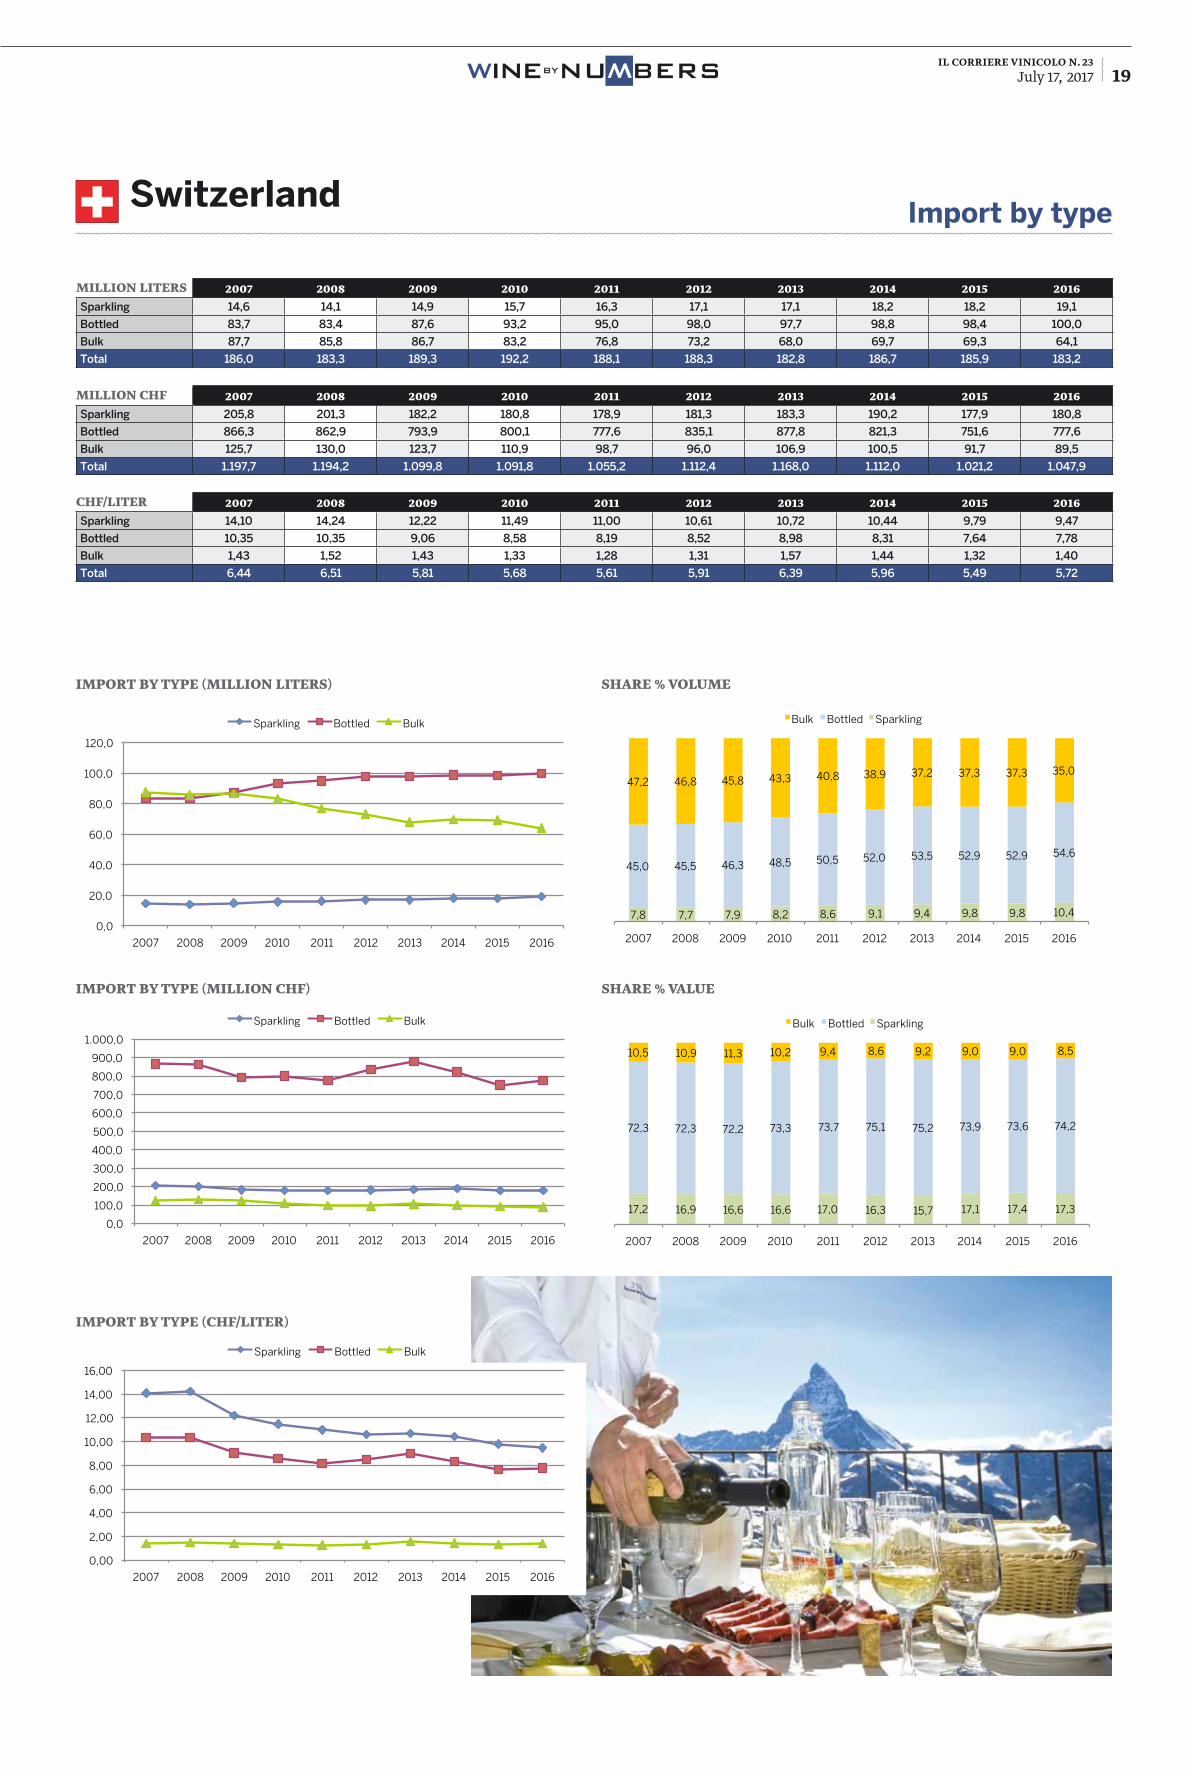
million liters 2007 2008 2009 2010 2011 2012 2013 2014 2015 2016Sparkling 14,6 14,1 14,9 15,7 16,3 17,1 17,1 18,2 18,2 19,1
Bottled 83,7 83,4 87,6 93,2 95,0 98,0 97,7 98,8 98,4 100,0
Bulk 87,7 85,8 86,7 83,2 76,8 73,2 68,0 69,7 69,3 64,1
Total 186,0 183,3 189,3 192,2 188,1 188,3 182,8 186,7 185,9 183,2
million ChF 2007 2008 2009 2010 2011 2012 2013 2014 2015 2016Sparkling 205,8 201,3 182,2 180,8 178,9 181,3 183,3 190,2 177,9 180,8
Bottled 866,3 862,9 793,9 800,1 777,6 835,1 877,8 821,3 751,6 777,6
Bulk 125,7 130,0 123,7 110,9 98,7 96,0 106,9 100,5 91,7 89,5
Total 1.197,7 1.194,2 1.099,8 1.091,8 1.055,2 1.112,4 1.168,0 1.112,0 1.021,2 1.047,9
ChF/liter 2007 2008 2009 2010 2011 2012 2013 2014 2015 2016Sparkling 14,10 14,24 12,22 11,49 11,00 10,61 10,72 10,44 9,79 9,47
Bottled 10,35 10,35 9,06 8,58 8,19 8,52 8,98 8,31 7,64 7,78
Bulk 1,43 1,52 1,43 1,33 1,28 1,31 1,57 1,44 1,32 1,40
Total 6,44 6,51 5,81 5,68 5,61 5,91 6,39 5,96 5,49 5,72
Import by typeSwitzerland
import by type (million ChF)
import by type (million liters)
share % valUe
share % volUme
0,0
20,0
40,0
60,0
80,0
100,0
120,0
2007 2008 2009 2010 2011 2012 2013 2014 2015 2016
Import by type (million liters)
Sparkling Bottled Bulk
0,0
100,0
200,0
300,0
400,0
500,0
600,0
700,0
800,0
900,0
1.000,0
2007 2008 2009 2010 2011 2012 2013 2014 2015 2016
Import by type (million CHF)
Sparkling Bottled Bulk
7,8 7,7 7,9 8,2 8,6 9,1 9,4 9,8 9,8 10,4
45,0 45,5 46,3 48,5 50,5 52,0 53,5 52,9 52,9 54,6
47,2 46,8 45,8 43,3 40,8 38,9 37,2 37,3 37,3 35,0
2007 2008 2009 2010 2011 2012 2013 2014 2015 2016
Share % volume
Bulk Bottled Sparkling
17,2 16,9 16,6 16,6 17,0 16,3 15,7 17,1 17,4 17,3
72,3 72,3 72,2 73,3 73,7 75,1 75,2 73,9 73,6 74,2
10,5 10,9 11,3 10,2 9,4 8,6 9,2 9,0 9,0 8,5
2007 2008 2009 2010 2011 2012 2013 2014 2015 2016
Share % value
Bulk Bottled Sparkling
0,00
2,00
4,00
6,00
8,00
10,00
12,00
14,00
16,00
2007 2008 2009 2010 2011 2012 2013 2014 2015 2016
Import by type (CHF/liter)
Sparkling Bottled Bulk
import by type (ChF/liter)
il corriere vinicolo n. 23July 17, 2017 20 BYNUWBERSWINE
W
Bo
ttled
by co
un
tryS
pa
rklin
g b
y cou
ntry
bottled (million liters) evolUtion volUme (Cagr. %)
evolUtion valUe (Cagr. %)
evolUtion priCes (Cagr. %)
bottled (million ChF)
bottled (ChF/liter)
sparkling (million liters) evolUtion volUme (Cagr. %)
sparkling (million ChF) evolUtion valUe (Cagr. %)
0
5
10
15
20
25
30
35
40
45
2007 2008 2009 2010 2011 2012 2013 2014 2015 2016
Bottled (million liters)
Italy France Spain Germany Portugal
0
50
100
150
200
250
300
350
2007 2008 2009 2010 2011 2012 2013 2014 2015 2016
Bottled (million CHF)
Italy France Spain Germany Portugal
2,00
4,00
6,00
8,00
10,00
12,00
14,00
16,00
18,00
20,00
2007 2008 2009 2010 2011 2012 2013 2014 2015 2016
Bottled (CHF/liter)
Italy France Spain Germany Portugal
0
2
4
6
8
10
12
2007 2008 2009 2010 2011 2012 2013 2014 2015 2016
Sparkling (million liters)
France Italy Spain
0
20
40
60
80
100
120
140
160
2007 2008 2009 2010 2011 2012 2013 2014 2015 2016
Sparkling (million CHF)
France Italy Spain
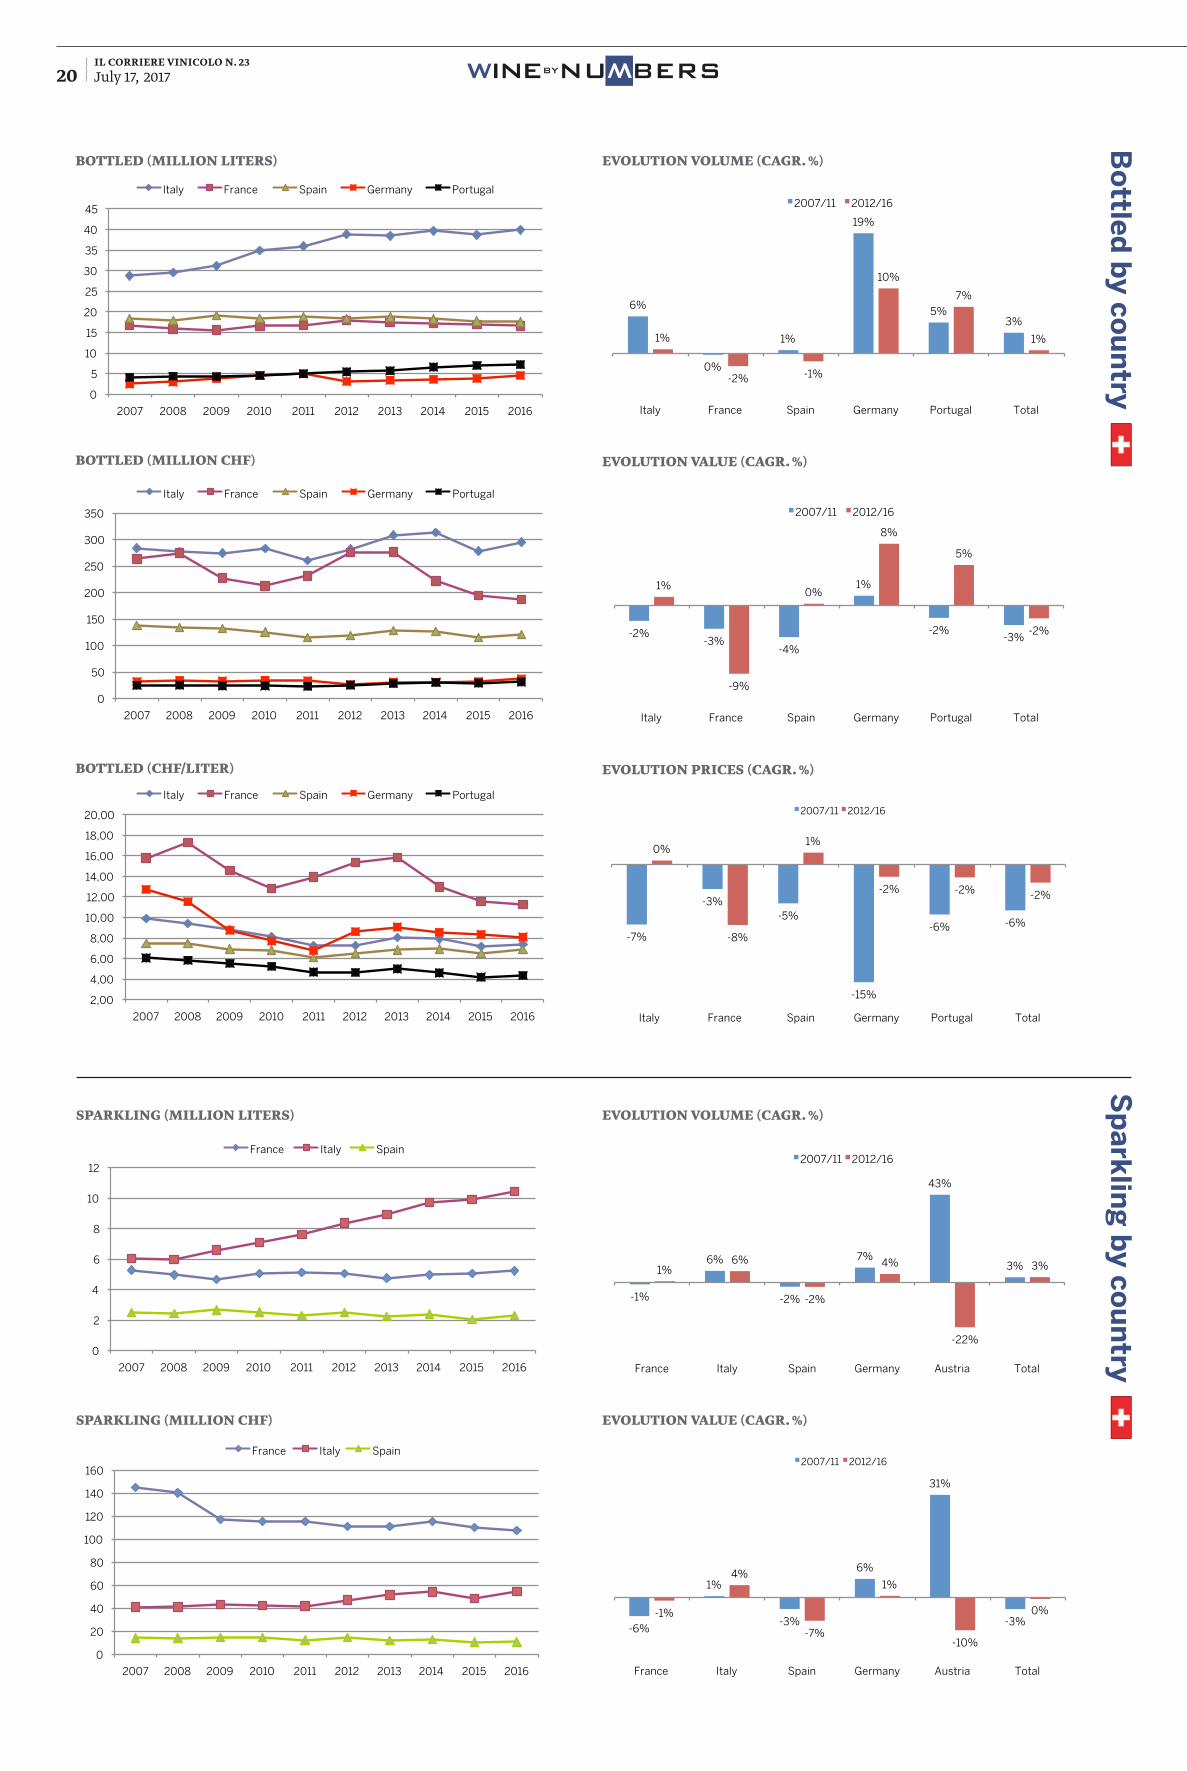
6%
0%
1%
19%
5% 3%
1%
-2% -1%
10%
7%
1%
Italy France Spain Germany Portugal Total
Evolution volume (Cagr %)
2007/11 2012/16
-2% -3%
-4%
1%
-2% -3%
1%
-9%
0%
8%
5%
-2%
Italy France Spain Germany Portugal Total
Evolution value (Cagr %)
2007/11 2012/16
-7%
-3% -5%
-15%
-6% -6%
0%
-8%
1%
-2% -2% -2%
Italy France Spain Germany Portugal Total
Evolution prices (Cagr %)
2007/11 2012/16
-1%
6%
-2%
7%
43%
3% 1% 6%
-2%
4%
-22%
3%
France Italy Spain Germany Austria Total
Evolution volume (Cagr %)
2007/11 2012/16
-6%
1%
-3%
6%
31%
-3% -1%
4%
-7%
1%
-10%
0%
France Italy Spain Germany Austria Total
Evolution value (Cagr %)
2007/11 2012/16
il corriere vinicolo n. 23July 17, 2017 21BYNUWBERSWINE
W
Sp
ark
ling
by co
un
tryB
ulk
by co
un
try
sparkling (ChF/liter) evolUtion priCes (Cagr. %)
evolUtion volUme (Cagr. %)
evolUtion valUe (Cagr. %)
evolUtion priCes (Cagr. %)
bUlk (million liters)
bUlk (million ChF)
bUlk (ChF/liter)
15,00
17,00
19,00
21,00
23,00
25,00
27,00
29,00
4,00
4,50
5,00
5,50
6,00
6,50
7,00
7,50
2007 2008 2009 2010 2011 2012 2013 2014 2015 2016
Sparkling (CHF/liter)
France (right axis) Italy Spain
0
5
10
15
20
25
30
35
2007 2008 2009 2010 2011 2012 2013 2014 2015 2016
Bulk (million liters)
Italy France Spain Portugal
0
10
20
30
40
50
60
2007 2008 2009 2010 2011 2012 2013 2014 2015 2016
Bulk (million CHF)
Italy France Spain Portugal
0,00
0,50
1,00
1,50
2,00
2,50
2007 2008 2009 2010 2011 2012 2013 2014 2015 2016
Bulk (CHF/liter)
Italy France Spain Portugal
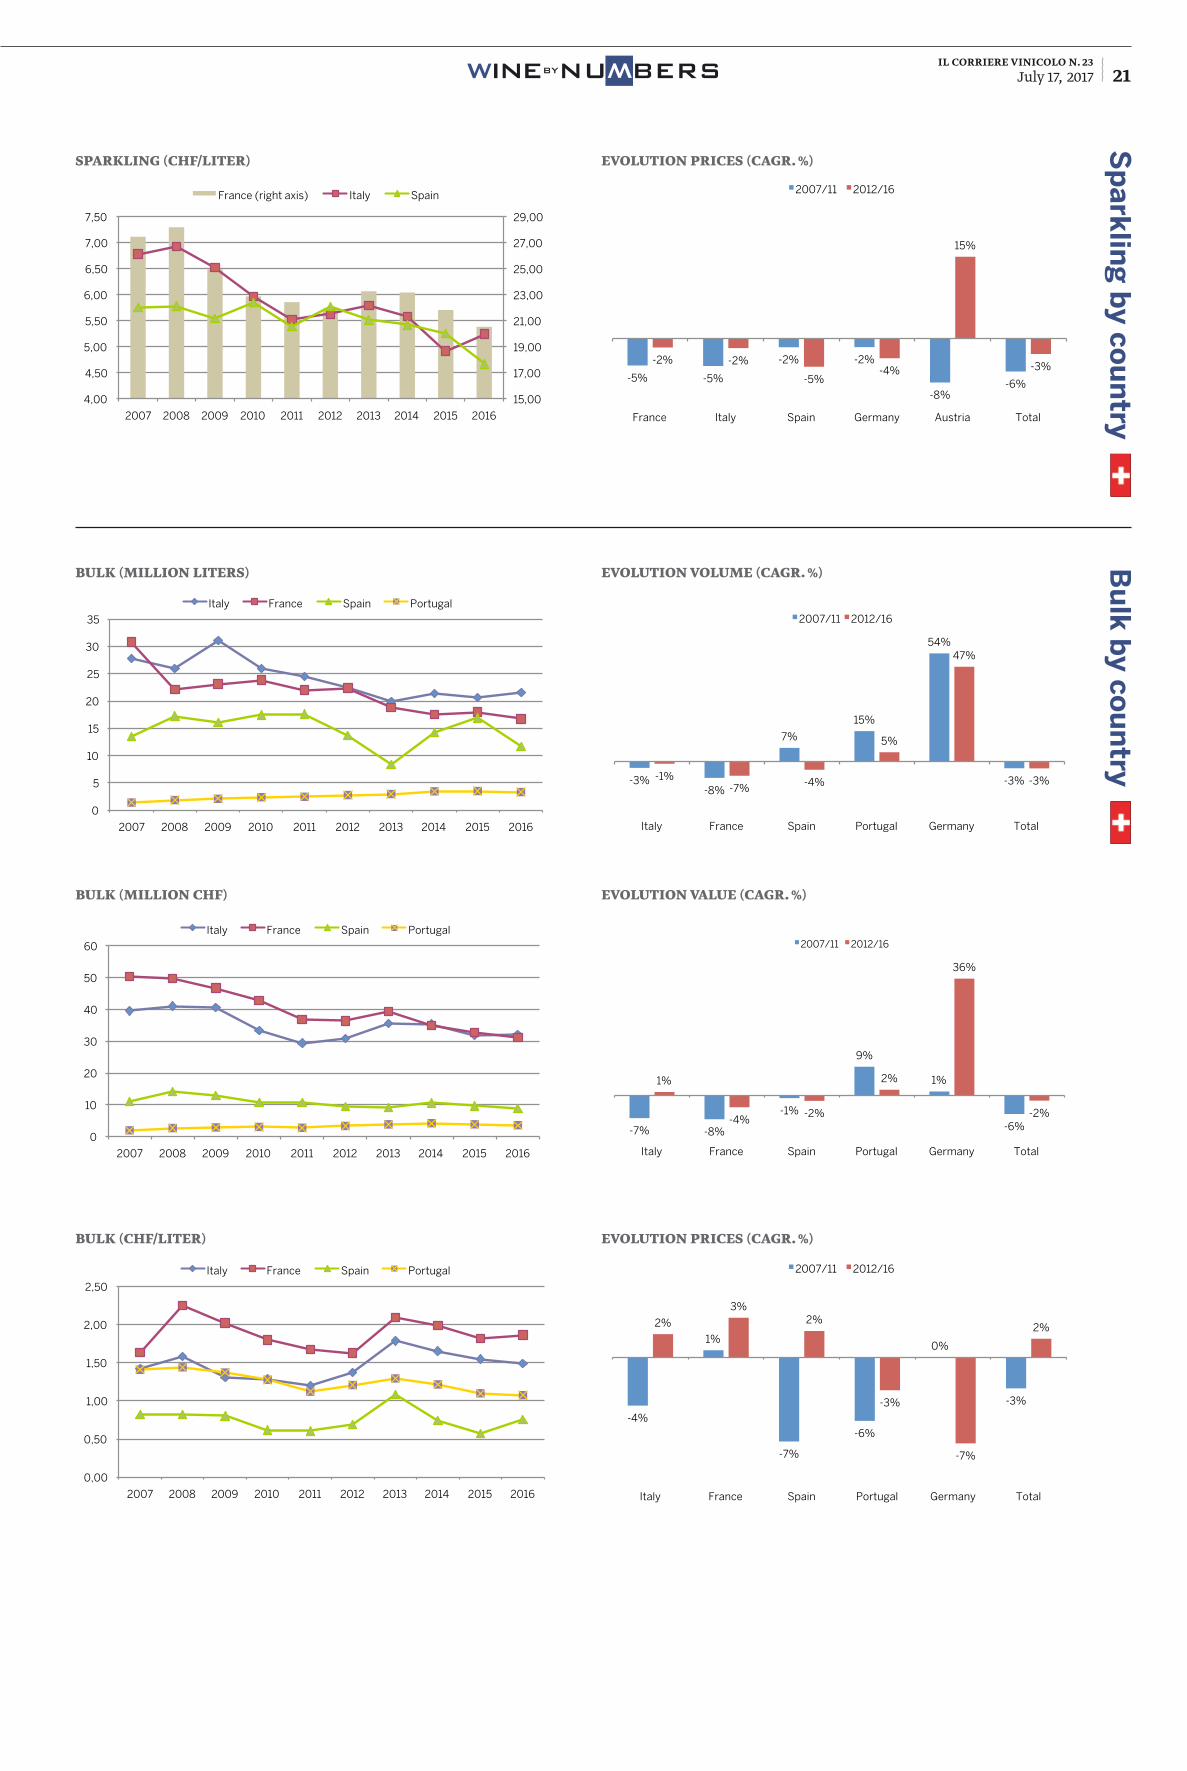
-5% -5%
-2% -2%
-8% -6%
-2% -2%
-5% -4%
15%
-3%
France Italy Spain Germany Austria Total
Evolution prices (Cagr %)
2007/11 2012/16
-3% -8%
7%
15%
54%
-3% -1% -7% -4%
5%
47%
-3%
Italy France Spain Portugal Germany Total
Evolution volume (Cagr %)
2007/11 2012/16
-7% -8%
-1%
9%
1%
-6%
1%
-4% -2%
2%
36%
-2%
Italy France Spain Portugal Germany Total
Evolution value (Cagr %)
2007/11 2012/16
-4%
1%
-7%
-6%
0%
-3%
2%
3% 2%
-3%
-7%
2%
Italy France Spain Portugal Germany Total
Evolution prices (Cagr %)
2007/11 2012/16
il corriere vinicolo n. 23July 17, 2017 22 BYNUWBERSWINE
W
th. liters 2007 2008 2009 2010 2011 2012 2013 2014 2015 2016Sparkling 15.646 19.388 18.251 27.931 36.515 31.456 36.884 37.120 24.072 26.416
Bottled 225.108 226.217 181.555 225.601 246.142 255.964 275.794 258.032 175.713 183.770
Bulk 26.659 34.946 158.866 293.100 228.519 202.535 186.625 172.457 200.005 193.771
Total 267.412 280.551 358.671 546.632 511.176 489.955 499.303 467.609 399.789 403.958
th. Us$ 2007 2008 2009 2010 2011 2012 2013 2014 2015 2016Sparkling 113.249 144.694 96.006 164.002 217.322 189.169 238.320 210.717 105.285 116.590
Bottled 439.896 540.362 398.742 504.030 639.772 723.650 845.684 822.422 485.201 512.341
Bulk 25.571 36.240 92.157 154.891 139.494 147.636 139.959 108.438 100.928 98.932
Total 578.715 721.297 586.905 822.924 996.589 1.060.456 1.223.964 1.141.577 691.413 727.863
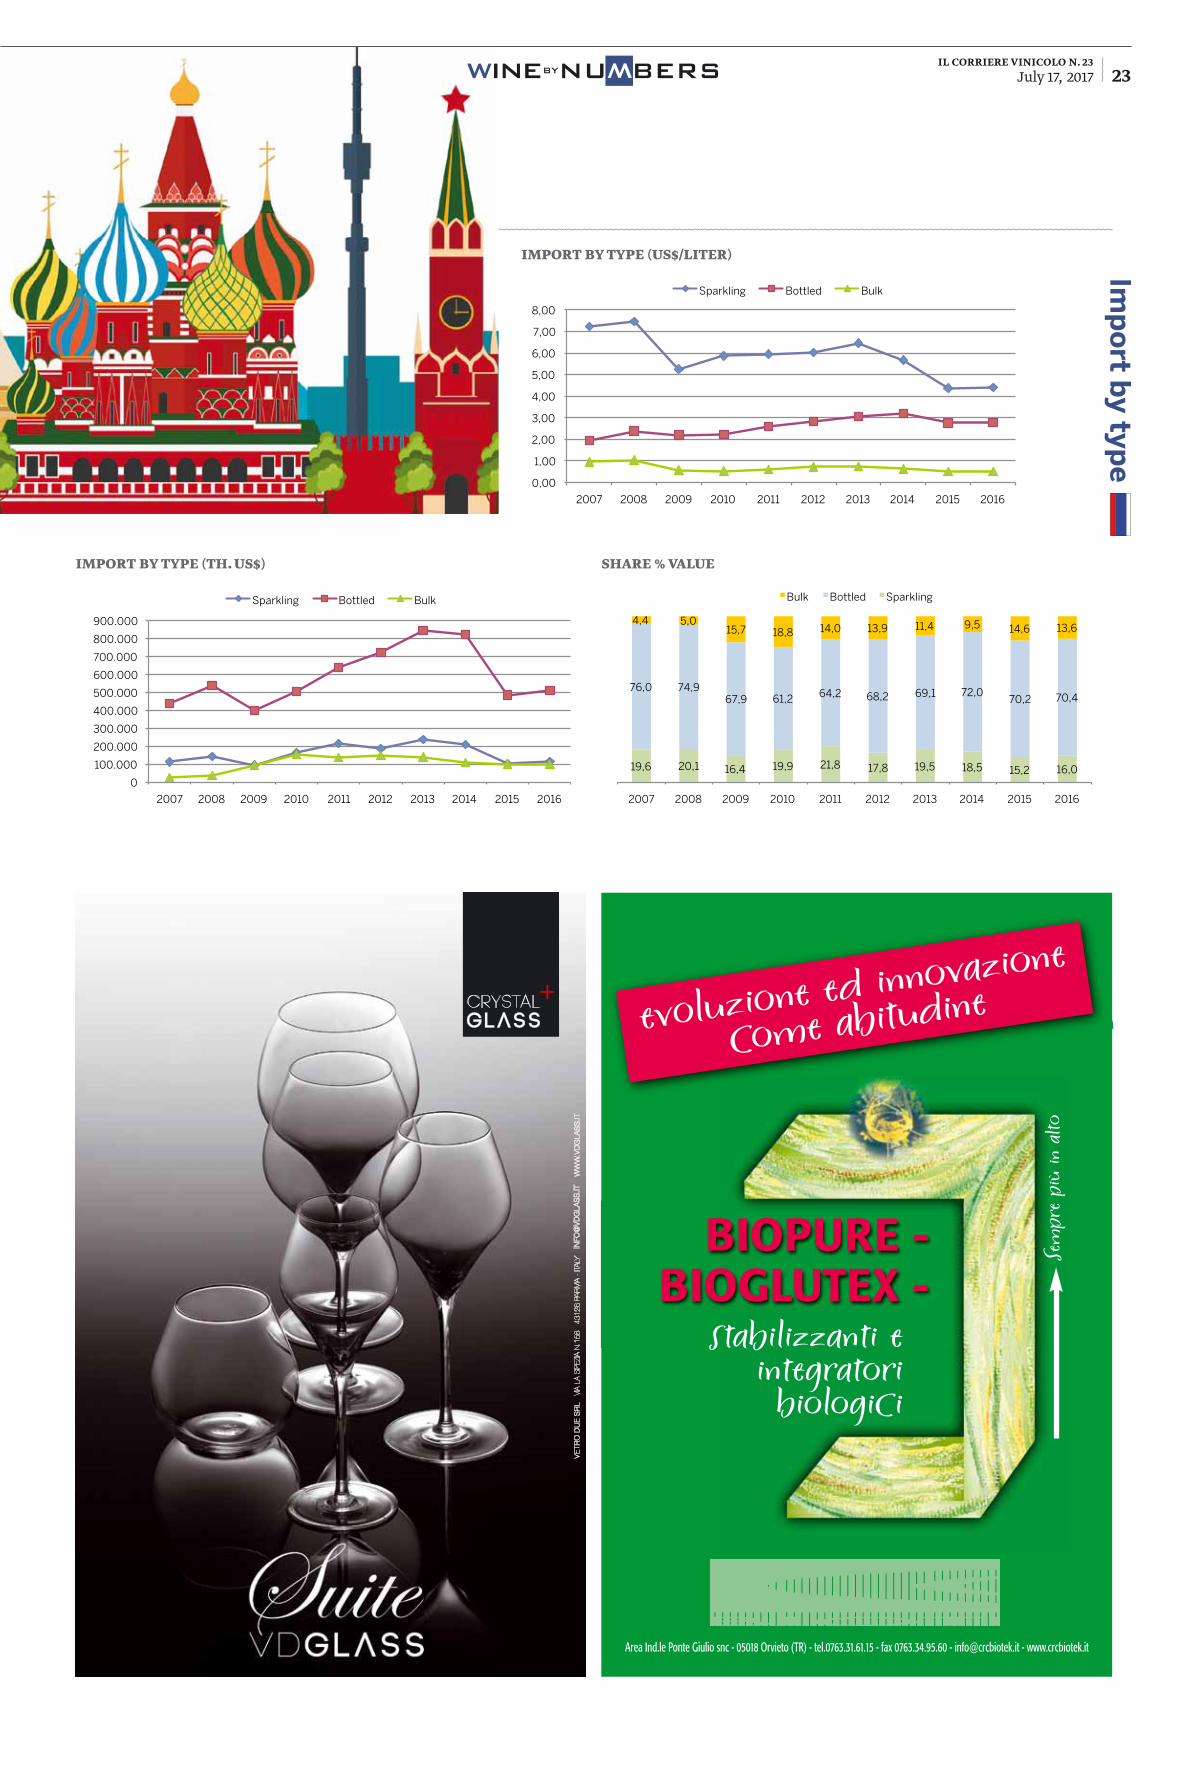
Us$/liter 2007 2008 2009 2010 2011 2012 2013 2014 2015 2016Sparkling 7,24 7,46 5,26 5,87 5,95 6,01 6,46 5,68 4,37 4,41
Bottled 1,95 2,39 2,20 2,23 2,60 2,83 3,07 3,19 2,76 2,79
Bulk 0,96 1,04 0,58 0,53 0,61 0,73 0,75 0,63 0,50 0,51
Total 2,16 2,57 1,64 1,51 1,95 2,16 2,45 2,44 1,73 1,80
Russia
Import by type
import by type (th. liters) share % volUme
0
50.000
100.000
150.000
200.000
250.000
300.000
350.000
2007 2008 2009 2010 2011 2012 2013 2014 2015 2016
Import by type (th. liters)
Sparkling Bottled Bulk
5,9 6,9 5,1 5,1 7,1 6,4 7,4 7,9 6,0 6,5
84,2 80,6
50,6 41,3
48,2 52,2 55,2 55,2 44,0 45,5
10,0 12,5
44,3 53,6
44,7 41,3 37,4 36,9 50,0 48,0
2007 2008 2009 2010 2011 2012 2013 2014 2015 2016
Import by type (share % volume)
Bulk Bottled Sparkling
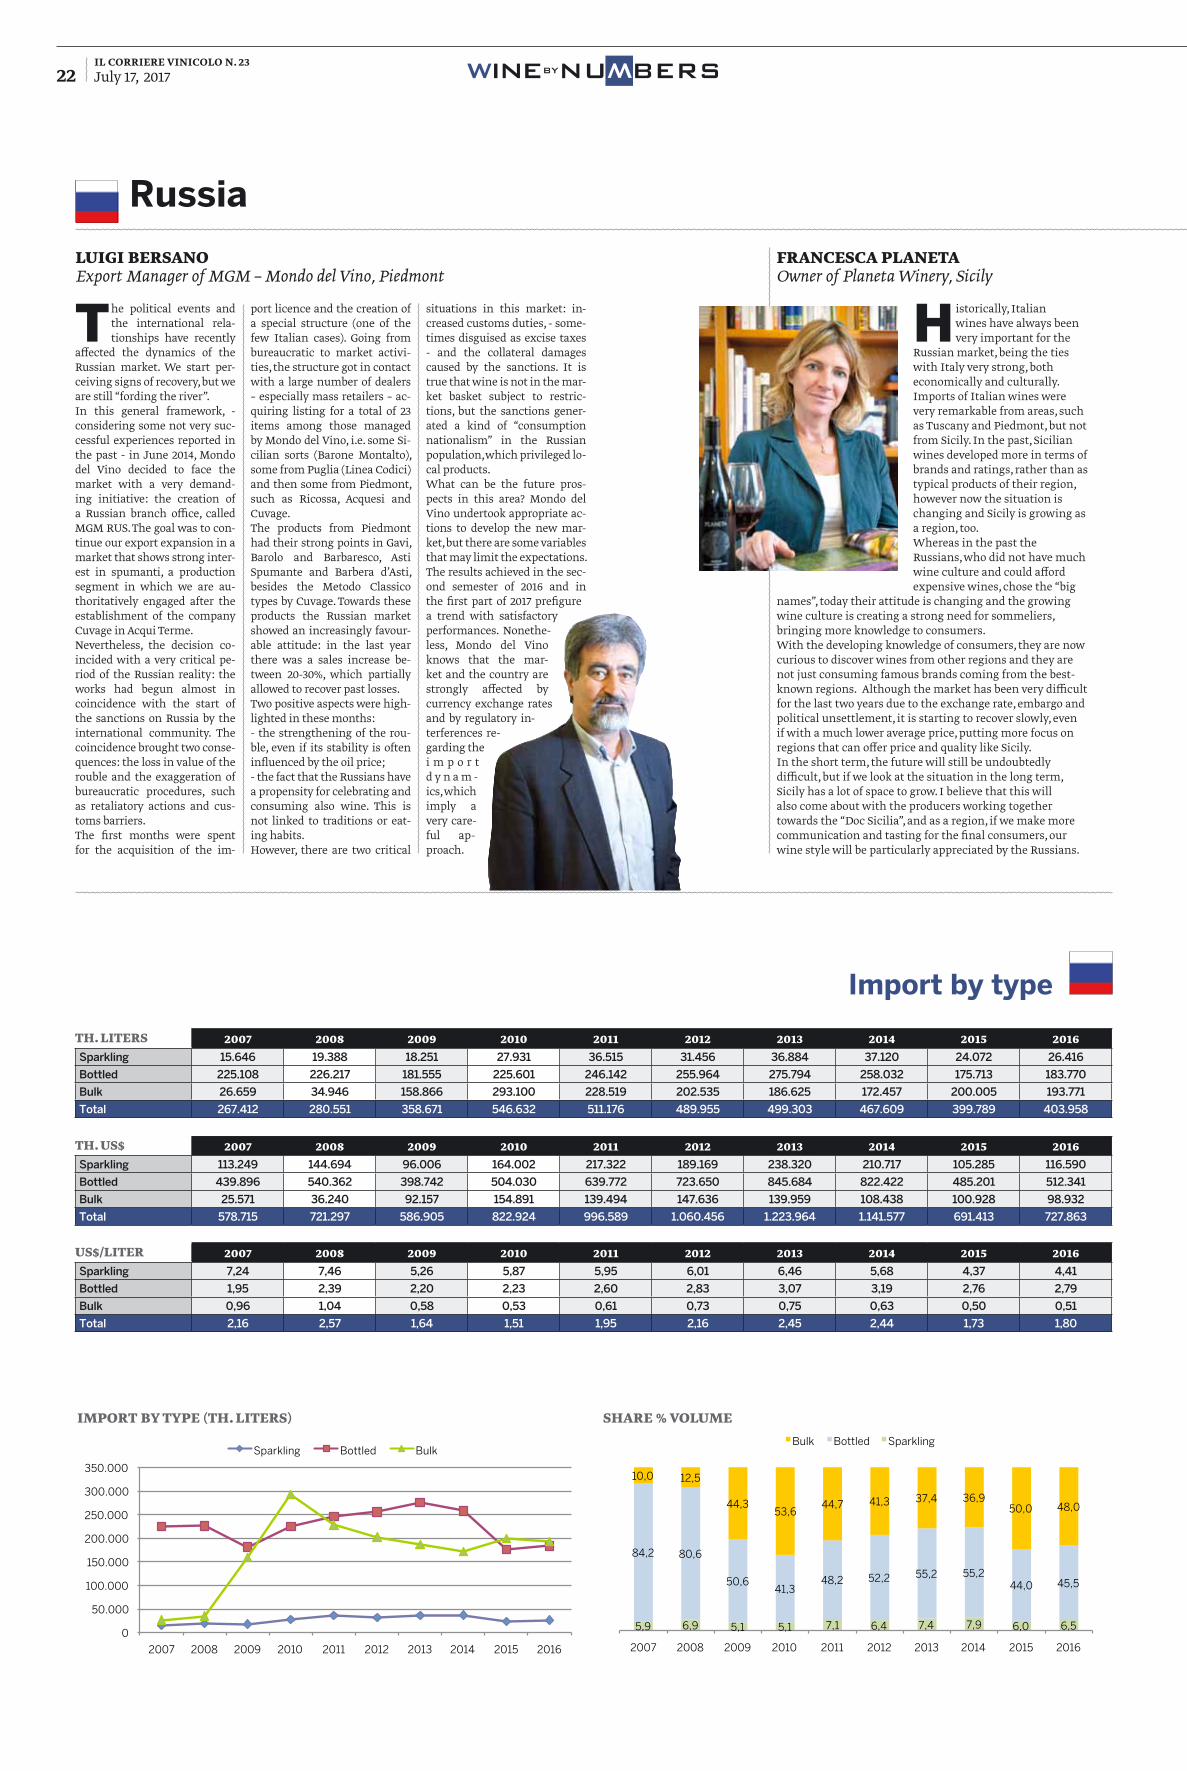
The political events and the international rela-tionships have recently
affected the dynamics of the Russian market. We start per-ceiving signs of recovery, but we are still “fording the river”.In this general framework, - considering some not very suc-cessful experiences reported in the past - in June 2014, Mondo del Vino decided to face the market with a very demand-ing initiative: the creation of a Russian branch office, called MGM RUS. The goal was to con-tinue our export expansion in a market that shows strong inter-est in spumanti, a production segment in which we are au-thoritatively engaged after the establishment of the company Cuvage in Acqui Terme.Nevertheless, the decision co-incided with a very critical pe-riod of the Russian reality: the works had begun almost in coincidence with the start of the sanctions on Russia by the international community. The coincidence brought two conse-quences: the loss in value of the rouble and the exaggeration of bureaucratic procedures, such as retaliatory actions and cus-toms barriers.The first months were spent for the acquisition of the im-
port licence and the creation of a special structure (one of the few Italian cases). Going from bureaucratic to market activi-ties, the structure got in contact with a large number of dealers – especially mass retailers – ac-quiring listing for a total of 23 items among those managed by Mondo del Vino, i.e. some Si-cilian sorts (Barone Montalto), some from Puglia (Linea Codici) and then some from Piedmont, such as Ricossa, Acquesi and Cuvage. The products from Piedmont had their strong points in Gavi, Barolo and Barbaresco, Asti Spumante and Barbera d’Asti, besides the Metodo Classico types by Cuvage. Towards these products the Russian market showed an increasingly favour-able attitude: in the last year there was a sales increase be-tween 20-30%, which partially allowed to recover past losses.Two positive aspects were high-lighted in these months:- the strengthening of the rou-ble, even if its stability is often influenced by the oil price;- the fact that the Russians have a propensity for celebrating and consuming also wine. This is not linked to traditions or eat-ing habits.However, there are two critical
H istorically, Italian wines have always been very important for the
Russian market, being the ties with Italy very strong, both economically and culturally. Imports of Italian wines were very remarkable from areas, such as Tuscany and Piedmont, but not from Sicily. In the past, Sicilian wines developed more in terms of brands and ratings, rather than as typical products of their region, however now the situation is changing and Sicily is growing as a region, too.Whereas in the past the Russians, who did not have much wine culture and could afford expensive wines, chose the “big
names”, today their attitude is changing and the growing wine culture is creating a strong need for sommeliers, bringing more knowledge to consumers. With the developing knowledge of consumers, they are now curious to discover wines from other regions and they are not just consuming famous brands coming from the best-known regions. Although the market has been very difficult for the last two years due to the exchange rate, embargo and political unsettlement, it is starting to recover slowly, even if with a much lower average price, putting more focus on regions that can offer price and quality like Sicily. In the short term, the future will still be undoubtedly difficult, but if we look at the situation in the long term, Sicily has a lot of space to grow. I believe that this will also come about with the producers working together towards the “Doc Sicilia”, and as a region, if we make more communication and tasting for the final consumers, our wine style will be particularly appreciated by the Russians.
lUigi bersano Export Manager of MGM – Mondo del Vino, Piedmont
FranCesCa planeta Owner of Planeta Winery, Sicily
situations in this market: in-creased customs duties, - some-times disguised as excise taxes - and the collateral damages caused by the sanctions. It is true that wine is not in the mar-ket basket subject to restric-tions, but the sanctions gener-ated a kind of “consumption nationalism” in the Russian population, which privileged lo-cal products.What can be the future pros-pects in this area? Mondo del Vino undertook appropriate ac-tions to develop the new mar-ket, but there are some variables that may limit the expectations. The results achieved in the sec-ond semester of 2016 and in the first part of 2017 prefigure a trend with satisfactory performances. Nonethe-less, Mondo del Vino knows that the mar-ket and the country are strongly affected by currency exchange rates and by regulatory in-terferences re-garding the i m p o r t d y n a m -ics, which imply a very care-ful ap-proach.
il corriere vinicolo n. 23July 17, 2017 23
BIOPURE -BIOGLUTEX -
Sem
pre
più
in a
ltoevoluzione ed innovazione
come abitudine
Area Ind.le Ponte Giulio snc - 05018 Orvieto (TR) - tel.0763.31.61.15 - fax 0763.34.95.60 - [email protected] - www.crcbiotek.it
stabilizzanti eintegratori biologici
BIOPURE rivista 13,5x20,8_Layout 1 04/07/17 11.29 Pagina 1
import by type (Us$/liter)
0,00
1,00
2,00
3,00
4,00
5,00
6,00
7,00
8,00
2007 2008 2009 2010 2011 2012 2013 2014 2015 2016
Import by type ($/liter)
Sparkling Bottled Bulk
import by type (th. Us$) share % valUe
0
100.000
200.000
300.000
400.000
500.000
600.000
700.000
800.000
900.000
2007 2008 2009 2010 2011 2012 2013 2014 2015 2016
Import by type (th. $)
Sparkling Bottled Bulk
19,6 20,1 16,4 19,9 21,8 17,8 19,5 18,5 15,2 16,0
76,0 74,9 67,9 61,2 64,2 68,2 69,1 72,0
70,2 70,4
4,4 5,0 15,7 18,8 14,0 13,9 11,4 9,5 14,6 13,6
2007 2008 2009 2010 2011 2012 2013 2014 2015 2016
Import by type (share % value)
Bulk Bottled Sparkling
Imp
ort b
y type
BYNUWBERSWINE
W
il corriere vinicolo n. 23July 17, 2017 24 BYNUWBERSWINE
W
sparkling (th. Us$) evolUtion valUe (Cagr. %)
Bo
ttled
by co
un
tryS
pa
rklin
g b
y cou
ntry
bottled (th. liters) evolUtion volUme (Cagr. %)
evolUtion valUe (Cagr. %)
evolUtion priCes (Cagr. %)
bottled (th. Us$)
bottled (Us$/liter)
sparkling (th. liters) evolUtion volUme (Cagr. %)
0
50.000
100.000
150.000
200.000
250.000
2007 2008 2009 2010 2011 2012 2013 2014 2015 2016
Bottled (th. $)
Italy France Spain Abkhazia Chile
0
10.000
20.000
30.000
40.000
50.000
60.000
2007 2008 2009 2010 2011 2012 2013 2014 2015 2016
Bottled (th. liters))
Italy France Spain Abkhazia Chile
0,50
1,00
1,50
2,00
2,50
3,00
3,50
4,00
4,50
2007 2008 2009 2010 2011 2012 2013 2014 2015 2016
Bottled ($/lliter)
Italy France Spain Abkhazia Chile
0
5.000
10.000
15.000
20.000
25.000
30.000
2007 2008 2009 2010 2011 2012 2013 2014 2015 2016
Sparkling (th. liters)
Italy France Spain Ukraine Moldova
0
20.000
40.000
60.000
80.000
100.000
120.000
140.000
160.000
2007 2008 2009 2010 2011 2012 2013 2014 2015 2016
Sparkling (th. $)
Italy France Spain Ukraine Moldova
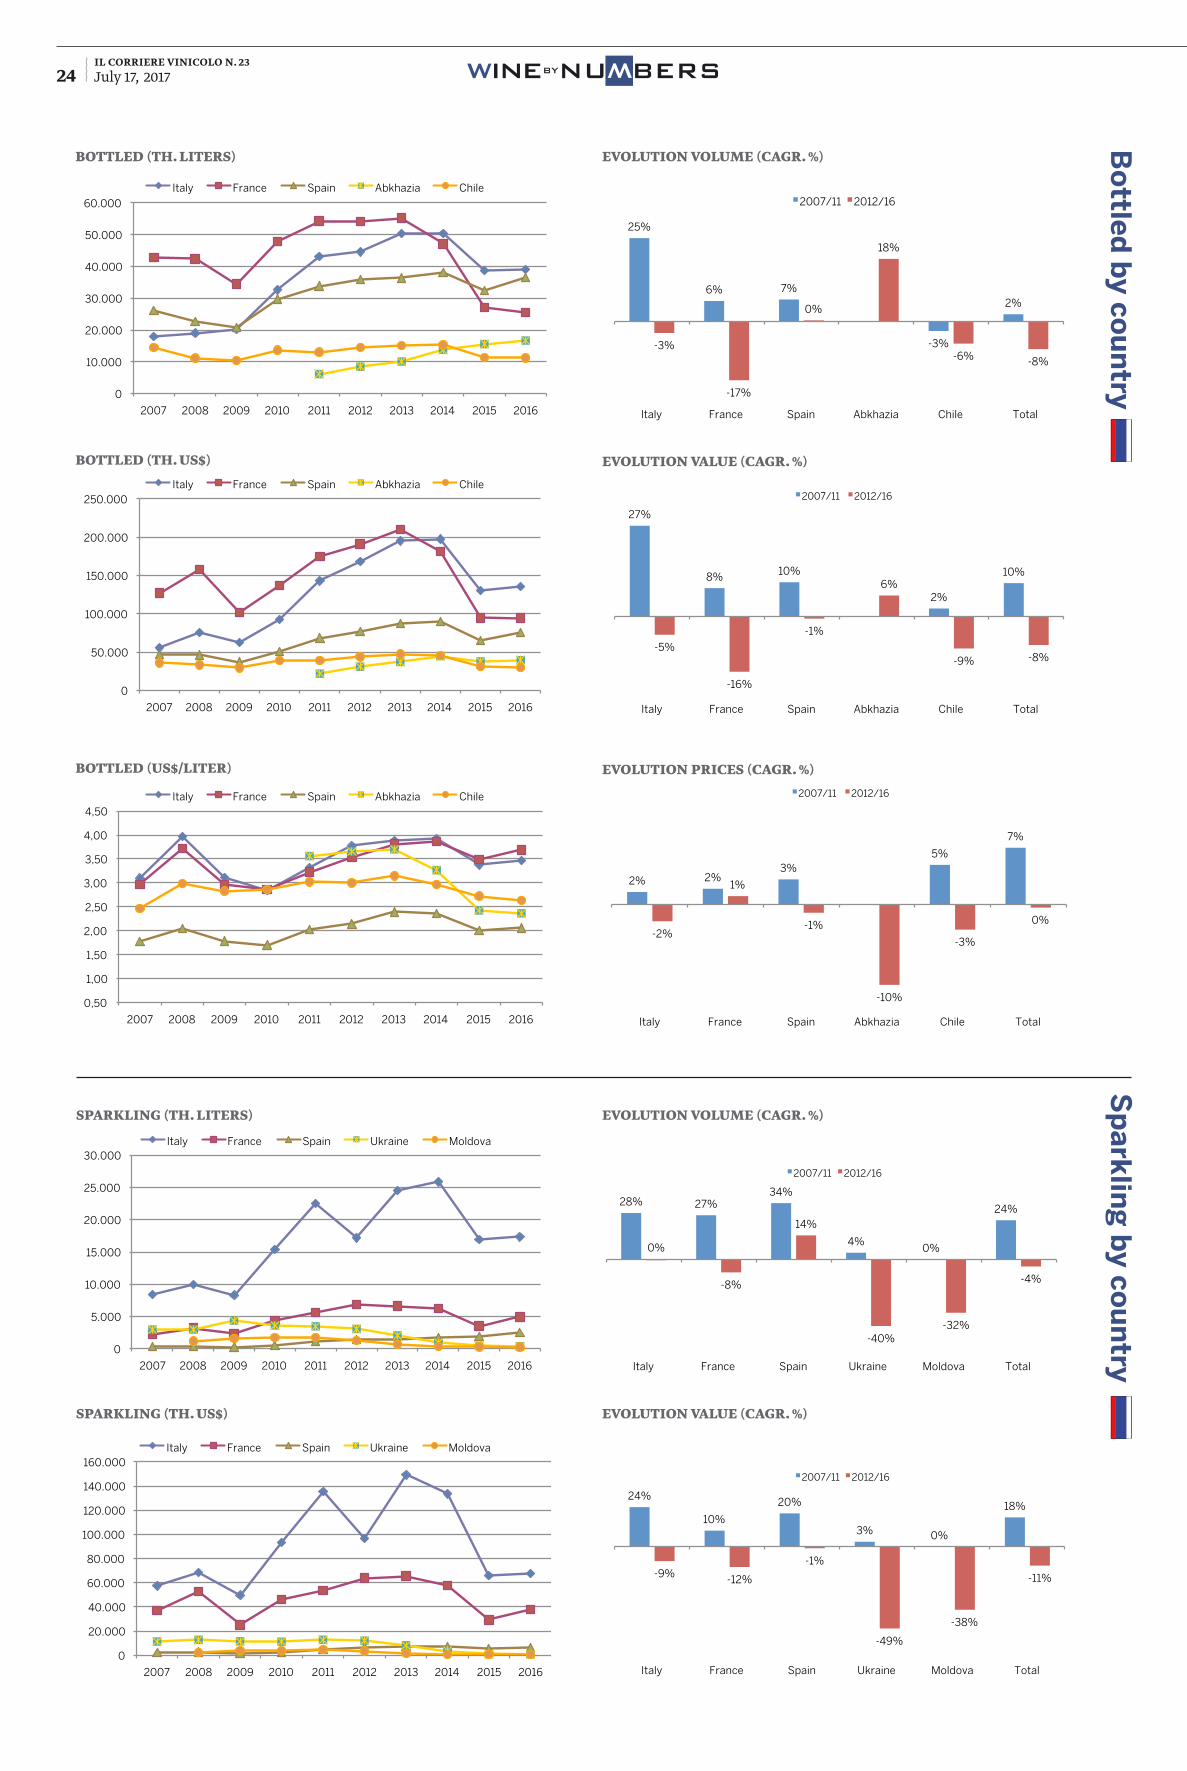
27%
8% 10%
2%
10%
-5%
-16%
-1%
6%
-9% -8%
Italy France Spain Abkhazia Chile Total
Evolution value (Cagr %)
2007/11 2012/16
25%
6% 7%
-3%
2%
-3%
-17%
0%
18%
-6% -8%
Italy France Spain Abkhazia Chile Total
Evolution volume (Cagr %)
2007/11 2012/16
2% 2% 3%
5%
7%
-2%
1%
-1%
-10%
-3%
0%
Italy France Spain Abkhazia Chile Total
Evolution prices (Cagr %)
2007/11 2012/16
28% 27% 34%
4% 0%
24%
0%
-8%
14%
-40% -32%
-4%
Italy France Spain Ukraine Moldova Total
Evolution volume (Cagr %)
2007/11 2012/16
24%
10%
20%
3% 0%
18%
-9% -12%
-1%
-49%
-38%
-11%
Italy France Spain Ukraine Moldova Total
Evolution value (Cagr %)
2007/11 2012/16
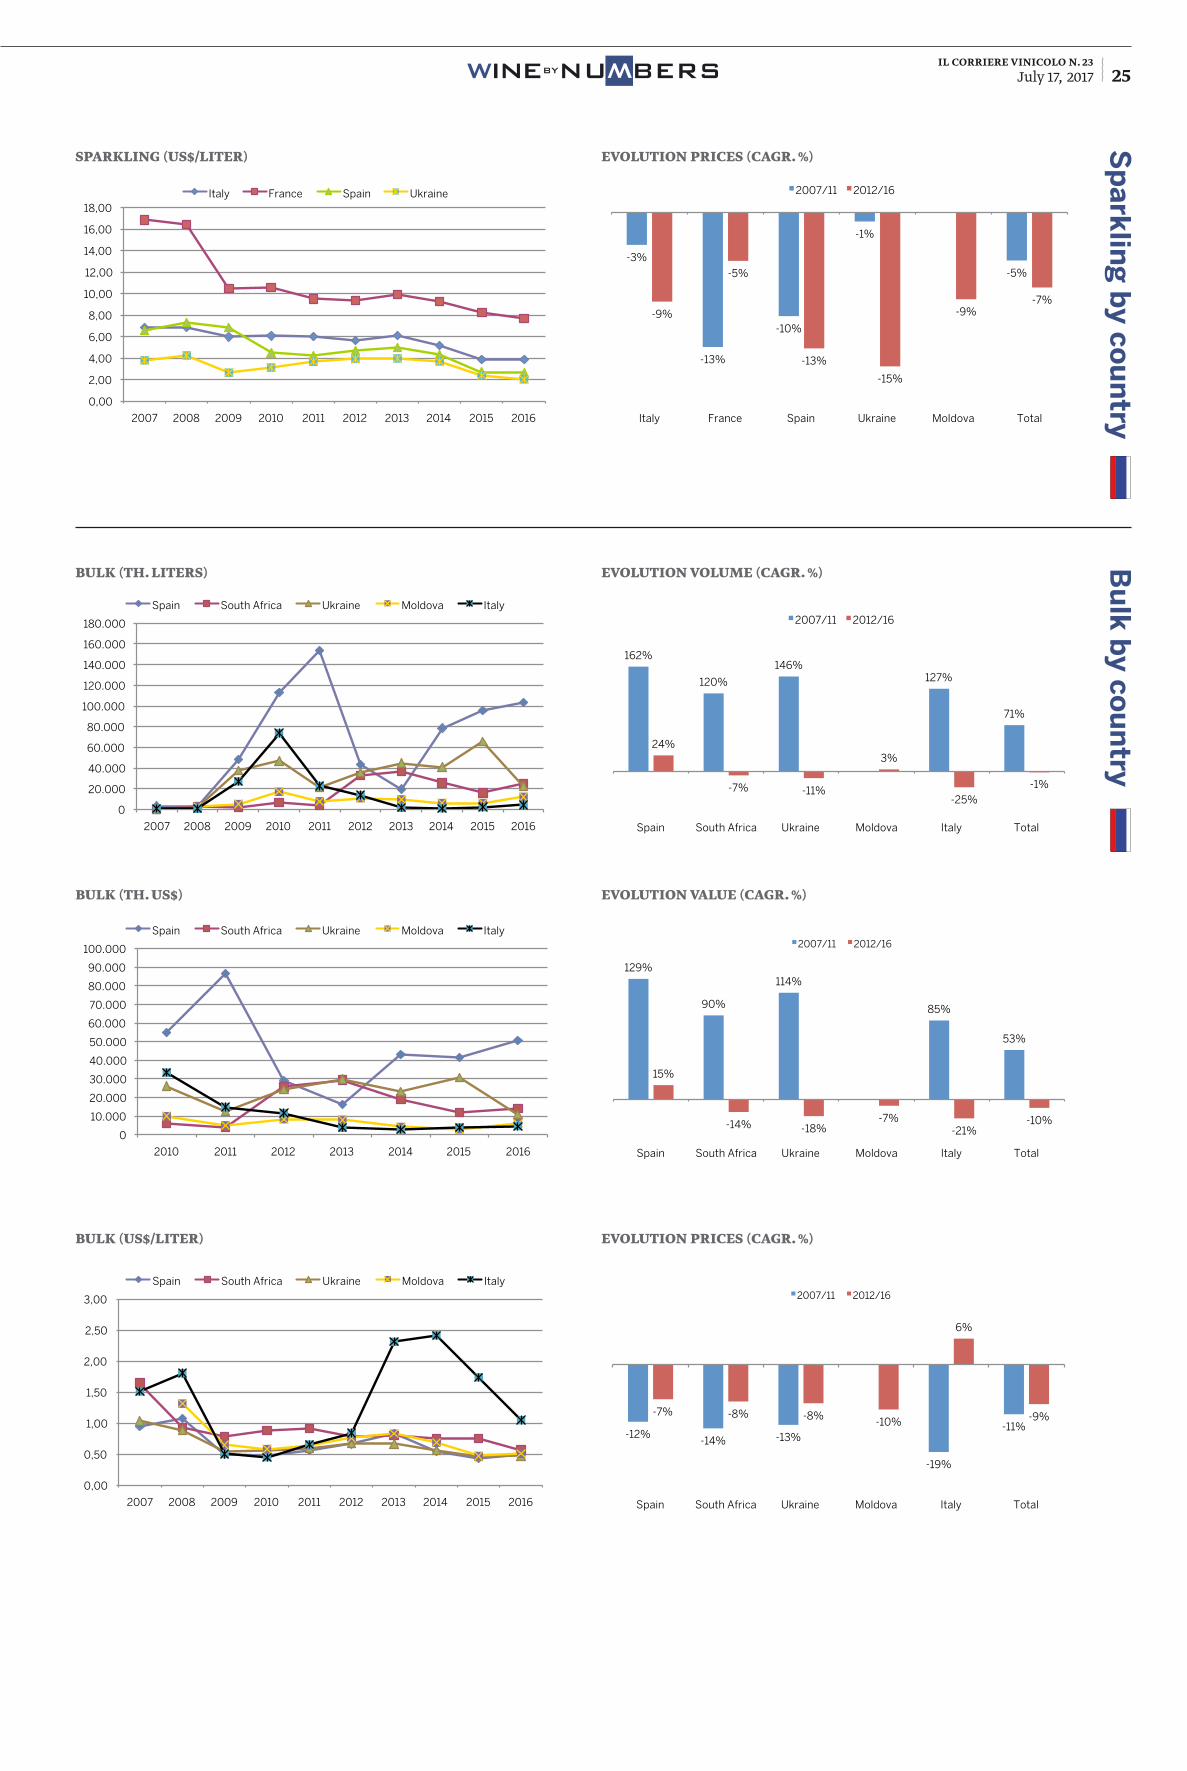
il corriere vinicolo n. 23July 17, 2017 25BYNUWBERSWINE
W
Bu
lk b
y cou
ntry
evolUtion volUme (Cagr. %)
evolUtion valUe (Cagr. %)
evolUtion priCes (Cagr. %)
bUlk (th. liters)
bUlk (th. Us$)
bUlk (Us$/liter)
Sp
ark
ling
by co
un
try
sparkling (Us$/liter) evolUtion priCes (Cagr. %)
0,00
2,00
4,00
6,00
8,00
10,00
12,00
14,00
16,00
18,00
2007 2008 2009 2010 2011 2012 2013 2014 2015 2016
Sparkling ($/liter)
Italy France Spain Ukraine
0
20.000
40.000
60.000
80.000
100.000
120.000
140.000
160.000
180.000
2007 2008 2009 2010 2011 2012 2013 2014 2015 2016
Bulk (th. liters)
Spain South Africa Ukraine Moldova Italy
0
10.000
20.000
30.000
40.000
50.000
60.000
70.000
80.000
90.000
100.000
2010 2011 2012 2013 2014 2015 2016
Bulk (th. $)
Spain South Africa Ukraine Moldova Italy
0,00
0,50
1,00
1,50
2,00
2,50
3,00
2007 2008 2009 2010 2011 2012 2013 2014 2015 2016
Bulk ($/liter)
Spain South Africa Ukraine Moldova Italy
-3%
-13%
-10%
-1%
-5%
-9%
-5%
-13%
-15%
-9% -7%
Italy France Spain Ukraine Moldova Total
Evolution prices (Cagr %)
2007/11 2012/16
162%
120%
146% 127%
71%
24%
-7% -11%
3%
-25% -1%
Spain South Africa Ukraine Moldova Italy Total
Evolution volume (Cagr %)
2007/11 2012/16
129%
90%
114%
85%
53%
15%
-14% -18% -7%
-21% -10%
Spain South Africa Ukraine Moldova Italy Total
Evolution value (Cagr %)
2007/11 2012/16
-12% -14% -13%
-19%
-11% -7% -8% -8% -10%
6%
-9%
Spain South Africa Ukraine Moldova Italy Total
Evolution prices (Cagr %)
2007/11 2012/16
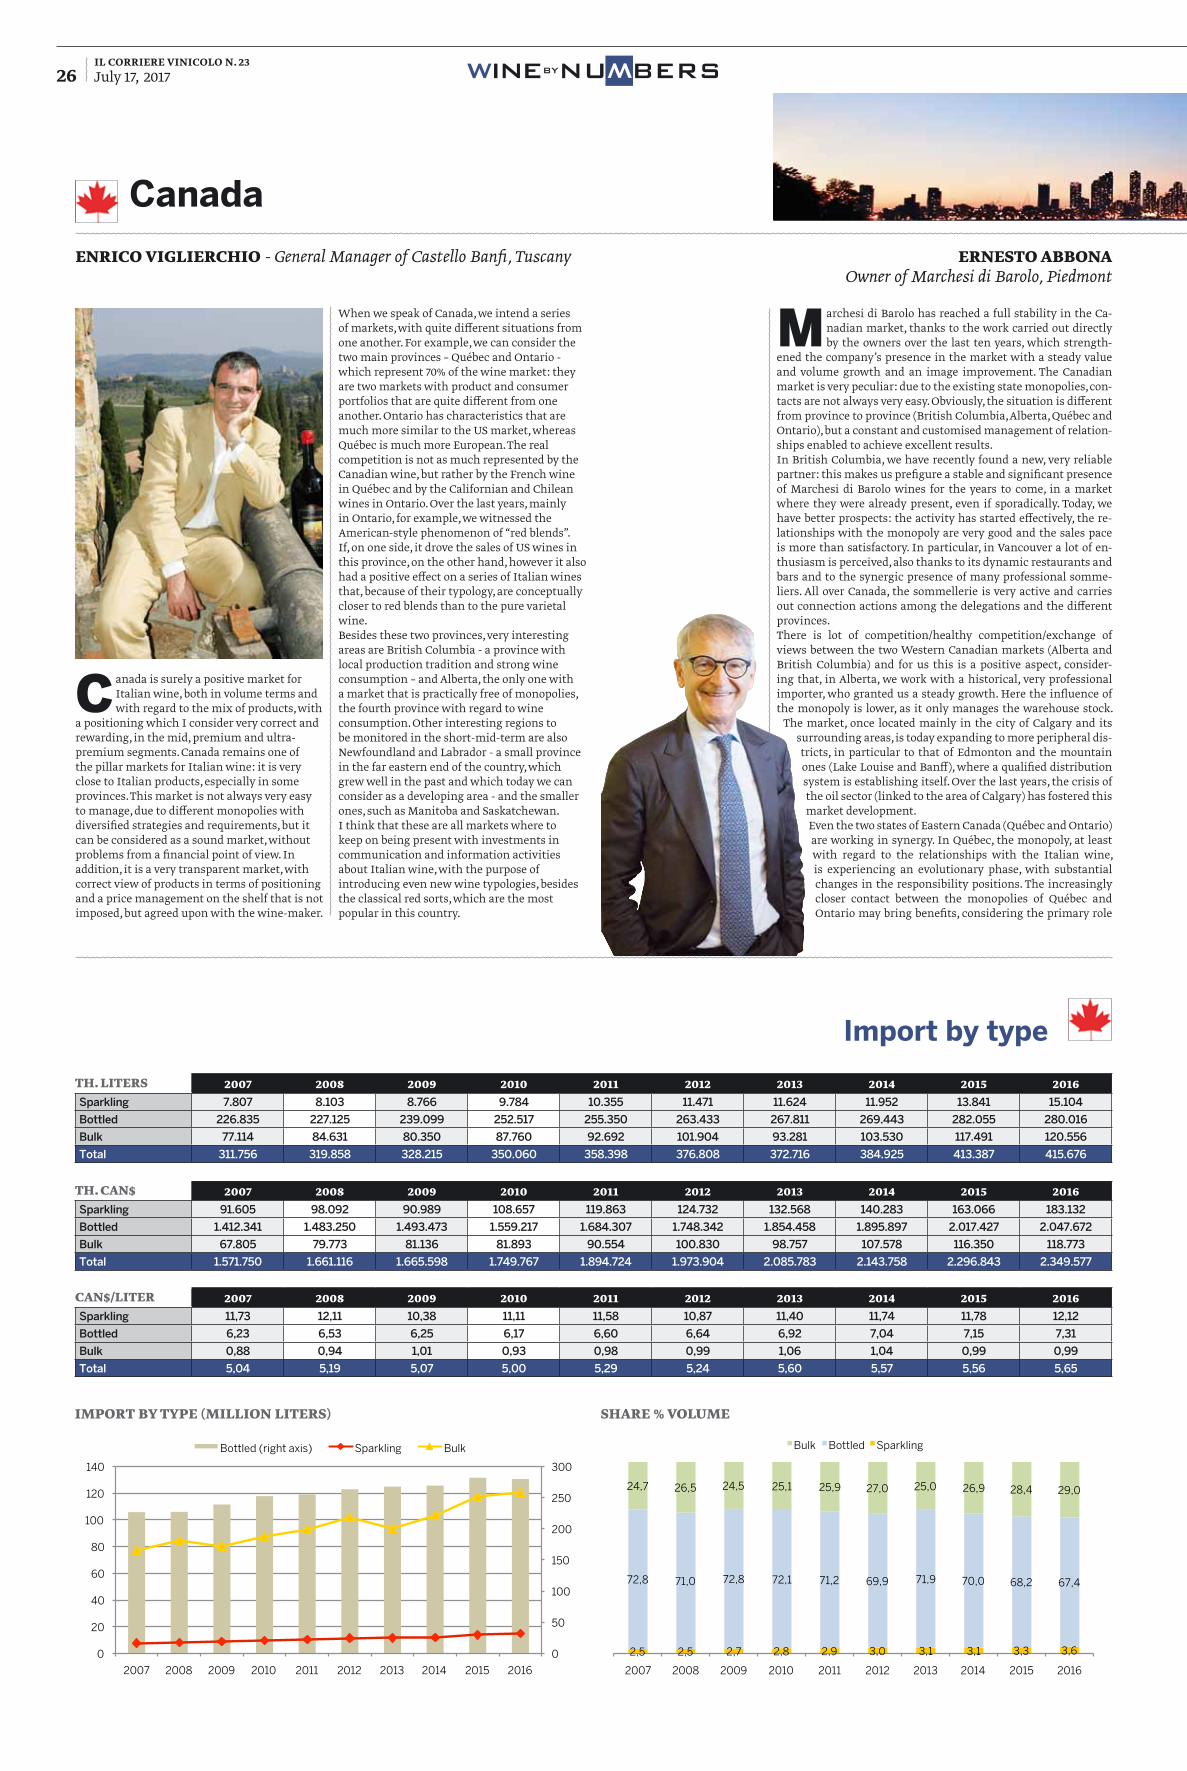
il corriere vinicolo n. 23July 17, 2017 26 BYNUWBERSWINE
W
th. liters 2007 2008 2009 2010 2011 2012 2013 2014 2015 2016Sparkling 7.807 8.103 8.766 9.784 10.355 11.471 11.624 11.952 13.841 15.104
Bottled 226.835 227.125 239.099 252.517 255.350 263.433 267.811 269.443 282.055 280.016
Bulk 77.114 84.631 80.350 87.760 92.692 101.904 93.281 103.530 117.491 120.556
Total 311.756 319.858 328.215 350.060 358.398 376.808 372.716 384.925 413.387 415.676
th. Can$ 2007 2008 2009 2010 2011 2012 2013 2014 2015 2016Sparkling 91.605 98.092 90.989 108.657 119.863 124.732 132.568 140.283 163.066 183.132
Bottled 1.412.341 1.483.250 1.493.473 1.559.217 1.684.307 1.748.342 1.854.458 1.895.897 2.017.427 2.047.672
Bulk 67.805 79.773 81.136 81.893 90.554 100.830 98.757 107.578 116.350 118.773
Total 1.571.750 1.661.116 1.665.598 1.749.767 1.894.724 1.973.904 2.085.783 2.143.758 2.296.843 2.349.577
Can$/liter 2007 2008 2009 2010 2011 2012 2013 2014 2015 2016Sparkling 11,73 12,11 10,38 11,11 11,58 10,87 11,40 11,74 11,78 12,12
Bottled 6,23 6,53 6,25 6,17 6,60 6,64 6,92 7,04 7,15 7,31
Bulk 0,88 0,94 1,01 0,93 0,98 0,99 1,06 1,04 0,99 0,99
Total 5,04 5,19 5,07 5,00 5,29 5,24 5,60 5,57 5,56 5,65
Canada
Import by type
import by type (million liters) share % volUme
0
50
100
150
200
250
300
0
20
40
60
80
100
120
140
2007 2008 2009 2010 2011 2012 2013 2014 2015 2016
Import by type (million liters)
Bottled (right axis) Sparkling Bulk
2,5 2,5 2,7 2,8 2,9 3,0 3,1 3,1 3,3 3,6
72,8 71,0 72,8 72,1 71,2 69,9 71,9 70,0 68,2 67,4
24,7 26,5 24,5 25,1 25,9 27,0 25,0 26,9 28,4 29,0
2007 2008 2009 2010 2011 2012 2013 2014 2015 2016
Share % volume
Bulk Bottled Sparkling
ernesto abbona Owner of Marchesi di Barolo, Piedmont
enriCo viglierChio - General Manager of Castello Banfi, Tuscany
Canada is surely a positive market for Italian wine, both in volume terms and with regard to the mix of products, with
a positioning which I consider very correct and rewarding, in the mid, premium and ultra-premium segments. Canada remains one of the pillar markets for Italian wine: it is very close to Italian products, especially in some provinces. This market is not always very easy to manage, due to different monopolies with diversified strategies and requirements, but it can be considered as a sound market, without problems from a financial point of view. In addition, it is a very transparent market, with correct view of products in terms of positioning and a price management on the shelf that is not imposed, but agreed upon with the wine-maker.
When we speak of Canada, we intend a series of markets, with quite different situations from one another. For example, we can consider the two main provinces – Québec and Ontario - which represent 70% of the wine market: they are two markets with product and consumer portfolios that are quite different from one another. Ontario has characteristics that are much more similar to the US market, whereas Québec is much more European. The real competition is not as much represented by the Canadian wine, but rather by the French wine in Québec and by the Californian and Chilean wines in Ontario. Over the last years, mainly in Ontario, for example, we witnessed the American-style phenomenon of “red blends”. If, on one side, it drove the sales of US wines in this province, on the other hand, however it also had a positive effect on a series of Italian wines that, because of their typology, are conceptually closer to red blends than to the pure varietal wine.Besides these two provinces, very interesting areas are British Columbia - a province with local production tradition and strong wine consumption – and Alberta, the only one with a market that is practically free of monopolies, the fourth province with regard to wine consumption. Other interesting regions to be monitored in the short-mid-term are also Newfoundland and Labrador - a small province in the far eastern end of the country, which grew well in the past and which today we can consider as a developing area - and the smaller ones, such as Manitoba and Saskatchewan.I think that these are all markets where to keep on being present with investments in communication and information activities about Italian wine, with the purpose of introducing even new wine typologies, besides the classical red sorts, which are the most popular in this country.
Marchesi di Barolo has reached a full stability in the Ca-nadian market, thanks to the work carried out directly by the owners over the last ten years, which strength-
ened the company’s presence in the market with a steady value and volume growth and an image improvement. The Canadian market is very peculiar: due to the existing state monopolies, con-tacts are not always very easy. Obviously, the situation is different from province to province (British Columbia, Alberta, Québec and Ontario), but a constant and customised management of relation-ships enabled to achieve excellent results.In British Columbia, we have recently found a new, very reliable partner: this makes us prefigure a stable and significant presence of Marchesi di Barolo wines for the years to come, in a market where they were already present, even if sporadically. Today, we have better prospects: the activity has started effectively, the re-lationships with the monopoly are very good and the sales pace is more than satisfactory. In particular, in Vancouver a lot of en-thusiasm is perceived, also thanks to its dynamic restaurants and bars and to the synergic presence of many professional somme-liers. All over Canada, the sommellerie is very active and carries out connection actions among the delegations and the different provinces.There is lot of competition/healthy competition/exchange of views between the two Western Canadian markets (Alberta and British Columbia) and for us this is a positive aspect, consider-ing that, in Alberta, we work with a historical, very professional importer, who granted us a steady growth. Here the influence of the monopoly is lower, as it only manages the warehouse stock.
The market, once located mainly in the city of Calgary and its surrounding areas, is today expanding to more peripheral dis-tricts, in particular to that of Edmonton and the mountain ones (Lake Louise and Banff), where a qualified distribution system is establishing itself. Over the last years, the crisis of the oil sector (linked to the area of Calgary) has fostered this market development.Even the two states of Eastern Canada (Québec and Ontario) are working in synergy. In Québec, the monopoly, at least with regard to the relationships with the Italian wine, is experiencing an evolutionary phase, with substantial changes in the responsibility positions. The increasingly closer contact between the monopolies of Québec and Ontario may bring benefits, considering the primary role
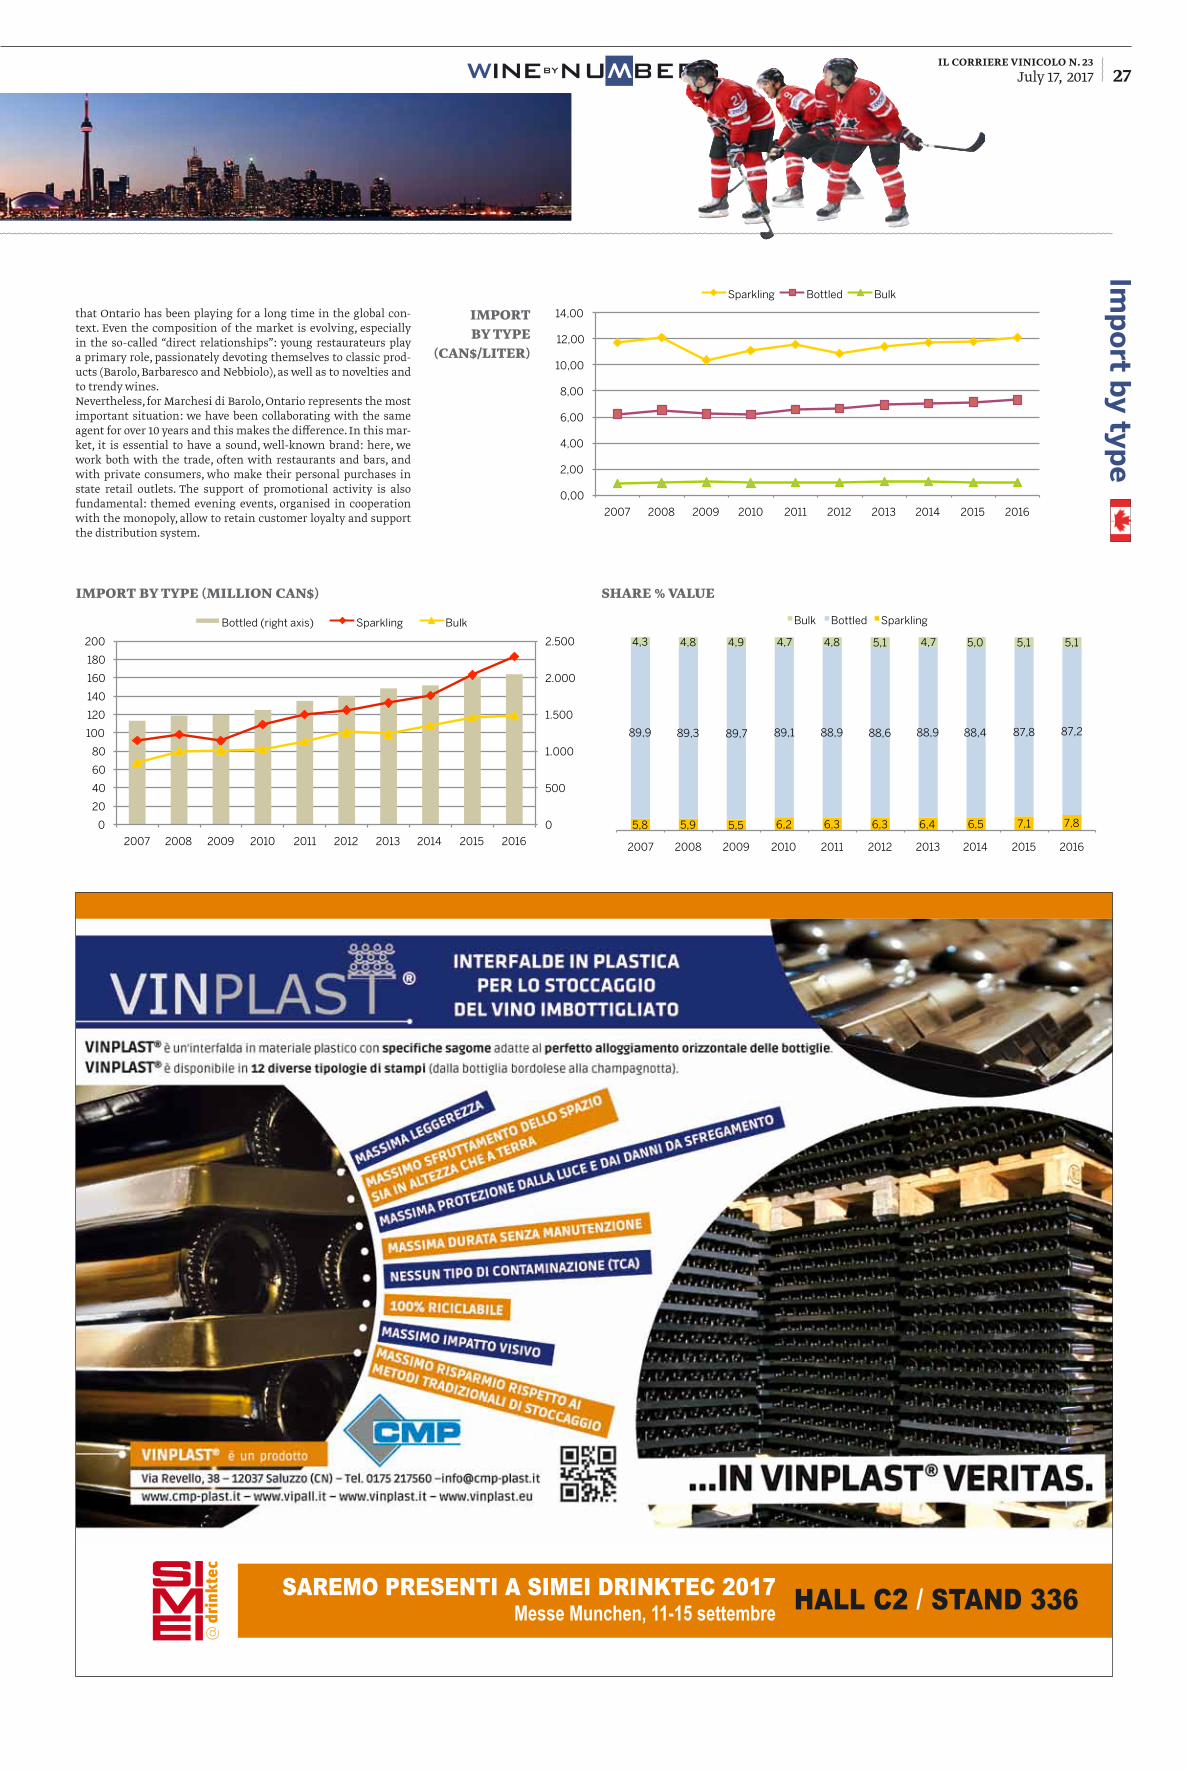
il corriere vinicolo n. 23July 17, 2017 27BYNUWBERSWINE
W
Imp
ort b
y type
import by type (million Can$) share % valUe
0
500
1.000
1.500
2.000
2.500
0
20
40
60
80
100
120
140
160
180
200
2007 2008 2009 2010 2011 2012 2013 2014 2015 2016
Import by type (million CAN$)
Bottled (right axis) Sparkling Bulk
import by type
(Can$/liter)
0,00
2,00
4,00
6,00
8,00
10,00
12,00
14,00
2007 2008 2009 2010 2011 2012 2013 2014 2015 2016
Import by type (CAN$/liter)
Sparkling Bottled Bulk
5,8 5,9 5,5 6,2 6,3 6,3 6,4 6,5 7,1 7,8
89,9 89,3 89,7 89,1 88,9 88,6 88,9 88,4 87,8 87,2
4,3 4,8 4,9 4,7 4,8 5,1 4,7 5,0 5,1 5,1
2007 2008 2009 2010 2011 2012 2013 2014 2015 2016
Share % value
Bulk Bottled Sparkling
SAREMO PRESENTI A SIMEI DRINKTEC 2017Messe Munchen, 11-15 settembre HALL C2 / STAND 336
that Ontario has been playing for a long time in the global con-text. Even the composition of the market is evolving, especially in the so-called “direct relationships”: young restaurateurs play a primary role, passionately devoting themselves to classic prod-ucts (Barolo, Barbaresco and Nebbiolo), as well as to novelties and to trendy wines.Nevertheless, for Marchesi di Barolo, Ontario represents the most important situation: we have been collaborating with the same agent for over 10 years and this makes the difference. In this mar-ket, it is essential to have a sound, well-known brand: here, we work both with the trade, often with restaurants and bars, and with private consumers, who make their personal purchases in state retail outlets. The support of promotional activity is also fundamental: themed evening events, organised in cooperation with the monopoly, allow to retain customer loyalty and support the distribution system.
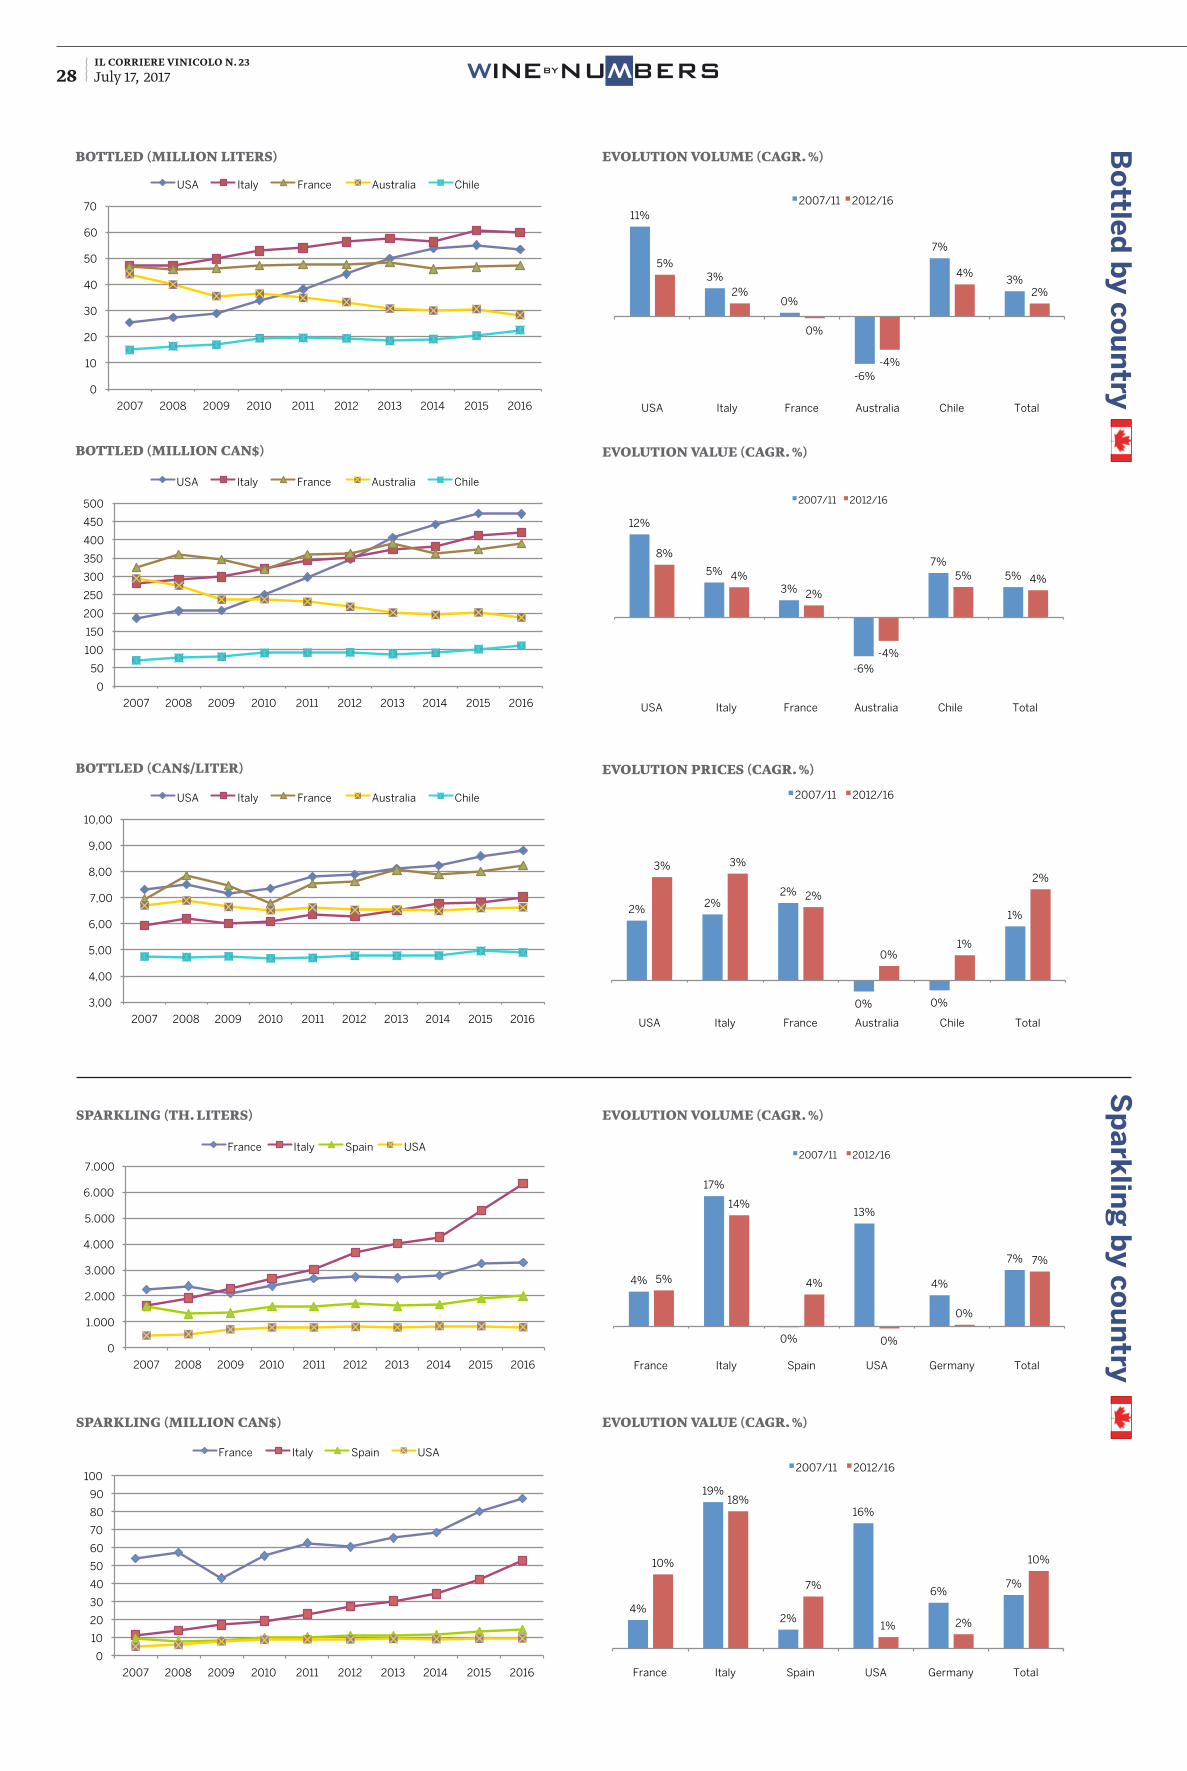
il corriere vinicolo n. 23July 17, 2017 28 BYNUWBERSWINE
W
sparkling (million Can$) evolUtion valUe (Cagr. %)
Bo
ttled
by co
un
tryS
pa
rklin
g b
y cou
ntry
bottled (million liters) evolUtion volUme (Cagr. %)
evolUtion valUe (Cagr. %)
evolUtion priCes (Cagr. %)
bottled (million Can$)
bottled (Can$/liter)
sparkling (th. liters) evolUtion volUme (Cagr. %)
0
50
100
150
200
250
300
350
400
450
500
2007 2008 2009 2010 2011 2012 2013 2014 2015 2016
Bottled (million CAN$)
USA Italy France Australia Chile
0
10
20
30
40
50
60
70
2007 2008 2009 2010 2011 2012 2013 2014 2015 2016
Bottled (million liters)
USA Italy France Australia Chile
3,00
4,00
5,00
6,00
7,00
8,00
9,00
10,00
2007 2008 2009 2010 2011 2012 2013 2014 2015 2016
Bottled (CAN$/liter)
USA Italy France Australia Chile
0
1.000
2.000
3.000
4.000
5.000
6.000
7.000
2007 2008 2009 2010 2011 2012 2013 2014 2015 2016
Sparkling (th. liters)
France Italy Spain USA
0
10
20
30
40
50
60
70
80
90
100
2007 2008 2009 2010 2011 2012 2013 2014 2015 2016
Sparkling (million CAN$)
France Italy Spain USA
12%
5%
3%
-6%
7% 5%
8%
4%
2%
-4%
5% 4%
USA Italy France Australia Chile Total
Evolution value (Cagr %)
2007/11 2012/16
11%
3%
0%
-6%
7%
3%
5%
2%
0%
-4%
4%
2%
USA Italy France Australia Chile Total
Evolution volume (Cagr %)
2007/11 2012/16
2% 2% 2%
0% 0%
1%
3% 3%
2%
0% 1%
2%
USA Italy France Australia Chile Total
Evolution prices (Cagr %)
2007/11 2012/16
4%
17%
0%
13%
4%
7%
5%
14%
4%
0%
0%
7%
France Italy Spain USA Germany Total
Evolution volume (Cagr %)
2007/11 2012/16
4%
19%
2%
16%
6% 7%
10%
18%
7%
1% 2%
10%
France Italy Spain USA Germany Total
Evolution value (Cagr %)
2007/11 2012/16
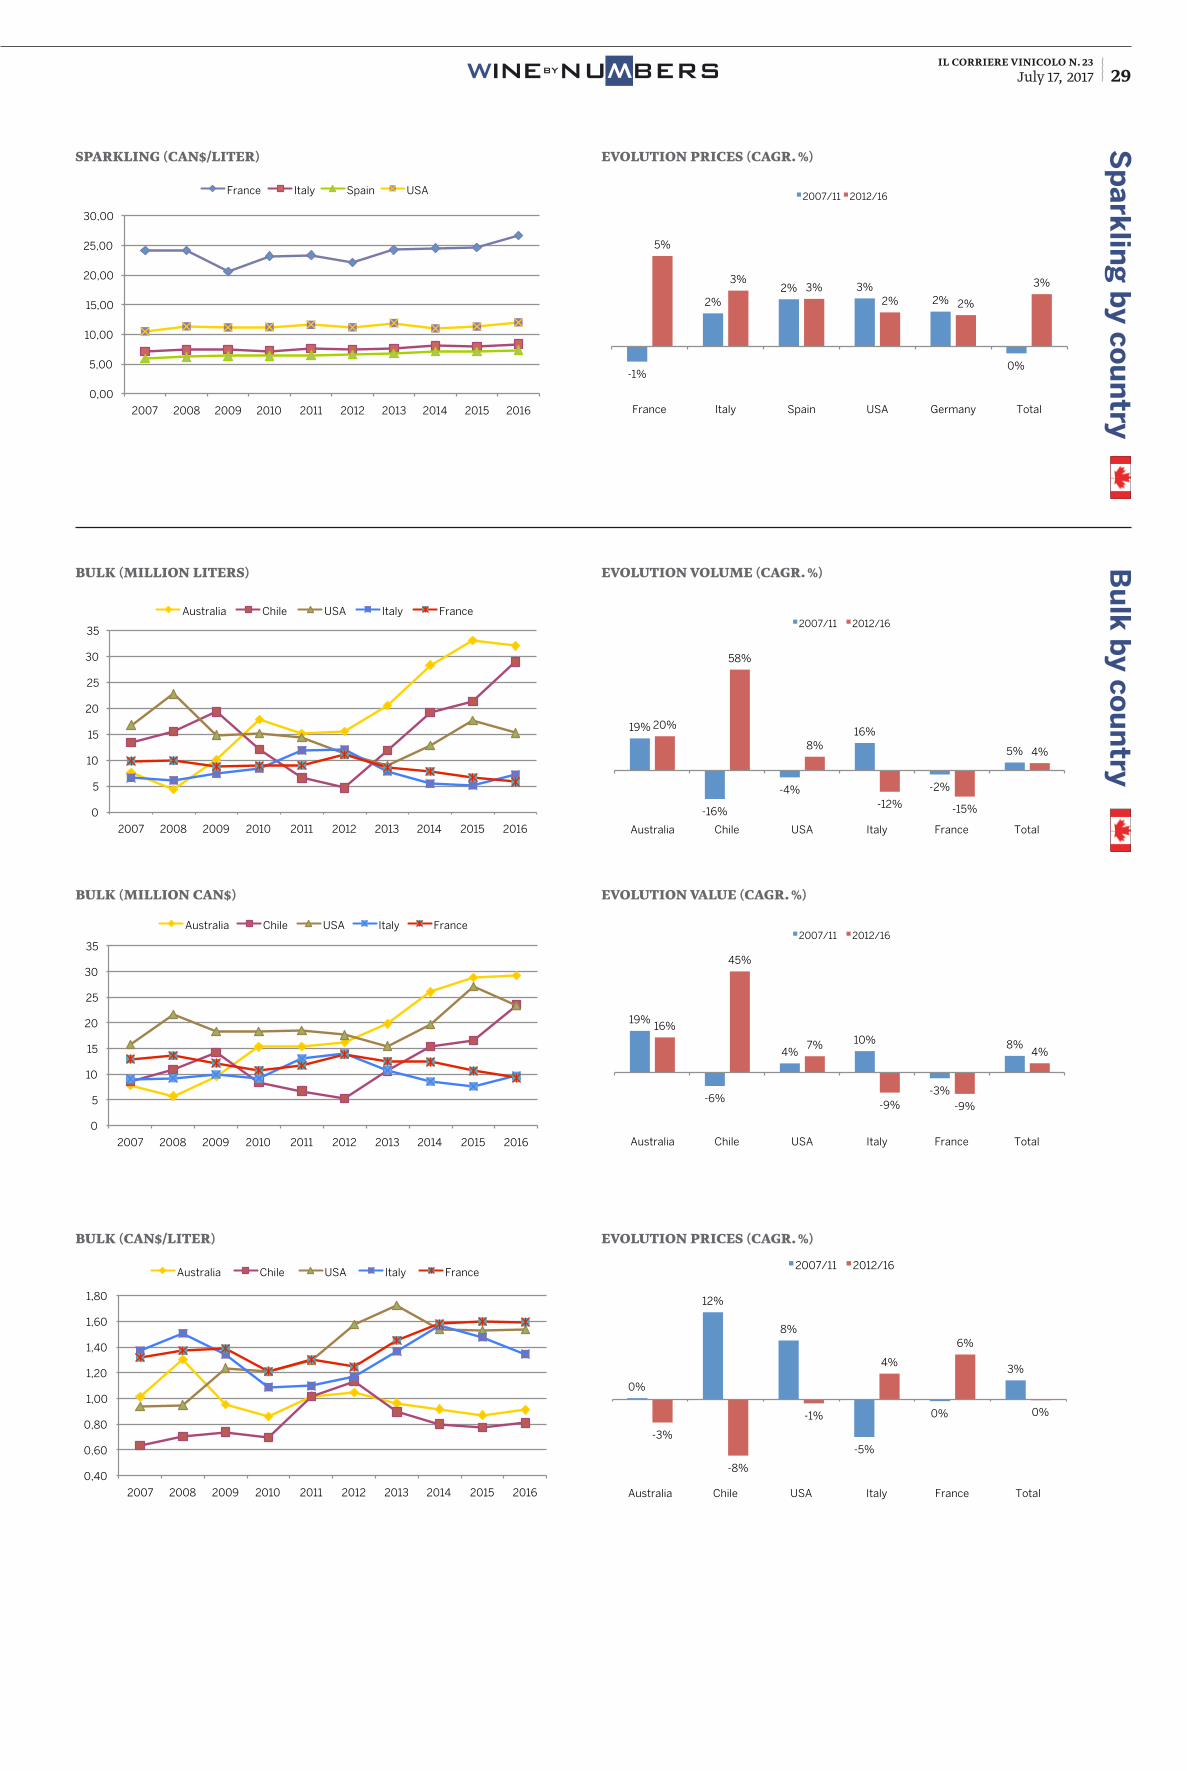
il corriere vinicolo n. 23July 17, 2017 29BYNUWBERSWINE
W
Bu
lk b
y cou
ntry
evolUtion volUme (Cagr. %)
evolUtion valUe (Cagr. %)
evolUtion priCes (Cagr. %)
bUlk (million liters)
bUlk (million Can$)
bUlk (Can$/liter)
Sp
ark
ling
by co
un
try
sparkling (Can$/liter) evolUtion priCes (Cagr. %)
0,00
5,00
10,00
15,00
20,00
25,00
30,00
2007 2008 2009 2010 2011 2012 2013 2014 2015 2016
Sparkling (CAN$/liter)
France Italy Spain USA
0
5
10
15
20
25
30
35
2007 2008 2009 2010 2011 2012 2013 2014 2015 2016
Bulk (million CAN$)
Australia Chile USA Italy France
0
5
10
15
20
25
30
35
2007 2008 2009 2010 2011 2012 2013 2014 2015 2016
Bulk (million liters)
Australia Chile USA Italy France
0,40
0,60
0,80
1,00
1,20
1,40
1,60
1,80
2007 2008 2009 2010 2011 2012 2013 2014 2015 2016
Bulk (CAN$/liter)
Australia Chile USA Italy France
-1%
2% 2% 3%
2%
0%
5%
3% 3%
2% 2%
3%
France Italy Spain USA Germany Total
Evolution prices (Cagr %)
2007/11 2012/16
19%
-16%
-4%
16%
-2%
5%
20%
58%
8%
-12% -15%
4%
Australia Chile USA Italy France Total
Evolution volume (Cagr %)
2007/11 2012/16
19%
-6%
4% 10%
-3%
8%
16%
45%
7%
-9% -9%
4%
Australia Chile USA Italy France Total
Evolution value (Cagr %)
2007/11 2012/16
0%
12%
8%
-5%
0%
3%
-3%
-8%
-1%
4%
6%
0%
Australia Chile USA Italy France Total
Evolution prices (Cagr %)
2007/11 2012/16
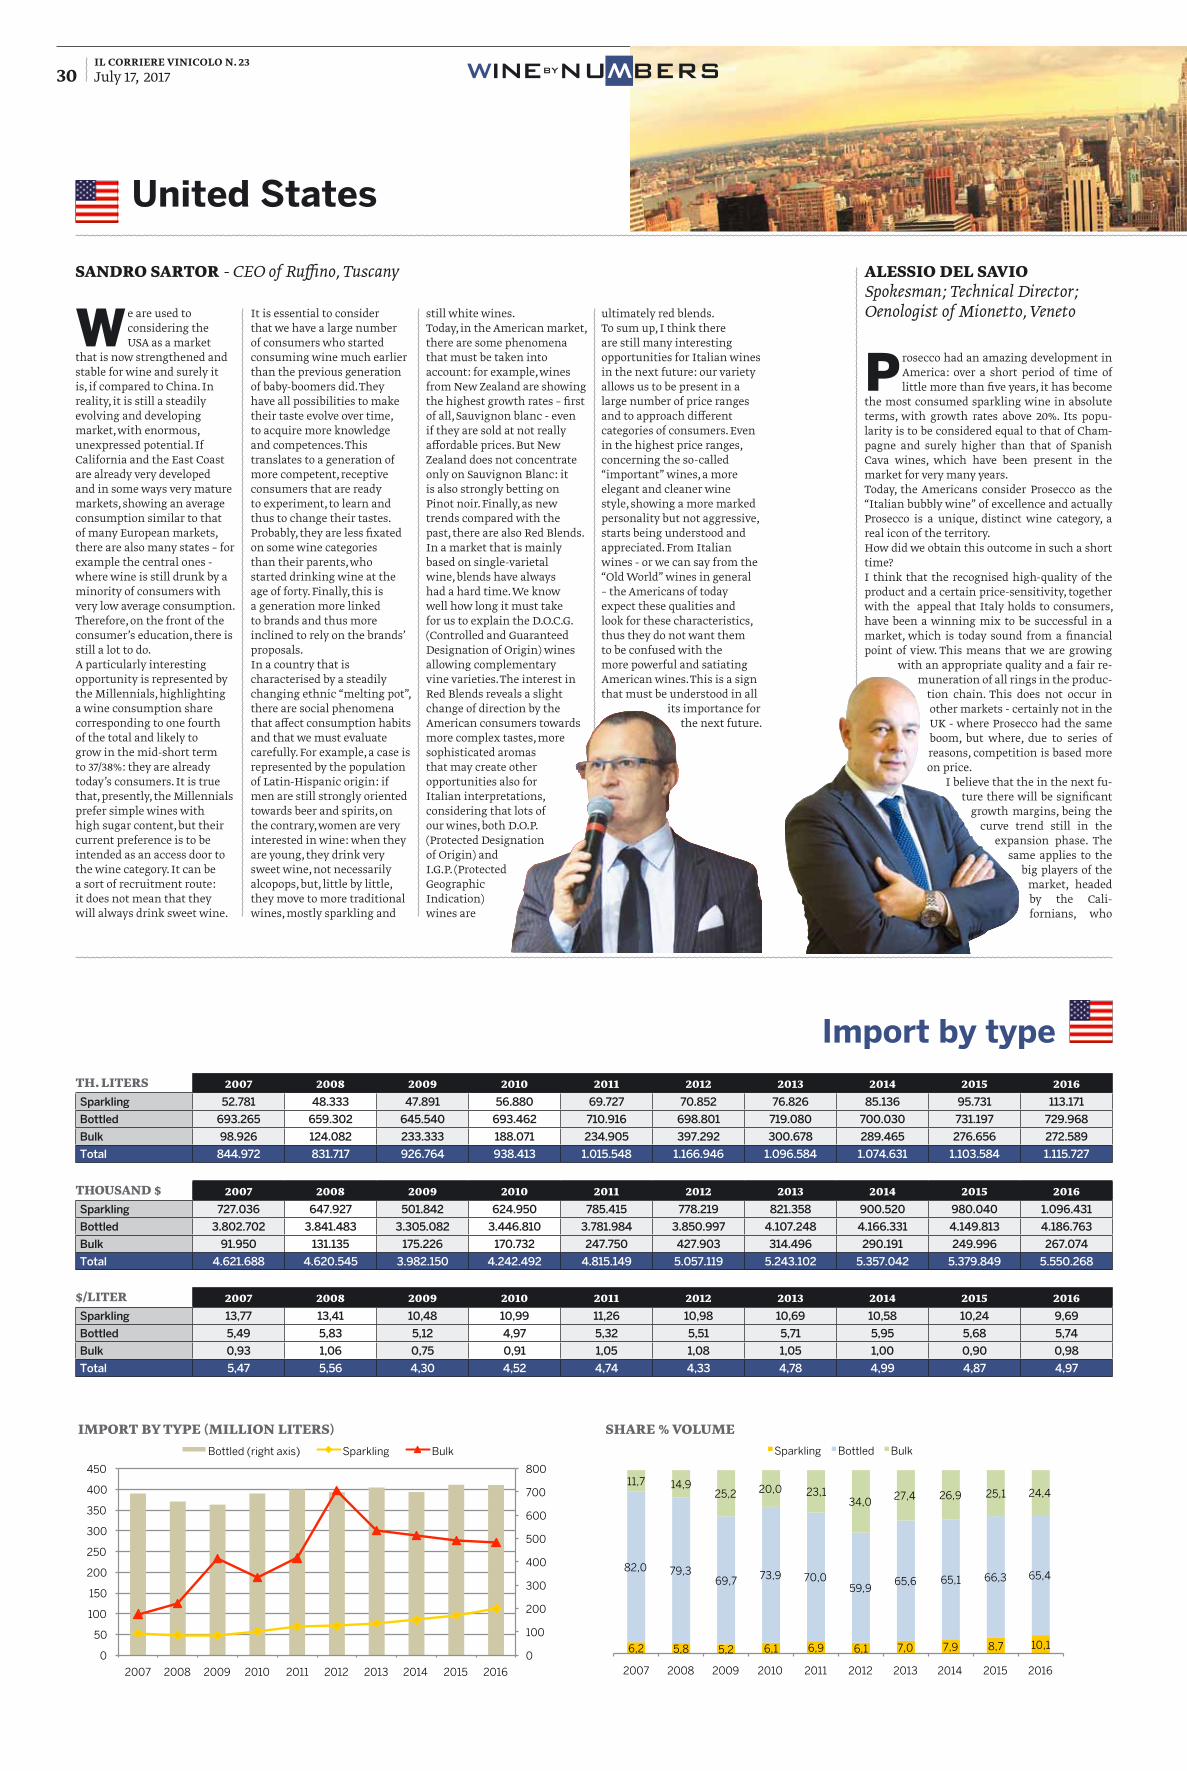
il corriere vinicolo n. 23July 17, 2017 30
th. liters 2007 2008 2009 2010 2011 2012 2013 2014 2015 2016Sparkling 52.781 48.333 47.891 56.880 69.727 70.852 76.826 85.136 95.731 113.171
Bottled 693.265 659.302 645.540 693.462 710.916 698.801 719.080 700.030 731.197 729.968
Bulk 98.926 124.082 233.333 188.071 234.905 397.292 300.678 289.465 276.656 272.589
Total 844.972 831.717 926.764 938.413 1.015.548 1.166.946 1.096.584 1.074.631 1.103.584 1.115.727
thoUsand $ 2007 2008 2009 2010 2011 2012 2013 2014 2015 2016Sparkling 727.036 647.927 501.842 624.950 785.415 778.219 821.358 900.520 980.040 1.096.431
Bottled 3.802.702 3.841.483 3.305.082 3.446.810 3.781.984 3.850.997 4.107.248 4.166.331 4.149.813 4.186.763
Bulk 91.950 131.135 175.226 170.732 247.750 427.903 314.496 290.191 249.996 267.074
Total 4.621.688 4.620.545 3.982.150 4.242.492 4.815.149 5.057.119 5.243.102 5.357.042 5.379.849 5.550.268
$/liter 2007 2008 2009 2010 2011 2012 2013 2014 2015 2016Sparkling 13,77 13,41 10,48 10,99 11,26 10,98 10,69 10,58 10,24 9,69
Bottled 5,49 5,83 5,12 4,97 5,32 5,51 5,71 5,95 5,68 5,74
Bulk 0,93 1,06 0,75 0,91 1,05 1,08 1,05 1,00 0,90 0,98
Total 5,47 5,56 4,30 4,52 4,74 4,33 4,78 4,99 4,87 4,97
United States
Import by type
import by type (million liters) share % volUme
0
100
200
300
400
500
600
700
800
0
50
100
150
200
250
300
350
400
450
2007 2008 2009 2010 2011 2012 2013 2014 2015 2016
Import by type (million liters)
Bottled (right axis) Sparkling Bulk
6,2 5,8 5,2 6,1 6,9 6,1 7,0 7,9 8,7 10,1
82,0 79,3 69,7 73,9 70,0
59,9 65,6 65,1 66,3 65,4
11,7 14,9 25,2 20,0 23,1
34,0 27,4 26,9 25,1 24,4
2007 2008 2009 2010 2011 2012 2013 2014 2015 2016
Share % volume
Sparkling Bottled Bulk
alessio del savioSpokesman; Technical Director;Oenologist of Mionetto, Veneto
sandro sartor - CEO of Ruffino, Tuscany
We are used to considering the USA as a market
that is now strengthened and stable for wine and surely it is, if compared to China. In reality, it is still a steadily evolving and developing market, with enormous, unexpressed potential. If California and the East Coast are already very developed and in some ways very mature markets, showing an average consumption similar to that of many European markets, there are also many states – for example the central ones - where wine is still drunk by a minority of consumers with very low average consumption. Therefore, on the front of the consumer’s education, there is still a lot to do. A particularly interesting opportunity is represented by the Millennials, highlighting a wine consumption share corresponding to one fourth of the total and likely to grow in the mid-short term to 37/38%: they are already today’s consumers. It is true that, presently, the Millennials prefer simple wines with high sugar content, but their current preference is to be intended as an access door to the wine category. It can be a sort of recruitment route: it does not mean that they will always drink sweet wine.
It is essential to consider that we have a large number of consumers who started consuming wine much earlier than the previous generation of baby-boomers did. They have all possibilities to make their taste evolve over time, to acquire more knowledge and competences. This translates to a generation of more competent, receptive consumers that are ready to experiment, to learn and thus to change their tastes. Probably, they are less fixated on some wine categories than their parents, who started drinking wine at the age of forty. Finally, this is a generation more linked to brands and thus more inclined to rely on the brands’ proposals. In a country that is characterised by a steadily changing ethnic “melting pot”, there are social phenomena that affect consumption habits and that we must evaluate carefully. For example, a case is represented by the population of Latin-Hispanic origin: if men are still strongly oriented towards beer and spirits, on the contrary, women are very interested in wine: when they are young, they drink very sweet wine, not necessarily alcopops, but, little by little, they move to more traditional wines, mostly sparkling and
still white wines. Today, in the American market, there are some phenomena that must be taken into account: for example, wines from New Zealand are showing the highest growth rates – first of all, Sauvignon blanc - even if they are sold at not really affordable prices. But New Zealand does not concentrate only on Sauvignon Blanc: it is also strongly betting on Pinot noir. Finally, as new trends compared with the past, there are also Red Blends. In a market that is mainly based on single-varietal wine, blends have always had a hard time. We know well how long it must take for us to explain the D.O.C.G. (Controlled and Guaranteed Designation of Origin) wines allowing complementary vine varieties. The interest in Red Blends reveals a slight change of direction by the American consumers towards more complex tastes, more sophisticated aromas that may create other opportunities also for Italian interpretations, considering that lots of our wines, both D.O.P. (Protected Designation of Origin) and I.G.P. (Protected Geographic Indication) wines are
ultimately red blends. To sum up, I think there are still many interesting opportunities for Italian wines in the next future: our variety allows us to be present in a large number of price ranges and to approach different categories of consumers. Even in the highest price ranges, concerning the so-called “important” wines, a more elegant and cleaner wine style, showing a more marked personality but not aggressive, starts being understood and appreciated. From Italian wines - or we can say from the “Old World” wines in general – the Americans of today expect these qualities and look for these characteristics, thus they do not want them to be confused with the more powerful and satiating American wines. This is a sign that must be understood in all
its importance for the next future.
P rosecco had an amazing development in America: over a short period of time of little more than five years, it has become
the most consumed sparkling wine in absolute terms, with growth rates above 20%. Its popu-larity is to be considered equal to that of Cham-pagne and surely higher than that of Spanish Cava wines, which have been present in the market for very many years. Today, the Americans consider Prosecco as the “Italian bubbly wine” of excellence and actually Prosecco is a unique, distinct wine category, a real icon of the territory. How did we obtain this outcome in such a short time? I think that the recognised high-quality of the product and a certain price-sensitivity, together with the appeal that Italy holds to consumers, have been a winning mix to be successful in a market, which is today sound from a financial point of view. This means that we are growing
with an appropriate quality and a fair re-muneration of all rings in the produc-
tion chain. This does not occur in other markets - certainly not in the UK - where Prosecco had the same boom, but where, due to series of reasons, competition is based more on price.
I believe that the in the next fu-ture there will be significant
growth margins, being the curve trend still in the
expansion phase. The same applies to the
big players of the market, headed by the Cali-fornians, who
BYNUWBERSWINE
W
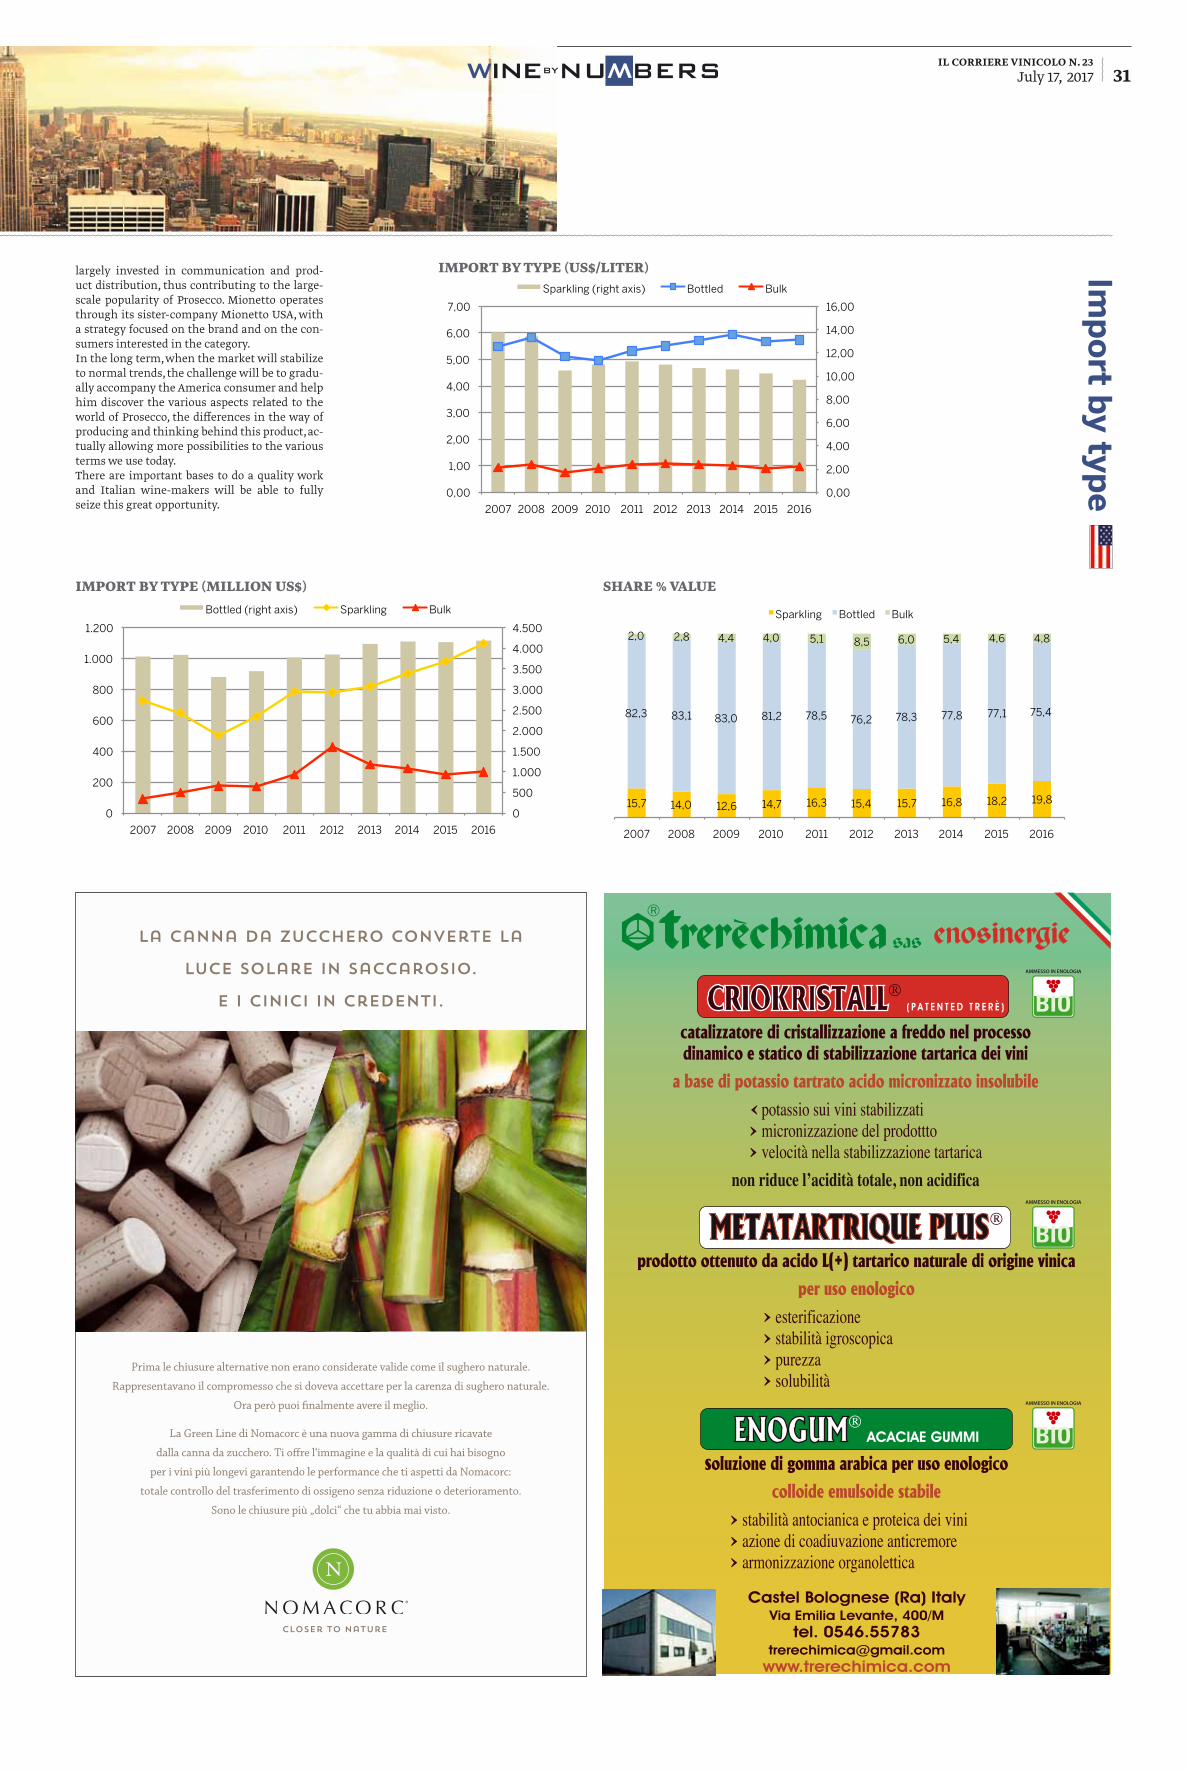
il corriere vinicolo n. 23July 17, 2017 31
Imp
ort b
y type
import by type (million Us$) share % valUe
0
500
1.000
1.500
2.000
2.500
3.000
3.500
4.000
4.500
0
200
400
600
800
1.000
1.200
2007 2008 2009 2010 2011 2012 2013 2014 2015 2016
Import by type (million $)
Bottled (right axis) Sparkling Bulk
15,7 14,0 12,6 14,7 16,3 15,4 15,7 16,8 18,2 19,8
82,3 83,1 83,0 81,2 78,5 76,2 78,3 77,8 77,1 75,4
2,0 2,8 4,4 4,0 5,1 8,5 6,0 5,4 4,6 4,8
2007 2008 2009 2010 2011 2012 2013 2014 2015 2016
Share % value
Sparkling Bottled Bulk
La canna da zucchero converte la
luce solare in saccarosio.
E i cinici in credenti.
Prima le chiusure alternative non erano considerate valide come il sughero naturale.
Rappresentavano il compromesso che si doveva accettare per la carenza di sughero naturale.
Ora però puoi finalmente avere il meglio.
La Green Line di Nomacorc è una nuova gamma di chiusure ricavate
dalla canna da zucchero. Ti offre l‘immagine e la qualità di cui hai bisogno
per i vini più longevi garantendo le performance che ti aspetti da Nomacorc:
totale controllo del trasferimento di ossigeno senza riduzione o deterioramento.
Sono le chiusure più „dolci“ che tu abbia mai visto.
Closer to Nature
Castel Bolognese (Ra) ItalyVia Emilia Levante, 400/M
tel. [email protected]
www.trerechimica.com
CRIOKRISTALL® ( P A T E N T E D T R E R È )
catalizzatore di cristallizzazione a freddo nel processodinamico e statico di stabilizzazione tartarica dei vini
a base di potassio tartrato acido micronizzato insolubile
‹ potassio sui vini stabilizzati › micronizzazione del prodottto › velocità nella stabilizzazione tartarica
non riduce l’acidità totale, non acidifica
METATARTRIQUE PLUS®
prodotto ottenuto da acido L(+) tartarico naturale di origine vinica
per uso enologico
› esterificazione › stabilità igroscopica › purezza › solubilità
ENOGUM® ACACIAE GUMMI
soluzione di gomma arabica per uso enologico
colloide emulsoide stabile
› stabilità antocianica e proteica dei vini › azione di coadiuvazione anticremore › armonizzazione organolettica
AMMESSO IN ENOLOGIA
AMMESSO IN ENOLOGIA
AMMESSO IN ENOLOGIA
largely invested in communication and prod-uct distribution, thus contributing to the large-scale popularity of Prosecco. Mionetto operates through its sister-company Mionetto USA, with a strategy focused on the brand and on the con-sumers interested in the category. In the long term, when the market will stabilize to normal trends, the challenge will be to gradu-ally accompany the America consumer and help him discover the various aspects related to the world of Prosecco, the differences in the way of producing and thinking behind this product, ac-tually allowing more possibilities to the various terms we use today. There are important bases to do a quality work and Italian wine-makers will be able to fully seize this great opportunity.
import by type (Us$/liter)
0,00
2,00
4,00
6,00
8,00
10,00
12,00
14,00
16,00
0,00
1,00
2,00
3,00
4,00
5,00
6,00
7,00
2007 2008 2009 2010 2011 2012 2013 2014 2015 2016
Import by type ($/liter)
Sparkling (right axis) Bottled Bulk
BYNUWBERSWINE
W

il corriere vinicolo n. 23July 17, 2017 32 BYNUWBERSWINE
W
sparkling (th. Us$) evolUtion valUe (Cagr. %)
Bo
ttled
by co
un
tryS
pa
rklin
g b
y cou
ntry
bottled (th. liters) evolUtion volUme (Cagr. %)
evolUtion valUe (Cagr. %)
evolUtion priCes (Cagr. %)
bottled (th. Us$)
bottled (Us$/liter)
sparkling (th. liters) evolUtion volUme (Cagr. %)
0
50.000
100.000
150.000
200.000
250.000
300.000
2007 2008 2009 2010 2011 2012 2013 2014 2015 2016
Bottled (th. liters)
Italy France Australia New Zealand Argentina
0
200.000
400.000
600.000
800.000
1.000.000
1.200.000
1.400.000
1.600.000
2007 2008 2009 2010 2011 2012 2013 2014 2015 2016
Bottled (th. $)
Italy France Australia New Zealand Argentina
2,00
4,00
6,00
8,00
10,00
12,00
14,00
2007 2008 2009 2010 2011 2012 2013 2014 2015 2016
Bottled ($/liter)
Italy France Australia New Zealand Argentina
0
10.000
20.000
30.000
40.000
50.000
60.000
70.000
2007 2008 2009 2010 2011 2012 2013 2014 2015 2016
Sparkling (th.liters)
France Italy Spain
0
100.000
200.000
300.000
400.000
500.000
600.000
700.000
0
50.000
100.000
150.000
200.000
250.000
300.000
350.000
400.000
2007 2008 2009 2010 2011 2012 2013 2014 2015 2016
Sparkling (th. $)
France (right axis) Italy Spain
2%
-3%
-7%
4%
23%
1% 1%
7%
-4%
14%
0%
1%
Italy France Australia New Zealand Argentina Total
Evolution volume (Cagr %)
2007/11 2012/16
3%
-4%
-11%
4%
24%
0%
3% 3%
-6%
13%
1% 2%
Italy France Australia New Zealand Argentina Total
Evolution value (Cagr %)
2007/11 2012/16
1%
-1%
-4%
0%
1%
-1%
2%
-4%
-2%
-1%
1% 1%
Italy France Australia New Zealand Argentina Total
Evolution prices (Cagr %)
2007/11 2012/16
-1%
15%
8%
12%
4% 7%
9%
18%
6%
-13%
3%
12%
France Italy Spain Australia Germany Total
Evolution volume (Cagr %)
2007/11 2012/16
-2%
15%
6%
16%
5% 2%
6%
17%
6%
-13%
7% 9%
France Italy Spain Australia Germany Total
Evolution value (Cagr %)
2007/11 2012/16
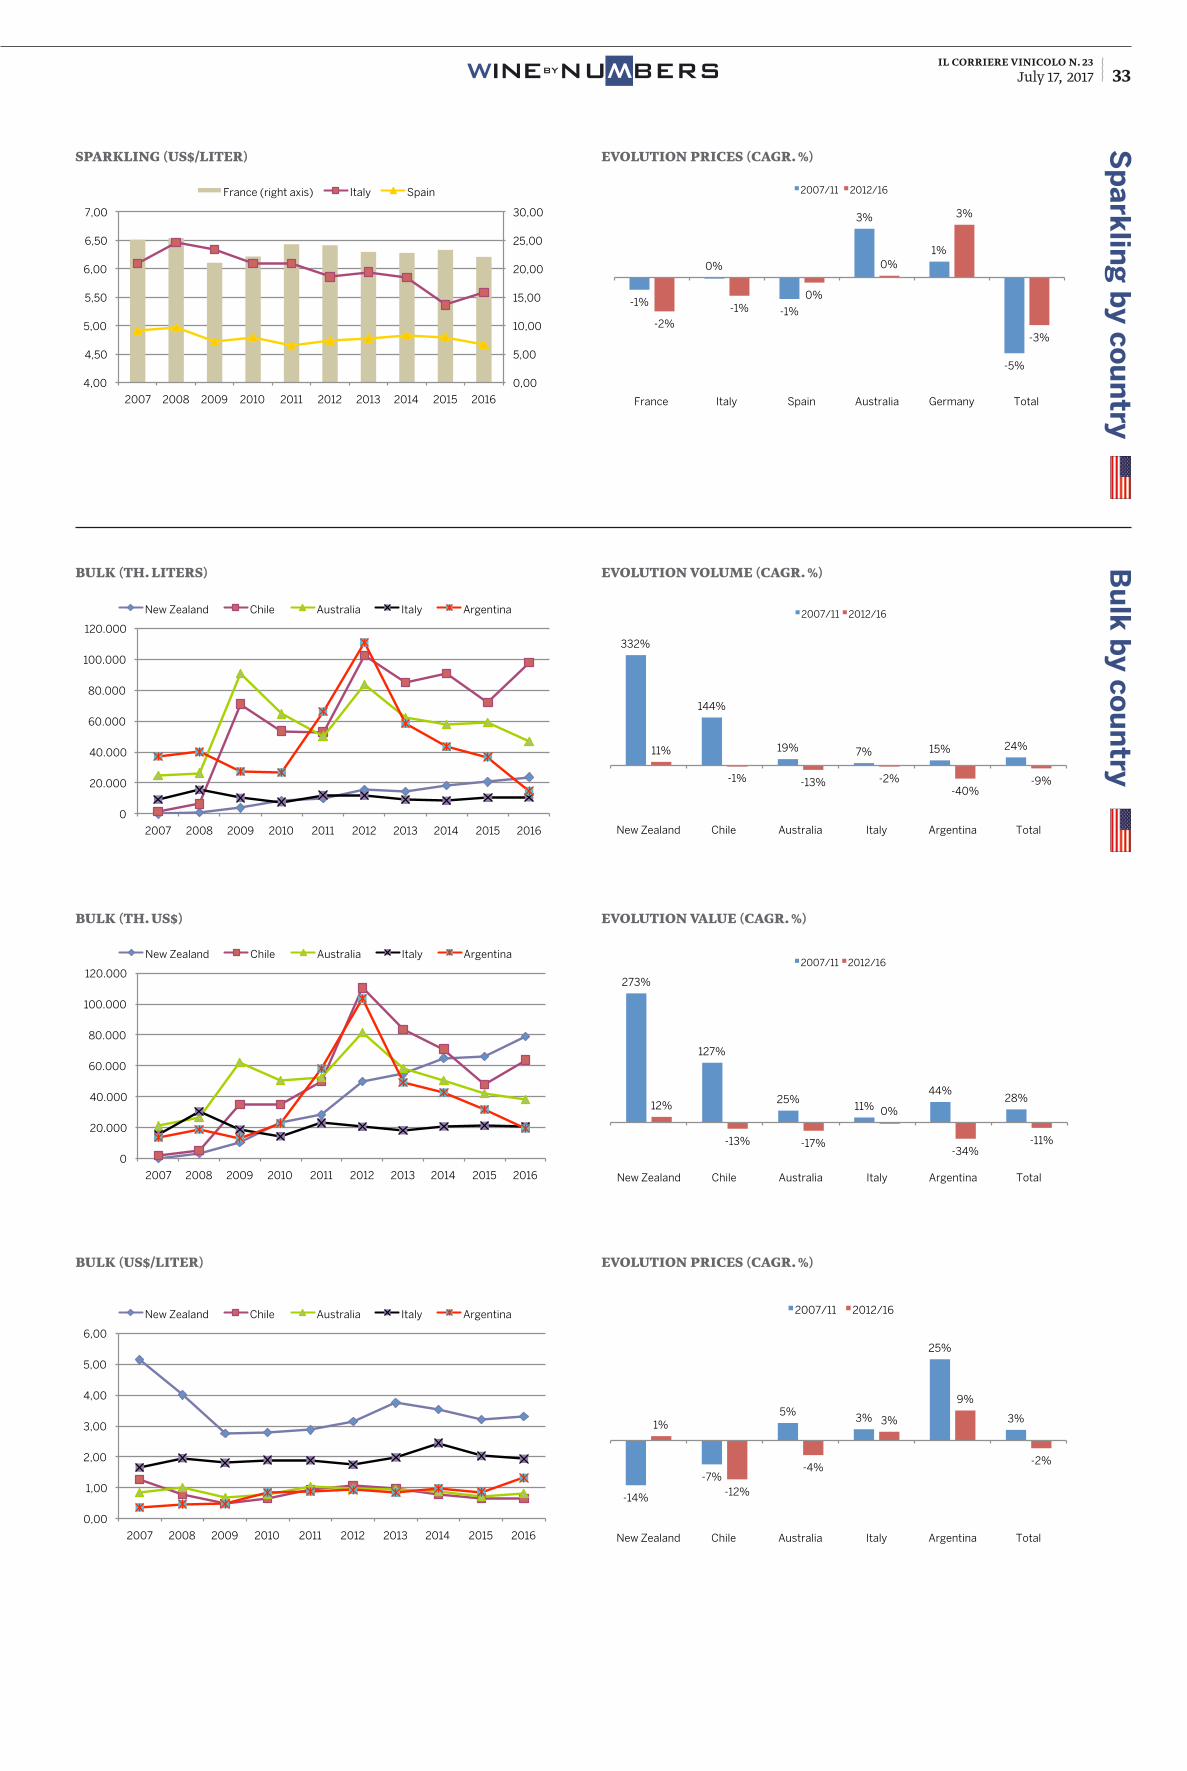
il corriere vinicolo n. 23July 17, 2017 33BYNUWBERSWINE
W
Bu
lk b
y cou
ntry
evolUtion volUme (Cagr. %)bUlk (th. liters)
Sp
ark
ling
by co
un
try
sparkling (Us$/liter) evolUtion priCes (Cagr. %)
0,00
5,00
10,00
15,00
20,00
25,00
30,00
4,00
4,50
5,00
5,50
6,00
6,50
7,00
2007 2008 2009 2010 2011 2012 2013 2014 2015 2016
Sparkling (th. $)
France (right axis) Italy Spain
0
20.000
40.000
60.000
80.000
100.000
120.000
2007 2008 2009 2010 2011 2012 2013 2014 2015 2016
> 2 l and bulk (th. liters)
New Zealand Chile Australia Italy Argentina
evolUtion valUe (Cagr. %)
evolUtion priCes (Cagr. %)
bUlk (th. Us$)
bUlk (Us$/liter)
0
20.000
40.000
60.000
80.000
100.000
120.000
2007 2008 2009 2010 2011 2012 2013 2014 2015 2016
> 2 l and bulk (th. $)
New Zealand Chile Australia Italy Argentina
0,00
1,00
2,00
3,00
4,00
5,00
6,00
2007 2008 2009 2010 2011 2012 2013 2014 2015 2016
> 2 l and bulk ($/liter)
New Zealand Chile Australia Italy Argentina
-1%
0%
-1%
3%
1%
-5%
-2% -1%
0%
0%
3%
-3%
France Italy Spain Australia Germany Total
Evolution prices (Cagr %)
2007/11 2012/16
332%
144%
19% 7% 15% 24% 11%
-1% -13% -2% -40%
-9%
New Zealand Chile Australia Italy Argentina Total
Evolution volume (Cagr %)
2007/11 2012/16
273%
127%
25% 11%
44% 28%
12%
-13% -17%
0%
-34% -11%
New Zealand Chile Australia Italy Argentina Total
Evolution value (Cagr %)
2007/11 2012/16
-14%
-7%
5% 3%
25%
3% 1%
-12%
-4%
3%
9%
-2%
New Zealand Chile Australia Italy Argentina Total
Evolution prices (Cagr % )
2007/11 2012/16
l’integrazione
tecnologica è
nel nostro dnaDentro a una bottiglia di vino c’è un mondo
fatto di tecnologia. Un universo complesso,
che richiede un approccio integrato.
Da 50 anni il gruppo Della Toffola offre
soluzioni innovative per la gestione di
tutta la filiera produttiva enologica: dal
ricevimento dell’uva alla pressatura, dalla
vinificazione all’imbottigliamento.
Scegliere il gruppo Della Toffola vuol dire
scegliere l’affidabilità, l’esperienza e la
competenza di un gruppo fortemente
integrato, composto da 10 aziende
produttive e 6 filiali commerciali e di
assistenza internazionali che hanno la
tecnologia nel loro dna.
Scegliere il gruppo Della Toffola vuol dire
scegliere una soluzione personalizzata
chiavi in mano, studiata appositamente per
le esigenze della tua cantina.
Tu mettici la passione, il gruppo Della
Toffola ci mette la tecnologia.
www.dellatoffola.it
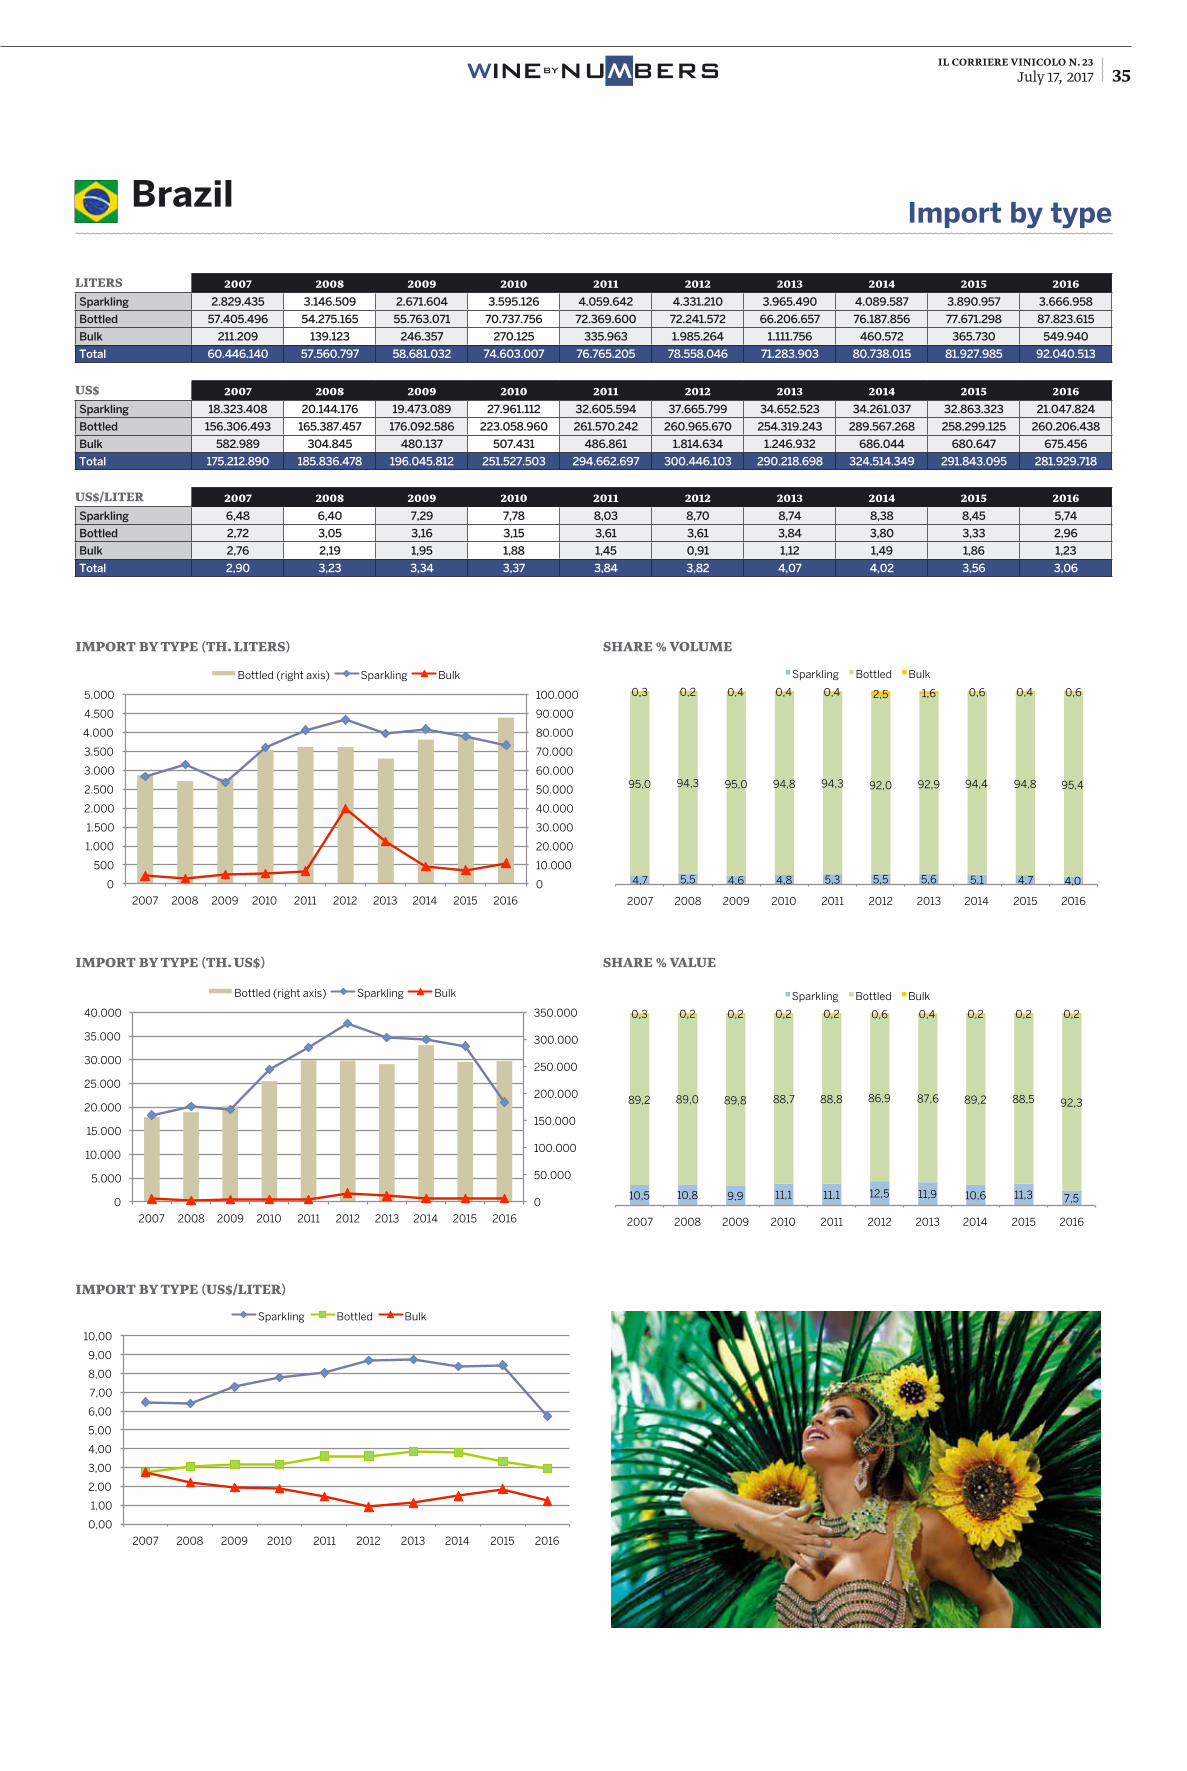
il corriere vinicolo n. 23July 17, 2017 35BYNUWBERSWINE
W
liters 2007 2008 2009 2010 2011 2012 2013 2014 2015 2016Sparkling 2.829.435 3.146.509 2.671.604 3.595.126 4.059.642 4.331.210 3.965.490 4.089.587 3.890.957 3.666.958
Bottled 57.405.496 54.275.165 55.763.071 70.737.756 72.369.600 72.241.572 66.206.657 76.187.856 77.671.298 87.823.615
Bulk 211.209 139.123 246.357 270.125 335.963 1.985.264 1.111.756 460.572 365.730 549.940
Total 60.446.140 57.560.797 58.681.032 74.603.007 76.765.205 78.558.046 71.283.903 80.738.015 81.927.985 92.040.513
Us$ 2007 2008 2009 2010 2011 2012 2013 2014 2015 2016Sparkling 18.323.408 20.144.176 19.473.089 27.961.112 32.605.594 37.665.799 34.652.523 34.261.037 32.863.323 21.047.824
Bottled 156.306.493 165.387.457 176.092.586 223.058.960 261.570.242 260.965.670 254.319.243 289.567.268 258.299.125 260.206.438
Bulk 582.989 304.845 480.137 507.431 486.861 1.814.634 1.246.932 686.044 680.647 675.456
Total 175.212.890 185.836.478 196.045.812 251.527.503 294.662.697 300.446.103 290.218.698 324.514.349 291.843.095 281.929.718
Us$/liter 2007 2008 2009 2010 2011 2012 2013 2014 2015 2016Sparkling 6,48 6,40 7,29 7,78 8,03 8,70 8,74 8,38 8,45 5,74
Bottled 2,72 3,05 3,16 3,15 3,61 3,61 3,84 3,80 3,33 2,96
Bulk 2,76 2,19 1,95 1,88 1,45 0,91 1,12 1,49 1,86 1,23
Total 2,90 3,23 3,34 3,37 3,84 3,82 4,07 4,02 3,56 3,06
Import by typeBrazil
import by type (th. Us$)
import by type (th. liters)
import by type (Us$/liter)
share % valUe
0
50.000
100.000
150.000
200.000
250.000
300.000
350.000
0
5.000
10.000
15.000
20.000
25.000
30.000
35.000
40.000
2007 2008 2009 2010 2011 2012 2013 2014 2015 2016
Import by type (th. $)
Bottled (right axis) Sparkling Bulk
0
10.000
20.000
30.000
40.000
50.000
60.000
70.000
80.000
90.000
100.000
0
500
1.000
1.500
2.000
2.500
3.000
3.500
4.000
4.500
5.000
2007 2008 2009 2010 2011 2012 2013 2014 2015 2016
Import by type (th. liters)
Bottled (right axis) Sparkling Bulk
0,00
1,00
2,00
3,00
4,00
5,00
6,00
7,00
8,00
9,00
10,00
2007 2008 2009 2010 2011 2012 2013 2014 2015 2016
Import by type ($/liter)
Sparkling Bottled Bulk
share % volUme
4,7 5,5 4,6 4,8 5,3 5,5 5,6 5,1 4,7 4,0
95,0 94,3 95,0 94,8 94,3 92,0 92,9 94,4 94,8 95,4
0,3 0,2 0,4 0,4 0,4 2,5 1,6 0,6 0,4 0,6
2007 2008 2009 2010 2011 2012 2013 2014 2015 2016
Share % volume
Sparkling Bottled Bulk
10,5 10,8 9,9 11,1 11,1 12,5 11,9 10,6 11,3 7,5
89,2 89,0 89,8 88,7 88,8 86,9 87,6 89,2 88,5 92,3
0,3 0,2 0,2 0,2 0,2 0,6 0,4 0,2 0,2 0,2
2007 2008 2009 2010 2011 2012 2013 2014 2015 2016
Share % value
Sparkling Bottled Bulk
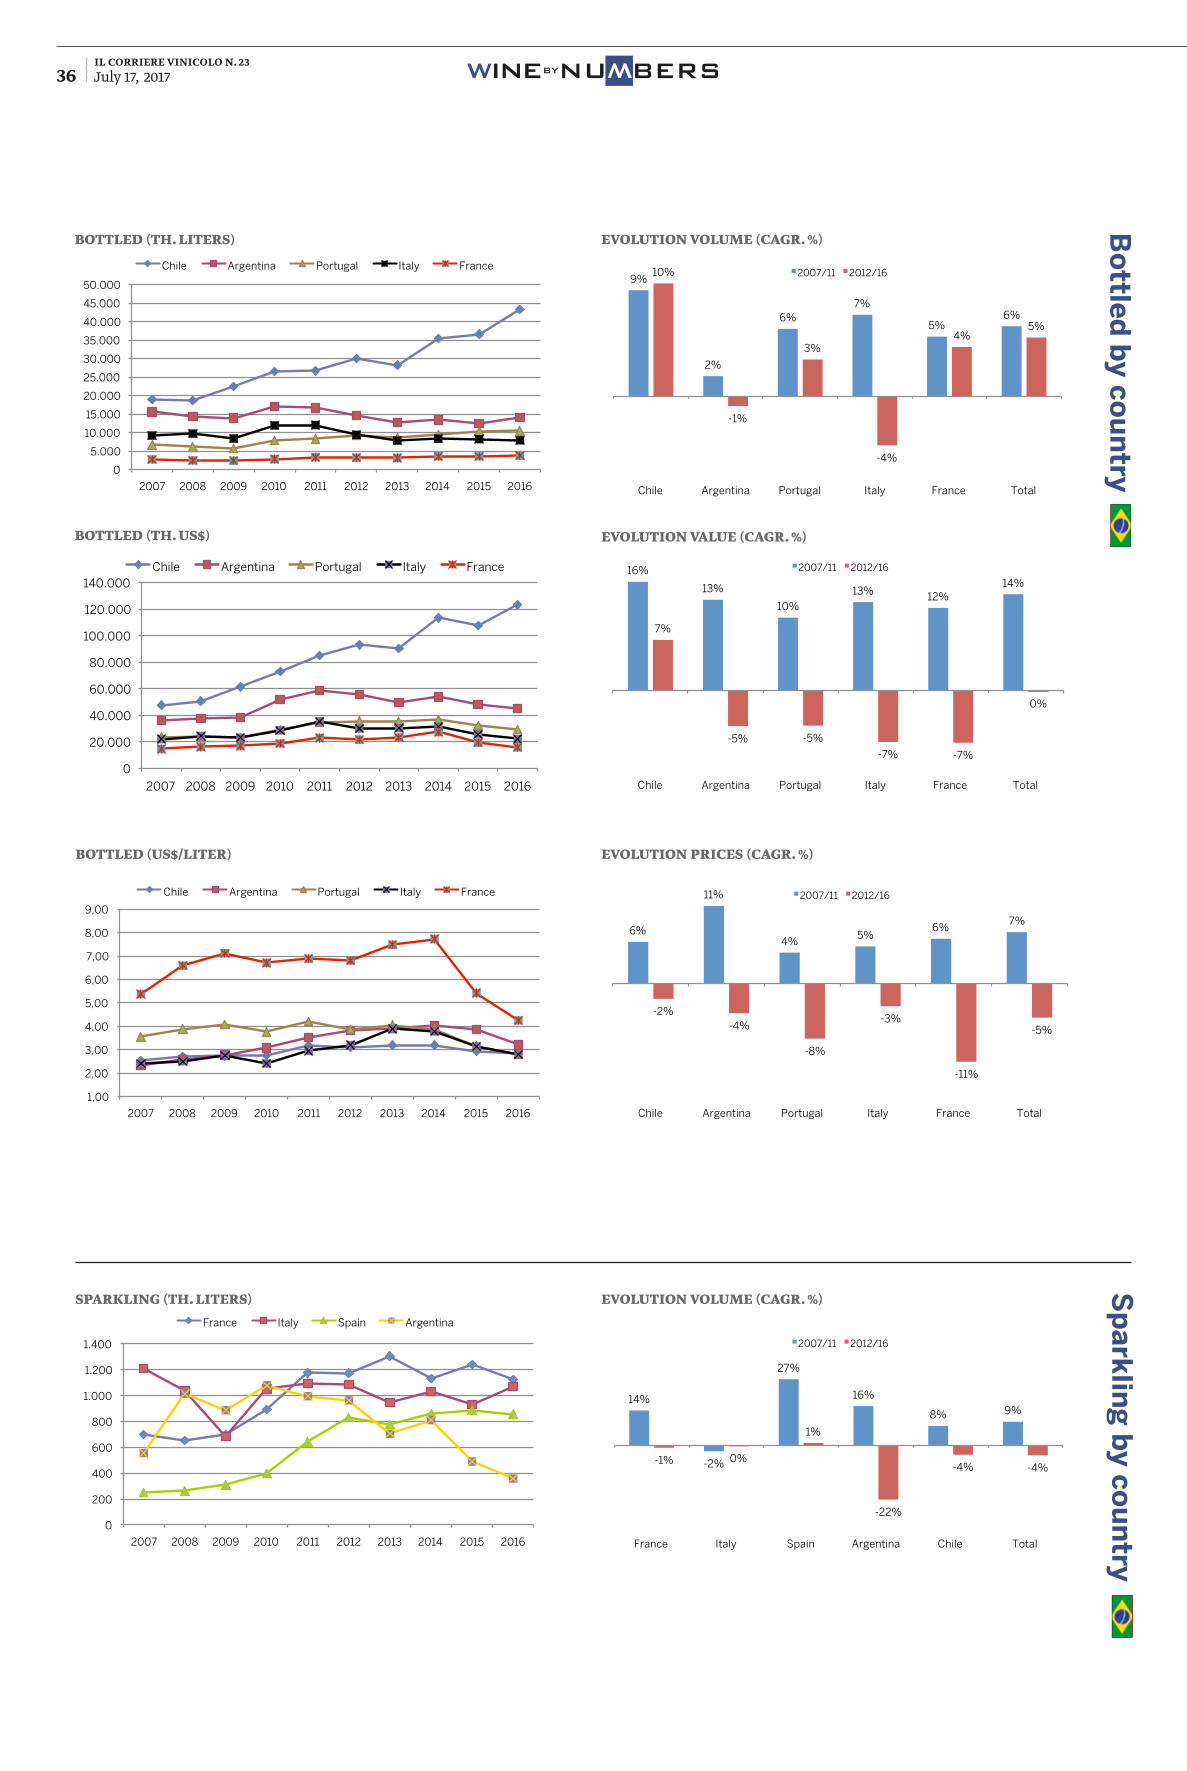
il corriere vinicolo n. 23July 17, 2017 36 BYNUWBERSWINE
W
Sp
ark
ling
by co
un
try
sparkling (th. liters) evolUtion volUme (Cagr. %)
0
200
400
600
800
1.000
1.200
1.400
2007 2008 2009 2010 2011 2012 2013 2014 2015 2016
Sparkling (th. liters)
France Italy Spain Argentina
14%
-2%
27%
16%
8% 9%
-1% 0%
1%
-22%
-4% -4%
France Italy Spain Argentina Chile Total
Evolution volume (Cagr %)
2007/11 2012/16
Bo
ttled
by co
un
try
bottled (th. liters) evolUtion volUme (Cagr. %)
evolUtion valUe (Cagr. %)bottled (th. Us$)
0
5.000
10.000
15.000
20.000
25.000
30.000
35.000
40.000
45.000
50.000
2007 2008 2009 2010 2011 2012 2013 2014 2015 2016
Bottled (th. liters)
Chile Argentina Portugal Italy France
0
20.000
40.000
60.000
80.000
100.000
120.000
140.000
2007 2008 2009 2010 2011 2012 2013 2014 2015 2016
Bottled (th. $)
Chile Argentina Portugal Italy France
bottled (Us$/liter)
1,00
2,00
3,00
4,00
5,00
6,00
7,00
8,00
9,00
2007 2008 2009 2010 2011 2012 2013 2014 2015 2016
Bottled ($/liter)
Chile Argentina Portugal Italy France
evolUtion priCes (Cagr. %)
16%
13%
10% 13% 12%
14%
7%
-5% -5%
-7% -7%
0%
Chile Argentina Portugal Italy France Total
Evolution value (Cagr %)
2007/11 2012/16
6%
11%
4% 5%
6% 7%
-2% -4%
-8%
-3%
-11%
-5%
Chile Argentina Portugal Italy France Total
Evolution prices (Cagr %)
2007/11 2012/16
9%
2%
6% 7%
5% 6%
10%
-1%
3%
-4%
4% 5%
Chile Argentina Portugal Italy France Total
Evolution volume (Cagr %)
2007/11 2012/16
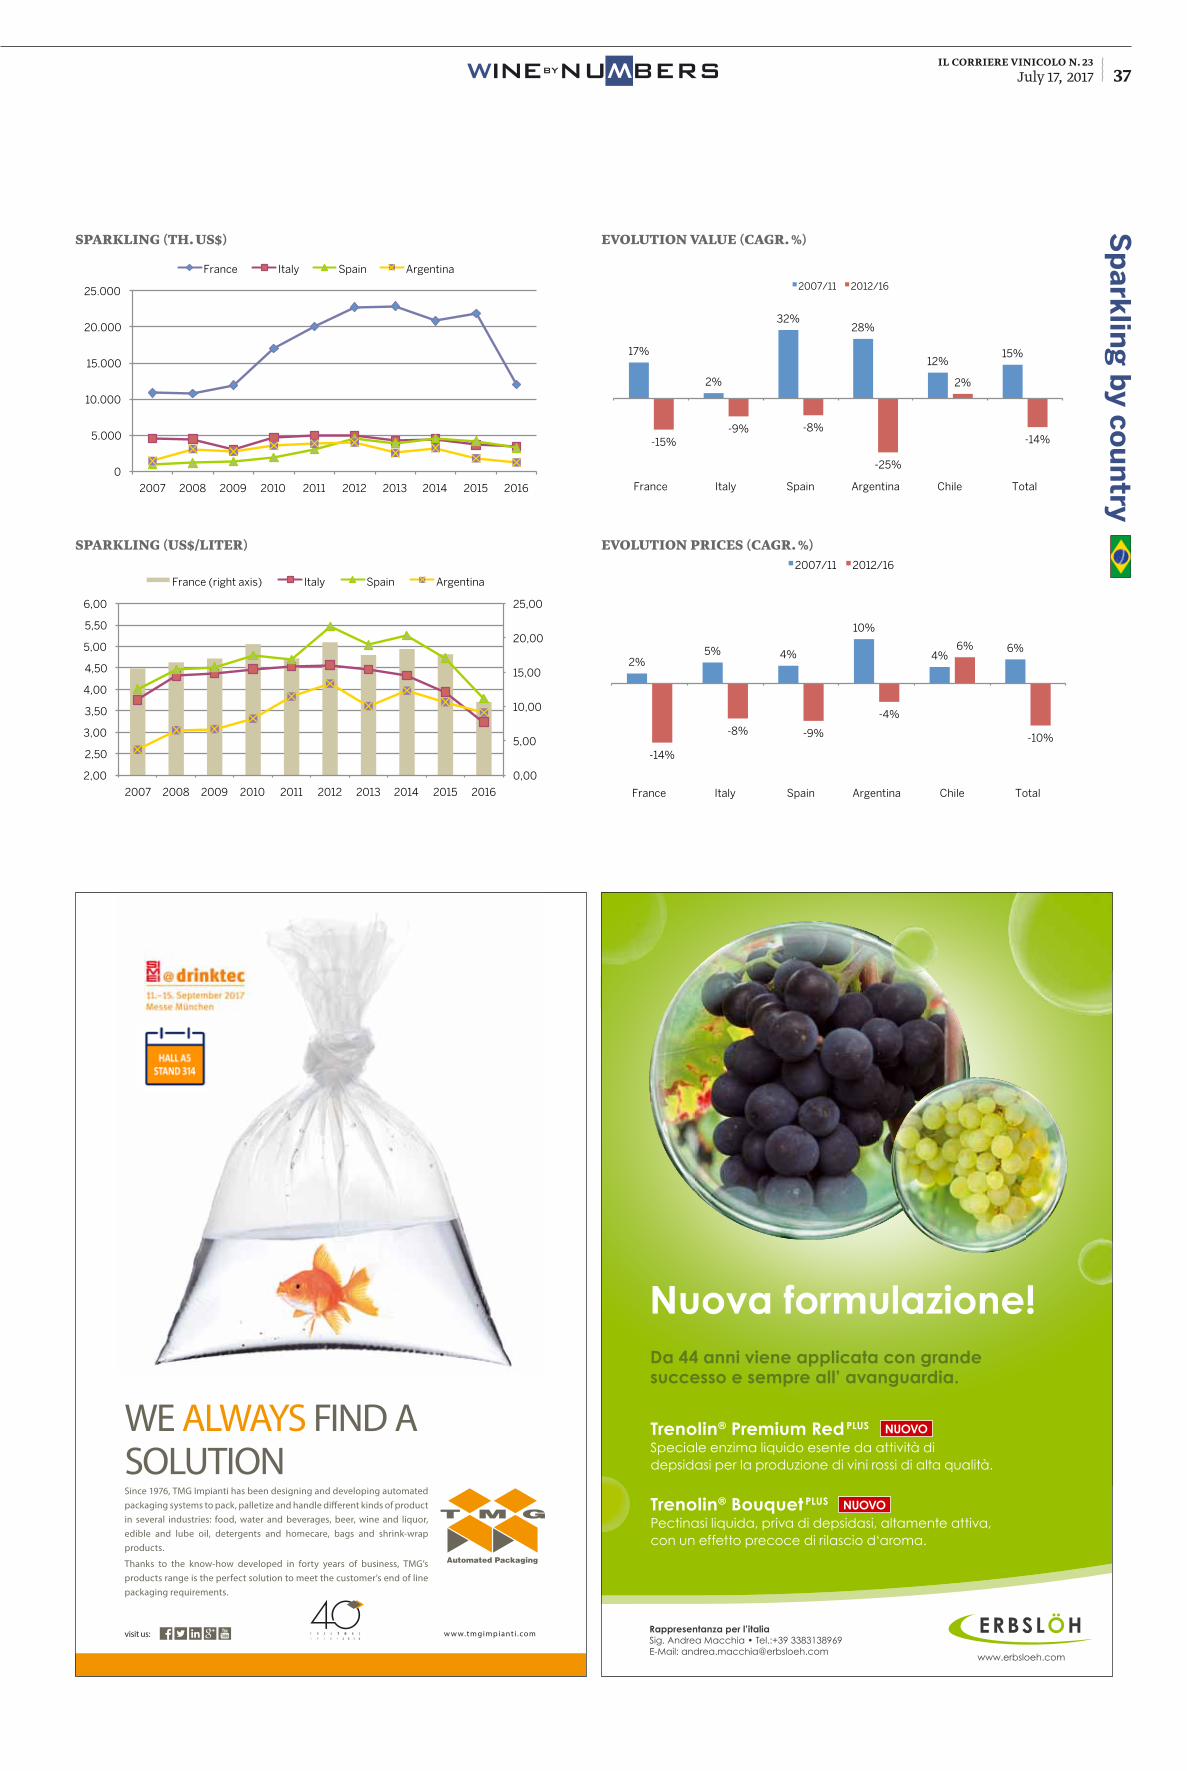
il corriere vinicolo n. 23July 17, 2017 37BYNUWBERSWINE
W
www.erbsloeh.com
Rappresentanza per l’italiaSig. Andrea Macchia • Tel.:+39 3383138969E-Mail: [email protected]
NUOVO
NUOVO
AZ Erbslöh_Corriere Vinicolo_Trenolin 135x208_RZ.indd 1 21.06.16 12:23
WE ALWAYS FIND A SOLUTION
visit us: w w w.tmgimpiant i .com
Since 1976, TMG Impianti has been designing and developing automated packaging systems to pack, palletize and handle different kinds of product in several industries: food, water and beverages, beer, wine and liquor, edible and lube oil, detergents and homecare, bags and shrink-wrap products.
Thanks to the know-how developed in forty years of business, TMG’s products range is the perfect solution to meet the customer’s end of line packaging requirements.
sparkling (th. Us$)
sparkling (Us$/liter)
evolUtion valUe (Cagr. %)
evolUtion priCes (Cagr. %)
Sp
ark
ling
by co
un
try
0
5.000
10.000
15.000
20.000
25.000
2007 2008 2009 2010 2011 2012 2013 2014 2015 2016
Sparkling (th. $)
France Italy Spain Argentina
0,00
5,00
10,00
15,00
20,00
25,00
2,00
2,50
3,00
3,50
4,00
4,50
5,00
5,50
6,00
2007 2008 2009 2010 2011 2012 2013 2014 2015 2016
Sparkling ($/liter)
France (right axis) Italy Spain Argentina
17%
2%
32% 28%
12% 15%
-15% -9% -8%
-25%
2%
-14%
France Italy Spain Argentina Chile Total
Evolution value (Cagr %)
2007/11 2012/16
2% 5% 4%
10%
4% 6%
-14%
-8% -9%
-4%
6%
-10%
France Italy Spain Argentina Chile Total
Evolution prices (Cagr %)
2007/11 2012/16
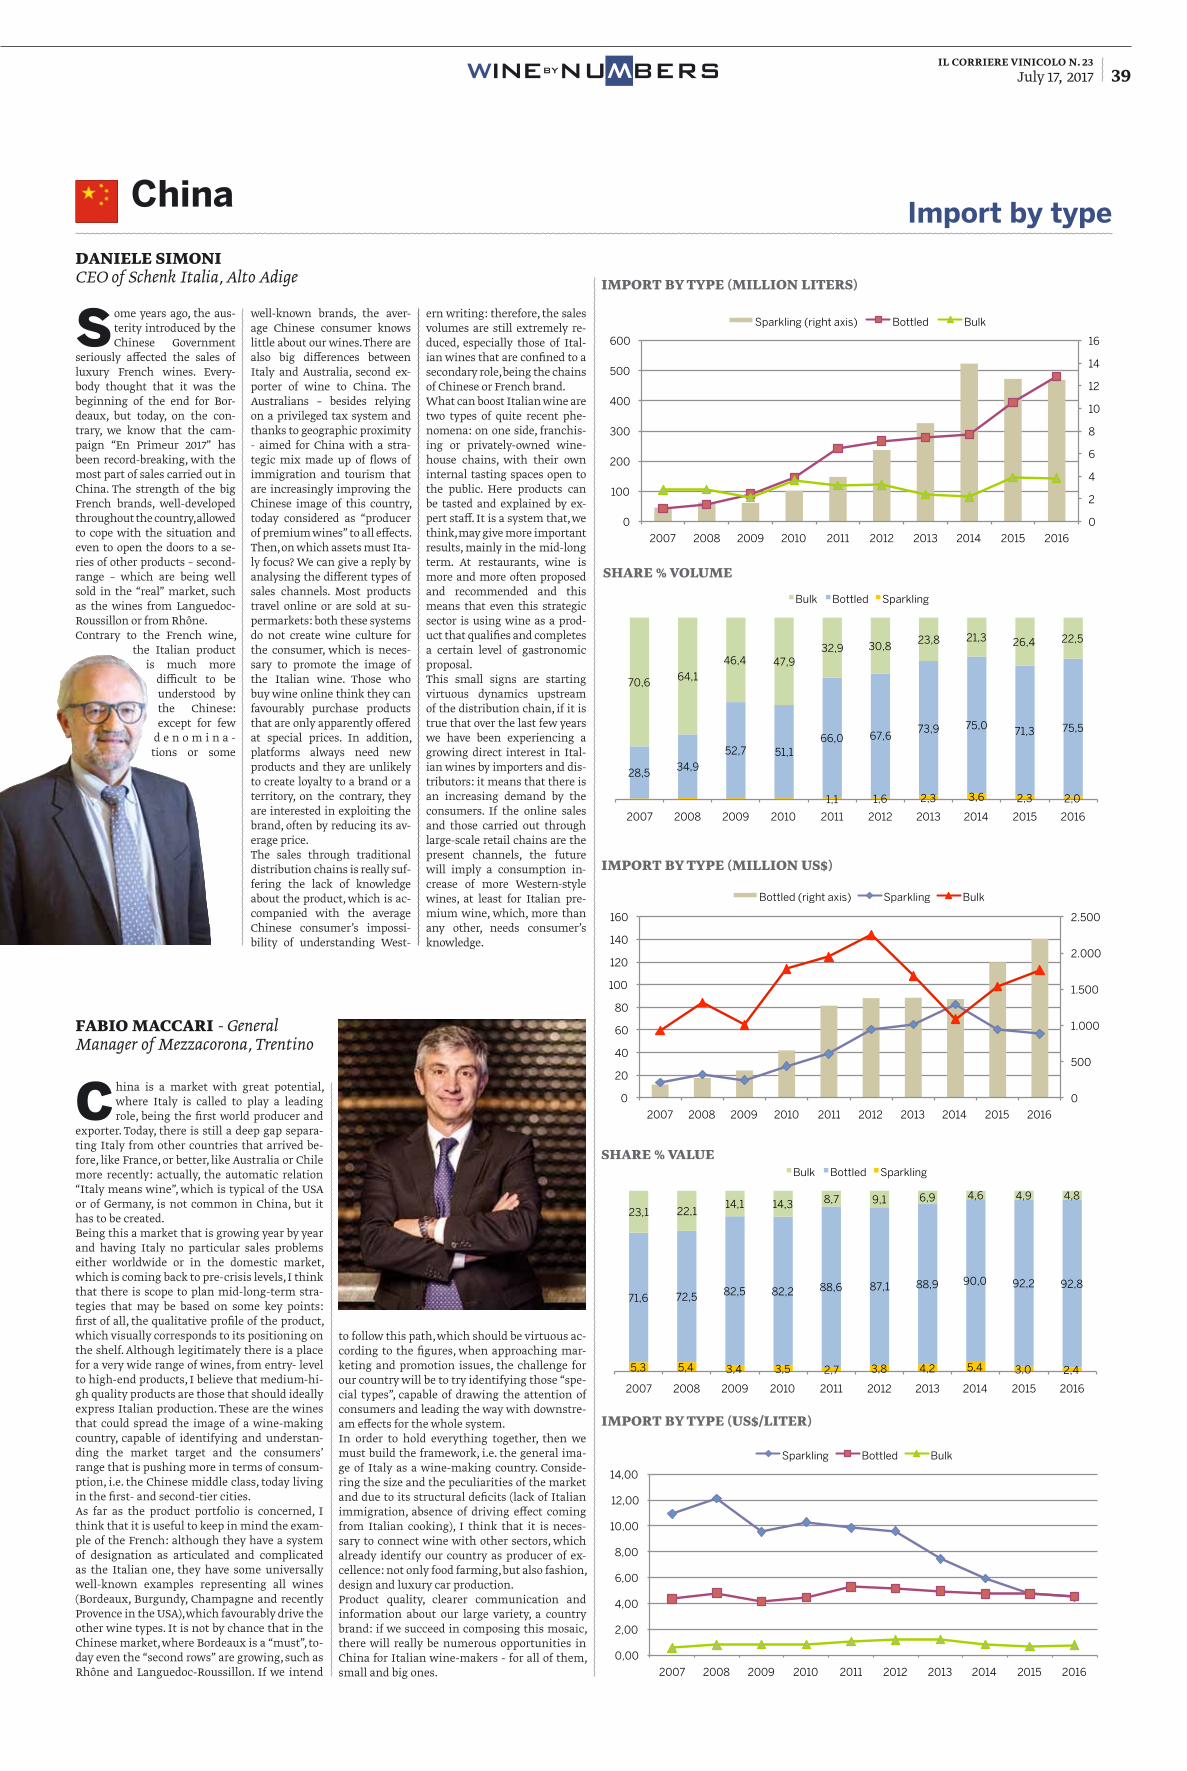
il corriere vinicolo n. 23July 17, 2017 39BYNUWBERSWINE
W
import by type (million liters)
0
2
4
6
8
10
12
14
16
0
100
200
300
400
500
600
2007 2008 2009 2010 2011 2012 2013 2014 2015 2016
Import by type (million liters)
Sparkling (right axis) Bottled Bulk
import by type (million Us$)
0
500
1.000
1.500
2.000
2.500
0
20
40
60
80
100
120
140
160
2007 2008 2009 2010 2011 2012 2013 2014 2015 2016
Import by type (million US$)
Bottled (right axis) Sparkling Bulk
import by type (Us$/liter)
0,00
2,00
4,00
6,00
8,00
10,00
12,00
14,00
2007 2008 2009 2010 2011 2012 2013 2014 2015 2016
Import by type (US$/liter)
Sparkling Bottled Bulk
Import by typeChina
share % volUme
1,1 1,6 2,3 3,6 2,3 2,0
28,5 34,9
52,7 51,1 66,0 67,6
73,9 75,0 71,3 75,5
70,6 64,1
46,4 47,9 32,9 30,8
23,8 21,3 26,4 22,5
2007 2008 2009 2010 2011 2012 2013 2014 2015 2016
Share % volume
Bulk Bottled Sparkling
share % valUe
5,3 5,4 3,4 3,5 2,7 3,8 4,2 5,4 3,0 2,4
71,6 72,5 82,5 82,2 88,6 87,1 88,9 90,0 92,2 92,8
23,1 22,1 14,1 14,3 8,7 9,1 6,9 4,6 4,9 4,8
2007 2008 2009 2010 2011 2012 2013 2014 2015 2016
Share % value
Bulk Bottled Sparkling
daniele simoniCEO of Schenk Italia, Alto Adige
Fabio maCCari - General Manager of Mezzacorona, Trentino
Some years ago, the aus-terity introduced by the Chinese Government
seriously affected the sales of luxury French wines. Every-body thought that it was the beginning of the end for Bor-deaux, but today, on the con-trary, we know that the cam-paign “En Primeur 2017” has been record-breaking, with the most part of sales carried out in China. The strength of the big French brands, well-developed throughout the country, allowed to cope with the situation and even to open the doors to a se-ries of other products – second-range – which are being well sold in the “real” market, such as the wines from Languedoc-Roussillon or from Rhône. Contrary to the French wine,
the Italian product is much more
difficult to be understood by the Chinese: except for few
d e n o m i n a -tions or some
well-known brands, the aver-age Chinese consumer knows little about our wines. There are also big differences between Italy and Australia, second ex-porter of wine to China. The Australians – besides relying on a privileged tax system and thanks to geographic proximity - aimed for China with a stra-tegic mix made up of flows of immigration and tourism that are increasingly improving the Chinese image of this country, today considered as “producer of premium wines” to all effects.Then, on which assets must Ita-ly focus? We can give a reply by analysing the different types of sales channels. Most products travel online or are sold at su-permarkets: both these systems do not create wine culture for the consumer, which is neces-sary to promote the image of the Italian wine. Those who buy wine online think they can favourably purchase products that are only apparently offered at special prices. In addition, platforms always need new products and they are unlikely to create loyalty to a brand or a territory, on the contrary, they are interested in exploiting the brand, often by reducing its av-erage price. The sales through traditional distribution chains is really suf-fering the lack of knowledge about the product, which is ac-companied with the average Chinese consumer’s impossi-bility of understanding West-
ern writing: therefore, the sales volumes are still extremely re-duced, especially those of Ital-ian wines that are confined to a secondary role, being the chains of Chinese or French brand.What can boost Italian wine are two types of quite recent phe-nomena: on one side, franchis-ing or privately-owned wine-house chains, with their own internal tasting spaces open to the public. Here products can be tasted and explained by ex-pert staff. It is a system that, we think, may give more important results, mainly in the mid-long term. At restaurants, wine is more and more often proposed and recommended and this means that even this strategic sector is using wine as a prod-uct that qualifies and completes a certain level of gastronomic proposal. This small signs are starting virtuous dynamics upstream of the distribution chain, if it is true that over the last few years we have been experiencing a growing direct interest in Ital-ian wines by importers and dis-tributors: it means that there is an increasing demand by the consumers. If the online sales and those carried out through large-scale retail chains are the present channels, the future will imply a consumption in-crease of more Western-style wines, at least for Italian pre-mium wine, which, more than any other, needs consumer’s knowledge.
China is a market with great potential, where Italy is called to play a leading role, being the first world producer and
exporter. Today, there is still a deep gap separa-ting Italy from other countries that arrived be-fore, like France, or better, like Australia or Chile more recently: actually, the automatic relation “Italy means wine”, which is typical of the USA or of Germany, is not common in China, but it has to be created.Being this a market that is growing year by year and having Italy no particular sales problems either worldwide or in the domestic market, which is coming back to pre-crisis levels, I think that there is scope to plan mid-long-term stra-tegies that may be based on some key points: first of all, the qualitative profile of the product, which visually corresponds to its positioning on the shelf. Although legitimately there is a place for a very wide range of wines, from entry- level to high-end products, I believe that medium-hi-gh quality products are those that should ideally express Italian production. These are the wines that could spread the image of a wine-making country, capable of identifying and understan-ding the market target and the consumers’ range that is pushing more in terms of consum-ption, i.e. the Chinese middle class, today living in the first- and second-tier cities.As far as the product portfolio is concerned, I think that it is useful to keep in mind the exam-ple of the French: although they have a system of designation as articulated and complicated as the Italian one, they have some universally well-known examples representing all wines (Bordeaux, Burgundy, Champagne and recently Provence in the USA), which favourably drive the other wine types. It is not by chance that in the Chinese market, where Bordeaux is a “must”, to-day even the “second rows” are growing, such as Rhône and Languedoc-Roussillon. If we intend
to follow this path, which should be virtuous ac-cording to the figures, when approaching mar-keting and promotion issues, the challenge for our country will be to try identifying those “spe-cial types”, capable of drawing the attention of consumers and leading the way with downstre-am effects for the whole system. In order to hold everything together, then we must build the framework, i.e. the general ima-ge of Italy as a wine-making country. Conside-ring the size and the peculiarities of the market and due to its structural deficits (lack of Italian immigration, absence of driving effect coming from Italian cooking), I think that it is neces-sary to connect wine with other sectors, which already identify our country as producer of ex-cellence: not only food farming, but also fashion, design and luxury car production. Product quality, clearer communication and information about our large variety, a country brand: if we succeed in composing this mosaic, there will really be numerous opportunities in China for Italian wine-makers - for all of them, small and big ones.
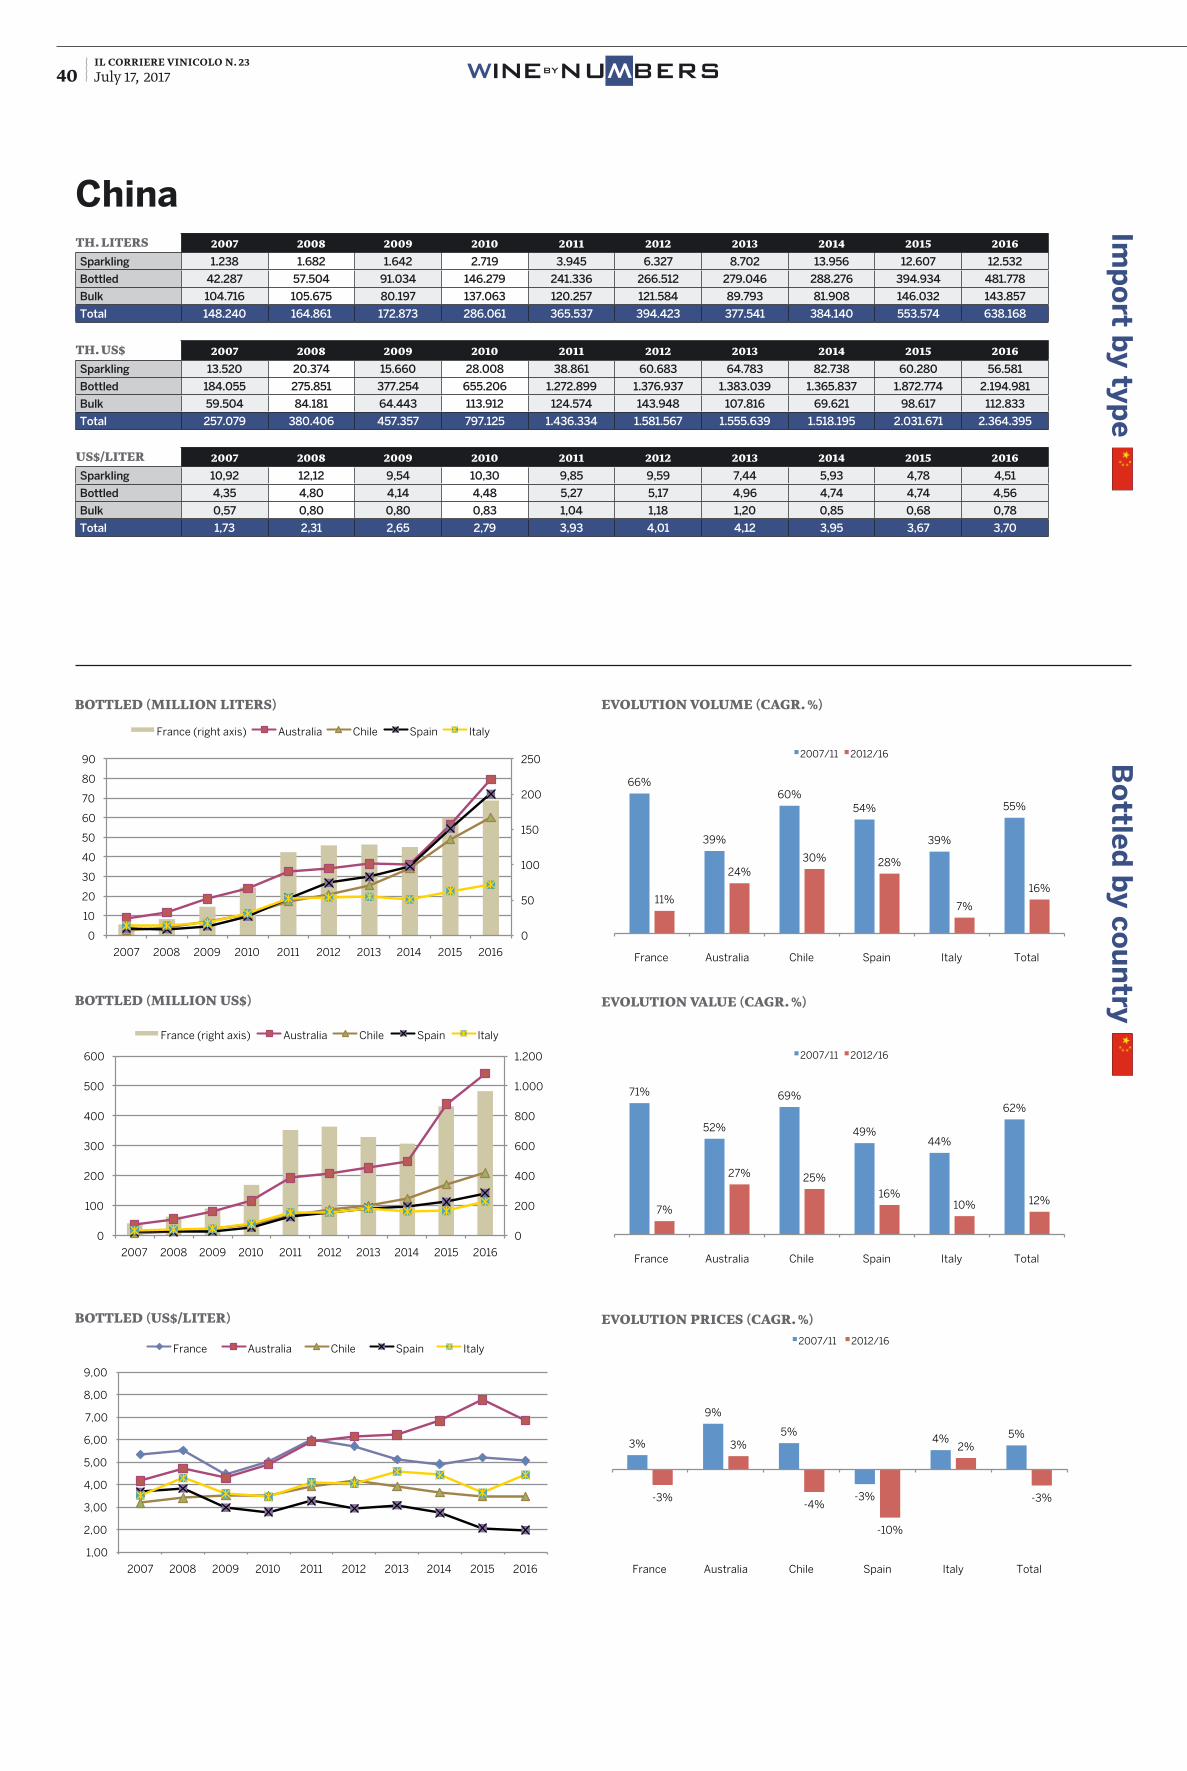
il corriere vinicolo n. 23July 17, 2017 40 BYNUWBERSWINE
W
th. liters 2007 2008 2009 2010 2011 2012 2013 2014 2015 2016Sparkling 1.238 1.682 1.642 2.719 3.945 6.327 8.702 13.956 12.607 12.532
Bottled 42.287 57.504 91.034 146.279 241.336 266.512 279.046 288.276 394.934 481.778
Bulk 104.716 105.675 80.197 137.063 120.257 121.584 89.793 81.908 146.032 143.857
Total 148.240 164.861 172.873 286.061 365.537 394.423 377.541 384.140 553.574 638.168
th. Us$ 2007 2008 2009 2010 2011 2012 2013 2014 2015 2016Sparkling 13.520 20.374 15.660 28.008 38.861 60.683 64.783 82.738 60.280 56.581
Bottled 184.055 275.851 377.254 655.206 1.272.899 1.376.937 1.383.039 1.365.837 1.872.774 2.194.981
Bulk 59.504 84.181 64.443 113.912 124.574 143.948 107.816 69.621 98.617 112.833
Total 257.079 380.406 457.357 797.125 1.436.334 1.581.567 1.555.639 1.518.195 2.031.671 2.364.395
Us$/liter 2007 2008 2009 2010 2011 2012 2013 2014 2015 2016Sparkling 10,92 12,12 9,54 10,30 9,85 9,59 7,44 5,93 4,78 4,51
Bottled 4,35 4,80 4,14 4,48 5,27 5,17 4,96 4,74 4,74 4,56
Bulk 0,57 0,80 0,80 0,83 1,04 1,18 1,20 0,85 0,68 0,78
Total 1,73 2,31 2,65 2,79 3,93 4,01 4,12 3,95 3,67 3,70
Bo
ttled
by co
un
try
bottled (million liters) evolUtion volUme (Cagr. %)
evolUtion valUe (Cagr. %)
evolUtion priCes (Cagr. %)
bottled (million Us$)
bottled (Us$/liter)
0
200
400
600
800
1.000
1.200
0
100
200
300
400
500
600
2007 2008 2009 2010 2011 2012 2013 2014 2015 2016
Bottled (million US$)
France (right axis) Australia Chile Spain Italy
0
50
100
150
200
250
0
10
20
30
40
50
60
70
80
90
2007 2008 2009 2010 2011 2012 2013 2014 2015 2016
Bottled (million liters)
France (right axis) Australia Chile Spain Italy
1,00
2,00
3,00
4,00
5,00
6,00
7,00
8,00
9,00
2007 2008 2009 2010 2011 2012 2013 2014 2015 2016
Bottled (US$/liter)
France Australia Chile Spain Italy
66%
39%
60% 54%
39%
55%
11%
24% 30% 28%
7%
16%
France Australia Chile Spain Italy Total
Evolution volume (Cagr %)
2007/11 2012/16
71%
52%
69%
49% 44%
62%
7%
27% 25%
16% 10% 12%
France Australia Chile Spain Italy Total
Evolution value (Cagr %)
2007/11 2012/16
3%
9%
5%
-3%
4% 5%
-3%
3%
-4%
-10%
2%
-3%
France Australia Chile Spain Italy Total
Evolution prices (Cagr %)
2007/11 2012/16
Imp
ort b
y type
China
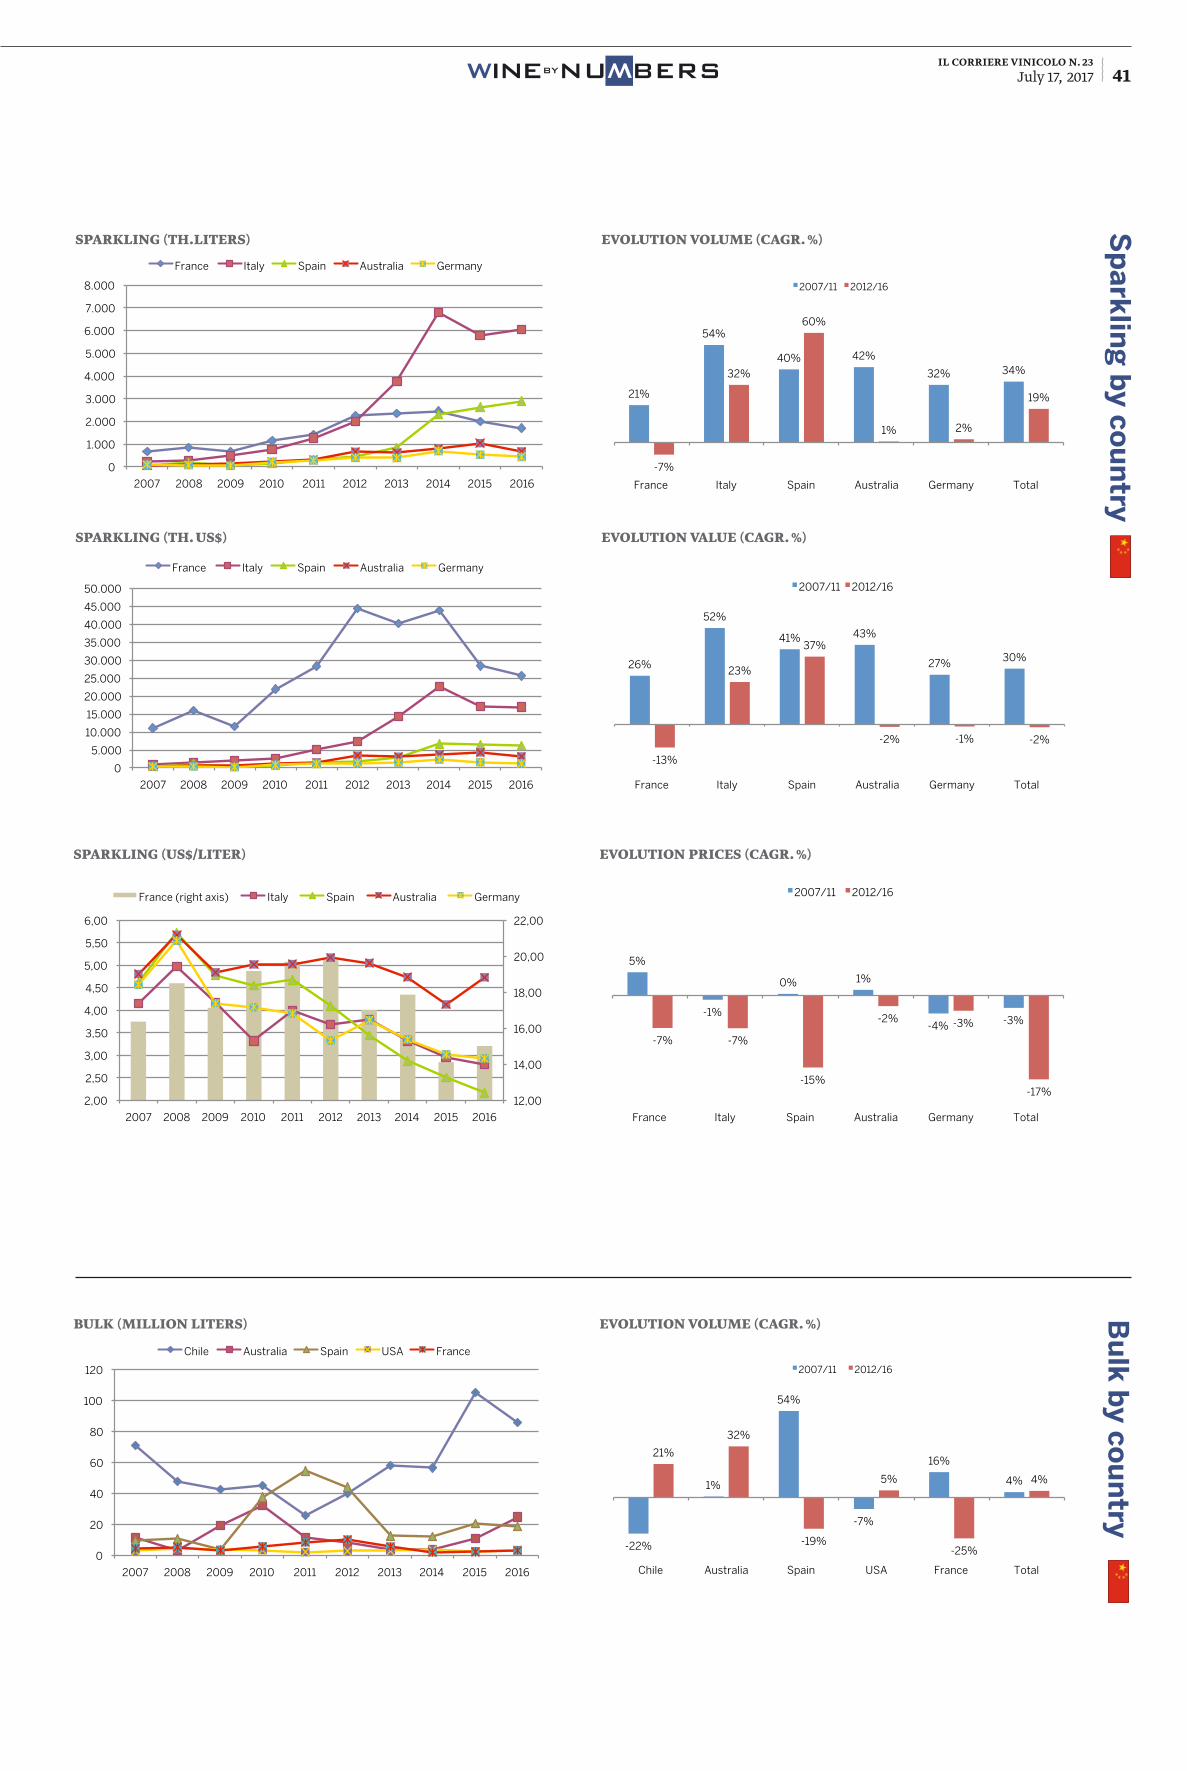
il corriere vinicolo n. 23July 17, 2017 41BYNUWBERSWINE
W
evolUtion volUme (Cagr. %)bUlk (million liters) Bu
lk b
y cou
ntry
sparkling (Us$/liter) evolUtion priCes (Cagr. %)
12,00
14,00
16,00
18,00
20,00
22,00
2,00
2,50
3,00
3,50
4,00
4,50
5,00
5,50
6,00
2007 2008 2009 2010 2011 2012 2013 2014 2015 2016
Sparkling (US$/liter)
France (right axis) Italy Spain Australia Germany
0
20
40
60
80
100
120
2007 2008 2009 2010 2011 2012 2013 2014 2015 2016
Bulk (million liters)
Chile Australia Spain USA France
sparkling (th. Us$) evolUtion valUe (Cagr. %)
Sp
ark
ling
by co
un
try
0
5.000
10.000
15.000
20.000
25.000
30.000
35.000
40.000
45.000
50.000
2007 2008 2009 2010 2011 2012 2013 2014 2015 2016
Sparkling (th. US$)
France Italy Spain Australia Germany
sparkling (th.liters) evolUtion volUme (Cagr. %)
0
1.000
2.000
3.000
4.000
5.000
6.000
7.000
8.000
2007 2008 2009 2010 2011 2012 2013 2014 2015 2016
Sparkling (th. liters)
France Italy Spain Australia Germany
21%
54%
40% 42%
32% 34%
-7%
32%
60%
1% 2%
19%
France Italy Spain Australia Germany Total
Evolution volume (Cagr %)
2007/11 2012/16
26%
52%
41% 43%
27% 30%
-13%
23%
37%
-2% -1% -2%
France Italy Spain Australia Germany Total
Evolution value (Cagr %)
2007/11 2012/16
5%
-1%
0% 1%
-4% -3%
-7% -7%
-15%
-2% -3%
-17%
France Italy Spain Australia Germany Total
Evolution prices (Cagr %)
2007/11 2012/16
-22%
1%
54%
-7%
16%
4%
21%
32%
-19%
5%
-25%
4%
Chile Australia Spain USA France Total
Evolution volume (Cagr %)
2007/11 2012/16
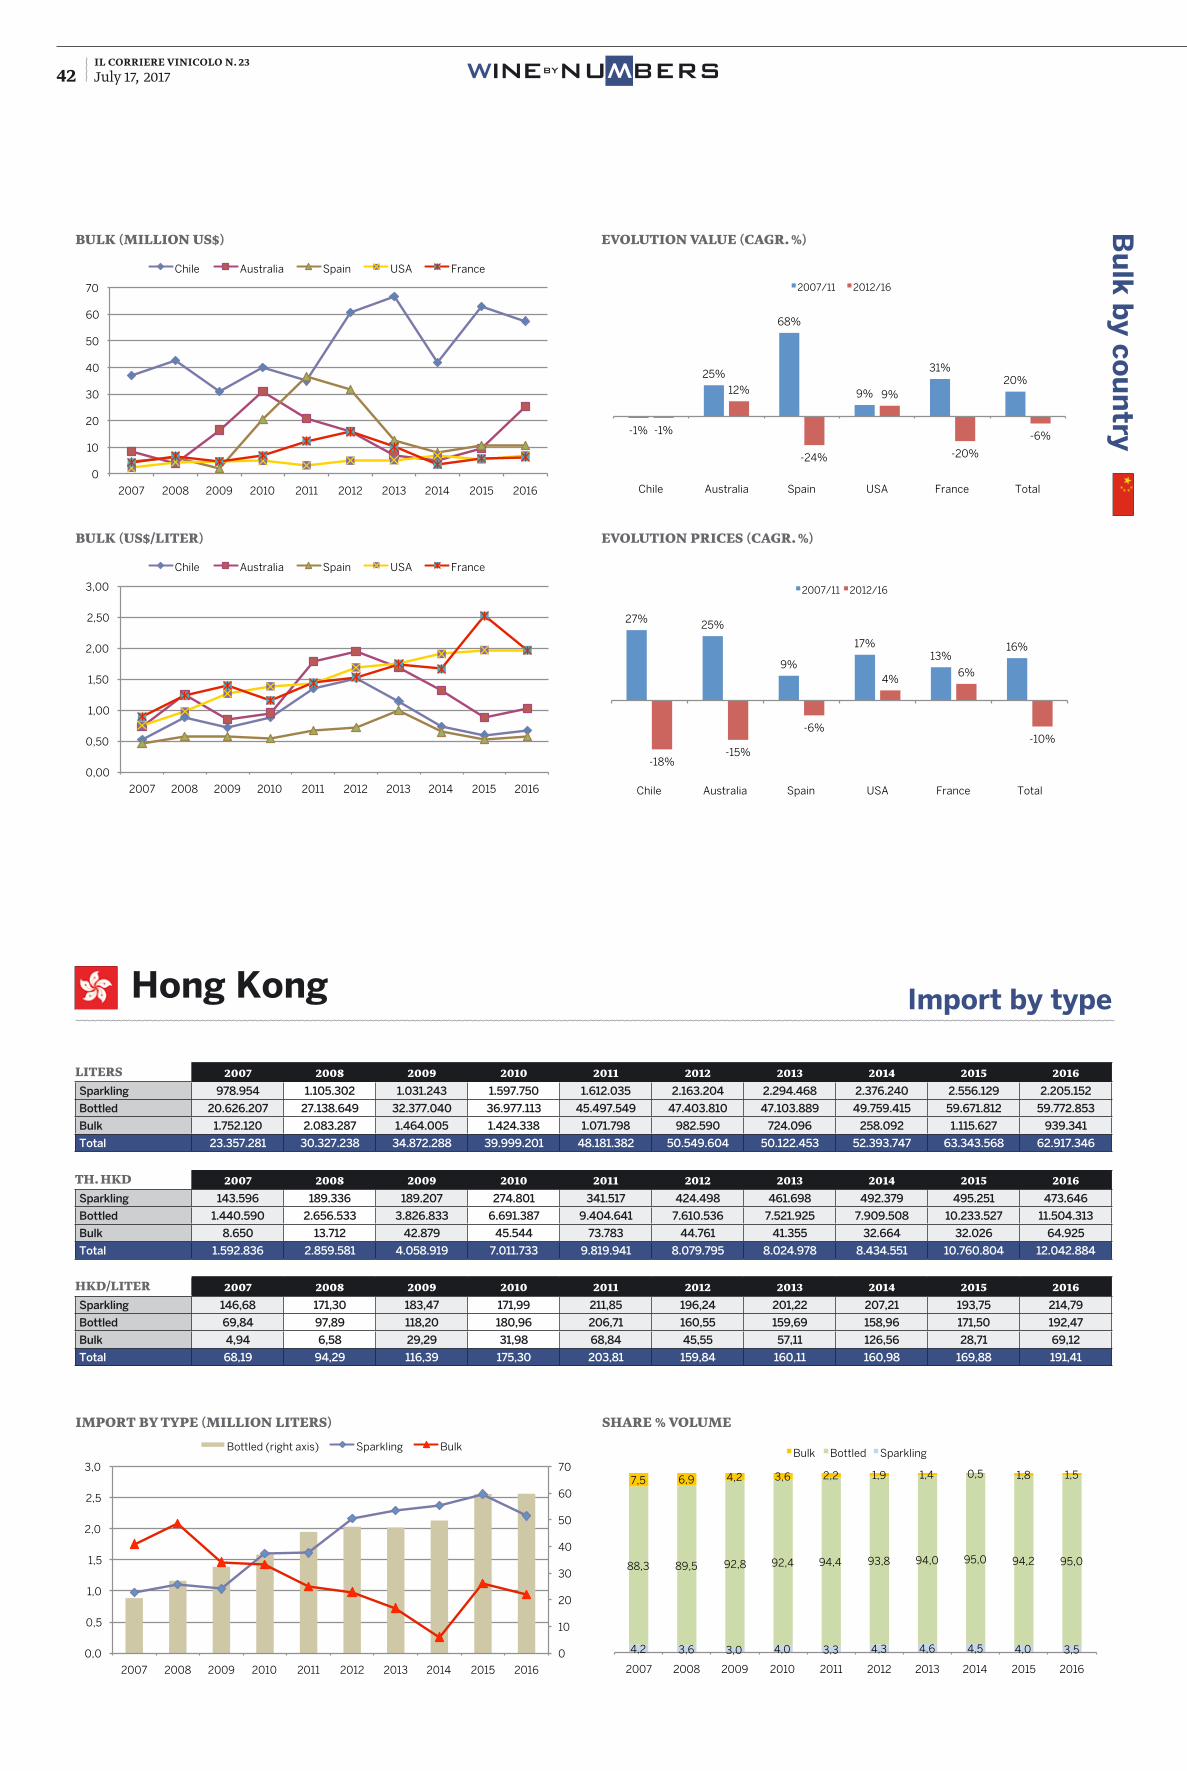
il corriere vinicolo n. 23July 17, 2017 42 BYNUWBERSWINE
W
liters 2007 2008 2009 2010 2011 2012 2013 2014 2015 2016Sparkling 978.954 1.105.302 1.031.243 1.597.750 1.612.035 2.163.204 2.294.468 2.376.240 2.556.129 2.205.152
Bottled 20.626.207 27.138.649 32.377.040 36.977.113 45.497.549 47.403.810 47.103.889 49.759.415 59.671.812 59.772.853
Bulk 1.752.120 2.083.287 1.464.005 1.424.338 1.071.798 982.590 724.096 258.092 1.115.627 939.341
Total 23.357.281 30.327.238 34.872.288 39.999.201 48.181.382 50.549.604 50.122.453 52.393.747 63.343.568 62.917.346
th. hkd 2007 2008 2009 2010 2011 2012 2013 2014 2015 2016Sparkling 143.596 189.336 189.207 274.801 341.517 424.498 461.698 492.379 495.251 473.646
Bottled 1.440.590 2.656.533 3.826.833 6.691.387 9.404.641 7.610.536 7.521.925 7.909.508 10.233.527 11.504.313
Bulk 8.650 13.712 42.879 45.544 73.783 44.761 41.355 32.664 32.026 64.925
Total 1.592.836 2.859.581 4.058.919 7.011.733 9.819.941 8.079.795 8.024.978 8.434.551 10.760.804 12.042.884
hkd/liter 2007 2008 2009 2010 2011 2012 2013 2014 2015 2016Sparkling 146,68 171,30 183,47 171,99 211,85 196,24 201,22 207,21 193,75 214,79
Bottled 69,84 97,89 118,20 180,96 206,71 160,55 159,69 158,96 171,50 192,47
Bulk 4,94 6,58 29,29 31,98 68,84 45,55 57,11 126,56 28,71 69,12
Total 68,19 94,29 116,39 175,30 203,81 159,84 160,11 160,98 169,88 191,41
Import by typeHong Kong
import by type (million liters)
0
10
20
30
40
50
60
70
0,0
0,5
1,0
1,5
2,0
2,5
3,0
2007 2008 2009 2010 2011 2012 2013 2014 2015 2016
Import by type (million liters)
Bottled (right axis) Sparkling Bulk
share % volUme
4,2 3,6 3,0 4,0 3,3 4,3 4,6 4,5 4,0 3,5
88,3 89,5 92,8 92,4 94,4 93,8 94,0 95,0 94,2 95,0
7,5 6,9 4,2 3,6 2,2 1,9 1,4 0,5 1,8 1,5
2007 2008 2009 2010 2011 2012 2013 2014 2015 2016
Share % volume
Bulk Bottled Sparkling
evolUtion valUe (Cagr. %)
evolUtion priCes (Cagr. %)
bUlk (million Us$)
bUlk (Us$/liter)
0
10
20
30
40
50
60
70
2007 2008 2009 2010 2011 2012 2013 2014 2015 2016
Bulk (million US$)
Chile Australia Spain USA France
0,00
0,50
1,00
1,50
2,00
2,50
3,00
2007 2008 2009 2010 2011 2012 2013 2014 2015 2016
Bulk (US$/liter)
Chile Australia Spain USA France
-1%
25%
68%
9%
31% 20%
-1%
12%
-24%
9%
-20%
-6%
Chile Australia Spain USA France Total
Evolution value (Cagr %)
2007/11 2012/16
27% 25%
9%
17% 13%
16%
-18% -15%
-6%
4% 6%
-10%
Chile Australia Spain USA France Total
Evolution prices (Cagr %)
2007/11 2012/16
Bu
lk b
y cou
ntry
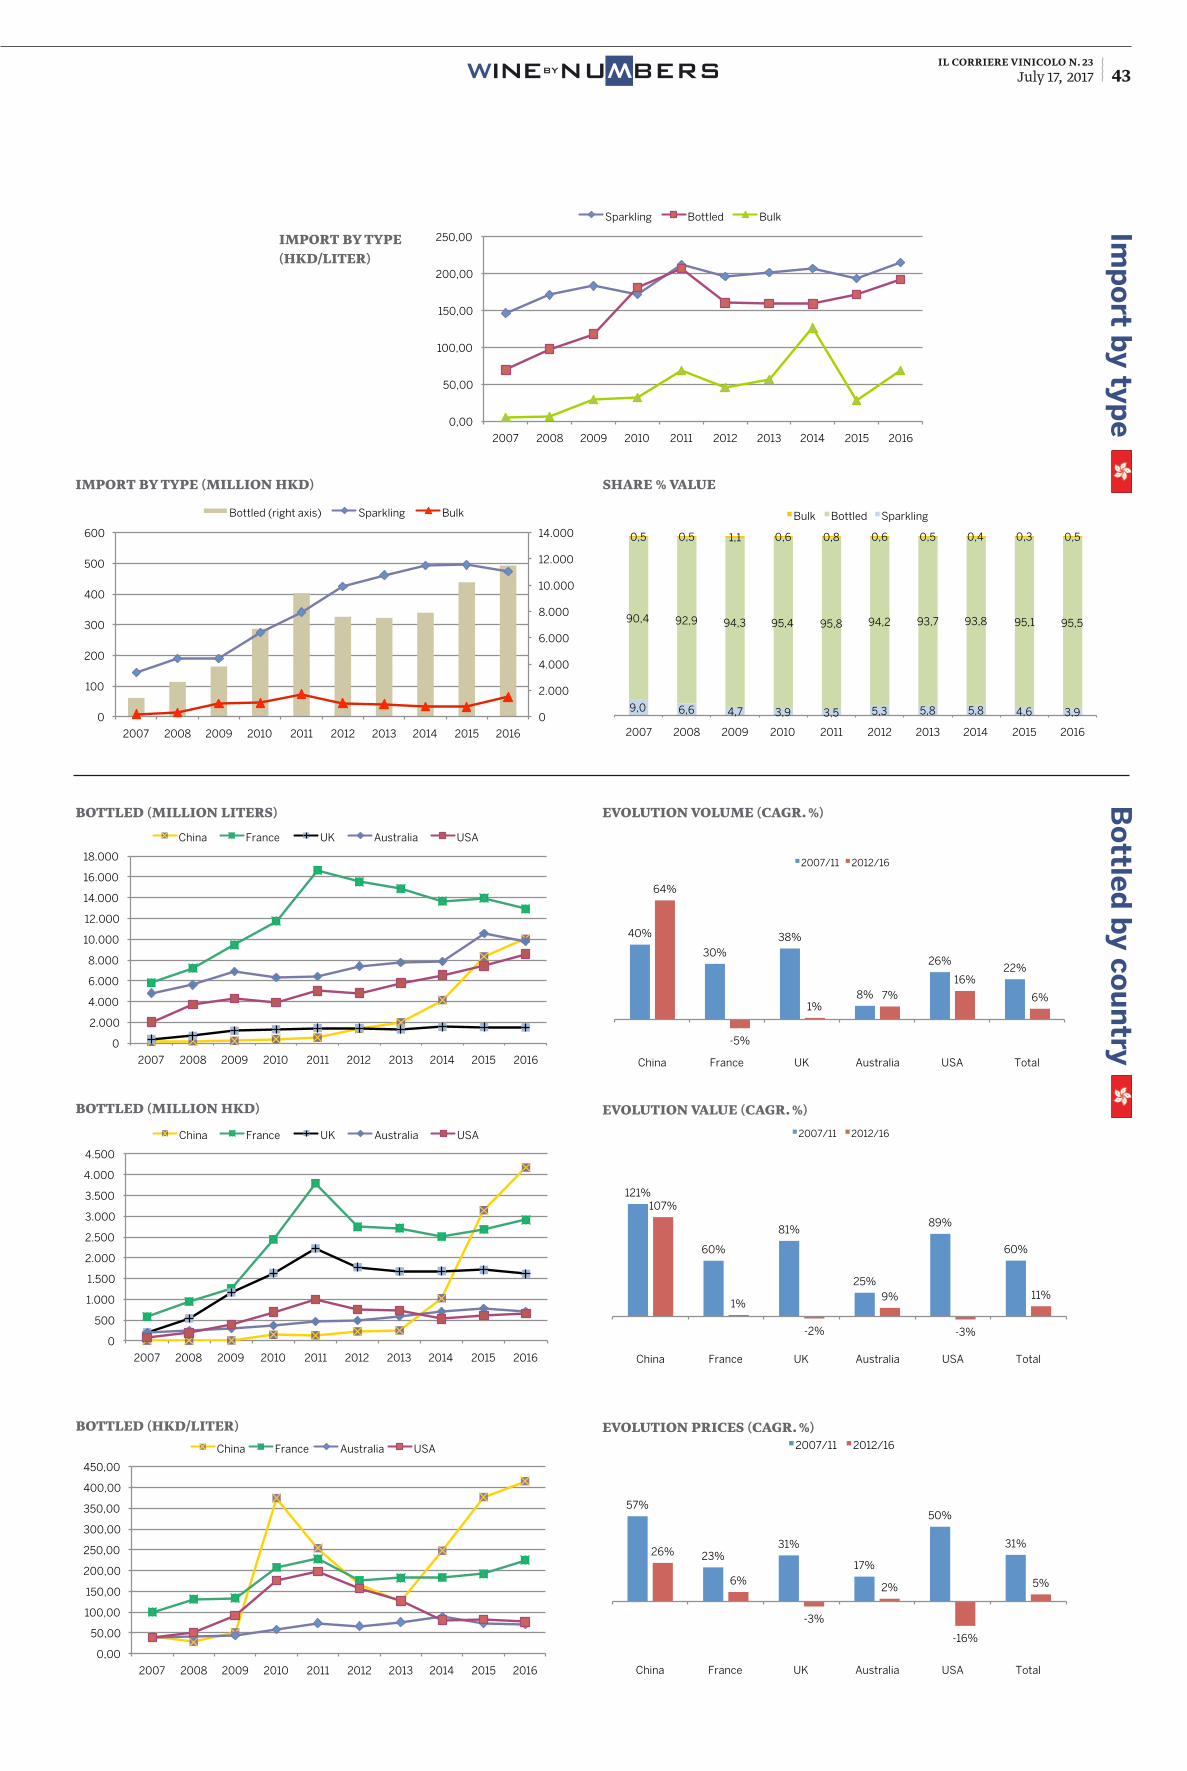
il corriere vinicolo n. 23July 17, 2017 43BYNUWBERSWINE
W
import by type (million hkd)
0
2.000
4.000
6.000
8.000
10.000
12.000
14.000
0
100
200
300
400
500
600
2007 2008 2009 2010 2011 2012 2013 2014 2015 2016
Import by type (million HKD)
Bottled (right axis) Sparkling Bulk
Bo
ttled
by co
un
tryIm
po
rt by typ
e
bottled (million liters) evolUtion volUme (Cagr. %)
evolUtion valUe (Cagr. %)
evolUtion priCes (Cagr. %)
bottled (million hkd)
bottled (hkd/liter)
0
2.000
4.000
6.000
8.000
10.000
12.000
14.000
16.000
18.000
2007 2008 2009 2010 2011 2012 2013 2014 2015 2016
Bottled (million liter)
China France UK Australia USA
0
500
1.000
1.500
2.000
2.500
3.000
3.500
4.000
4.500
2007 2008 2009 2010 2011 2012 2013 2014 2015 2016
Bottled (million HKD)
China France UK Australia USA
0,00
50,00
100,00
150,00
200,00
250,00
300,00
350,00
400,00
450,00
2007 2008 2009 2010 2011 2012 2013 2014 2015 2016
Bottled (HKD/liter)
China France Australia USA
share % valUe
9,0 6,6 4,7 3,9 3,5 5,3 5,8 5,8 4,6 3,9
90,4 92,9 94,3 95,4 95,8 94,2 93,7 93,8 95,1 95,5
0,5 0,5 1,1 0,6 0,8 0,6 0,5 0,4 0,3 0,5
2007 2008 2009 2010 2011 2012 2013 2014 2015 2016
Share % value
Bulk Bottled Sparkling
import by type (hkd/liter)
0,00
50,00
100,00
150,00
200,00
250,00
2007 2008 2009 2010 2011 2012 2013 2014 2015 2016
Import by type (HKD/liter)
Sparkling Bottled Bulk
40%
30% 38%
8%
26% 22%
64%
-5%
1% 7%
16%
6%
China France UK Australia USA Total
Evolution volume (Cagr % 2011/16)
2007/11 2012/16
121%
60%
81%
25%
89%
60%
107%
1%
-2%
9%
-3%
11%
China France UK Australia USA Total
Evolution value (Cagr % 2011/16)
2007/11 2012/16
57%
23% 31%
17%
50%
31% 26%
6%
-3%
2%
-16%
5%
China France UK Australia USA Total
Evolution prices (Cagr % 2011/16)
2007/11 2012/16
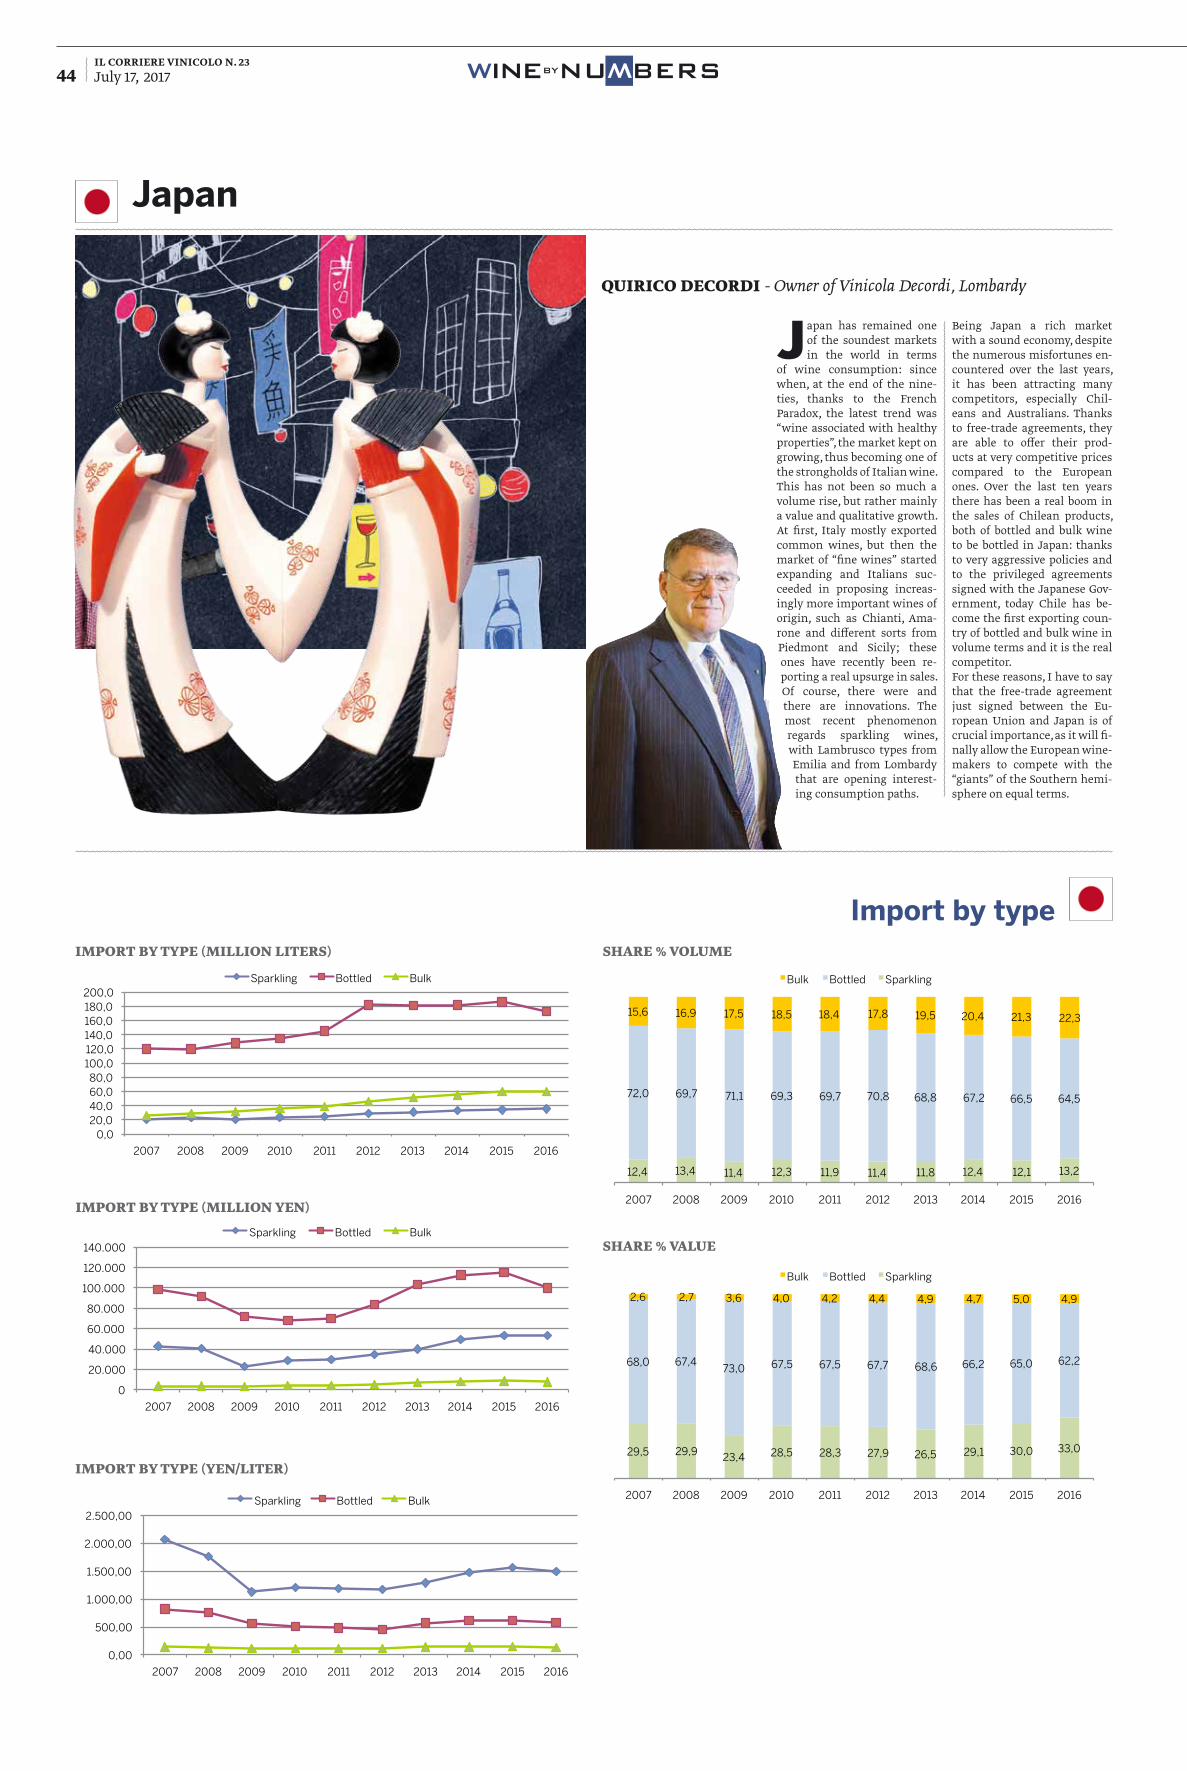
il corriere vinicolo n. 23July 17, 2017 44 BYNUWBERSWINE
W
Import by type
Japan
import by type (million yen)
import by type (million liters)
import by type (yen/liter)
share % valUe
share % volUme
12,4 13,4 11,4 12,3 11,9 11,4 11,8 12,4 12,1 13,2
72,0 69,7 71,1 69,3 69,7 70,8 68,8 67,2 66,5 64,5
15,6 16,9 17,5 18,5 18,4 17,8 19,5 20,4 21,3 22,3
2007 2008 2009 2010 2011 2012 2013 2014 2015 2016
Share % volume
Bulk Bottled Sparkling
29,5 29,9 23,4 28,5 28,3 27,9 26,5 29,1 30,0 33,0
68,0 67,4 73,0 67,5 67,5 67,7 68,6 66,2 65,0 62,2
2,6 2,7 3,6 4,0 4,2 4,4 4,9 4,7 5,0 4,9
2007 2008 2009 2010 2011 2012 2013 2014 2015 2016
Share % value
Bulk Bottled Sparkling
0
20.000
40.000
60.000
80.000
100.000
120.000
140.000
2007 2008 2009 2010 2011 2012 2013 2014 2015 2016
Import by type (million yen) Sparkling Bottled Bulk
0,00
500,00
1.000,00
1.500,00
2.000,00
2.500,00
2007 2008 2009 2010 2011 2012 2013 2014 2015 2016
Import by type (yen/liter)
Sparkling Bottled Bulk
0,0 20,0 40,0 60,0 80,0
100,0 120,0 140,0 160,0 180,0 200,0
2007 2008 2009 2010 2011 2012 2013 2014 2015 2016
Import by type (million liters)
Sparkling Bottled Bulk
qUiriCo deCordi - Owner of Vinicola Decordi, Lombardy
Japan has remained one of the soundest markets in the world in terms
of wine consumption: since when, at the end of the nine-ties, thanks to the French Paradox, the latest trend was “wine associated with healthy properties”, the market kept on growing, thus becoming one of the strongholds of Italian wine.This has not been so much a volume rise, but rather mainly a value and qualitative growth. At first, Italy mostly exported common wines, but then the market of “fine wines” started expanding and Italians suc-ceeded in proposing increas-ingly more important wines of origin, such as Chianti, Ama-rone and different sorts from Piedmont and Sicily; these ones have recently been re-porting a real upsurge in sales.Of course, there were and there are innovations. The most recent phenomenon regards sparkling wines, with Lambrusco types from Emilia and from Lombardy that are opening interest-ing consumption paths.
Being Japan a rich market with a sound economy, despite the numerous misfortunes en-countered over the last years, it has been attracting many competitors, especially Chil-eans and Australians. Thanks to free-trade agreements, they are able to offer their prod-ucts at very competitive prices compared to the European ones. Over the last ten years there has been a real boom in the sales of Chilean products, both of bottled and bulk wine to be bottled in Japan: thanks to very aggressive policies and to the privileged agreements signed with the Japanese Gov-ernment, today Chile has be-come the first exporting coun-try of bottled and bulk wine in volume terms and it is the real competitor. For these reasons, I have to say that the free-trade agreement just signed between the Eu-ropean Union and Japan is of crucial importance, as it will fi-nally allow the European wine-makers to compete with the “giants” of the Southern hemi-sphere on equal terms.
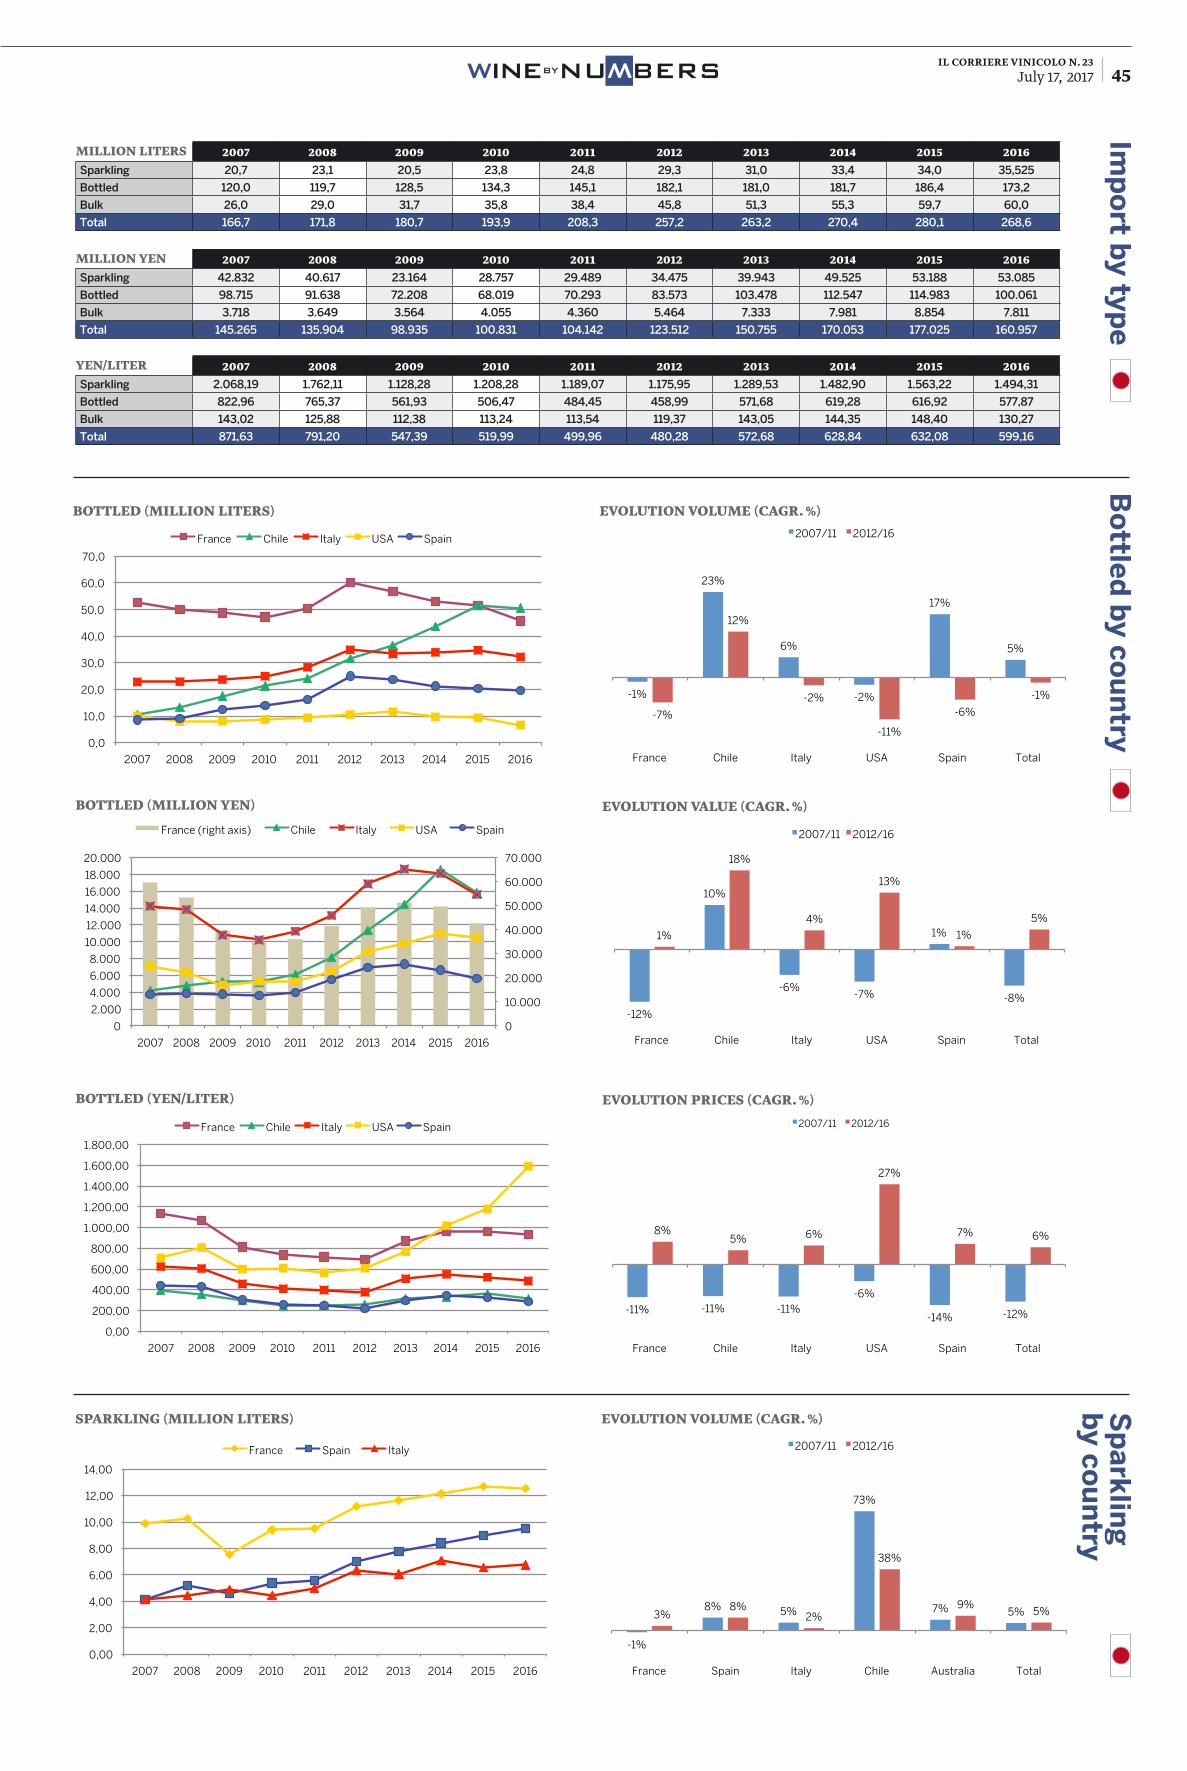
il corriere vinicolo n. 23July 17, 2017 45BYNUWBERSWINE
W
Bo
ttled
by co
un
tryIm
po
rt by typ
eS
pa
rklin
g
by co
un
try
0
10.000
20.000
30.000
40.000
50.000
60.000
70.000
0
2.000
4.000
6.000
8.000
10.000
12.000
14.000
16.000
18.000
20.000
2007 2008 2009 2010 2011 2012 2013 2014 2015 2016
Bottled (million yen)
France (right axis) Chile Italy USA Spain
evolUtion valUe (Cagr. %)
evolUtion priCes (Cagr. %)
bottled (million yen)
bottled (yen/liter)
0,00
200,00
400,00
600,00
800,00
1.000,00
1.200,00
1.400,00
1.600,00
1.800,00
2007 2008 2009 2010 2011 2012 2013 2014 2015 2016
Bottled (yen/liter)
France Chile Italy USA Spain
sparkling (million liters) evolUtion volUme (Cagr. %)
0,00
2,00
4,00
6,00
8,00
10,00
12,00
14,00
2007 2008 2009 2010 2011 2012 2013 2014 2015 2016
Sparkling (million liters)
France Spain Italy
bottled (million liters) evolUtion volUme (Cagr. %)
0,0
10,0
20,0
30,0
40,0
50,0
60,0
70,0
2007 2008 2009 2010 2011 2012 2013 2014 2015 2016
Bottled (million liters)
France Chile Italy USA Spain
million liters 2007 2008 2009 2010 2011 2012 2013 2014 2015 2016Sparkling 20,7 23,1 20,5 23,8 24,8 29,3 31,0 33,4 34,0 35,525
Bottled 120,0 119,7 128,5 134,3 145,1 182,1 181,0 181,7 186,4 173,2
Bulk 26,0 29,0 31,7 35,8 38,4 45,8 51,3 55,3 59,7 60,0
Total 166,7 171,8 180,7 193,9 208,3 257,2 263,2 270,4 280,1 268,6
million yen 2007 2008 2009 2010 2011 2012 2013 2014 2015 2016Sparkling 42.832 40.617 23.164 28.757 29.489 34.475 39.943 49.525 53.188 53.085
Bottled 98.715 91.638 72.208 68.019 70.293 83.573 103.478 112.547 114.983 100.061
Bulk 3.718 3.649 3.564 4.055 4.360 5.464 7.333 7.981 8.854 7.811
Total 145.265 135.904 98.935 100.831 104.142 123.512 150.755 170.053 177.025 160.957
yen/liter 2007 2008 2009 2010 2011 2012 2013 2014 2015 2016Sparkling 2.068,19 1.762,11 1.128,28 1.208,28 1.189,07 1.175,95 1.289,53 1.482,90 1.563,22 1.494,31
Bottled 822,96 765,37 561,93 506,47 484,45 458,99 571,68 619,28 616,92 577,87
Bulk 143,02 125,88 112,38 113,24 113,54 119,37 143,05 144,35 148,40 130,27
Total 871,63 791,20 547,39 519,99 499,96 480,28 572,68 628,84 632,08 599,16
-1%
23%
6%
-2%
17%
5%
-7%
12%
-2%
-11%
-6%
-1%
France Chile Italy USA Spain Total
Evolution volume (Cagr %)
2007/11 2012/16
-12%
10%
-6% -7%
1%
-8%
1%
18%
4%
13%
1%
5%
France Chile Italy USA Spain Total
Evolution value (Cagr %)
2007/11 2012/16
-11% -11% -11% -6%
-14% -12%
8% 5% 6%
27%
7% 6%
France Chile Italy USA Spain Total
Evolution prices (Cagr %)
2007/11 2012/16
-1%
8% 5%
73%
7% 5% 3% 8%
2%
38%
9% 5%
France Spain Italy Chile Australia Total
Evolution volume (Cagr %)
2007/11 2012/16
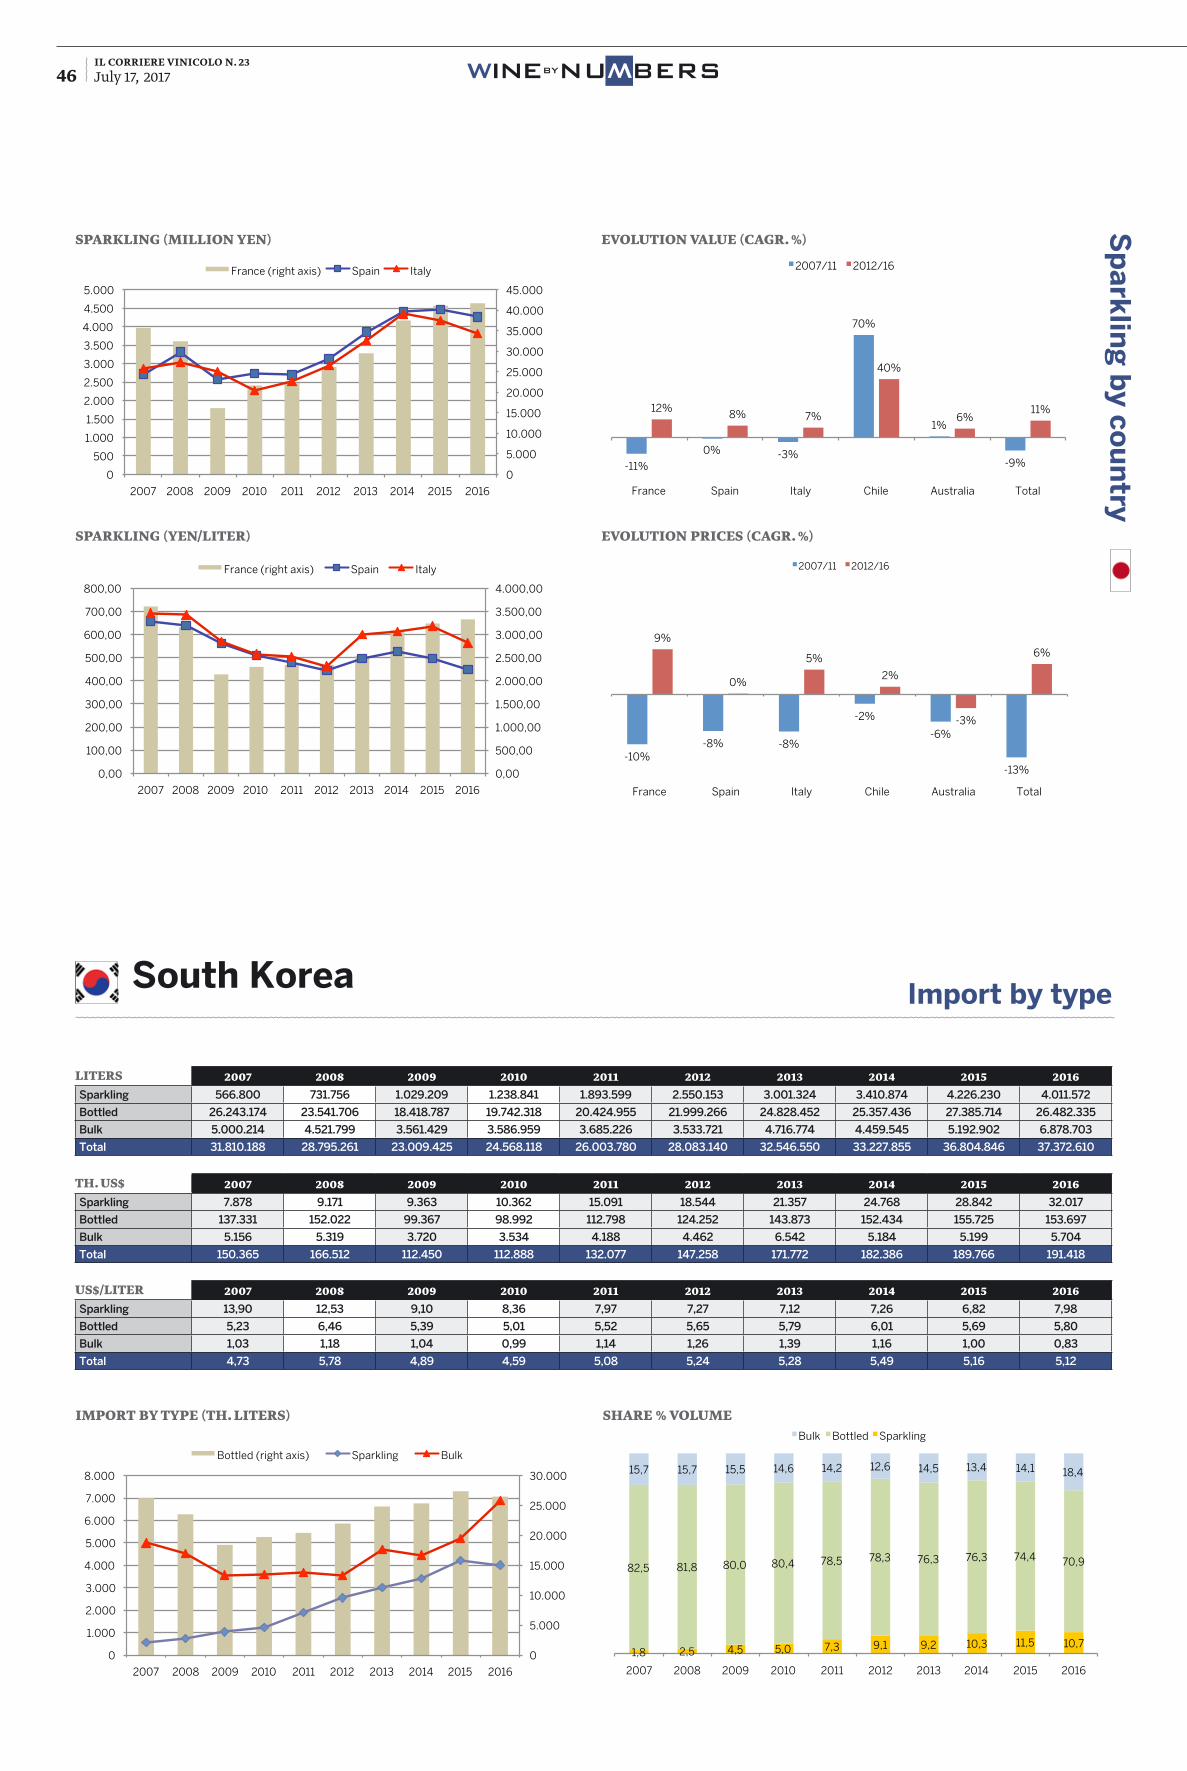
il corriere vinicolo n. 23July 17, 2017 46 BYNUWBERSWINE
W
Import by typeSouth Korea
import by type (th. liters)
liters 2007 2008 2009 2010 2011 2012 2013 2014 2015 2016Sparkling 566.800 731.756 1.029.209 1.238.841 1.893.599 2.550.153 3.001.324 3.410.874 4.226.230 4.011.572
Bottled 26.243.174 23.541.706 18.418.787 19.742.318 20.424.955 21.999.266 24.828.452 25.357.436 27.385.714 26.482.335
Bulk 5.000.214 4.521.799 3.561.429 3.586.959 3.685.226 3.533.721 4.716.774 4.459.545 5.192.902 6.878.703
Total 31.810.188 28.795.261 23.009.425 24.568.118 26.003.780 28.083.140 32.546.550 33.227.855 36.804.846 37.372.610
th. Us$ 2007 2008 2009 2010 2011 2012 2013 2014 2015 2016Sparkling 7.878 9.171 9.363 10.362 15.091 18.544 21.357 24.768 28.842 32.017
Bottled 137.331 152.022 99.367 98.992 112.798 124.252 143.873 152.434 155.725 153.697
Bulk 5.156 5.319 3.720 3.534 4.188 4.462 6.542 5.184 5.199 5.704
Total 150.365 166.512 112.450 112.888 132.077 147.258 171.772 182.386 189.766 191.418
Us$/liter 2007 2008 2009 2010 2011 2012 2013 2014 2015 2016Sparkling 13,90 12,53 9,10 8,36 7,97 7,27 7,12 7,26 6,82 7,98
Bottled 5,23 6,46 5,39 5,01 5,52 5,65 5,79 6,01 5,69 5,80
Bulk 1,03 1,18 1,04 0,99 1,14 1,26 1,39 1,16 1,00 0,83
Total 4,73 5,78 4,89 4,59 5,08 5,24 5,28 5,49 5,16 5,12
0
5.000
10.000
15.000
20.000
25.000
30.000
0
1.000
2.000
3.000
4.000
5.000
6.000
7.000
8.000
2007 2008 2009 2010 2011 2012 2013 2014 2015 2016
Import by type (th. liters)
Bottled (right axis) Sparkling Bulk
share % volUme
1,8 2,5 4,5 5,0 7,3 9,1 9,2 10,3 11,5 10,7
82,5 81,8 80,0 80,4 78,5 78,3 76,3 76,3 74,4 70,9
15,7 15,7 15,5 14,6 14,2 12,6 14,5 13,4 14,1 18,4
2007 2008 2009 2010 2011 2012 2013 2014 2015 2016
Share % volume
Bulk Bottled Sparkling
Sp
ark
ling
by co
un
try
sparkling (million yen)
sparkling (yen/liter)
evolUtion valUe (Cagr. %)
evolUtion priCes (Cagr. %)
0
5.000
10.000
15.000
20.000
25.000
30.000
35.000
40.000
45.000
0
500
1.000
1.500
2.000
2.500
3.000
3.500
4.000
4.500
5.000
2007 2008 2009 2010 2011 2012 2013 2014 2015 2016
Sparkling (million yen)
France (right axis) Spain Italy
0,00
500,00
1.000,00
1.500,00
2.000,00
2.500,00
3.000,00
3.500,00
4.000,00
0,00
100,00
200,00
300,00
400,00
500,00
600,00
700,00
800,00
2007 2008 2009 2010 2011 2012 2013 2014 2015 2016
Sparkling (yen/liter)
France (right axis) Spain Italy
-11%
0% -3%
70%
1%
-9%
12% 8% 7%
40%
6% 11%
France Spain Italy Chile Australia Total
Evolution value (Cagr %)
2007/11 2012/16
-10% -8% -8%
-2%
-6%
-13%
9%
0%
5%
2%
-3%
6%
France Spain Italy Chile Australia Total
Evolution prices (Cagr %)
2007/11 2012/16
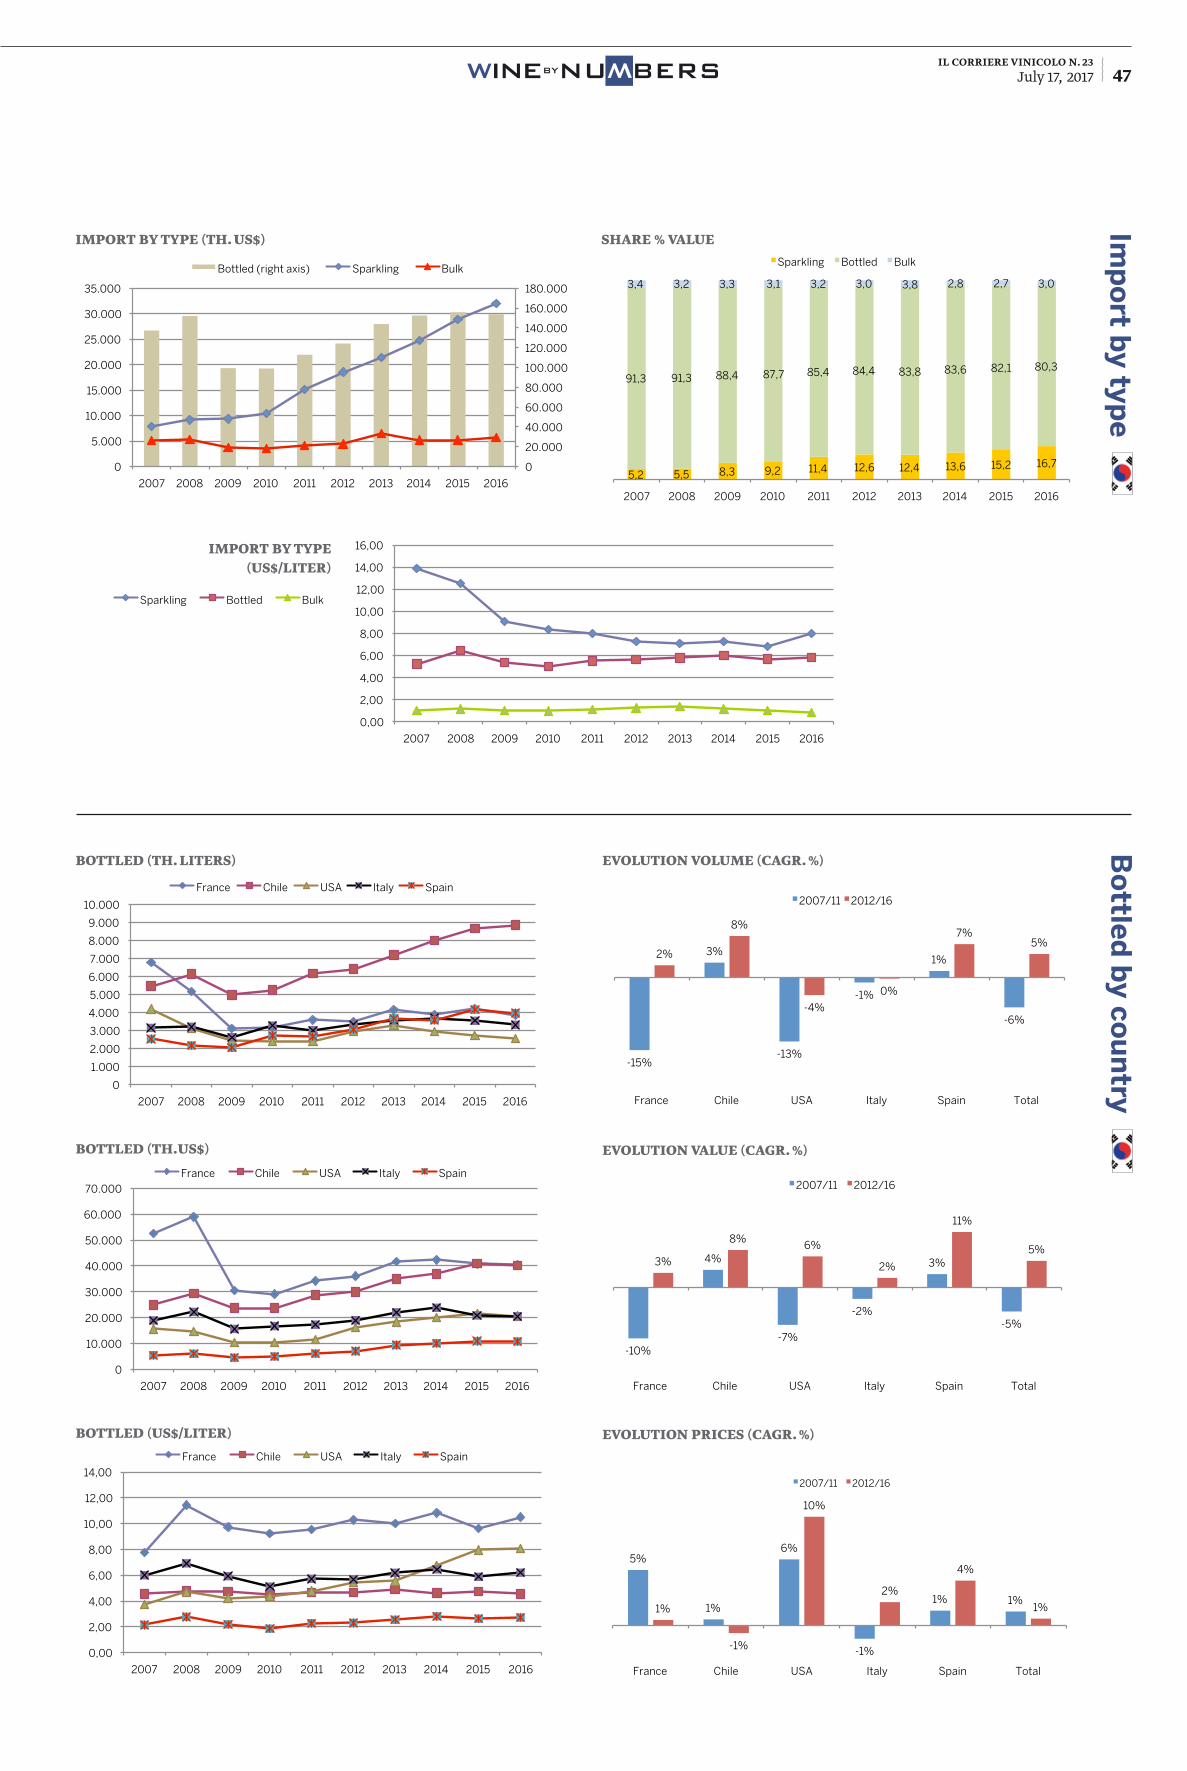
il corriere vinicolo n. 23July 17, 2017 47BYNUWBERSWINE
W
import by type (th. Us$)
import by type (Us$/liter)
0
20.000
40.000
60.000
80.000
100.000
120.000
140.000
160.000
180.000
0
5.000
10.000
15.000
20.000
25.000
30.000
35.000
2007 2008 2009 2010 2011 2012 2013 2014 2015 2016
Import by type (th. $)
Bottled (right axis) Sparkling Bulk
0,00
2,00
4,00
6,00
8,00
10,00
12,00
14,00
16,00
2007 2008 2009 2010 2011 2012 2013 2014 2015 2016
Import by type ($/liter)
Sparkling Bottled Bulk
0,00
2,00
4,00
6,00
8,00
10,00
12,00
14,00
16,00
2007 2008 2009 2010 2011 2012 2013 2014 2015 2016
Import by type ($/liter)
Sparkling Bottled Bulk
Imp
ort b
y type
share % valUe
5,2 5,5 8,3 9,2 11,4 12,6 12,4 13,6 15,2 16,7
91,3 91,3 88,4 87,7 85,4 84,4 83,8 83,6 82,1 80,3
3,4 3,2 3,3 3,1 3,2 3,0 3,8 2,8 2,7 3,0
2007 2008 2009 2010 2011 2012 2013 2014 2015 2016
Share % value
Sparkling Bottled Bulk
Bo
ttled
by co
un
try
bottled (th. liters) evolUtion volUme (Cagr. %)
evolUtion valUe (Cagr. %)
evolUtion priCes (Cagr. %)
bottled (th.Us$)
bottled (Us$/liter)
0
1.000
2.000
3.000
4.000
5.000
6.000
7.000
8.000
9.000
10.000
2007 2008 2009 2010 2011 2012 2013 2014 2015 2016
Bottled (th. liters)
France Chile USA Italy Spain
0
10.000
20.000
30.000
40.000
50.000
60.000
70.000
2007 2008 2009 2010 2011 2012 2013 2014 2015 2016
Bottled (th. $)
France Chile USA Italy Spain
0,00
2,00
4,00
6,00
8,00
10,00
12,00
14,00
2007 2008 2009 2010 2011 2012 2013 2014 2015 2016
Bottled ($/liter)
France Chile USA Italy Spain
-15%
3%
-13%
-1%
1%
-6%
2%
8%
-4%
0%
7% 5%
France Chile USA Italy Spain Total
Evolution volume (Cagr %)
2007/11 2012/16
-10%
4%
-7%
-2%
3%
-5%
3%
8% 6%
2%
11%
5%
France Chile USA Italy Spain Total
Evolution value (Cagr %)
2007/11 2012/16
5%
1%
6%
-1%
1% 1% 1%
-1%
10%
2%
4%
1%
France Chile USA Italy Spain Total
Evolution prices (Cagr %)
2007/11 2012/16
Dietro l’etichetta Nortan trovate i migliori impianti, professionistiesperti, risposte certe.Nortan nasce nel 1981 e da allora ha sempre mantenuto le proprie promesse. Quando un prodotto Nortan viene immesso sul mercato state certi: ha superato mille test. Se Nortan dice 30.000 bottiglie/ora è perchè sono 30.000 bottiglie/ora. Per i nuovi impianti della vostra linea di produzione chiamate Nortan. Trovere-te un consulente a 360°.
Un impianto Nortan vi garantisce molti anni di performances ineguagliabili.E’ facile da impiegare. E’ affidabile anche in condizioni estreme. E’ rapidamente conformabile a produzioni diverse. Garantisce altissima preci-sione. Dispone di coclea universale. Si comanda da un video “touch-screen”. Si regola automaticamente in funzione dell’altezza delle bottiglie. Ha velocità di produzione e delle torrette sincronizzate. Può essere acquistato sia per singole stazioni che in versione linea integrata.
Nortan S.r.l. Via dell'Industria 37040 VERONELLA (VR) ITALY - Tel.+39 0442 47844 - Fax +39 0442 47990 - www.nortan.it E-mail: [email protected]
Mod. PRISMA 20+20 TR
www.stp.it