Embed Size (px)
Citation preview

Q1 - March 2018
Global Workforce Trends
Quarterly Market Report

2ManpowerGroup Solutions QMR Q1, 2018
• Global Workforce Trends
• Regional Highlights
• Detailed Country Level Analysis
– North, South, & Central America
– Europe, Middle East, & Africa
– Asia-Pacific
Table of Contents

This report is intended to provide an overview of general business
information relative to global employment conditions and
considerations. It should not be interpreted as legal advice. Please
consult with legal counsel to ensure that you are in compliance with
all applicable laws.
4ManpowerGroup Solutions QMR Q1, 2018
Global Workforce Trends

5ManpowerGroup Solutions QMR Q1, 2018
Q1’18 Global Trends Overview
North
America
South &
Central
America
Europe
Middle East
& Africa
Asia-Pacific
Wages Restrictions Benefits Taxes
1. US – Minimum
wage & O/T
increasing
2. CA – Pay parity
1. US - Visa, Salary
History, & Drug
testing
1. US - State Paid-Leave
Increase
2. CA – Increased leave
1. US – State level
increases
2. CA – Provincial
increases
1. Organized labor and
collective bargaining
changes
2. Costa Rica laws
overhauled
1. Increasing burdens
& social insurance
2. Increasing use of
pensions & non-
wage incentives
1. Ongoing reform,
with minimal
consistency cross-
border
1. Varies by country
w/ UK regulations
uncertain post-
Brexit
1. Foreign worker
restrictions
increasing for CEE
workers
1. Increased use of
flex-schedule and
remote work in
white & gray collar
1. Taxation of x-EU
workers in/out of UK
may adjust
1. Increasing
insurance costs
raise burden/bill
rates
1. Foreign worker
restrictions
increasing in Islam
States
1. Healthcare reform &
social insurance
ongoing review
1. Taxation +
insurance
increasing costs of
employment
1. O/T restrictions
rising – Japan &
China w/new
guidelines
1. Foreign worker
restrictions in
Singapore &
elsewhere
1. Reduced work hour
closer to global
average of 8.5/day
1. Rising taxes, esp.
China undermine
cost savings of
wages
1. Chile/Brazil
increased O/T law
2. Central America
tiered wage
schedules
Source: ManpowerGroup Solutions 2017 Total Workforce Index

6ManpowerGroup Solutions QMR Q1, 2018
Workforce Demographics Have Evolved
49% of college students are female
52% of global workforce is in China & India
21% of global workforce is in Middle East
41% of global workforce are baby boomers nearing retirement
9% of global workforce works from home
occasionally
20.8% of global workforce is informal31% of US workforce
works from home occasionally
20% of migrant workforce originate from China, India, & Philippines
Source: ManpowerGroup Solutions 2017 Total Workforce Index
7ManpowerGroup Solutions QMR Q1, 2018
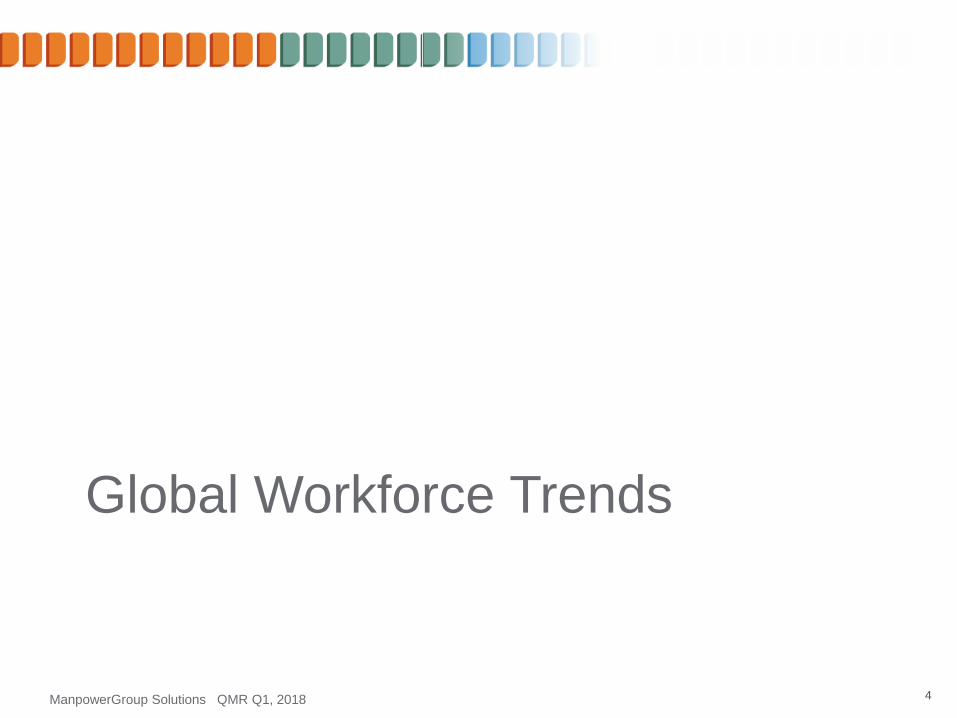
Key Labor Trends for 2018 Planning
Skills Demand
Increasing demand for digitization across industries
Increased focus on hiring fewer years of experience
Career Mapping
Organizational restructuring accounts for 17.8% of organizational movement in 2017
Real-estate consolidation directly impacts nearly 1/3 of remote workforce strategies
Cost Savings
Location of hire driving 18% of cost savings
Hiring 1-3 years experience saves 8-14% over 4 years
O/T mapping can save 5-8% on current O/T spend
Legislative Impact
Paid Sick Leave & O/T regulations have highest impact in the US
Salary History ban and marijuana legislation increasingly adopted in US, impacting hiring process
Source: ManpowerGroup Solutions 2017 Total Workforce Index

8ManpowerGroup Solutions QMR Q1, 2018
Flexibility in labor law, but these
countries require dedicated programs
More innovative models not restricted
to contingent labor are necessary
Flexible legislation and abundant
workers enable MSP delivery in these
markets – usually leveraged on price
An established partner is required in
these markets to manage labor legislation and
achieve flexibility and efficiency
1 Relative rank calculated based on
active regulations related to contractual
terms, costs or labor and termination,
hiring and firing restrictions, and
enforced consequences
2 Relative rank determined by MSP
awareness, knowledge, and adoption
Source: ManpowerGroup Solutions 2017 Total Workforce Index

9ManpowerGroup Solutions QMR Q1, 2018ManpowerGroup Proprietary & Confidential
Global Parity Tracker:
Argentina
Austria
Belgium
Brazil
Bulgaria
China
Croatia
Czech Rep.
Denmark
Estonia
Finland
France
Germany
Greece
Honduras
Hungary
India
Ireland
Italy
Kazakhstan
Korea (South)
Latvia
Luxembourg
Malaysia
Netherlands
Nicaragua
Norway
Peru
Poland
Portugal
Slovakia
Slovenia
South Africa
Spain
Sweden
Taiwan
United Kingdom
Uruguay
Venezuela
Colombia
Croatia
India
Lithuania
Romania
Russia
Switzerland
Turkey
Vietnam
Canada
Hong Kong
Japan
Mexico
Australia
Bahrain
Belarus
Bolivia
Chile
Costa Rica
Dominican Rep.
Ecuador
El Salvador
Guatemala
Israel
Macau
Monaco
Morocco
New Zealand
Panama
Paraguay
Philippines
Puerto Rico
Serbia
Singapore
Thailand
Tunisia
UAE
Ukraine
No Parity Required
Just Benefit Parity
Just Pay Parity
Full Pay & Benefit Parity
USA*
USA* Full benefit parity is not required but the Healthcare Reform Bill is moving the USA in this direction
Source: ManpowerGroup Solutions 2017 Total Workforce Index

10ManpowerGroup Solutions QMR Q1, 2018
Regional Highlights

11ManpowerGroup Solutions QMR Q1, 2018ManpowerGroup Proprietary & Confidential
Strategic Update on Americas
Latin America
• The World Economic Forum ranks Brazil 119th in a list
of countries for wage equality for similar work. The gap is
especially noticeable for workers with higher levels of
education. While women account for 60% of employees
with a university degree, but their employers paid them
36% less than men with the same educational level.
• A controversial legislative measure nicknamed the
‘youth slave law’ is in the process of being passed by
the Peruvian Congress. The law restricts youth benefits
that would allow students a fair wage while studying and
allows some employers to take on students of technical
institutes without any compensation at all.
• Costa Rica's Labor Procedure Reform Law No. 9343
amends the procedural part of the country's labor code
and the collective bargaining law and individual labor
law governing the employer-employee relationship;
nearly half of the country's labor and employment laws.
North America
• In New Brunswick (Canada) employees would be entitled to
paid leave in situations where they are victims of domestic,
intimate partner, or sexual violence under legislation being
considered by New Brunswick's parliament. The leave is
intended to give employees a chance to make life changes
and enhance their safety. Bill 44 would also provide better
access to unpaid leave for maternity, child care, or critical
illness.
• Labor unions are asking Mexico’s Labor secretary to push
his American counterparts on new protections for guest
workers in the United States as part of the ongoing
negotiations over the North American Free Trade
Agreement.
• There could be numerous changes to labor laws in the
United States in 2018 due to the number of changes
instituted or proposed in 2017. These include alterations on
Federal and local tax codes that will affect executive
compensation, changes to laws covering hours worked and
wages paid, likely reforms to immigration laws that will affect
how employers hire and who they may hire and the
continuing growth of the #MeToo anti-harassment
movement.
Source: ManpowerGroup Solutions 2017 Total Workforce Index

12ManpowerGroup Solutions QMR Q1, 2018
Strategic Update on EMEA
Eastern Europe
• Labor costs would increase in Poland if the
government adopts a proposed new social security
contribution system designed to increase individual
retirement savings. The proposal is to create a so-
called Employees' Capital Pension Scheme (PPK) that
would require employers to contribute at least 1.5% of
employees' gross wages to individual savings
accounts.
• The average Czech salary has climbed to more than
30,000 crowns per month for the very first time.
Average monthly earnings in the Czech Republic rose
nearly 8% year-on-year to 31,646 crowns per month.
Unemployment in the Czech Republic is also currently
at a record low. The highest monthly wages were
seen in the IT sector at 52,530 crowns per month
followed by the finance and insurance (52,156 crowns)
and energy (43,344 crowns) sectors.
Western Europe
• The European Union reached a tentative agreement to
tighten employment rules for workers who move to richer
member states in order to earn more money, a practice
some countries say can be used to undercut wages and
labor rules.
• Germany’s business heartland has begun moves to loosen
the country’s strict labor laws for high earners, aiming to
boost competitiveness but putting it on a collision course
with powerful labor unions. The finance ministry is working
“vigorously” on employment law reform for top earners
across all industries. The plan is aimed at smoothing the
system of time-consuming and costly settlements when
companies fire senior staff, requiring contracts for elite
workers to include agreed settlements in the event of early
termination.
• Migration into the United Kingdom from Europe has
reached its lowest point since 2013, indicating that the June
2016 vote to leave the EU has changed the dynamics of
immigration into Britain, where the number of foreign
arrivals and its impact on local communities, public
services, and wages was a key reason behind the Brexit
vote.
Source: ManpowerGroup Solutions 2017 Total Workforce Index

13ManpowerGroup Solutions QMR Q1, 2018
Strategic Update on APAC
• India’s Sexual Harassment of Women at Workplace Act requires employers to enact specific procedures to handle
sexual harassment complaints from female employees, including forming a committee with one independent external
expert and enacting written policies. Though it is not a gender-neutral law, many global companies choose to enact
gender-neutral policies based on it.
• Japan established a government agency designed to enforce its protections applicable to female employees and to
address issues associated with female workers. The agency has the right to audit companies’ relevant books and
records.
• Malaysia’s Employment Act requires employers to investigate any complaint of sexual harassment and, if the employee
is found guilty, the employer must discipline the perpetrator.
• Singapore’s Protection from Harassment Act, though not specifically employment-related, criminalizes sexual
harassment and lists workplace harassment as an example of unlawful harassment.
• In Australia large employers must file annual reports to the Workplace Gender Equality Agency that address gender
composition, pay disparity, flexible work arrangement availability, and consultation with employees about issues in the workplace.
Asia Pacific
• Taiwan has empowered its Ministry of Labor to enforce its 2014 Act of Gender
Equality in Employment, including prescribing measures to implement parental
leave, subsidizing employers that set up nursing rooms and offer childcare
options to employees, exercising authority to impose sanctions (such as fines for
violations up to $50,000), and publishing offending individuals’ names and titles
and ordering them to improve within a specified period.
Source: ManpowerGroup Solutions 2017 Total Workforce Index

14ManpowerGroup Solutions QMR Q1, 2018
Detailed Country Analysis:
Americas

15ManpowerGroup Solutions QMR Q1, 2018
Argentina Agriculture 2% Services 73% Industry 25%
Workforce (9% Informal Workforce)
Total Workforce 19,901,954
Permanent Employees 13,669,319
Non Standard Workforce 4,580,773
Unemployed Workers 1,651,862
Year on Year
Wage Inflation Rate (Dec 17) Private Sector 0.74%
Inflation Rate 25%
▪ According to ECW International, private sector
employees are expecting a 25% salary increase
during 2018 (forecast to be approximately 7% in
real terms).
▪ Teachers are demanding a 15% increase in
salary.
▪ Recent job losses in the public sector.
24%
61%
15%
Highly Skilled
Medium Skilled
Non Skilled
Notice Period By Tenure
Tenure Argentina Regional Ave
1 Year 4.3 weeks 1.9 weeks
5 Years 8.7 weeks 2.7 weeks
Severance Pay By Tenure
Tenure Argentina Regional Ave
1 Year 4.3 weeks 4.3 weeks
5 Years 21.7 weeks 16.4 weeks
50
29 3.9
60
18 190
50
100
OvertimePremiums (%)
Employer Taxes(%)
Profit Taxes (%)
Argentina Americas United States
6.9% 6.8% 7.5%5.9%
8.5% 8.3%
0%
20%
2013 2014 2015 2016 2017 2018
Unemployment Rate at Q1
$1.00$1.90
$2.98
$0
$10
$20
2014 2016 2018
Minimum Wage (USD 2018)
▪ Minimum Wage in USD at 2018 Exchange
rate
Redundancy and Dismissal Other Cost Considerations
Nominal Wage Inflation and InflationChanges to Minimum Wage (2018 USD rate)Changes to Unemployment RatesEconomic Climate
Economic Climate
Source: http://www.doingbusiness.org/

16ManpowerGroup Solutions QMR Q1, 2018
Bolivia Agriculture 30% Services 49% Industry 21%
Workforce (50% Informal Workforce)
Total Workforce 5,093,300
Permanent Employees 3,199,687
Non Standard Workforce 1,715,347
Unemployed Workers 178,266
Year on Year
Wage Inflation Rate N/A
Inflation Rate (Dec 17) 2.7%
▪ According to the IMF, minimum wages in Bolivia
increased on average by 14% per year between
2006 and 2016.
12%
63%
25%
Highly Skilled
Medium Skilled
Non Skilled
Notice Period By Tenure
Tenure Bolivia Regional Ave
1 Year Redundancy Dismissal not permissible.
1.9 weeks
5 Years 2.7 weeks
Severance Pay By Tenure
Tenure Bolivia Regional Ave
1 Year Redundancy Dismissal not permissible.
4.3 weeks
5 Years 16.4 weeks
100
19 0
60
18 190
50
100
OvertimePremiums (%)
Employer Taxes(%)
Profit Taxes (%)
Bolivia Americas United States
8.3%
5.4%6.3%
2.7% 2.7% 3.5%
0%
20%
2013 2014 2015 2016 2017 2018
Unemployment Rate at Q1
$1.08 $1.18 $1.64
$0
$10
$20
2014 2016 2018
Minimum Wage (USD 2018)
Redundancy and Dismissal Other Cost Considerations
Nominal Wage Inflation and InflationChanges to Minimum Wage (2018 USD rate)Changes to Unemployment Rates
Economic Climate
Labor Market
Source: http://www.doingbusiness.org/

17ManpowerGroup Solutions QMR Q1, 2018
Brazil Agriculture 15% Services 63 % Industry 22%
Workforce (10% Informal Workforce)
Total Workforce 104,278,814
Permanent Employees 62,358,314
Non Standard Workforce 29,615,600
Unemployed Workers 12,304,900
Year on Year
Wage Inflation Rate N/A
Inflation Rate (Jan 2018) 2.86%
▪ Recent labor reform implemented to try to
increase job creation.
22%
62%
16%
Highly Skilled
Medium Skilled
Non Skilled
Notice Period By Tenure
Tenure Brazil Regional Ave
1 Year 4.7 weeks 1.9 weeks
5 Years 6.4 weeks 2.7 weeks
Severance Pay By Tenure
Tenure Brazil Regional Ave
1 Year 1.7 weeks 4.3 weeks
5 Years 8.3 weeks 16.4 weeks
60
4024.960
18 190
50
100
OvertimePremiums (%)
Employer Taxes(%)
Profit Taxes (%)
Brazil Americas United States
4.6% 4.3% 4.3%
6.9%
12.0% 11.8%
0%
20%
2013 2014 2015 2016 2017 2018
Unemployment Rate at Q1
$1.27 $1.55 $1.69
$0
$10
$20
2014 2016 2018
Minimum Wage (USD 2018)
▪ Each Brazilian state has its own minimum
wage which can not be lower than the
Federal wage.
Redundancy and Dismissal Other Cost Considerations
Nominal Wage Inflation and InflationChanges to Minimum Wage (2018 USD rate)Changes to Unemployment Rates
Economic Climate
Labor Market
Source: http://www.doingbusiness.org/

18ManpowerGroup Solutions QMR Q1, 2018
Canada Agriculture 2% Services 78% Industry 20%
Workforce (7% Informal Workforce)
Total Workforce 19,784,200
Permanent Employees 15,749,925
Non Standard Workforce 2,867,008
Unemployed Workers 1,167,268
Year on Year to Dec 2017
Wage Inflation Rate (Dec) 2.7%
Inflation Rate (Jan 18) 1.7%
▪ Average hourly wage in December 2017 was
C$26.68.
▪ Youth unemployment in Canada is at 10.9%.
▪ Part time employment fell by 137,000 jobs in
January but full time employment was up by
49,000. Ontario’s 20% increase in minimum
wage is thought to have been a key contributor
to the loss of 50,900 jobs.
44%
48%
8%
Highly Skilled
Medium Skilled
Non Skilled
Notice Period By Tenure
Tenure Canada Regional Ave
1 Year 2.0 weeks 1.9 weeks
5 Years 5.0 weeks 2.7 weeks
Severance Pay By Tenure
Tenure Canada Regional Ave
1 Year 0 weeks 4.3 weeks
5 Years 5.0 weeks 16.4 weeks
50
13 3.8
60
18 190
50
100
OvertimePremiums (%)
Employer Taxes(%)
Profit Taxes (%)
Canada Americas United States
7.0% 7.0% 6.6% 7.2% 6.9%5.9%
0%
20%
2013 2014 2015 2016 2017 2018
Unemployment Rate at Q1
$8.71$9.90 $10.69
$0
$10
$20
2014 2016 2018
Minimum Wage (USD 2018)
▪ Minimum wage varies by Province. This is
a mid-point.
Redundancy and Dismissal Other Cost Considerations
Nominal Wage Inflation and InflationChanges to Minimum Wage (2018 USD rate)Changes to Unemployment Rates
Economic Climate
Labor Market
Source: http://www.doingbusiness.org/

19ManpowerGroup Solutions QMR Q1, 2018
Chile Agriculture 10% Services 68% Industry 23%
Workforce (10% Informal Workforce)
Total Workforce 8,963,683
Permanent Employees 6,057,585
Non Standard Workforce 2,332,422
Unemployed Workers 573,676
Year on Year
Wage Inflation Rate (Dec 17) 5.1%
Inflation Rate (Jan 18) 2.2%
▪ According to the OECD, Economic growth in
2018 is expected to be 2.9% up from the 1.7%
of 2017.
25%
51%
24%
Highly Skilled
Medium Skilled
Non Skilled
Notice Period By Tenure
Tenure Chile Regional Ave
1 Year 4.3 weeks 1.9 weeks
5 Years 4.3 weeks 2.7 weeks
Severance Pay By Tenure
Tenure Chile Regional Ave
1 Year 2.8 weeks 4.3 weeks
5 Years 15.2 weeks 16.4 weeks
50
5
25.260
18 190
50
100
OvertimePremiums (%)
Employer Taxes(%)
Profit Taxes (%)
Chile Americas United States
6.1% 5.7% 6.0% 5.8% 6.1% 6.4%
0%
20%
2013 2014 2015 2016 2017 2018
Unemployment Rate at Q1
$1.82 $2.17 $2.40
$0
$10
$20
2014 2016 2018
Minimum Wage (USD 2018)
Redundancy and Dismissal Other Cost Considerations
Nominal Wage Inflation and InflationChanges to Minimum Wage (2018 USD rate)Changes to Unemployment Rates
Economic Climate
Labor Market
Source: http://www.doingbusiness.org/

20ManpowerGroup Solutions QMR Q1, 2018
Colombia Agriculture 14% Services 70% Industry 17%
Workforce (31% Informal Workforce)
Total Workforce 26,421,780
Permanent Employees 11,833,258
Non Standard Workforce 12,316,249
Unemployed Workers 2,272,273
Year on Year
Wage Inflation Rate N/A
Inflation Rate (Jan 18) 3.7%
▪ GDP growth is forecast to be 2.7% in 2018.
▪ The minimum wage rise for this year is 5.9%
which is below the 9.0% that the workers were
requesting but above the 5.1% proposed by
business leaders.
▪ President Santos reported that 2.5 million
workers and pensioners receive the minimum
wage.
8%
77%
15%
Highly Skilled
Medium Skilled
Non Skilled
Notice Period By Tenure
Tenure Colombia Regional Ave
1 Year 0 weeks 1.9 weeks
5 Years 0 weeks 2.7 weeks
Severance Pay By Tenure
Tenure Colombia Regional Ave
1 Year 4.3 weeks 4.3 weeks
5 Years 15.7 weeks 16.4 weeks
25 19
22.260
18 190
50
100
OvertimePremiums (%)
Employer Taxes(%)
Profit Taxes (%)
Colombia Americas United States
9.6%8.4% 8.7% 8.6% 8.7% 8.6%
0%
20%
2013 2014 2015 2016 2017 2018
Unemployment Rate at Q1
$1.16 $1.21 $1.47
$0
$10
$20
2014 2016 2018
Minimum Wage (USD 2018)
Redundancy and Dismissal Other Cost Considerations
Nominal Wage Inflation and InflationChanges to Minimum Wage (2018 USD rate)Changes to Unemployment Rates
Economic Climate
Labor Market
Source: http://www.doingbusiness.org/

21ManpowerGroup Solutions QMR Q1, 2018
Costa Rica Agriculture 12% Services 69% Industry 19%
Workforce (9% Informal Workforce)
Total Workforce 2,288,044
Permanent Employees 1,624,925
Non Standard Workforce 450,331
Unemployed Workers 212,788
Year on Year
Wage Inflation Rate N/A
Inflation Rate (Jan 2018) 2.4%
▪ GDP growth for 2017 was 2.98%.
▪ Youth unemployment is at 22.3%
▪ Bayer, Citi and Amazon are among companies
that have recently announced expansion plans
in Costa Rica.
22%
52%
26%
Highly Skilled
Medium Skilled
Non Skilled
Notice Period By Tenure
Tenure Costa Rica Regional Ave
1 Year 4.3 weeks 1.9 weeks
5 Years 4.3 weeks 2.7 weeks
Severance Pay By Tenure
Tenure Costa Rica Regional Ave
1 Year 2.8 weeks 4.3 weeks
5 Years 15.2 weeks 16.4 weeks
50
3319.2
60
18 190
50
100
OvertimePremiums (%)
Employer Taxes(%)
Profit Taxes (%)
Costa Rica Americas United States
10.0%8.9%
10.0% 9.2% 9.5% 9.3%
0%
20%
2013 2014 2015 2016 2017 2018
Unemployment Rate at Q1
$1.89 $2.10 $2.40
$0
$10
$20
2014 2016 2018
Minimum Wage (USD 2018)
▪ Minimum wage varies by occupation. This
is for a machine operator.
Redundancy and Dismissal Other Cost Considerations
Nominal Wage Inflation and InflationChanges to Minimum Wage (2018 USD rate)Changes to Unemployment Rates
Economic Climate
Labor Market
Source: http://www.doingbusiness.org/

22ManpowerGroup Solutions QMR Q1, 2018
Dominican Republic Agriculture 13% Services 70% Industry 17%
Workforce (20% Informal Workforce)
Total Workforce 5,081,390
Permanent Employees 2,687,110
Non Standard Workforce 2,119,885
Unemployed Workers 274,395
Year on Year
Wage Inflation Rate N/A
Inflation Rate (Dec 17) 4.2%
18%
58%
24%
Highly Skilled
Medium Skilled
Non Skilled
Notice Period By Tenure
Tenure Dominican Rep. Regional Ave
1 Year 4.0 weeks 1.9 weeks
5 Years 4.0 weeks 2.7 weeks
Severance Pay By Tenure
Tenure Dominican Rep. Regional Ave
1 Year 3.8 weeks 4.3 weeks
5 Years 20.9 weeks 16.4 weeks
35 19
29.160
18 190
50
100
OvertimePremiums (%)
Employer Taxes(%)
Profit Taxes (%)
Dominican Republic Americas United States
14.3% 15.0% 14.9%14.0% 14.0%
5.4%
0%
20%
2013 2014 2015 2016 2017 2018
Unemployment Rate at Q1
$0.96 $1.20 $1.64
$0
$10
$20
2014 2016 2018
Minimum Wage (USD 2018)
▪ Minimum wage depends on location and
the size of the company and amount of
company capital.
▪ *Rate reported by the country. World Bank
2017 data has unemployment at 13.8%.
*
Redundancy and Dismissal Other Cost Considerations
Nominal Wage Inflation and InflationChanges to Minimum Wage (2018 USD rate)Changes to Unemployment Rates
Economic Climate
Labor Market
Source: http://www.doingbusiness.org/
23ManpowerGroup Solutions QMR Q1, 2018
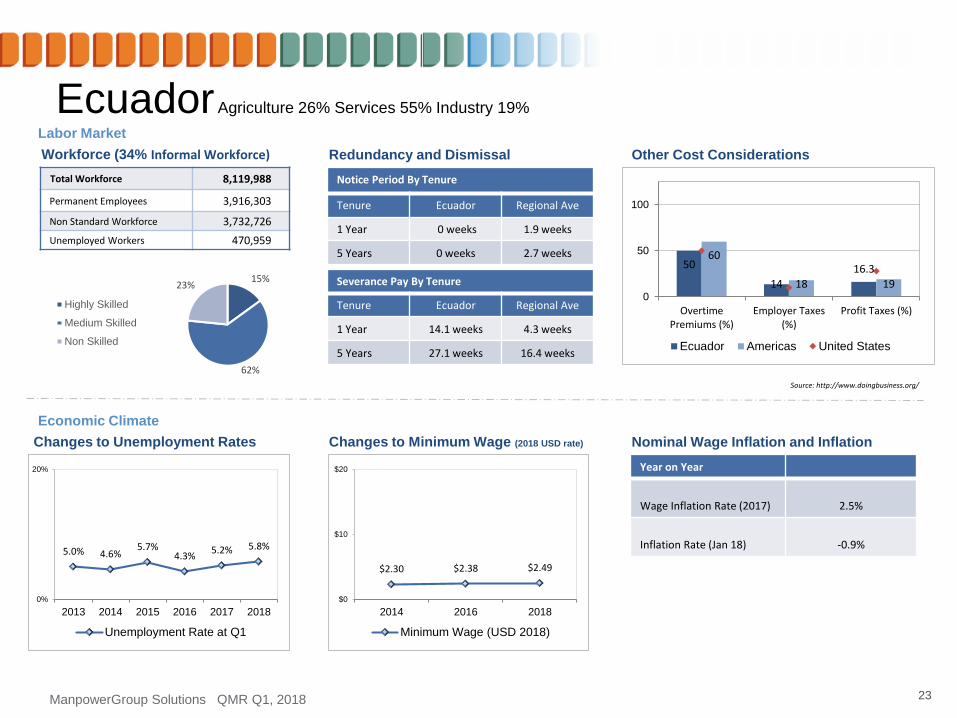
Ecuador Agriculture 26% Services 55% Industry 19%
Workforce (34% Informal Workforce)
Total Workforce 8,119,988
Permanent Employees 3,916,303
Non Standard Workforce 3,732,726
Unemployed Workers 470,959
Year on Year
Wage Inflation Rate (2017) 2.5%
Inflation Rate (Jan 18) -0.9%
15%
62%
23%
Highly Skilled
Medium Skilled
Non Skilled
Notice Period By Tenure
Tenure Ecuador Regional Ave
1 Year 0 weeks 1.9 weeks
5 Years 0 weeks 2.7 weeks
Severance Pay By Tenure
Tenure Ecuador Regional Ave
1 Year 14.1 weeks 4.3 weeks
5 Years 27.1 weeks 16.4 weeks
50
14
16.360
18 190
50
100
OvertimePremiums (%)
Employer Taxes(%)
Profit Taxes (%)
Ecuador Americas United States
5.0% 4.6%5.7%
4.3%5.2% 5.8%
0%
20%
2013 2014 2015 2016 2017 2018
Unemployment Rate at Q1
$2.30 $2.38 $2.49
$0
$10
$20
2014 2016 2018
Minimum Wage (USD 2018)
Redundancy and Dismissal Other Cost Considerations
Nominal Wage Inflation and InflationChanges to Minimum Wage (2018 USD rate)Changes to Unemployment Rates
Economic Climate
Labor Market
Source: http://www.doingbusiness.org/

24ManpowerGroup Solutions QMR Q1, 2018
El Salvador Agriculture 19% Services 61% Industry 20%
Workforce (30% Informal Workforce)
Total Workforce 2,844,179
Permanent Employees 1,599,350
Non Standard Workforce 1,048,581
Unemployed Workers 196,248
Year on Year
Wage Inflation Rate N/A
Inflation Rate (Jan 18) 1.4%
▪ Approximately 240K Salvadorans in the United
States are set to lose their Temporary Protected
Status. This will impact the economy as the
Washington Post reports that 18.3% of El
Salvador’s GDP comes from US remittances.
12%
60%
28%
Highly Skilled
Medium Skilled
Non Skilled
Notice Period By Tenure
Tenure El Salvador Regional Ave
1 Year 0 weeks 1.9 weeks
5 Years 0 weeks 2.7 weeks
Severance Pay By Tenure
Tenure El Salvador Regional Ave
1 Year 4.3 weeks 4.3 weeks
5 Years 21.4 weeks 16.4 weeks
125
17
16.960
18 190
50
100
OvertimePremiums (%)
Employer Taxes(%)
Profit Taxes (%)
El Salvador Americas United States
7.1%6.1% 5.7%
7.0% 7.0% 6.9%
0%
20%
2013 2014 2015 2016 2017 2018
Unemployment Rate at Q1
$1.15 $1.27 $1.57
$0
$10
$20
2014 2016 2018
Minimum Wage (USD 2018)
▪ Minimum wage varies by industry. This
minimum wage is for the retail industry.
Redundancy and Dismissal Other Cost Considerations
Nominal Wage Inflation and InflationChanges to Minimum Wage (2018 USD rate)Changes to Unemployment Rates
Economic Climate
Labor Market
Source: http://www.doingbusiness.org/

25ManpowerGroup Solutions QMR Q1, 2018
Guatemala Agriculture 32% Services 49% Industry 19%
Workforce (39% Informal Workforce)
Total Workforce 6,812,531
Permanent Employees 4,147,128
Non Standard Workforce 2,488,277
Unemployed Workers 177,126
Year on Year
Wage Inflation Rate (Jan 18)
High Skilled 5.1%Low Skilled 23.9%
Inflation Rate (Dec 17) 5.7%
10%
70%
20%
Highly Skilled
Medium Skilled
Non Skilled
Notice Period By Tenure
Tenure Guatemala Regional Ave
1 Year 0 weeks 1.9 weeks
5 Years 0 weeks 2.7 weeks
Severance Pay By Tenure
Tenure Guatemala Regional Ave
1 Year 5.1 weeks 4.3 weeks
5 Years 25.3 weeks 16.4 weeks
50
14
20.260
18 190
50
100
OvertimePremiums (%)
Employer Taxes(%)
Profit Taxes (%)
Guatemala Americas United States
4.1%2.9% 2.9% 2.9% 3.1% 2.6%
0%
20%
2013 2014 2015 2016 2017 2018
Unemployment Rate at Q1
$1.60 $1.69 $2.14
$0
$10
$20
2014 2016 2018
Minimum Wage (USD 2018)
▪ Minimum wage differs by age and industry.
This minimum wage is for a worker who is
25 years or older and in a non-agricultural
industry.
Redundancy and Dismissal Other Cost Considerations
Nominal Wage Inflation and InflationChanges to Minimum Wage (2018 USD rate)Changes to Unemployment Rates
Economic Climate
Labor Market
Source: http://www.doingbusiness.org/

26ManpowerGroup Solutions QMR Q1, 2018
Honduras Agriculture 29% Services 49% Industry 22%
Workforce (44% Informal Workforce)
Total Workforce 4,312,820
Permanent Employees 2,139,236
Non Standard Workforce 1,927,753
Unemployed Workers 245,831
Year on Year
Wage Inflation Rate (Jan 18)
High Skilled 2.3%Low Skilled 11%
Inflation Rate (Jan 18) 4.6%
▪ A number of technology initiatives have been
taking place including, camps for 20,000 young
people to participate in robotics, computer
programming and hardware design, ‘Women Do
Tech’ and a forum on technology.
12%
63%
25%
Highly Skilled
Medium Skilled
Non Skilled
Notice Period By Tenure
Tenure Honduras Regional Ave
1 Year 4.3 weeks 1.9 weeks
5 Years 8.7 weeks 2.7 weeks
Severance Pay By Tenure
Tenure Honduras Regional Ave
1 Year 4.3 weeks 4.3 weeks
5 Years 21.7 weeks 16.4 weeks
383
31.160
18 190
50
100
OvertimePremiums (%)
Employer Taxes(%)
Profit Taxes (%)
Honduras Americas United States
3.9% 4.4% 4.5% 3.9%
7.3%5.7%
0%
20%
2013 2014 2015 2016 2017 2018
Unemployment at Q1
$1.35 $1.46 $1.99
$0
$10
$20
2014 2016 2018
Minimum Wage (USD 2018)
▪ Minimum wage in Honduras varies by
industry and company size. This minimum
wage is for a worker in a large
manufacturing company.
Redundancy and Dismissal Other Cost Considerations
Nominal Wage Inflation and InflationChanges to Minimum Wage (2018 USD rate)Changes to Unemployment Rates
Economic Climate
Labor Market
Source: http://www.doingbusiness.org/

27ManpowerGroup Solutions QMR Q1, 2018
Mexico Agriculture 13% Services 61% Industry 25%
Workforce (20% Informal Workforce)
Total Workforce 58,072,763
Permanent Employees 38,490,395
Non Standard Workforce 17,782,112
Unemployed Workers 1,800,256
Year on Year
Wage Inflation Rate (Dec 17) 0.1%
Inflation Rate (Jan 2018) 5.55%
▪ GDP growth is at 0.8% for the year to December
2017.
19%
57%
24%
Highly Skilled
Medium Skilled
Non Skilled
Notice Period By Tenure
Tenure Mexico Regional Ave
1 Year 0 weeks 1.9 weeks
5 Years 0 weeks 2.7 weeks
Severance Pay By Tenure
Tenure Mexico Regional Ave
1 Year 14.6 weeks 4.3 weeks
5 Years 21.4 weeks 16.4 weeks
100
26
25.560
18 190
50
100
OvertimePremiums (%)
Employer Taxes(%)
Profit Taxes (%)
Mexico Americas United States
4.5% 4.3% 3.8% 4.0% 3.4% 3.1%
0%
20%
2013 2014 2015 2016 2017 2018
Unemployment Rate at Q1
$0.44 $0.49 $0.59
$0
$10
$20
2014 2016 2018
Minimum Wage (USD 2018)
Redundancy and Dismissal Other Cost Considerations
Nominal Wage Inflation and InflationChanges to Minimum Wage (2018 USD rate)Changes to Unemployment Rates
Economic Climate
Labor Market
Source: http://www.doingbusiness.org/

28ManpowerGroup Solutions QMR Q1, 2018
Nicaragua Agriculture 24% Services 61% Industry 15%
Workforce (44% Informal Workforce)
Total Workforce 2,940,014
Permanent Employees 1,522,269
Non Standard Workforce 1,235,464
Unemployed Workers 182,281
Year on Year
Wage Inflation Rate N/A
Inflation Rate (Jan 18) 5.4%
17%
52%
31%Highly Skilled
Medium Skilled
Non Skilled
Notice Period By Tenure
Tenure Nicaragua Regional Ave
1 Year 0 weeks 1.9 weeks
5 Years 0 weeks 2.7 weeks
Severance Pay By Tenure
Tenure Nicaragua Regional Ave
1 Year 4.3 weeks 4.3 weeks
5 Years 18.8 weeks 16.4 weeks
100
23
17.560
18 190
50
100
OvertimePremiums (%)
Employer Taxes(%)
Profit Taxes (%)
Nicaragua Americas United States
6.3%7.8%
5.9%6.8% 6.8% 6.2%
0%
20%
2013 2014 2015 2016 2017 2018
Unemployment Rate at Q1
$0.54 $0.75 $0.79
$0
$10
$20
2014 2016 2018
Minimum Wage (USD 2018)
▪ Minimum wage in Nicaragua varies by
industry. This minimum wage is for the
manufacturing industry.
Redundancy and Dismissal Other Cost Considerations
Nominal Wage Inflation and InflationChanges to Minimum Wage (2018 USD rate)Changes to Unemployment Rates
Economic Climate
Labor Market
Source: http://www.doingbusiness.org/

29ManpowerGroup Solutions QMR Q1, 2018
Panama Agriculture 15% Services 66% Industry 20%
Workforce (12% Informal Workforce)
Total Workforce 1,992,351
Permanent Employees 1,224,668
Non Standard Workforce 674,042
Unemployed Workers 93,640
Year on Year
Wage Inflation Rate N/A
Inflation Rate (Dec 17) 0.5%
▪ The most recent minimum wage increases were
6.5% for large enterprises and 4.5% for smaller
companies.
▪ 292,000 employees of large companies
currently receive minimum wage.
24%
56%
20%
Highly Skilled
Medium Skilled
Non Skilled
Notice Period By Tenure
Tenure Panama Regional Ave
1 Year 0 weeks 1.9 weeks
5 Years 0 weeks 2.7 weeks
Severance Pay By Tenure
Tenure Panama Regional Ave
1 Year 3.4 weeks 4.3 weeks
5 Years 17.0 weeks 16.4 weeks
50
2012.4
60
18 190
50
100
OvertimePremiums (%)
Employer Taxes(%)
Profit Taxes (%)
Panama Americas United States
4.6% 4.2% 4.1%2.5%
5.6%4.7%
0%
20%
2013 2014 2015 2016 2017 2018
Unemployment Rate at Q1
$2.31 $2.36 $2.51
$0
$10
$20
2014 2016 2018
Minimum Wage (USD 2018)
▪ Minimum wage depends on the size of the
company. This minimum wage is for a
large company.
Redundancy and Dismissal Other Cost Considerations
Nominal Wage Inflation and InflationChanges to Minimum Wage (2018 USD rate)Changes to Unemployment Rates
Economic Climate
Labor Market
Source: http://www.doingbusiness.org/

30ManpowerGroup Solutions QMR Q1, 2018
Paraguay Agriculture 20% Services 61% Industry 20%
Workforce (40% Informal Workforce)
Total Workforce 3,385,223
Permanent Employees 1,751,650
Non Standard Workforce 1,376,296
Unemployed Workers 257,277
Year on Year
Wage Inflation Rate N/A
Inflation Rate (Jan 18) 4.7%
19%
62%
19%
Highly Skilled
Medium Skilled
Non Skilled
Notice Period By Tenure
Tenure Paraguay Regional Ave
1 Year 7.5 weeks 1.9 weeks
5 Years 10.0 weeks 2.7 weeks
Severance Pay By Tenure
Tenure Paraguay Regional Ave
1 Year 2.1 weeks 4.3 weeks
5 Years 10.7 weeks 16.4 weeks
50
199.6
60
18 190
50
100
OvertimePremiums (%)
Employer Taxes(%)
Profit Taxes (%)
Paraguay Americas United States
6.9% 7.7% 7.9%6.3% 6.9% 7.6%
0%
20%
2013 2014 2015 2016 2017 2018
Unemployment Rate at Q1
$1.43 $1.57 $1.76
$0
$10
$20
2014 2016 2018
Minimum Wage (USD 2018)
Redundancy and Dismissal Other Cost Considerations
Nominal Wage Inflation and InflationChanges to Minimum Wage (2018 USD rate)Changes to Unemployment Rates
Economic Climate
Labor Market
Source: http://www.doingbusiness.org/

31ManpowerGroup Solutions QMR Q1, 2018
Peru Agriculture 24% Services 58% Industry 17%
Workforce (31% Informal Workforce)
Total Workforce 17,902,747
Permanent Employees 7,551,110
Non Standard Workforce 9,044,736
Unemployed Workers 1,306,901
Year on Year
Wage Inflation Rate (Jan 18)
Highly Skilled 2.9%Low Skilled 4.3%
Inflation Rate (Jan 18) 1.3%
▪ A recent ManpowerGroup study found that 74%
of 18-34 year olds in Peru apply for jobs using
their smartphones.
▪ During the second quarter of 2017, 143,600 jobs
were created. Approximately three quarters of
these were in the services sector. The job
growth was in micro enterprises (businesses
with fewer than 11 employees).
15%
53%
32%Highly Skilled
Medium Skilled
Non Skilled
Notice Period By Tenure
Tenure Peru Regional Ave
1 Year 0 weeks 1.9 weeks
5 Years 0 weeks 2.7 weeks
Severance Pay By Tenure
Tenure Peru Regional Ave
1 Year 2.9 weeks 4.3 weeks
5 Years 14.3 weeks 16.4 weeks
25 11
21.460
18 190
50
100
OvertimePremiums (%)
Employer Taxes(%)
Profit Taxes (%)
Peru Americas United States
5.9% 5.7% 5.6% 5.7% 6.2%7.3%
0%
20%
2013 2014 2015 2016 2017 2018
Unemployment Rate at Q1
$1.11 $1.33 $1.47
$0
$10
$20
2014 2016 2018
Minimum Wage (USD 2018)
Redundancy and Dismissal Other Cost Considerations
Nominal Wage Inflation and InflationChanges to Minimum Wage (2018 USD rate)Changes to Unemployment Rates
Economic Climate
Labor Market
Source: http://www.doingbusiness.org/

32ManpowerGroup Solutions QMR Q1, 2018
Puerto Rico Agriculture 2% Services 81% Industry 18%
Workforce (40% Informal Workforce)
Total Workforce 1,164,521
Permanent Employees 738,735
Non Standard Workforce 304,676
Unemployed Workers 121,110
Year on Year
Wage Inflation Rate N/A
Inflation Rate (Aug 17) 2.0%
▪ The Labor Department has requested a
consultation to consider increasing the minimum
wage in the public sector in Puerto Rico in an
effort to drive socio-economic development.
The proposal is an increase in the minimum
wage to $8.25 per hour. It is expected to impact
~6,500 employees and cost $10.9 million.
31%
64%
5%
Highly Skilled
Medium Skilled
Non Skilled
Notice Period By Tenure
Tenure Puerto Rico Regional Ave
1 Year 0 weeks 1.9 weeks
5 Years 0 weeks 2.7 weeks
Severance Pay By Tenure
Tenure Puerto Rico Regional Ave
1 Year 0 weeks 4.3 weeks
5 Years 0 weeks 16.4 weeks
50
13
29.860
18 190
50
100
OvertimePremiums (%)
Employer Taxes(%)
Profit Taxes (%)
Puerto Rico Americas United States
13.8%15.4%
13.7%12.2%
11.0% 10.4%
0%
20%
2013 2014 2015 2016 2017 2018
Unemployment Rate at Q1
$7.25 $7.25 $7.25
$0
$10
$20
2014 2016 2018
Minimum Wage (USD 2018)
Redundancy and Dismissal Other Cost Considerations
Nominal Wage Inflation and InflationChanges to Minimum Wage (2018 USD rate)Changes to Unemployment Rates
Economic Climate
Labor Market
Source: http://www.doingbusiness.org/

33ManpowerGroup Solutions QMR Q1, 2018
United States Agriculture 2% Services 81% Industry 17%
Workforce (5% Informal Workforce)
Total Workforce 161,115,000
Permanent Employees 139,212,866
Non Standard Workforce 15,296,419
Unemployed Workers 6,605,715
Year on Year
Wage Inflation Rate (Jan 18) 2.9%
Inflation Rate 2.1%
▪ The Labor Department has reported that the US
added 200,000 jobs during January and the
initial jobless claims in mid-February were one
of the lowest since the end of 2007-2009
Recession.
▪ Average wages in the private sector are $26.74
which is an increase of 75 cents for the year.
42%
45%
13%
Highly Skilled
Medium Skilled
Non Skilled
Notice Period By Tenure
Tenure United States Regional Ave
1 Year 0 weeks 1.9 weeks
5 Years 0 weeks 2.7 weeks
Severance Pay By Tenure
Tenure United States Regional Ave
1 Year 0 weeks 4.3 weeks
5 Years 0 weeks 16.4 weeks
50
10
27.960
18 190
50
100
OvertimePremiums (%)
Employer Taxes(%)
Profit Taxes (%)
United States Americas United Kingdom
7.9%6.7%
5.7% 4.9% 4.8% 4.1%
0%
20%
2013 2014 2015 2016 2017 2018
Unemployment Rate at Q1
$7.25 $7.25 $7.25
$0
$10
$20
2014 2016 2018
Minimum Wage (USD 2018)
▪ Although this is the Federal Minimum
wage, many states and metropolitan areas
have implemented higher minimum wages.
Redundancy and Dismissal Other Cost Considerations
Nominal Wage Inflation and InflationChanges to Minimum Wage (2018 USD rate)Changes to Unemployment Rates
Economic Climate
Labor Market
Source: http://www.doingbusiness.org/

34ManpowerGroup Solutions QMR Q1, 2018
Uruguay Agriculture 9% Services 71% Industry 21%
Workforce (12% Informal Workforce)
Total Workforce 1,769,207
Permanent Employees 1,187,582
Non Standard Workforce 459,550
Unemployed Workers 122,075
Year on Year
Wage Inflation Rate (Dec 17) 8.0%
Inflation Rate (Jan 18) 6.7%
22%
59%
19%
Highly Skilled
Medium Skilled
Non Skilled
Notice Period By Tenure
Tenure Uruguay Regional Ave
1 Year 0 weeks 1.9 weeks
5 Years 0 weeks 2.7 weeks
Severance Pay By Tenure
Tenure Uruguay Regional Ave
1 Year 5.2 weeks 4.3 weeks
5 Years 26.0 weeks 16.4 weeks
100
1623.6
60
18 190
50
100
OvertimePremiums (%)
Employer Taxes(%)
Profit Taxes (%)
Uruguay Americas United States
6.0% 6.5% 7.0% 7.4% 7.7% 6.9%
0%
20%
2013 2014 2015 2016 2017 2018
Unemployment Rate at Q1
$1.45 $1.75 $1.75
$0
$10
$20
2014 2016 2018
Minimum Wage (USD 2018)
Redundancy and Dismissal Other Cost Considerations
Nominal Wage Inflation and InflationChanges to Minimum Wage (2018 USD rate)Changes to Unemployment Rates
Economic Climate
Labor Market
Source: http://www.doingbusiness.org/
▪ Economic growth in Uruguay was estimated to
be 3% in 2017.

35ManpowerGroup Solutions QMR Q1, 2018
Venezuela Agriculture 12% Services 61% Industry 27%
Workforce (40% Informal Workforce)
Total Workforce 14,732,929
Permanent Employees 8,781,724
Non Standard Workforce 4,875,701
Unemployed Workers 1,075,504
Year on Year
Wage Inflation Rate N/A
Inflation Rate (Jan 2018) 4,068%
▪ Inflation is expected to hit 13,000% during 2018.
▪ Forbes reports that at least half a million
Venezuelans have left in the past year.
18%
57%
25%
Highly Skilled
Medium Skilled
Non Skilled
Notice Period By Tenure
Tenure Venezuela Regional Ave
1 Year Redundancy dismissal not permissible.
1.9 weeks
5 Years 2.7 weeks
Severance Pay By Tenure
Tenure Venezuela Regional Ave
1 Year Redundancy dismissal not permissible.
4.3 weeks
5 Years 16.4 weeks
50
189.8
60
18 190
50
100
OvertimePremiums (%)
Employer Taxes(%)
Profit Taxes (%)
Venezuela Americas United States
5.9% 5.6% 5.5% 6.0%7.3% 7.3%
0%
20%
2013 2014 2015 2016 2017 2018
Unemployment Rate at Q1
$1.89 $19.44
$461.03
$0
$250
$500
2014 2016 2018
Minimum Wage (USD 2018)
▪ Two exchange rates in Venezuela. Based
on the black market exchange rate
(available to the people) the monthly
minimum wage is approximately $1.
Redundancy and Dismissal Other Cost Considerations
Nominal Wage Inflation and InflationChanges to Minimum Wage (2018 USD rate)Changes to Unemployment Rates
Economic Climate
Labor Market
Source: http://www.doingbusiness.org/

36ManpowerGroup Solutions QMR Q1, 2018
Detailed Country Analysis:
Europe, Middle East, Africa

37ManpowerGroup Solutions QMR Q1, 2018
Austria Agriculture 5% Services 69% Industry 26%
Workforce (6% Informal Workforce)
Total Workforce 4,555,300
Permanent Employees 3,607,228
Non Standard Workforce 515,318
Unemployed Workers 432,754
Year on Year
Wage Inflation Rate (Jan 18) 1.65%
Inflation Rate (Jan 18) 1.8%
▪ A number of new strategies including wage
subsidies for employers have been implemented
to help the long term unemployed back into
work.
▪ Recent legislation to abolish the different
treatment of white and blue collar workers
especially with regard to notice periods and sick
leave will have a transitional period.
41%
51%
8%
Highly Skilled
Medium Skilled
Non Skilled
Notice Period By Tenure
Tenure Austria Regional Ave
1 Year 2.0 weeks 4.6 weeks
5 Years 2.0 weeks 7.0 weeks
Severance Pay By Tenure
Tenure Austria Regional Ave
1 Year 0 weeks 2.5 weeks
5 Years 0 weeks 8.5 weeks
5034
1736
2513
0
50
100
OvertimePremiums (%)
Employer Taxes(%)
Profit Taxes (%)
Austria EMEA United States
4.5%
9.8% 10.5% 10.9% 10.6%9.5%
0%
20%
2013 2014 2015 2016 2017 2018
Unemployment Rate at Q1
$10.17 $10.33 $10.33
$0
$10
$20
2014 2016 2018
Minimum Wage (USD 2018)
▪ Minimum wage is determined by industry
through collective bargaining. These
wages are within the Retail Sector – the
next indexation is under debate.
Redundancy and Dismissal Other Cost Considerations
Nominal Wage Inflation and InflationChanges to Minimum Wage (2018 USD rate)Changes to Unemployment Rates
Economic Climate
Labor Market
Source: http://www.doingbusiness.org/

38ManpowerGroup Solutions QMR Q1, 2018
Bahrain Agriculture 1% Services 66% Industry 33%
Workforce (19% Informal Workforce)
Total Workforce 864,918
Permanent Employees 826,339
Non Standard Workforce 28,200
Unemployed Workers 10,379
Year on Year
Wage Inflation Rate N/A
Inflation Rate (Jan 18) 2.8%
▪ The Gulf Cooperation Council has projected that
salary growth in Bahrain will be at 4% in 2018
▪ 2017 has been reported as a record year for
investment in Bahrain by the Economics
Development Board with $733 million invested
by 71 new companies. This investment is
expected to create over 2,800 jobs. Just over
half of the investment was in ICT.
25%
51%
24%
Highly Skilled
Medium Skilled
Non Skilled
Notice Period By Tenure
Tenure Bahrain Regional Ave
1 Year 4.3 weeks 4.6 weeks
5 Years 4.3 weeks 7.0 weeks
Severance Pay By Tenure
Tenure Bahrain Regional Ave
1 Year 2.2 weeks 2.5 weeks
5 Years 60.0 weeks 8.5 weeks
38 140
3625
13
0
50
100
OvertimePremiums (%)
Employer Taxes(%)
Profit Taxes (%)
Bahrain EMEA United States
3.8% 3.8% 3.7% 3.9% 3.9%
1.2%
0%
20%
2013 2014 2015 2016 2017 2018
Unemployment Rate at Q1
$3.41 $4.19 $4.19
$0
$10
$20
2014 2016 2018
Minimum Wage (USD 2018)
Redundancy and Dismissal Other Cost Considerations
Nominal Wage Inflation and InflationChanges to Minimum Wage (2018 USD rate)Changes to Unemployment Rates
Economic Climate
Labor Market
Source: http://www.doingbusiness.org/

39ManpowerGroup Solutions QMR Q1, 2018
Belarus Agriculture 10% Services 58% Industry 32%
Workforce (41% Informal Workforce)
Total Workforce 5,052,049
Permanent Employees 4,855,878
Non Standard Workforce 170,911
Unemployed Workers 25,260
Year on Year
Wage Inflation Rate (Nov 17) 16.6%
Inflation Rate (Jan 18) 4.5%
▪ Gross average earnings in January were 859 BYN
(approx. 440 USD)
▪ GDP has increased by 4.6% in the year to January
2018. This has been lead by consumer demand
due in part to the wage increases.
▪ President Alexander Lukashenko has recently
abolished a law which forced people who worked
less then half a year to pay social tax. He wants to
improve the work chances of citizens by improving
retraining opportunities and encouraging better
employment.
12%
81%
7%
Highly Skilled
Medium Skilled
Non Skilled
Notice Period By Tenure
Tenure Belarus Regional Ave
1 Year 8.7 weeks 4.6 weeks
5 Years 8.7 weeks 7.0 weeks
Severance Pay By Tenure
Tenure Belarus Regional Ave
1 Year 13.0 weeks 2.5 weeks
5 Years 13.0 weeks 8.5 weeks
100
39 10.83625
13
0
50
100
OvertimePremiums (%)
Employer Taxes(%)
Profit Taxes (%)
Belarus EMEA United States
0.6% 0.6% 0.5% 1.0% 1.0% 0.5%
0%
20%
2013 2014 2015 2016 2017 2018
Unemployment Rate at Q1
$0.50 $0.68 $0.90
$0
$10
$20
2014 2016 2018
Minimum Wage (USD 2018)
Redundancy and Dismissal Other Cost Considerations
Nominal Wage Inflation and InflationChanges to Minimum Wage (2018 USD rate)Changes to Unemployment Rates
Economic Climate
Labor Market
Source: http://www.doingbusiness.org/

40ManpowerGroup Solutions QMR Q1, 2018
Belgium Agriculture 1% Services 78% Industry 21%
Workforce (6% Informal Workforce)
Total Workforce 5,013,000
Permanent Employees 3,997,301
Non Standard Workforce 699,880
Unemployed Workers 315,819
Year on Year
Wage Inflation Rate (Sept 17) 3.5%
Inflation Rate (Feb 18) 1.5%
▪ The Belgium Federation for Commerce and
Services (Comeos) has estimated that 14,500
potential jobs were lost in the e-commerce
industry due to strict night work rules. The
government is implementing changes to make
night work less strictly regulated.
▪ Recent protests over pension reform.
47%
43%
10%
Highly Skilled
Medium Skilled
Non Skilled
Notice Period By Tenure
Tenure Belgium Regional Ave
1 Year 8.0 weeks 4.6 weeks
5 Years 18.0 weeks 7.0 weeks
Severance Pay By Tenure
Tenure Belgium Regional Ave
1 Year 0 weeks 2.5 weeks
5 Years 0 weeks 8.5 weeks
50 4610.336
2513
0
50
100
OvertimePremiums (%)
Employer Taxes(%)
Profit Taxes (%)
Belgium EMEA United States
7.4%8.4% 8.4% 7.9% 7.6%
6.3%
0%
20%
2013 2014 2015 2016 2017 2018
Unemployment Rate at Q1
$10.98 $11.40 $11.61
$0
$10
$20
2014 2016 2018
Minimum Wage (USD 2018)
▪ If no collective bargaining agreement, a
national minimum wage applies. This
wage is for 22 years and older with > 6
months experience.
Redundancy and Dismissal Other Cost Considerations
Nominal Wage Inflation and InflationChanges to Minimum Wage (2018 USD rate)Changes to Unemployment Rates
Economic Climate
Labor Market
Source: http://www.doingbusiness.org/

41ManpowerGroup Solutions QMR Q1, 2018
Bulgaria Agriculture 7% Services 64% Industry 29%
Workforce (6% Informal Workforce)
Total Workforce 3,425,200
Permanent Employees 2,810,623
Non Standard Workforce 372,415
Unemployed Workers 242,162
Year on Year
Wage Inflation Rate (Dec 17) 10.9%
Inflation Rate (Jan 18) 1.8%
▪ The latest minimum wage rise is expected to
affect 417,000 workers.
▪ A recent survey by Colliers International showed
that 40% of producers are struggling to get the
skilled workers that this has limited their growth.
▪ The Bulgarian Government is enacting laws to
help increase skilled foreign workers. While this
has been welcomed by business groups, unions
are opposing it.
32%
57%
11%
Highly Skilled
Medium Skilled
Non Skilled
Notice Period By Tenure
Tenure Bulgaria Regional Ave
1 Year 4.3 weeks 4.6 weeks
5 Years 4.3 weeks 7.0 weeks
Severance Pay By Tenure
Tenure Bulgaria Regional Ave
1 Year 4.3 weeks 2.5 weeks
5 Years 4.3 weeks 8.5 weeks
50
20 53625
13
0
50
100
OvertimePremiums (%)
Employer Taxes(%)
Profit Taxes (%)
Bulgaria EMEA United States
12.4% 12.0%10.8% 10.0%
8.0%7.1%
0%
20%
2013 2014 2015 2016 2017 2018
Unemployment Rate at Q1
$1.24 $1.58 $1.86
$0
$10
$20
2014 2016 2018
Minimum Wage (USD 2018)
Redundancy and Dismissal Other Cost Considerations
Nominal Wage Inflation and InflationChanges to Minimum Wage (2018 USD rate)Changes to Unemployment Rates
Economic Climate
Labor Market
Source: http://www.doingbusiness.org/

42ManpowerGroup Solutions QMR Q1, 2018
Croatia Agriculture 9% Services 64% Industry 27%
Workforce (27% Informal Workforce)
Total Workforce 1,849,400
Permanent Employees 1,398,069
Non Standard Workforce 225,704
Unemployed Workers 225,627
Year on Year
Wage Inflation Rate (Nov 17 6.6%
Inflation Rate 1.2%
▪ Approximately 76,000 workers receive the
minimum wage.
▪ The trade unions have claimed that the
minimum wage should be increased to a level
that is half of the average wage but even with
the latest increase it represents approximately
43%.
36%
57%
7%
Highly Skilled
Medium Skilled
Non Skilled
Notice Period By Tenure
Tenure Croatia Regional Ave
1 Year 4.3 weeks 4.6 weeks
5 Years 8.7 weeks 7.0 weeks
Severance Pay By Tenure
Tenure Croatia Regional Ave
1 Year 0 weeks 2.5 weeks
5 Years 7.2 weeks 8.5 weeks
0 19 036
2513
0
50
100
OvertimePremiums (%)
Employer Taxes(%)
Profit Taxes (%)
Croatia EMEA United States
21.1% 21.6%19.6%
17.9%
14.8%
12.2%
0%
25%
2013 2014 2015 2016 2017 2018
Unemployment Rate Q1
$2.85 $2.99 $3.29
$0
$10
$20
2014 2016 2018
Minimum Wage (USD 2018)
▪ Public sector workers have a much higher
minimum wage. Public sector minimum wages
are approximately $5.19
Redundancy and Dismissal Other Cost Considerations
Nominal Wage Inflation and InflationChanges to Minimum Wage (2018 USD rate)Changes to Unemployment Rates
Economic Climate
Labor Market
Source: http://www.doingbusiness.org/
43ManpowerGroup Solutions QMR Q1, 2018
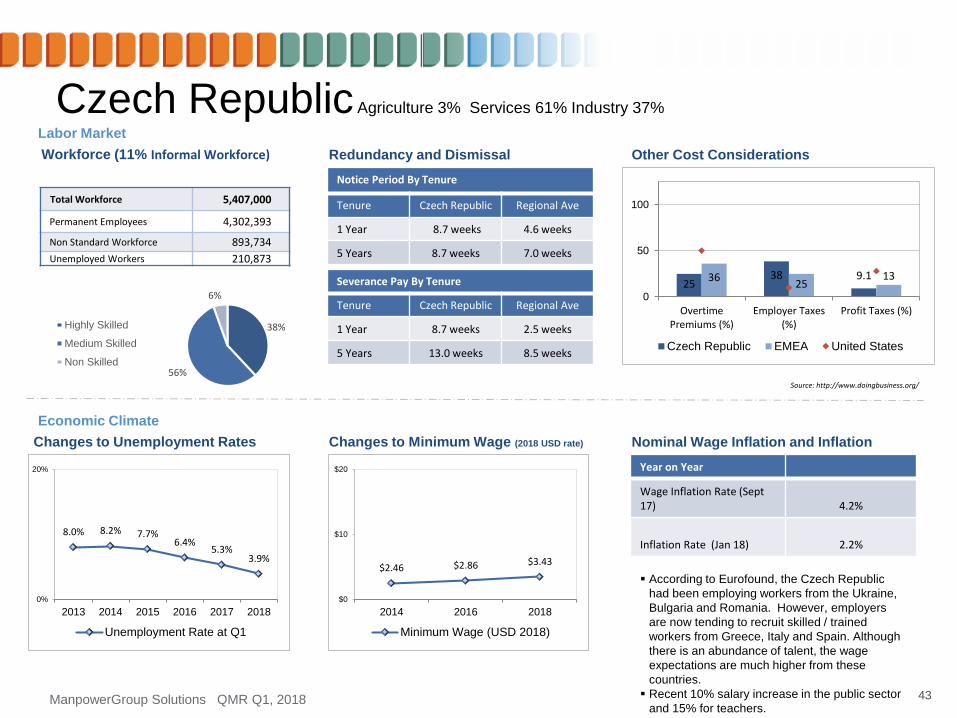
Czech Republic Agriculture 3% Services 61% Industry 37%
Workforce (11% Informal Workforce)
Total Workforce 5,407,000
Permanent Employees 4,302,393
Non Standard Workforce 893,734
Unemployed Workers 210,873
Year on Year
Wage Inflation Rate (Sept 17) 4.2%
Inflation Rate (Jan 18) 2.2%
▪ According to Eurofound, the Czech Republic
had been employing workers from the Ukraine,
Bulgaria and Romania. However, employers
are now tending to recruit skilled / trained
workers from Greece, Italy and Spain. Although
there is an abundance of talent, the wage
expectations are much higher from these
countries.
▪ Recent 10% salary increase in the public sector
and 15% for teachers.
38%
56%
6%
Highly Skilled
Medium Skilled
Non Skilled
Notice Period By Tenure
Tenure Czech Republic Regional Ave
1 Year 8.7 weeks 4.6 weeks
5 Years 8.7 weeks 7.0 weeks
Severance Pay By Tenure
Tenure Czech Republic Regional Ave
1 Year 8.7 weeks 2.5 weeks
5 Years 13.0 weeks 8.5 weeks
2538 9.136
2513
0
50
100
OvertimePremiums (%)
Employer Taxes(%)
Profit Taxes (%)
Czech Republic EMEA United States
8.0% 8.2% 7.7%6.4%
5.3%3.9%
0%
20%
2013 2014 2015 2016 2017 2018
Unemployment Rate at Q1
$2.46 $2.86 $3.43
$0
$10
$20
2014 2016 2018
Minimum Wage (USD 2018)
Redundancy and Dismissal Other Cost Considerations
Nominal Wage Inflation and InflationChanges to Minimum Wage (2018 USD rate)Changes to Unemployment Rates
Economic Climate
Labor Market
Source: http://www.doingbusiness.org/

44ManpowerGroup Solutions QMR Q1, 2018
Denmark Agriculture 2% Services 78% Industry 19%
Workforce (5% Informal Workforce)
Total Workforce 3,015,100
Permanent Employees 2,625,615
Non Standard Workforce 262,850
Unemployed Workers 126,634
Year on Year
Wage Inflation Rate2% averaged over the
past 5 years
Inflation Rate (Jan 18) 0.7%
▪ The Confederation of Danish Industry has
reported that nearly 40% of its companies were
suffering from a shortage of skilled workers. It is
calling on the government to attract foreign
workers.
46%
44%
10%
Highly Skilled
Medium Skilled
Non Skilled
Notice Period By Tenure
Tenure Denmark Regional Ave
1 Year 0 weeks 4.6 weeks
5 Years 0 weeks 7.0 weeks
Severance Pay By Tenure
Tenure Denmark Regional Ave
1 Year 0 weeks 2.5 weeks
5 Years 0 weeks 8.5 weeks
0 4
17.736
2513
0
50
100
OvertimePremiums (%)
Employer Taxes(%)
Profit Taxes (%)
Denmark EMEA United States
4.8% 4.3% 4.0% 4.5% 4.3% 4.2%
0%
20%
2013 2014 2015 2016 2017 2018
Unemployment Rate at Q1
$17.81 $18.23 $18.23
$0
$10
$20
2014 2016 2018
Minimum Wage (USD 2018)
▪ Minimum wage is determined by Collective
Bargaining Agreements. This is the
average minimum across the private and
public sectors.
Redundancy and Dismissal Other Cost Considerations
Nominal Wage Inflation and InflationChanges to Minimum Wage (2018 USD rate)Changes to Unemployment Rates
Economic Climate
Labor Market
Source: http://www.doingbusiness.org/

45ManpowerGroup Solutions QMR Q1, 2018
Estonia Agriculture 4% Services 67% Industry 29%
Workforce (6% Informal Workforce)
Total Workforce 703,100
Permanent Employees 601,915
Non Standard Workforce 63,920
Unemployed Workers 37,264
Year on Year
Wage Inflation Rate (Sept 17) 7.3%
Inflation Rate (Jan 18) 3.5%
▪ Youth unemployment in Estonia is 6.8%. To
further reduce this rate, the government has
announced a relaxation in the conditions for
employers to receive a subsidy for hiring a
person between 17-29 years.
▪ Over 4,000 people are employed in Estonian
start ups. The employment taxes collected from
start ups increased by almost a third in 2017
compared to 2016.
43%
49%
8%
Highly Skilled
Medium Skilled
Non Skilled
Notice Period By Tenure
Tenure Estonia Regional Ave
1 Year 4.3 weeks 4.6 weeks
5 Years 8.6 weeks 7.0 weeks
Severance Pay By Tenure
Tenure Estonia Regional Ave
1 Year 4.3 weeks 2.5 weeks
5 Years 4.3 weeks 8.5 weeks
5039 7.936
2513
0
50
100
OvertimePremiums (%)
Employer Taxes(%)
Profit Taxes (%)
Estonia EMEA United States
9.7%8.0% 7.5%
5.2%
7.5%
5.3%
0%
20%
2013 2014 2015 2016 2017 2018
Unemployment Rate at Q1
$2.63 $3.01 $3.51
$0
$10
$20
2014 2016 2018
Minimum Wage (USD 2018)
Redundancy and Dismissal Other Cost Considerations
Nominal Wage Inflation and InflationChanges to Minimum Wage (2018 USD rate)Changes to Unemployment Rates
Economic Climate
Labor Market
Source: http://www.doingbusiness.org/
46ManpowerGroup Solutions QMR Q1, 2018
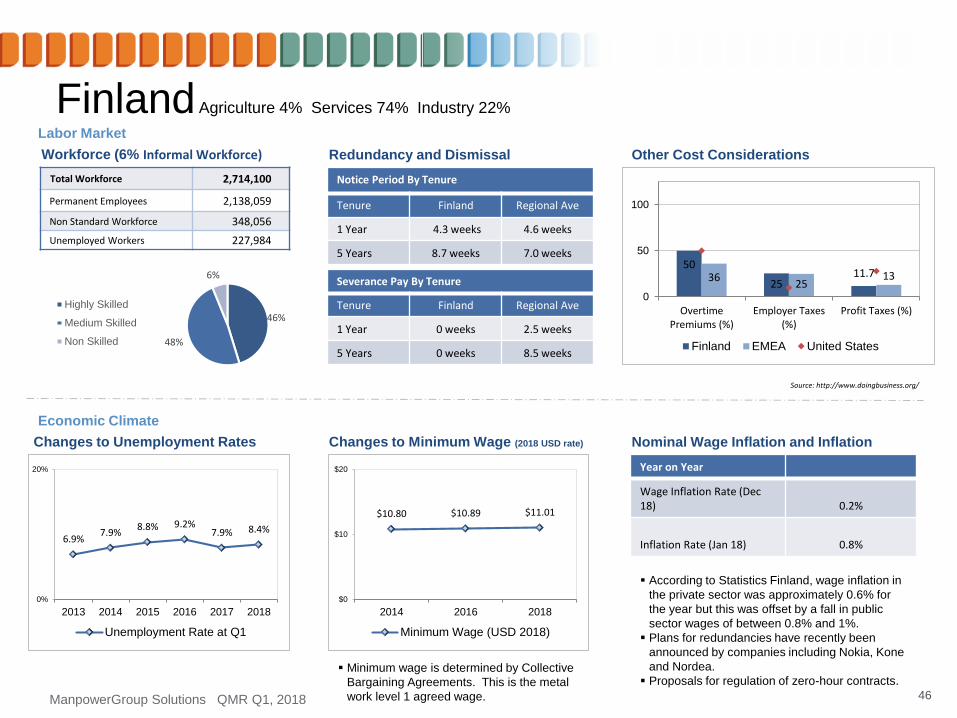
Finland Agriculture 4% Services 74% Industry 22%
Workforce (6% Informal Workforce)
Total Workforce 2,714,100
Permanent Employees 2,138,059
Non Standard Workforce 348,056
Unemployed Workers 227,984
Year on Year
Wage Inflation Rate (Dec 18) 0.2%
Inflation Rate (Jan 18) 0.8%
▪ According to Statistics Finland, wage inflation in
the private sector was approximately 0.6% for
the year but this was offset by a fall in public
sector wages of between 0.8% and 1%.
▪ Plans for redundancies have recently been
announced by companies including Nokia, Kone
and Nordea.
▪ Proposals for regulation of zero-hour contracts.
46%
48%
6%
Highly Skilled
Medium Skilled
Non Skilled
Notice Period By Tenure
Tenure Finland Regional Ave
1 Year 4.3 weeks 4.6 weeks
5 Years 8.7 weeks 7.0 weeks
Severance Pay By Tenure
Tenure Finland Regional Ave
1 Year 0 weeks 2.5 weeks
5 Years 0 weeks 8.5 weeks
50
2511.736
2513
0
50
100
OvertimePremiums (%)
Employer Taxes(%)
Profit Taxes (%)
Finland EMEA United States
6.9%7.9%
8.8% 9.2%7.9% 8.4%
0%
20%
2013 2014 2015 2016 2017 2018
Unemployment Rate at Q1
$10.80 $10.89 $11.01
$0
$10
$20
2014 2016 2018
Minimum Wage (USD 2018)
▪ Minimum wage is determined by Collective
Bargaining Agreements. This is the metal
work level 1 agreed wage.
Redundancy and Dismissal Other Cost Considerations
Nominal Wage Inflation and InflationChanges to Minimum Wage (2018 USD rate)Changes to Unemployment Rates
Economic Climate
Labor Market
Source: http://www.doingbusiness.org/

47ManpowerGroup Solutions QMR Q1, 2018
France Agriculture 3% Services 77% Industry 21%
Workforce (5% Informal Workforce)
Total Workforce 29,768,200
Permanent Employees 23,891,689
Non Standard Workforce 3,227,141
Unemployed Workers 2,649,370
Year on Year
Wage Inflation Rate (Sept 18) 0.3%
Inflation Rate (Jan 18) 1.2%
▪ Youth unemployment is at 22.3% (Dec 17).
▪ In the last quarter of 2017, more than 50,000
new jobs were added in the private sector
(mainly within services). Almost 235,000 jobs
were created in 2017.
▪ Skills shortages exist in manufacturing, IT and
engineering.
45%
45%
10%
Highly Skilled
Medium Skilled
Non Skilled
Notice Period By Tenure
Tenure France Regional Ave
1 Year 4.3 weeks 4.6 weeks
5 Years 8.7 weeks 7.0 weeks
Severance Pay By Tenure
Tenure France Regional Ave
1 Year 0.9 weeks 2.5 weeks
5 Years 4.3 weeks 8.5 weeks
25
51
0.73625
13
0
50
100
OvertimePremiums (%)
Employer Taxes(%)
Profit Taxes (%)
France EMEA United States
10.5% 10.9% 10.4% 10.6% 10.0%8.9%
0%
20%
2013 2014 2015 2016 2017 2018
Unemployment Rate at Q1
$11.76 $11.94 $12.19
$0
$10
$20
2014 2016 2018
Minimum Wage (USD 2018)
Redundancy and Dismissal Other Cost Considerations
Nominal Wage Inflation and InflationChanges to Minimum Wage (2018 USD rate)Changes to Unemployment Rates
Economic Climate
Labor Market
Source: http://www.doingbusiness.org/

48ManpowerGroup Solutions QMR Q1, 2018
Germany Agriculture 1% Services 71% Industry 28%
Workforce (5% Informal Workforce)
Total Workforce 43,662,200
Permanent Employees 37,755,054
Non Standard Workforce 4,335,307
Unemployed Workers 1,571,839
Year on Year
Wage Inflation Rate (Sept 17) 0.7%
Inflation Rate (Feb 18) 1.4%
▪ The IG Metall, which is Germany’s largest
metalworker’s union representing 3.9 million workers
has agreed a pay increase of 6% and also the right
for workers to temporarily reduce their working hours
to 28 per week for up to two years and then return to
full time work. This would give the worker more
flexibility to look after children or aging relatives etc.
▪ Proposals to limit some labor restrictions for high
earners to make Germany more competitive
(especially in the finance industry) post BREXIT.;
44%
48%
8%
Highly Skilled
Medium Skilled
Non Skilled
Notice Period By Tenure
Tenure Germany Regional Ave
1 Year 4.0 weeks 4.6 weeks
5 Years 8.7 weeks 7.0 weeks
Severance Pay By Tenure
Tenure Germany Regional Ave
1 Year 2.2 weeks 2.5 weeks
5 Years 10.8 weeks 8.5 weeks
0 21
23.236
2513
0
50
100
OvertimePremiums (%)
Employer Taxes(%)
Profit Taxes (%)
Germany EMEA United States
6.7%5.1% 4.8% 4.5% 3.9% 3.6%
0%
20%
2013 2014 2015 2016 2017 2018
Unemployment Rate at Q1
$10.11 $10.49 $10.91
$0
$10
$20
2014 2016 2018
Minimum Wage (USD 2018)
▪ This is the national minimum wage,
however higher minimum wages are often
set by Collective Agreements and are
enforceable by law.
Redundancy and Dismissal Other Cost Considerations
Nominal Wage Inflation and InflationChanges to Minimum Wage (2018 USD rate)Changes to Unemployment Rates
Economic Climate
Labor Market
Source: http://www.doingbusiness.org/

49ManpowerGroup Solutions QMR Q1, 2018
Greece Agriculture 13% Services 72% Industry 15%
Workforce (11% Informal Workforce)
Total Workforce 4,793,800
Permanent Employees 2,514,027
Non Standard Workforce 1,277,869
Unemployed Workers 1,001,904
Year on Year
Wage Inflation Rate (Dec 17) -1.3%
Inflation Rate (Dec 17) 0.7%
▪ Data from ERGANI, shows that 143,535 new
jobs were created in 2017. However more than
half of these were part-time.
▪ Industrial action during January in protest
against changes to the labor law including the
right to strike and wages.
31%
62%
7%
Highly Skilled
Medium Skilled
Non Skilled
Notice Period By Tenure
Tenure Greece Regional Ave
1 Year 0 weeks 4.6 weeks
5 Years 0 weeks 7.0 weeks
Severance Pay By Tenure
Tenure Greece Regional Ave
1 Year 8.7 weeks 2.5 weeks
5 Years 13.0 weeks 8.5 weeks
28 28
2336
2513
0
50
100
OvertimePremiums (%)
Employer Taxes(%)
Profit Taxes (%)
Greece EMEA United States
26.8% 27.8%25.8%
24.5%23.0%
20.9%
0%
30%
2013 2014 2015 2016 2017 2018
Unemployment Rate at Q1
$4.87 $5.22 $5.22
$0
$10
$20
2014 2016 2018
Minimum Wage (USD 2018)
Redundancy and Dismissal Other Cost Considerations
Nominal Wage Inflation and InflationChanges to Minimum Wage (2018 USD rate)Changes to Unemployment Rates
Economic Climate
Labor Market
Source: http://www.doingbusiness.org/

50ManpowerGroup Solutions QMR Q1, 2018
Hungary Agriculture 4% Services 64% Industry 30 %
Workforce (5% Informal Workforce)
Total Workforce 4,639,200
Permanent Employees 3,976,453
Non Standard Workforce 486,457
Unemployed Workers 176,290
Year on Year
Wage Inflation Rate (Dec 17) 13%
Inflation Rate (Dec 17) 2.1%
▪ Strikes in the retail sector have led to a
substantial increase in pay
▪ Wages are expected to increase in public
utilities by between 10% and 12% in 2018.
36%
54%
10%
Highly Skilled
Medium Skilled
Non Skilled
Notice Period By Tenure
Tenure Hungary Regional Ave
1 Year 4.3 weeks 4.6 weeks
5 Years 6.4 weeks 7.0 weeks
Severance Pay By Tenure
Tenure Hungary Regional Ave
1 Year 0 weeks 2.5 weeks
5 Years 8.7 weeks 8.5 weeks
5034 9.936
2513
0
50
100
OvertimePremiums (%)
Employer Taxes(%)
Profit Taxes (%)
Hungary EMEA United States
10.7%9.1%
7.1%6.2%
4.4% 3.8%
0%
20%
2013 2014 2015 2016 2017 2018
Unemployment Rate at Q1
$2.31 $2.53 $3.14
$0
$10
$20
2014 2016 2018
Minimum Wage (USD 2018)
▪ Minimum wage depends on the skill level.
Redundancy and Dismissal Other Cost Considerations
Nominal Wage Inflation and InflationChanges to Minimum Wage (2018 USD rate)Changes to Unemployment Rates
Economic Climate
Labor Market
Source: http://www.doingbusiness.org/

51ManpowerGroup Solutions QMR Q1, 2018
Ireland Agriculture 5% Services 77% Industry 18%
Workforce (7% Informal Workforce)
Total Workforce 2,370,400
Permanent Employees 1,860,773
Non Standard Workforce 365,032
Unemployed Workers 144,594
Year on Year
Wage Inflation Rate (3rd Qtr 2017)
<50 employees 2.0%50-250 employees 2.8%>250 employees 2.2%
Inflation Rate 0.4%
▪ By industry, the Central Statistics Office
reported that the transportation and storage
sector had the highest wage growth at 4.3%.
▪ Wage growth for 2018 is expected to be ~2.8%
37%
54%
9%
Highly Skilled
Medium Skilled
Non Skilled
Notice Period By Tenure
Tenure Ireland Regional Ave
1 Year 1.0 weeks 4.6 weeks
5 Years 4.0 weeks 7.0 weeks
Severance Pay By Tenure
Tenure Ireland Regional Ave
1 Year 0 weeks 2.5 weeks
5 Years 11.0 weeks 8.5 weeks
0 1212.436
2513
0
50
100
OvertimePremiums (%)
Employer Taxes(%)
Profit Taxes (%)
Ireland EMEA United States
14.6%
12.3%10.5%
8.6%7.1%
6.1%
0%
20%
2013 2014 2015 2016 2017 2018
Unemployment Rate at Q1
$10.68 $11.29 $11.79
$0
$10
$20
2014 2016 2018
Minimum Wage (USD 2018)
Redundancy and Dismissal Other Cost Considerations
Nominal Wage Inflation and InflationChanges to Minimum Wage (2018 USD rate)Changes to Unemployment Rates
Economic Climate
Labor Market
Source: http://www.doingbusiness.org/

52ManpowerGroup Solutions QMR Q1, 2018
Israel Agriculture 1% Services 81% Industry 18%
Workforce (6% Informal Workforce)
Total Workforce 4,017,542
Permanent Employees 3,247,460
Non Standard Workforce 609,381
Unemployed Workers 160,702
Year on Year
Wage Inflation Rate (Nov 17) 2.1%
Inflation Rate (Feb 18) 0.1%
▪ Growth in the economy was at 3% during 2017 and
is forecast to be 3.5% during 2018.
▪ According to the Israel Innovation Authority, the
average monthly salary in a high tech job (NIS
21,000 ~ $6K US) is twice the average salary in
Israel. During the next decade, the Authority aims
to increase employees in high tech from 270,000 to
500,000. In the short term, they are trying to attract
skilled immigrants, run intensive coding courses and
integrate the Arab population into the labor force.
51%42%
7%
Highly Skilled
Medium Skilled
Non Skilled
Notice Period By Tenure
Tenure Israel Regional Ave
1 Year 4.3 weeks 4.6 weeks
5 Years 4.3 weeks 7.0 weeks
Severance Pay By Tenure
Tenure Israel Regional Ave
1 Year 4.3 weeks 2.5 weeks
5 Years 21.7 weeks 8.5 weeks
25 6
19.636
2513
0
50
100
OvertimePremiums (%)
Employer Taxes(%)
Profit Taxes (%)
Israel EMEA United States
6.9%5.8% 5.7% 5.2%
4.3% 4.0%
0%
20%
2013 2014 2015 2016 2017 2018
Unemployment Rate at Q1
$6.63 $7.17$8.17
$0
$10
$20
2014 2016 2018
Minimum Wage (USD 2018)
Redundancy and Dismissal Other Cost Considerations
Nominal Wage Inflation and InflationChanges to Minimum Wage (2018 USD rate)Changes to Unemployment Rates
Economic Climate
Labor Market
Source: http://www.doingbusiness.org/

53ManpowerGroup Solutions QMR Q1, 2018
Italy Agriculture 4% Services 69% Industry 27%
Workforce (9% Informal Workforce)
Total Workforce 25,923,800
Permanent Employees 17,551,138
Non Standard Workforce 5,572,891
Unemployed Workers 2,799,770
Year on Year
Wage Inflation Rate (Jan 18) 0.7%
Inflation Rate (Jan 18) 0.8%
▪ Italy has struggled with both economic growth
and low productivity.
▪ Youth unemployment is decreasing but still at
32.7%.
▪ Elections are due in early March with the
Democratic Party promising a minimum wage.
36%
53%
11%
Highly Skilled
Medium Skilled
Non Skilled
Notice Period By Tenure
Tenure Italy Regional Ave
1 Year 2.9 weeks 4.6 weeks
5 Years 4.3 weeks 7.0 weeks
Severance Pay By Tenure
Tenure Italy Regional Ave
1 Year 0 weeks 2.5 weeks
5 Years 0 weeks 8.5 weeks
15 23
23.336
2513
0
50
100
OvertimePremiums (%)
Employer Taxes(%)
Profit Taxes (%)
Italy EMEA United States
11.2%12.7% 12.9%
11.4% 12.0%10.8%
0%
20%
2013 2014 2015 2016 2017 2018
Unemployment Rate at Q1
$6.81 $6.70 $6.09
$0
$10
$20
2014 2016 2018
Minimum Wage (USD 2018)
▪ There isn’t a minimum wage in Italy. This is
the change to the Living Wage for an
individual as calculated by Wageindicator
Foundation.
Redundancy and Dismissal Other Cost Considerations
Nominal Wage Inflation and InflationChanges to Living Wage (2018 USD rate)Changes to Unemployment Rates
Economic Climate
Labor Market
Source: http://www.doingbusiness.org/

54ManpowerGroup Solutions QMR Q1, 2018
KazakhstanAgriculture 18% Services 62% Industry 20 %
Workforce (28% Informal Workforce)
Total Workforce 9,209,076
Permanent Employees 6,401,975
Non Standard Workforce 2,355,857
Unemployed Workers 451,245
Year on Year
Wage Inflation Rate (Jan 18)
Highly skilled 5.75%Low skilled 10.2%
Inflation Rate (Jan 18) 6.8%
▪ The Minister for National Economy has said that
over 17,000 jobs were created in 2017 in small
and medium sized enterprises
34%
47%
19%
Highly Skilled
Medium Skilled
Non Skilled
Notice Period By Tenure
Tenure Kazakhstan Regional Ave
1 Year 4.3 weeks 4.6 weeks
5 Years 4.3 weeks 7.0 weeks
Severance Pay By Tenure
Tenure Kazakhstan Regional Ave
1 Year 4.3 weeks 2.5 weeks
5 Years 4.3 weeks 8.5 weeks
50
1116.2
3625
13
0
50
100
OvertimePremiums (%)
Employer Taxes(%)
Profit Taxes (%)
Kazakhstan EMEA United States
5.3% 5.2% 5.0% 5.0% 5.0% 4.9%
0%
20%
2013 2014 2015 2016 2017 2018
Unemployment Rate at Q1
$0.36 $0.39 $0.51
$0
$10
$20
2014 2016 2018
Minimum Wage (USD 2018)
Redundancy and Dismissal Other Cost Considerations
Nominal Wage Inflation and InflationChanges to Minimum Wage (2018 USD rate)Changes to Unemployment Rates
Economic Climate
Labor Market
Source: http://www.doingbusiness.org/

55ManpowerGroup Solutions QMR Q1, 2018
Latvia Agriculture 7% Services 70% Industry 23%
Workforce (4% Informal Workforce)
Total Workforce 987,000
Permanent Employees 784,798
Non Standard Workforce 118,307
Unemployed Workers 83,895
Year on Year
Wage Inflation Rate (Dec 17) 7.5%
Inflation Rate (Dec 17) 2.2%
▪ In 2017, Latvia’s GDP grew by 4.5% which was
the best growth since 2011.
▪ The Finance Ministry expects that wage growth
in 2018 will be at 8%, inflation will be at 2.8%
dropping to 2.4% in 2019.
▪ Latvian tax authority published a list of
employers that pay their employees minimum
wage or less.
40%
47%
13%
Highly Skilled
Medium Skilled
Non Skilled
Notice Period By Tenure
Tenure Latvia Regional Ave
1 Year 4.3 weeks 4.6 weeks
5 Years 4.3 weeks 7.0 weeks
Severance Pay By Tenure
Tenure Latvia Regional Ave
1 Year 4.3 weeks 2.5 weeks
5 Years 8.7 weeks 8.5 weeks
100
27 6.33625
13
0
50
100
OvertimePremiums (%)
Employer Taxes(%)
Profit Taxes (%)
Latvia EMEA United States
10.5%11.8%
10.6%9.7% 9.5%
8.5%
0%
20%
2013 2014 2015 2016 2017 2018
Unemployment Rate at Q1
$2.28 $2.64 $3.06
$0
$10
$20
2014 2016 2018
Minimum Wage (USD 2018)
Redundancy and Dismissal Other Cost Considerations
Nominal Wage Inflation and InflationChanges to Minimum Wage (2018 USD rate)Changes to Unemployment Rates
Economic Climate
Labor Market
Source: http://www.doingbusiness.org/

56ManpowerGroup Solutions QMR Q1, 2018
Lithuania Agriculture 9% Services 67% Industry 25%
Workforce (4% Informal Workforce)
Total Workforce 1,454,300
Permanent Employees 1,161,804
Non Standard Workforce 165,972
Unemployed Workers 126,524
Year on Year
Wage Inflation Rate (Q4, 2017) 7.5%
Inflation Rate (Dec 17) 3.9%
▪ Wage growth is being driven by the private
sector where the wage growth was 8% for the
last quarter. The wage growth has been
attributed to a shortage of skilled workers and a
favourable economic environment.
▪ Due to inflation, real wage growth was 5.7% in
2017 which was down from the 7.7% of 2016.
▪ Lithuania’s Swedbank has forecast wage
inflation to be 7% during 2018.
42%
49%
9%
Highly Skilled
Medium Skilled
Non Skilled
Notice Period By Tenure
Tenure Lithuania Regional Ave
1 Year 8.7 weeks 4.6 weeks
5 Years 8.7 weeks 7.0 weeks
Severance Pay By Tenure
Tenure Lithuania Regional Ave
1 Year 8.7 weeks 2.5 weeks
5 Years 17.3 weeks 8.5 weeks
5035 5.936
2513
0
50
100
OvertimePremiums (%)
Employer Taxes(%)
Profit Taxes (%)
Lithuania EMEA United States
12.5%10.9%
9.4% 9.0% 8.5% 8.7%
0%
20%
2013 2014 2015 2016 2017 2018
Unemployment Rate at Q1
$2.49 $2.85
$0
$10
$20
2014 2016 2018
Minimum Wage (USD 2018)
▪ Lithuania introduced the Euro at the
beginning of 2015.
Redundancy and Dismissal Other Cost Considerations
Nominal Wage Inflation and InflationChanges to Minimum Wage (2018 USD rate)Changes to Unemployment Rates
Economic Climate
Labor Market
Source: http://www.doingbusiness.org/
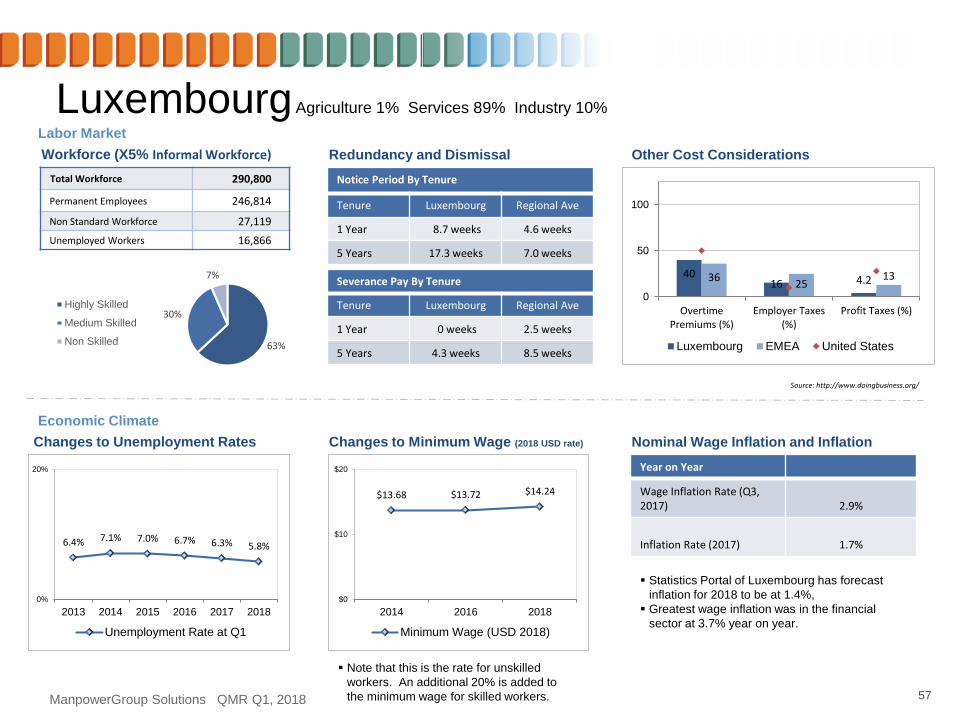
57ManpowerGroup Solutions QMR Q1, 2018
Luxembourg Agriculture 1% Services 89% Industry 10%
Workforce (X5% Informal Workforce)
Total Workforce 290,800
Permanent Employees 246,814
Non Standard Workforce 27,119
Unemployed Workers 16,866
Year on Year
Wage Inflation Rate (Q3, 2017) 2.9%
Inflation Rate (2017) 1.7%
▪ Statistics Portal of Luxembourg has forecast
inflation for 2018 to be at 1.4%,
▪ Greatest wage inflation was in the financial
sector at 3.7% year on year.
63%
30%
7%
Highly Skilled
Medium Skilled
Non Skilled
Notice Period By Tenure
Tenure Luxembourg Regional Ave
1 Year 8.7 weeks 4.6 weeks
5 Years 17.3 weeks 7.0 weeks
Severance Pay By Tenure
Tenure Luxembourg Regional Ave
1 Year 0 weeks 2.5 weeks
5 Years 4.3 weeks 8.5 weeks
4016 4.236
2513
0
50
100
OvertimePremiums (%)
Employer Taxes(%)
Profit Taxes (%)
Luxembourg EMEA United States
6.4% 7.1% 7.0% 6.7% 6.3% 5.8%
0%
20%
2013 2014 2015 2016 2017 2018
Unemployment Rate at Q1
$13.68 $13.72 $14.24
$0
$10
$20
2014 2016 2018
Minimum Wage (USD 2018)
▪ Note that this is the rate for unskilled
workers. An additional 20% is added to
the minimum wage for skilled workers.
Redundancy and Dismissal Other Cost Considerations
Nominal Wage Inflation and InflationChanges to Minimum Wage (2018 USD rate)Changes to Unemployment Rates
Economic Climate
Labor Market
Source: http://www.doingbusiness.org/

58ManpowerGroup Solutions QMR Q1, 2018
Morocco Agriculture 33% Services 47% Industry 21%
Workforce (29% Informal Workforce)
Total Workforce 12,714,115
Permanent Employees 5,274,018
Non Standard Workforce 6,092,400
Unemployed Workers 1,347,696
Year on Year
Wage Inflation Rate N/A
Inflation Rate (Jan 18) 1.8%
▪ Youth unemployment is at 29.3%. Graduate
unemployment in 2015 was 24.4%
▪ The average wage in the private sector is 1.57
times lower than the public sector.
7%
77%
16%
Highly Skilled
Medium Skilled
Non Skilled
Notice Period By Tenure
Tenure Morocco Regional Ave
1 Year 4.3 weeks 4.6 weeks
5 Years 8.7 weeks 7.0 weeks
Severance Pay By Tenure
Tenure Morocco Regional Ave
1 Year 2.2 weeks 2.5 weeks
5 Years 10.9 weeks 8.5 weeks
25 23
25.1
3625
13
0
50
100
OvertimePremiums (%)
Employer Taxes(%)
Profit Taxes (%)
Morocco EMEA United States
9.4% 10.0% 9.7% 9.5% 9.4%10.6%
0%
20%
2013 2014 2015 2016 2017 2018
Unemployment Rate at Q1
$1.32 $1.46 $1.46
$0
$10
$20
2014 2016 2018
Minimum Wage (USD 2018)
▪ This is the private sector minimum wage.
The public sector is treated differently.
Redundancy and Dismissal Other Cost Considerations
Nominal Wage Inflation and InflationChanges to Minimum Wage (2018 USD rate)Changes to Unemployment Rates
Economic Climate
Labor Market
Source: http://www.doingbusiness.org/

59ManpowerGroup Solutions QMR Q1, 2018
Netherlands Agriculture 2% Services 82% Industry 16%
Workforce (7% Informal Workforce)
Total Workforce 9,072,000
Permanent Employees 7,239,583
Non Standard Workforce 1,451,393
Unemployed Workers 381,024
Year on Year
Wage Inflation Rate (Dec 17) 1.7%
Inflation Rate (Dec 17) 1.3%
▪ 80% of employees in the Netherlands are
covered by collective bargaining agreements.
▪ According to CBS, the national statistics office,
there were only 1.8 applicants per job vacancy
during Q4 of 2017.
47%
44%
9%
Highly Skilled
Medium Skilled
Non Skilled
Notice Period By Tenure
Tenure Netherlands Regional Ave
1 Year 4.3 weeks 4.6 weeks
5 Years 8.7 weeks 7.0 weeks
Severance Pay By Tenure
Tenure Netherlands Regional Ave
1 Year 0 weeks 2.5 weeks
5 Years 7.2 weeks 8.5 weeks
0 20
20.536
2513
0
50
100
OvertimePremiums (%)
Employer Taxes(%)
Profit Taxes (%)
Netherlands EMEA United States
7.2%8.5% 8.1%
6.6%5.4%
4.2%
0%
20%
2013 2014 2015 2016 2017 2018
Unemployment Rate at Q1
$10.58 $10.86 $11.25
$0
$10
$20
2014 2016 2018
Minimum Wage (USD 2018)
▪ This minimum wage is for workers who are
23 years or over.
Redundancy and Dismissal Other Cost Considerations
Nominal Wage Inflation and InflationChanges to Minimum Wage (2018 USD rate)Changes to Unemployment Rates
Economic Climate
Labor Market
Source: http://www.doingbusiness.org/

60ManpowerGroup Solutions QMR Q1, 2018
Norway Agriculture 2% Services 78% Industry 20%
Workforce (5% Informal Workforce)
Total Workforce 2,748,800
Permanent Employees 2,454,208
Non Standard Workforce 181,891
Unemployed Workers 112,701
Year on Year
Wage Inflation Rate (Dec 17) 2.3%
Inflation Rate (Jan 18) 1.6%
▪ Inflation is expected to rise to 2% in 2018.
▪ The central bank has predicted that wages will
rise by 2.9% in 2018 which is an increase on
2017 where the average wage grew by 2.3%
although it was 2.5% in the manufacturing
sector.
51%45%
4%
Highly Skilled
Medium Skilled
Non Skilled
Notice Period By Tenure
Tenure Norway Regional Ave
1 Year 4.3 weeks 4.6 weeks
5 Years 8.7 weeks 7.0 weeks
Severance Pay By Tenure
Tenure Norway Regional Ave
1 Year 0 weeks 2.5 weeks
5 Years 0 weeks 8.5 weeks
4016
21.636
2513
0
50
100
OvertimePremiums (%)
Employer Taxes(%)
Profit Taxes (%)
Norway EMEA United States
3.5% 3.5% 3.7%4.6% 4.7% 4.1%
0%
20%
2013 2014 2015 2016 2017 2018
Unemployment Rate at Q1
$18.95
$21.68$23.75
$0
$10
$20
2014 2016 2018
Minimum Wage (USD 2018)
▪ Wages are determined by industry through
Collective Bargaining Agreements. This is
the wage for unskilled workers in
construction.
Redundancy and Dismissal Other Cost Considerations
Nominal Wage Inflation and InflationChanges to Minimum Wage (2018 USD rate)Changes to Unemployment Rates
Economic Climate
Labor Market
Source: http://www.doingbusiness.org/

61ManpowerGroup Solutions QMR Q1, 2018
Poland Agriculture 11% Services 60% Industry 30%
Workforce (9% Informal Workforce)
Total Workforce 17,327,200
Permanent Employees 12,817,415
Non Standard Workforce 3,366,190
Unemployed Workers 1,143,595
Year on Year
Wage Inflation Rate (Dec 17) 7.3%
Inflation Rate (Dec 17) 2.1%
▪ GDP growth in Poland in 2017 was at 4.6% which is
the highest rate since 2011.
▪ Restrictions on Sunday trading which are due to be
implemented in March are not expected to have an
impact on unemployment.
▪ 2 million Ukrainian immigrants are currently working
in Poland. There is concern that lifting Visa
restrictions in the Schengen Area will create a labor
shortage in Poland as Ukrainians move to wealthier
countries.
37%
56%
7%
Highly Skilled
Medium Skilled
Non Skilled
Notice Period By Tenure
Tenure Poland Regional Ave
1 Year 4.3 weeks 4.6 weeks
5 Years 13.0 weeks 7.0 weeks
Severance Pay By Tenure
Tenure Poland Regional Ave
1 Year 4.3 weeks 2.5 weeks
5 Years 8.7 weeks 8.5 weeks
50
2514.5
3625
13
0
50
100
OvertimePremiums (%)
Employer Taxes(%)
Profit Taxes (%)
Poland EMEA United States
13.4% 13.4%12.1%
10.3%8.7%
6.6%
0%
20%
2013 2014 2015 2016 2017 2018
Unemployment Rate at Q1
$3.02 $3.16 $3.59
$0
$10
$20
2014 2016 2018
Minimum Wage (USD 2018)
Redundancy and Dismissal Other Cost Considerations
Nominal Wage Inflation and InflationChanges to Minimum Wage (2018 USD rate)Changes to Unemployment Rates
Economic Climate
Labor Market
Source: http://www.doingbusiness.org/

62ManpowerGroup Solutions QMR Q1, 2018
Portugal Agriculture 8% Services 68% Industry 24%
Workforce (8% Informal Workforce)
Total Workforce 5,226,900
Permanent Employees 3,958,101
Non Standard Workforce 845,420
Unemployed Workers 423,379
Year on Year
Wage Inflation Rate (Nov 17) 5.4%
Inflation Rate (Jan 18) 1.1%
▪ The government has committed to raising
minimum wages to €600 per month in 2019.
The recent minimum wage rise of 4.1% puts the
monthly rate at €580 (paid 14 times a year)
▪ There are 800,000 minimum wage workers in
Portugal.
35%
55%
11%
Highly Skilled
Medium Skilled
Non Skilled
Notice Period By Tenure
Tenure Portugal Regional Ave
1 Year 4.3 weeks 4.6 weeks
5 Years 8.6 weeks 7.0 weeks
Severance Pay By Tenure
Tenure Portugal Regional Ave
1 Year 1.7 weeks 2.5 weeks
5 Years 8.6 weeks 8.5 weeks
31 2712.536
2513
0
50
100
OvertimePremiums (%)
Employer Taxes(%)
Profit Taxes (%)
Portugal EMEA United States
15.8% 15.3%13.5%
11.9%10.5%
8.1%
0%
20%
2013 2014 2015 2016 2017 2018
Unemployment Rate at Q1
$4.03 $4.40 $4.82
$0
$10
$20
2014 2016 2018
Minimum Wage (USD 2018)
Redundancy and Dismissal Other Cost Considerations
Nominal Wage Inflation and InflationChanges to Minimum Wage (2018 USD rate)Changes to Unemployment Rates
Economic Climate
Labor Market
Source: http://www.doingbusiness.org/

63ManpowerGroup Solutions QMR Q1, 2018
Romania Agriculture 26% Services 47% Industry 28%
Workforce (13% Informal Workforce)
Total Workforce 9,290,700
Permanent Employees 6,514,546
Non Standard Workforce 2,348,782
Unemployed Workers 427,372
Year on Year
Wage Inflation Rate (Nov 17) 12.4%
Inflation Rate (Jan 18) 4.3%
23%
67%
10%
Highly Skilled
Medium Skilled
Non Skilled
Notice Period By Tenure
Tenure Romania Regional Ave
1 Year 4.0 weeks 4.6 weeks
5 Years 4.0 weeks 7.0 weeks
Severance Pay By Tenure
Tenure Romania Regional Ave
1 Year 0 weeks 2.5 weeks
5 Years 0 weeks 8.5 weeks
75
2611.636
2513
0
50
100
OvertimePremiums (%)
Employer Taxes(%)
Profit Taxes (%)
Romania EMEA United States
6.5% 7.1% 6.4% 6.7%5.5%
4.6%
0%
20%
2013 2014 2015 2016 2017 2018
Unemployment Rate at Q1
$1.30 $1.97$2.91
$0
$10
$20
2014 2016 2018
Minimum Wage (USD 2018)
▪ Despite a 31% increase in minimum wage in
January 2018, the net income of minimum wage
earning Romanians will only increase by 8% as
the government has shifted the burden of social
security contributions to the employee.
▪ According to a trade union leader Dumitru
Costin, only about half of the employers have
increased worker’s salaries.
Redundancy and Dismissal Other Cost Considerations
Nominal Wage Inflation and InflationChanges to Minimum Wage (2018 USD rate)Changes to Unemployment Rates
Economic Climate
Labor Market
Source: http://www.doingbusiness.org/

64ManpowerGroup Solutions QMR Q1, 2018
Russia Agriculture 7% Services 66% Industry 27%
Workforce (5% Informal Workforce)
Total Workforce 75,500,360
Permanent Employees 66,204,454
Non Standard Workforce 5,445,388
Unemployed Workers 3,850,518
Year on Year
Wage Inflation Rate (Jan 2018 6.2%
Inflation Rate 2.2%
▪ Legislation has been passed to increase
minimum wage by 43% by May 2018.
44%
46%
10%
Highly Skilled
Medium Skilled
Non Skilled
Notice Period By Tenure
Tenure Russia Regional Ave
1 Year 8.7 weeks 4.6 weeks
5 Years 8.7 weeks 7.0 weeks
Severance Pay By Tenure
Tenure Russia Regional Ave
1 Year 8.7 weeks 2.5 weeks
5 Years 8.7 weeks 8.5 weeks
5036 8.836
2513
0
50
100
OvertimePremiums (%)
Employer Taxes(%)
Profit Taxes (%)
Russia EMEA United States
5.3% 5.6% 5.3% 5.8% 5.3% 5.1%
0%
20%
2013 2014 2015 2016 2017 2018
Unemployment Rate at Q1
$0.57 $0.64 $0.98
$0
$10
$20
2014 2016 2018
Minimum Wage (USD 2018)
Redundancy and Dismissal Other Cost Considerations
Nominal Wage Inflation and InflationChanges to Minimum Wage (2018 USD rate)Changes to Unemployment Rates
Economic Climate
Labor Market
Source: http://www.doingbusiness.org/

65ManpowerGroup Solutions QMR Q1, 2018
Serbia Agriculture 19% Services 56% Industry 25%
Workforce (35% Informal Workforce)
Total Workforce 3,142,798
Permanent Employees 1,872,366
Non Standard Workforce 865,011
Unemployed Workers 405,421
Year on Year
Wage Inflation Rate (Sept 2017) 4.2%
Inflation Rate 3.0%
29%
62%
9%
Highly Skilled
Medium Skilled
Non Skilled
Notice Period By Tenure
Tenure Serbia Regional Ave
1 Year 0 weeks 4.6 weeks
5 Years 0 weeks 7.0 weeks
Severance Pay By Tenure
Tenure Serbia Regional Ave
1 Year 1.4 weeks 2.5 weeks
5 Years 7.2 weeks 8.5 weeks
26 2016
3625
13
0
50
100
OvertimePremiums (%)
Employer Taxes(%)
Profit Taxes (%)
Serbia EMEA United States
22.4%
20.1%
16.8% 17.3%
13.8% 12.9%
0%
25%
2013 2014 2015 2016 2017 2018
Unemployment Rate at Q1
$1.20 $1.70$2.79
$0
$10
$20
2014 2016 2018
Minimum Wage (USD 2018)
▪ There are approximately 350,000 minimum
wage workers in Serbia.
▪ Youth unemployment is at 28.8% (Sept 17)
▪ The World Bank has reported that economic
growth during 2017 was 2.0% and it is forecast
to be 3.0% during 2018.
Redundancy and Dismissal Other Cost Considerations
Nominal Wage Inflation and InflationChanges to Minimum Wage (2018 USD rate)Changes to Unemployment Rates
Economic Climate
Labor Market
Source: http://www.doingbusiness.org/

66ManpowerGroup Solutions QMR Q1, 2018
Slovakia Agriculture 3% Services 62% Industry 35%
Workforce (11% Informal Workforce)
Total Workforce 2,763,200
Permanent Employees 2,197,145
Non Standard Workforce 403,027
Unemployed Workers 163,029
Year on Year
Wage Inflation Rate (Dec 17) 3.6%
Inflation Rate (Dec 17) 1.9%
▪ More than 1 in 5 workers in Slovakia receive the
minimum wage. The current prime minister plans
to rapidly increase the minimum wage.
▪ Approximately 19% of workers in Slovakia work
the night shift. Revisions to the Labor Code have
been drafted to reduce the amount of night work
by increasing the premiums on night work and
weekend work. Additionally, there is a proposal to
introduce 13th and 14th month salaries.
32%
60%
8%
Highly Skilled
Medium Skilled
Non Skilled
Notice Period By Tenure
Tenure Slovakia Regional Ave
1 Year 8.7 weeks 4.6 weeks
5 Years 13.0 weeks 7.0 weeks
Severance Pay By Tenure
Tenure Slovakia Regional Ave
1 Year 0 weeks 2.5 weeks
5 Years 8.7 weeks 8.5 weeks
2540 10.536
2513
0
50
100
OvertimePremiums (%)
Employer Taxes(%)
Profit Taxes (%)
Slovakia EMEA United States
14.4%13.5%
12.3%10.6%
8.8%
5.9%
0%
20%
2013 2014 2015 2016 2017 2018
Unemployment Rate at Q1
$2.51 $2.88 $3.42
$0
$10
$20
2014 2016 2018
Minimum Wage (USD 2018)
Redundancy and Dismissal Other Cost Considerations
Nominal Wage Inflation and InflationChanges to Minimum Wage (2018 USD rate)Changes to Unemployment Rates
Economic Climate
Labor Market
Source: http://www.doingbusiness.org/

67ManpowerGroup Solutions QMR Q1, 2018
Slovenia Agriculture 9% Services 62% Industry 30%
Workforce (7% Informal Workforce)
Total Workforce 1,039,000
Permanent Employees 814,853
Non Standard Workforce 133,754
Unemployed Workers 90,393
Year on Year
Wage Inflation Rate (Dec 17) 4.1%
Inflation Rate (Feb 18) 1.2%
▪ 2018 has already seen strikes in the public
sector over wages. Slovenia’s government has
offered a 1% pay rise which is considerably
lower than the demands of the unions.
▪ GDP growth in Slovenia was 5% in 2017.
Employment was up by 2.8%
43%
48%
9%
Highly Skilled
Medium Skilled
Non Skilled
Notice Period By Tenure
Tenure Slovenia Regional Ave
1 Year 4.3 weeks 4.6 weeks
5 Years 5.1 weeks 7.0 weeks
Severance Pay By Tenure
Tenure Slovenia Regional Ave
1 Year 0.9 weeks 2.5 weeks
5 Years 4.3 weeks 8.5 weeks
30 1812.736
2513
0
50
100
OvertimePremiums (%)
Employer Taxes(%)
Profit Taxes (%)
Slovenia EMEA United States
12.2% 13.0% 12.5% 11.7%10.4%
8.7%
0%
20%
2013 2014 2015 2016 2017 2018
Unemployment Rate at Q1
$5.58 $5.63 $6.01
$0
$10
$20
2014 2016 2018
Minimum Wage (USD 2018)
Redundancy and Dismissal Other Cost Considerations
Nominal Wage Inflation and InflationChanges to Minimum Wage (2018 USD rate)Changes to Unemployment Rates
Economic Climate
Labor Market
Source: http://www.doingbusiness.org/
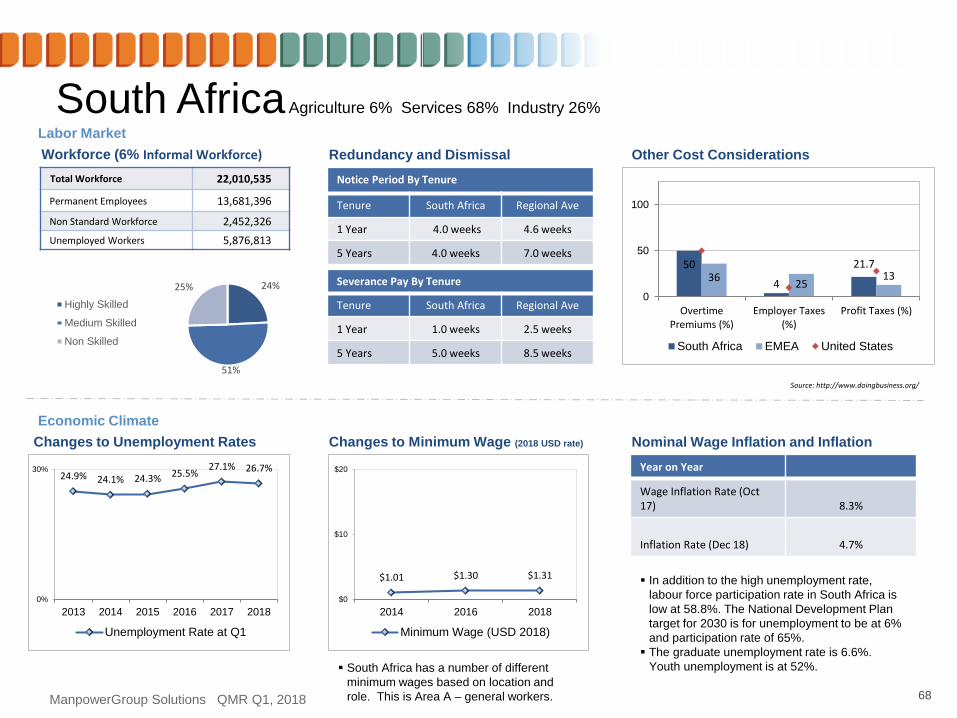
68ManpowerGroup Solutions QMR Q1, 2018
South Africa Agriculture 6% Services 68% Industry 26%
Workforce (6% Informal Workforce)
Total Workforce 22,010,535
Permanent Employees 13,681,396
Non Standard Workforce 2,452,326
Unemployed Workers 5,876,813
Year on Year
Wage Inflation Rate (Oct 17) 8.3%
Inflation Rate (Dec 18) 4.7%
▪ In addition to the high unemployment rate,
labour force participation rate in South Africa is
low at 58.8%. The National Development Plan
target for 2030 is for unemployment to be at 6%
and participation rate of 65%.
▪ The graduate unemployment rate is 6.6%.
Youth unemployment is at 52%.
24%
51%
25%
Highly Skilled
Medium Skilled
Non Skilled
Notice Period By Tenure
Tenure South Africa Regional Ave
1 Year 4.0 weeks 4.6 weeks
5 Years 4.0 weeks 7.0 weeks
Severance Pay By Tenure
Tenure South Africa Regional Ave
1 Year 1.0 weeks 2.5 weeks
5 Years 5.0 weeks 8.5 weeks
50
4
21.736
2513
0
50
100
OvertimePremiums (%)
Employer Taxes(%)
Profit Taxes (%)
South Africa EMEA United States
24.9% 24.1% 24.3% 25.5%27.1% 26.7%
0%
30%
2013 2014 2015 2016 2017 2018
Unemployment Rate at Q1
$1.01 $1.30 $1.31
$0
$10
$20
2014 2016 2018
Minimum Wage (USD 2018)
▪ South Africa has a number of different
minimum wages based on location and
role. This is Area A – general workers.
Redundancy and Dismissal Other Cost Considerations
Nominal Wage Inflation and InflationChanges to Minimum Wage (2018 USD rate)Changes to Unemployment Rates
Economic Climate
Labor Market
Source: http://www.doingbusiness.org/

69ManpowerGroup Solutions QMR Q1, 2018
Spain Agriculture 4% Services 77% Industry 19%
Workforce (6% Informal Workforce)
Total Workforce 22,765,000
Permanent Employees 15,843,825
Non Standard Workforce 3,153,567
Unemployed Workers 3,767,608
Year on Year
Wage Inflation Rate (Jan 18) 0%
Inflation Rate (Jan 18) 0.5%
▪ Minimum wage is expected to increase to €850
per month by 2020.
▪ Between 2008 and 2017, 1 million jobs were lost
in the construction industry. Over the same
time, 400,000 jobs have been created in
hospitality and tourism. However, many of the
new jobs have been low skilled and in the first
half of 2017, 97% of the new jobs in the sector
were for part time and temporary jobs.
33%
54%
13%
Highly Skilled
Medium Skilled
Non Skilled
Notice Period By Tenure
Tenure Spain Regional Ave
1 Year 2.1 weeks 4.6 weeks
5 Years 2.1 weeks 7.0 weeks
Severance Pay By Tenure
Tenure Spain Regional Ave
1 Year 2.9 weeks 2.5 weeks
5 Years 14.3 weeks 8.5 weeks
036 10.636
2513
0
50
100
OvertimePremiums (%)
Employer Taxes(%)
Profit Taxes (%)
Spain EMEA United States
26.0% 26.0%23.7%
20.9%18.6%
16.6%
0%
30%
2013 2014 2015 2016 2017 2018
Unemployment Rate at Q1
$4.72 $4.74 $5.38
$0
$10
$20
2014 2016 2018
Minimum Wage (USD 2018)
Redundancy and Dismissal Other Cost Considerations
Nominal Wage Inflation and InflationChanges to Minimum Wage (2018 USD rate)Changes to Unemployment Rates
Economic Climate
Labor Market
Source: http://www.doingbusiness.org/

70ManpowerGroup Solutions QMR Q1, 2018
Sweden Agriculture 2% Services 80% Industry 18%
Workforce (5% Informal Workforce)
Total Workforce 5,351,200
Permanent Employees 4,483,931
Non Standard Workforce 492,685
Unemployed Workers 374,584
Year on Year
Wage Inflation Rate N/A
Inflation Rate (Dec 17) 1.7%
▪ The economy grew at 2.9% in 2017 and similar
growth is expected in 2018.
▪ Due to skill shortages, a recent open letter to the
Government from a group of company bosses
requested that skilled migrants aren’t deported.
50%45%
5%
Highly Skilled
Medium Skilled
Non Skilled
Notice Period By Tenure
Tenure Sweden Regional Ave
1 Year 4.3 weeks 4.6 weeks
5 Years 13.0 weeks 7.0 weeks
Severance Pay By Tenure
Tenure Sweden Regional Ave
1 Year 0 weeks 2.5 weeks
5 Years 0 weeks 8.5 weeks
035
13.13625
13
0
50
100
OvertimePremiums (%)
Employer Taxes(%)
Profit Taxes (%)
Sweden EMEA United States
8.9%7.5% 7.0% 6.7% 6.5% 7.0%
0%
20%
2013 2014 2015 2016 2017 2018
Unemployment Rate at Q1
$12.29
$16.51 $17.23
$0
$10
$20
2014 2016 2018
Minimum Wage (USD 2018)
▪ Sweden does not have a minimum wage
as it uses Collective Bargaining. The
above rates are the lowest hourly pay in
the manual section, excluding overtime.
Redundancy and Dismissal Other Cost Considerations
Nominal Wage Inflation and InflationChanges to Minimum Wage (2018 USD rate)Changes to Unemployment Rates
Economic Climate
Labor Market
Source: http://www.doingbusiness.org/

71ManpowerGroup Solutions QMR Q1, 2018
Switzerland Agriculture 4% Services 76% Industry 20%
Workforce (6% Informal Workforce)
Total Workforce 4,881,900
Permanent Employees 3,993,795
Non Standard Workforce 727,003
Unemployed Workers 161,103
Year on Year
Wage Inflation Rate 0.3%
Inflation Rate (Jan 18) 0.7%
▪ Economic growth was 1.8% during 2017 and is
expected to be 2.3% in 2018.
52%44%
4%
Highly Skilled
Medium Skilled
Non Skilled
Notice Period By Tenure
Tenure Switzerland Regional Ave
1 Year 8.7 weeks 4.6 weeks
5 Years 8.7 weeks 7.0 weeks
Severance Pay By Tenure
Tenure Switzerland Regional Ave
1 Year 0 weeks 2.5 weeks
5 Years 0 weeks 8.5 weeks
25 189.336
2513
0
50
100
OvertimePremiums (%)
Employer Taxes(%)
Profit Taxes (%)
Switzerland EMEA United States
3.4% 3.5% 3.5% 3.8% 3.7% 3.3%
0%
20%
2013 2014 2015 2016 2017 2018
Unemployment Rate at Q1
$17.64$19.88
$22.23
$0
$10
$20
2014 2016 2018
Minimum Wage (USD 2018)
▪ No national minimum wage. In 2017,
Neuchâtel Canton introduced a minimum
wage of 20 Fracs per hour. 2014 and 2016
figures refer to skilled Domestic help.
Redundancy and Dismissal Other Cost Considerations
Nominal Wage Inflation and InflationChanges to Minimum Wage (2018 USD rate)Changes to Unemployment Rates
Economic Climate
Labor Market
Source: http://www.doingbusiness.org/

72ManpowerGroup Solutions QMR Q1, 2018
Tunisia Agriculture 12% Services 59% Industry 29%
Workforce (11% Informal Workforce)
Total Workforce 4,110,009
Permanent Employees 2,523,854
Non Standard Workforce 957,324
Unemployed Workers 628,831
Year on Year
Wage Inflation Rate
Inflation Rate (Dec 17) 6.4%
▪ Recent protests over austerity measures and
various tax increases. According to the budget,
wages are expected to grow by 3% in 2018 but
the public sector wage bill is expected to be
lowered.
▪ Income from tourism in Tunisia has reportedly
fallen by 40% since 2015.
▪ High youth unemployment ~30% of young
higher education graduates are unemployed.
21%
57%
22%
Highly Skilled
Medium Skilled
Non Skilled
Notice Period By Tenure
Tenure Tunisia Regional Ave
1 Year 4.3 weeks 4.6 weeks
5 Years 4.3 weeks 7.0 weeks
Severance Pay By Tenure
Tenure Tunisia Regional Ave
1 Year 4.3 weeks 2.5 weeks
5 Years 21.4 weeks 8.5 weeks
25 25
1736
2513
0
50
100
OvertimePremiums (%)
Employer Taxes(%)
Profit Taxes (%)
Tunisia EMEA United States
17.0%15.7% 15.2% 15.3% 15.5% 15.3%
0%
20%
2013 2014 2015 2016 2017 2018
Unemployment Rate at Q1
$0.57 $0.68 $0.72
$0
$10
$20
2014 2016 2018
Minimum Wage (USD 2018)
▪ Non Agricultural workers.
Redundancy and Dismissal Other Cost Considerations
Nominal Wage Inflation and InflationChanges to Minimum Wage (2018 USD rate)Changes to Unemployment Rates
Economic Climate
Labor Market
Source: http://www.doingbusiness.org/

73ManpowerGroup Solutions QMR Q1, 2018
Turkey Agriculture 20% Services 53% Industry 28%
Workforce (13% Informal Workforce)
Total Workforce 32,184,000
Permanent Employees 19,602,084
Non Standard Workforce 9,266,964
Unemployed Workers 3,314,952
Year on Year
Wage Inflation Rate N/A
Inflation Rate (Jan 18) 10.4%
▪ Turkey’s Central Bank has forecast inflation at
7.9% during 2018.
▪ Despite a 14% increase in the minimum wage, it
is still below the labor unions’ demands.
▪ Turkey’s Prime Minister has declared a
crackdown on child labor. In 2016, there were
over 700,000 children working in Turkey.
20%
65%
15%
Highly Skilled
Medium Skilled
Non Skilled
Notice Period By Tenure
Tenure Turkey Regional Ave
1 Year 4.0 weeks 4.6 weeks
5 Years 8.0 weeks 7.0 weeks
Severance Pay By Tenure
Tenure Turkey Regional Ave
1 Year 4.3 weeks 2.5 weeks
5 Years 21.7 weeks 8.5 weeks
50
20
18.236
2513
0
50
100
OvertimePremiums (%)
Employer Taxes(%)
Profit Taxes (%)
Turkey EMEA United States
9.3% 9.7% 10.4% 10.5%11.8%
10.3%
0%
20%
2013 2014 2015 2016 2017 2018
Unemployment Rate at Q1
$1.56$2.41 $2.97
$0
$10
$20
2014 2016 2018
Minimum Wage (USD 2018)
Redundancy and Dismissal Other Cost Considerations
Nominal Wage Inflation and InflationChanges to Minimum Wage (2018 USD rate)Changes to Unemployment Rates
Economic Climate
Labor Market
Source: http://www.doingbusiness.org/

74ManpowerGroup Solutions QMR Q1, 2018
Ukraine Agriculture 16% Services 60% Industry 25%
Workforce (7% Informal Workforce)
Total Workforce 20,510,114
Permanent Employees 15,433,574
Non Standard Workforce 3,251,140
Unemployed Workers 1,825,400
Year on Year
Wage Inflation Rate (Dec 17) 35.6%
Inflation Rate (Dec 17) 13.7%
▪ Cabinet ministers of Ukraine have a policy of
increasing the average salary from UAH 8,777
($328 per month) to UAHJ 10,000 ($374 per
month) by the end of 2018.
▪ According to Intellinews, 2018 growth is forecast
to be at 3.1% compared with growth of just over
2% over the past two years. Growth is being
driven by the construction industry.
38%
44%
18%
Highly Skilled
Medium Skilled
Non Skilled
Notice Period By Tenure
Tenure Ukraine Regional Ave
1 Year 8.7 weeks 4.6 weeks
5 Years 8.7 weeks 7.0 weeks
Severance Pay By Tenure
Tenure Ukraine Regional Ave
1 Year 4.3 weeks 2.5 weeks
5 Years 4.3 weeks 8.5 weeks
100
2511.936
2513
0
50
100
OvertimePremiums (%)
Employer Taxes(%)
Profit Taxes (%)
Ukraine EMEA United States
7.8% 7.6%8.9% 9.4% 9.2% 8.9%
0%
20%
2013 2014 2015 2016 2017 2018
Unemployment Rate at Q1
$0.27 $0.32 $0.83
$0
$10
$20
2014 2016 2018
Minimum Wage (USD 2018)
Redundancy and Dismissal Other Cost Considerations
Nominal Wage Inflation and InflationChanges to Minimum Wage (2018 USD rate)Changes to Unemployment Rates
Economic Climate
Labor Market
Source: http://www.doingbusiness.org/

75ManpowerGroup Solutions QMR Q1, 2018
United Arab Emirates Agriculture 4% Services 75% Industry 21%
Workforce (26% Informal Workforce)
Total Workforce 6,447,171
Permanent Employees 6,009,911
Non Standard Workforce 192,268
Unemployed Workers 244,992
37%
54%
10%
Highly Skilled
Medium Skilled
Non Skilled
Notice Period By Tenure
Tenure UAE Regional Ave
1 Year 4.3 weeks 4.6 weeks
5 Years 4.3 weeks 7.0 weeks
Severance Pay By Tenure
Tenure UAE Regional Ave
1 Year 0 weeks 2.5 weeks
5 Years 0 weeks 8.5 weeks
25 14 036
2513
0
50
100
OvertimePremiums (%)
Employer Taxes(%)
Profit Taxes (%)
United Arab Emirates EMEA United States
4.6% 4.2% 4.2% 3.6% 3.6% 3.8%
0%
20%
2013 2014 2015 2016 2017 2018
Unemployment Rate at Q1
$2.00 $2.14
$0
$10
$20
2014 2016 2018
Minimum Wage (USD 2018)
Year on Year
Wage Inflation Rate (Q3) 4.3%
Inflation Rate (Dec 17) 2.7%
▪ Nominal wages in the UAE are expected to rise
by 4.1% this year but inflation is forecast to be at
4.6%.
▪ The UAE introduced VAT at a rate of 5% in
January.
▪ UAE doesn’t have a minimum wage – this
is the minimum wage set by the Philippines
Government for domestic workers in the
UAE.
Redundancy and Dismissal Other Cost Considerations
Nominal Wage Inflation and InflationChanges to Minimum Wage (2018 USD rate)Changes to Unemployment Rates
Economic Climate
Labor Market
Source: http://www.doingbusiness.org/

76ManpowerGroup Solutions QMR Q1, 2018
United Kingdom Agriculture 1% Services 81% Industry 18%
Workforce (7% Informal Workforce)
Total Workforce 33,493,800
Permanent Employees 27,117,317
Non Standard Workforce 4,936,249
Unemployed Workers 1,440,233
Year on Year
Wage Inflation Rate (Dec 17) 2.5%
Inflation Rate (Dec 17) 3.0%
▪ Minimum wage is due to increase in April. It is
estimated that there are 2 million minimum wage
workers in the UK.
▪ Recent job losses have been announced across
a number of industries including construction,
banking, utilities and retail. Job losses are
expected to increase in the lead up to BREXIT.
48%
43%
9%
Highly Skilled
Medium Skilled
Non Skilled
Notice Period By Tenure
Tenure United Kingdom Regional Ave
1 Year 1.0 weeks 4.6 weeks
5 Years 5.0 weeks 7.0 weeks
Severance Pay By Tenure
Tenure United Kingdom Regional Ave
1 Year 0 weeks 2.5 weeks
5 Years 3.5 weeks 8.5 weeks
0 11
18.136
2513
0
50
100
OvertimePremiums (%)
Employer Taxes(%)
Profit Taxes (%)
United Kingdom EMEA United States
7.7% 7.1%5.8% 5.1% 4.8% 4.3%
0%
20%
2013 2014 2015 2016 2017 2018
Unemployment Rate at Q1
$8.87$10.12 $10.54
$0
$10
$20
2014 2016 2018
Minimum Wage (USD 2018)
▪ Since April 2016, the National Living Wage
for workers over the age of 25 yrs. Different
rates apply to 1st yr apprentices and
workers < 25 yrs.
Redundancy and Dismissal Other Cost Considerations
Nominal Wage Inflation and InflationChanges to Minimum Wage (2018 USD rate)Changes to Unemployment Rates
Economic Climate
Labor Market
Source: http://www.doingbusiness.org/

77ManpowerGroup Solutions QMR Q1, 2018
Detailed Country Analysis:
Asia-Pacific

78ManpowerGroup Solutions QMR Q1, 2018
Australia Agriculture 3% Services 76% Industry 21%
Workforce (6% Informal Workforce)
Total Workforce 13,177,300
Permanent Employees 10,335,615
Non Standard Workforce 2,116,933
Unemployed Workers 724,752
Year on Year
Wage Inflation Rate (Aug 17) 1.5%
Inflation Rate (Dec 17) 1.9%
▪ Despite the number of jobs in Australia growing
by 16,000 in January, full time jobs fell by
49,800 offset by an increase in part-time
employment of 65,900.
45%
47%
8%
Highly Skilled
Medium Skilled
Non Skilled
Notice Period By Tenure
Tenure Australia Regional Ave
1 Year 1.0 weeks 2.9 weeks
5 Years 4.0 weeks 3.8 weeks
Severance Pay By Tenure
Tenure Australia Regional Ave
1 Year 4.0 weeks 3.4 weeks
5 Years 10.0 weeks 12.5 weeks
50
21
26
38 16 18
0
50
100
OvertimePremiums (%)
Employer Taxes(%)
Profit Taxes (%)
Australia APAC United States
5.4% 5.8% 6.4% 5.8% 5.8% 5.5%
0%
20%
2013 2014 2015 2016 2017 2018
Unemployment Rate at Q1
$12.89 $13.61 $14.40
$0
$10
$20
2014 2016 2018
Minimum Wage (USD 2018)
▪ Casual employees who are working for
minimum wage must also receive at least
a 25% casual loading.
Redundancy and Dismissal Other Cost Considerations
Nominal Wage Inflation and InflationChanges to Minimum Wage (2018 USD rate)Changes to Unemployment Rates
Economic Climate
Labor Market
Source: http://www.doingbusiness.org/

79ManpowerGroup Solutions QMR Q1, 2018
China Agriculture 27% Services 49% Industry 24%
Workforce (18% Informal Workforce)
Total Workforce 785,399,319
Permanent Employees 480,787,691
Non Standard Workforce 273,981,055
Unemployed Workers 30,630,573
Year on Year
Wage Inflation Rate (Dec 16) 6.8%
Inflation Rate (Jan 18) 1.5%
▪ The National Development and Reform
Commission has said that China needs to boost
its job creation and promote entrepreneurship.
▪ The NDRC expects that 8.2 million college
graduates will enter the job market this year.
▪ In 2017, 13.51 million new jobs were reported to
be created in urban areas.
12%
80%
8%
Highly Skilled
Medium Skilled
Non Skilled
Notice Period By Tenure
Tenure China Regional Ave
1 Year 4.3 weeks 2.9 weeks
5 Years 4.3 weeks 3.8 weeks
Severance Pay By Tenure
Tenure Regional Ave
1 Year 4.3 weeks 3.4 weeks
5 Years 21.7 weeks 12.5 weeks
50 4811.138 16 18
0
50
100
OvertimePremiums (%)
Employer Taxes(%)
Profit Taxes (%)
China APAC United States
4.1% 4.0% 4.1% 4.1% 4.0% 3.9%
0%
20%
2013 2014 2015 2016 2017 2018
Unemployment Rate at Q1
$2.68 $2.97 $3.33
$0
$10
$20
2014 2016 2018
Minimum Wage (USD 2018)
▪ Minimum wages are dependent on location
and vary significantly across China. These
rates are for Beijing.
Redundancy and Dismissal Other Cost Considerations
Nominal Wage Inflation and InflationChanges to Minimum Wage (2018 USD rate)Changes to Unemployment Rates
Economic Climate
Labor Market
Source: http://www.doingbusiness.org/

80ManpowerGroup Solutions QMR Q1, 2018
Hong Kong Agriculture 0% Services 85% Industry 15%
Workforce (6% Informal Workforce)
Total Workforce 3,960,400
Permanent Employees 3,499,449
Non Standard Workforce 346,099
Unemployed Workers 114,852
Year on Year
Wage Inflation Rate (Oct 17) 3.0%
Inflation Rate (Jan 18) 1.7%
39%
41%
20%
Highly Skilled
Medium Skilled
Non Skilled
Notice Period By Tenure
Tenure Hong Kong Regional Ave
1 Year 4.3 weeks 2.9 weeks
5 Years 4.3 weeks 3.8 weeks
Severance Pay By Tenure
Tenure Hong Kong Regional Ave
1 Year 0 weeks 3.4 weeks
5 Years 1.4 weeks 12.5 weeks
0 5
17.538 16 18
0
50
100
OvertimePremiums (%)
Employer Taxes(%)
Profit Taxes (%)
Hong Kong APAC United States
3.3% 3.2% 3.3% 3.3% 3.3% 2.9%
0%
20%
2013 2014 2015 2016 2017 2018
Unemployment Rate at Q1
$3.83 $4.15 $4.41
$0
$10
$20
2014 2016 2018
Minimum Wage (USD 2018)
Redundancy and Dismissal Other Cost Considerations
Nominal Wage Inflation and InflationChanges to Minimum Wage (2018 USD rate)Changes to Unemployment Rates
Economic Climate
Labor Market
Source: http://www.doingbusiness.org/
▪ The unemployment rate in Hong Kong is the
lowest it has been in almost 20 years.
▪ The Hong Kong government is conducting a
study into the long hours resulting in death at
work. Hong Kong Census data shows that
11.1% of employees work 60 or more hours a
week. The government is working on sector
specific guidelines for the working week.

81ManpowerGroup Solutions QMR Q1, 2018
India Agriculture 44% Services 31% Industry 25%
Workforce (41% Informal Workforce)
Total Workforce 520,199,005
Permanent Employees 105,810,558
Non Standard Workforce 395,661,282
Unemployed Workers 18,727,164
Year on Year
Wage Inflation Rate N/A
Inflation Rate (Dec 17) 5.2%
▪ According to the Reserve Bank of India,
economic growth is projected to be 6.6% in
2018 and 7.2% in 2019
▪ The Indian workforce is expected to grow by
approximately 12 million per year for the next 15
years.
15%
59%
26%
Highly Skilled
Medium Skilled
Non Skilled
Notice Period By Tenure
Tenure India Regional Ave
1 Year 4.3 weeks 2.9 weeks
5 Years 4.3 weeks 3.8 weeks
Severance Pay By Tenure
Tenure India Regional Ave
1 Year 2.1 weeks 3.4 weeks
5 Years 10.7 weeks 12.5 weeks
100
20
23.538 16 18
0
50
100
OvertimePremiums (%)
Employer Taxes(%)
Profit Taxes (%)
India APAC United States
3.8%4.7% 4.7%
3.6% 3.6% 3.6%
0%
20%
2013 2014 2015 2016 2017 2018
Unemployment Rate at Q1
$0.70 $0.87 $1.19
$0
$10
$20
2014 2016 2018
Minimum Wage (USD 2018)
▪ Minimum wages in India vary depending
on location, occupation and skill. This
minimum wage relates to a semi-skilled
worker in Delhi.
Redundancy and Dismissal Other Cost Considerations
Nominal Wage Inflation and InflationChanges to Minimum Wage (2018 USD rate)Changes to Unemployment Rates
Economic Climate
Labor Market
Source: http://www.doingbusiness.org/

82ManpowerGroup Solutions QMR Q1, 2018
Japan Agriculture 4% Services 69% Industry 27%
Workforce (7% Informal Workforce)
Total Workforce 66,427,560
Permanent Employees 57,787,992
Non Standard Workforce 6,779,597
Unemployed Workers 1,859,972
Year on Year
Real Wage Inflation Rate (Dec 17) -0.2%
Inflation Rate (Dec 17) 1.0%
▪ The economy of Japan has experienced eight
consecutive quarters of growth which is the
longest since 1990.
▪ Prime Minister Abe has been promoting wage
increases of 3% in an attempt to increase
domestic consumption and move inflation
towards the 2% target.
▪ The jobs to applicant ratio is at ~1.6 jobs for
each applicant.
25%
68%
7%
Highly Skilled
Medium Skilled
Non Skilled
Notice Period By Tenure
Tenure Japan Regional Ave
1 Year 4.3weeks 2.9 weeks
5 Years 4.3 weeks 3.8 weeks
Severance Pay By Tenure
Tenure Japan Regional Ave
1 Year 0 weeks 3.4 weeks
5 Years 0 weeks 12.5 weeks
25 19
24.638 16 18
0
50
100
OvertimePremiums (%)
Employer Taxes(%)
Profit Taxes (%)
Japan APAC United States
4.2% 3.7% 3.4% 3.3% 3.1% 2.8%
0%
20%
2013 2014 2015 2016 2017 2018
Unemployment Rate at Q1
$7.17 $7.49 $7.72
$0
$10
$20
2014 2016 2018
Minimum Wage (USD 2018)
▪ Different regions have different minimum
wages. This is a mid-level minimum wage.
Redundancy and Dismissal Other Cost Considerations
Nominal Wage Inflation and InflationChanges to Minimum Wage (2018 USD rate)Changes to Unemployment Rates
Economic Climate
Labor Market
Source: http://www.doingbusiness.org/

83ManpowerGroup Solutions QMR Q1, 2018
Macau Agriculture 0% Services 82% Industry 18%
Workforce (18% Informal Workforce)
Total Workforce 382,381
Permanent Employees 349,233
Non Standard Workforce 25,883
Unemployed Workers 7,265
Year on Year
Wage Inflation Rate (Dec 17) 3.3% Local residents
Inflation Rate (Dec 17) 2.0%
▪ Wages in construction were up by 5.9% year on
year
12%
77%
11%
Highly Skilled
Medium Skilled
Non Skilled
Notice Period By Tenure
Tenure Macau Regional Ave
1 Year 2.1 weeks 2.9 weeks
5 Years 3.0 weeks 3.8 weeks
Severance Pay By Tenure
Tenure Macau Regional Ave
1 Year 1.0 weeks 3.4 weeks
5 Years 9.3 weeks 12.5 weeks
0 41238 16 18
0
50
100
OvertimePremiums (%)
Employer Taxes(%)
Profit Taxes (%)
Macau APAC United States
1.9% 1.9% 1.7% 1.9% 1.9% 1.9%
0%
20%
2013 2014 2015 2016 2017 2018
Unemployment Rate at Q1
$3.22 $3.72 $3.72
$0
$10
$20
2014 2016 2018
Minimum Wage (USD 2018)
▪ Current discussions to increase the
minimum wage.
Redundancy and Dismissal Other Cost Considerations
Nominal Wage Inflation and InflationChanges to Minimum Wage (2018 USD rate)Changes to Unemployment Rates
Economic Climate
Labor Market
Source: http://www.doingbusiness.org/

84ManpowerGroup Solutions QMR Q1, 2018
Malaysia Agriculture 12% Services 61% Industry 27%
Workforce (10% Informal Workforce)
Total Workforce 15,432,885
Permanent Employees 11,103,158
Non Standard Workforce 3,820,442
Unemployed Workers 509,285
Year on Year
Wage Inflation Rate (Dec 17) Private sector 6.3%
Inflation Rate (Dec 17) 3.7%
▪ Economic growth in Malaysia was 5.9% in 2017.
▪ The manufacturing sector has seen the biggest
increases in wages with a rise of more than 9%
since April.
▪ The Malaysian Employers Federation expects
that wage increases will be lower than 2017 this
year as employers now need to pay a levy for
foreign workers and some increases to social
insurance.
25%
61%
14%
Highly Skilled
Medium Skilled
Non Skilled
Notice Period By Tenure
Tenure Malaysia Regional Ave
1 Year 4.0 weeks 2.9 weeks
5 Years 8.0 weeks 3.8 weeks
Severance Pay By Tenure
Tenure Malaysia Regional Ave
1 Year 1.7 weeks 3.4 weeks
5 Years 16.7 weeks 12.5 weeks
50
16
21.838 16 18
0
50
100
OvertimePremiums (%)
Employer Taxes(%)
Profit Taxes (%)
Malaysia APAC United States
3.0% 3.4% 2.7% 3.2% 3.4% 3.3%
0%
20%
2013 2014 2015 2016 2017 2018
Unemployment Rate at Q1
$1.11 $1.36 $1.48
$0
$10
$20
2014 2016 2018
Minimum Wage (USD 2018)
▪ Minimum wage depends on location. This
wage refers to the Peninsula. A new
minimum wage in 2018 is expected to
minimise disparity between the areas.
Redundancy and Dismissal Other Cost Considerations
Nominal Wage Inflation and InflationChanges to Minimum Wage (2018 USD rate)Changes to Unemployment Rates
Economic Climate
Labor Market
Source: http://www.doingbusiness.org/

85ManpowerGroup Solutions QMR Q1, 2018
New Zealand Agriculture 6% Services 73% Industry 21%
Workforce (8% Informal Workforce)
Total Workforce 2,716,000
Permanent Employees 2,137,275
Non Standard Workforce 456,505
Unemployed Workers 122,220
Year on Year
Wage Inflation Rate (Jan 18) 3.1%
Inflation Rate (Dec 17) 1.6%
▪ Minimum wage which is currently NZ $15.75 is set
to increase to NZ$16.50 in April. Average hourly
wage in New Zealand is currently NZ$30.74 .
▪ GDP growth is 0.6% to September 2017.
▪ The Ministry of Business, Innovation and
Employment expects New Zealand employment to
grow by 2% or 153,00 over the next 3 years.
Skilled and professional jobs are expected to
account for nearly 95,000 of this increase with
business services adding 33,000 jobs.
45%
49%
6%
Highly Skilled
Medium Skilled
Non Skilled
Notice Period By Tenure
Tenure New Zealand Regional Ave
1 Year 0 weeks 2.9 weeks
5 Years 0 weeks 3.8 weeks
Severance Pay By Tenure
Tenure New Zealand Regional Ave
1 Year 0 weeks 3.4 weeks
5 Years 0 weeks 12.5 weeks
0 3
29.9
38 16 18
0
50
100
OvertimePremiums (%)
Employer Taxes(%)
Profit Taxes (%)
New Zealand APAC United States
6.9%6.0% 5.7% 5.3% 5.2% 4.5%
0%
20%
2013 2014 2015 2016 2017 2018
Unemployment Rate at Q1
$10.09 $10.82 $11.56
$0
$10
$20
2014 2016 2018
Minimum Wage (USD 2018)
Redundancy and Dismissal Other Cost Considerations
Nominal Wage Inflation and InflationChanges to Minimum Wage (2018 USD rate)Changes to Unemployment Rates
Economic Climate
Labor Market
Source: http://www.doingbusiness.org/
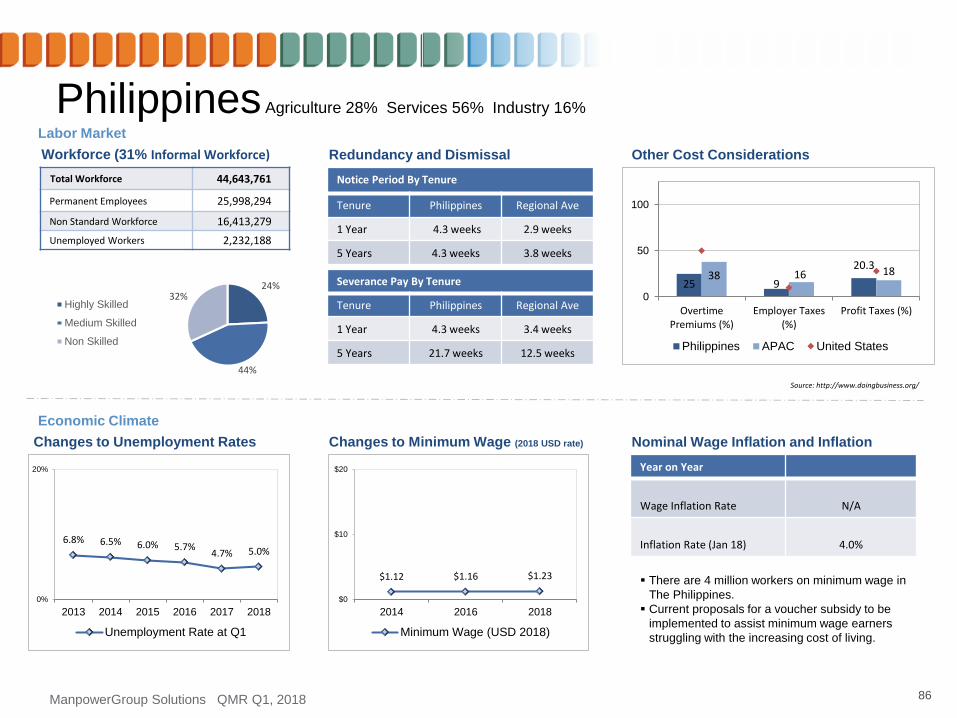
86ManpowerGroup Solutions QMR Q1, 2018
Philippines Agriculture 28% Services 56% Industry 16%
Workforce (31% Informal Workforce)
Total Workforce 44,643,761
Permanent Employees 25,998,294
Non Standard Workforce 16,413,279
Unemployed Workers 2,232,188
Year on Year
Wage Inflation Rate N/A
Inflation Rate (Jan 18) 4.0%
▪ There are 4 million workers on minimum wage in
The Philippines.
▪ Current proposals for a voucher subsidy to be
implemented to assist minimum wage earners
struggling with the increasing cost of living.
24%
44%
32%Highly Skilled
Medium Skilled
Non Skilled
Notice Period By Tenure
Tenure Philippines Regional Ave
1 Year 4.3 weeks 2.9 weeks
5 Years 4.3 weeks 3.8 weeks
Severance Pay By Tenure
Tenure Philippines Regional Ave
1 Year 4.3 weeks 3.4 weeks
5 Years 21.7 weeks 12.5 weeks
25 9
20.338 16 18
0
50
100
OvertimePremiums (%)
Employer Taxes(%)
Profit Taxes (%)
Philippines APAC United States
6.8% 6.5% 6.0% 5.7%4.7% 5.0%
0%
20%
2013 2014 2015 2016 2017 2018
Unemployment Rate at Q1
$1.12 $1.16 $1.23
$0
$10
$20
2014 2016 2018
Minimum Wage (USD 2018)
Redundancy and Dismissal Other Cost Considerations
Nominal Wage Inflation and InflationChanges to Minimum Wage (2018 USD rate)Changes to Unemployment Rates
Economic Climate
Labor Market
Source: http://www.doingbusiness.org/

87ManpowerGroup Solutions QMR Q1, 2018
Singapore Agriculture 0% Services 83% Industry 17%
Workforce (6% Informal Workforce)
Total Workforce 3,310,882
Permanent Employees 2,784,323
Non Standard Workforce 457,031
Unemployed Workers 69,529
Year on Year
Wage Inflation Rate (Oct 17) 3.2%
Inflation Rate (Dec 18) 0.4%
▪ In his most recent budget, the finance minister
has announced an extension of the Wage Credit
Scheme until 2020. Under this scheme, the
government pays a percentage of the pay rise
for eligible low earning Singaporeans.
56%36%
8%
Highly Skilled
Medium Skilled
Non Skilled
Notice Period By Tenure
Tenure Singapore Regional Ave
1 Year 1.0 weeks 2.9 weeks
5 Years 4.0 weeks 3.8 weeks
Severance Pay By Tenure
Tenure Singapore Regional Ave
1 Year 0 weeks 3.4 weeks
5 Years 0 weeks 12.5 weeks
50
18 1.538 16 18
0
50
100
OvertimePremiums (%)
Employer Taxes(%)
Profit Taxes (%)
Singapore APAC United States
1.8% 1.8% 1.9% 1.9% 2.2% 2.1%
0%
20%
2013 2014 2015 2016 2017 2018
Unemployment Rate at Q1
$3.11$4.39 $4.39
$0
$10
$20
2014 2016 2018
Minimum Wage (USD 2018)
▪ Singapore only has a minimum wage for
workers in the cleaning and security
sectors. This is the security sector
minimum wage.
Redundancy and Dismissal Other Cost Considerations
Nominal Wage Inflation and InflationChanges to Minimum Wage (2018 USD rate)Changes to Unemployment Rates
Economic Climate
Labor Market
Source: http://www.doingbusiness.org/

88ManpowerGroup Solutions QMR Q1, 2018
South Korea Agriculture 5% Services 70% Industry 25%
Workforce (11% Informal Workforce)
Total Workforce 27,876,549
Permanent Employees 18,972,333
Non Standard Workforce 7,900,660
Unemployed Workers 1,003,556
Year on Year
Wage Inflation Rate N/A
Inflation Rate (Jan 18) 1.0%
▪ A number of laws are being introduced in South
Korea. Maximum working hours will be
decreased to 52 hours a week from 68.
▪ The most recent minimum wage rise of 16% has
been met with complaints by business groups.
President Moon wants to raise the minimum
wage by another third before 2020.
▪ It is estimated that 14% of South Koreans were
paid less than minimum wage in 2016.
21%
66%
13%
Highly Skilled
Medium Skilled
Non Skilled
Notice Period By Tenure
Tenure South Korea Regional Ave
1 Year 4.3 weeks 2.9 weeks
5 Years 4.3 weeks 3.8 weeks
Severance Pay By Tenure
Tenure South Korea Regional Ave
1 Year 4.3 weeks 3.4 weeks
5 Years 21.7 weeks 12.5 weeks
50
14
18.238 16 18
0
50
100
OvertimePremiums (%)
Employer Taxes(%)
Profit Taxes (%)
South Korea APAC United States
2.9% 3.0% 3.5% 3.4% 3.4% 3.6%
0%
20%
2013 2014 2015 2016 2017 2018
Unemployment Rate at Q1
$4.54$5.63
$7.03
$0
$10
$20
2014 2016 2018
Minimum Wage (USD 2018)
Redundancy and Dismissal Other Cost Considerations
Nominal Wage Inflation and InflationChanges to Minimum Wage (2018 USD rate)Changes to Unemployment Rates
Economic Climate
Labor Market
Source: http://www.doingbusiness.org/

89ManpowerGroup Solutions QMR Q1, 2018
Taiwan Agriculture 5% Services 59% Industry 36%
Workforce (18% Informal Workforce)
Total Workforce 11,831,000
Permanent Employees 9,023,456
Non Standard Workforce 2,369,797
Unemployed Workers 437,747
Year on Year
Wage Inflation Rate (Dec 18) 2.8%
Inflation Rate (Jan 18) 0.9%
▪ Changes to overtime and how it is paid will take
affect from the March 1st.
▪ Foxconn has announced that it is automating
10,000 Taiwanese jobs in 2018. Conversely,
there are currently 6,000 open jobs in
developing Artificial Intelligence.
34%
41%
25%
Highly Skilled
Medium Skilled
Non Skilled
Notice Period By Tenure
Tenure Taiwan Regional Ave
1 Year 2.9 weeks 2.9 weeks
5 Years 4.3 weeks 3.8 weeks
Severance Pay By Tenure
Tenure Taiwan Regional Ave
1 Year 2.2 weeks 3.4 weeks
5 Years 10.8 weeks 12.5 weeks
33 1812.538 16 18
0
50
100
OvertimePremiums (%)
Employer Taxes(%)
Profit Taxes (%)
Taiwan APAC United States
4.2% 4.1% 3.8% 3.9% 3.8% 3.7%
0%
20%
2013 2014 2015 2016 2017 2018
Unemployment Rate at Q1
$3.93 $4.11 $4.79
$0
$10
$20
2014 2016 2018
Minimum Wage (USD 2018)
Redundancy and Dismissal Other Cost Considerations
Nominal Wage Inflation and InflationChanges to Minimum Wage (2018 USD rate)Changes to Unemployment Rates
Economic Climate
Labor Market
Source: http://www.doingbusiness.org/

90ManpowerGroup Solutions QMR Q1, 2018
Thailand Agriculture 34% Services 43% Industry 23%
Workforce (42% Informal Workforce)
Total Workforce 39,134,876
Permanent Employees 18,248,201
Non Standard Workforce 20,495,326
Unemployed Workers 391,349
Year on Year
Wage Inflation Rate N/A
Inflation Rate (Jan 18) 0.7%
▪ Minimum wage is due to increase in April.
▪ Economic growth in 2017 was 3.9% and the
central bank has predicted that it will be similar
in 2018.
▪ The Thai Prime Minister is working towards
“Thailand 4.0” which is to provide a high
technology, innovation based industry. The aim
is to achieve high income status by 2036.
14%
76%
10%
Highly Skilled
Medium Skilled
Non Skilled
Notice Period By Tenure
Tenure Thailand Regional Ave
1 Year 4.3 weeks 2.9 weeks
5 Years 4.3 weeks 3.8 weeks
Severance Pay By Tenure
Tenure Thailand Regional Ave
1 Year 15.0 weeks 3.4 weeks
5 Years 30.0 weeks 12.5 weeks
50
5
22.638 16 18
0
50
100
OvertimePremiums (%)
Employer Taxes(%)
Profit Taxes (%)
Thailand APAC United States
0.6% 0.7% 1.1% 0.7% 0.8% 1.0%
0%
20%
2013 2014 2015 2016 2017 2018
Unemployment Rate at Q1
$1.20 $1.20 $1.24
$0
$10
$20
2014 2016 2018
Minimum Wage (USD 2018)
▪ Depends on location.
Redundancy and Dismissal Other Cost Considerations
Nominal Wage Inflation and InflationChanges to Minimum Wage (2018 USD rate)Changes to Unemployment Rates
Economic Climate
Labor Market
Source: http://www.doingbusiness.org/

91ManpowerGroup Solutions QMR Q1, 2018
Vietnam Agriculture 42% Services 35% Industry 23%
Workforce (43% Informal Workforce)
Total Workforce 56,358,750
Permanent Employees 22,861,206
Non Standard Workforce 32,359,098
Unemployed Workers 1,138,447
Year on Year
Wage Inflation Rate N/A
Inflation Rate (Jan 18) 3.15%
▪ Ho Chi Minh City has recently announced that it
will raise public sector wages.
▪ A recent study by Korn Ferry Human Resources
Company anticipates that wage growth in
Vietnam will be between 4% and 5% during
2018.
11%
49%
40%Highly Skilled
Medium Skilled
Non Skilled
Notice Period By Tenure
Tenure Vietnam Regional Ave
1 Year 0 weeks 2.9 weeks
5 Years 0 weeks 3.8 weeks
Severance Pay By Tenure
Tenure Vietnam Regional Ave
1 Year 8.7 weeks 3.4 weeks
5 Years 21.7 weeks 12.5 weeks
50
2513.138 16 18
0
50
100
OvertimePremiums (%)
Employer Taxes(%)
Profit Taxes (%)
Vietnam APAC United States
2.1% 2.2% 2.1% 2.3% 2.1% 2.0%
0%
20%
2013 2014 2015 2016 2017 2018
Unemployment Rate at Q1
$0.57 $0.79 $1.01
$0
$10
$20
2014 2016 2018
Minimum Wage (USD 2018)
▪ Varies by region, this relates to region 1
which includes Ho Chin Minh City.
Redundancy and Dismissal Other Cost Considerations
Nominal Wage Inflation and InflationChanges to Minimum Wage (2018 USD rate)Changes to Unemployment Rates
Economic Climate
Labor Market
Source: http://www.doingbusiness.org/

92ManpowerGroup Solutions QMR Q1, 2018
Available Thought Leadership
Quarterly Market Reporthttps://insights.manpowergroupsolutions.com/thought-leadership/quarterly-
market-report/
Total Workforce Indexhttp://www.manpowergroupsolutions.com/twi
Global Insights Portalhttp://insights.manpowergroupsolutions.com/
Follow @WorkforceInsght
Email [email protected]


![KP THERAPISTS’ CBA OUTLINE and TENTATIVE …...KAISER PERMANENTE MEDICM~ CARE PROGRAM AND ENew Bargaining Group] 2013 CONTRACT NEGOTIATIONS INTENTLANGUAGE Fixed Workday (Consensus](https://img.pdfslide.net/doc/110x75/61173fbb455796699c6e82f7/kp-therapistsa-cba-outline-and-tentative-kaiser-permanente-medicm-care-program.jpg)