Embed Size (px)
Citation preview

GLOBALDATA CONSULTING
THE UK SUBSCRIPTION BOX BOOM REPORT FEBRUARY 2019
PREPARED FOR ROYAL MAIL

PAGE
THE UK SUBSCRIPTION BOX BOOM REPORT FEBRUARY 2019
© 2019 GlobalData Retail. All rights reserved. Whether in printed or electronic form: no part of this publication may be copied, stored in a retrieval system, or transmitted without the prior written permission of GlobalData Retail. All abstracting of the data for republication must have prior permission. In order to apply, an application form and draft copies of the proposed document must be submitted, together with full details of circulation and audience. All information will be treated in strictest confidence. Please note, consent is not given automatically and in certain instances a charge may be applicable. Data and reports are sold on the condition that they will not be circulated outside the staff who work at the address to which they are sent. Printed reports are subject to the Copyright, Designs and Patents Act 1988 (CDPA). Please note, the Fair Dealing provisions of the CDPA do not allow copying of any part of printed publications for commercial usage of any kind. While information is compiled with due care, GlobalData Retail will not be liable for the consequences of anyone acting or refraining from acting in reliance on any information.

PAGE
Summary and conclusions In this section, we draw together the findings from each of the sections of the research

PAGEPAGE
DECLINING SHARE
THE MARKET
27.4% of UK consumers are currently signed up to a subscription box service, either for themselves or on behalf of somebody else. Such schemes have gained strong traction among younger demographics, with over half of 25-34s (52.1%) signed up to at least one, compared to just 11.7% of 55-64s and 7.6% of those over 65s. There is also a slight male skew, with 30.6% of males signed up, compared to 24.3% of females, reflecting the strong traction that male-focussed boxes, such as shaving and beer subscriptions have gained. Inevitably, given the greater penetration among younger shoppers, London is where subscription boxes are most popular, with 50.7% being signed up. In addition to the younger, more affluent population of the city, London has also been a popular go-to destination for start-up subscription companies due to its size and population density.
Driving greater brand loyalty is a key motivation for launching a subscription service – cited by 44.8% of those operating such a service. Other important reasons for starting a subscription box service include the desire for greater control, in particular control of distribution (34.5%), control of marketing and promotion (24.1%) and lower start-up costs (24.1%). Perhaps spurred on by growing competition (with 75.9% agreeing that the subscription box market is becoming highly competitive), 58.6% of subscription box businesses intend to invest in new or existing subscription services in the next 12 months and 72.4% intend to add new products to their service. Positively, in terms of the likely longevity of this type of business model, 51.7% agree that subscription is set to be a major focus of their company in the future, though 44.8% admit to concerns that larger retailers/brands will invest more strongly in this segment of the market.
-2.3%
Spurred on by the growth of mobile devices, subscription commerce has moved on from a past focus on magazines and newspapers, to embrace everything from recipe food kits, to shaving gear and self-care. The US market has seen tremendous growth over the past few years, moving from a very niche industry, to one which has made mainstream retailers sit up and take notice. In the UK, the subscription market is still in relative infancy, but with major global brands, such as HelloFresh, Harry’s, Birchbox and Dollar Shave Club increasing their efforts at expansion, the market is now in a phase of rapid growth. UK consumers have embraced subscription brands, with homegrown startups like Cornerstone greatly exceeding their own expectations for their subscriber base, while established subscription brands such as Graze, have also found favour overseas. GlobalData forecasts that by 2022, the UK market will have almost doubled in size to £1bn, with beauty boxes and male grooming enjoying a particularly significant surge in popularity.
SUMMARY
£1 billion
Forecast value of the subscription box market in 2022, up 72% vs. 2017
27.4%
Proportion of shoppers currently signed up to a subscription service
58.6%
Of subscription box businesses in our survey intend to invest in new or existing subscription services in the next year
DECLINING SHARE CONSUMER
DECLINING SHARE RETAILERS

PAGEPAGE
KEY FIGURES
DECLINING SHARE
THE 2017 MARKET IN FIGURES
DECLINING SHARE
MARKET GROWTH DECLINING
SHARE THE FORECAST 2022 MARKET IN FIGURES
Estimated spend on subscription services in 2017
£583.3 milllion
Forecast value of the subscription market in 2022
£1,003.4 milllion72.0 %
Forecast growth in the subscription market (2017-2022)
Deliveries made
Growth in spending on male grooming subscriptions over 2017-22
Growth in spending on other health & beauty subscriptions over 2017-22
65.3 milllion
328.6 %
203.3 %
Deliveries made
Spent on gifting subscription services
Spent on food & drink subscriptions and recipe boxes (the largest gifting category)
40.1 milllion
£159.9 milllion
£420.2 milllion

PAGEPAGE
SIZING THE MARKET
The volume of small operators in the market makes it challenging to measure, meaning the total value of the market in 2017 could be as much as £700 million
Top 25 – c£500m
GlobalData estimates that the top 25 companies account for approximately £500m in sales.
Remaining 400-600 companies
Low barriers to entry mean that the remainder of the market is comprised predominantly of small and micro- companies (below 50 employees). GlobalData estimates that there are between 400 and 600 of such companies in operation with combined turnover of between £80m and £200m in 2017.
Only a handful of companies in this market meet the thresholds for which they are required to report turnover to Companies House.

PAGEPAGE
BEST PRACTICE: RESPONDING TO CUSTOMER NEEDS
Flexibility, convenience and a USP – the keys to a successful subscription box The subscription model does not sit comfortably with all shoppers – 58.1% of those who are not currently signed up do not like the idea of being locked into recurring deliveries, and flexibility and ease of cancelling are the top reasons which could persuade shoppers to sign up. This makes it imperative for subscription brands to emphasise how flexible they can be and how straightforward it is for shoppers to quit when they want to. Another key element is delivering a convenient experience from start to finish, which makes convenience in the delivery aspect key. Letterbox delivery is highly sought after and brands, such as Garçon Wines, with its pioneering, flat wine bottle are seeking innovative ways to respond to this need. The final piece of the jigsaw lies in delivering a USP, something new, different or surprising, which helps the brand stand out from the crowd.
Overcoming the key barriers to take-up of subscription services requires the delivery of a highly convenient and flexible service, that is easy to cancel and offers something shoppers cannot easily get in conventional retailers – be that price, unique products, a tailored, curated selection or just the sheer joy of the element of surprise
PAGEPAGE
BEST PRACTICE: CREATING A USP
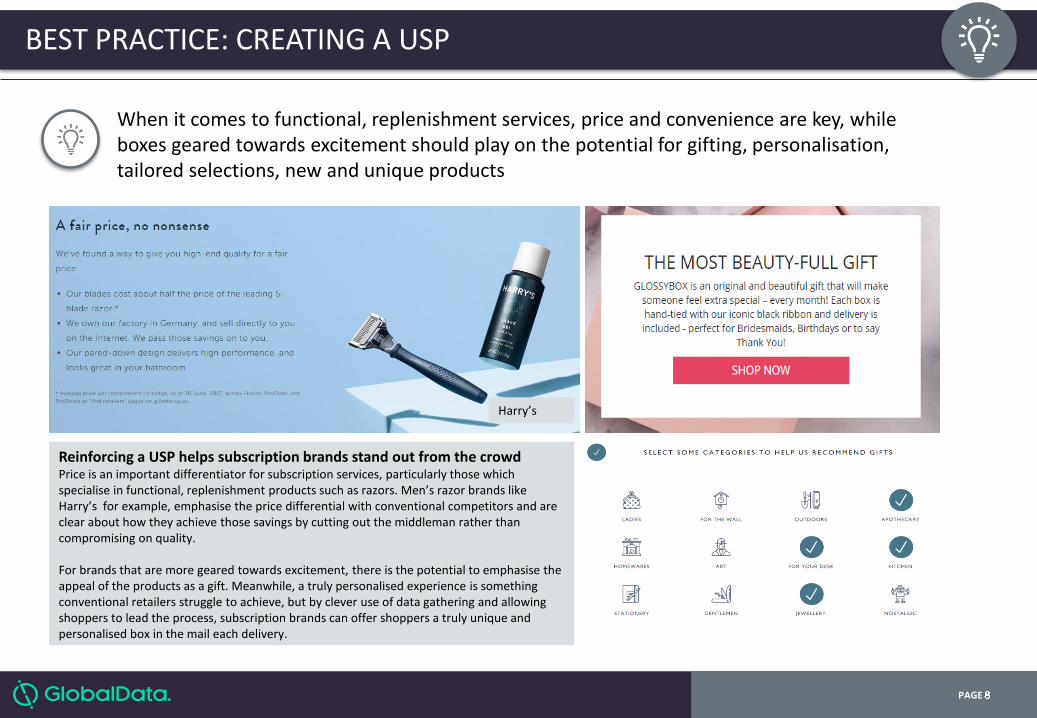
Reinforcing a USP helps subscription brands stand out from the crowd Price is an important differentiator for subscription services, particularly those which specialise in functional, replenishment products such as razors. Men’s razor brands like Harry’s for example, emphasise the price differential with conventional competitors and are clear about how they achieve those savings by cutting out the middleman rather than compromising on quality. For brands that are more geared towards excitement, there is the potential to emphasise the appeal of the products as a gift. Meanwhile, a truly personalised experience is something conventional retailers struggle to achieve, but by clever use of data gathering and allowing shoppers to lead the process, subscription brands can offer shoppers a truly unique and personalised box in the mail each delivery.
Harry’s
When it comes to functional, replenishment services, price and convenience are key, while boxes geared towards excitement should play on the potential for gifting, personalisation, tailored selections, new and unique products

PAGEPAGE
BEST PRACTICE: MARKETING
As well as spreading the core messages of the brand and reaching potential new customers, marketing is also a key way for brands to keep shoppers engaged and ensure customer retention, with social media at the heart of many subscription brands’ marketing strategies
Interactive Keeping shoppers engaged is vital to customer retention. Beauty brands do this by encouraging shopper interaction and participation on social media. Birchbox does this through extensive use of video content on sites such as Facebook Live, where the marketing is very much in a Q&A format. Brands like Birchbox and rival, Glossybox, also value their customers as marketers themselves, encouraging them to share their “unboxings” with the wider social media community.
Educational Added value is another key way for subscription boxes to keep shoppers interested. One way in which they can do this is by helping them to learn a new skill or improve upon an existing one. Recipe boxes, like Gousto for example, know that one of their key markets is novice cooks and so much of their marketing is tailored towards helping to educate shoppers on cooking techniques.
Humour Humour is one of the most effective ways to encourage shoppers to return to and share content. It is a tool that has always been a central tenet of Dollar Shave Club’s marketing strategy. Its social media pages reflect the irreverent image the brand has cultivated, with plenty of humorous content and advice and tips framed in a light-hearted way, helping to connect with its core customers.
PAGEPAGE
CASE STUDY: PACT COFFEE
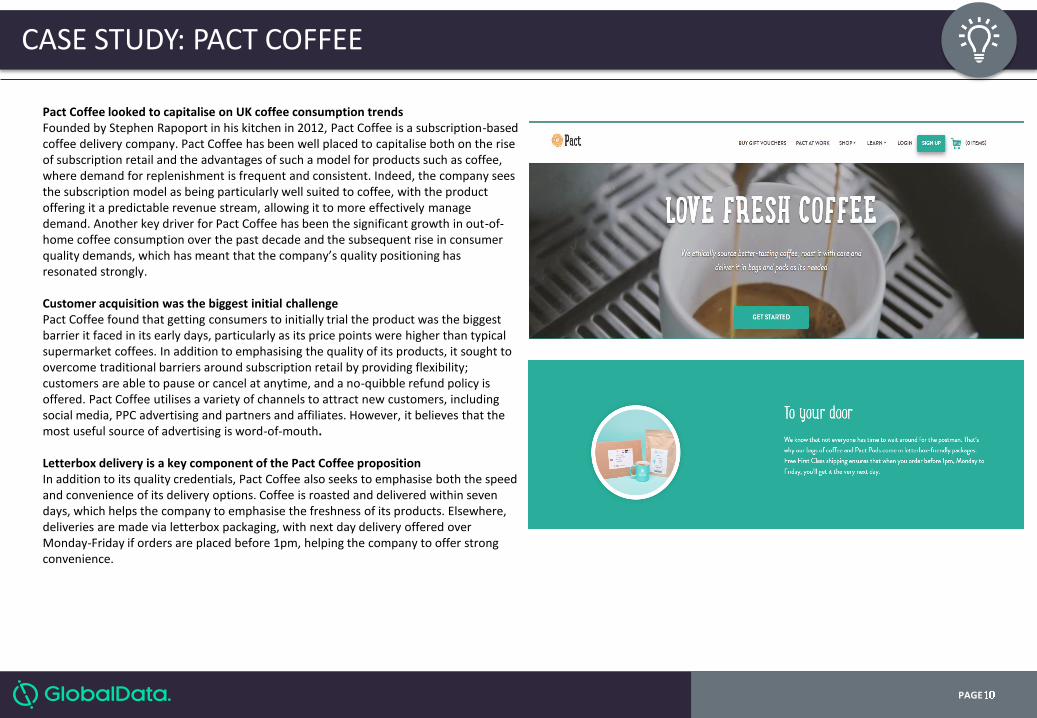
Pact Coffee looked to capitalise on UK coffee consumption trends Founded by Stephen Rapoport in his kitchen in 2012, Pact Coffee is a subscription-based coffee delivery company. Pact Coffee has been well placed to capitalise both on the rise of subscription retail and the advantages of such a model for products such as coffee, where demand for replenishment is frequent and consistent. Indeed, the company sees the subscription model as being particularly well suited to coffee, with the product offering it a predictable revenue stream, allowing it to more effectively manage demand. Another key driver for Pact Coffee has been the significant growth in out-of-home coffee consumption over the past decade and the subsequent rise in consumer quality demands, which has meant that the company’s quality positioning has resonated strongly. Customer acquisition was the biggest initial challenge Pact Coffee found that getting consumers to initially trial the product was the biggest barrier it faced in its early days, particularly as its price points were higher than typical supermarket coffees. In addition to emphasising the quality of its products, it sought to overcome traditional barriers around subscription retail by providing flexibility; customers are able to pause or cancel at anytime, and a no-quibble refund policy is offered. Pact Coffee utilises a variety of channels to attract new customers, including social media, PPC advertising and partners and affiliates. However, it believes that the most useful source of advertising is word-of-mouth. Letterbox delivery is a key component of the Pact Coffee proposition In addition to its quality credentials, Pact Coffee also seeks to emphasise both the speed and convenience of its delivery options. Coffee is roasted and delivered within seven days, which helps the company to emphasise the freshness of its products. Elsewhere, deliveries are made via letterbox packaging, with next day delivery offered over Monday-Friday if orders are placed before 1pm, helping the company to offer strong convenience.
PAGEPAGE
CASE STUDY: PACT COFFEE (CONTINUED)
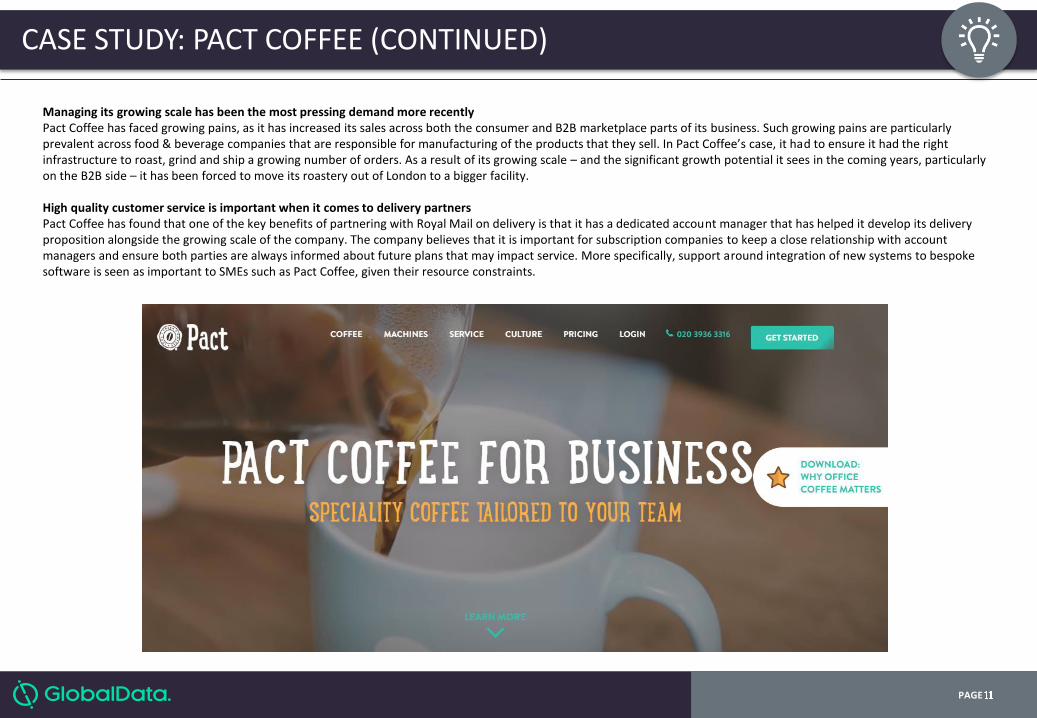
Managing its growing scale has been the most pressing demand more recently Pact Coffee has faced growing pains, as it has increased its sales across both the consumer and B2B marketplace parts of its business. Such growing pains are particularly prevalent across food & beverage companies that are responsible for manufacturing of the products that they sell. In Pact Coffee’s case, it had to ensure it had the right infrastructure to roast, grind and ship a growing number of orders. As a result of its growing scale – and the significant growth potential it sees in the coming years, particularly on the B2B side – it has been forced to move its roastery out of London to a bigger facility. High quality customer service is important when it comes to delivery partners Pact Coffee has found that one of the key benefits of partnering with Royal Mail on delivery is that it has a dedicated account manager that has helped it develop its delivery proposition alongside the growing scale of the company. The company believes that it is important for subscription companies to keep a close relationship with account managers and ensure both parties are always informed about future plans that may impact service. More specifically, support around integration of new systems to bespoke software is seen as important to SMEs such as Pact Coffee, given their resource constraints.

PAGEPAGE
CASE STUDY: VEGAN TUCK BOX
Vegan Tuck Box aims to make it easier to buy vegan snacks Founded by Kelly Slade and Chrissy Leyland in October 2013, Vegan Tuck Box is a subscription-based vegan snacks company. Both of the company’s founders are from a background in the vegan community; regularly running events, and saw that a lack of easily available vegan snack products represented a key barrier to more people turning to veganism. Vegan Tuck Box was set up with the aim of making it easier to be vegan, with the founders inspired by similar vegan subscription box concepts, based on North America. Vegan Tuck Box faced operational challenges early on… Given the backgrounds of the company’s founders, in addition to the inevitable teething problems faced by most business start-ups, Vegan Tuck Box faced a number of operational challenges. While getting the business off the ground wasn’t difficult – the business initially started in the living room of one of the founder’s – issues such as finding where the company was going to source its products from had to be overcome. Another issue was finance, with a lack of significant third party investment meaning that everything had to be developed in a cost-effective way. Despite research into the competitive landscape, Vegan Tuck Box also faced the challenge of a better financed competitor launching at around the same time. …but gradually benefitted from its growing scale Within a year of operating, Vegan Tuck Box had grown to a sufficient enough scale to move into a warehouse, allowing it to both take a higher volume of supplier deliveries and to distribute more boxes to customers. It was also able to negotiate better prices for its boxes, while a greater ability to spend more upfront has allowed it to benefit from cheaper prices when sourcing its products. Nonetheless, similar to other start-ups, the company has faced a difficult balancing act between offering a price competitive service with its aspirations to achieve profitability, particularly given that margins are generally lower in food & beverages compared to segments such as health & beauty. In the long term, it hopes that its increasing scale will help it to make further savings on wholesale prices.

PAGEPAGE
CASE STUDY: VEGAN TUCK BOX (CONTINUED)
Vegan Tuck Box has looked to differentiate through its product assortment While the last five years has seen a significant growth in veganism across the UK, this has represented both a blessing and curse for Vegan Tuck Box. In response to this growing trend, vegan snacks have become more readily available in mainstream supermarkets and food service outlets. In response, the company has doubled-down on its aim to provide unique products that aren’t easily available in shops – such as new vegan brands from other countries. This has brought its own challenges, with the Brexit vote having an adverse impact on the value of sterling, forcing it to stop sourcing products from North America. Minimising churn rate is one of the key challenges for Vegan Tuck Box While the subscription model has the advantage of providing a stream of regular and consistent income, the risk of shoppers being able to cancel at any time is an element that Vegan Tuck Box attempts to minimise as much as possible. While the company has subscribers that have been signed up for most of the five years of its operation, the average is 3-6 months. It has looked to strengthen loyalty via competitions, and the launch of a loyalty points scheme, which can be used towards single boxes. The company has had to respond to customer delivery demands As with many companies operating in the burgeoning subscription segment, Vegan Tuck Box has had to evolve its proposition in accordance with consumer demands. Traditionally selling via monthly boxes, gift boxes and an online shop for specific products, it launched a weekly/fortnightly letterbox service in January 2018, representing a cheaper and more convenient alternative to its other options. Given the importance of curating its product selection for consumers, and against the backdrop of growing availability of vegan snack products at mainstream retailers, the company also ceased offering individual products in early 2018, to focus on its subscription and gifting streams.

PAGEPAGE
CASE STUDY: VEGAN TUCK BOX (CONTINUED)
The company has pursued a varied marketing strategy Given its lack of significant third party investment, Vegan Tuck Box’s approach to marketing has been to supplement word-of-mouth and advertising via Google, with cross-platform social media activity. With the latter, it has benefitted from a growing profile on Facebook and Instagram, which has represented a good way of showing off its unique products. Elsewhere, a refer-a-friend scheme has also further encouraged promotion via word-of-mouth. Having access to a good support system has been an advantage of working with Royal Mail Vegan Tuck Box has found that one of the key advantages of its partnership with Royal Mail has been the support system that the company has in place, including access to a dedicated account manager. For example, Royal Mail recently changed its computer system, with Vegan Tuck Box’s account manager helping the company through the changes.

PAGE
In this section, we take a look at some of the key issues and trends in the subscription market
Section 1 The market

PAGEPAGEPAGE
SUMMARY
Convenient replenishment of everyday, functional products and the excitement of getting to try something new and different in the mail each month are two of the key benefits of subscription box schemes. A growing array of men’s grooming brands are busily capitalising on the potential of the former, bolstered by the price advantages they offer compared to traditional competitors thanks to their direct to consumer business model. Harry’s and Dollar Shave Club command an estimated combined subscriber base of six million across the globe. Both are now aggressively seeking to make headway in the UK market, where home-grown brand Cornerstone is estimated to grow its customer base to 250,000 and turnover £10 million in 2018. With take-up of such services estimated at approximately 500,000 in 2017, a growth trajectory similar to that witnessed in the US could see male grooming subscriptions attracting almost two million members by 2022, making them the fastest growing subscription category. Beauty box services also cater to the replenishment needs of their subscribers, but additionally offer the excitement of getting to try out new products. Such services are already more established in the UK than their counterparts in male grooming, but there remains significant growth potential, with GlobalData forecasting health & beauty revenue to grow by 210% between 2017 and 2022.
1. RAZORS AND BEAUTY OFFER THE BIGGEST GROWTH OPPORTUNITIES
While some of the more established food & drink box brands, including Graze, Abel & Cole and Riverford have found growth more difficult to come by in recent years, there is a growing opportunity for smaller companies with more niche product assortments to carve out a slice of the market. In particular, there are plenty of opportunities to cater for specialised diets, with shoppers often appreciating a helping hand when it comes to deciding what to eat. More unusual products that are not easily available in shops, such as Japanese candy, French gourmet specialities and spice blends, also offer up an opportunity to service needs not currently being met by mainstream retailers. Many of these categories are particularly well suited to small companies, given that demand is unlikely to be sufficiently widespread to attract the attention of more established competitors.
2. NICHE PRODUCTS REPRESENT A STRONG GROWTH OPPORTUNITY WITHIN FOOD & DRINK
The recipe box or meal kit market is perhaps the archetypal example of the meteoric rise of subscription box schemes. Barely registering on the radar five years’ ago, the market was worth an estimated £129.2 million in the UK in 2017. Despite some signs of gradual maturation, growth in the market continues to far outstrip the performance of the wider food and grocery sector. With fast growing rivals like Gousto beginning to show signs of threatening market leader HelloFresh’s dominance, plenty of opportunities exist for entrepreneurs looking to take advantage of the rising popularity of these schemes. In particular, boxes which cater to particular dietary requirements, or simply help customers plan healthier meals, offer further growth opportunities, while the leading players are extending their offers to include fine dining with gourmet ingredients and other meals such as breakfast.
3. FINE DINING, BREAKFAST AND SPECIALIST DIETS OFFER FURTHER GROWTH OPPORTUNITIES IN THE RECIPE BOX MARKET

PAGEPAGEPAGE
KEY ISSUES AND TRENDS IN THE SUBSCRIPTION MARKET
LOW IMPACT
8 1 2 3 4 5 6 7 9 10
IMPACT OF ISSUE
HIGH IMPACT
It is a scenario familiar to online shoppers everywhere: arriving home from work excited for the arrival of the product that was ordered so conveniently with the click of a mouse button, only to discover a “sorry you were out” card. One way to limit the chance of this frustrating event from occurring is the use of letterbox delivery. This has led to brands finding clever ways to ensure that even products which are not obviously suited to this kind of delivery to fit through the letterbox. A good example of this is the growing trend for letterbox flowers, led by brands such as Bloom & Wild, which provide high quality, fresh flowers, packed flat to fit through the letterbox. Food & drink is another category which does not obviously lend itself to letterbox delivery, but the success of market leading brands, such as Graze in managing to provide a convenient letterbox service for its popular snacks, is prompting other brands to follow suit. Taking this one step further, Garçon Wines has even pioneered a flattened 750ml wine bottle that can fit through a letterbox, potentially revolutionising wine delivery and opening it up to new audiences.
INNOVATION IN DELIVERY As the subscription market becomes increasingly competitive, brands are having to find innovative new ways to gain an edge on the competition. One of the ways that they can do this is by making delivery as convenient as possible. In particular, there is a clear demand from busy shoppers to have items delivered hassle-free without them having to wait in at home.
LOW IMPACT
8 1 2 3 4 5 6 7 9 10
IMPACT OF ISSUE
HIGH IMPACT
The low barriers to entry in the subscription market have meant that with even limited capital and resources, budding entrepreneurs have the ability to set up and quickly build a successful business. Their success is starting to breed competition with brands like Gillette and Sephora hoping to emulate the performance of subscription companies, like Dollar Shave Club and Birchbox. That said, subscription box companies have not always found that big retailers and brands are intent on becoming their competition. In some cases, major companies have adopted a “if you can’t beat them join them” approach. This has led to brands like Graze and HelloFresh stocking their products in conventional retail stores, while Unilever went one step further by acquiring Dollar Shave Club for $1 billion in 2016. Brands like Estee Lauder have also made use of the wealth of data subscription brands have on their shoppers to find new ways to target shoppers with their latest products.
BIG BRANDS SEEK A SLICE OF THE ACTION The rapid rise of subscription boxes has in the main been driven by innovative start-ups, often with limited resources. Their success has prompted bigger brands to take note, with Gillette, Sephora, Walmart and Amazon among the big names to have launched their own subscription schemes.
PAGEPAGEPAGE
KEY ISSUES AND TRENDS IN THE SUBSCRIPTION MARKET
LOW IMPACT
8 1 2 3 4 5 6 7 9 10
IMPACT OF ISSUE
HIGH IMPACT
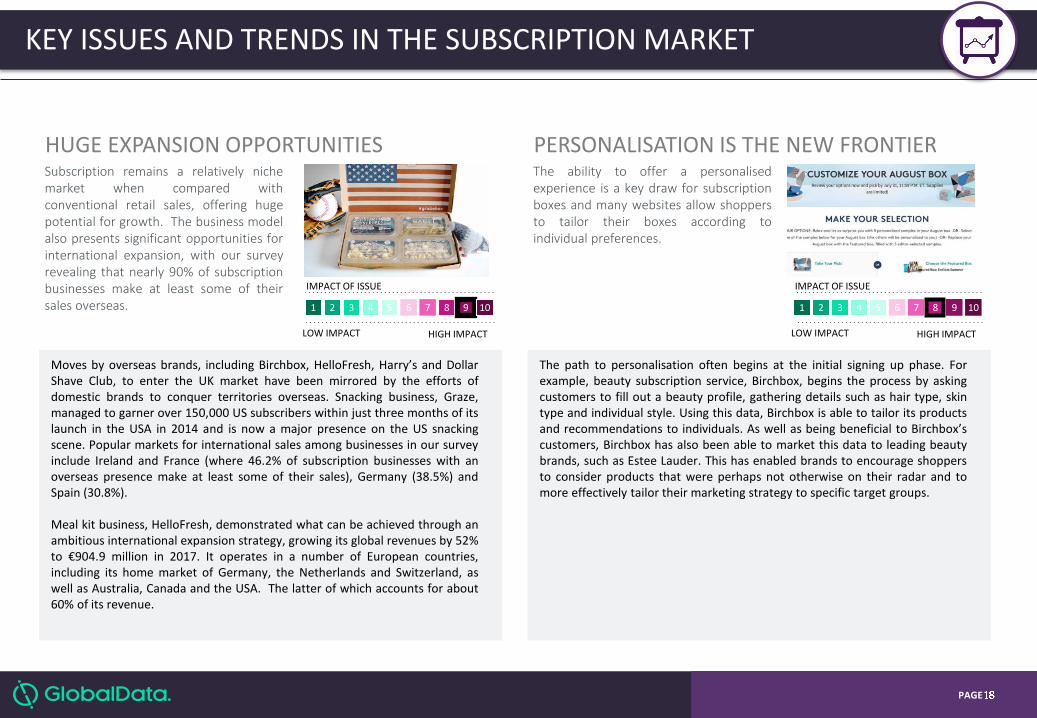
Moves by overseas brands, including Birchbox, HelloFresh, Harry’s and Dollar Shave Club, to enter the UK market have been mirrored by the efforts of domestic brands to conquer territories overseas. Snacking business, Graze, managed to garner over 150,000 US subscribers within just three months of its launch in the USA in 2014 and is now a major presence on the US snacking scene. Popular markets for international sales among businesses in our survey include Ireland and France (where 46.2% of subscription businesses with an overseas presence make at least some of their sales), Germany (38.5%) and Spain (30.8%). Meal kit business, HelloFresh, demonstrated what can be achieved through an ambitious international expansion strategy, growing its global revenues by 52% to €904.9 million in 2017. It operates in a number of European countries, including its home market of Germany, the Netherlands and Switzerland, as well as Australia, Canada and the USA. The latter of which accounts for about 60% of its revenue.
HUGE EXPANSION OPPORTUNITIES Subscription remains a relatively niche market when compared with conventional retail sales, offering huge potential for growth. The business model also presents significant opportunities for international expansion, with our survey revealing that nearly 90% of subscription businesses make at least some of their sales overseas.
LOW IMPACT
8 1 2 3 4 5 6 7 9 10
IMPACT OF ISSUE
HIGH IMPACT
The path to personalisation often begins at the initial signing up phase. For example, beauty subscription service, Birchbox, begins the process by asking customers to fill out a beauty profile, gathering details such as hair type, skin type and individual style. Using this data, Birchbox is able to tailor its products and recommendations to individuals. As well as being beneficial to Birchbox’s customers, Birchbox has also been able to market this data to leading beauty brands, such as Estee Lauder. This has enabled brands to encourage shoppers to consider products that were perhaps not otherwise on their radar and to more effectively tailor their marketing strategy to specific target groups.
PERSONALISATION IS THE NEW FRONTIER The ability to offer a personalised experience is a key draw for subscription boxes and many websites allow shoppers to tailor their boxes according to individual preferences.

PAGEPAGEPAGE
KEY ISSUES AND TRENDS IN THE SUBSCRIPTION MARKET
LOW IMPACT
8 1 2 3 4 5 6 7 9 10
IMPACT OF ISSUE
HIGH IMPACT
One of the big success stories of the burgeoning subscription market, is male grooming. Led by Dollar Shave Club, whose three million subscribers spent a reported $160 million worldwide in 2016, the industry has experienced phenomenal growth across the Atlantic and a number of the leading brands have begun targeting the UK market. UK market leader, Cornerstone, perfectly exemplifies the ability for motivated entrepreneurs to launch subscription businesses with limited resources. From a £5,000 start-up loan and working at his kitchen table, Oliver Bridge has turned cornerstone into a business with 140,000 subscribers and a projected turnover of £10 million in 2018. Such rapid success does breed competition. In the US, Gillette has launched an on-demand subscription service in response to the meteoric rise of Dollar Shave Club and Harry’s, while Unilever spent $1 billion acquiring Dollar Shave Club in 2016. In the UK, the success of home grown brands, such as Cornerstone, is increasingly under threat from the major US brands, with both Harry’s and Dollar Shave Club making a concerted play for UK market share in 2017.
MALE GROOMING TAKES OFF GlobalData estimates that the market for subscription shaving products was worth £20.1 million in 2017 and is forecast to rise by over 300% to £86 million by 2022 as major US brands, Harry’s and Dollar Shave Club begin a concerted marketing push to challenge the success of homegrown favourites, such as Cornerstone.
LOW IMPACT
8 1 2 3 4 5 6 7 9 10
IMPACT OF ISSUE
HIGH IMPACT
Retaining customers is key for any subscription business as even a small percentage of shoppers cancelling each month can have a dramatic impact on the subscriber base. For this reason, subscription brands have had to be innovative in their approach to combatting churn. Innovation can be something as simple as keeping customers engaged using a magazine. Shaving subscription business, Cornerstone, for example, credits the launch of its “15 minutes” magazine with a major reduction in its churn rate. It now claims to boast a readership of 130,000, exceeding the circulation of GQ. Among beauty box retailers, there has been an increasing trend towards personalisation, with Birchbox trialing Birchbox Select, which allows customers to pick out specific items or tailor the box to their specific requirements – e.g. dry skin, coloured hair etc. In the food & drink sector, leading meal kit supplier, Hello Fresh, expanded its repertoire beyond dinner to include breakfasts and has also launched its meal kits in Sainsbury’s, tapping into the market for shoppers who don’t tend to plan their meals in advance. Meanwhile, popular snack business, Graze, now sells its products in stores, including Sainsbury’s, Tesco, Asda and Boots.
COMBATTING “CHURN” “Churn” – or the proportion of customers who decide to cancel – is one of the biggest challenges facing subscription businesses. Keeping customers engaged is key and a number of subscription businesses have developed innovative ways to do this, from diversifying their business model to reduce their reliance on subscriptions, to launching new products and features.

PAGEPAGEPAGE
KEY ISSUES AND TRENDS IN THE SUBSCRIPTION MARKET
LOW IMPACT
8 1 2 3 4 5 6 7 9 10
IMPACT OF ISSUE
HIGH IMPACT
The most obvious way for subscription businesses to capitalise on personal recommendations, is by offering incentives. HelloFresh, for example, provides users with an unlimited referral code which they can use to obtain credit and freebies, while Dollar Shave Club gives a £5 credit for referrals. Other brands, such as Birchbox, work to create an interactive social media experience, with a focus on encouraging user generated-content. One of the ways that it does this is by Q&A style videos on Facebook Live.
THE IMPORTANCE OF WORD OF MOUTH Word of mouth is one of the most important ways that subscription businesses expand their subscriber base. In our survey, it was the most common way for subscription box subscribers to hear about the service they signed up to. Subscription brands have taken advantage of this through referral schemes and encouraging social media participation.
LOW IMPACT
8 1 2 3 4 5 6 7 9 10
IMPACT OF ISSUE
HIGH IMPACT
The gifting market is a key avenue for subscription businesses, including both shoppers gifting to their friends and family and the growing trend for self-gifting. There are even subscription boxes, such as Not-Another-Bill, which cater specifically for the gifting market. The inspiration behind this particular service was the idea that ‘No-one gets anything good in the post anymore apart from bills and a few pizza menus.’ Customers receive one present each month, ranging from homewares to jewellery and stationery. The element of surprise, having someone else curate a selection based on your profile and getting to try out exciting new products are just some of the reasons subscription boxes are well suited to gifting and self-gifting. These factors have all been key to the rapid rise of beauty boxes, such as Look Fantastic, GlossyBox and Birchbox. In a market in which the choice of products can be overwhelming, these boxes also help to take some of the hassle out of the decision making process – a key factor given the increasingly stressful and time-pressured lives of today’s shoppers.
GIFTING IS A KEY DRIVER In addition to the near one third of subscription buyers who have signed up to a subscription service as a gift, 42.1% of those who signed up for themselves did so as a treat, reflecting the importance of both gifting and self-gifting in this market. Subscription brands have encouraged this trend with a focus on the element of surprise, as well as innovative and unique products.

PAGEPAGEPAGE
MARKET SIZE AND GROWTH
Current and forecast value of the subscription box market Figures on the chart are £millions
Forecast growth in the subscription box market (2017-2022) Figures on the chart are percentages
583.3
291.0 87.5 129.2
42.7 20.1 12.8
1,003.4
354.7 209.2 201.1 129.5 86.0 22.8
Total Food & drink Other Recipe box Health & beauty Male grooming Entertainment & books
2017 2022
328.6
203.3
139.1
77.8 72.0 55.6 21.9
Male grooming Health & beauty Other Entertainment & books All subscription boxes Recipe box Food & drink
Male grooming and health & beauty boxes are forecast to be the biggest growers over the next five years, with growth at more established food & drink operators stabilising and the rapid growth of recipe boxes beginning to show signs of a loss in momentum

PAGEPAGEPAGE
GIFTING SPEND
Spend on gifting vs. spend for myself by category 2017 Figures on the chart are £millions
Proportion of spend on gifting by category 2017 Figures on the chart are percentages
423.4
208.1
112.4
27.9 52.0 8.3 14.6
159.9
82.9 16.8 14.8 35.5
4.5 5.4
Total Food & drink Recipe box Health & beauty Other Entertainment & books Male grooming
Bought for myself Bought as a gift
40.6 35.4 34.6
28.5 27.4 27.0
13.0
Other Entertainment & books Health & beauty Food & drink Total Male grooming Recipe box
Gifting is responsible for over a quarter of spending on subscription products, equating to £159.9 million

PAGEPAGEPAGE
DELIVERY VOLUMES AND SPENDING ON DELIVERY
Delivery volumes per year Figures on the chart are millions of deliveries
Spend on the delivery element in 2017 Figures on the chart are £millions
40.1
7.7
19.8
5.2 4.0 3.5
65.3
24.0 21.8
8.2 5.7 5.6
Total Health & beauty (inc. male grooming) Food & drink Other Recipe box Entertainment & books
2017 2022
16.2
8.3
5.2
1.3 0.6 0.3 0.3 0.2
Total Food & Drink Health & Beauty (Inc. Male Grooming) Other Recipe Box Fashion & Jewellery Magazines & Books Music & Video
Shoppers spent over £13 million on over 35 million deliveries in 2017, with delivery volumes forecast to rise to over 60 million by 2022

PAGEPAGEPAGE
BRAND MARKET SHARES
Market share of leading subscription brands 2017 Figures on the chart are percentages
14.7
11.2
9.7
8.6 8.0
3.5 3.5 3.3 2.8
2.0 1.7 1.4
HelloFresh Abel & Cole Riverford Graze Naked Wines Birchbox Gousto Direct Wines(Laithwaitesand SundayTimes Wine
club)
Tails.com Glossybox Diet chef HotelChocolat
• Food & drink brands dominate the market, with HelloFresh on top • Beauty services like Birchbox are also rapidly gaining traction, while we expect male
grooming services, like Cornerstone to soon make their mark on the top ten
PAGE
Section 2 The consumer In this section, the focus is on consumer take-up, views and attitudes towards subscription box services

PAGEPAGEPAGE
SUMMARY
27.4% of UK consumers are currently signed up to a subscription box service, either for themselves or on behalf of somebody else. Such schemes have gained strong traction among younger demographics, with over half of 25-34s (52.1%) signed up to at least one, compared to just 11.7% of 55-64s and 7.6% of over 65s. There is also a slight male skew, with 30.6% of males signed up, compared to 24.3% of females, reflecting the strong traction that male-focussed boxes, such as shaving and beer subscriptions have gained. Inevitably, given the greater penetration among younger shoppers, London is where subscription boxes are most popular, with 50.7% being signed up. In addition to the younger, more affluent population of the city, London has also been a popular go-to destination for start-up subscription companies due to its size and population density.
1. OVER A QUARTER OF UK CONSUMERS ARE SIGNED UP TO A SUBSCRIPTION BOX
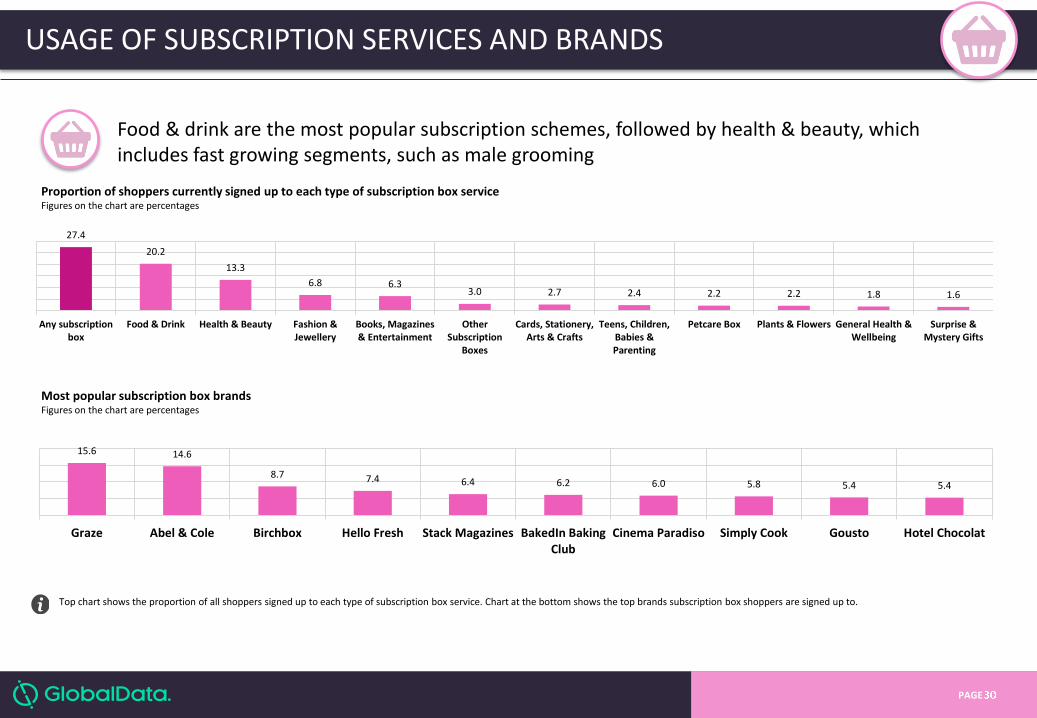
The most popular type of subscription boxes are snack and sweets services, such as Graze, SourcedBox, Sweets in the City (7.4% of the UK population signed up to these services), followed by recipe box services, such as Hello Fresh, Gousto, Mindful Chef (6.5% of the UK population signed up to these services). Indeed, 73.9% of those consumers signed up to subscription schemes buy into a type of Food & drinks service. These schemes benefit from a consistent usage and need – for boxes such as meal kits and snacks – or their appeal as gifts – such as beer subscriptions. The most bought into subscription brand is Graze (15.6%), followed by Abel & Cole (14.6%), with the latter being particularly popular with 25-34s (25.7%). Elsewhere, 3.3% sign up to a shaving and/or grooming box service, such as The Personal Barber, Cornerstone, and King of Shaves. Male grooming has been a key growth area in subscription, with these companies marketing heavily and benefitting from positioning themselves as a more convenient, higher quality and price competitive alternative to major brands for products that require frequent replenishment.
2. FOOD & DRINK ARE MOST POPULAR SUBSCRIPTION SCHEMES
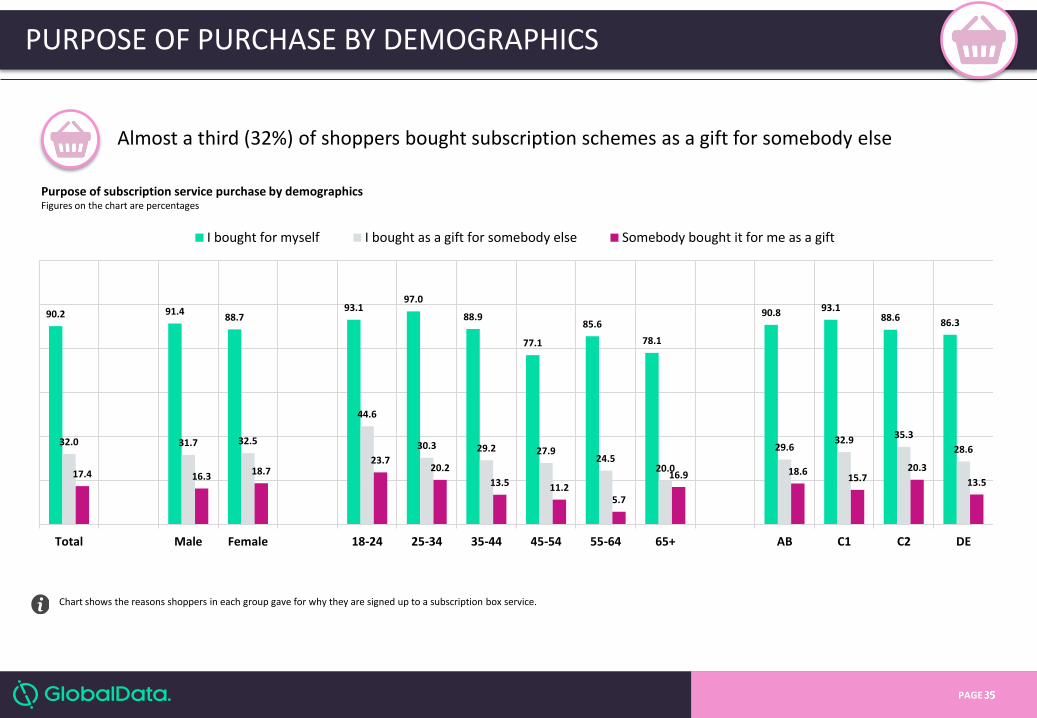
Of those that are signed up to subscription schemes, the average number of different schemes signed up to is 3.3, with most receiving deliveries either every couple of weeks or monthly. While 90.2% of subscription shoppers bought for themselves, almost a third (30.2%) bought on behalf of somebody else, with 44.6% of 18-24s buying into such boxes as a gift. With the rise of online retail – and particularly media streaming – driving a decline in demand in some key traditional gifting categories, subscription boxes – and particularly those that deliver interesting products that the recipient potentially hasn’t tried before – are helping to partially fill the void.
3. ALMOST A THIRD ARE SIGNED UP TO SUBSCRIPTION SCHEMES ON BEHALF OF SOMEBODY ELSE

PAGEPAGEPAGE
SUMMARY
When it comes to the key factors that would encourage shoppers to sign-up to subscription schemes the key driver would be the flexibility to cancel whenever, which was cited by 61.9%. When it comes to subscription of any form – whether it be a gym membership, mobile phone subscription or retail subscription – there has been a shift away from long term contracts, with consumers being increasingly wary of being tied into recurring costs. On the factors that are most important for those signing up to subscription schemes, 85.2% mentioned the ability to return damaged items easily, while 83.7% believe being able to get products delivered without having to wait in is important. Ensuring delivery is as hassle-free as possible is key for subscription brands, with many opting for letterbox delivery where possible and, where not possible, allowing for flexibility in delivery days/times.
5.FLEXIBILITY AROUND ORDERING AND RETURNS IS KEY
39.2% of respondents said that they will join more delivery subscription schemes in the future, with 43.8% suggesting that they will maintain a similar number of schemes. Of those that are most likely to increase their subscription spending, the highest proportion is among 25-34s (56.7%), males (42.4%) and ABs (46.0%).
6. MORE THAN THREE-QUARTERS ARE SET TO EITHER MAINTAIN OR INCREASE THEIR USE OF SUBSCRIPTION SCHEMES IN THE FUTURE
Of those that have signed up to subscription schemes for themselves, the most important driver was the opportunity to try something new, cited by 45.2% of subscription shoppers. Encouragingly for brands, 35.7% said the ability to try samples before purchasing is another key driver. Another factor is the desire for shoppers to treat themselves, reflecting the strong element of self-gifting involved with many subscription purchases. When it comes to purchasing on behalf of somebody else, there is a strong element of refer and recommendation as being key when it comes to discovery, with 53.9% purchasing after being recommended by someone, and 43.8% after reading good reviews. The growing influence of subscription boxes as gifts is reflected by the 36.1% who felt their purchase was a thoughtful gift to buy someone.
4. THE OPPORTUNITY TO TRY SOMETHING NEW IS THE MAIN DRIVER WHEN IT COMES TO SIGNING UP

PAGE
Section 2.1 The consumer: purchasing In this section, we look at consumer purchasing habits when it comes to subscriptions

PAGEPAGEPAGE
PENETRATION OF SUBSCRIPTION SERVICES
Top chart shows the proportion of shoppers in each demographic group who are currently signed up to a subscription box service. Bottom chart shows the same by UK region.
Proportion of shoppers signed up to subscription services by age, gender and social grade Figures on the chart are percentages
27.4 30.6 24.3
44.8 52.1
38.1
18.1 11.7
7.6
26.8 30.7
35.9
16.8
Anysubscription
box
Male Female 18-24 25-34 35-44 45-54 55-64 65+ AB C1 C2 DE
Proportion of shoppers signed up to subscription services by UK region Figures on the chart are percentages
50.7
34.7 28.0 25.7 25.2 24.7 22.6 22.5 22.0 20.6 20.0 18.7
London North East South West South East Wales East Anglia Scotland WestMidlands
North West NorthernIreland
East Midlands Yorkshire &Humberside
• Over a quarter of shoppers are currently signed up to a subscription service • Popularity is highest among under 35s, peaking at 52.1% among 25-34s
PAGEPAGEPAGE
USAGE OF SUBSCRIPTION SERVICES AND BRANDS
Top chart shows the proportion of all shoppers signed up to each type of subscription box service. Chart at the bottom shows the top brands subscription box shoppers are signed up to.
Proportion of shoppers currently signed up to each type of subscription box service Figures on the chart are percentages
27.4
20.2
13.3
6.8 6.3 3.0 2.7 2.4 2.2 2.2 1.8 1.6
Any subscriptionbox
Food & Drink Health & Beauty Fashion &Jewellery
Books, Magazines& Entertainment
OtherSubscription
Boxes
Cards, Stationery,Arts & Crafts
Teens, Children,Babies &Parenting
Petcare Box Plants & Flowers General Health &Wellbeing
Surprise &Mystery Gifts
Most popular subscription box brands Figures on the chart are percentages
15.6 14.6
8.7 7.4 6.4 6.2 6.0 5.8 5.4 5.4
Graze Abel & Cole Birchbox Hello Fresh Stack Magazines BakedIn BakingClub
Cinema Paradiso Simply Cook Gousto Hotel Chocolat
Food & drink are the most popular subscription schemes, followed by health & beauty, which includes fast growing segments, such as male grooming

PAGEPAGEPAGE
DECLINING SHARE
CURRENTLY SIGNED UP TO (%)
DECLINING SHARE
CANCELLED OR NOT RENEWED (%)
DECLINING SHARE
CONSIDERING SIGNING UP TO (%)
Snack and sweets service 7.4
Recipe box service 6.5
Beauty box service 5.3
Chocolate box 3.6
Shaving or grooming box service 3.3
Gym or supplements box 3.2
Vegetable box 2.8
Women’s grooming 2.8
Coffee or tea box service 2.7
Meat or BBQ box service 2.6
Children’s/babies clothing 2.5
Cheese box 2.5
Fish box 2.5
Beer or wine box service 2.4
Magazine box 2.2
Pet care subscription box 2.2
DVD subscription 2.0
Men’s clothing 2.0
Women’s clothing 2.0
Geek boxes 1.9
Baking or dessert boxes 1.8
Self-care box 1.8
Flower box 1.6
Others 9.5
Snack and sweets service 9.7
Recipe box service 4.3
Beer or wine box service 2.9
Chocolate box 2.8
Beauty box service 2.4
Vegetable box 2.3
Magazine box 2.1
Fish box 1.8
Cheese box 1.8
Shaving or grooming box service 1.7
Meat or BBQ box service 1.6
Gym or supplements box 1.5
Geek boxes 1.3
Coffee or tea box service 1.2
DVD subscription 1.1
Music box 1.1
Adult box 1.1
Women’s health box 0.9
Book box 0.8
Baking or dessert boxes 0.8
Cards or stationery box 0.8
Others 6.1
Snack and sweets service 6.4
Recipe box service 6.1
Chocolate box 5.4
Vegetable box 4.6
Meat or BBQ box service 4.4
Beauty box service 3.9
Beer or wine box service 3.2
Fish box 3.0
Cheese box 3.0
Women’s health box 2.7
Baking or dessert boxes 2.7
Self-care box 2.7
Coffee or tea box service 2.5
Shaving or grooming box service 2.5
Gym or supplements box 2.3
Adult box 2.3
Surprise or mystery gift box 2.3
Pet care subscription box 2.0
Women’s grooming such as Nailbox etc 1.7
Lingerie box 1.7
Geek boxes 1.7
Arts and craft box such as Crafty Creatives 1.6
Box for children or babies 1.6
Others 12.1
USAGE OF SUBSCRIPTION SERVICES

PAGEPAGEPAGE
USAGE OF SUBSCRIPTION SERVICES BY DEMOGRAPHICS
Table shows the proportion of shoppers in each demographic group who are signed up to each type of subscription box service.
Proportion of shoppers in each demographic group who are currently signed up to each type of subscription box service Figures on the chart are percentages
Younger shoppers – especially the under 35s – are notably more likely to be signed up
Overall Male Female 18-24 25-34 35-44 45-54 55-64 65+ AB C1 C2 DE
Food & drink 20.2 24.6 16.1 30.7 43.3 29.5 12.5 7.5 4.0 21.2 23.7 25.2 11.1
Health & beauty 13.3 13.9 12.7 27.3 27.0 18.3 7.0 3.6 1.8 11.8 16.0 19.8 6.3
Fashion & jewellery 6.8 8.3 5.3 11.9 18.4 10.3 1.0 1.0 0.6 6.5 8.1 9.6 3.2
Books, magazines & entertainment 6.3 7.6 5.0 14.9 12.6 9.1 1.0 0.7 1.9 5.5 7.1 10.7 2.3
Other subscription boxes 3.0 3.8 2.2 5.6 6.6 3.2 2.4 0.5 0.6 3.4 2.7 4.5 1.6
Cards, stationery, arts & crafts 2.7 3.2 2.3 3.7 7.2 5.0 0.7 0.4 0.2 3.0 3.3 3.5 1.0
Teens, children, babies & parenting 2.4 3.2 1.6 2.5 6.3 4.9 1.3 2.3 3.0 3.7 0.7
Petcare box 2.2 2.4 2.0 5.0 2.9 2.7 2.0 0.6 0.7 3.7 1.9 2.7 0.4
Plants & flowers 2.2 2.7 1.6 1.4 6.2 4.0 0.9 0.8 0.1 2.2 3.0 3.0 0.5
General health & wellbeing 1.8 2.2 1.4 3.6 4.7 2.6 0.3 0.3 3.2 1.5 2.0 0.4
Surprise & mystery gifts 1.6 1.5 1.7 3.9 4.3 1.9 0.6 1.5 1.8 2.7 0.7
Highest value Above average Average Below average Lowest value

PAGEPAGEPAGE
NUMBER OF SCHEMES SIGNED UP TO
Top chart shows the proportion of subscription shoppers signed up to each number of services. Chart at the bottom shows the average number of services shoppers are signed up to by category. Only shoppers who are currently signed up to at least one subscription service are included in the sample.
Number of subscription services signed up to Figures on the chart are percentages
38.6 38.4 44.6 26.8
47.8 25.1 29.9 22.3 23.2
41.2 56.9
40.1
24.8 25.3 26.3
24.9
22.7
28.6 24.2 39.6 24.6
18.9
21.0
24.8
21.4 20.8 15.3 30.7
15.3 26.9 26.5
25.7 41.2 27.0
22.1 28.5
10.9 11.2 10.6 15.3 12.9 17.3 16.6 10.3 6.3 5.1 0.0 6.6 4.3 4.3 3.2 2.3 1.4 2.1 2.8 2.1 4.7 7.8 0.0 0.0
All SubscriptionBoxes
Food & Drink Health & Beauty Fashion &Jewellery
Petcare Box General Health &Wellbeing
Cards, Stationery,Arts & Crafts
Teens, Children,Babies &Parenting
Plants & Flowers Books, Magazines& Entertainment
Surprise &Mystery Gifts
OtherSubscription
Boxes
1 2 to 3 4 to 6 7 to 9 10 or more
61.4% of subscription box shoppers are signed up to more than one scheme and over a third (36.6%) are signed up to four or more schemes
Average number of subscription services signed up to by category Figures on the chart are percentages
3.3 3.9 3.9 3.8 3.8 3.4 3.4 3.3 3.1 3.0 3.0
2.1
All SubscriptionBoxes
Plants & Flowers Cards, Stationery,Arts & Crafts
General Health &Wellbeing
Fashion &Jewellery
Books, Magazines& Entertainment
Teens, Children,Babies &Parenting
Food & Drink OtherSubscription
Boxes
Health & Beauty Petcare Box Surprise &Mystery Gifts

PAGEPAGEPAGE
NUMBER OF SCHEMES SIGNED UP TO
Top chart shows the average number of subscription box services shoppers in each demographic group are signed up to. Bottom chart shows the same by UK region. Only shoppers who are currently signed up to at least one subscription service are included in the sample.
Average number of subscription services signed up to by age and social grade Figures on the chart are percentages
25-34 year olds currently using subscription schemes are signed up to an average of 3.7 of such schemes
Average number of subscription services signed up to by region Figures on the chart are percentages
4.3 3.8 3.7 3.7 3.5 3.3 3.1 3.1
2.6 2.5 2.5 2.4
Wales North East London Yorkshire &Humberside
South East East Anglia North West East Midlands Northern Ireland Scotland West Midlands South West
3.3 3.7
2.8
3.4 3.7 3.5
2.3
1.8
1.2
3.6 3.6
3.1
2.5
All Male Female 18-24 25-34 35-44 45-54 55-64 65+ AB C1 C2 DE
PAGEPAGEPAGE
Chart shows the reasons shoppers in each group gave for why they are signed up to a subscription box service.
Almost a third (32%) of shoppers bought subscription schemes as a gift for somebody else
PURPOSE OF PURCHASE BY DEMOGRAPHICS
Purpose of subscription service purchase by demographics Figures on the chart are percentages
90.2 91.4 88.7
93.1 97.0
88.9
77.1
85.6
78.1
90.8 93.1 88.6 86.3
32.0 31.7 32.5
44.6
30.3 29.2 27.9 24.5
20.0
29.6 32.9
35.3
28.6
17.4 16.3 18.7 23.7
20.2
13.5 11.2 5.7
16.9 18.6 15.7
20.3
13.5
Total Male Female 18-24 25-34 35-44 45-54 55-64 65+ AB C1 C2 DE
I bought for myself I bought as a gift for somebody else Somebody bought it for me as a gift

PAGEPAGEPAGE
Chart shows the reasons shoppers gave for why they are signed up to each type of subscription box service.
Gifting of subscription boxes is popular across categories
PURPOSE OF PURCHASE BY TYPE OF SUBSCRIPTION
Purpose of subscription service purchase by type of subscription Figures on the chart are percentages
90.2 88.8
77.6 77.5 73.4 71.4
67.7 66.2 61.7 60.9 60.3 58.7
32.0
25.1 26.4 29.0
25.8
35.6
26.1 24.0
38.5 42.0
22.9
44.1
17.4
10.3
16.0 12.0
7.3 10.4 11.0 11.9
6.9
14.2
27.2
10.3
All Food & Drink Books,Magazines &
Entertainment
Health & Beauty Petcare Box Fashion &Jewellery
Surprise &Mystery Gifts
OtherSubscription
Boxes
Health &Wellbeing
Teens, Children,Babies &Parenting
Plants &Flowers
Cards,Stationery, Arts
& Crafts
I bought for myself I bought as a gift for somebody else Somebody bought it for me as a gift

PAGE
Section 2.2 The consumer: drivers and barriers In this section, we look at the drivers and barriers to using subscription box services

PAGEPAGE
DECLINING SHARE BOUGHT FOR
THEMSELVES (%)
DECLINING SHARE
BOUGHT AS A GIFT (%) DECLINING
SHARE GIFT RECIPIENTS (%)
Try something new 45.2
Like the subscription model 44.9
To treat myself 42.1
Can try before I buy 35.7
Recommendation 30.7
Reviews 30.3
Convenience 28.1
Flexibility to cancel 21.9
I need this type of product 19.2
Financial incentive 18.9
To save money 17.8
Enjoy receiving gifts in the post 17.5
To save time 17.0
Like element of surprise 16.9
To experience different products 16.3
To get something I can’t easily find in the shops 13.8
Access to exclusive/unique products 13.5
Personalised experience 10.6
To receive something exciting in the mail 7.6
Enjoy having someone else plan my purchases 4.6
Other 2.4
Recommended by someone 53.9
Read good reviews 43.8
I thought this was a thoughtful gift 36.1
I thought this was a unique gift 35.9
I like the subscription model 33.6
Knew recipient would like this as a gift 28.8
I had previously been signed up to this service/a similar service
27.6
I thought this was a cost-effective gift 14.4
It was convenient to buy this as a gift 13.6
There was a promotion on – e.g. first month free 8.4
Other 1.1
Good to try something new 32.2
I appreciated this as a gift 29.2
I like the subscription model 27.4
I enjoy being able to try samples before I buy 26.2
Would consider buying this type of subscription for others
20.8
Would recommend to other people 20.2
I plan to continue once the gift period runs out 19.1
I need this type of product 15.8
Likely to cancel/let the subscription expire once 15.8
I enjoy the element of surprise 14.9
Enjoy ability to experience a variety of different products
14.2
I look forward to receiving these items in the mail 14.2
None of the above 12.3
I enjoy having someone else plan my purchases 8.9
Nice as a gift but isn’t something I need 8.3
I believe this subscription is convenient 8.1
Like to receive items that I can’t find easily in the shops 7.8
This gift subscription is saving me money 6.9
This isn’t something I would buy somebody else as a gift 1.8
I find having to plan for delivery quite annoying 0.0
DEMAND DRIVERS
PAGEPAGE
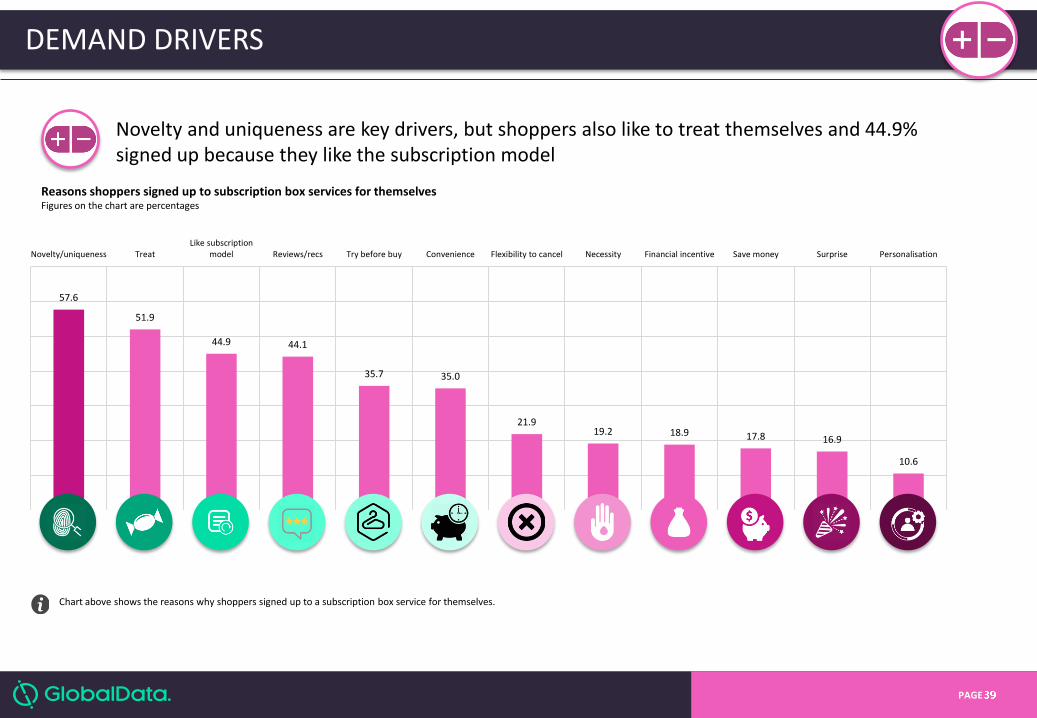
Chart above shows the reasons why shoppers signed up to a subscription box service for themselves.
Reasons shoppers signed up to subscription box services for themselves Figures on the chart are percentages
57.6
51.9
44.9 44.1
35.7 35.0
21.9 19.2 18.9 17.8 16.9
10.6
Novelty/uniqueness TreatLike subscription
model Reviews/recs Try before buy Convenience Flexibility to cancel Necessity Financial incentive Save money Surprise Personalisation
Novelty and uniqueness are key drivers, but shoppers also like to treat themselves and 44.9% signed up because they like the subscription model
DEMAND DRIVERS

PAGEPAGE
PURCHASE DRIVERS BY DEMOGRAPHICS
Table above shows the reasons shoppers in each demographic group gave for why they are signed up to a subscription service.
Reasons shoppers signed up to subscription box services for themselves by demographics Figures on the chart are percentages
The subscription model is a more significant driver of take-up among male shoppers, reflecting the growing traction of male grooming services, which provide a regular supply of everyday essentials, such as shaving gear
Overall Male Female 18-24 25-34 35-44 45-54 55-64 65+ AB C1 C2 DE
Novelty/uniqueness 57.6 51.0 65.8 59.6 55.0 57.7 54.5 63.7 64.3 62.3 61.7 53.0 48.7
Treat 51.9 48.7 55.8 57.9 51.1 57.7 40.0 48.2 32.5 47.9 57.3 46.7 57.3
I like the subscription model 44.9 50.3 38.2 43.6 56.4 40.4 33.0 34.7 27.6 54.8 40.2 45.4 35.9
Reviews/recommendations 44.1 42.5 46.0 50.6 43.0 50.3 33.0 27.1 35.8 44.4 48.6 37.6 46.0
Ability to try samples before I buy 35.7 34.2 37.6 37.9 34.9 41.8 30.2 30.3 23.0 41.4 34.3 34.7 30.4
Convenience/time saving 35.0 33.3 37.2 26.6 34.8 42.4 36.9 37.1 38.1 34.7 35.0 36.8 32.4
Flexibility to cancel 21.9 20.9 23.0 17.7 25.0 18.5 18.3 30.5 30.5 24.3 21.7 20.2 21.0
Necessity 19.2 15.3 24.1 19.4 23.0 19.2 18.2 4.6 11.6 15.3 25.0 16.8 18.5
Financial incentive 18.9 17.7 20.3 13.0 24.3 23.2 7.7 17.1 14.6 16.3 26.9 17.4 9.1
To save money 17.8 16.8 18.9 12.6 17.6 20.7 20.4 21.4 20.9 19.6 20.9 11.5 19.4
Surprise 16.9 12.4 22.4 20.9 15.6 14.6 14.8 24.8 12.1 22.0 17.0 13.5 13.5
Personalised experience 10.6 9.5 12.0 9.3 13.6 11.4 2.9 5.5 14.0 16.3 11.1 7.5 5.1
Other reason – please specify 2.4 1.8 3.1 2.7 1.4 6.1 2.6 7.9 2.8 2.8 1.8 1.9
For no particular reason 1.8 2.0 1.5 1.7 1.8 2.3 3.4 7.4 2.6 0.4 1.1 4.6
Above average Average Below average
PAGEPAGE
DEMAND DRIVERS BY TYPE OF SUBSCRIPTION BOX
Table above shows the reasons shoppers gave for why they are signed up to each type of subscription service.
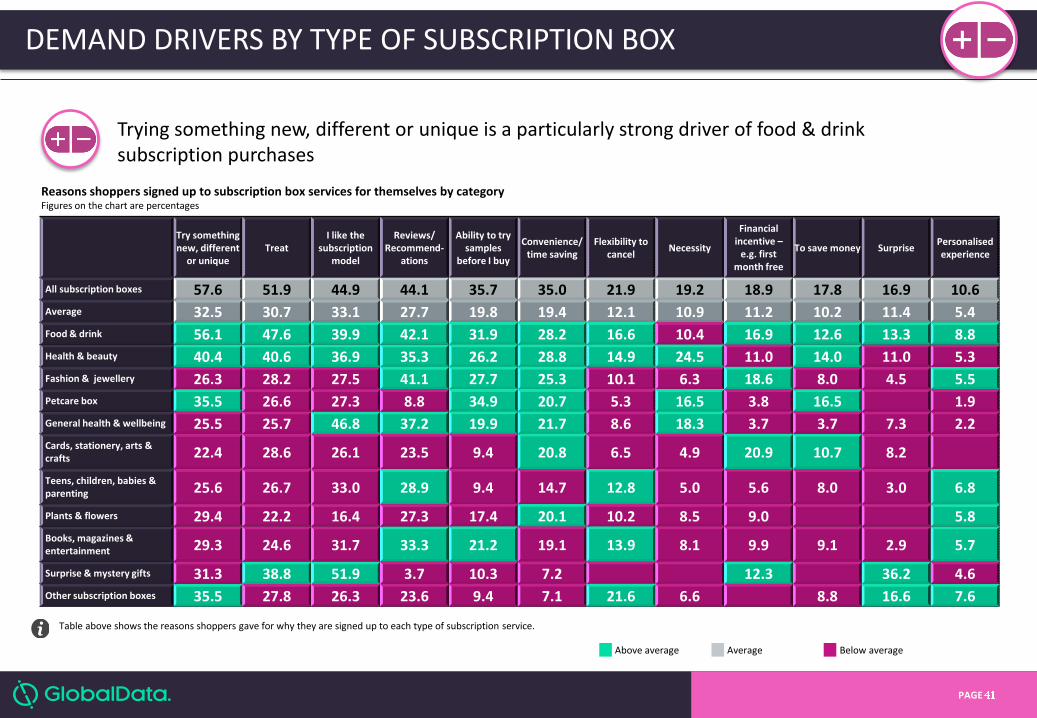
Reasons shoppers signed up to subscription box services for themselves by category Figures on the chart are percentages
Try something new, different
or unique Treat
I like the subscription
model
Reviews/ Recommend-
ations
Ability to try samples
before I buy
Convenience/ time saving
Flexibility to cancel
Necessity
Financial incentive –
e.g. first month free
To save money Surprise Personalised experience
All subscription boxes 57.6 51.9 44.9 44.1 35.7 35.0 21.9 19.2 18.9 17.8 16.9 10.6
Average 32.5 30.7 33.1 27.7 19.8 19.4 12.1 10.9 11.2 10.2 11.4 5.4
Food & drink 56.1 47.6 39.9 42.1 31.9 28.2 16.6 10.4 16.9 12.6 13.3 8.8
Health & beauty 40.4 40.6 36.9 35.3 26.2 28.8 14.9 24.5 11.0 14.0 11.0 5.3
Fashion & jewellery 26.3 28.2 27.5 41.1 27.7 25.3 10.1 6.3 18.6 8.0 4.5 5.5
Petcare box 35.5 26.6 27.3 8.8 34.9 20.7 5.3 16.5 3.8 16.5 1.9
General health & wellbeing 25.5 25.7 46.8 37.2 19.9 21.7 8.6 18.3 3.7 3.7 7.3 2.2
Cards, stationery, arts & crafts 22.4 28.6 26.1 23.5 9.4 20.8 6.5 4.9 20.9 10.7 8.2
Teens, children, babies & parenting 25.6 26.7 33.0 28.9 9.4 14.7 12.8 5.0 5.6 8.0 3.0 6.8
Plants & flowers 29.4 22.2 16.4 27.3 17.4 20.1 10.2 8.5 9.0 5.8
Books, magazines & entertainment 29.3 24.6 31.7 33.3 21.2 19.1 13.9 8.1 9.9 9.1 2.9 5.7
Surprise & mystery gifts 31.3 38.8 51.9 3.7 10.3 7.2 12.3 36.2 4.6
Other subscription boxes 35.5 27.8 26.3 23.6 9.4 7.1 21.6 6.6 8.8 16.6 7.6
Trying something new, different or unique is a particularly strong driver of food & drink subscription purchases
Above average Average Below average
PAGEPAGE
MARKETING OF SUBSCRIPTION SERVICES
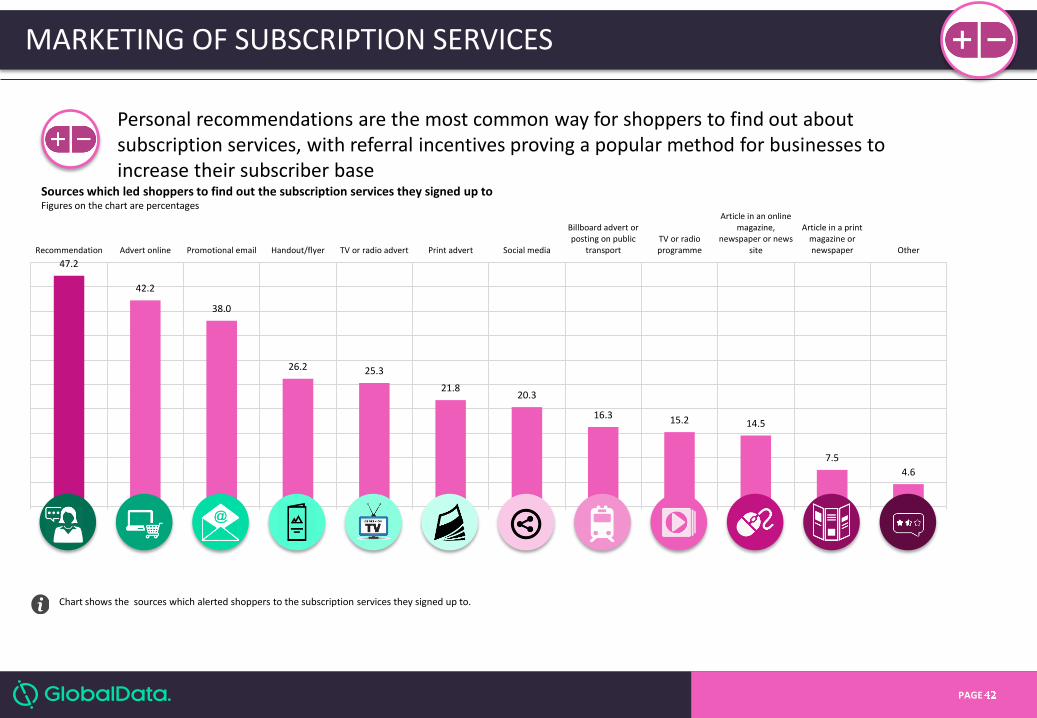
Chart shows the sources which alerted shoppers to the subscription services they signed up to.
Sources which led shoppers to find out the subscription services they signed up to Figures on the chart are percentages
47.2
42.2
38.0
26.2 25.3
21.8 20.3
16.3 15.2 14.5
7.5
4.6
Recommendation Advert online Promotional email Handout/flyer TV or radio advert Print advert Social media
Billboard advert orposting on public
transportTV or radioprogramme
Article in an onlinemagazine,
newspaper or newssite
Article in a printmagazine ornewspaper Other
Personal recommendations are the most common way for shoppers to find out about subscription services, with referral incentives proving a popular method for businesses to increase their subscriber base

PAGEPAGE
LENGTH OF TIME SHOPPERS HAVE BEEN SIGNED UP FOR
Chart shows the average number of months shoppers sign up to each subscription service.
Average number of months shoppers have been signed up to each subscription service for Figures on the chart are number of months
5.6 5.5 5.5 5.3 5.3
4.7 4.6 4.6 4.6 4.6 4.4
4.1
All SubscriptionBoxes
Books, Magazines &Entertainment
Teens, Children,Babies & Parenting Petcare Box Food & Drink
Other SubscriptionBoxes
Surprise & MysteryGifts Health & Beauty
General Health &Wellbeing Fashion & Jewellery Plants & Flowers
Cards, Stationery,Arts & Crafts
?
On average, shoppers in our survey had been signed up for subscription boxes for less than six months
PAGEPAGE
CANCELLING SUBSCRIPTION SERVICES
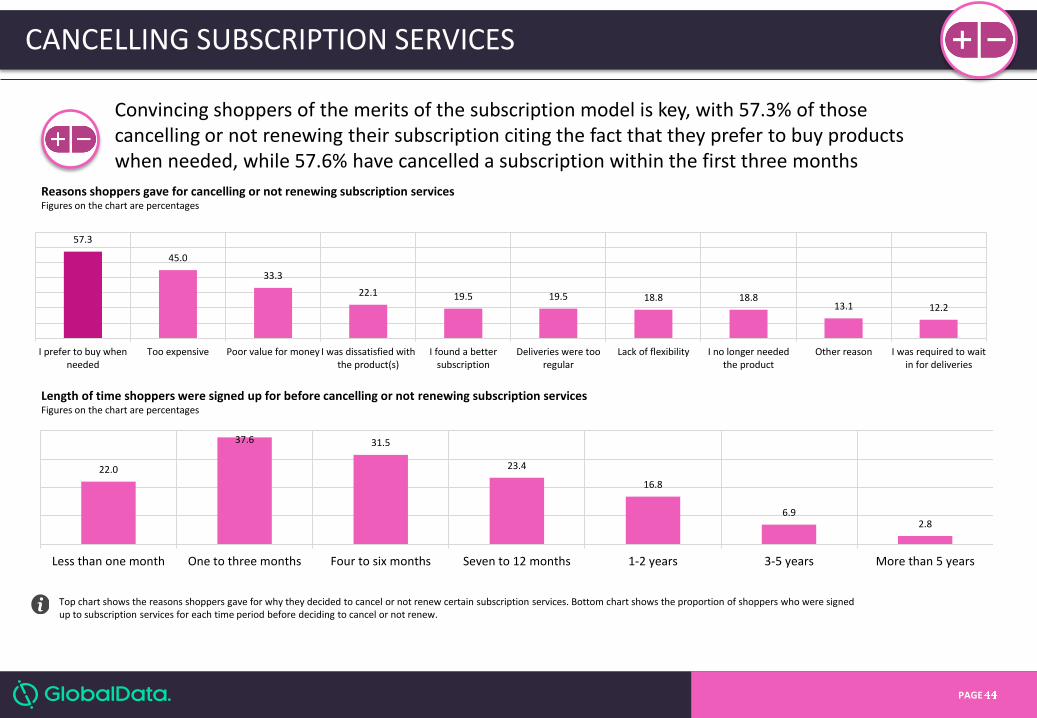
Top chart shows the reasons shoppers gave for why they decided to cancel or not renew certain subscription services. Bottom chart shows the proportion of shoppers who were signed up to subscription services for each time period before deciding to cancel or not renew.
Reasons shoppers gave for cancelling or not renewing subscription services Figures on the chart are percentages
57.3
45.0
33.3
22.1 19.5 19.5 18.8 18.8 13.1 12.2
I prefer to buy whenneeded
Too expensive Poor value for money I was dissatisfied withthe product(s)
I found a bettersubscription
Deliveries were tooregular
Lack of flexibility I no longer neededthe product
Other reason I was required to waitin for deliveries
Length of time shoppers were signed up for before cancelling or not renewing subscription services Figures on the chart are percentages
22.0
37.6 31.5
23.4
16.8
6.9 2.8
Less than one month One to three months Four to six months Seven to 12 months 1-2 years 3-5 years More than 5 years
Convincing shoppers of the merits of the subscription model is key, with 57.3% of those cancelling or not renewing their subscription citing the fact that they prefer to buy products when needed, while 57.6% have cancelled a subscription within the first three months

PAGEPAGE
REASONS SHOPPERS DECIDED TO CANCEL SUBSCRIPTIONS
Table above shows the reasons shoppers gave for why they decided to cancel or not renew each type of subscription service.
Reasons shoppers gave for cancelling or not renewing subscription services Figures are percentages
In the majority of cases, shoppers cancel food & drink subscriptions because they prefer to buy when needed
Overall Male Female 18-24 25-34 35-44 45-54 55-64 65+ AB C1 C2 DE
Nothing 61.1 65.1 57.3 19.4 39.4 41.4 63.1 64.8 76.3 67.5 50.6 53.8 65.9
Flexibility to cancel to 19.1 17.8 20.3 59.4 30.7 31.3 15.6 17.2 9.1 13.0 26.4 24.5 17.0
Easy to cancel 15.8 14.2 17.2 28.9 20.1 22.0 17.5 14.6 10.2 12.3 26.0 12.9 14.2
Cheaper products 15.6 13.6 17.4 11.5 22.3 15.6 14.7 19.2 12.8 14.9 22.8 12.8 13.3
Try before I buy 12.4 9.9 14.8 17.9 15.4 14.8 11.8 12.0 10.7 8.2 19.3 13.4 11.5
Ability to change delivery frequency 11.3 9.9 12.6 12.3 14.6 14.4 11.1 13.9 7.7 9.6 15.4 8.6 11.7
Clear what comes in each delivery 10.7 10.3 11.1 20.7 11.5 14.9 8.1 11.5 8.6 10.0 15.7 7.9 9.9
Confidence in product quality 9.1 8.3 9.9 7.8 11.1 12.7 10.5 7.7 7.6 7.3 13.7 7.7 8.7
Brands I have heard of and buy 7.8 7.1 8.5 12.3 10.3 10.5 3.8 8.9 7.3 8.6 9.2 7.1 6.7
Unique products 7.7 6.5 8.8 8.4 6.9 15.3 8.1 5.0 6.3 5.8 11.1 7.9 7.1
Ability to get products dellivered when I'm out 6.8 5.1 8.4 12.6 9.6 13.5 4.2 8.9 3.3 4.4 10.8 8.2 5.8
Financial incentive 5.7 4.8 6.6 22.5 2.8 9.7 7.4 2.3 3.6 3.2 13.2 2.9 5.1
Good reviews 5.0 4.4 5.7 28.2 9.0 3.6 4.4 2.5 3.0 4.0 7.1 4.5 5.0
Recommendations 3.8 3.8 3.8 12.7 3.2 2.8 4.0 4.8 2.4 4.0 8.1 0.8 2.8
Average Food & drink
Health & Beauty
Fashion & jewellery
Petcare Box General Health &
Wellbeing
Cards, stationery,
arts & crafts
Teens, children, babies & parenting
Plants & flowers
Books, magazines
& entertainm
ent
Surprise & mystery
gifts
Other Subscription
Boxes
I prefer to buy when needed 37.5 52.3 39.8 33.5 11.9 59.0 40.9 17.6 52.6 42.4 40.9 21.6
Too expensive 31.4 34.6 36.7 26.4 39.3 37.6 34.9 28.2 29.7 26.0 10.2 41.5
Poor value for money 28.0 26.8 23.9 24.5 16.1 31.2 23.9 29.6 36.8 17.7 52.9 24.5
I found a better subscription 17.6 15.2 11.2 14.7 7.1 8.3 5.3 24.3 42.3 13.9 37.3 14.1
I no longer needed the product 16.0 10.9 16.0 18.6 10.4 12.7 22.9 20.6 11.7 20.1 12.0 20.4
I was dissatisfied with the product(s)
16.0 17.7 12.0 21.8 29.3 12.7 15.2 14.3 5.5 12.8 22.2 12.9
Lack of flexibility 13.4 13.4 15.9 21.1 0.0 21.2 17.1 18.6 9.9 12.3 0.0 18.1
Deliveries were too regular 12.9 17.1 11.7 13.4 6.2 32.7 10.9 6.3 24.0 10.3 0.0 8.8
I was required to wait in for deliveries
10.2 6.7 10.6 18.6 0.0 0.0 14.0 10.9 18.1 7.6 12.0 14.0
Other reason 9.0 6.6 16.1 8.0 0.0 8.3 16.5 4.4 10.2 13.2 12.0 4.3
Highest value Above average Average Below average Lowest value

PAGEPAGE
BARRIERS AND FACTORS WHICH COULD OVERCOME THEM
Top chart shows reasons shoppers gave for why they have never signed up to a subscription service. Bottom chart shows the factors which could persuade these shoppers to consider signing up to subscription services.
Barriers to using subscription box services Figures on the chart are percentages
58.1 49.6
41.2 40.0 37.9 37.7
18.9 16.8 10.1 10.0 6.5 5.6 2.7
Don’t like being locked in to
recurring deliveries
Don’t need to receive these
items regularly
Have no needfor any of these
services
I enjoy shopping for things myself and don’t want
someone to do it for me
Don’t see the point
Waste of money Like to knowwhat I will be
receiving
Don't knowanyone who has
subscribed
Concernedabout quality
Would not bearound to take
delivery
I forget to cancelsubscriptions
Not heard of anysubscription
brands
Other – please specify
Factors which could persuade non-shoppers to sign up to subscription box services Figures on the chart are percentages
61.1
19.1 15.8 15.6 12.4 11.3 10.7 9.1 7.8 7.7 6.8 5.7 5.0 3.8
Nothing Flexibility tocancel
Easy to cancel Get productsmore cheaply
Ability to trysample before
signing up
Ability to changedelivery
frequency
Clear beforehandwhat I would be
receiving
Certainty aboutquality
Brands I haveheard of andcurrently buy
Products notavailable
anywhere else
Delivery withouthaving to wait in
an home
Financialincentive
Good reviews Recommendation
Being locked into regular deliveries is a key factor putting off many shoppers, making it key that retailers provide easy and flexible opportunities for cancellation

PAGEPAGE
FACTORS WHICH COULD ENCOURAGE NON-SHOPPERS TO SIGN UP
Table shows the reasons shoppers in each demographic group gave for why they have never signed up to a subscription service.
Factors which could persuade shoppers to consider signing up to subscription services Figures are percentages
While many shoppers in the 45+ age group are resistant to the idea of subscription services, there is potential to convert younger shoppers, though they need to see that it is easy for them to opt out
Overall Male Female 18-24 25-34 35-44 45-54 55-64 65+ AB C1 C2 DE
Nothing 61.1 65.1 57.3 19.4 39.4 41.4 63.1 64.8 76.3 67.5 50.6 53.8 65.9
Flexibility to cancel 19.1 17.8 20.3 59.4 30.7 31.3 15.6 17.2 9.1 13.0 26.4 24.5 17.0
Easy to cancel 15.8 14.2 17.2 28.9 20.1 22.0 17.5 14.6 10.2 12.3 26.0 12.9 14.2
Cheaper products 15.6 13.6 17.4 11.5 22.3 15.6 14.7 19.2 12.8 14.9 22.8 12.8 13.3
Try before I buy 12.4 9.9 14.8 17.9 15.4 14.8 11.8 12.0 10.7 8.2 19.3 13.4 11.5
Ability to change delivery frequency 11.3 9.9 12.6 12.3 14.6 14.4 11.1 13.9 7.7 9.6 15.4 8.6 11.7
Clear what comes in each delivery 10.7 10.3 11.1 20.7 11.5 14.9 8.1 11.5 8.6 10.0 15.7 7.9 9.9
Confidence in product quality 9.1 8.3 9.9 7.8 11.1 12.7 10.5 7.7 7.6 7.3 13.7 7.7 8.7
Brands I have heard of and buy 7.8 7.1 8.5 12.3 10.3 10.5 3.8 8.9 7.3 8.6 9.2 7.1 6.7
Unique products 7.7 6.5 8.8 8.4 6.9 15.3 8.1 5.0 6.3 5.8 11.1 7.9 7.1
Ability to get products dellivered when I'm out 6.8 5.1 8.4 12.6 9.6 13.5 4.2 8.9 3.3 4.4 10.8 8.2 5.8
Financial incentive 5.7 4.8 6.6 22.5 2.8 9.7 7.4 2.3 3.6 3.2 13.2 2.9 5.1
Good reviews 5.0 4.4 5.7 28.2 9.0 3.6 4.4 2.5 3.0 4.0 7.1 4.5 5.0
Recommendations 3.8 3.8 3.8 12.7 3.2 2.8 4.0 4.8 2.4 4.0 8.1 0.8 2.8
Highest value Above average Average Below average Lowest value

PAGE
Section 2.3 The consumer: delivery In this section, we look at the key issues when it comes to the delivery of subscriptions
PAGEPAGE
KEY CONSIDERATIONS FOR SUBSCRIPTION SERVICES
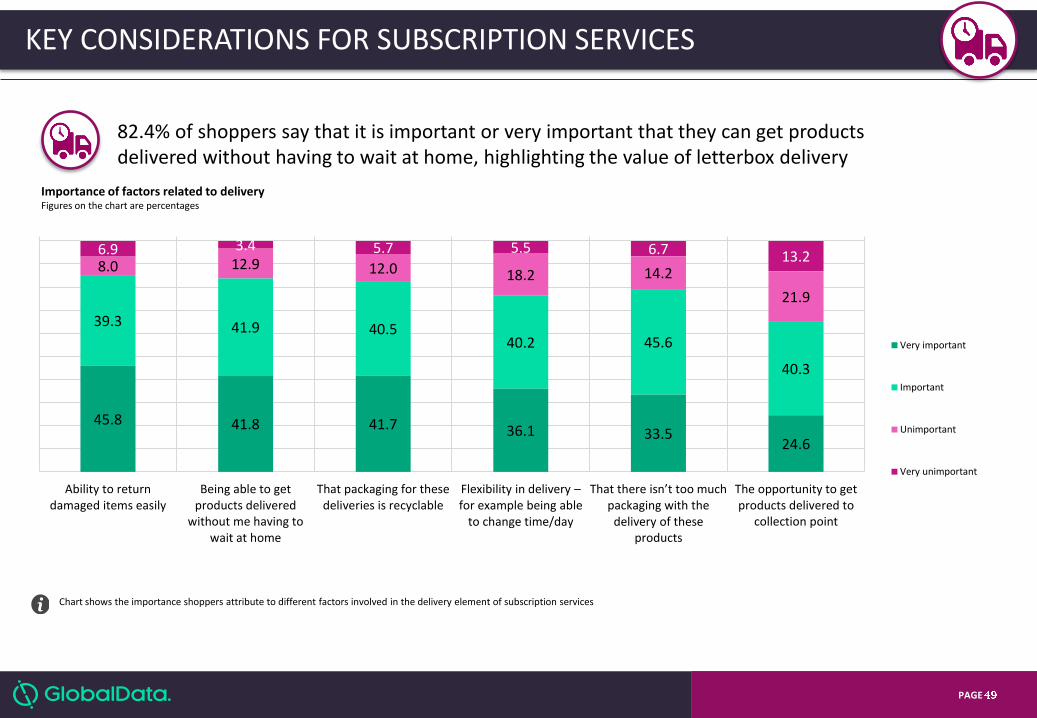
Chart shows the importance shoppers attribute to different factors involved in the delivery element of subscription services
Importance of factors related to delivery Figures on the chart are percentages
6.9 3.4 5.7 5.5 6.7 13.2 8.0 12.9 12.0 18.2 14.2
21.9
39.3 41.9 40.5 40.2 45.6
40.3
45.8 41.8 41.7 36.1 33.5 24.6
Ability to returndamaged items easily
Being able to getproducts delivered
without me having towait at home
That packaging for thesedeliveries is recyclable
Flexibility in delivery – for example being able
to change time/day
That there isn’t too much packaging with the
delivery of these products
The opportunity to getproducts delivered to
collection point
Very important
Important
Unimportant
Very unimportant
82.4% of shoppers say that it is important or very important that they can get products delivered without having to wait at home, highlighting the value of letterbox delivery

PAGEPAGE
SATISFACTION WITH SUBSCRIPTION SERVICES
Charts shows how satisfied shoppers are with different elements of the subscription services they are signed up to.
Shopper satisfaction with different elements of subscription services Figures on the chart are percentages
6.3 4.2 3.7 4.6 4.9
8.5 9.3 10.0 10.6 13.6
38.8 43.5 45.2 48.7
47.8
46.5 43.0 41.2 36.1 33.7
Quality Convenience Variety Uniqueness Price
Very satisfied
Satisfied
Unsatisfied
Very unsatisfied
Shoppers are generally satisfied with the services they get as part of their subscriptions, but price does offer some room for improvement
PAGEPAGE
DELIVERY METHOD
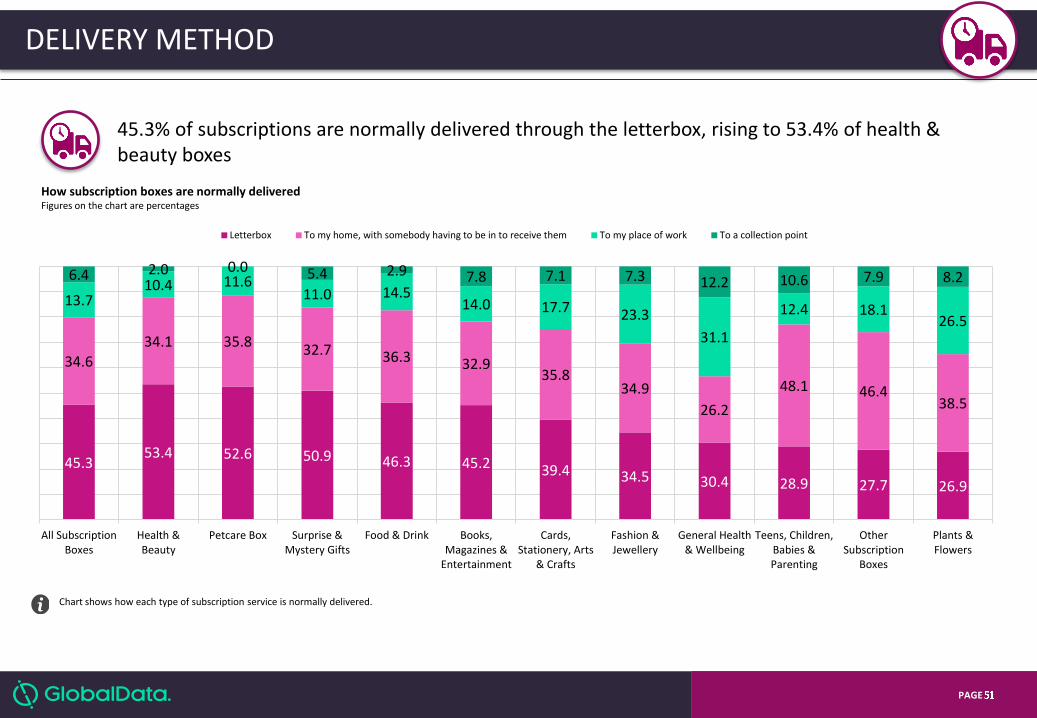
Chart shows how each type of subscription service is normally delivered.
How subscription boxes are normally delivered Figures on the chart are percentages
45.3 53.4 52.6 50.9 46.3 45.2 39.4 34.5 30.4 28.9 27.7 26.9
34.6
34.1 35.8 32.7 36.3 32.9
35.8 34.9
26.2
48.1 46.4 38.5
13.7 10.4 11.6
11.0 14.5 14.0 17.7 23.3
31.1
12.4 18.1 26.5
6.4 2.0 0.0 5.4 2.9 7.8 7.1 7.3 12.2 10.6 7.9 8.2
All SubscriptionBoxes
Health &Beauty
Petcare Box Surprise &Mystery Gifts
Food & Drink Books,Magazines &
Entertainment
Cards,Stationery, Arts
& Crafts
Fashion &Jewellery
General Health& Wellbeing
Teens, Children,Babies &Parenting
OtherSubscription
Boxes
Plants &Flowers
Letterbox To my home, with somebody having to be in to receive them To my place of work To a collection point
45.3% of subscriptions are normally delivered through the letterbox, rising to 53.4% of health & beauty boxes

PAGEPAGE
PREFERRED DELIVERY METHOD
Charts shows preferred delivery method for subscription boxes, by category.
Preferred delivery method for subscription boxes Figures on the chart are percentages
46.7 55.3 54.0 51.1 50.4 46.7
39.1 38.1 36.3 36.1 35.7 35.4
32.6
36.9 31.5 32.1 32.1 34.5 45.3
32.1 36.6 34.3 40.2 41.6
14.2 2.6 11.3 12.6 12.3 13.0
15.6
20.2 9.8 22.3 16.7 19.8
6.5 5.3 3.2 4.2 5.2 5.8 0.0 9.6
17.3 7.3 7.4 3.3
All SubscriptionBoxes
Surprise &Mystery Gifts
Books,Magazines &
Entertainment
Health &Beauty
Petcare Box Food & Drink Plants &Flowers
OtherSubscription
Boxes
General Health& Wellbeing
Cards,Stationery, Arts
& Crafts
Teens, Children,Babies &Parenting
Fashion &Jewellery
Letterbox To my home, with somebody having to be in to receive them To my place of work To a collection point
Just under half (46.7%) of shoppers would prefer to have letterbox delivery

PAGEPAGE
FREQUENCY OF DELIVERY
Charts show the frequency with which each type of subscription box is delivered.
Frequency of delivery Figures on the chart are percentages
32.7 45.7 42.0 41.8 41.5
33.6 32.8 31.9 29.4 29.3 28.4 21.7
46.4
46.7
29.2 44.1 43.8
50.2 58.8
46.7 51.6 47.9 51.0 64.4
15.1
7.6
18.6
12.2 10.4 14.0 8.4
16.2 16.0 21.6 10.8
8.2 5.8 0.0
10.2 1.8 4.4 2.1 0.0 5.2 2.9 1.1
9.7 5.7
All SubscriptionBoxes
Plants &Flowers
Fashion &Jewellery
Teens, Children,Babies &Parenting
Food & Drink Books,Magazines &
Entertainment
Petcare Box Cards,Stationery, Arts
& Crafts
Health & Beauty OtherSubscription
Boxes
General Health& Wellbeing
Surprise &Mystery Gifts
Once a week or more Once or twice a month Four to six times a year Fewer than four times a year
Just under a third of subscription boxes are delivered once a week or more

PAGE
Section 2.4 The consumer: future intentions
In this section, we look at shoppers’ future intentions when it comes to the use of subscriptions

PAGEPAGEPAGE
Chart shows whether shoppers intend to change their use of subscription services in the future.
More than three-quarters of shoppers are set to either maintain or increase their use of subscription services in the future, with 56.7% of 25-34 year olds planning to join more subscription schemes in the future
FUTURE INTENTIONS TO USE SUBSCRIPTION SCHEMES
Intentions to use subscription services in the future Figures on the chart are percentages
39.2 42.4 35.4 36.5
56.7
33.3 28.0
22.7 16.5
46.0 36.9 39.2
32.2
43.8 43.8
43.7 45.8
31.7
44.9 55.0 61.2
56.8
41.9
43.2 42.9 49.8
17.0 13.8 20.9 17.7
11.6 21.8 17.0 16.1
26.6
12.1 19.9 18.0 18.0
Total Male Female 18-24 25-34 35-44 45-54 55-64 65+ AB C1 C2 DE
It is likely that I will reduce the number of subscription schemes that I am signed up to
It is likely that I will be signed up to a similar number of subscription schemes as I am at the moment
It is likely I will join more subscription schemes
PAGEPAGEPAGE
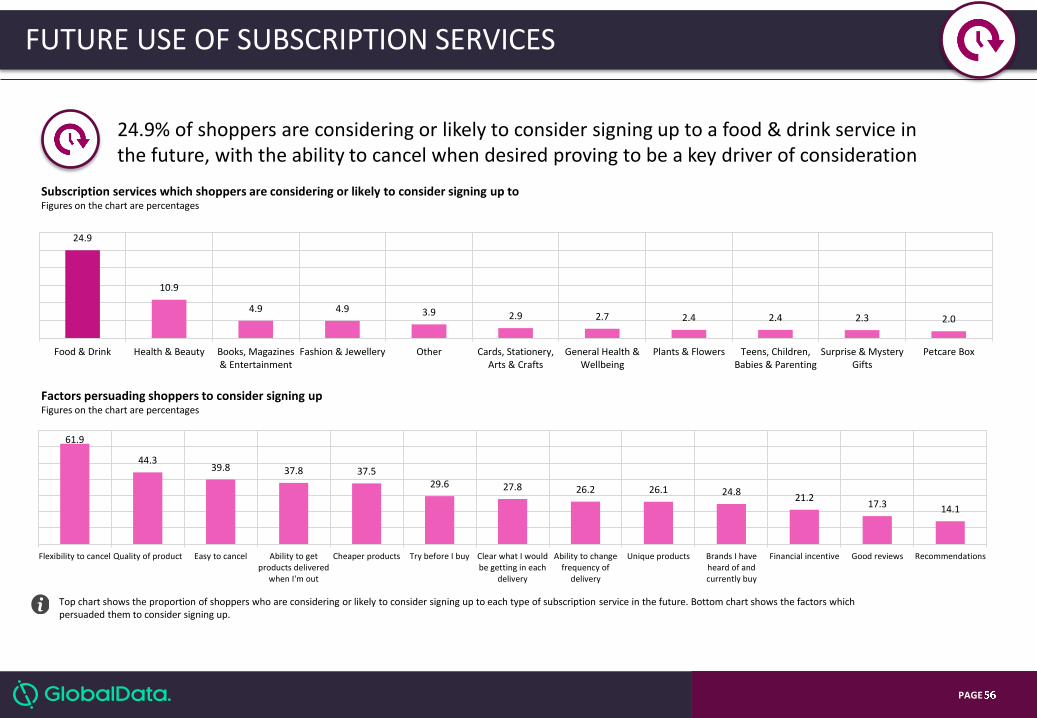
FUTURE USE OF SUBSCRIPTION SERVICES
Top chart shows the proportion of shoppers who are considering or likely to consider signing up to each type of subscription service in the future. Bottom chart shows the factors which persuaded them to consider signing up.
Subscription services which shoppers are considering or likely to consider signing up to Figures on the chart are percentages
24.9
10.9
4.9 4.9 3.9 2.9 2.7 2.4 2.4 2.3 2.0
Food & Drink Health & Beauty Books, Magazines& Entertainment
Fashion & Jewellery Other Cards, Stationery,Arts & Crafts
General Health &Wellbeing
Plants & Flowers Teens, Children,Babies & Parenting
Surprise & MysteryGifts
Petcare Box
Factors persuading shoppers to consider signing up Figures on the chart are percentages
61.9
44.3 39.8 37.8 37.5
29.6 27.8 26.2 26.1 24.8 21.2
17.3 14.1
Flexibility to cancel Quality of product Easy to cancel Ability to getproducts delivered
when I'm out
Cheaper products Try before I buy Clear what I wouldbe getting in each
delivery
Ability to changefrequency of
delivery
Unique products Brands I haveheard of andcurrently buy
Financial incentive Good reviews Recommendations
24.9% of shoppers are considering or likely to consider signing up to a food & drink service in the future, with the ability to cancel when desired proving to be a key driver of consideration

PAGEPAGEPAGE
FACTORS ENCOURAGING SHOPPERS TO CONSIDER SIGNING UP
Table shows the factors which have persuaded shoppers in each demographic group to consider signing up to subscription services.
Factors which have persuaded shoppers to consider signing up to subscription services Figures on the chart are percentages
Flexibility to cancel is the key factor that would encourage shoppers to sign up to more subscription schemes
Overall Male Female 18-24 25-34 35-44 45-54 55-64 65+ AB C1 C2 DE
Flexibility to cancel 61.9 56.5 67.3 59.2 60.4 52.1 76.5 62.4 70.5 60.5 63.5 58.1 66.5
Quality of product 44.3 34.9 53.6 52.5 35.1 38.0 48.5 56.1 47.6 42.4 47.0 39.9 48.3
Easy to cancel 39.8 33.0 46.5 35.9 34.5 29.5 51.7 49.9 61.7 41.4 41.0 30.2 49.8
Ability to get products delivered when I'm out 37.8 33.9 41.6 44.0 36.2 41.3 34.8 35.1 24.8 39.3 39.0 35.6 36.2
Cheaper products 37.5 31.2 43.8 47.8 28.1 33.3 35.5 42.2 48.1 29.6 40.7 36.4 44.4
Try before I buy 29.6 20.6 38.5 35.9 20.1 22.3 37.6 35.6 40.5 22.5 27.5 28.8 46.3
Clear what I would be getting in each delivery 27.8 23.3 32.3 26.8 22.9 22.0 32.3 46.3 35.2 24.7 30.7 24.7 31.3
Ability to change frequency of delivery 26.2 21.0 31.4 30.4 19.3 25.2 29.4 30.7 30.8 23.7 25.2 27.0 31.4
Unique products 26.1 22.8 29.4 40.1 22.3 18.4 23.8 31.7 14.0 19.5 30.2 25.5 28.4
Brands I have heard of and currently buy 24.8 24.6 25.1 36.6 21.5 23.1 9.2 29.0 29.1 20.5 26.0 26.1 27.1
Financial incentive 21.2 15.2 27.1 28.6 18.0 17.7 21.5 15.7 22.5 17.3 22.8 17.0 30.3
Good reviews 17.3 11.4 23.2 26.1 11.9 12.5 15.3 18.9 22.8 15.9 16.8 17.4 20.4
Recommendations 14.1 12.0 16.3 18.7 9.1 13.8 18.5 17.8 8.1 14.5 16.4 13.1 10.2
Highest value Above average Average Below average Lowest value

PAGE
Section 3 Retailer dynamics In this section, we look at the retailer perspective on key issues, trends, drivers and barriers in the subscription market

PAGEPAGE
SUMMARY
Driving greater brand loyalty is a key motivating factor behind the launch of many subscription schemes – cited by 44.8% of those operating such a service. Successive years of wage squeezes and an increasingly competitive retail environment have fostered the growth of more selective consumers, making it more challenging for retailers to rely on loyal customers. This in turn, has encouraged retailers to be more creative when it comes to generating loyalty, leading to ever more innovative loyalty schemes. In this regard, subscription offers an enticing option to lock consumers in to regular purchasing. Other important reasons for starting a subscription box service include the desire for greater control, in particular control of distribution (34.5%), control of marketing and promotion (24.1%) and lower start-up costs (24.1%).
1. DRIVING GREATER BRAND LOYALTY IS KEY
Linked to the desire to drive greater loyalty, retaining customers is seen as one of the key challenges associated with operating a subscription box scheme (20.7%). This is brought into sharp focus when looking at the average amount of time shoppers stay signed up to subscription services, with the average retention rate of 58.6% of the businesses in our survey being three months or less and only 10.3% retaining customers for an average of one year or more. On a more positive note, subscription box businesses tend to see a return on investment relatively quickly, with 62.1% achieving this within three months of a customer being signed up to a service. Allied to this, sourcing exciting, new and/or innovative products is inevitably a key part of ensuring customers remain interested and engaged. Sourcing new and exciting products and sourcing unique products were mentioned as key challenges by 20.7% of businesses.
2. SOURCING AND CUSTOMER RETENTION ARE THE MOST COMMONLY CITED CHALLENGES
89.7% of businesses in our survey make at least some of their subscription revenue from outside the UK and over a fifth (23.8%) make more than half of sales from abroad. Sustained low growth in UK retail sales and the growing attractiveness of UK prices thanks to the weakness of sterling, is making international expansion opportunities increasingly appealing. With relatively low start-up costs, subscription boxes are clearly an attractive option for businesses targeting markets overseas. Popular overseas markets include the Republic of Ireland and France - where 46.2% of subscription businesses which sell overseas make at least some of their sales – as well as Germany (38.5%) and Spain (30.5%).
3. SUBSCRIPTION RETAIL OFFERS SIGNIFICANT OPPORTUNITIES FOR INTERNATIONAL EXPANSION

PAGEPAGE
SUMMARY
Perhaps spurred on by growing competition (with 75.9% agreeing that the subscription box market is becoming highly competitive), 58.6% of subscription box businesses intend to invest in new or existing subscription services in the next 12 months and 72.4% intend to add new products to their service. Positively in terms of the likely longevity of this type of business model, 51.7% agree that subscription is set to be a major focus of their company in the future, though 44.8% admit to concerns that larger retailers/brands will invest more strongly in this segment of the market.
5. SUBSCRIPTION BOX BUSINESSES PLANNING FUTURE INVESTMENTS, BUT CONCEDE THE MARKET IS BECOMING HIGHLY COMPETITIVE
Perhaps influenced by the difficulties subscription box businesses have had in terms of customer retention and the increasingly competitive nature of the market, just over a fifth (20.8%) of businesses not currently operating a subscription box mentioned the lack of long term opportunities as a reason why they have not entered the market.
6. SCEPTICISM OVER THE LONG TERM OPPORTUNITY REPRESENTS A BARRIER TO BUSINESSES LAUNCHING SUBSCRIPTION SERVICES
72.3% of businesses offering a subscription service said that the cost of the service is an important factor when dealing with delivery and fulfilment partners and the vast majority of businesses (82.8%) are either satisfied or very satisfied with the cost of the service they receive. When it comes to satisfaction with services, punctuality (in terms of delivery speed) and customer service (between the business and the fulfilment partner) offer room for improvement, with 24.1% of businesses reporting that they are unsatisfied with the service they receive in these areas. Overall, in spite of generally high levels of satisfaction with the service provided to them, 51.7% of businesses believe that delivery and fulfilment could do more to improve the services offered to them.
4. WHEN IT COMES TO DELIVERY PARTNERS, COST IS KEY

PAGEPAGE
DECLINING SHARE REASONS FOR LAUNCHING
DECLINING SHARE
KEY CHALLENGES DECLINING
SHARE BARRIERS
Drive greater brand loyalty 44.8
Control of distribution 34.5
Lower start-up costs 24.1
Control of marketing and promotion 24.1
We believe subscriptions to be a good retail model 13.8
Rising consumer demand for subscription schemes 13.8
Barriers to selling via other means were higher 10.3
Unique product that lends itself to subscriptions 10.3
Fewer competitors in the subscription market for the products we sell
10.3
Good model to establish a consistent revenue stream 10.3
Lower operational costs 6.9
Our products lend themselves strongly to gifting in the form of subscriptions
6.9
Responding to competitors 3.4
Other 3.4
Sourcing new and exciting products 20.7
Sourcing unique products 20.7
Customer retention 20.7
Customer acquisition 17.2
The fickleness of shoppers 17.2
Getting the price right 17.2
Keeping up with demand 17.2
Staying on top of the schedule of operations 17.2
Growing/scaling up the business 17.2
Reliance on own marketing 13.8
Finding a reliable delivery partner 13.8
Managing relationships with delivery partners 13.8
Maintaining high levels of customer service 13.8
Dealing with problems/complaints 13.8
Staying competitive on price 13.8
Ensuring that we remain front-of-mind among consumers 13.8
Ease of entry of competitors 10.3
High reliance on delivery partners 10.3
Danger that larger brands invest more strongly in this market
10.3
Finding a delivery partner which offers a high standard of service for a reasonable price
6.9
Managing sourcing costs 6.9
Greater exposure to own distribution operations 6.9
Growing competition 6.9
Other companies replicating our niche 6.9
My company is focussed on other areas of priority 25.0
I just don’t think that subscriptions offer strong long term opportunities
20.8
My company’s products don’t lend themselves well to subscription services
16.7
I just don’t think subscriptions are a good retail/distribution model
8.3
We don’t currently have the right systems in place to operate a subscription scheme
8.3
Other 8.3
Such services have too high a reliance on effectiveness of own marketing and promotion
4.2
The subscription market for the products my company sells is already crowded
4.2
There is too much reliance on the efficiency of delivery partners
4.2
There is growing competition in the subscription market 4.2
None of the above 29.2
SUMMARY

PAGEPAGE
Top chart shows the average number of months shoppers stay signed up for.
Average number of months shoppers stay signed up for Figures on the chart are percentages
24.1
34.5
13.8 17.2
6.9
0 3.4
27.6
34.5
13.8 17.2
3.4 3.4 0
Less than one month One to three months Four to six months Seven to 12 months 1-2 years 3-5 years More than 5 years
Average time shoppers sign up for Average time to see ROI
Average number of months consumers stay signed up for Figures on the chart are months
6.0
12.0 8.0 7.0
4.6 4.5 4.0 4.0 3.8 2.8 2.5 2.0
Allsubscription
boxes
Fashion &Jewellery
Health &Beauty
Food & Drink Plants &Flowers
GeneralHealth &
Wellbeing
Surprise &Mystery Gifts
OtherSubscription
Boxes
Teens,Children,Babies &Parenting
Books,Magazines &
Entertainment
Cards,Stationery,
Arts & Crafts
Petcare Box
CUSTOMER RETENTION
58.6% of businesses retain customers for an average of three months or less

PAGEPAGE
SELLING OVERSEAS
Top chart shows the proportion of sales made abroad among B2B respondents. The bottom chart shows the proportion of B2B respondents that sell in each country, among those that said that they make sales abroad.
Proportion of sales made abroad Figures on the chart are percentages
10.3
44.7
17.1
3.4
10.2 13.6
0% 1-10% 11-25% 26-50% 51-75% 76-100%
Countries subscription boxes are delivered to (of those companies which make at least some sales abroad) Figures on the chart are percentages
46.2 46.2 38.5
30.8
23.1 19.2 19.2
15.4 11.5
7.7 7.7 7.7 7.7 3.8
Republic ofIreland
France Germany Spain Elsewherein Europe
Netherlands Italty Portugal Sweden Belgium Norway Denmark Outside ofEurope
Poland
Almost 90% of businesses make at least some of their sales outside of the UK

PAGEPAGE
DELIVERY METHOD
Top chart shows the proportion of B2B respondents that use different types of delivery methods. The chart below shows the reasons why these delivery methods are used.
Delivery method normally used Figures on the chart are percentages
65.5
31.0
3.4
Letterbox delivery Standard signed-for/received delivery Other – please specify
Reasons for using each delivery method Figures on the chart are percentages
84.2
44.4 47.4 44.4
5.3
55.6
Letterbox Signed for/received delivery
Because it is cheaper to deliver this way
Because this is the most convenient for our customers
Because the size of the items we are delivering means that it makesmore sense to deliver this way
The lower cost of letterbox delivery makes it attractive to subscription box companies

PAGEPAGE
KEY CONSIDERATIONS REGARDING DELIVERY PARTNERS
Chart above shows total agreement (i.e. the total percentage of shoppers who say that they either agree or strongly agree with each statement), split by demographics.
Which factors are important when it comes to delivery/fulfilment partners Figures on the chart are months
72.4
44.8 41.4
34.5 31.0
17.2
6.9 4.0
Cost of service to mycompany
Punctuality of the service offered – in terms of
delivery speed
Effectiveness of service offered – items are
delivered on time and in good condition
Ability to scale up/downand deal with peaks andtroughs in order volumes
Reliability – i.e. that they deliver as promised
Customer service (for theend consumer)
Customer service (betweenour business and the
delivery/fulfilment partner)
Other – please specify
Cost is the key consideration when it comes to delivery partners

PAGEPAGE
SATISFACTION WITH DELIVERY PARTNERS
Chart shows satisfaction with different elements of relationships with delivery partners.
Satisfaction with delivery/fulfilment partners Figures on the chart are percentages
6.9 10.3 6.9 0.0 0.0 0.0 10.3 10.3 6.9 10.3
17.2 20.7 24.1 13.8
48.3
69.0 69.0 58.6 55.2
55.2 55.2
34.5
13.8 13.8 24.1 24.1 20.7 20.7
Reliability – i.e. that they deliver as
promised
Cost of service to mycompany
Ability to scaleup/down and deal
with peaks andtroughs in order
volume
Customer service(B2C)
Effectiveness of service offered –
items are delivered on time and in good
condition
Punctuality of the service offered – in
terms of delivery speed
Customer service(B2B)
Very satisfied
Satisfied
Unsatisfied
Very unsatisfied
Satisfaction is highest with reliability, with customer service (B2B) and punctuality offering room for improvement

PAGEPAGE
BARRIERS TO LAUNCHING A SUBSCRIPTION SERVICE
Charts above show total agreement (i.e. the total percentage of shoppers who say that they either agree or strongly agree with each statement), split by demographics.
Barriers to launching a subscription service Figures on the chart are percentages
25.0
20.8
16.7
8.3 8.3 8.3
4.2 4.2 4.2 4.2
29.2
My company isfocussed on otherareas of priority
I just don’t think that subscription offers strong long
terms opportunities
My company’s products don’t lend themselves well to
subscription services
I just don’t think subscriptions are a
good retail/distribution
model
We don’t currently have the right
systems in place to operate a
subscription scheme
Other Such services havetoo high a relianceon effectiveness ofown marketing and
promotion
The subscriptionmarket for theproducts my
company sells isalready crowded
There is too muchreliance on the
efficiency ofdelivery partners
There is growingcompetition in the
subscription market
None of the above
Focussing on other areas is the number one reason businesses are not planning to launch a subscription service

PAGEPAGE
VIEWS ON SUBSCRIPTION MARKET AND FUTURE PLANS
Chart shows agreement of various statements in relation to the subscription market.
Views on the subscription market Figures on the chart are percentages
75.9 72.4 58.6 58.6 51.7 51.7 44.8 44.8 41.4
24.1 24.1 37.9 34.5 48.3 41.4 51.7 55.2
48.3
0.0 3.4 3.4 6.9 0.0 6.9 3.4 0.0 10.3
The subscription marketis becoming highly
competitive
Intend to add newproducts to my
subscription service inthe next 12 months
Intend to invest in anew or existing
subscription service inthe next 12 months
Subscription serviceswill be a key driver for
growth for my companyin the next 12 months
Delivery providers coulddo more to improve the
services offered
Subscription delivery isset to be a major focusfor my company in the
future
Subscription servicesare likely to continue to
grow in importance
There is a danger thatlarger brands investmore strongly in this
market
Subscriptions are a goodway for a start up to
enter a market
AGREE NEITHER AGREE NOR DISAGREE DISAGREE
Subscription box businesses planning future investments, but concede the market is becoming highly competitive

PAGE
How the market is sized, researched, and its components
Methodology
PAGEPAGE
DEFINITION
DEFINITION OF THE SUBSCRIPTION BOX MARKET A subscription box is a recurring, physical delivery of products packaged as an experience and designed to offer additional value on top of the actual retail products contained in the box, such as through surprise, a saving on what is on offer in the shops, or by giving the user a chance to experiment with a tailored selection of products.
PAGEPAGE
DETAILS OF PRIMARY RESEARCH
CONSUMER SURVEY WORK – BASIC METHODOLOGY GlobalData undertook a bespoke, nationally-representative consumer survey of 2,000 consumers to understand penetration, attitudes and shopping habits in the subscription retail market. B2B SURVEY WORK – BASIC METHODOLOGY Separately, GlobalData also surveyed 53 businesses across the retail and healthcare sectors to understand more about their experience of and attitudes towards operating subscription retail services.

PAGEPAGE
OUR APPROACH TO MARKET SIZING
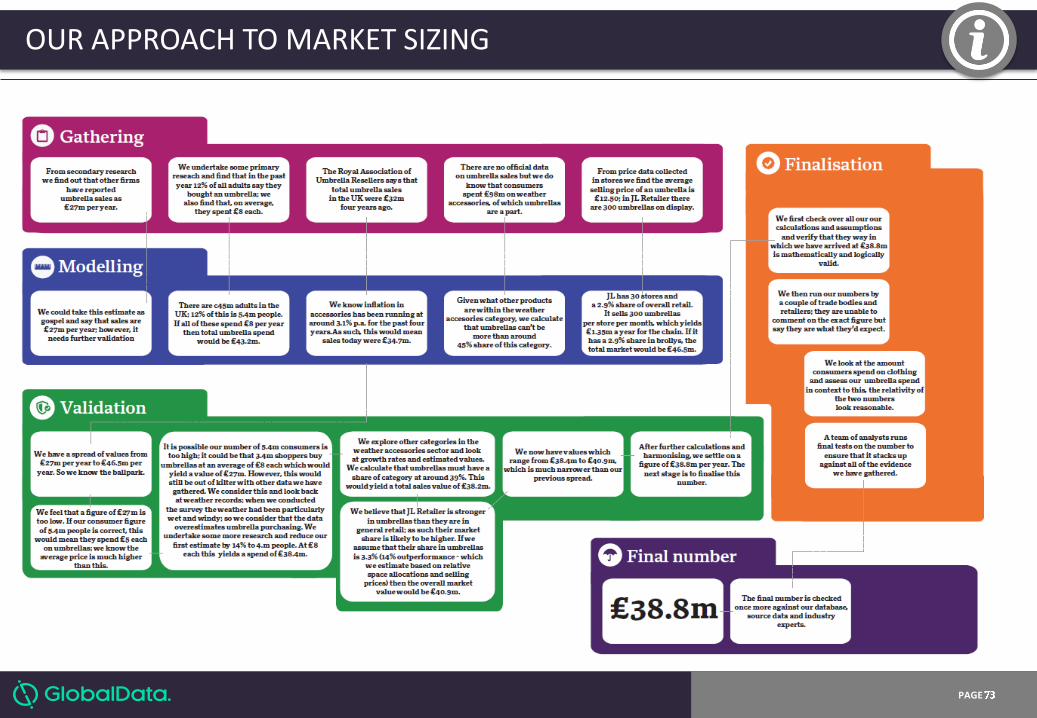
PAGEPAGE
OUR APPROACH TO MARKET SIZING

GlobalData Retail 7 Carmelite Street, London, EC4Y 0BS Phone: 020 7936 6400
Email: [email protected] Web: www.globaldata.com Twitter: @retail_GD
Boston: 179 South Street, Boston, MA 02111 San Francisco: 425 California Street, San Francisco, CA 94104 Washington DC: 21335 Signal Hill Plaza, Suite 200, Sterling, VA, 20164 Toronto: 229 Yonge Street, Suite 400, Toronto, Ontario, M55B 1N9 Mexico City: Mote Pelvoux 111-2 Piso, Lomas de Chapultepec, Mexico D.F, 11000 Buenos Aires: Basavibaso 1328, 2nd Floor, Off 206, Buenos Aires, 1006 London: 7 Carmelite Street, London, EC4Y 0BS Madrid: C/Jesusa Lara, 29 – Atico J, 28250 Torrelodones, Madrid Sydney: Level 2, 63 York Street, Sydney NSW 2000, Australia Melbourne: Suite 1608, Exchange Tower, 530 Little Collins Street, Melbourne 3000, Victoria Tokyo: Level 3, Sanno Park Tower, 2-11-1 Nagata-cho,Chiyoda-ku, Tokyo, 100-6162 Hong Kong: 1008 Shalin Galleria, 18-24 Shan Mei Street, Fo Tan, New Territories, Hong Kong SAR Beijing: Room 2301 Building 4, Wanda Plaza, No 93 Jianguo Road, Chaoyang District, Bejing 100026 Shanghai: Jing'an China Tower, No: 1701, West Beijing Road, Jing'an District, 200040, Shanghai Seoul: 11th Floor, West Wing, POSCO Center Building, 892, Daechi-4Dong, Gangnam-Gu, Seoul 135-777 Hyderabad: 2nd Floor, NSL Centrum, Plot No-S1, Phase 1 & 2, KPHB Colony, Hyderabad-500072 Dubai: Dubai Media City, Building 7, Floor 3, Office 308, PO Box 502635, Dubai


![MTEC a member of NSTDA · [1] GlobalData market studies. "Hip and knee implants - Global pipeline analysis, opportunity assessment and market forecasts to 2016. " GlobalData publisher,](https://img.pdfslide.net/doc/110x75/5fd3e85a448da70cbe063f3b/mtec-a-member-of-nstda-1-globaldata-market-studies-hip-and-knee-implants.jpg)