Embed Size (px)
Citation preview
UNITED STATESSECURITIES AND EXCHANGE COMMISSION
Washington, D.C. 20549
FORM 10-KÈ ANNUAL REPORT PURSUANT TO SECTION 13 OR 15(D) OF THE SECURITIES
EXCHANGE ACT OF 1934For the fiscal year ended December 31, 2012
OR
‘ TRANSITION REPORT PURSUANT TO SECTION 13 OR 15(D) OF THE SECURITIESEXCHANGE ACT OF 1934For the transition period from to .
Commission File No. 001-33601
GlobalSCAPE, Inc.(Exact name of registrant as specified in its charter)
Delaware 74-2785449(State or other jurisdiction of
incorporation or organization)(I.R.S. Employer
Identification No.)
4500 Lockhill-Selma, Suite 150San Antonio, Texas 78249
(Address of Principal Executive Office) (Zip Code)(210) 308-8267
(Registrant’s Telephone Number, Including Area Code)
Securities registered pursuant to Section 12(b) of the Act:Common Stock, par value $0.001 per share
(Title of Class)Securities registered pursuant to Section 12(g) of the Act:
None
Indicate by check mark if the registrant is a well-known seasoned issuer, as defined in Rule 405 of the Securities Act.‘ Yes È No
Indicate by check mark if the registrant is not required to file reports pursuant to Section 13 or Section 15(d) of the Act.‘ Yes È No
Indicate by check mark whether the registrant (1) has filed all reports required to be filed by Section 13 or 15(d) of theSecurities Exchange Act of 1934 during the preceding 12 months (or for such shorter period that the registrant was required to filesuch reports), and (2) has been subject to such filing requirements for the past 90 days.
È Yes ‘ NoIndicate by check mark whether the registrant has submitted electronically and posted on its corporate Web site, if any, everyInteractive Data File required to be submitted and posted pursuant to Rule 405 of Regulation S-T (§232.405 of this chapter)
during the preceding 12 months (or for such shorter period that the registrant was required to submit and post such files).È Yes ‘ No
Indicate by check mark whether disclosure of delinquent filers pursuant to Item 405 of Regulation S-K (§ 229.405 of thischapter) is not contained herein, and will not be contained, to the best of registrant’s knowledge, in definitive proxy or informationstatements incorporated by reference in Part III of this Form 10-K or any amendment to this Form 10-K. ‘
Indicate by check mark whether the registrant is a large accelerated filer, an accelerated filer, a non-accelerated filer or asmaller reporting company. See definition of “accelerated filer”, “large accelerated filer” and “smaller reporting company” inRule 12b-2 of the Exchange Act (check one):
Large Accelerated filer ‘ Accelerated filer ‘Non-Accelerated filer ‘ Smaller Reporting Company È(Do not check if a smaller reporting company)Indicate by check mark if the registrant is a shell company (as defined in Rule 12b-2 of the Act). ‘ Yes È NoThe aggregate market value of the registrant’s outstanding common stock held by non-affiliates was approximately
$20,696,394 as of the last business day of the registrant’s most recently completed second fiscal quarter, based upon the closingsales price of $1.99 per share on such date on the NYSE MKT.
As of March 15, 2013 there were 18,445,516 shares of common stock outstanding.Documents Incorporated by Reference
Portions of the Registrant’s Proxy Statement for the 2013 Annual Meeting of Stockholders to be held on May 21, 2013, areincorporated by reference in Part III hereof.
TABLE OF CONTENTS
Page
PART I
Item 1. Business . . . . . . . . . . . . . . . . . . . . . . . . . . . . . . . . . . . . . . . . . . . . . . . . . . . . . . . . . . . . . . . . . . . . 3
Item 1A. Risk Factors . . . . . . . . . . . . . . . . . . . . . . . . . . . . . . . . . . . . . . . . . . . . . . . . . . . . . . . . . . . . . . . . . 25
Item 1B. Unresolved Staff Comments . . . . . . . . . . . . . . . . . . . . . . . . . . . . . . . . . . . . . . . . . . . . . . . . . . . . 43
Item 2. Properties . . . . . . . . . . . . . . . . . . . . . . . . . . . . . . . . . . . . . . . . . . . . . . . . . . . . . . . . . . . . . . . . . . . 43
Item 3. Legal Proceedings . . . . . . . . . . . . . . . . . . . . . . . . . . . . . . . . . . . . . . . . . . . . . . . . . . . . . . . . . . . . 43
Item 4. Mine Safety Disclosures . . . . . . . . . . . . . . . . . . . . . . . . . . . . . . . . . . . . . . . . . . . . . . . . . . . . . . . . 44
PART II
Item 5. Market for Registrant’s Common Equity and Related Stockholder Matters and IssuerPurchases of Equity . . . . . . . . . . . . . . . . . . . . . . . . . . . . . . . . . . . . . . . . . . . . . . . . . . . . . . . . . 45
Item 6. Selected Financial Data . . . . . . . . . . . . . . . . . . . . . . . . . . . . . . . . . . . . . . . . . . . . . . . . . . . . . . . . 45
Item 7. Management’s Discussion and Analysis of Financial Condition and Results of Operation . . . . 46
Item 8. Financial Statements and Supplementary Data . . . . . . . . . . . . . . . . . . . . . . . . . . . . . . . . . . . . . . 72
Item 9. Changes in and Disagreements with Accountants on Accounting and Financial Disclosure . . . 96
Item 9A. Controls and Procedures . . . . . . . . . . . . . . . . . . . . . . . . . . . . . . . . . . . . . . . . . . . . . . . . . . . . . . . . 96
Item 9B. Other Information . . . . . . . . . . . . . . . . . . . . . . . . . . . . . . . . . . . . . . . . . . . . . . . . . . . . . . . . . . . . . 96
PART III
Item 10. Directors, Executive Officers and Corporate Governance . . . . . . . . . . . . . . . . . . . . . . . . . . . . . . 97
Item 11. Executive Compensation . . . . . . . . . . . . . . . . . . . . . . . . . . . . . . . . . . . . . . . . . . . . . . . . . . . . . . . 97
Item 12. Security Ownership of Certain Beneficial Owners and Management and Related StockholderMatters . . . . . . . . . . . . . . . . . . . . . . . . . . . . . . . . . . . . . . . . . . . . . . . . . . . . . . . . . . . . . . . . . . . 97
Item 13. Certain Relationships and Related Transactions, and Director Independence . . . . . . . . . . . . . . . 97
Item 14. Principal Accountant Fees and Services. . . . . . . . . . . . . . . . . . . . . . . . . . . . . . . . . . . . . . . . . . . . 97
PART IV
Item 15. Exhibits, Financial Statement Schedules . . . . . . . . . . . . . . . . . . . . . . . . . . . . . . . . . . . . . . . . . . . 98
Preliminary Notes
GlobalSCAPE®, CuteFTP®, CuteFTP Pro®, CuteBackup®, CuteSendIt®, Mail Express are registeredtrademarks of GlobalSCAPE, Inc. Secure FTP ServerTM, Wide Area File ServicesTM, WAFSTM, CDPTM, DMZGateway®, Advanced Workflow EngineTM, Applicability Statement 2 TM, AS2TM, AWETM, Enhanced FileTransfer ServerTM, Managed Information XchangeTM, MIXTM, Hosted Enhanced File Transfer ServerTM, EFTServerTM, CuteFTP LiteTM, CuteFTP HomeTM, Secure Ad Hoc TransferTM, Total Path SecurityTM, EnhancedFile Transfer ServerTM, EFT Server EnterpriseTM, Enhanced File Transfer Server Enterprise TM, Stop to Ask TM,Total Recall TM, Stop Tomorrow’s Viriuses Today TM, GlobalSCAPE Securely Corrected TM, and appShieldTM aretrademarks of GlobalSCAPE, Inc. TappIn® and TappIn and desigin are registered trademarks of our wholly-owned subsidiary, TappIn, Inc. Now Playing TM, TappIn Secure Share TM, Social Share TM, and Enhanced A LaCarte Playlist TM, are trademarks of our wholly-owned subsidiary TappIn, Inc. Other trademarks and trade namesin this Annual Report are the property of their respective owners.
In this report, we use the following terms:
“Cloud” or “cloud computing” refers to pooled computing resources, delivered on-demand, over theInternet. In the same manner that electricity is delivered on-demand from large scale power plants, cloudcomputing is delivered from centralized data centers to users all over the world.
“DMZ” or Demilitarized Zone refers to a computer host or perimeter network inserted between a trustedinternal network and an untrusted public network such as the Internet.
“FTP” or File Transfer Protocol is a protocol used to exchange or manipulate files over a computer networksuch as the Internet.
“HTTP” or Hyper Text Transfer Protocol is a protocol commonly used to transfer hypertext documentsbetween a web server and a web browser.
“HTTPS” or Hyper Text Transfer Protocol Secure is a combination of HTTP and a network securityprotocol such as Secure Sockets Layer or Transport Layer Security.
“LAN” or Local Area Network provides networking capability to a group of computers in close proximityto each other, such as in an office building or home.
“MFT” or Managed File Transfer refers to software solutions that facilitate the secure transfer of data fromone computer to another through a network.
“RFC” or Request for Comment is a memorandum published by the Internet Engineering Task Forcedescribing methods, research, or innovations applicable to the working of the Internet and Internet-connectedsystems.
“SaaS” or Software-as-a-Service uses hosted, cloud computing approaches in which the customeradditionally does not need to install the underlying software on its own computer systems to access theapplication.
“S/KEY” is a security system in which a one-time challenge-response password scheme is used toauthenticate access to data. The purpose of S/Key is to eliminate the need for the same password to be sent over anetwork each time a password is needed for access.
“SMB” means small to medium size business.
1
“SNMP” is a User Datagram Protocol-based network protocol primarily used in network managementsystems to monitor network-attached devices for conditions that warrant administrative attention.
“SQL” or Structured Query Language is a database computer language.
“SSH2” or Secure Shell is a protocol that provides encrypted network communications between twocomputers.
“SSL” or Secure Sockets Layer and “TLS” or Transport Layer Security uses cryptography to encrypt databetween the web server and the web browser.
“WAN” or Wide Area Network is a computer network that spans a relatively large geographical area, andtypically connects multiple LANs. The largest WAN in existence is the Internet.
“XML” or Extensible Markup Language is a set of rules for encoding documents electronically usually forusability over the internet.
Forward-Looking Statements
This Annual Report on Form 10-K and the documents incorporated by reference herein contain “forward-looking statements” within the meaning of Section 27A of the Securities Act of 1933, as amended, andSection 21E of the Securities and Exchange Act of 1934, as amended. “Forward-looking statements” are thosestatements that are not of historical fact but describe management’s beliefs and expectations. We have identifiedmany of the forward-looking statements in this Annual Report by using words such as “anticipate,” “believe,”“could,” “estimate,” “may,” “expect,” “potentially” and “intend.” Although we believe these expectations arereasonable, our operations involve a number of risks and uncertainties, including those described in the “RiskFactors” section of this Annual Report and other documents filed with the Securities and Exchange Commission.Therefore, GlobalSCAPE’s actual results could differ materially from those discussed in this Annual Report.
2
PART I
Item 1. Business
Company Overview
We provide secure information exchange capabilities for enterprises and consumers through thedevelopment and distribution of software, delivery of managed and hosted solutions, and provisioning ofassociated services. We have thousands of enterprise customers and more than one million individual consumersin over 150 countries. Our solutions are used by more than 20,000 U.S. Army users deployed worldwide.
We operate primarily in the Managed File Transfer, or MFT, industry. We are evolving our MFT focus intoadjacent solution spaces that creates what we refer to as Total Path Security. The Total Path Security frameworkaddresses data and information management, movement, security and accessibility across a broad range ofenvironments encompassing data and information in motion (for example, with traditional MFT solutionsdelivered as on-premises software or as a cloud service) and at rest (for example, through securely deleting orpurging files or securely accessing stored data from mobile tablet or smartphone devices using our TappInsolution).
Our solution portfolio facilitates transmission of critical information such as financial data, medical records,customer files, vendor files, personnel files and other similar documents between diverse and geographicallyseparated network infrastructures while supporting a range of information protection approaches to meet privacyand other security requirements. Our products provide the ability to monitor these activities, as well as access theunderlying data, securely and flexibly through a wide range of network-enabled, mobile devices, includingtablets and smartphones.
Our solutions ensure compliance with government regulations relating to the protection of informationwhile allowing users to reduce IT costs, increase efficiency, track and audit transactions and automate processes.Our solutions also provide data replication, acceleration of file transfer, sharing/collaboration and continuousdata backup and recovery to our customers. We believe we are strongly positioned to provide secure transfer,sharing, and replication of files that need to be transmitted inside the user’s firewall to distributed offices, oroutside the user’s firewall to business and trading partners, including network-enabled, mobile devices.
Our initial product, CuteFTP, a file transfer protocol client program used mostly by individuals and smallbusinesses, was first distributed in 1996 over the Internet and achieved significant success and popularity. Sincethen, we have continued to enhance our portfolio of products to meet the increasing demand for secureinformation exchange in the MFT industry and adjacent markets such as cloud services. Our capabilities haveevolved from personal and small business MFT products to include standard and enterprise versions of ourEnhanced File Transfer, or EFT, software, with an increasing number of add-on modules that provide additionalcapabilities such as ad hoc file transfer, advanced auditing and reporting, government-validated cryptography,and workflow automation. We have also developed Wide-Area File Services, or WAFS, and Continuous DataProtection, or CDP, software which further enhances the ability to replicate, share and backup files within a widearea network or local area network, at WAN and LAN speeds.
We also offer managed e-mail attachment, software-as-a-service, or SaaS, and cloud-based subscriptionsolutions for information sharing solutions. Our managed e-mail attachment solution addresses the needs ofcustomers who are constrained by the typical limits on e-mail attachment size or who require additional security,auditing, and reporting for file attachments shared through e-mail. Our SaaS and cloud-based subscriptionsolutions allow customers to reduce their upfront and total cost of ownership and achieve other recognizedbenefits of cloud-based solutions, including service elasticity and strong service level agreements for ITinfrastructure reliability and performance.
3

Our managed cloud-based subscription solutions are a notable part of our future revenue model plansbecause they provide recurring revenue which potentially builds over time, as compared to sales of on-premisessoftware licenses which must be reconstituted every period. While we are in the early stages of growing oursubscription services, we already have added capability to deliver these services in additional geographies, suchas the United Kingdom and Canada, where country-specific compliance requirements may necessitate in-countryservice delivery
In December 2011, we entered the secure content mobility market with the acquisition of TappIn, Inc.Secure content mobility provides users with the ability to easily and securely access and share data andinformation using a web-browser, tablet or other mobile device such as a smartphone. Secure content mobilityintegrates aspects of ad hoc file transfer, broader MFT capabilities, cloud services, and remote accessibility toaddress growing market demand for secure, ‘anytime and anywhere’, device-independent access to distributedcontent. We believe that the addition of secure content mobility capability to our portfolio potentially hasprofound implications due to the continuing growth of tablet computers and smartphone sales and theirincreasing adoption by business users.
Industry Background
The Internet has become an integral part of daily operations for individual users and companies of all sizes,not only for e-commerce, but also as a means of managing information between central and remote locations andwith associates, employees, partners, suppliers, and customers. Corporate information managers must protectbusiness assets, ensure that policies and processes meet regulations governing the management of sensitiveinformation, and ensure that the right people have access to the right information at the right time. Globaloperations, diverse business partners and networks further emphasize the need for common standards to ensurecompatibility, scalability, privacy, security and cost-effective integration. All of these needs have created theneed for maintaining the security of data and information in motion (for example, with traditional MFT solutionsdelivered as on-premises software or as a cloud service) and at rest (for example, through securely deleting orpurging files or securely accessing stored data from mobile tablet or smartphone devices using our TappInsolution).
The need for MFT and secure content mobility solutions is particularly strong for organizations faced with adaunting array of privacy, security, and remote accessibility challenges stemming from various regulatory andbusiness requirements for data privacy and confidentiality. Regulatory and privacy requirements include federallegislation and regulations such as the Health Insurance Portability and Accountability Act (HIPAA), theGramm-Leach-Bliley Act (GLBA),the Federal Trade Commission Red Flags Rules, as well as state legislationand regulations in the U.S such as California Senate Bill (SB) 1386 and the data security regulations issued bythe Massachusetts Office of Consumer Affairs and Business, as well as the extraterritorial requirements such asthe European Union Data Protection Directive. Some of these statutes and regulations impose severe penalties forimproper disclosure of confidential information. Industry best-practices such as the Payment Card Industry DataSecurity Standard (PCI DSS) and self-imposed business requirements lead to the need to secure and protectconsumer information, intellectual property and trade secrets. These measures offer protection against disclosureof proprietary information and also reduce corporate risks associated with the potentially devastatingconsequences of security breaches.
Markets for MFT and secure remote access grew from mainstream adoption of the Internet, the subsequentexponential growth in data and information sharing, and the growing realization that information is a significantbusiness currency requiring appropriate security, management, auditing, and reporting, and also subject in manycases to regulatory and privacy requirements. Similarly, the cloud services market arose from recognition that theInternet allows ubiquitous, global access to data and information services. By leveraging Internet technologies,and delivering services through appropriately secured and managed shared resources, cloud-based solutionsallow businesses and other organizations to achieve economies of scale and greater operational agility. Cloud
4

solutions also can support individual consumer needs for information access and sharing at very affordable costs.Secure content mobility solutions provide these same benefits, but extend the information delivery model to andfrom the broadest range of network-enabled devices, including smartphones and tablets.
Our primary industry is known as managed file transfer. The MFT industry has its technical origin in the filetransfer protocol, or FTP. FTP dates back to 1980 (RFC 765, later superseded by RFC 959), with even earlierRFCs guiding prior attempts to establish standards for file transfer protocols. The use of file transfer protocolsincreased dramatically with the explosive growth of the Internet and the World Wide Web during the 1990s. TheMFT industry arose from recognition that FTP, alone, does not provide adequate security and managementcapabilities for file transfers. MFT solutions offer a greater degree of security and control than FTP. Featuresavailable in MFT solutions include integrated security, auditing capabilities, performance monitoring, andreporting. The MFT industry includes low cost, or even free, solutions that offer basic capabilities. However,businesses and even individuals procure more advanced solutions that provide scalability, enhanced securityoptions, automated workflow, dedicated maintenance and support, and other features that facilitate high-confidence, secure and cost effective file transfers.
Cloud computing is a model for enabling convenient, on-demand network access to a shared pool ofconfigurable computing resources (e.g., networks, servers, storage, applications, and services) that can be rapidlyprovisioned, released, and scaled to meet requirements. We believe the continuing movement to cloud services isanalogous to the telecommunications shift from dedicated point-to-point circuits to a delivery model in which theentire telecommunications infrastructure potentially can be used to establish, maintain, and manage individualconnections on an as-needed basis. Cloud implementations may be public, private, community or a hybridcombination. In a private cloud, the infrastructure is operated solely for a specific organization. In a communitycloud, the infrastructure is shared by several organizations and supports a specific community that has sharedconcerns (e.g., mission, security requirements, policy, and compliance considerations). In a public cloud theinfrastructure is made available to the general public or a large industry group. A hybrid cloud is a compositionof two or more clouds (private, community, or public) that remain unique entities but are bound together bystandardized or proprietary technologies that enable data and application portability (for example, cloud burstingfor load-balancing between clouds).
The secure content mobility market has emerged from a confluence of the same primary market forces thatdrove demand for MFT and cloud services, with those forces magnified by the exponential, worldwideproliferation of mobile devices. According to a recent report by Cisco Systems, global mobile data traffic grewby 70% in 2012. The Cisco report also states that mobile data traffic in 2012 was nearly 12 times the size of theentire global Internet in 2000 and projects that such traffic will increase 13-fold between 2012 and 2017. Thereport further projects that the number of mobile-connected devices will surpass the world’s population in 2013.Secure content mobility solutions will become increasingly necessary to allow business and consumers tosecurely access and share data, potentially across multiple network-enabled devices to include smartphones andtablets. The content delivery model will include solutions like TappIn that provide access directly to and fromon-premises or personal devices, with those solutions possibly interoperating with cloud-based data repositories.
Strategy
Our Total Path Security framework encompasses protection of data in motion and at rest. We intend to buildupon our leadership position in the MFT market to provide businesses, other organizations, and individual userswith the solutions necessary to meet their growing need for secure information exchange within the Total PathSecurity framework. From our perspective, more fully addressing this need for secure information exchangerequires consideration of capabilities beyond traditional MFT, including managed e-mail attachment, cloud-based, and remote access security solutions. We believe we must consider ongoing, fundamental changes incustomer technologies and processes, such as the rapidly increasing use of mobile devices, including “BringYour Own Device”, or BYOD, aspirations, in the workplace.
5
Our strategic focus continues to center on:
• Entering and establishing leadership in broader information exchange markets while maintainingleadership in the MFT industry.
• Growing recurring revenue.
• Developing and enhancing our software solutions.
• Entering and extending our presence in the secure content mobility market.
• Increasing international sales through third-party distributor channels.
• Growing enterprise and government sales, and
• Developing our corporate brand and market recognition.
Entering and Establishing Leadership in Broader Markets
Gartner and International Data Corporation (“IDC”) have stated that the annual MFT market is in excess of$700 million. We are a leader in MFT products and services. In 2012, we achieved one of the highest ratings inthe latest Managed File Transfer (MFT) Vendor Landscape Report from Info-Tech Research Group. The reportdesignated GlobalSCAPE a “Champion” in its Vendor Landscape matrix and awarded the Company “ExemplaryPerformer” status in both security strength and ad hoc file transfer capabilities. Info-Tech Research Groupevaluated criteria such as strategy, viability, sales and support reach, and channel partner programs. We scoredhigh in all categories, earning the ranking of “Champion.” Their evaluation of our strategy garnered one of thehighest possible scores due in part to our TappIn product line and our approach to mobile file access. Alsoplaying a role in our rating was the assessment of our EFT Enterprise Edition, one of our primary MFT solutionproducts. EFT Enterprise Edition was commended for its ability to meet advanced security requirements, itsflexible deployment options and our responsive customer support. We also received the highest marks for ouravailable features and flexible system architecture.
We also were in the leader’s quadrant of the Gartner Magic Quadrant for Managed File Transfer in 2011and 2010, the latest years for which Gartner published this magic quadrant. With MFT capabilities increasinglybeing integrated into business-to-business, or B2B, gateway, data integration, service oriented architecture, andother technical solutions, we believe the market will continue shifting toward consideration of MFT as more of a“feature” than a solution. This shift may take many years, but we believe early recognition of the trend andappropriate strategic planning increase our potential for evolving our solutions in front of the ongoing marketchanges. We have begun to address this shift in a number of ways.
We offer services to the much larger, and adjacent, cloud services market with our Managed InformationXchange, or MIX, and Hosted Enhanced File Transfer solutions. Gartner, a notable industry analyst, estimatedthe cloud computing market would grow from an estimated $109 billion in 2012 to approximately $207 billionby 2016. This market includes categories such as infrastructure-as-a-service, management and security, andSaaS. Our partner agreements with hosting providers such as Rackspace and Peer 1, and the proven, modularcapabilities of our EFT solution suite, provide us a straightforward path for delivering our products andtechnology to specific segments of this market
Our Secure Ad Hoc Transfer module, or SAT module, is designed for companies needing an out-of-the-boxsolution to exchange files without the problems typically associated with having to manually create temporaryFTP accounts, accept the size limitations and security issues of regular email, or contend with the time delays andhigh costs of overnight and physical shipments. The SAT Module works in conjunction with our EFT solutionand allows users inside an enterprise to send and receive files of any size to and from recipients outside theorganization with secure authentication, non-repudiation and auditing capabilities. We have added otheradjacent-market capabilities, such as business automation, to the EFT software also through our modular solutionarchitecture. These capabilities are helping to underpin the consistent growth in revenue from the EFT solution
6
suite. In addition, our Mail Express solution was recognized by Info Security Products Guide as a “GlobalExcellence Award” winner in February 2012 in the Email Management and Security category. We believestrengthening our ad hoc file transfer solutions remains a key strategy element and we intend to pursue solutionenhancements in this area in future periods. Our secure content mobility competencies provide a potentiallycompelling complement to traditional MFT capabilities, including ad hoc file transfer solutions. We havedeveloped a secure mobile access module for our EFT solution as an initial point of integration with our TappIntechnology. We regard secure content mobility potentially as a unifying concept for our solution portfolio giventhe central position and importance of content (i.e., data and information) in the market drivers for our solutions.We intend to further integrate our solution capabilities, for example as demonstrated by the February 2013integration of Mail Express functionality as a module within the EFT solution suite, to take advantage ofpotential synergies and strengths across our solution portfolio, while also possibly simplifying our marketing andsales processes.
We believe that building on our MFT capabilities provides a clear opportunity to increase our averagetransaction size and repeat business through greater scalability, business integration, and application ofprofessional services to support implementation planning and execution. Our enterprise solutions, such as EFTEnterprise, have increased considerably in capability over the years. The add-on modules available for EFTEnterprise and increased technical performance for other offerings in our portfolio provide a strong platform forgreater business adoption and integration of our solutions. We believe continued focus on capabilities necessaryfor even broader B2B applicability, including appropriate treatment of evolving secure content mobilityrequirements, is a key strategic opportunity for our future business operations.
With MFT capabilities increasingly being integrated into B2B gateway, data integration, service orientedarchitecture, and other technical solutions, the need to keep evolving our solutions and entering adjacent marketsalso is clear. We continue to believe the market will shift toward consideration of traditional MFT as more of a“feature” than a solution. This shift may take many years, but we believe early recognition of the trend andappropriate strategic planning increase our potential for evolving our solutions in front of the ongoing marketchanges.
Growing Recurring Revenue
Recurring revenue includes M&S contracts and subscriptions for our cloud-based managed and hostedsolutions. In the broadest sense, delivery of labor hours on long-duration professional services contracts also fitswithin this growth strategy because such “contracted sales” provide a book of sold business that will berecognized as revenue in future periods with some revenue from these labor contracts potentially visible eventwo or three years in the future. We believe increasing recurring revenue provides greater predictability ofrevenue in future periods and a stronger hedge against future business or broader economic downturns.
We believe execution of this strategy element potentially could provide greater predictability of revenue infuture periods and a stronger hedge against future business (or broader economic) downturns. Currently, thelargest component of our recurring revenue is from M&S contracts which grew 20% or more in both 2012 and2011 compared to the prior year. We intend to focus on delivering continued growth in deferred revenue, whileassessing market traction for the full range of our solutions on an ongoing basis. From this perspective, deferredrevenue may continue to grow in absolute terms, and as a percentage of total revenue, for some period of time,depending on the relative future growth rates of all of our solutions.
As discussed under “Key Business Metrics” in “Management’s Discussion and Analysis of FinancialCondition and Results of Operations,” subscription sales may change the trajectory of our prior revenue growth.We believe that due to its compounding effects, subscription revenue potentially can grow more quickly andsignificantly than software license revenue and create increased operating margins.
7
Developing and Enhancing Our Solutions
We have allocated significant resources to enhancing and developing our solutions in recent years. Thisstrategic focus has delivered substantially more capable releases of our Enhanced File Transfer, WAFS and MailExpress solutions, plus our cloud-based offerings, TappIn mobile file access and monitoring products andprofessional services. We intend to maintain our focus on developing our solution portfolio and, as appropriate,enhancing our existing solutions.
Our solution portfolio may evolve over time, for example, through development of new offerings in adjacentmarkets or through acquisitions. We maintain an active research and development program and work closelywith partners and others in the industry to identify new solution opportunities. As an example, we began our firstoriginal equipment manufacturer, or OEM, partnership with Network Automation in 2008, embedding NetworkAutomation’s AutoMate product as the Advanced Workflow Engine, or AWE, module to our Enhanced FileTransfer Server solution. During 2010, we expanded our partner agreement to become a worldwide reseller ofNetwork Automation’s software solutions, AutoMate and AutoMate Business Process Automation Server. Overthe past three years, we have partnered with hosting providers (including Rackspace Hosting) to deliver the MIXand Hosted EFT Server solutions. Also, in December 2011, we acquired the TappIn secure content mobilitytechnology.
As we evolve our solution portfolio, we intend to maintain an appropriate balance between legacy and newsolutions, including making choices about transitioning, sustaining, or retiring solutions as necessary to bestoperate under prevailing business conditions. Transitioning or sustaining solutions may involve consolidatingcapabilities within our solution portfolio, releasing upgrades in response to market or customer needs, or makingbug fixes in accordance with our communicated End of Life, or EOL, Policy. We also may phase out solutionsperiodically in accordance with the EOL Policy.
Entering and Extending our Presence in the Secure Content Mobility Market
In December 2011, we entered the secure content mobility market with the acquisition and introduction ofour TappIn product line. Secure content mobility provides users with the ability to easily and securely access andshare data and information using a web-browser, tablet or other mobile device such as a smartphone. Securecontent mobility integrates aspects of ad hoc file transfer, broader MFT capabilities, cloud services, and remoteaccessibility to address growing market demand for secure, ‘anytime and anywhere’, device-independent accessto distributed content.
We believe the addition of secure content mobility capability to our portfolio potentially has profoundimplications due to the continuing growth of tablet computers and smartphone sales and their increasing adoptionby business users. While storing and accessing data in a cloud environment is viable in many circumstances, webelieve there also is a significant demand in the marketplace for the ability to access data in a manner similar tothat offered by cloud computing but with the data being accessed and stored within the security of computers,servers or data centers owned by or dedicated solely to a particular individual or enterprise, rather than in thecloud. Many of our customers already using our EFT Server and other products have expressed a desire to havethe flexibility to access their data or monitor the status of their MFT activities from anywhere using a tabletcomputer or smartphone and security protocols at least equivalent to that offered by our EFT Server and otherproducts. Our TappIn technology, if further developed, potentially can provide that accessibility. Therefore, weintend to expand and enhance the TappIn capabilities and appeal for enterprise customers.
TappIn currently supports the consumer user’s needs by providing the capability to access data stored on theuser’s personal computer, network attached storage or similar device from a remote location using a tablet,smartphone or other network-enabled device. There is demand in the marketplace for this capability in light ofconcerns about the security of personal data when it is stored in the cloud. We are accessing this market throughdirect sales of the TappIn application to consumers through our website and by partnering with major storagedevice manufacturers who will ship their products pre-configured with TappIn capabilities.
8

Increasing International Sales Through Third-Party Distributor Channels
We have added several channel partners in recent years and also organized our sales force and associatedsales processes, to more effectively support our partner network worldwide. Channel partners resell, distribute, orintegrate our solutions. These channel partners provide us with additional opportunities to penetrate deeper intoexisting markets and enter new sales territories.
Channel sales can help us establish a lower-touch delivery model through which we train and provision thepartners to sell and distribute our solutions. We leverage this approach to reduce our over cost of marketing andselling our solutions in geographic areas where it would be costly to establish a presence with our ownemployees. To facilitate this approach, we host channel partner conferences to provide a forum for exchangingideas and delivering partner-specific sales education and training. We currently derive approximately 88 percentof our sales from the United States, United Kingdom, Canada, and Australia. Achieving an additional presence inregions we do not yet serve to any notable degree could increase our sales in future years.
Growing Enterprise and Government Sales
GlobalSCAPE conducts business with thousands of businesses around the world. We provide solutions tosome of the world’s largest banks, insurance companies, healthcare providers, automakers and film companies.We intend to continue penetrating large enterprise firms with our expanding solutions and services.
Government sales, particularly large contracts from the U.S. Army, have had a significant positive impacton our growth and market image since 2007. However, these large contracts also have caused significant swingsin our financial results. We are focused on more deliberate growth in government sales, including software andassociated services, potentially augmented by occasional large product orders.
We have a contract with the U.S. Army to support the Standard Army Maintenance System-Enhanced(SAMS-E) logistics program. This is the fourth large U.S. Army contract for GlobalSCAPE since 2005. Thiscontract extends through September 2013. It is a sole source contract for $1.35 million, which we will recognizeas revenue in equal monthly installments over that term. Under this agreement, we will continue to providemaintenance and support to previously purchased software licenses, including the Enhanced File Transfer Serversolution and CuteFTP Pro managed file transfer application. GlobalSCAPE solutions enable the SAMS-Eprogram to maintain compliance with federal and U.S. Army and information security regulations as a result ofour product certifications that include Federal Information Processing Standards (FIPS 140-2) and the U.S. ArmyCertificate of Networthiness.
Developing our Corporate Brand
GlobalSCAPE traditionally has been better known for CuteFTP than as a corporate brand. We have anongoing initiative to elevate our corporate profile under the GlobalSCAPE brand. We use internal resources aswell as outside marketing, communications and investor relations professionals to support this work.
We have participated in numerous analyst briefings and investor conferences that have increased ourrecognition within the investor and analyst communities. We have revised our website, logos, and other areasreflecting our corporate brand. Through these activities, we have established a more consistent, recognizablebrand that may better support future growth and market visibility.
We believe we have continued to enhance our brand through additional national and regional attentionresulting from the numerous corporate awards we have received including:
• In 2012, the San Antonio Business Journal named us one of San Antonio’s fast track companies forrevenue growth.
9
• In 2012, we also were named one of the top 50 companies in the San Antonio Express-News TopWorkplaces for the third year in a row.
• In 2012, we were named one of the “Best Places to Work” by the San Antonio Business Journal for thethird year in a row.
• In 2011, Computerworld named GlobalSCAPE on its list of “100 Best Places to Work in IT” for thesecond year in a row.
• In 2012, Texas Monthly named GlobalSCAPE one of the best companies to work for in Texas for thethird year in a row.
We were also named Software Magazine’s Software 500 ranking of the world’s largest software and serviceproviders, now in its 29th year. The Software 500 is a revenue-based ranking of software and services supplierstargeting medium to large enterprises, their IT professionals, software developers, and business managersinvolved in software and services purchasing. The ranking was based on total worldwide software and servicesrevenue for 2010, including revenue from software licenses, maintenance and support, training and software-related services and consulting.
In addition to these corporate awards, we were named to Deloitte’s Technology Fast 500 for 2010 and 2009,a ranking that recognizes the fastest growing technology, media, telecommunications, life sciences and cleantechnology companies in North America on the basis of five-year revenue growth. We believe our corporate,financial, and technical awards in aggregate increase our market visibility and provide a stronger basis forcontinued development of the GlobalSCAPE brand.
Software Products
Managed File Transfer Products and Solutions
Our MFT products and solutions help users securely move and copy files on the Internet. FTP, along withmore secure protocols such as SFTP, FTP/S, and HTTP/S, requires a client program to start a transfer and aserver program to accept the connection. A substantial portion of our revenues is derived from licensing our filemanagement products, especially the EFT solution.
In 2012, we achieved one of the highest ratings in the latest Managed File Transfer (MFT) Vendor LandscapeReport from Info-Tech Research Group. The report designated GlobalSCAPE a “Champion” in its VendorLandscape matrix and awarded the Company “Exemplary Performer” status in both security strength and ad hoc filetransfer capabilities. Info-Tech Research Group evaluated criteria such as strategy, viability, sales and supportreach, and channel partner programs. We scored high in all categories, earning the ranking of “Champion.” Theirevaluation of our strategy garnered one of the highest possible scores due in part to our TappIn product line and ourapproach to mobile file access. Also playing a role in our rating was the assessment of our EFT Enterprise Edition,one of our primary MFT solution products. EFT Enterprise Edition was commended for its ability to meet advancedsecurity requirements, its flexible deployment options and our responsive customer support. We also received thehighest marks for our available features and flexible system architecture.
Server-Based Managed File Transfer Software Solutions
Our server software solutions are designed to provide businesses with increased file transfer security,automation, and performance when compared to traditional FTP-based and e-mail delivery systems. Our serversolutions offer substantial ease-of-use advantages compared to competitive products. Each provides two-factorauthentication, enhanced visibility and monitoring of file transfers, support for IPv6, and additional securityenhancements. These products are common, scalable solution platforms that accommodate a broad family of add-on modules to support the user’s complex information sharing needs. For flexibility, these products preservebackward compatibility with our early version solutions.
10
Enhanced File Transfer Standard Edition (“EFT Standard Edition”). Our EFT Standard Edition solutioncomplements CuteFTP Pro (further described below) and other third party FTP clients by enabling encryptedtransfers using SSL, SSH2 and advanced S/KEY password encryption. When used with CuteFTP Pro, EFTStandard Edition offers a complete digital certificate management system giving system administrators the abilityto manage digital certificates as well as initiate back-end processes with other customer systems. The latterfunctionality can be used as a partial or total replacement for more complex, enterprise-level electronic datainterchange systems. Additional features include remote management capability, the ability to operate multipleFTP sites with unique user management from a single server and the ability to manage user accounts withadvanced settings for maximum security and control. EFT Standard Edition is integrated with a Secure MobileAccess, or SMA, module that uses TappIn functionality to allow authorized mobile users to view files on EFT.
EFT Standard Edition supports add-on modules and software such as the Auditing and Reporting module,High-Security module, OpenPGP module, Web Transfer Client, Secure Ad hoc Transfer module, DMZ gateway,and FIPS 140-2 validated cryptographic libraries.
Version 6 of EFT Standard Edition and CuteFTP Pro Version 3.1 also received the Certificate ofNetworthiness from the U.S. Army Network Technology Command (NETCOM) during 2009. Our receipt of thiscertificate enables Army installations worldwide to install and operate these server and client-based secureinformation exchange solutions. The availability of add-on modules, and migration to a common software codebase with EFT Enterprise Edition have dramatically increased the capabilities of EFT Standard Edition ascompared to the legacy Secure FTP Server.
Enhanced File Transfer Enterprise Edition (“EFT Enterprise Edition”). EFT Enterprise Edition is anenterprise file server, building on the base features of EFT Standard Edition. EFT Enterprise Edition supportslarge-enterprise installations and is compatible with our AWE module. The AWE module provides over 200built-in “drag and drop” workflow actions, including sending SNMP traps, communicating with mainframecomputers, redirecting or relocating files, integrating SQL and XML capabilities, and executing third-partyapplications, custom programs, and batch files.
EFT Enterprise Edition also supports the Applicability Statement 2 (AS2) protocol, encrypting file system(EFS), the multi-site (and multi-platform) version of DMZ Gateway, two-factor authentication, active directoryadministration, Oracle DBMS, Microsoft SQL and many more enterprise capabilities. In November 2012, wereleased our Business Activity Monitoring (“BAM”) dashboard as an additional module available for use withEFT Enterprise Edition. The BAM dashboard is designed for both technical and business users requiringmonitoring of business transactions. The BAM software provides an overview of transactions involving sensitivedata transfers such as currency exchange, shipments and deliveries and other sensitive data transfers. Screenviews provided by the BAM dashboard are customizable by the user to display transactions in a mannerresponsive to their business needs.
Both editions of our EFT solution provide two-factor authentication, enhanced visibility and monitoring offile transfers, support for IPv6, and additional security enhancements. In February 2013, we announced thegeneral availability of EFT Standard 2013 and EFT Enterprise 2013 (collectively EFT 2013). The EFT 2013release provides a significant update to the EFT Standard and Enterprise Editions. Some of the top improvementsfor EFT 2013 include full Unicode UTF-8 integration which allows data exchange in any language, improvedsupport for implementations with hundreds of thousands of accounts, expanded administrative visibility andcontrol of ongoing data transfers, and full support for Microsoft Windows Server 2012 and Microsoft SQLServer 2012. In addition, EFT 2013 includes tight integration with our Mail Express solution, allowing users toexchange large or sensitive files securely via email attachment. This new integration with Mail Express allowsadministrators to achieve even higher levels of efficiency and visibility than prior versions, through commonauditing, reporting, and event rule processing.
11
CuteFTP
CuteFTP is a ‘“client side” software product, installed on a user’s local computer, that enables file transfersfrom or to an FTP server. The target market for the CuteFTP product includes corporate IT professionals who useit to transfer data between locations via the Internet and individual Web site operators who use it to upload theirWeb pages to their Web hosting provider, among others. CuteFTP simplifies use of file transfer protocolspresenting a user-friendly, graphical user interface that allows users to “drag and drop” files between computers,rather than requiring those users to interact directly with the underlying technical processes and protocols.CuteFTP has won several awards, and has been favorably reviewed over the years in leading online and printtrade journals, as being one of the most powerful, easy-to-use file transfer protocol program available. We offerCuteFTP in English, German, French, Spanish, Japanese, Traditional and Simplified Chinese, Russian,Portuguese and Turkish.
CuteFTP incorporates standards for encrypting data during transport and at rest, accelerating transfer oflarge files, and automating common file transfer tasks. It includes various features attractive to advanced userssuch as multi-part and concurrent file transfers to maximize transfer speed, additional secure protocols, scheduledfile transfers, automated site backups and scripting ability for automating FTP tasks. CuteFTP has been favorablyreviewed by leading online publications including CNet’s Download.com and PC Review.
We released our current CuteFTP Version 9 in November 2012. The Version 9 release includes a number ofupdates, including support for Unicode (UTF-8) characters that will allow greater international use and WebDistributed Authoring and Versioning (WebDAV) support to facilitate collaboration between users in editing andmanaging documents and files stored on World Wide Web servers. In creating the Version 9 release, we alsosimplified our CuteFTP product line by consolidated all the features of our previous multi-product CuteFTPproduct line for Windows operating systems into the single new version. We also continue to offer CuteFTPVersion 3.1 software for Mac platforms.
Wide-Area File Services and Continuous Data Protection Solutions
Our Wide Area File Services, or WAFS, software provides a file sharing, collaboration, and replicationsolution over multiple sites. WAFS technology can have our Continuous Data Protection (“CDP”) product addedto provide enterprises with a file access and data protection combination that centralizes data storage and ITadministration facilities but doesn’t compromise data sharing and protection.
Wide Area File Services. Our WAFS software delivers a unified and accelerated file access system, instantfile-sharing and server-to-server mirroring across any distance, with full coherency and at near-LAN accessspeeds. WAFS delivers a true, wide area file solution for collaboration. Continuous, real-time multi-directionalacceleration and mirroring technology ensures that data exists in multiple places simultaneously and in completesynchronization, no matter where a change in any file is made. The data is mirrored between servers on the LAN,virtual private network, or across firewalls in real time, with full support for file locking ensuring coherency. OurWAFS product ensures bandwidth efficient WAN utilization and that users have access to the most recent data.The off-line mode ensures continued data access in the event of WAN or server outage. Our WAFS software iseasy to deploy and manage remotely. It supports Autodesk® Revit® Architecture construction and designapplication. Most recent feature enhancements include compatibility with Unicode character sets (which areencountered more frequently in international sales opportunities), and Local Sync, a feature that allows users torapidly synchronize data while also simplifying implementation.
In April 2012, WAFS won the Network Products Guide 2012 Best Products and Services Awards in the“Social Media, Networking or Collaboration Solutions” category. These awards highlight the best products andservices, roadmaps, industry directions, technology advancements, and independent product evaluations of the year.
12
CDP. Our CDP continuous backup software transparently and continuously captures data from local andremote servers, eliminating the backup window and restoring data rapidly. Our software-only solution supportsthe ability to backup any number of branch servers or remote laptops to one or more centrally located systems.As files change, file servers backup in real time to the customer’s backup site which can be at the same or aremote location. The backup server can keep any number of past versions of each file (and deleted files) whichgives the customer immediate restore, as well as the ability to perform point-in-time snapshots. Bandwidthrequirements are minimal since only file differences are transferred to the backup system.
Managed E-mail Attachment Solution
Not all customers want to use FTP, or even traditional MFT solutions, to transfer large files. Somecustomers prefer using their familiar e-mail application to send and receive large files such as images, video, datafiles, etc. However, e-mail traditionally has been ill-suited to delivery of certain attachments due to typicalinfrastructure and administrator-defined limitations on e-mail attachment size. In many cases, these limitationspreclude sending or receiving e-mail attachments larger than 10 to 20 MB.
Mail Express is a software add-in (also sometimes referred to as a plug-in) compatible with MicrosoftOutlook. The add-in transparently redirects e-mail attachments, up to 25 GB in size, for delivery in accordancewith administrator-defined policies. Attachments specified in the policy (for example, by type or size) arereplaced in the e-mail message with a hyperlink. The files are transferred securely to the Mail Express server.The e-mail recipient clicks the hyperlink and is able to download the files from the Mail Express server usingstandard web-based download procedures with all communications using HTTPS (SSL or TLS encryption). Thisapproach can ease the load on the e-mail infrastructure and the long-term storage requirements associated with e-mail attachments. Mail Express also allows enhanced tracking and auditing of the file attachments through readreceipts and log files. Mail Express requires little or no user training because the add-in is transparent from theperspective of the sender and the recipient is able to use a familiar web browser for downloading the attachments.
Mail Express provides two-way file sharing and collaboration, an optimized administrator experiencethrough enhanced workflow in the user interface and a simplified deployment process. It provides a secureenvironment by supporting communication through the GlobalSCAPE DMZ Gateway. This DMZ Gatewaysupport allows customers to implement Mail Express behind a demilitarized zone (DMZ) firewall, providing anadded layer of protection for data storage and retrieval, user authentication, and firewall traversal. The MailExpress Internal Web Portal provides full Mail Express functionality via a standard web browser to customeremployees who may not use Microsoft Outlook as their primary mail client. Other key features of Mail Expressinclude support for Microsoft Outlook and Exchange 2010, improved performance, and optimization wheninteracting with anti-virus software, and ease of scalability.
In February 2013, we announced the general availability of Mail Express Version 3.3. In addition to theintegration with EFT 2013, the new Mail Express includes a number of enhancements including:
• More flexible language support through which users can specify a language by message or globallywith full localization.
• An administrative view of all connected clients with the client dashboard.
• The ability to require recipients to login to pick up files with user authentication.
• A single-sign-on capability that allows users to automatically login to the Mail Express Internal WebPortal using Windows credentials.
13
Mail Express awards and recognitions include:
• In March 2012, Info Security Products Guide recognized Mail Express as the winner of the 2012Global Excellence Award in the Email Management and Security category. The 2012 GlobalExcellence Awards attracted entries from all over the world with more than 50 judges from a broadspectrum of industries determining the winners.
• In April 2012, Mail Express was named a finalist in the Network Products Guide 2012 Best Productsand Services Awards in the “Email, Security, and Management” category.
Data Backup and Recovery Solution
In 2011 we released CuteBackup, a data backup and recovery software solution, compatible with Windowsoperating systems, aimed at helping consumers and small business owners avoid a data loss catastrophe. Thescalable, automated solution gives home and small business computer users complete backup and recoveryprotection, with an intuitive setup wizard that enables a simplified, effective way of securing data. CuteBackupalso offers “Boot Corrector” protection that can reboot the system and subsequently correct most common issuesif the computer crashes and fails to restart. Additional features include automated backup routines and selectiverestores. CuteBackup is powered by Paragon Software Group’s Backup and Recovery 10 Suite.
Endpoint Security Solution
We had planned to enter the endpoint security market through development of appShield, a softwareapplication control, or whitelisting product. The appShield product was being developed under a JointDevelopment and Reseller Agreement between GlobalSCAPE and CoreTrace Corporation. In November 2012,CoreTrace Corporation sold substantially all its assets to an unrelated third party resulting in CoreTrace endingits development work on appShield. This action provided us possession of the appShield source code whilesustaining our prior appShield-related license rights. The notable resulting change is that we now have the rightto sell products based on the appShield source code with no royalty obligation to CoreTrace Corporation or anyother party.
The consumer application control market has matured significantly since appShield product developmentbegan in 2009. That situation necessitates additional development work, which possibly could be significant, tobring appShield to market. We are investigating whether to further develop this product on our own, engageothers to continue the development for us, or sell the appShield rights to another party. We therefore have no datescheduled for introduction of appShield to the market nor do we have specific plans to pursue introduction.
Maintenance and Support
We offer maintenance and support, or M&S, contracts to licensees of all of our software products. TheseM&S contracts entitle the licensee to software upgrades and technical support services in accordance with theterms of our M&S contract. Standard technical support services are provided via e-mail and telephone during ourregular business hours. For EFT Server Enterprise and WAFS software, we offer a Platinum M&S contractwhich provides access to emergency technical assistance 24 hours per day 7 days a week.
Cloud-Based Services
GlobalSCAPE Managed Solutions
We have a partner agreement with Rackspace Hosting, Inc., a world leader in the hosting and cloudcomputing industry that began in 2010. We have a similar agreement with PEER 1 Hosting to meet the growingEuropean demand for our services. Through these relationships, GlobalSCAPE delivers cloud-based, managed
14
file transfer solutions for the secure exchange of business-to-business data, including large files and sensitivedata. Our cloud-based solutions allow customers to outsource all or part of their complex and demandinginformation exchange needs to reduce costs, improve operational efficiencies, track and audit transactions, andprovide a greater level of security. We offer our cloud services capability in the United States, as well as in theUnited Kingdom and Canada, to support solution delivery in instances where country-specific compliancerequirements may necessitate in-country delivery of the services.
Managed Information Xchange. Our Managed Information Xchange, or MIX, service delivers a hosted andmanaged MFT solution that enables cost effective, secure exchange of business-to-business data, including largefiles and sensitive data. MIX is a fully GlobalSCAPE-managed solution for companies seeking complete supportfor the contracted services. The tiered service allows customers to outsource all or part of their complex anddemanding information exchange needs to reduce costs, improve operational efficiencies, track and audittransactions, and provide a greater level of security. Available solution tiers range from trial and proof-of-concept implementations to enterprise-scale managed services.
Key benefits and features of the Managed Information Xchange offering include:
• “Pay as you go,” flexible pricing that helps customers eliminate upfront capital expenditures.
• Reduced ongoing maintenance expenses, including hardware, software, personnel, utility services, andbackup costs.
• Improved IT infrastructure reliability and performance enabled by the Rackspace and Peer 1 globalinfrastructure and other partner capabilities.
• Easy and rapid deployment with scalable processing and storage capabilities.
• The market-leading features and security capabilities of our EFT Server solution adopted by thousandsof customers worldwide.
• Operation of the cloud-based secure file transfer capability by our technical resources, in accordancewith service level agreements.
We introduced our MIX solution in mid-2010. In 2011, Info Security Products Guide recognized MIX as thewinner of the 2011 Global Excellence Award in the Cloud category. The Info Security Product Guiderecognition, together with previous awards received for EFT Server, broadened our portfolio of industry andmarket validations for our cloud-based solutions.
Hosted Enhanced File Transfer Server. In 2011, we introduced our Hosted Enhanced File Transfer Service.This service expands our cloud-based solution portfolio by integrating a hosted version of our market-leadingEFT Server solution with Rackspace Hosting, Peer 1 and other partner infrastructure. While this scalable andtiered service is structured for the small-to-medium business, or SMB, market, it allows customers of all sizes tooutsource all or part of their complex and demanding secure information exchange needs. Through suchoutsourcing, customers can greatly reduce costs, increase efficiencies, track and audit transactions, and provide agreater level of security and compliance, at affordable price points. The Hosted EFT Server offering deliversthese benefits while allowing direct customer management of the EFT Server solution (as contrasted with thefully managed MIX service)
Software as a Service Solutions
SaaS delivers a software application over the Internet, or across other networks, to users on an on-demandbasis. The SaaS delivery model allows central administration and maintenance of the application with user accessprovided through a provider hosted website. SaaS appeals to many prospective customers because it uses cloudcomputing approaches in which the customer does not need to install special software on the computer systemsaccessing the application. SaaS eliminates the need for the customer to purchase, install and maintain servers andother IT infrastructure to use and maintain the software.
15
Our SaaS solution, CuteSendIt, is a file transfer service for individuals, professionals, and businesses.CuteSendIt uses cloud computing approaches to deliver files through a hosted web portal. This solution approachmeets the needs of users who do not have, or wish to invest in, file transfer infrastructure such as FTP servers orclient application software. The solution scales from single-user to multi-user licensing with varying file transfercapabilities based, for example, on a maximum number of files, the aggregate data volume for files transferredeach month or the amount of long-term online storage required for the files.
Users access the CuteSendIt application over the Internet using a standard web browser, securely uploadfiles (up to multi-GB) through the portal and compose a brief message to accompany the file delivery.CuteSendIt then sends the message to the recipients as the body of an e-mail message. This e-mail message alsoincludes links to the files uploaded through the CuteSendIt web portal. Anyone with an Internet connection canaccess this service at www.cutesendit.com. There is no software to install with CuteSendIt, and no specificknowledge of file transfer is needed to use it.
Secure Content Mobility Solution
We believe secure content mobility is a rapidly emerging central feature of our served markets, includingour primary MFT market. Exponential growth in smartphone and tablet sales and adoption, combined with rapidgrowth in retained content and BYOD expectations, will drive strong growth in this market segment. Weacquired TappIn, Inc. in December 2011 to provide us with initial entry into the secure content mobility market.
The TappIn GlobalSCAPEservice provides the ability to easily and securely access and share documents,pictures, videos and music anytime, anywhere while eliminating or minimizing the storage of data in the cloudand the associated security and privacy concerns. From the office, at home, or on the road, customers can “TappIn” to their files, stored in multiple locations, using any web browser and most Internet-enabled mobile devices(including Apple iPhone and iPad, Google Android and Windows Phone and Kindle Fire). With TappIn, userscan avoid uploading and/or syncing to a cloud storage location and eliminate the need to pay for additional cloudstorage. Instead, the TappIn service securely accesses the user’s existing in-house storage devices (such as adesktop computer, in-house network servers or network attached storage devices), allows sharing files of any sizeand provides encryption to safeguard content.
The TappIn GlobalSCAPE service incorporates elements of on-premises software, cloud and SaaS deliverymodels. Unlike other remote access products that can consume significant amounts of storage capacity on asmartphone or tablet, TappIn makes content available through a secure pathway that gives users access to files ontheir existing in-house storage devices without having to download those files to their mobile device. Thisdelivery method not only saves storage space on the mobile device but also ensures content remains secure andprivate on the user’s existing in-house storage devices.
We first offered these secure content mobility capabilities through our TappIn Standard Edition. In October2012, we introduced TappIn Professional Edition, offering additional features that build upon our TappInStandard Edition. These additional features include:
• Administrative capabilities that enable businesses (and their system administrators) to manage groupsof users associated with the TappIn Professional Edition subscription.
• An “OnTapp” capability that allows subscribers to access and share files when their permanent storagedevice is turned off or in sleep mode by storing selected files, for a user-defined period of time, in atransactional cloud repository without modifying the ongoing ability to access files stored on the user’sexisting in-house storage devices.
• Integration with Salesforce.com that enables access to information stored within a Salesforce.comaccount through the same interface used to access content stored on the user’s existing, in-housestorage devices.
16
The TappIn mobile file access capabilities are integrated with our EFT Server solution. The Secure MobileAccess Module allows businesses and IT departments to better support the rapidly growing BYOD trend.
TappIn solutions are available through direct sales and channel partners. TappIn enables channel partners toprovide end-users with secure mobile access to rich-media content. TappIn’s OEM strategy is geared towardthree major technology categories – hardware devices, content security software and SaaS providers, and carriersand network operators – and is designed to provide industry leading secure access and file sharing capability.Hardware manufacturers may preload certain levels of TappIn functionality on their hardware devices.Customers who purchase those devices are presented the TappIn solution and provided the opportunity toupgrade to a higher service level such as upgrading to the Professional Edition from the Standard Edition or tothe Standard Edition from trial usage.
We have established OEM relationships with hardware manufacturers such as QNAP, Seagate, and mostrecently, Scale Computing. We also have been selected by SnappCloud as one of the preferred secure file accessand sharing solutions for all Toshiba product users and OEM partners. In the area of content security software,we have signed an agreement with ESET, a leading provider of anti-virus software, under which ESET will offerTappIn’s secure content mobility solution to customers wanting remote access and file sharing capability.
Most recently in the area of SaaS and hosting services providers, we announced an agreement under whichthe TappIn solution will be included on the Rackspace Cloud Tools Marketplace. After downloading the TappInsolution, Rackspace customers will receive a 30-day free trial of the TappIn Professional Edition. Following thefree trial period, customers can choose to subscribe to either the Professional Edition or Standard Edition. Theserelationships, as well as other contracted and potential business arrangements, provide TappIn with direct accessto well-established, synergistic, distribution channels.
TappIn has won numerous awards and accolades from leading industry authorities, including:
• In December 2011, TappIn was selected as a Red Herring 2011 Top 100 Global award recipient, aprestigious recognition honoring the year’s most audacious and far reaching private technologycompanies and entrepreneurs from across the globe.
• In February 2012, the TappIn solution was recognized by Info Security Products Guide as a GlobalExcellence Award winner in the Software as a Service (SaaS)/Cloud Solutions category.
• In April 2012, the TappIn solution also was named a finalist in the Network Products Guide 2012 BestProducts and Services Awards in the “Mobile/Wireless Solution” category.
Professional Services
We offer a range of professional services to complement our software and cloud-based solutions. Theseprofessional services include product customization and system integration, solution “quickstart”implementations, business process and workflow, policy development, education and training, and health checks.In addition, we may provide longer-term engineering services, including supporting multi-year contracts, ifnecessary to support certain solution implementations and integrations.
Product Customization and System Integration.
Through our product customization and system integration services, we customize the branding, reporting,and administration capabilities of our solutions to meet specific customer requirements. Typical deliverablesinclude customized implementations, documentation for installations and customizations, and the installerprograms necessary to install or reinstall the applicable solutions, drivers, and other software included in thecustomization and systems integration project.
17

Custom Branding. Custom branding services allow customers to incorporate logos, different fonts, colors,hyperlinks, and additional text within the Web Transfer Client and the SAT module used with our EFT Serversolution and Mail Express products.
Custom Reporting. Custom reporting services leverage the flexibility and power of the Auditing andReporting Module used with our EFT Server solution to deliver customer-specific formatting and content usingdata tracked within the EFT Server solution. Custom reporting services also can provide customers with a webbrowser-accessible reporting module for the EFT Server solution. This module allows users to generate reportswithout requiring administrative access to the EFT Server.
Custom Administration and System Integration. Custom administration and system integration servicesprovide web-based administration and development capabilities for our EFT Server solution. A browser-accessible administrative module facilitates sub-domain administration of EFT Server through separation ofduties. The web-based user provisioning does not require full administrative access to the EFT Server andprovides convenient access without the need to install client software. Other web services-based customizationsexpose much of the functionality within the EFT Server component object model (COM) applicationprogramming interface (API). Exposure of the COM API allows integration with a customer’s existing ITinfrastructure via open standards.
Solution Quickstart Implementation
Our Quickstart Implementation services accelerate implementation of our file transfer solutions withincustomer IT environments. Our engineers lead the product installation and configuration and provide training andknowledge transfer to customer administrators. Quickstart Implementation services are available for the EFTServer, WAFS, and Mail Express secure information exchange solutions. Typical deliverables includerequirements documentation, implementation plans, and configuration documentation.
Business Process and Workflow
Business Process and Workflow services include workflow site surveys and implementation of the AWEModule used with our EFT Server solution. The workflow site surveys assist customers with documentingbusiness processes as they pertain to information delivery and sharing associated with file transfers. Typicaldeliverables include business process documentation for file transfers, recommendations for process automation,workflow implementation and use documentation, and installation of the AWE module for use with the EFTServer solution.
Policy Development
Policy Development services help customers establish and implement file transfer policies that addressregulatory requirements and comply with corporate policies. Typical deliverables include a map or census ofexisting file transfer policies, standards, and procedures, recommended improvements based on our best practicesand updated policy documentation with customer-approved improvements.
Education and Training
Education and Training services provide classroom and hands-on instruction for implementing, maintainingand optimizing our secure information exchange solutions. Intermediate and advanced classes cover the use ofour EFT Server solution. We also provide business process instruction tailored to the AWE module. We candeliver training at customer facilities or from our offices. Typical deliverables include the instruction hours plustraining materials and solution documentation.
18
Health Checks
Health Check services provide customers with periodic assessments, education, and training, to help themget the most value from our solution implementations. These services also allow customers to more easilymaintain currency with the latest versions of our software and with best practices for sustaining and enhancingthe deployments.
Longer-Term Engineering Services
In addition to the previously described professional services, we have developed our capacity to deliverlonger-term engineering services. Beginning in 2010 we have been a subcontractor on the McLane AdvancedTechnologies (MAT) industry team supporting the U.S. Army Standard Army Maintenance System (SAMS-E)program. As part of the MAT industry team, we are providing professional and technical services to support theSAMS-E program, including the EFT solution (known as Secure FTP Server before the release of Enhanced FileTransfer Server 6 in early 2009) and CuteFTP solutions integrated into the SAMS-E environment. We havedeployed several engineers onsite at the MAT facility. We continue to adjust the size of this team as required tobest support contract requirements. Our increased capacity to deliver longer-term professional services also maybe applicable to the commercial sector as we work closely with our enterprise customers to help them bestsustain their secure information exchange solutions and infrastructure.
Sales and Marketing
We emphasize developing our direct sales staff and reseller channels to capture those sales through a highlevel of individual attention to the customer. For example, sales of our more complex enterprise solutions, suchas EFT Server, WAFS and Mail Express, sales to larger enterprises, and sales of managed solutions and M&Scontracts are delivered by our direct sales staff and resellers in an environment of personal interaction with thecustomer.
We provide our sales staff and resellers with training and professional development opportunities to ensurethey are capable of meeting the needs of our prospects and customers. These sales team development activitiesfocus on technical and process-oriented topical areas to enhance their ability to identify prospects, best positionour solutions and develop pipeline opportunities into sales.
Our reseller and distributor relationships allow us to increase our market reach, particularly when pursuinginternational sales. We have established such relationships within specific industries, such as the governmentsector, and in multiple geographies outside of North America in, for example, Europe, Australia, Asia, LatinAmerica, and Africa.
We also sell our file transfer client programs, such as CuteFTP, as well as EFT Standard Edition, certain ofour EFT solution add-on modules, and CuteBackup via download from our www.cuteftp.com website.Prospective buyers may use certain of our software products for free during an evaluation period that is typicallyfor thirty days. The programs are automatically disabled if a license is not purchased by the end of the trialperiod. Our software is also available for download from a variety of independent Internet software sites such asCNet’s Download.com, as well as sites in Western Europe, Canada, Australia, and Asia.
We offer our TappIn solutions for trial and subscription activation from our www.tappin.com website. Aswith our software solutions, prospective subscribers may use the TappIn service for free during an evaluationperiod. At the end of the evaluation period, the TappIn service is automatically downgraded unless theprospective customer activates a paid subscription.
In addition to the www.cuteftp.com and www.tappin.com websites, we also maintain a corporate website,www.globalscape.com. Our corporate website provides a variety of sales and marketing information for ourenterprise solutions. The website also includes links to the www.cuteftp.com and www.tappin.com websites tofacilitate cross-marketing and potential promotions.
19
The segmentation and re-launch of our websites, implemented in 2012, allows us to leverage the websitesfor marketing communication activities oriented toward specific market segments. We continually update thedesign of our websites to be responsive to the evolving marketplace and to provide a more solution-orientedperspective of our business, improve site navigation and provide additional opportunities for visitors to contact usthrough the websites.
The websites also provide an effective means of facilitating certain post-sale customer support functions. Tofacilitate self-help for common inquiries and issues, we provide free customer support via searchable knowledgebases on our websites. We also sell maintenance and support plans to customers requiring assistance from oursupport services team.
Our marketing activities consist primarily of online paid advertising (for example, Google AdWords),improvement of natural search-engine results, marketing communications initiatives such as press releases andincreased media outreach, and attendance at key industry trade shows, such as the RSA Security Conference. Wealso provide an online chat capability that allows us to interact in real time or near-real time with visitors to ourwebsite. Our reliance on online paid advertising has declined in recent years as we have transitioned to a morestrategic business development and sales approach based on the personal interaction discussed above. We alsohave reduced our reliance on online paid advertising by conducting ongoing search-engine optimization toenhance our ranking for particular key words in natural search results of major search engines.
Customers
Our solutions have been sold to most of the Fortune 100 companies. Our products have been sold into morethan 150 countries. No single customer accounts for more than 10 percent of our revenue.
We continue to derive most of our revenue from commercial customers in the U.S., U.K., Canada, andAustralia. Our primary commercial vertical markets include finance, health care, energy, retail, manufacturing,and engineering. We also have a customer base in the local, state, and federal government spaces. We continue topursue additional government business by leveraging our certifications and industry validations.
Seasonality
Our products are marketed to individuals as well as large organizations. As a result of this mix within ourcustomer base, we typically have not experienced significant seasonality in our sales other than a typical modestdecline in first quarter sales as compared to fourth quarter results. We believe this seasonality is related to ourcontinued growth as an enterprise solution provider operating in an environment where first quarter salespossibly slow as prospective customers begin to execute their business activities, including purchases of oursolutions, in accordance with new-year budgets and plans.
Network and Equipment
We have contracted with various network providers for Internet access. Our arrangements provide forredundancy in the event of a failure, and also for expansion of available bandwidth in the event that there is adramatic increase in demand. To protect critical customer data, GlobalSCAPE’s Internet shopping cart utilizesSSL encryption. We maintain technical and physical measures and procedures compliant with the PCI DSS. Weuse a certified Approved Scanning Vendor and to verify our compliance with the PCI DSS.
We have dedicated servers on and off site and expansion plans in place to allow rapid and cost effectivescalability. Our offsite servers and data backup procedures provide a warm backup to our onsite servers forcontingency purposes. The backups are performed in accordance with our disaster recovery plan.
20

Research and Development
Our internal software engineers are responsible for software design, managing the development process,testing and quality assurance. We utilize offshore developers for a portion of the coding phase of softwaredevelopment for certain products. Our use of external developers allows us to tap into a highly skilled labor pool,maintain a 24-hour development schedule, decrease time to market, and minimize programming costs.
All phases of development, including scope approval, functional and implementation design, objectmodeling and programming, are subject to extensive internal quality assurance testing. We maintain an ongoingfocus on improving our quality assurance testing infrastructure and practices. Technical reporting, for examplethrough WinQual, and customer support feedback confirm the continuing positive effect of our ongoingenhancement of research and development and quality assurance processes.
In 2012, we expended $3.5 million on research and development of which we capitalized $330,000 with theremainder recorded as research and development expense. In 2011 and 2010, we expended $3.1 million and $3.0million, respectively, on research and development all of which was recorded as research and developmentexpense with none capitalized. We expect to continue to increase our research and development spending infuture years as we focus improving our current products and introducing new products.
Competition
The file management, content management and Web development software market sectors are intenselycompetitive, subject to rapid change and significantly affected by new product introductions and other activitiesof market participants. Our primary competitors vary by product.
We have limited information regarding the market shares of our solutions in their respective categories.Many of our competitors have substantially greater financial, technical, sales, marketing, personnel, and otherresources, as well as greater name recognition and a larger customer base than we do. Significant competitioncharacterizes the markets for our traditional MFT products. We anticipate we will continue to face increasingpricing pressures from competitors in the future. Given there are low barriers to entry into the software market,and the market is subject to rapid technological change, we believe that competition will persist and intensify inthe future. For more discussion on the risks associated with our competition, you should read the informationunder “Risk Factors — Risks Related to Operations.”
EFT Standard Edition. EFT Standard Edition competes against a limited number of secure, Windows-based FTP servers. We believe our primary competitors are products sold by Ipswitch, SolarWinds (through theirDecember 2012 acquisition of RhinoSoft) and JSCAPE. EFT Standard Edition has the advantage of leveragingthe success of CuteFTP through product integration, offering proprietary extensions to the FTP protocol, andcross-marketing efforts to an existing customer base. EFT Standard Edition also benefits from being part of ourEFT platform, which includes add-on modules, including the DMZ Gateway solution, and an upgrade path toEFT Enterprise Edition.
EFT Enterprise Edition. EFT Enterprise Edition competes in the managed file transfer server market. Webelieve our primary competitors are Axway, Ipswitch, IBM-Sterling Commerce and Tibco (including throughtheir acquisition of Proginet). EFT Enterprise Edition has the advantage of being very cost effective in its marketand allowing customers to flexibly evolve their MFT implementation by procuring add-on modules such as ourDMZ Gateway and Advanced Workflow Engine solutions.
CuteFTP. CuteFTP exists in a highly competitive environment with numerous FTP software utilitiesavailable on the Internet for both the personal and professional user. CuteFTP is positioned as one of the onlysecure FTP client programs that support a wide range of security standards related to the FTP protocol. We
21
believe our primary competitors are consumer file transfer solutions sold by Ipswitch, Inc., SolarWinds(RhinoSoft) and products offered by Van Dyke Software, Inc. CuteFTP was the second Windows-based FTPclient to market and is consistently among the most frequently downloaded FTP clients on popular downloadsites. CuteFTP Mac, our FTP client for the Macintosh platform, competes with products offered by FetchSoftworks, Interachry, Nolobe Software Pty Ltd, and Panic, Inc.
WAFS. WAFS competes in the Wide Area File Services/Storage market. We believe our primarycompetitors are Riverbed, Blue Coat and Cisco, who are delivering proprietary appliances. We believe thatWAFS has the advantage of being a software-only solution which leverages corporate infrastructure andminimizes the total cost of ownership.
CDP. CDP competes in the highly competitive continuous data protection market. We believe our primarycompetitors are CA XOsoft, Vision Solutions, and Symantec (Veritas). We believe CDP has the advantage oftransparently and continuously capturing data from local and remote servers, eliminating the backup window andrestoring data rapidly.
Mail Express. Mail Express competes in areas of the file transfer market associated with e-mail attachmentoffloading. We believe our primary competitors are Accellion, Tibco (Proginet), Leapfile and Biscom. MailExpress has the advantage of centralized policies for outbound file attachments and a transparent end-userexperience, which allows for rapid customer deployments. Mail Express also has the benefit of integration withour most recent EFT release which provides customers with a more uniform administration experience for e-mailattachment offloading and traditional MFT operations.
Cloud-based Managed Solutions for Secure Information Exchange. Our MIX and Hosted Enhanced FileTransfer solutions compete with MFT SaaS solutions. We believe our primary competitors are Ipswitch, Axway,IBM-Sterling Commerce, Thru, Inc. and Accellion. MIX and Hosted Enhanced File Transfer have the advantageof leveraging cost effective, secure hosting and cloud infrastructures, as well as Enhanced File Transfermanagement services provided by GlobalSCAPE’s experts.
TappIn. The TappIn solution has direct competitors such as PogoPlug and FileTek. In addition, TappIncompetes for mindshare in the market with pure-play cloud data repositories like Dropbox and Box and withcomputer remote control solution such as Citrix Systems (GoToMyPC) and LogMeIn.
CuteBackup. CuteBackup competes in a highly competitive, and even saturated, market for on-premisesbackup solutions. While there are few means of differentiation in such an environment, CuteBackup allows us tomake opportunistic sales, particularly to customers who visit our website for other solutions, such as CuteFTP, orwho wish to contract with one vendor for multiple products (for example, for consistency of support).
CuteSendIt. CuteSendIt competes in the SaaS segment of the file transfer market. There are a large numberof competitors, but we believe our primary competition includes YouSendIt, LeapFILE, Dilbert Files, DropSend,SendThisFile, Box and Pando. CuteSendIt has the advantage of supporting multiple users, allowing larger files tobe sent, and providing additional file tracking. However, some of the competitors offer significant capabilities forfree.
Governmental Regulation
Export Control Regulations. All of our products are subject to U.S. export control laws and applicableforeign government import, export and/or use requirements. The level of control generally depends on the natureof the goods and services in question. For example, the level of control is impacted by the nature of the softwareand encryption incorporated into our products. Where controls apply, the export of our products may require anexport license or authorization or that the transaction qualify for a license exception or the equivalent, and may
22
also be subject to corresponding reporting requirements. For the export of some of our products, we may besubject to various post-shipment reporting requirements. Minimal U.S. export restrictions apply to all of ourproducts, whether or not they perform encryption functions. Additionally, because GlobalSCAPE is aDepartment of Defense contractor, there are certain registration requirements that may be triggered by our sales.In addition, certain GlobalSCAPE items and/or transactions may be subject to the International Traffic in ArmsRegulations (ITAR) if our software or services are specifically designed or modified for defense purposes.Companies engaged in manufacturing or exporting ITAR-controlled goods and services (even if these companiesdo not export such items) are required to register with the U.S. State Department.
Enhancements to existing products may, and new products will, be subject to review under the ExportAdministration Act to determine what export classification they will receive. In light of the ongoing discussionsregarding anti-terrorism legislation in the U.S. Congress, there continues to be discussions regarding the correctlevel of export control. Export regulations may be modified at any time. Modifications to the export regulationscould reduce or eliminate our ability to export some or all of our products from the U.S. without a license in thefuture, which could put us at a disadvantage in competing for international sales compared to companies locatedoutside of the U.S. that would not be subject to these restrictions. Modifications to the export regulations couldprevent us from exporting our existing and future products in an unrestricted manner without a license or make itmore difficult to receive the desired classification. If export regulations were to be modified in such a way, wemay be put at a competitive disadvantage with respect to selling our products internationally. We are working onenhancing our systems to address the impact of these regulations on our products and services and understand theneed to comply. We will complete technical reviews on any new products that we acquire or develop that may besubject to the requirements before we can export them.
Privacy Laws. As our business evolves to incorporate more cloud and SaaS solutions, we will receive,transmit, and store more and more information. As a result, we may be subject to various federal and Stateregulations regarding the protection of personally identifying information. Applicable laws may include, withoutlimitation, federal laws such as the GLBA and HIPAA, as well as state and regulations in the U.S., asinternational laws and regulations including the European Union Data Protection Directive. In the event oursystems are compromised by an unauthorized party, many of these privacy laws require that we provide noticesto our customers whose personally identifiable data we reasonably believe may have been compromised. Tomitigate the risk of compromised information, we use encryption and other security to protect our databases.
Intellectual Property
We regard some of the features of our internal operations, software, and documentation as proprietary andrely on copyright, patent, and trademark and service mark laws and trade secret protection, such asconfidentiality procedures, contractual arrangements, non-disclosure agreements and other measures to protectour proprietary information. Our intellectual property is an important and valuable asset that enables us to gainrecognition for our products, services, and technology and enhance our competitive position and market value.
As part of our confidentiality procedures, we generally enter into non-disclosure agreements with ouremployees and independent contractors, resellers, and corporate partners. We enter into license or subscriptionservices agreements with respect to our software, documentation, and other proprietary information. Our standardlicense agreements are transferable only in limited circumstances and have a perpetual term. Our subscriptionservices agreement for our hosted solutions restrict access and have a definite term. We also educate ouremployees on trade secret protection and employ measures to protect our facilities, equipment, and networks.
Our trademarks and copyrights are central to our business. We have U.S. federal trademark registrations forGlobalSCAPE, GlobalSCAPE and design, CuteFTP, CuteFTP Pro, CuteBackup, CuteSendIt and design, DMZGateway, Enhanced File Transfer Server and design, Availl, Mail Express, and Mail Express and design, andSnapEdit and pending U. S. federal trademark applications for appshield, appShield and design, CuteSendit and
23
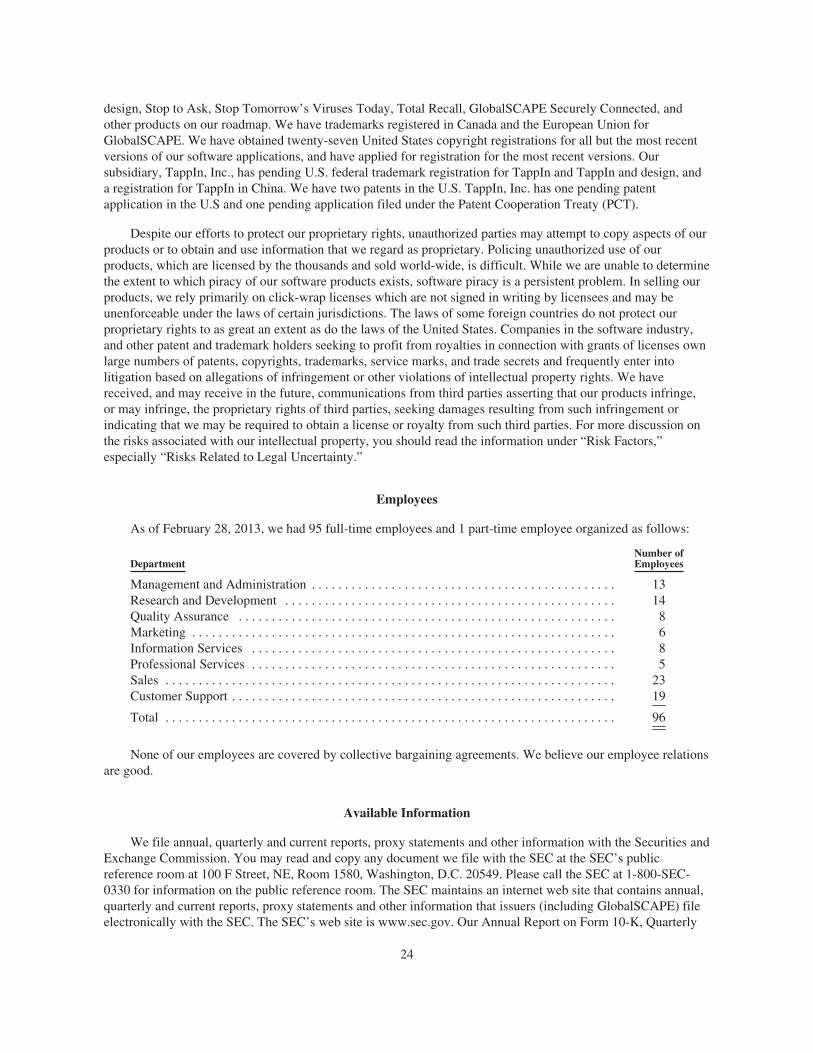
design, Stop to Ask, Stop Tomorrow’s Viruses Today, Total Recall, GlobalSCAPE Securely Connected, andother products on our roadmap. We have trademarks registered in Canada and the European Union forGlobalSCAPE. We have obtained twenty-seven United States copyright registrations for all but the most recentversions of our software applications, and have applied for registration for the most recent versions. Oursubsidiary, TappIn, Inc., has pending U.S. federal trademark registration for TappIn and TappIn and design, anda registration for TappIn in China. We have two patents in the U.S. TappIn, Inc. has one pending patentapplication in the U.S and one pending application filed under the Patent Cooperation Treaty (PCT).
Despite our efforts to protect our proprietary rights, unauthorized parties may attempt to copy aspects of ourproducts or to obtain and use information that we regard as proprietary. Policing unauthorized use of ourproducts, which are licensed by the thousands and sold world-wide, is difficult. While we are unable to determinethe extent to which piracy of our software products exists, software piracy is a persistent problem. In selling ourproducts, we rely primarily on click-wrap licenses which are not signed in writing by licensees and may beunenforceable under the laws of certain jurisdictions. The laws of some foreign countries do not protect ourproprietary rights to as great an extent as do the laws of the United States. Companies in the software industry,and other patent and trademark holders seeking to profit from royalties in connection with grants of licenses ownlarge numbers of patents, copyrights, trademarks, service marks, and trade secrets and frequently enter intolitigation based on allegations of infringement or other violations of intellectual property rights. We havereceived, and may receive in the future, communications from third parties asserting that our products infringe,or may infringe, the proprietary rights of third parties, seeking damages resulting from such infringement orindicating that we may be required to obtain a license or royalty from such third parties. For more discussion onthe risks associated with our intellectual property, you should read the information under “Risk Factors,”especially “Risks Related to Legal Uncertainty.”
Employees
As of February 28, 2013, we had 95 full-time employees and 1 part-time employee organized as follows:
DepartmentNumber ofEmployees
Management and Administration . . . . . . . . . . . . . . . . . . . . . . . . . . . . . . . . . . . . . . . . . . . . . . 13Research and Development . . . . . . . . . . . . . . . . . . . . . . . . . . . . . . . . . . . . . . . . . . . . . . . . . . 14Quality Assurance . . . . . . . . . . . . . . . . . . . . . . . . . . . . . . . . . . . . . . . . . . . . . . . . . . . . . . . . . 8Marketing . . . . . . . . . . . . . . . . . . . . . . . . . . . . . . . . . . . . . . . . . . . . . . . . . . . . . . . . . . . . . . . . 6Information Services . . . . . . . . . . . . . . . . . . . . . . . . . . . . . . . . . . . . . . . . . . . . . . . . . . . . . . . 8Professional Services . . . . . . . . . . . . . . . . . . . . . . . . . . . . . . . . . . . . . . . . . . . . . . . . . . . . . . . 5Sales . . . . . . . . . . . . . . . . . . . . . . . . . . . . . . . . . . . . . . . . . . . . . . . . . . . . . . . . . . . . . . . . . . . . 23Customer Support . . . . . . . . . . . . . . . . . . . . . . . . . . . . . . . . . . . . . . . . . . . . . . . . . . . . . . . . . . 19
Total . . . . . . . . . . . . . . . . . . . . . . . . . . . . . . . . . . . . . . . . . . . . . . . . . . . . . . . . . . . . . . . . . . . . 96
None of our employees are covered by collective bargaining agreements. We believe our employee relationsare good.
Available Information
We file annual, quarterly and current reports, proxy statements and other information with the Securities andExchange Commission. You may read and copy any document we file with the SEC at the SEC’s publicreference room at 100 F Street, NE, Room 1580, Washington, D.C. 20549. Please call the SEC at 1-800-SEC-0330 for information on the public reference room. The SEC maintains an internet web site that contains annual,quarterly and current reports, proxy statements and other information that issuers (including GlobalSCAPE) fileelectronically with the SEC. The SEC’s web site is www.sec.gov. Our Annual Report on Form 10-K, Quarterly
24

Reports on Form 10-Q, Current Reports on Form 8-K and other reports and amendments filed with the Securitiesand Exchange Commission are available free of charge on our web site at www.globalscape.com in the InvestorRelations section as soon as practicable after such reports are filed. Information on our website is notincorporated by reference into this Form 10-K and should not be considered part of this report or any other filingthat we make with the SEC.
Item 1A. Risk Factors
We have described below risks we are aware of that could have a material adverse effect on our business,financial results of operations and financial condition and the value of our stock owned by our shareholders.
Risks Related to Our Operations
A significant portion of our revenue is generated through maintenance and support revenue; decreases inmaintenance and support sales or renewal rates, or a decrease in the number of new licenses we sell, willnegatively impact our future revenue and financial results.
Revenue from maintenance and support services, or M&S, we provide our customers comprised 48%, 45%and 42% of our total revenue in 2012, 2011 and 2010 respectively. We earn M&S revenue from new M&Scontracts, typically sold with new software licenses, and from renewals of such contracts. Any reduction in thenumber of new software licenses that we sell, or a reduction in sales of associated initial M&S contracts,therefore may have a long-term negative impact on our future M&S revenue, even if our customers continue torenew M&S contracts at historical rates. This situation, in turn, would impact our business and harm our financialresults.
Our customers have no obligation to purchase M&S with their initial software license or renew their M&Scontract after the expiration of their initial M&S period, which is typically one year. Our customers’ purchases ofM&S, and our renewal rates, may decline or fluctuate as a result of a number of factors, including the overallglobal economy, the health of their businesses, and the perceived value of the M&S program. If our customers donot purchase M&S with their initial software license or renew their M&S contract for our products, our M&Srevenue will decline and our financial results will suffer. In addition, a substantial portion of our quarterly M&Srevenue is attributable to M&S agreements entered into during previous quarters. As a result, if there is a declinein renewed M&S agreements in any one quarter, only a small portion of the decline will be reflected in our M&Srevenue recognized in that quarter and the remainder will be reflected in our M&S revenue recognized in thefollowing four quarters or more and in a decrease in deferred revenue on our balance sheet. For moreinformation, see Item 7, “Management; Discussion and Analysis of Financial Condition and Results ofOperations”.
If we are unable to develop, offer and deliver new and enhanced products and services that achievewidespread market acceptance, or if we are unable to continually improve the performance, features, andreliability of our existing products and services, our business and operating results could be adversely affected.
Rapid technological changes, as well as changes in customer requirements and preferences, characterize thesoftware industry. Just as the transition from mainframes to personal computers transformed the industry thirtyyears ago, we believe our industry may transform in response to continued adoption of mobile devices and cloudservices, growth of big data, and potential emergence of capabilities resulting from disruptive innovation. Inresponse, we have devoted significant resources to the development of new solutions, such as our cloud-basedand secure content mobility services. We are making such investments through our internal efforts, includingfurther development and enhancement of our existing products, as well as through acquisitions of new productlines. Innovation, new product development or acquisition, and go-to-market activities involve a significantcommitment of time and resources and are subject to a number of risks and challenges including:
• Developing, sustaining, and appropriately leveraging market intelligence to identify areas of marketneed that offer potentially high return on investment for solution development.
25
• Managing the length of the development cycle for new products and product enhancements, which maybe longer than originally expected.
• Adapting to emerging and evolving industry standards and to technological developments by ourcompetitors and customers.
• Extending the operation of our products and services to new platforms and operating systems.
• Entering into new or unproven markets with which we have limited experience.
• Managing new product and service strategies, including integrating our various security and filereplication technologies, management solutions, customer service, and support into unified enterprisesecurity and file replication solutions.
• Incorporating acquired products and technologies.
• Developing or expanding efficient sales channels.
• Obtaining sufficient licenses to technology and technical access from operating system softwarevendors on reasonable terms to enable the development and deployment of interoperable products,including source code licenses for certain products with deep technical integration into operatingsystems.
Investments in new products may not result in sufficient revenue generation to justify their costs, or maycause short or long-term harm to our financial results. For example, customer adoption of our cloud and mobilecomputing services may not occur as rapidly as anticipated, or competitors may introduce new products andservices that achieve acceptance among our current customers, adversely affecting our competitive position, orwe may not be successful in future attempts to achieve disruptive innovation.
Further, given the rapid speed of changing customer expectations and advancement of technology inherentin the software industry, the extensive and complex efforts required to create useful and widely acceptedproducts and the rapid evolution of cloud computing, mobile devices, new computing platforms and othertechnologies, our executive management team must act quickly, continuously and with vision. Although we havearticulated a strategy that we believe will fulfill these challenges, if we fail to execute properly on that strategy,adapt that strategy as market conditions evolve, or fail to internalize and execute on that strategy, we may fail tomeet our customers’ expectations, fail to compete with our competitors’ products and technology and lose theconfidence of our channel partners and employees. This in turn could adversely affect our business and financialperformance.
We earn the large majority of our revenue and operating margins from our Enhanced File Transfer, licensedsoftware solution suite and related maintenance and support services and, as a result, are highly dependentupon the continued success of this product line.
Our Enhanced File Transfer solution, or EFT, is one of our on-premises, managed file transfer solutionstargeted primarily to the enterprise and small and medium business user environments. This product line wasresponsible for over 75% of our revenue in 2012 and has provided substantially all of our recent revenue growthand most of the operating margin necessary to fund our operations including, most notably, our sales andmarketing and research and development activities. Declines and variability in demand for the EFT solutioncould occur as a result of:
• Improved products or product versions being offered by competitors in our markets.
• Competitive pricing pressures.
• Failure to release new or enhanced versions of the EFT solution on a timely basis, or at all.
• Technological change that we are unable to address with file transfer products or that changes the wayenterprises utilize our products.
• General economic conditions.
26

Due to our product concentration, our business, results of operations, financial condition, and cash flowswould therefore be adversely affected by a decline in demand for the EFT solution suite.
We may not achieve our expected future financial results from our other product lines and services thatinclude Mail Express, Wide Area File Services, CuteFTP, Managed Information Xchange, Hosted EnhancedFile Transfer, TappIn and professional services.
Revenue from our products other than the EFT solution accounted for less than 25% of our total revenue in2012. Our revenue from these other products, and the related operating margins they contributed, generallydeclined in 2012 compared to 2011.
Improving, and possibly even sustaining, our financial results is dependent upon achieving additionalsuccess in the marketplace with our products and services that complement and supplement our EFT solutionsuite. These products and services include CuteFTP, Mail Express, Wide Area File Services, ManagedInformation Xchange, Hosted Enhanced File Transfer and TappIn. These solutions involve serving markets thatin some ways differ from the markets we encounter when selling EFT software and maintenance. Gainingadditional traction in such markets will require that we market, sell, and support these solutions effectively. Eachof these success factors has inherent risks due to, for example, our limited corporate expertise in the adjacentmarkets and the possibility that the specific buyers of solutions in these adjacent markets may be different fromthe buyers with whom we interact throughout our traditional EFT solution sales cycle. Entering, obtainingtraction, and sustaining growth in these markets requires investments in engineering, marketing, sales, customersupport, and internal business systems. If we do not effectively penetrate these markets, or if the resourcesnecessary to effectively address these markets exceed our expectations, our business and financial results couldbe adversely affected.
Our Managed Information Exchange, Hosted Enhanced File Transfer and TappIn solutions are cloud-basedservices. We believe these cloud-based services potentially provide a significant revenue opportunity tosupplement our EFT business. Cloud-based services are a relatively new solution area for us that requiretechnology development, marketing, sales and customer support techniques that can be distinctly different fromthose items as they relate to our EFT software that is installed on-premises at a customer location. Ourexperience suggests that it will continue to take time to obtain market traction with these solutions and to identifythe trends necessary to develop projections of future business performance. It is difficult to determine when, or if,our ongoing investment in these products lines will achieve the desired levels of sales and contribution margins.If our ongoing development, marketing and sales of these products does not evolve as anticipated, our businessand financial results could be adversely affected.
A material portion of our professional services revenue is earned under our contract with McLane AdvancedTechnologies, or MAT, in connection with their services to the U.S. Army. While we continue to earnprofessional services revenue under the MAT contract, the amount of our professional services requested byMAT has declined such that this revenue decreased in 2012 compared to 2011. Our contract with MAT expires in2013. MAT is under no obligation to renew or extend this contract. Should this contract not be renewed orextended, our business and financial results in the future could be adversely affected.
Our acquisition of TappIn, Inc. in 2011 and possible future acquisitions give rise to risks and challenges thatcould adversely affect our future financial results.
The TappIn acquisition, and acquisitions generally, involve a number of risks and challenges, including:
• Complexity, time, and costs associated with integration of the acquired business operations, workforce,products, and technologies into our existing business, sales force, employee base, product lines,marketing and technology. The possibility exists that the integration ultimately may not be successful.
• Diversion of management time and attention from our existing business and other businessopportunities throughout the integration.
27
• Potential loss or termination of employees, including costs associated with the termination orreplacement of those employees.
• Assumption of debt or other liabilities of the acquired business, including any future litigation relatedto alleged liabilities of the acquired business.
• The incurrence of additional acquisition-related debt as well as increased expenses and working capitalrequirements.
• Potential dilution of earnings per share.
• Increased costs and efforts in connection with compliance with Section 404 of the Sarbanes-Oxley Act.
• Potentially substantial accounting charges for restructuring and related expenses, write-off of in-process research and development, impairment of goodwill, amortization of intangible assets, andshare-based compensation expense.
The ongoing integration of TappIn, or any other acquired business, involves continually determining andleveraging the actual market synergies, sustaining and even extending the business performance of the acquiredentity, implementing our technology systems in the acquired operations and integrating and managing thepersonnel of the acquired operations. We also must continue to effectively integrate the different cultures ofacquired business organizations into our own culture in a way that aligns various interests.
Through the TappIn acquisition, we entered a new adjacent market in which we had limited experience atthe time of the acquisition. While our knowledge of this market has expanded since the acquisition, the securecontent mobility market is an emerging market, with a wide range of potential solution approaches. Moreestablished, cloud-based data repositories and service providers compete for market share and mindshare withTappIn. Some of these competitors have much stronger market positions than TappIn. The time and expense tomarket, sell and support the TappIn solution and possible future versions of the solution, introduce additional riskto current operations.
Any of the foregoing, and other factors, could harm our ability to achieve anticipated levels of financialperformance from TappIn or to realize other anticipated benefits of the acquisition. In addition, because acquisitionsof technology companies are inherently risky, no assurance can be given that our previous, current, or futureacquisitions will be successful and will not adversely affect our business, operating results, or financial condition.
We may engage third parties to develop products on our behalf; this may involve reliance on resources ownedand managed by those third parties over which we have no direct control.
In addition to researching and developing new products ourselves, we have in the past and may in the futuredecide to evolve and expand our product offerings by engaging third parties to conceive, design and developproducts on our behalf. These arrangements involve high levels of risk due to inherent uncertainties about thetimely delivery and ultimate viability of those products due to the reliance we must place on third parties to plan,perform and successfully complete work for us. These are processes for which we could have notably less directcontrol than if we performed the work ourselves. These arrangements also involve us relying on the ongoingfinancial viability of the enterprise performing the work. This is a challenging risk to manage because we do notalways have clear visibility as to the condition of the overall enterprise. These risks could result in the productnot being successfully completed within the expected timeframe, or at all, as has been the case to date with ourappShield product. If actual results from these type endeavors we may undertake in the future differ materiallyfrom original and ongoing expectations, our business, operating results and financial position could be harmed.
Our addition of subscription services, such as our cloud-based Managed Information Xchange and HostedEnhanced File Transfer solutions in recent years, may impact our prior revenue trends as some opportunitiesthat otherwise would have materialized as software license sales potentially shift to subscription-based sales.
Much of our revenue growth in recent years has been attributable to license and maintenance and supportsales of our EFT solution. Software license sales typically are intended for implementations on customer
28
premises and are recognized as revenue when delivery of the software has occurred and collection of fees fromthe customer is deemed probable. Because revenue from a subscription is recognized ratably over the life of thesubscription, changes in the proportion of sales from software licenses and from subscriptions may result insubstantial changes in our revenue trends and other financial metrics.
License fees for software to be installed at a customer site, such as our EFT solution, are typicallyrecognized in full as revenue at the time the software is delivered to the customer. Subscription services, on theother hand, are recognized as revenue over time as the services are delivered (assuming collection is deemedprobable), typically on a monthly basis. Therefore, only a ratable portion of the total value of a subscriptionservices sale is recognized as revenue each month with the remainder recorded as deferred revenue. The portionof the total value of the subscription recognized as revenue each month decreases as the contract term increasesfrom 12 to 24, or 36 months.
The impact of subscription services on prior revenue growth trends depends on several key factors,including the number of customers who may shift from software licenses to subscription services, the rate atwhich they may do so, the subscription term and fees, and the comparative value of the opportunity had itmaterialized as a software license sale instead of as a subscription service. Generally, for a fixed number ofopportunities (that is, without considering the possibility that a new service offering may result in additional salesopportunities), addition of subscription services reduces revenue growth rates for several quarters for theassociated solutions until cumulative subscription revenue increases and, potentially, surpasses comparablesoftware license revenue. The revenue impacts are particularly pronounced early in the introduction ofsubscription services because there has been only a short time period for accumulation of the recurring revenuestream. As we continue to promote subscription-based services, the risk of this revenue shift will continue withrevenue derived from sales of our EFT solution, the comparable on-premises MFT software in our portfolio, ismost subject to ongoing transitory risk from the introduction of these subscription services. However, to date, wehave seen no material impact from this potential revenue shift in light of the continued strength of our EFT sales.
We rely on third parties to provide us with a number of operational services, including hosting and delivery,certain of our customer services and other operations; any interruption or delay in service from these thirdparties, breaches of security or privacy, or failures in data collection could expose us to liability, harm ourreputation and adversely impact our financial performance.
We rely on hosted computer services from third parties for certain services that we provide our customers.As we gather customer data and host certain customer data in third-party facilities, a security breach couldcompromise the integrity or availability or result in the theft of customer data. In addition, our operations couldbe negatively affected in the event of a security breach, and we could be subject to the loss or theft ofconfidential or proprietary information.
Unauthorized access to this data may be obtained through break-ins, breach of our secure network by anunauthorized party, employee theft or misuse, or other misconduct. We rely on a number of third party suppliersin the operation of our business for the provisioning of various services and materials that we use in the operationof our business and production of our products. Although we seek to diversify our third party suppliers, we mayfrom time to time rely on a single or limited number of suppliers, or upon suppliers in a single country, for theseservices or materials. The inability of such third parties to satisfy our requirements could disrupt our businessoperations or make it more difficult for us to implement our business strategy. If any of these situations were tooccur, our reputation could be harmed, we could be subject to third party liability, including under dataprotection and privacy laws in certain jurisdictions, and our financial performance could be negatively impacted.
29

Fluctuations in professional services revenue may be greater than experienced in previous reporting periodsand have a disproportionate impact on our financial results. For example, increased professional servicessales, especially to the government, may result in lower earnings as a percentage of revenue.
Our solution portfolio includes software licenses, subscription services, and professional services. Becausethey are relatively labor intensive, professional services typically have substantially lower margins than softwarelicense sales, maintenance and support sales and subscription services. However, these services represent astrategic capability that helps customers plan, implement, and sustain our solutions and also provide us with thedemonstrated past performance necessary to participate in certain procurements.
Professional services historically have been less than 10% of our total revenue. However, this percentagecan fluctuate significantly from period to period depending on the needs of our customers. For example, thepersonnel we assigned to the MAT industry team supporting the U.S. Army ’s Standard Army MaintenanceSystem – Enhanced (SAMS-E) program increased in 2011 compared to 2010 and subsequently decreased in 2012compared to 2011 as a result of a change in the scope of services provided to the U.S. Army as determined byMAT. We also may continue to adjust, up or down, our professional services support to the Army, and to othercustomers within the government and commercial sectors, in a given reporting period.
Depending on our mix of software licenses, subscription, and professional services revenue in a givenreporting period, our earnings as a percentage of revenue may fluctuate from historical norms. For example, if wewere to derive a relatively large (compared to historical norms) component of our revenue from professionalservices in a reporting period, earnings as a percentage of revenue may decline in that period due to lower margincontribution from the labor-intensive services as compared to software license and subscription service revenue.
An inability to establish vendor specific objective evidence of the selling price of one or more components of asoftware sale with multiple components could result in our having to change from recognizing softwarelicense revenue in full at the time the software is delivered to recognizing that same software license revenueratably in the future over an extended number of accounting periods.
For software sales with multiple components (typically a sale involving both a license to software that willbe delivered immediately and maintenance and support services that will be delivered over an extended period oftime), generally accepted accounting principles require that vendor specific objective evidence of selling price(“VSOE”) be established for at least one of the components of that sale before the software license revenue canbe recognized in full at the time of delivery to the customer of the licensed software. If VSOE cannot beestablished, recognition of the software license revenue must deferred and recognized ratably in the future overan extended number of accounting periods, the length of which would typically be the time period covered by therelated maintenance and support contract. We currently have established VSOE in a manner that supports usrecognizing software license revenue in full at the time we deliver the software to our customers for substantiallyall of our products.
Situations can arise where a change in product pricing that improves our cash flow and financial positionhas an unintended consequence of us not being able to establish VSOE where it existed before. If that set ofcircumstances were to occur, we could be required by generally accepted accounting principles to deferrecognition of software license revenue to future periods. That requirement could cause us to experience animmediate decline in software license revenue recognized in our financial statements in the period in which thelicensed software was delivered to our customer even though the timing and amount of cash flow from thetransaction would be the same as when we had established VSOE. If this collection of events were to occur, itcould have a material, adverse effect on our revenue, results of operations and financial condition we present inour financial statements.
30
Our indebtedness may adversely affect our cash flow and business operations.
At December 31, 2012, we had notes payable of $5.7 million under our loan agreements with a bank. Ourindebtedness could have important consequences to us, including:
• Our ability to obtain additional financing, if necessary, for working capital, capital expenditures,acquisitions or other purposes which may be impaired or not available on favorable terms.
• Covenants contained in our loan agreements require us to meet financial tests that may affect ourflexibility in planning for and reacting to changes in our business, including future businessopportunities.
• We may need a substantial portion of our cash flow from operations to make principal and interestpayments on our indebtedness, reducing the funds that would otherwise be available for operations andfuture business opportunities.
• Our level of indebtedness can make us more vulnerable to competitive pressures if there is a downturnin our business or the economy in general, than our competitors with less debt.
Our ability to service our indebtedness will depend upon, among other things, our future financial andoperating performance, which will be affected by prevailing economic conditions and financial, business,regulatory and other factors, some of which are beyond our control. If our operating results are not sufficient toservice our current or future indebtedness, we will be forced to take actions such as reducing or delaying capitalexpenditures, acquisitions and/or, selling assets, restructuring or refinancing our indebtedness or seekingadditional debt or equity capital or bankruptcy protection. We may not be able to affect any of these remedies onsatisfactory terms or at all.
A breach of the terms and conditions of our loan agreements, including the inability to comply with therequired financial covenants, could result in an event of default. If an event of default occurs (after any applicablenotice and cure periods), the lender would be entitled to accelerate the repayment of amounts outstanding(including accrued and unpaid interest and fees). Upon a default under the loan agreements, the lender could alsoforeclose against any collateral securing such obligations, which may be all or substantially all of our assets. Ifthat occurred, we may not be able to continue to operate as a going concern.
We may not be able to compete effectively with larger, better-positioned companies, resulting in lower marginsand loss of market share.
We operate in intensely competitive markets that experience rapid technological developments, marketconsolidation, changes in industry standards, changes in customer requirements, and frequent new productintroductions and product improvements by existing and new competitors. If we are unable to anticipate or reactto these competitive challenges or if existing or new competitors take or gain additional market share in any ofour markets, our competitive position could weaken, and we could experience a decrease in revenues that couldadversely affect our business and operating results. To compete successfully, we must maintain a successfulresearch and development effort to develop new products and services and enhance existing products andservices, effectively adapt to changes in the technology or product rights held by our competitors, appropriatelyrespond to competitor strategies as such strategies become apparent, and effectively adapt to technologicalchanges and changes in the ways that our information is accessed, used, and stored within our enterprise andconsumer markets. If we are unsuccessful in responding to our competitors or to changing technological andcustomer demands, we could experience a negative effect on our competitive position and our financial results.
We compete with a variety of companies who have significantly greater revenues and financial resources,partners, resellers and distribution channels than GlobalSCAPE as well as greater personnel and technicalresources. For example, the EFT solution suite competes with products from Sterling Commerce, Axway andseveral other vendors, and WAFS competes with Riverbed Technology and Cisco. TappIn competes with avariety of cloud file storage and collaboration companies such as Dropbox. Large companies may be able to
31

develop new technologies, across multiple solution spaces, and on more operating systems, more quickly than wecan, to offer a broader array of products, and to respond more quickly to new opportunities, industry standards orcustomer requirements. For example, Sterling Commerce receives substantial maintenance contract revenueannually, providing them with significant resources for product research, development and marketing.
Additional competitors may enter the market and also may have significantly greater capabilities andresources than we do. Some existing competitors also may be able to adopt more aggressive pricing strategies.For example, Ipswitch provides an older version of its consumer file transfer protocol program for free for non-commercial use, and Microsoft includes file transfer protocol functionality in its Internet browser, which it alsodistributes for free. Increased competition may result in lower operating margins and loss of market share.
We may incur losses as we attempt to expand our business.
We intend to expand our business and therefore expect to expend additional resources on continuingresearch and development, developing our sales force and a more robust reseller program, marketing, gainingtraction in newly entered markets such as secure content mobility and cloud services, and potentially enteringother new or adjacent markets.
If we do not successfully develop and introduce the new solutions to the market, are unable to improve ourdirect and channel sales results, or are unable to enter expected new markets, we may not be able to achieve therevenue growth associated with the business expansion expenditures and may not be profitable.
Our products are complex and operate in a wide variety of computer configurations, which could result inerrors or product failures.
Addressing MFT, WAFS, CDP, Managed E-mail Attachment, cloud services, secure content mobility, andendpoint security market needs typically requires very complex products. Therefore, undetected errors, failures,or bugs may occur, especially when products are first introduced or when new versions are released. Ourproducts are often installed and used in large-scale computing environments with different operating systems,system management software, and equipment and networking configurations, which may cause errors or failuresin our products or may expose undetected errors, failures, or bugs in our products. Our customers’ computingenvironments also are often characterized by a wide variety of standard and non-standard configurations thatmake pre-release testing for programming or compatibility errors very difficult and time-consuming. In addition,despite testing by us and others, errors, failures, or bugs may not be found in new products or releases until aftercommencement of commercial shipments. In the past, we have discovered software errors, failures, and bugs incertain of our product offerings after their introduction and have experienced delayed or lost revenues during thetime required to correct these errors.
Errors, failures, or bugs in products released by us could result in negative publicity, product returns, loss ofor delay in market acceptance of our products, loss of competitive position, or claims by customers or others.Many of our end-user customers use our products in applications that are critical to their businesses and mayhave a greater sensitivity to defects in our products than to defects in other, less critical, software products. Inaddition, if an actual or perceived breach of information integrity or availability occurs in one of our end-usercustomer’s systems, regardless of whether the breach is attributable to our products, the market perception of theeffectiveness of our products could be harmed. Alleviating any of these problems could require significantexpenditures of our capital and other resources and could cause interruptions, delays, or cessation of our productlicensing, which could cause us to lose existing or potential customers and could adversely affect our operatingresults. For example, it took longer than originally expected to make the necessary improvements to our WAFSsolution and therefore WAFS revenues to date have been lower than originally anticipated.
32
Turmoil and uncertainty in U.S. and international economic markets could adversely affect our business andoperating results.
Demand for our products depends in large part upon the level of capital and maintenance expenditures bymany of our customers. Lingering effects of the economic downturn in recent years have adversely impactedspending on information technology projects as prospects and customers reduce, sometimes greatly, theirdiscretionary spending to focus on preserving mandatory spending budgets.
These adverse impacts to customer spending may be directly, and adversely, reflected in our future businessand operating results because we believe a substantial part of the MFT spending budget is considereddiscretionary by our prospects and customers. The perception of MFT solutions spending as discretionary isfurther reinforced by the existence of low cost, or even free, products that deliver some subset of the capabilitiesfound in our solutions. Given the economic downturn, some customers may have decided to defer spending forour solutions or may have elected to obtain low cost or free “good enough” products as an interim measure. Thepotential adverse impacts of such decisions may persist for an extended period of time, even well into a period ofeconomic recovery, given that many prospects will not change their IT infrastructure for a considerable period oftime after that infrastructure has been installed and is operating adequately.
Adverse financial results from another economic downturn and uncertainty could include flat, or evendecreasing, sales, lower gross and net margins, and impairment of current or future goodwill and long-livedassets. In addition, some of our customers could delay paying their obligations to us. Potentially reduced salesand margins and customer payment problems could limit our ability to fund research and development,marketing, sales, and other activities necessary to sustain and expand our market position.
As was the case with many other companies, at the onset of the recent economic downturn, our stock pricedecreased. If investors have concerns that our business, financial condition and results of operations will benegatively impacted by another economic downturn, our stock price could decrease again.
Regardless of economic conditions, fluctuations in demand for our products and services are driven by manyfactors and a decrease in demand for our products could adversely affect our financial results.
We are subject to fluctuations in demand for our products and services due to a variety of factors, includingcompetition, product obsolescence, technological change, budget constraints of our actual and potential customers,level of broadband usage, awareness of security threats to IT systems, and other factors. While such factors may, insome periods, increase product sales, fluctuations in demand can also negatively impact our product sales. Ifdemand for our products declines, our revenues, as well as our gross and net margins, could be adversely affected.CuteFTP, in particular, competes in some ways with social media services for image and video sharing. As socialmedia has increased exponentially in popularity, sales of our CuteFTP product line have declined.
Sales to the U.S. Government make up a portion of our business and changes in government defense spendingcould have consequences on our financial position, results of operations and business.
From time-to-time in the past, sales to the U.S. Government have accounted for 10% or more of our totalsales. Our revenues from the U.S. Government largely result from contracts awarded to us under various U.S.Government programs, primarily defense-related programs with the Department of Defense (“DoD”). Thefunding of our programs is subject to the overall U.S. Government budget and appropriation decisions andprocesses which are driven by numerous factors, including geo-political events and macroeconomic conditions,and are beyond our control. The overall level of U.S. defense spending has increased in recent years fornumerous reasons, including increases in funding of operations in Iraq and Afghanistan and the DoD’smodernization initiatives. Looking forward, we expect overall defense spending to remain relatively flat in thenear term, given the completed military withdrawal from Iraq and the expected drawdown of military operationsin Afghanistan. However, projected defense spending budgets are uncertain and become increasingly difficult to
33
predict for periods beyond the near-term due to numerous factors, including the external threat environment,funding for ongoing operations in Afghanistan, future priorities of the Administration and the overall health ofthe U.S. and world economies and the state of governmental finances.
Significant changes in defense spending could have long-term consequences for our size and structure.Changes in government priorities and requirements could impact the funding, or the timing of funding, of ourprograms which could negatively impact our results of operations and financial condition. Larger governmentcontracts, such as the Army contracts in which we participate with certain of our customers, typically have longsales cycles. Therefore, closure of such contracts is difficult to predict, increasing uncertainty in our projections.
U.S. Government contracts generally also permit the government to terminate the contract, in whole or inpart, without prior notice, at the government’s convenience or for default based on performance. If one of ourcontracts is terminated for convenience, we would generally be entitled to payments for our allowable costs andwould receive some allowance for profit on the work performed. If one of our contracts is terminated for default,we would generally be entitled to payments for our work that has been accepted by the government. Atermination arising out of our default could expose us to liability and have a negative impact on our ability toobtain future contracts and orders. Furthermore, on contracts for which we are a subcontractor and not the primecontractor, the U.S. Government could terminate the prime contract for convenience or otherwise, irrespective ofour performance as a subcontractor.
Because we are a DoD contractor, certain GlobalSCAPE items and/or transactions may be subject to theInternational Traffic in Arms Regulations (“ITAR”) if our software or services are specifically designed ormodified for defense purposes. Companies engaged in manufacturing or exporting ITAR-controlled goods andservices (even if these companies do not export such items) are required to register with the U.S. StateDepartment. Failure to comply with these requirements could result in fines and sanctions which couldnegatively impact our results of operations and financial condition.
If we fail to manage our sales and distribution channels effectively or if our partners choose not to market andsell our products to their customers, our operating results could be adversely affected.
We sell our products to customers primarily through our direct sales force and through resellers. Salesthrough these different channels involve distinct risks, including the following:
Direct Sales. Most of our revenue is derived from sales by our direct sales force to end-users. Special risksassociated with this sales channel include:
• Longer sales cycles associated with direct sales efforts;
• Difficulty in hiring, retaining, and motivating our direct sales force;
• Substantial amounts of training for sales representatives to become productive, including regularupdates to cover new and revised products; and
• Reliance on leads obtained from paid advertising (for example, Google ads) could materially impactdirect sales should advertising effectiveness decline due to non-attributable declines in leads,unforeseen search engine algorithm changes, or other occurrences that may adversely impact the leadgeneration aspects of the direct sales cycle. In addition, increased competition may materially impactthe costs associated with such advertising.
Indirect Sales Channels. A significant portion of our revenue is derived from sales through indirectchannels, including distributors and partners that sell our products to end-users and other resellers. This channelinvolves a number of risks, including:
• Our lack of control over the timing of delivery of our products to end-users;
34
• Our resellers and distributors currently are not subject to minimum sales requirements or any obligationto market our products to their customers;
• Our reseller and distributor agreements are generally nonexclusive and may be terminated at any timewithout cause; and
• Our resellers and distributors frequently market and distribute competing products and may, from timeto time, place greater emphasis on the sale of these products due to pricing, promotions, and otherterms offered by our competitors.
We cannot be certain that our distribution channel partners will continue to market or sell our productseffectively. If we are not successful, we may lose sales opportunities, customers and revenues.
If we lose key personnel we may not be able to execute our business plan.
Our future success depends on the continued services of key members of our management team. Theseindividuals are difficult to replace because of the intense competition for similarly skilled people. New membersof the management team may not be productive for weeks or months as they learn about our solutions, ourpersonnel and the administrative practices within GlobalSCAPE.
Failure to maintain proper and effective internal controls could affect our ability to produce accuratefinancial statements which could result in the restatement of our financial statements or adversely affect ouroperating results, our ability to operate our business, and our stock price.
Effective internal controls are necessary for us to provide reliable financial reports and effectively preventfraud. We maintain a system of internal control over financial reporting, which is defined as a process designedby, or under the supervision of, our principal executive officer and principal financial officer, or personsperforming similar functions, and effected by our board of directors, management and other personnel, to providereasonable assurance regarding the reliability of financial reporting and the preparation of financial statementsfor external purposes in accordance with generally accepted accounting principles.
If we are unable to establish and maintain appropriate internal financial reporting controls and procedures, itcould cause us to fail to meet our reporting obligations, result in the restatement of our financial statements, harmour operating results, subject us to regulatory scrutiny and sanction, cause investors to lose confidence in ourreported financial information, and have a negative effect on the market price for shares of our common stock.
Our ability to develop our software will be seriously impaired if we are not able to use our foreignsubcontractors.
We rely on foreign subcontractors to help us develop some aspects of some of our software. If theseprogrammers decided to stop working for us, or if we were unable to continue using them because of political oreconomic instability, we would have difficulty finding comparably skilled developers in a timely manner. Inaddition, we would likely have to pay considerably more for the same work, especially if we used U.S. personnel.If we could not replace the contract programmers, it would take us significantly longer to develop certainproducts and product upgrades.
It may be difficult for us to recruit and retain software developers and other technical and managementpersonnel because we are a relatively small company.
We compete intensely with other software development and distribution companies internationally andinformation technology departments supporting larger businesses to recruit and hire from a limited pool ofqualified personnel. Some qualified candidates prefer to work for larger, better known companies or in anothergeographic area. In order to attract and retain personnel in a competitive marketplace, we believe that we mustprovide a competitive compensation package, including cash and equity-based compensation. The volatility in
35
our stock price may from time to time adversely affect our ability to recruit or retain employees. In addition, wemay be unable to obtain required stockholder approvals of future increases in the number of shares available forissuance under our equity compensation plans. Also, accounting rules require us to treat the issuance of employeestock options and other forms of equity-based compensation as compensation expense. As a result, we maydecide to issue fewer equity-based incentives and may be impaired in our efforts to attract and retain necessarypersonnel. If we are unable to hire and retain qualified employees, or conversely, if we fail to manage employeeperformance or reduce staffing levels when required by market conditions, our business and operating resultscould be adversely affected.
Key personnel have left our Company in the past. There likely will be additional departures of keypersonnel from time to time in the future. The loss of any key employee could result in significant disruptions toour operations, including adversely affecting the timeliness of product releases, the successful implementationand completion of company initiatives, the effectiveness of our disclosure controls and procedures and ourinternal control over financial reporting, and the results of our operations. Hiring, training, and successfullyintegrating replacement sales, engineering, and other personnel could be time consuming, may cause additionaldisruptions to our operations, and may be unsuccessful, which could negatively impact future revenues.
Our operations potentially are vulnerable to security breaches that could harm the quality of our products andservices or disrupt our ability to deliver our products and services.
Information security is a dynamic discipline that historically has faced a threat that develops and emerges insometimes-unpredictable ways. Third parties may breach our system and information security and damage ourproducts and services or misappropriate confidential customer information. This might cause us to losecustomers, or even cause customers to make claims against us for damages. We may be required to expendsignificant resources to protect against potential or actual security breaches and/or to address problems caused bysuch breaches.
Improper disclosure of personal data could result in liability and harm our reputation.
While we have derived the majority of our historical revenues from on-premise delivery of our products, wenow also offer our products on third party hosted platforms. As we continue to execute our strategy of increasingthe number and scale of our cloud-based offerings, we store and process increasingly large amounts of personallyidentifiable information of our customers. At the same time, the continued occurrence of high-profile databreaches provides evidence of an external environment increasingly hostile to information security. Thisenvironment demands that we continuously improve our design and coordination of security controls. It ispossible our security controls over personal data, our training of employees and vendors on data security, andother practices we follow may not prevent the improper disclosure of personally identifiable information.Improper disclosure of this information could harm our reputation, lead to legal exposure to customers, or subjectus to liability under laws that protect personal data, resulting in increased costs or loss of revenue. We believeconsumers using our subscription services increasingly will want efficient, centralized methods of choosing theirprivacy preferences and controlling their data. Perceptions that our products or services do not adequately protectthe privacy of personal information could inhibit sales of our products or services, and could constrain consumerand business adoption of cloud-based solutions.
Breaches of our cybersecurity systems could degrade our ability to conduct our business operations anddeliver products and services to our customers, delay our ability to recognize revenue, compromise theintegrity of our software products, result in significant data losses and the theft of our intellectual property,damage our reputation, expose us to liability to third parties and require us to incur significant additionalcosts to maintain the security of our networks and data.
We increasingly depend upon our IT systems to conduct virtually all of our business operations, rangingfrom our internal operations and product development activities to our marketing and sales efforts andcommunications with our customers and business partners. Cyber threats may attempt to penetrate our network
36
security, or that of our website, and misappropriate our proprietary information or cause interruptions of ourservice. Because the techniques used by such attackers to access or sabotage networks change frequently andmay not be recognized until launched against a target, we may be unable to anticipate these techniques. Inaddition, sophisticated hardware and operating system software and applications that we produce or procure fromthird parties may contain defects in design or manufacture, including “bugs” and other problems that couldunexpectedly interfere with the operation of the system. We have also outsourced a number of our businessfunctions to third party contractors. Therefore, our business operations also depend, in part, on the success of ourcontractors’ own cybersecurity measures. Similarly, we rely upon distributors, resellers, system vendors andsystems integrators to sell our products and our sales operations depend, in part, on the reliability of theircybersecurity measures. Additionally, we depend upon our employees to appropriately handle confidential dataand deploy our IT resources in safe and secure fashion that does not expose our network systems to securitybreaches and the loss of data. Accordingly, if our cybersecurity systems and those of our contractors fail toprotect against unauthorized access, sophisticated cyberattacks and the mishandling of data by our employeesand contractors, our ability to conduct our business effectively could be damaged in a number of ways, including:
• Sensitive data regarding our business, including intellectual property and other proprietary data, couldbe stolen;
• Our electronic communications systems, including email and other methods, could be disrupted, andour ability to conduct our business operations could be seriously damaged until such systems can berestored;
• Our ability to process customer orders and electronically deliver products and services could bedegraded, and our distribution channels could be disrupted, resulting in delays in revenue recognition;
• Defects and security vulnerabilities could be introduced into our software products, thereby damagingthe reputation and perceived reliability and security of our products and potentially making the datasystems of our customers vulnerable to further data loss and cyber incidents; and
• Personally identifiable data of our customers, employees and business partners could be lost.
Should any of the above events occur, we could be subject to significant claims for liability from ourcustomers, regulatory actions from governmental agencies, our ability to protect our intellectual property rightscould be compromised and our reputation and competitive position could be significantly harmed. Also, theregulatory and contractual actions, litigations, investigations, fines, penalties and liabilities relating to databreaches that result in losses of personally identifiable or credit card information of users of our services can besignificant in terms of fines and reputational impact and necessitate changes to our business operations that maybe disruptive to us. Additionally, we could incur significant costs in order to upgrade our cybersecurity systemsand remediate damages. Consequently, our financial performance and results of operations could be adverselyaffected.
Certain components of the software code comprising some of our products are licensed from third partiesmaking us dependent upon those licenses remaining in place for those products to operate in their currentform.
Certain key components of the software code comprising certain of our products are licensed fromunrelated, third parties. These licenses are not perpetual such that, with advance notice as provided in the licenseagreements, those third parties could terminate those licenses. Even with advance notice, termination of thoselicenses could create a severe hardship for us due to the need to locate substitute software code from other thirdparties or create alternative software code ourselves in order for our products to continue to operate in the mannerdesigned or for us to keep pace with customer requirements, including our obligations under maintenance andsupport agreements. There is no assurance we could achieve either of those alternative solutions in a timely andeffective manner that would not disrupt our ability to continue selling and supporting those products, or withoutthe consumption of significant company resources in the form of time spent by our personnel creating alternativesolutions or cash paid to third parties to assist us. Such a situation could delay the completion and introduction to
37

the marketplace of other products we are developing to remain competitive due to the diversion of the attentionof certain of our key personnel away from that work. If any of these events occur, our future business andfinancial results could be adversely affected.
We utilize “open source” software in some of our products.
The open source software community develops software technology for free use by anyone. We incorporatea limited amount of open source code software into our products. For example, we have relied on open sourcetechnology for the encryption features in our CuteFTP Pro, EFT, and Mail Express solutions. We may use moreopen source code software in the future.
Our use, in some instances, of open source code software may impose limitations on our ability tocommercialize our solutions and may subject us to possible intellectual property litigation. Open source codemay impose limitations on our ability to commercialize our products because, among other reasons, open sourcelicense terms may be ambiguous and may result in unanticipated obligations regarding our solution, and opensource software cannot be protected under trade secret law. In addition, it may be difficult for us to accuratelydetermine the developers of the open source code and whether the acquired software infringes third-partyintellectual property rights. As a result, we could be subject to suits by parties claiming ownership of what webelieve to be open source software. From time to time, companies that incorporate open source software intotheir products have been subject to such claims.
Claims of infringement or misappropriation against us could be costly for us to defend and could require usto re-engineer our solution or to seek to obtain licenses from third parties in order to continue offering oursolution. We also might need to discontinue the sale of our solution in the event re-engineering could not beaccomplished on a timely or cost-effective basis. If any such claim, attempted remediation, or solutiondiscontinuance occur, our business and operating results could be harmed.
Our products may expose customers to invasion of privacy, causing customer dissatisfaction.
Our EFT suite, Mail Express, and TappIn solutions are intended to facilitate information sharing, sometimesby providing outsiders access to a customer’s computer. Such access potentially may make the customervulnerable to security breaches, which could result in the loss of their privacy or property. Invasions of privacy orother customer harm occurring in an environment where our solutions are operating could result in customerdissatisfaction and possible claims against us for any resulting damages.
Increased customer demands on our technical support services may adversely affect our relationships with ourcustomers and our financial results.
We offer technical support services with many of our products. We may be unable to respond quicklyenough to accommodate short-term increases in customer demand for support services. We also may be unable tomodify the format of our support services to compete with changes in support services provided by competitorsor successfully integrate support for our customers. Further customer demand for these services could increaseour costs and, without corresponding increasing revenues, adversely affect our operating results.
We are subject to governmental export and import controls that could subject us to liability or impair ourability to compete in international markets.
All products that are exported, re-exported or that are worked on by foreign nationals are subject to exportcontrols. Such controls include prohibitions on end uses, end users and country prohibitions. In addition,incorporation of encryption technology into our products can increase the level of U.S. export controls. Theencryptions export controls were modified in 2010. We are subject to these requirements as certain of ourproducts include the ability for the end user to encrypt data. Therefore, our products may be exported outside the
38
United States or revealed to foreign nations only with the required level of export controls/restrictions.Restrictions applicable to our products may include: the requirement to have a license to export the technology;the requirement to have software licenses approved before export is allowed; and outright bans on the licensingof certain encryption technology to particular end users or to all end users in a particular country. In addition,various countries regulate the import of certain technology and have enacted laws that could limit our ability todistribute our products or could limit our customers’ ability to implement our products in those countries.
There can be no assurance that we will be successful in obtaining or maintaining the licenses and otherauthorizations required to export our products from applicable government authorities. Any change in export orimport regulations or related legislation, shift in approach to the enforcement or scope of existing regulations, orchange in the list of countries to which we cannot export, changes in persons or technologies targeted by suchregulations, could result in decreased use of our products by, or in our decreased ability to export or sell ourproducts to, existing or potential customers with international operations. Changes in our products or changes inexport and import regulations may create delays in the introduction of our products in international markets,prevent our customers with international operations from deploying our products throughout their global systemsor, in some cases, prevent the export or import of our products to certain countries altogether. Any change inexport or import regulations or related legislation, shift in approach to the enforcement or scope of existingregulations, or change in the countries, persons or technologies targeted by such regulations, could result indecreased use of our products by, or in our decreased ability to export or sell our products to, existing or potentialcustomers with international operations.
Export laws and regulations can be extremely complex in their application. If we are found not to havecomplied with applicable export control laws, we may be sanctioned, fined or penalized by, among other things,having our ability to obtain export licenses curtailed or eliminated, possibly for an extended period of time. Ourfailure to receive or maintain any required export licenses or authorizations or our penalization for failure tocomply with applicable export control laws would hinder our ability to sell our products, could result in financialpenalties, and could materially adversely affect our business, financial condition, and results of operations. Anyfailure on our part or the part of our distributors to comply with encryption or other applicable export controlrequirements could harm our business and operating results.
Import and export regulations of encryption/decryption technology vary from country to country. We maybe subject to different statutory or regulatory controls in different foreign jurisdictions, and as such, ourtechnology may not be permitted in these foreign jurisdictions. Violations of foreign regulations or regulation ofinternational transactions could prevent us from being able to sell our products in international markets. Oursuccess depends in large part to having access to international markets. A violation of foreign regulations couldlimit our access to such markets and have a negative effect on our results of operations.
As our international sales grow, we could become increasingly subject to additional risks that could harm ourbusiness.
We conduct significant sales and customer support, in countries outside of the United States. During theyear ended December 31, 2012, approximately 26% of our sales were to purchasers outside the United States.Our continued growth and profitability could require us to further expand our international operations. Tosuccessfully expand international sales, we must establish additional foreign operations, hire additional personneland recruit additional international resellers. We may also incur additional expense translating our applicationsinto additional languages. In addition, there is significant competition for entry into high growth markets, such asChina. Our international operations are subject to a variety of risks, which could cause fluctuations in the resultsof our international operations. These risks include:
• Compliance with foreign regulatory and market requirements.
• Variability of foreign economic, political and labor conditions.
39

• Changing restrictions imposed by regulatory requirements, tariffs or other trade barriers or by U.S.export laws.
• Longer accounts receivable payment cycles.
• Potentially adverse tax consequences.
• Difficulties in protecting intellectual property.
• Burdens of complying with a wide variety of foreign laws.
• Difficulty transferring funds to the U.S. in a tax efficient manner from non-U.S jurisdictions in whichthe cash flow originates.
The amount of income taxes we compute as payable on our income tax returns filed with the Internal RevenueService and certain states could be challenged by those taxing authorities resulting in us paying more taxesthan anticipated.
We file income tax returns with the Internal Revenue Service and taxing authorities in certain states. Weprepare and file those returns based on our interpretations of the relevant tax code as to revenue to be reportedand deductions and credits allowed. We use third-party experts to assist us in preparing our tax returns andcomputing our tax liabilities to help us ensure we pay the proper amount of tax due. Our tax returns are subject toexamination by taxing authorities who could interpret the tax code in a different manner from us and concludewe are obligated to pay more taxes than we originally computed and paid. While we would defend the positiontaken on our tax returns as filed, a challenge from a taxing authority can be costly to defend with no assurance ofa favorable outcome for us. In the event of an unfavorable result under these circumstances, our business,operating results and financial position could be harmed.
The amount of sales tax we collect on sales could be challenged by taxing authorities both in jurisdictions inwhich we have a corporate presence as well as by taxing authorities in areas where we have no corporatepresence.
We collect and remit sales tax on sales in jurisdictions where we have a corporate or physical presence that resultsin an obligation to do so. We sell our products to customers in numerous locations where we do not have a corporate orphysical presence and, therefore, do not collect sales tax on those sales. States in which we collect sales tax could auditour activities and assess us with additional tax based on them interpreting the sales tax code differently than weinterpret it. Various states in which we do not collect sales tax are aggressive in interpreting their sales tax codes indetermining if a company with no apparent presence in those states is obligated to collect and remit sales taxes,particularly on sales made across the internet. States where we do not collect sales tax could make an assertion that weshould have been collecting sales tax and could assess us with that tax. While we would defend the position taken as toour obligation to collect sales tax and the amount of sales tax collected, a challenge from a taxing authority can becostly to defend with no assurance of a favorable outcome for us. In the event of an unfavorable result under thesecircumstances, our business, operating results and financial position could be harmed.
Risks Related to Stock Ownership
Our stock price is/may be volatile.
The trading price of our common stock has been and could continue to be subject to wide fluctuations inresponse to certain factors, including:
• U.S. and global economic conditions leading to general declines in market capitalizations, with suchdeclines not associated with operating performance.
• Quarter-to-quarter variations in results of operations.
40
• Our announcements of new products.
• Our announcements of acquisitions.
• Our announcements of significant new customers or contracts.
• Our competitors’ announcements of new products.
• Our product development or release schedule.
• Changes in our management team.
• General conditions in the software industry.
• Investor perceptions and expectations regarding our products, plans and strategic position and those ofour competitors and customers.
In addition, the public stock markets experience extreme price and trading volume volatility, particularly inhigh-technology sectors of the market. This volatility has significantly affected the market prices of securities ofmany technology companies for reasons often unrelated to the operating performance of the specific companies.The broad market fluctuations may adversely affect the market price of our common stock.
Accounting charges may cause fluctuations in our annual or quarterly financial results.
Our financial results may be affected by non-cash and other accounting charges, including:
• Amortization of intangible assets, including acquired technology and product rights.
• Acquisition expenses.
• Impairment of goodwill and intangibles.
• Share-based compensation expense.
• Restructuring charges.
• Impairment of long-lived assets.
Anti-takeover provisions in our charter and Delaware law could inhibit others from acquiring us.
Some of the provisions of our certificate of incorporation and bylaws and in Delaware law could, together orseparately:
• Discourage potential acquisition proposals.
• Delay or prevent a change in control.
• Limit the price that investors may be willing to pay in the future for shares of our common stock.
In particular, our certificate of incorporation and bylaws prohibit stockholders from voting by writtenconsent or calling meetings of the stockholders. We are also subject to Section 203 of the Delaware GeneralCorporation Law, which generally prohibits a Delaware corporation from engaging in any of a broad range ofbusiness combinations with any interested stockholder, as defined in the statute, for a period of three yearsfollowing the date on which the stockholder became an interested stockholder.
Our directors and executive officers continue to have substantial control over us.
Our directors and executive officers, together with their affiliates and related persons, beneficially owned, inthe aggregate, approximately 42% of our outstanding common stock as of December 31, 2012. Thesestockholders would have the ability to control GlobalSCAPE and direct its policies including the outcome of
41
matters submitted to our stockholders for approval, such as the election of directors and any acquisition ormerger, consolidation or sale of all or substantially all of our assets. In addition, our certificate of incorporationand bylaws provide for our Board of Directors to be divided into three classes of directors serving staggeredthree-year terms. As a result, approximately one-third of our Board of Directors will be elected each year.
Stockholders’ ownership of our stock may be significantly diluted, affecting the value of the stock.
There were options for 3,650,095 shares outstanding under our employee and director stock option plans asof March 1, 2013, of which 2,649,455 were vested. We have filed a registration statement under the SecuritiesAct, covering stock issued upon the exercise of options by non-affiliates, and we may file a registration statementcovering options held by affiliates as well. If we do not file a registration statement covering affiliates, affiliateswho exercise their options may choose to sell the stock under an exemption from registration, such as Rule 144under the Securities Act. The exercise of these options and sale of the resulting stock could depress the value ofour stock.
Risks Related to Intellectual Property
We are vulnerable to claims that our products infringe third-party intellectual property rights particularlybecause our products are partially developed by independent parties.
From time to time we experience claims that our products infringe third-party intellectual property rights.We may be exposed to future litigation based on claims that our products infringe the intellectual property rightsof others. This risk is exacerbated by the fact that some of the code in our products is developed by independentparties or licensed from third parties over whom we have less control than we exercise over internal developers.In addition, we expect that infringement claims against software developers will become more prevalent as thenumber of products and developers grows and the functionality of software programs in the market increasinglyoverlaps. Companies in the technology industry, and other patent and trademark holders seeking to profit fromroyalties in connection with grants of licenses, own large numbers of patents, copyrights, trademarks, servicemarks, and trade secrets and frequently enter into litigation based on allegations of infringement or otherviolations of intellectual property rights. In addition, we may be the target of aggressive and opportunisticenforcement of patents by third parties, including non-practicing entities.
Responding to and defending against such claims may cause us to incur significant expense and divert thetime and efforts of our management and employees. Successful assertion of such claims could require that wepay substantial damages or ongoing royalty payments, prevent us from selling our products and services, damageour reputation, or require that we comply with other unfavorable terms, any of which could materially harm ourbusiness. In addition, we may decide to pay substantial settlement costs in connection with any claim orlitigation, whether or not successfully asserted.
While it is not possible to predict the outcome of patent litigation incident to our business, defense costsmay be significant, and we believe the costs associated with this litigation or other claims of infringement couldgenerally have a material adverse impact on our results of operations, financial position or cash flows. Regardlessof the merit of such claims, responding to infringement claims can be expensive and time-consuming.
For any intellectual property rights claim against us or our customers, we may have to pay damages andindemnify our customers against damages.
Claims of infringement could require us to re-engineer our products or seek to obtain licenses from thirdparties in order to continue offering its products. In addition, an adverse legal decision affecting our intellectualproperty, or the use of significant resources to defend against this type of claim could place a significant strain onour financial resources and harm our reputation.
42
We are currently a defendant in a patent infringement suit filed by Achates Reference Publishing, Inc. in theUnited States District Court for the Eastern District of Texas Marshall Division. The complaint alleges that weinfringed on a patent that addresses product activation functionality. We are currently one of a number ofdefendants in a patent infringement suit filed by Uniloc Luxembourg S.A. in the United States District Court forthe Eastern District of Texas Marshall Division. The complaint alleges that we infringed on a patent thataddresses software piracy prevention functionality. We believe we have meritorious defenses to the plaintiffs’claims in both of these cases and intend to defend these lawsuits vigorously. While we believe any loss we mayincur related to these matters would be immaterial to the Company’s financial position and results of operations,nonetheless, these actions subject us to the risks associated with intellectual property infringement claims bythird parties as described above.
We may not be able to protect our intellectual property rights.
Our software code, and trade and service marks are some of our most valuable assets. Given the globalnature of the internet and our business, we are vulnerable to the misappropriation of this intellectual property,particularly in foreign markets, such as China and Eastern Europe, where laws or law enforcement practices areless developed. The global nature of the internet makes it difficult to control the ultimate destination or securityof our software making it more likely that unauthorized third parties will copy certain portions of our proprietaryinformation or reverse engineer the proprietary information used in its programs. If our proprietary rights wereinfringed by a third-party and we did not have adequate legal recourse, our ability to earn profits, which arehighly dependent on those rights, would be severely diminished.
Other companies may own, obtain or claim trademarks that could prevent, limit or interfere with our use ofour trademarks.
Our various trademarks are important to our business. If we were to lose the use of any of our trademarks,our business would be harmed and we would have to devote substantial resources towards developing anindependent brand identity. Defending or enforcing our trademark rights at a local and international level couldresult in the expenditure of significant financial and managerial resources.
Item 1B. Unresolved Staff Comments
None
Item 2. Properties
Our corporate office is in San Antonio, Texas. That office contains approximately 21,000 square feet forwhich the average annual rent under the lease is $347,000. We maintain a software development office inSeattle, Washington primarily for the development of our TappIn product line. That office contains 5,300square feet for which the average annual rent under the lease is $126,000. We believe these facilities aresuitable for our current business needs and that suitable, additional space would be available if needed in thefuture under acceptable terms.
Item 3. Legal Proceedings
GlobalSCAPE is named as one of a number of defendants in a patent infringement suit filed by AchatesReference Publishing, Inc. in the United States District Court for the Eastern District of Texas Marshall Division.The complaint alleges that GlobalSCAPE infringed on a patent that addresses product activation functionality.GlobalSCAPE believes that it has meritorious defenses to plaintiffs’ claims in this case and intends to defend thislawsuit vigorously. GlobalSCAPE believes any loss it may incur related to this matter would be immaterial to theCompany’s financial position and results of operations.
43
GlobalSCAPE is named as one of a number of defendants in a patent infringement suit filed by UnilocLuxembourg S.A. in the United States District Court for the Eastern District of Texas Marshall Division. Thecomplaint alleges that GlobalSCAPE infringed on a patent that addresses software piracy preventionfunctionality. GlobalSCAPE believes that it has meritorious defenses to plaintiff’s claims in this case and intendsto defend this lawsuit vigorously. GlobalSCAPE believes any loss it may incur in this matter would beimmaterial to the Company’s financial position and results of operations.
Item 4. Mine Safety Disclosures
Not Applicable.
44

PART II
Item 5. Market for Registrant’s Common Equity, Related Stockholder Matters and Issuer Purchases ofEquity
Our common stock is listed on the NYSE MKT Exchange under the symbol “GSB” The following table setsforth the quarterly high and low closing sale prices for our common stock for the last two fiscal years.
2012 2011
High Low High Low
First Quarter (ending March 31) . . . . . . . . . . . . . . . . . . . . . . . . . . . . . 2.39 1.69 $3.14 $1.98Second Quarter (ending June 30) . . . . . . . . . . . . . . . . . . . . . . . . . . . . 2.15 1.77 $2.86 $1.92Third Quarter (ending September 30) . . . . . . . . . . . . . . . . . . . . . . . . . 2.28 1.96 $2.38 $1.42Fourth Quarter (ending December 31) . . . . . . . . . . . . . . . . . . . . . . . . 2.15 1.40 $2.17 $1.50Annual . . . . . . . . . . . . . . . . . . . . . . . . . . . . . . . . . . . . . . . . . . . . . . . . . 2.39 1.40 $3.14 $1.42
On March 15, 2013, the last reported sales price of our common stock on the NYSE MKT Exchange was $1.66per share. As of March 15, 2013, we had approximately 1,929 shareholders of record of our common stock.
We paid a special cash dividend of $.07 per share on December 27, 2012, to shareholders of record as of theclose of business on December 17, 2012. Our management anticipates future earnings and other cash resources, ifany, will be retained for investment in our business and has no intention as of the date of this filing of this Form10-K to declare or pay cash dividends in the foreseeable future.
Item 6. Selected Financial Data
The following selected financial data is derived from the Financial Statements included in this annual report.This data is qualified in its entirety by and should be read in conjunction with the more detailed FinancialStatements and related notes included in this annual report and with Item 8, Financial Statements andSupplementary Data. Historical results may not be indicative of future results.
On December 2, 2011 we acquired TappIn, Inc. This acquisition was accounted for as a stock purchase and,accordingly, the operating results of that business have been included in the Financial Statements included in thisannual report since the date of acquisition.
Statement of Operations Data:($ in thousands) 2012 2011 2010 2009 2008
Total revenues . . . . . . . . . . . . . . . . . . . . . . . . . . . . . . . . . . . . $23,372 $20,894 $18,565 $16,451 $15,792Operating expenses:
Cost of revenues . . . . . . . . . . . . . . . . . . . . . . . . . . . . . . . 1,296 1,723 601 336 189Selling, general and administrative . . . . . . . . . . . . . . . . 16,761 14,466 12,815 10,798 10,944Research and development . . . . . . . . . . . . . . . . . . . . . . . 3,531 3,124 3,016 2,805 2,819Impairment of goodwill . . . . . . . . . . . . . . . . . . . . . . . . . 0 0 0 0 5,773Impairment of long-lived assets . . . . . . . . . . . . . . . . . . . 0 0 0 0 3,244Affiliated entity asset impairment . . . . . . . . . . . . . . . . . 3,264 0 0 0 0TappIn earnout liability not earned . . . . . . . . . . . . . . . . (1,303) 0 0 0 0Depreciation and amortization . . . . . . . . . . . . . . . . . . . . 1,217 790 852 724 957
Total operating expenses . . . . . . . . . . . . . . . . . . . . 24,766 20,103 17,284 14,663 23,926
Income (loss) from operations . . . . . . . . . . . . . . . . . . . . . . . . (1,394) 791 1,281 1,788 (8,134)
Net income (loss) . . . . . . . . . . . . . . . . . . . . . . . . . . . . . . . . . . $ (1,800) $ 635 $ 881 $ 1,400 $ (7,660)
Net income (loss) per common share—basic . . . . . . . . . . . . . $ (0.10) $ 0.04 $ 0.05 $ 0.08 $ (0.44)Net income (loss) per common share—diluted . . . . . . . . . . . $ (0.10) $ 0.03 $ 0.05 $ 0.08 $ (0.44)
45

Balance Sheet Data:
($ in thousands) 2012 2011 2010 2009 2008
Cash and cash equivalents . . . . . . . . . . . . . . . . . . . . . . . . . . . $ 8,079 $ 8,861 $11,087 $ 7,026 $ 6,319Working capital . . . . . . . . . . . . . . . . . . . . . . . . . . . . . . . . . . . 73 1,662 8,607 5,540 4,435Total assets . . . . . . . . . . . . . . . . . . . . . . . . . . . . . . . . . . . . . . . 33,588 38,378 20,547 16,173 12,220Long term debt, less current portion . . . . . . . . . . . . . . . . . . . 4,389 5,667 — — —
Item 7. Management’s Discussion and Analysis of Financial Condition and Results of Operation
The following Management’s Discussion and Analysis of Financial Condition and Results of Operationsshould be read in conjunction with our financial statements for the years ended December 31, 2012, 2011 and2010, and related notes included elsewhere in this document.
Overview
We provide secure information exchange capabilities for consumers and enterprises through thedevelopment and distribution of software, delivery of managed and hosted solutions and provisioning ofassociated services. We have thousands of enterprise customers and more than one million individual consumersin over 150 countries. Our solutions are used by more than 20,000 U.S. Army users deployed worldwide.
We operate primarily in the Managed File Transfer, or MFT, industry. We are evolving our MFT focus intoadjacent solution spaces, including creating what we refer to as Total Path Security. The Total Path Securityframework addresses data and information management, movement, security and accessibility across a broadrange of environments encompassing data and information in motion (for example, with traditional MFTsolutions delivered as on-premises software or as a cloud service) and at rest (for example, through securelydeleting or purging files or securely accessing stored data from mobile tablet or smartphone devices using ourTappIn solution).
Our solution portfolio facilitates transmission of critical information such as financial data, medical records,customer files, vendor files, personnel files and other similar documents between diverse and geographicallyseparated network infrastructures while supporting a range of information protection approaches to meet privacyand other security requirements. Our products provide the ability to monitor these activities, as well as access theunderlying data, securely and flexibly through a wide range of network-enabled, mobile devices, includingtablets and smartphones.
Our solutions enable compliance with government regulations relating to the protection of informationwhile allowing users to reduce IT costs, increase efficiency, track and audit transactions and automate processes.Our solutions also provide data replication, acceleration of file transfer, sharing/collaboration and continuousdata backup and recovery to our customers. We believe we are strongly positioned to provide secure transfer,sharing, and replication of files that need to be transmitted inside the user’s firewall to distributed offices, oroutside the user’s firewall to business and trading partners, including network-enabled, mobile devices.
Our initial product, CuteFTP, a file transfer protocol client program used mostly by individuals and smallbusinesses, was first distributed in 1996 over the Internet and achieved significant success and popularity. Sincethen, we have continued to enhance our portfolio of products to meet the increasing demand for secureinformation exchange in the MFT industry and adjacent markets such as cloud services. Our capabilities haveevolved from personal and small business MFT products to include standard and enterprise versions of ourEnhanced File Transfer, or EFT software, with an increasing number of add-on modules that provide additionalcapabilities such as ad hoc file transfer, advanced auditing and reporting, government-validated cryptography,and workflow automation. We have also developed Wide-Area File Services, or WAFS, and Continuous DataProtection, or CDP, software which further enhances the ability to replicate, share and backup files within a widearea network or local area network, at WAN and LAN speeds.
46
We also offer managed e-mail attachment, software-as-a-service, or SaaS, and cloud-based subscriptionproducts and solutions for information sharing solutions. Our managed e-mail attachment solution addresses theneeds of customers who are constrained by the typical limits on e-mail attachment size or who require additionalsecurity, auditing, and reporting for file attachments shared through e-mail. Our SaaS and cloud-basedsubscription solutions allow customers to reduce their upfront and total cost of ownership and achieve otherrecognized benefits of cloud-based solutions, including service elasticity and strong service level agreements forIT infrastructure reliability and performance.
Our managed cloud-based subscription solutions are a notable part of our future revenue model plansbecause they provide recurring revenue which potentially builds over time, as compared to sales of on-premisessoftware licenses which must be reconstituted every period. While we are in the early stages of growing oursubscription services, we already have added capability to deliver these services in additional geographies, suchas the United Kingdom and Canada, where country-specific compliance requirements may necessitate in-countryservice delivery
In December 2011, we entered the secure content mobility market with the acquisition of TappIn, Inc.Secure content mobility provides users with the ability to easily and securely access and share data andinformation using a web-browser, tablet or other mobile device such as a smartphone. Secure content mobilityintegrates aspects of ad hoc file transfer, broader MFT capabilities, cloud services, and remote accessibility toaddress growing market demand for secure, ‘anytime and anywhere’, device-independent access to distributedcontent. We believe that the addition of secure content mobility capability to our portfolio potentially hasprofound implications due to the continuing growth of tablet computers and smartphone sales and theirincreasing adoption by business users.
Key Business Metrics
Key Business Metrics
We review a number of key business metrics on an ongoing basis to help us monitor our performance and toidentify material trends which may affect our business. The measures that we believe are the primary indicatorsof our performance are:
• Revenue growth
• Recurring revenue growth
• Aggregate contract value growth
• Adjusted EBITDA excluding infrequent items
Revenue Growth
Since 1996, we have transitioned from a consumer products company (mostly focused on the CuteFTPproduct line) to an MFT enterprise solutions provider with a focus on increasing the revenue contribution fromcloud-based solutions, enabling secure mobile access to data and delivering professional services whilecontinuing to grow our core MFT business. We have grown revenue consistently throughout this transition suchthat our enterprise solutions sales have grown from less than 50% of our revenue as recently as 2005 to nowcomprising more than 90% of our sales with our CuteFTP consumer products accounting for less than 5% ofrevenue for the year ended December 31, 2012. We believe our ability to sustain revenue growth whilecontinuing this business evolution is the most significant metric for our business.
Although we often have grown revenue sequentially quarter over quarter in recent years, we view annualrevenue growth as the more important metric, especially considering the ongoing evolution of our solution
47
portfolio. We believe annual “core” revenue growth, excluding larger, exceptional transactions, is a key metricfor monitoring our continued success in developing our business in future periods. Given our diverse solutionportfolio and the addition of subscription services, we review our revenue mix and changes in revenue, across allsolutions, on a regular basis to identify key trends and adjust resource allocations.
We believe attaining additional traction in the cloud-based managed solutions and secure content mobilitymarket segments, realizing the potential of new software solutions, and our ability to continue developing andenhancing our existing software solutions are significant factors in our continued ability to sustain or possiblyincrease our revenue growth in future years.
The impact of cloud-based managed solutions on our revenue growth trends depends on several key factors,including the number of customers who may shift from software licenses to subscription services, the rate atwhich they may do so, the subscription term and fees, and the comparative value of the opportunity had itmaterialized as a software license sale instead of as a subscription service. Generally, for a fixed number ofopportunities (that is, without considering the possibility that a new service offering may result in additional salesopportunities), addition of subscription services reduces revenue growth rates for several quarters for theassociated software license solutions until cumulative subscription revenue increases and, potentially, surpassescomparable software license revenue. The revenue impacts are particularly pronounced early in the introductionof subscription services because there has been only a short time period for accumulation of the recurringrevenue stream.
Similarly, we believe market adoption of secure content mobility solutions, such as those provided byTappIn, will increase in future periods as use of personal computing devices, such as smart phones and tablets,continues to grow exponentially and as businesses increasingly embrace BYOD operating models.
See the section below comparing our results of operations for the years ended December 31, 2012, 2011 and2010, for discussion of the revenue trends we have experienced.
Recurring Revenue Growth.
Recurring revenue includes revenue recognized from our maintenance and support, or M&S contracts,managed and hosted solutions, and other subscription services such as from our TappIn product line. M&Scontracts for our products are sold for fixed periods of time and are typically for one year with some agreementshaving longer terms. We recognize revenue from these contracts on a monthly basis over the life of the contract.Managed and hosted solutions, such as MIX and Hosted EFT, are sold as one, two, or three-year subscriptionswith the services invoiced and revenue recognized on a monthly basis. TappIn subscriptions typically are sold forone-year terms with the revenue recognized on a monthly basis.
Recurring revenue provides a more predictable revenue stream in future periods which we believe is highlyvalued by institutional investors and other market participants. We review recurring revenue trends periodicallyto determine the progress of our M&S and cloud solution sales and customer satisfaction with our ongoingsolution development and support activities. We also assess how aggregate contract value (see further discussionbelow) will factor into possible recurring revenue in future periods.
See the section below comparing our results of operations for the years ended December 31, 2012, 2011 and2010, for discussion of the recurring revenue trends we have experienced.
48

Aggregate Contract Value Growth.
Aggregate contract value, or ACV, is a measure of future revenue potential we have in place under non-cancellable contracts for product sales, maintenance and support, managed solutions, and professional servicesfor which we will recognize revenue in future periods. ACV is the sum of:
• Deferred revenue resulting from payments we have already received for services to be provided in thefuture.
• Amounts we are due to be paid under non-cancellable contracts for future services we will provideunder those contracts.
Our ACV growth as illustrated in the table below is a result of sales success in numerous areas of ourbusiness. While we expect ACV may grow in future periods as we potentially continue to increase our volume ofnon-cancellable contracts for future delivery of our products and services, it could also decrease for a number ofreasons including existing customers electing not to renew their maintenance and support contracts or a largeprofessional services contract, such as those we have in place to provide services to the U.S. Army, not beingrenewed for additional terms as provided in certain of those contracts.
ACV is not a measure of financial performance under generally accepted accounting principles in the UnitedStates (“GAAP”) and should not be considered a substitute for deferred revenue. We use this metric to assess theeffectiveness of sales and business development activities and how that effectiveness will factor into futurerevenue. We have maintained increased visibility into ACV in recent years because with the addition ofsubscription services and increased sales of professional services, we believe sales growth may significantlyoutpace revenue growth in the near term. ACV, together with recurring revenue and deferred revenue trends,provides greater insight into how bookings will factor into revenue over specific periods. We determine ACVrelated to non-cancellable contracts for future delivery of our products and services as follows:
December 31,
2012 2011
(thousands)
Amounts we have billed and/or been paid in advance(presented as deferred revenue in our financial statements) . . . . . . . . . . . . . . . . . . $ 9,773 $7,632Amounts we will bill and be paid in the future (will appear in our financial
statements when we are paid and/or when we provide the products andservices) . . . . . . . . . . . . . . . . . . . . . . . . . . . . . . . . . . . . . . . . . . . . . . . . . . . . . . . . 797 1,200
Total ACV . . . . . . . . . . . . . . . . . . . . . . . . . . . . . . . . . . . . . . . . . . . . . . . . . . . . . . . . $10,570 $8,832
Non-GAAP Financial Measures
In addition to our financial statements prepared in accordance with GAAP, we use certain supplemental,non-GAAP measures (as defined by the Securities and Exchange Commission) to monitor the financialperformance of our core operating activities prior to consideration of significant events that occur infrequently.Those non-GAAP measures include:
• Non-GAAP operating expenses
• Non-GAAP operating income
• Non-GAAP net income
• Non-GAAP earnings per share
Each of these non-GAAP financial measures excludes the effects of the affiliated entity asset impairmentand the TappIn earnout liability not paid that are part of our Consolidated Statements of Operations and
49

Comprehensive Income prepared in accordance with GAAP. We exclude these items when determining our non-GAAP financial measures because we do not consider them part of our core operating results when assessing ouroperational performance, allocating resources to our business activities and preparing operating budgets. Webelieve that by comparing our non-GAAP financial measures across historical periods, our operating results canbe evaluated exclusive of the effects of certain items that may not be indicative of our core operations.
While we believe these non-GAAP financial measures provide useful supplemental information, there arelimitations associated with the use of these non-GAAP financial measures. These non-GAAP financial measures arenot prepared in accordance with GAAP and may not be comparable to similarly titled measures of other companiessince there is no standard for preparing these non-GAAP financial measures. Each of the excluded items listedabove individually and collectively can have a material impact on operating expenses, operating income, net incomeand earnings per share. As a result, these non-GAAP financial measures have limitations and should not beconsidered in isolation from, or as a substitute for, financial statements prepared in accordance with GAAP.
Year Ended December 31,
2012 2011 2010
(In 000’s except per share amounts)
Non-GAAP Operating ExpensesGAAP total operating expenses . . . . . . . . . . . . . . . . . . . . . . . . . . . . . $24,766 $20,103 $17,284Affiliated entity asset impairment . . . . . . . . . . . . . . . . . . . . . . . . . . . (3,264) — —TappIn earnout liability not earned . . . . . . . . . . . . . . . . . . . . . . . . . . 1,343 — —
Non-GAAP operating expenses . . . . . . . . . . . . . . . . . . . . . . . . . . . . . $22,845 $20,103 $17,284
Non-GAAP (Loss) Income From OperationsGAAP (loss) income from operations . . . . . . . . . . . . . . . . . . . . . . . . $ (1,394) $ 791 $ 1,281Affiliated entity asset impairment . . . . . . . . . . . . . . . . . . . . . . . . . . . 3,264 — —TappIn earnout liability not earned . . . . . . . . . . . . . . . . . . . . . . . . . . (1,343) — —
Non-GAAP income from operations . . . . . . . . . . . . . . . . . . . . . . . . . $ 527 $ 791 $ 1,281
Non-GAAP Net Income (Loss)GAAP net (loss) income . . . . . . . . . . . . . . . . . . . . . . . . . . . . . . . . . . $ (1,800) $ 635 $ 881Affiliated entity asset impairment . . . . . . . . . . . . . . . . . . . . . . . . . . . 3,264 — —TappIn earnout liability not earned . . . . . . . . . . . . . . . . . . . . . . . . . . (1,343) — —
Non-GAAP net income . . . . . . . . . . . . . . . . . . . . . . . . . . . . . . . . . . . $ 121 $ 635 $ 881
Non-GAAP Earnings Per ShareNon-GAAP net income . . . . . . . . . . . . . . . . . . . . . . . . . . . . . . . . . . . $ 121 $ 635 $ 881Weighted average share outstanding:
Basic . . . . . . . . . . . . . . . . . . . . . . . . . . . . . . . . . . . . . . . . . . . . . . 18,358 18,081 17,540Diluted . . . . . . . . . . . . . . . . . . . . . . . . . . . . . . . . . . . . . . . . . . . . 19,016 18,747 18,260
Non-GAAP net income per common share:Basic . . . . . . . . . . . . . . . . . . . . . . . . . . . . . . . . . . . . . . . . . . . . . . $ 0.01 $ 0.04 $ 0.05Diluted . . . . . . . . . . . . . . . . . . . . . . . . . . . . . . . . . . . . . . . . . . . . $ 0.01 $ 0.03 $ 0.05
The affiliated entity asset impairment effect on non-GAAP net income of $3.3 million is the gross affiliatedentity asset impairment associated with the write-off of our investment in, and our notes receivable from,CoreTrace Corporation. There is no related federal income tax effect reflected here because this item is a capitalloss for federal income tax purposes for which we are uncertain as to whether we will generate sufficient capitalgains in the future against which this capital loss can be applied.
The TappIn earnout liability not paid of $1.3 million is the gross amount of the liability relieved. There is norelated federal income tax effect because the elimination of the liability for this payment is not a taxable event forfederal income tax purposes.
50
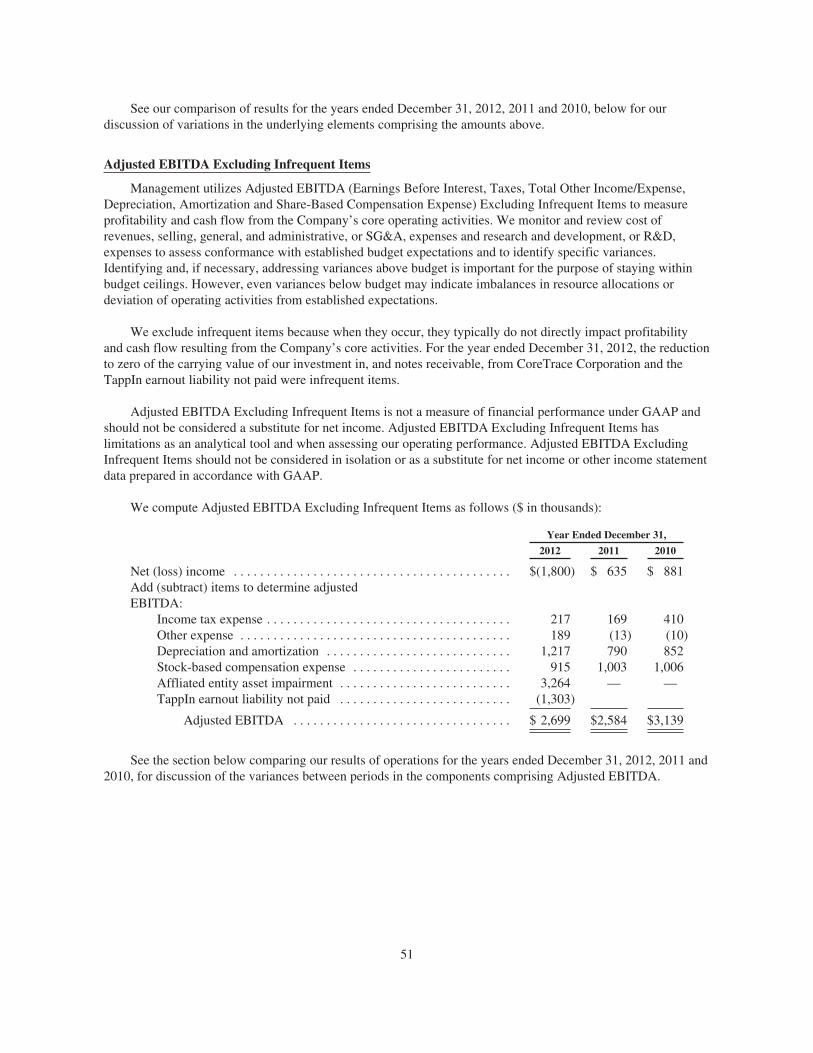
See our comparison of results for the years ended December 31, 2012, 2011 and 2010, below for ourdiscussion of variations in the underlying elements comprising the amounts above.
Adjusted EBITDA Excluding Infrequent Items
Management utilizes Adjusted EBITDA (Earnings Before Interest, Taxes, Total Other Income/Expense,Depreciation, Amortization and Share-Based Compensation Expense) Excluding Infrequent Items to measureprofitability and cash flow from the Company’s core operating activities. We monitor and review cost ofrevenues, selling, general, and administrative, or SG&A, expenses and research and development, or R&D,expenses to assess conformance with established budget expectations and to identify specific variances.Identifying and, if necessary, addressing variances above budget is important for the purpose of staying withinbudget ceilings. However, even variances below budget may indicate imbalances in resource allocations ordeviation of operating activities from established expectations.
We exclude infrequent items because when they occur, they typically do not directly impact profitabilityand cash flow resulting from the Company’s core activities. For the year ended December 31, 2012, the reductionto zero of the carrying value of our investment in, and notes receivable, from CoreTrace Corporation and theTappIn earnout liability not paid were infrequent items.
Adjusted EBITDA Excluding Infrequent Items is not a measure of financial performance under GAAP andshould not be considered a substitute for net income. Adjusted EBITDA Excluding Infrequent Items haslimitations as an analytical tool and when assessing our operating performance. Adjusted EBITDA ExcludingInfrequent Items should not be considered in isolation or as a substitute for net income or other income statementdata prepared in accordance with GAAP.
We compute Adjusted EBITDA Excluding Infrequent Items as follows ($ in thousands):
Year Ended December 31,
2012 2011 2010
Net (loss) income . . . . . . . . . . . . . . . . . . . . . . . . . . . . . . . . . . . . . . . . . . $(1,800) $ 635 $ 881Add (subtract) items to determine adjustedEBITDA:
Income tax expense . . . . . . . . . . . . . . . . . . . . . . . . . . . . . . . . . . . . . 217 169 410Other expense . . . . . . . . . . . . . . . . . . . . . . . . . . . . . . . . . . . . . . . . . 189 (13) (10)Depreciation and amortization . . . . . . . . . . . . . . . . . . . . . . . . . . . . 1,217 790 852Stock-based compensation expense . . . . . . . . . . . . . . . . . . . . . . . . 915 1,003 1,006Affliated entity asset impairment . . . . . . . . . . . . . . . . . . . . . . . . . . 3,264 — —TappIn earnout liability not paid . . . . . . . . . . . . . . . . . . . . . . . . . . (1,303)
Adjusted EBITDA . . . . . . . . . . . . . . . . . . . . . . . . . . . . . . . . . $ 2,699 $2,584 $3,139
See the section below comparing our results of operations for the years ended December 31, 2012, 2011 and2010, for discussion of the variances between periods in the components comprising Adjusted EBITDA.
51

Solution Perspective and Trends
The following is a summary description of our products and solutions. Our discussion of the business trendsof our products is based on the following profile of our revenue components ($ in thousands):
Revenue for the Year Ended December 31,
2012 2011 2010
AmountPercent of
Total AmountPercent of
Total AmountPercent of
Total
Revenue by ProductEFT Server Enterprise . . . . . . . . . . . . . . . . . . . . $14,742 63.1% $12,167 58.2% $10,913 58.8%EFT Server . . . . . . . . . . . . . . . . . . . . . . . . . . . . . 3,367 14.4% 3,665 17.5% 3,616 19.5%Wide Area File Services/CDP . . . . . . . . . . . . . . 1,577 6.7% 1,533 7.3% 1,869 10.1%Professional Services . . . . . . . . . . . . . . . . . . . . . 1,547 6.6% 1,772 8.5% 438 2.4%CuteFTP . . . . . . . . . . . . . . . . . . . . . . . . . . . . . . . 1,059 4.5% 1,209 5.8% 1,522 8.2%Other . . . . . . . . . . . . . . . . . . . . . . . . . . . . . . . . . . 1,080 4.6% 548 2.6% 207 1.1%
Total Operating Revenues . . . . . . . . . . . . . . . . . $23,372 100.0% $20,894 100.0% $18,565 100.0%
Maintenance and Support Included in TotalOperating Revenue $11,298 48% $ 9,424 45% $ 7,762 42%
Managed File Transfer Solutions (On Premises and Cloud-based)
Our MFT products and solutions allow customers to move large files and large numbers of files securely.We facilitate management, monitoring, and reporting on the file transfers and deliver advanced workflowcapabilities to move data and information into and throughout an enterprise.
We earn most of our software license revenue from sales of our EFT Standard Edition and EFT EnterpriseEdition products and solutions. These products and solutions provide a common, scalable MFT platform thataccommodates a broad family of add-on modules to provide SMB and enterprise customers with increasedsecurity, automation, and performance when compared to traditional FTP-based and e-mail delivery systems. Theadd-on modules allow customers to select the solution configuration most applicable to their requirements forauditing and reporting, encryption, ad hoc and web-based file transfers, operability in or through a DMZnetwork, and integration with back-end business processes, including workflow automation capabilities. Wecontinue to develop these products and solutions by, for example, improving their speed and responsiveness ofperformance, providing additional administration flexibility supporting cross-platform implementation with ourDMZ Gateway solution, implementing business activity monitoring, and providing additional language support.We have sustained the year-to-year increase in our revenue from these products and solutions as a result of ourongoing development of this product line that has continued to enhance its appeal in the marketplace.
CuteFTP is a ‘“client side” software product, installed on a user’s local computer, that enables file transfersfrom or to an FTP server. The target market for the CuteFTP product includes corporate IT professionals who useit to transfer data between locations via the Internet and individual Web site operators who use it to upload theirWeb pages to their Web hosting provider, among others. While CuteFTP still has significant brand recognition inthe market, the revenue dollars we earn from this product line and its percent of our total revenue has declined inrecent years. We believe market availability of free FTP utilities and the emergence of social media withimbedded capabilities for sharing non-sensitive data such as photos and videos are examples of the primarycauses of the decline in CuteFTP revenue. We released our current CuteFTP Version 9 in November 2012. TheVersion 9 release includes a number of updates, including support for Unicode (UTF-8) characters that will allowgreater international use and Web Distributed Authoring and Versioning (WebDAV) support to facilitatecollaboration between users in editing and managing documents and files stored on World Wide Web servers. Increating the Version 9 release, we also simplified our CuteFTP product line by consolidated all the features of
52

our previous multi-product CuteFTP product line for Windows operating systems into the single new version.We also continue to offer CuteFTP Version 3.1 software for Mac platforms. We believe this product Version 9product, as well as our continued offering of Version 3.1 for Mac platforms, can appeal to users wanting featuresmore robust than offered in free alternatives and potentially may slow the rate of decrease in CuteFTP’s level ofcontribution to our revenue in the future.
We have a partner agreement with Rackspace Hosting, Inc., a world leader in the hosting and cloudcomputing industry that began in 2010. We have a similar agreement with PEER 1 Hosting to meet the growingEuropean demand for our services. Through these relationships, we deliver cloud-based, managed file transfersolutions for the secure exchange of business-to-business data, including large files and sensitive data. Ourcloud-based solutions allow customers to outsource all or part of their complex and demanding informationexchange needs to reduce costs, improve operational efficiencies, track and audit transactions, and provide agreater level of security. We offer our cloud services capability in the United States, as well as in the UnitedKingdom and Canada, to support solution delivery in instances where country-specific compliance requirementsmay necessitate in-country delivery of the services. The cloud-based solutions established an additional deliverymethod for our MFT products and solutions and potentially for other solution capabilities. Through our cloudservices, we can offer new and existing customers “pay as you go”, flexible pricing under one, two, and three-year contracts that help them eliminate upfront capital expenditures. This subscription revenue provides us with agrowing revenue stream visible into future periods. The revenue we earn from this product line is included inother revenue in the table above. While this revenue has grown from year-to-year, it does not yet constitute amaterial portion of our overall revenue.
Wide Area File Services and Continuous Data Protection Solution
Our Wide Area File Services, or WAFS, software provides a file sharing, collaboration, and replicationsolution over multiple sites. WAFS technology can have our Continuous Data Protection (“CDP”) product addedto provide enterprises with a file access and data protection combination that centralizes data storage and ITadministration facilities but doesn’t compromise data sharing and protection. We experienced a decline in WAFSrevenue during 2011 as the marketplace anticipated a product upgrade forthcoming at that time. We releasedWAFS 4, a major upgrade of the solution, in September 2011. WAFS 4 introduced a new user interface, supportfor Unicode characters (to facilitate greater international sales), and other significant enhancements. WAFS 4allowed us to increase revenue from that product line in 2012, reversing a multi-year trend of declining revenue.We believe WAFS will be competitive in the marketplace for the foreseeable future as a product serving the needfor wide area file access and data protection.
Managed E-mail Attachment Solution
Our managed e-mail attachment solution, Mail Express, is a client-server application that allows users tosend and receive e-mail attachments, up to 25 GB, with enhanced security and visibility compared to typical e-mail solutions. The Mail Express application provides flexible, customer-defined administration privileges toallow e-mail administrators and end users to configure specific parameters for handling e-mail attachments inaccordance with corporate policy. We released Mail Express 3 in August 2010 which led to continued revenuegrowth from that product line in 2011 and 2012. In February 2013, we announced the general availability of MailExpress Version 3.3 that includes a number of enhancements including integration with EFT 2013. We believeMail Express will be competitive in the marketplace for the foreseeable future as a product for securely sharingand managing large e-mail attachments.
53

Secure Content Mobility Solution
We acquired TappIn, Inc. in December 2011 to provide us with initial entry into the secure content mobilitymarket. The TappIn by GlobalSCAPE service provides the ability to easily and securely access and sharedocuments, pictures, videos and music anytime, anywhere while eliminating or minimizing the storage of data inthe cloud and the associated security and privacy concerns. From the office, at home, or on the road, customerscan “Tapp In” to their files, stored in multiple locations, using any web browser and most Internet-enabledmobile devices (including Apple iPhone and iPad, Google Android and Windows Phone and Kindle Fire). WithTappIn, users can avoid uploading and/or syncing to a cloud storage location and eliminate the need to pay foradditional cloud storage. Instead, the TappIn service securely accesses the user’s existing in-house storagedevices (such as a desktop computer, in-house network servers or network attached storage devices), allowssharing files of any size and provides encryption to safeguard content.
The TappIn by GlobalSCAPE service incorporates elements of on-premises software, cloud and SaaSdelivery models. Unlike other remote access products that can consume significant amounts of storage capacityon a smartphone or tablet, TappIn makes content available through a secure pathway that gives users access tofiles on their existing in-house storage devices without having to download those files to their mobile device.This delivery method not only saves storage space on the mobile device but also ensures content remains secureand private on the user’s existing in-house storage devices.
We believe secure content mobility is a rapidly emerging central feature of our served markets, includingour primary MFT market. Exponential growth in smartphone and tablet sales and adoption, combined with rapidgrowth in retained content and BYOD expectations, will drive strong revenue growth in this market segment.
Professional Services
We offer a range of professional services to complement our software and cloud-based solutions. Theseprofessional services include product customization and system integration, solution “quickstart”implementations, business process and workflow, policy development, education and training, and health checks.In addition, we may provide longer-term engineering services, including supporting multi-year contracts, ifnecessary to support certain solution implementations and integrations.
Professional services decreased slightly from $1.8 million, or 8.5% percent of revenue in 2011, to$1.5 million or 6.6% percent of revenue in 2012 due to a decrease in revenue earned under our contractsupporting the Standard Army Maintenance System-Enhanced, or SAMS-E, logistics program as a result ofvarious budget action and project scope decisions made by the U.S. Army and the primary contractor to the U.S.Army, whom we support under this contract. The scope of this contract may continue to change in the future dueto a variety of factors, including availability of government budget authorization for the SAMS-E program andour evolving work share of the contract. We believe we can continue to increase deliveries of our commercial(non-government) professional services as we increasingly bundle those services with new sales of our enterprisesolutions and as we sell repeat services to our prior customers.
Our increased professional services lead to a corresponding increase in our cost of revenues (or cost ofgoods sold), because the services necessarily are labor intensive. For this reason, professional services typicallyhave significantly lower margins than product sales or subscription services. However, we believe professionalservices allow us to better establish and maintain our solution implementations, while also providing ourcustomers with the training and education services that help them make more complete use of our solutioncapabilities. In addition, for large contracts like the engineering services we provide to the U.S. Army, suchprofessional services provide significant past performance that facilitates additional business. Over time, webelieve the return on investment from increased professional services outweighs the potential near-term impactson operating margins.
54
Endpoint Security Solution
We had planned to enter the endpoint security market through development of appShield, a softwareapplication control (or “whitelisting”) product. The appShield product was being developed under a JointDevelopment and Reseller Agreement between GlobalSCAPE and CoreTrace Corporation. In November 2012,CoreTrace Corporation sold substantially all of its assets to an unrelated third party resulting in CoreTrace endingits development work on appShield. This action provided us possession of the appShield source code whilesustaining our prior appShield-related license rights. The notable resulting change is that we now have the rightto sell products based on the appShield source code with no royalty obligation to CoreTrace Corporation or anyother party.
The consumer application control market has matured significantly since appShield product developmentbegan in 2009. That situation necessitates additional development work on the appShield source code, whichpossibly could be significant, to bring appShield to market. We are investigating whether to further develop thisproduct on our own, engage others to continue the development for us, or sell the appShield rights to anotherparty. As a result, we have no date scheduled for introduction of appShield to the market nor do we have specificplans to pursue such introduction.
Overall Revenue Trends and Mix Between Products, Services, and Maintenance and Support
Our revenue from software licenses and professional services (i.e. all sources other than M&S sales)increased 4% in 2012 compared to 2011 and 6% in 2011 compared to 2010. Notable factors yielding thesecombined results include:
• Software license revenue from our EFT, WAFS and other software products (i.e. all software productsother than CuteFTP) grew 11% in 2012 compared to 2011 and declined 4% in 2011 compared to 2010.The decline in 2011 was due to pricing pressure in the marketplace on EFT Enterprise due primarily togeneral economic conditions resulting in a related responsive promotion in 2011 during which wediscounted the price of certain of our EFT products. We resumed growth in these license revenues in2012 as improved market conditions relieved pricing pressure, and we were able to achieve EFTEnterprise sales targets without continuing the discounting promotion from 2011. The growth rate in2012 is consistent with our expectations for these products that present our latest technologies to themarketplace, that constitute over 90% of our software license revenue and that contribute significantlyto our operating margins.
• Software license revenue from CuteFTP declined 13% in 2012 compared to 2011 and declined 25% in2011 compared to 2010. While this trend is unfavorable, it is not inconsistent with our expectations. Asdiscussed elsewhere in this document and in our previous regulatory filings, while CuteFTP still hassignificant brand recognition in the market, the revenue dollars we earn from this product line and itspercent of our total revenue has declined in recent years. We believe market availability of free FTPutilities and the emergence of social media with imbedded capabilities for sharing non-sensitive datasuch as photos and videos are examples of the primary causes of the decline in CuteFTP revenue. Webelieve CuteFTP Version 9, as well as our continued offering of Version 3.1 for Mac platforms, canappeal to users wanting features more robust than offered in free alternatives and potentially may slowthe rate of decrease in CuteFTP’s level of contribution to our revenue in the future.
• Professional services revenue declined 13% in 2012 compared to 2011 after increasing over 300% in2011 compared to 2010. We earn a significant portion of this professional services revenue (33% in2012 and 62% in 2011) under our contract supporting the Standard Army Maintenance System-Enhanced, or SAMS-E, logistics program. This program, which is dependent upon federal funding asdetermined by the United States Congress, is subject to unpredictable and varying budget actions andproject scope decisions between the U.S. Army and the primary contractor to the U.S. Army whom wesupport under this contract, which are factors beyond our control. The scope of this contract maycontinue to change in the future due to a variety of factors, including availability of government budgetauthorization for the SAMS-E program and our evolving work share of the contract.
55

M&S revenue increased 20% in 2012 compared to 2011 and 21% in 2011 compared to 2010. M&S revenueas a percent of our total revenue was 48%, 45% and 42% in 2012, 2011 and 2010, respectively. This continuedgrowth in M&S revenue is consistent with the continued growth in our deferred revenue balance at each yearend. Our M&S revenue growth and its increasing percentage of our total revenue are primarily due to thegrowing installed base of our software products in the marketplace. This installed base growth creates acompounding effect for M&S renewals since the cumulative number of licensed software installations sold overmultiple years that create M&S renewals in any single year predictably (and in line with our expectations)exceeds the number of new software licenses we sell in a single year. We expect this compounding effect tocontinue to grow. We view this M&S revenue increase as a positive indicator of our customers’ ongoingsatisfaction with our products purchased in past years.
Liquidity and Capital Resources
At December 31, 2012, we had cash of $8.1 million. We generated cash in excess of $2 million from ouroperating activities in each of 2012, 2011 and 2010. We rely on cash on hand and cash flows from operations tofund our operations and believe these items will be our principal sources of operating capital in 2013.
At December 31, 2012, our net working capital position was $73,000. The current liabilities component ofthat working capital included $8.3 million of deferred revenue which, unlike all other liability components of ourworking capital, is an obligation we will satisfy through ongoing operating activities from which we havehistorically generated cash flow and not through a disbursement of cash as a direct payment of that liability.
Our capital requirements principally relate to our need to fund our ongoing operating expenditures, whichare primarily related to employee salaries and benefits. We make these expenditures to enhance our existingproducts, develop new products, sell those products in the marketplace and support our customers after the sale.
In 2011, we enhanced our product offerings through the acquisition of TappIn, a secure content mobilitysolution company. At the time of that acquisition, we paid the TappIn selling stockholders $9 million which wefunded with $2.0 million of our cash on hand and $7.0 million borrowed under our notes payable to a bank. In2012, the TappIn shareholders earned an additional milestone payment provided for under the purchaseagreement of $2.0 million of which we paid $1.5 million in 2012 and $500,000 in 2013 from our cash on hand. Ifcertain TappIn product revenue milestones are achieved by December 31, 2014, we will be obligated to pay theformer stockholders of TappIn an additional $4.5 million
Because our principal sources of capital are cash on hand and cash flow from operations, to the extent thatsales decline, our cash flow from operations could also decline. If sales decline or if our liquidity is otherwiseunder duress, management could substantially reduce personnel and personnel-related costs, reduce orsubstantially eliminate capital expenditures and/or reduce or substantially eliminate certain research anddevelopment expenditures. We may also sell equity or debt securities or enter into credit arrangements in order tofinance future acquisitions or licensing activities, to the extent available.
Cash provided or used by our various activities consisted of the following ($ in thousands):
Year Ended December 31,
2012 2011 2010
Net cash provided by operating activities . . . . . . . . . . . . . . . . . . . . . . $ 3,844 $ 2,826 $2,711Net cash provided by (used in) investing activities . . . . . . . . . . . . . . . (2,103) (12,391) 1,021Net cash provided by (used in) financing activities . . . . . . . . . . . . . . (2,523) 7,339 329
56
The variations in these amounts between years are due to the following items. This discussion should beread in conjunction with our consolidated statement of cash flows presented below in Item 8. FinancialStatements and Supplemental Data:
Net cash provided by operating activities—
The amount provided in 2012 changed compared to the amount provided in 2011primarily due to:
• A net loss in 2012 compared to net income in 2011 (see the Result of Operations section below fora discussion of the nature of the changes in the components of net income and net loss.)
• Deferred revenue increased more in 2012 compared to 2011 mainly due to the receipt in 2012 ofan advance payment of $1.3 million under one of our contracts to provide services to the U.S.Army for which there was no similar receipt in the 2011.
The amount provided in 2011 was substantially unchanged from the amount provided in 2010although:
• Accounts receivable increased less in 2011, when compared to 2010, due to an increased focus onaccounts receivable collections in 2011.
• The CoreTrace receivable increased more in 2011 than in 2010 due to (1) a higher level of loansto CoreTrace needed to provide them funding to continue development at the time of our plannedappShield product plus (2) a higher level of accrued interest on those loans due to an increasingoutstanding notes receivable balance.
• Deferred revenue increased less in 2011 compared to 2010 due to continued amortization ofamounts previously received under our contract to provide services to the U.S. Army.
Net cash provided by (used in) investing activities —
The net use of cash in 2012 changed compared to the net use of cash in 2011 primarily due to:
• Cash paid for the initial purchase of TappIn, Inc. in 2011 for which there was no comparable eventin 2012 other than the related milestone payment in 2012 which was for a lesser amount than theinitial purchase price as provided in the purchase agreement.
• The purchase in 2011 of a certificate of deposit to secure the notes payable to a bank under whichfunds were borrowed for the purchase of TappIn for which there was no comparable event in2012.
The amount of cash used in 2011 changed compared to the amount provided in 2010 primarily due to:
• Cash paid for the purchase of TappIn, Inc. in 2011 for which there was no comparable event in2010.
• The purchase in 2011 of a certificate of deposit to secure the notes payable to a bank under whichfunds were borrowed for the purchase of TappIn for which there was no comparable event in2010.
• The 2010 redemption of short-term investments and transfer of the proceeds to cash (due to lowinterest rates creating no incentive for continuing with short-term investments) for which therewas no comparable transaction in 2011 since no short-term investments were made or existed in2011.
57
Net cash provided by (used in) financing activities —
There was a net use of cash in 2012 compared to cash being provided in 2011 with the changeprimarily due to:
• Principal payments on the notes payable to a bank during 2012 for which there were nocomparable transactions in 2011 because these notes payable originated in December 2011 inconnection with the TappIn, Inc. acquisition and no principle payments were due under the notespayable before 2012.
• A dividend payment to our stockholders in 2012 for which there was no comparable event in2011.
• The receipt in 2011 of proceeds from the bank loans described below in connection with theTappIn, Inc. acquisition for which there was no comparable event in 2012.
The cash provided in 2011 changed compared to the cash provided in 2010 primarily due to receipt in2011 of proceeds from the bank loans described below originated in connection with the TappIn, Inc.acquisition for which there was no comparable event in 2010.
Loan Agreements. In December 2011, we borrowed $7 million under loan agreements with The Bank ofSan Antonio to fund a portion of the purchase price of TappIn, Inc. These loan agreements provide for thefollowing notes payable:
• A $4.0 million note payable bearing interest at 4.75% per annum and secured by substantially all of ourconsolidated assets.
• A $3.0 million note payable bearing interest at 4.25% per annum and secured by a certificate of depositwith The Bank of San Antonio of $3.0 million bearing interest at 2.0% per annum.
Interest and principal are payable under both notes in 60 equal monthly installments that will fully amortizethe notes as of their December 2, 2016 maturity date. The loans may be prepaid at any time without premium orpenalty.
The Loan Agreements contain the following financial covenants:
• Beginning with the first quarter of 2013, we must maintain a debt service coverage ratio of at least1.25. This ratio is defined in the loan agreements as (1) net income plus depreciation, interest and non-cash charges divided by (2) the sum of the current portion of long-term debt plus interest expense.
• Beginning with the first quarter of 2013, we must maintain a debt to tangible net worth ratio of at least4.00:1. This ratio is defined in the loan agreements as (1) total liabilities less deferred revenues dividedby (2) total assets, excluding intangible assets, minus total liabilities, excluding deferred revenues.
• We must maintain liquid assets (cash and marketable securities) of at least $3.2 million in 2013 and$2.2 million in 2014.
The loan agreements contain customary covenants relating to maintaining legal existence and goodstanding, complying with applicable laws, delivery of financial statements, payment of taxes and maintaininginsurance. We are prohibited, without obtaining advance approval from the bank, from selling any of our assetsother than in the ordinary course of business, acquiring any other entities, changing the types of business we areengaged in, incurring indebtedness other than that permitted by the loan agreements, incurring any liens on ourassets other than those permitted by the loan agreements, making certain investments or acquiring any shares ofour capital stock. The loan agreements also contain customary events of default including the failure to makepayments of principal and interest, the breach of any covenants, the occurrence of a material adverse change, andcertain bankruptcy and insolvency events.
58
Contractual Obligations. At December 31, 2012, our principal commitments consisted of obligationsoutstanding under the loan agreements described above, operating leases for our office space, royalty agreementswith third parties, federal income tax payable, trade accounts payable and accrued liabilities. The commitmentsrelated to royalty agreements are contingent on sales volumes. We plan to continue to expend significantresources on product development in future periods which may require that we enter into additional contractualarrangements and use our cash to acquire or license technology, intellectual property, products or businessesrelated to our current business strategy.
Our contractual obligations at December 31, 2012, other than trade accounts payable, accrued liabilities,royalties and federal income taxes we incur in the normal course of business consisted of the following:
Payments Due for the Period
2013 2014 - 2016 2017 - 20192020 andthereafter Total
Office lease . . . . . . . . . . . . . . . . . . . . . . . . . $ 479 $1,207 $840 $— $2,526Equipment leases . . . . . . . . . . . . . . . . . . . . 2 — — — 2Long-term debt . . . . . . . . . . . . . . . . . . . . . . 1,567 4,703 — — 6,270
$2,048 $5,910 $840 $— $8,798
New Accounting Pronouncements
In July 2012, the Financial Accounting Standards Board (FASB) issued FASB Accounting StandardsUpdate (ASU) No. 2012-02, Intangibles—Goodwill and Other (Topic 350)—Testing Indefinite-Lived IntangibleAssets for Impairment. ASU 2012-02 permits an entity to first assess qualitative factors to determine whether it ismore likely than not that an indefinite-lived intangible asset is impaired as a basis for determining whether it isnecessary to perform the quantitative impairment test in accordance with Subtopic 350-30. If an entity concludesthat it is not more likely than not that the indefinite-lived intangible asset is impaired, then no further action isrequired. If an entity concludes otherwise, then it is required to determine the fair value of the indefinite-livedintangible asset and perform the quantitative impairment test. ASU 2012-02 is effective for annual and interimimpairment tests performed for fiscal years beginning after September 15, 2012, with early adoption permitted.The adoption of this ASU is not expected to have a material impact on our financial statements.
In December 2011, the FASB issued FASB ASU No. 2011-11, Balance Sheet (Topic 210)—Disclosuresabout Offsetting Assets and Liabilities. ASU 2011-11 requires an entity to disclose information about offsettingand related arrangements to enable users of its financial statements to understand the effect of those arrangementson its financial position. Entities are required to disclose both gross and net information about these instruments.ASU 2011-11 is effective for annual reporting periods beginning on or after January 1, 2013, and interim periodswithin those annual periods. The adoption of this ASU is not expected to have a material impact on our financialstatements.
Critical Accounting Policies
Our financial statements and accompanying notes are prepared in accordance with GAAP applicable topublic companies in the United States. Preparing financial statements requires management make estimates andassumptions that affect the reported amounts of assets, liabilities, revenue, and expenses. These estimates andassumptions are affected by management’s application of accounting policies. We discuss our critical accountingareas and policies below, all of which we apply in accordance with GAAP.
Revenue Recognition
We recognize revenue when each of the four factors below exists for a transaction:
• Evidence of an arrangement. We consider a non-cancelable written agreement signed by us andthe customer to be persuasive evidence of an arrangement.
59
• Delivery has occurred. We consider delivery to have occurred when a compact disc or othermedium containing the licensed software is provided to a common carrier, or in the case ofelectronic delivery, the customer is given electronic access to the licensed software. If anarrangement includes undelivered products or services that are essential to the functionality of thedelivered product, delivery is not considered to have occurred until these products or services aredelivered.
• Fixed or determinable fee. We consider the fee to be fixed or determinable unless the fee issubject to refund or adjustment or is not payable within normal payment terms. If the fee is subjectto refund or adjustment, we recognize revenue when the refund or adjustment right lapses or thereturn is estimable. For arrangements with extended payment terms, we recognize revenue asamounts become due and payable or as cash is collected. We grant a limited right of return to ourcustomers.
• Collection is deemed probable. We conduct a credit review for all transactions at the inception ofan arrangement to determine the creditworthiness of the customer. Collection is deemed probableif, based upon our evaluation, we expect that the customer will be able to pay amounts under thearrangement as payments become due. If we determine that collection is not probable, revenue isdeferred and recognized upon cash collection.
We earn most of our revenue from software products sold under perpetual software license agreements. Atthe time they purchase these products, our customers typically also purchase a product maintenance and supportagreement. These transactions are multiple element software sales for which we assess the presence of vendorspecific objective evidence (“VSOE”) of the fair value of the undelivered elements to determine the portion ofthese sales to recognize as revenue upon delivery of the software product and the portion of these sales to recordas deferred revenue at the time the product is delivered. We amortize the deferred revenue component to revenuein future periods as we deliver the related future services to the customer. For transactions for which we cannotestablish VSOE of fair value of the undelivered elements, we initially record the entire transaction as deferredrevenue and amortize that amount to revenue in future periods as we deliver the related future services to thecustomer. Our deferred revenue consists primarily of revenue to be earned in the future as we deliver servicesunder maintenance and support agreements. See Item 8., Financial Statements and Supplemental Data, below forthe presentation of the amounts of our revenue and deferred revenue for each reporting period contained hereinand our discussion of those items in the footnotes to our financial statements.
For our products delivered under a software-as-a-service transaction on a monthly subscription basis, werecognize revenue, including initial setup fees, on a monthly basis as we deliver our products and services overthe contractual term of the customer contract. We believe customers generally will continue to utilize ourservices beyond the initial contract term which typically ranges from one to three years. As a result, setup feesare recognized ratably over the estimated average life of a customer relationship. Amounts that have beeninvoiced are recorded in accounts receivable and either deferred revenue or revenue, depending on whether therevenue recognition criteria have been met.
We provide professional services to our customers consisting primarily of software installation support,operations support and training. We recognize revenue from these services as they are completed and accepted byour customers.
In determining revenue recognition, we must apply judgment and use estimates to determine the allocationof revenue between software license revenue and maintenance and support revenue, as well as the amount ofdeferred revenue to be recognized in each accounting period. Changes to the elements in a software arrangement,the ability to identify, determine and apply VSOE of fair value for those elements and the presence of flexibilityunder the terms of contractual arrangements with our customers could materially impact the revenue werecognize in current accounting periods and/or defer recognition to future periods.
60
Goodwill
Goodwill is not amortized. On at least an annual basis, we test goodwill for impairment at the reporting unitlevel. We operate as a single reporting unit.
When testing goodwill, we first assess qualitative factors to determine whether it is more likely than not(that is, a likelihood of more than 50 percent) that the fair value of our reporting unit is less than its carryingamount, including goodwill. In performing this qualitative assessment, we assess events and circumstancesrelevant to the Company including, but not limited to:
• Macroeconomic conditions.
• Industry and market considerations.
• Cost factors and trends for labor and other expenses of operating our business.
• Our overall financial performance and outlook for the future.
• Trends in the quoted market value and trading of our common stock.
In considering these and other factors, we consider the extent to which any adverse events andcircumstances identified could affect the comparison of our reporting unit’s fair value with its carrying amount.We place more weight on events and circumstances that most affect our reporting unit’s fair value or the carryingamount of our net assets. We consider positive and mitigating events and circumstances that may affect ourdetermination of whether it is more likely than not that the fair value of our reporting unit is less than its carryingamount. We evaluate, on the basis of the weight of the evidence, the significance of all identified events andcircumstances in the context of determining whether it is more likely than not that the fair value of our reportingunit is less than its carrying amount.
If, after assessing the totality of these qualitative events and circumstances, we determine it is not morelikely than not that the fair value of our reporting unit is less than its carrying amount, we conclude there is noimpairment of goodwill and perform no further testing in accordance with GAAP. If we conclude otherwise, weproceed with performing the first step, and if necessary, the second step, of the two-step goodwill impairment testprescribed by GAAP.
As of December 31, 2012 and December 31, 2011, after assessing the totality of the relevant qualitativeevents and circumstances, we determined it not more likely than not that the fair value of our reporting unit wasless than its carrying amount. Accordingly, we concluded there was no impairment of goodwill as of either ofthose dates and, in accordance with GAAP, performed no further testing.
Intangible Assets Being Amortized
We have intangible assets, other than goodwill, consisting of a patent, customer relationships and developedtechnology that we acquired through the purchase of other companies. We determined the value of thoseintangible assets at the time of acquisition through discounted cash flow and other similar valuation methods. Weamortize these intangible assets on straight-line basis over their estimated useful lives that range from seven toeighteen years.
We evaluate intangible assets being amortized for impairment at least annually and more frequently if thereare events or changes in circumstances indicating that the carrying amount of these assets may exceed their fairmarket value. In performing this evaluation, we consider general and company-specific qualitative factors thatare part of the environment in which we use those assets. We also perform quantitative analyses using discountedcash flow and other similar valuation methods. If this work indicates the carrying value of an intangible assetexceeds its fair market value, we adjust these assets to that fair market value. This work we performed as ofDecember 31, 2012 and 2011, resulted in no such adjustment to our intangible assets being necessary.
61

Contingent Consideration
Our TappIn acquisition included future contingent milestone payments based on achieving certain levels ofsales in the future and the introduction of new products (i.e. the TappIn earn out). We estimate the fair value ofthe TappIn earn out contingent consideration liability based on our assessment of the probabilities of achievingthe prescribed milestones. These estimates involve significant judgment. Changes in the fair value of the TappInearn out contingent consideration liability may result from changes in discount periods, changes in the timing andamount of sales and/or other specific milestone estimates and changes in probability assumptions with respect tothe likelihood of achieving the various earn-out criteria. At each reporting date, we assess the fair value of thiscontingent consideration liability. Changes in the fair value of these liabilities related are reflected in our netincome and could materially affect our operating results.
Research and Development and Capitalized Software Development Costs
We expense research and development costs as incurred. When we complete research and development for asoftware product and have a completed a detail program design or a working model of that software product, wecapitalize production costs incurred for that software product from that point forward until it is ready for generalrelease to the public. Thereafter, we amortize capitalized software production costs to expense using the straight-line method over the estimated useful life of that product, which is generally three years.
Allowance for Doubtful Accounts
We regularly assess the collectability of outstanding accounts receivable. We estimate and record anallowance for doubtful accounts considering factors such as historical collection experience, a customer’s currentcreditworthiness, the age of the receivable balance and general economic conditions that may affect ourcustomer’s ability to pay. Our actual bad debt experience could differ from our estimates and exceed ourallowance for doubtful accounts.
Share-based Compensation
We account for stock-based compensation by measuring the fair value of the award at the grant date usingthe Black-Scholes option-pricing model and recognizing expense over the requisite service period. Determiningthe fair value of share-based awards at the grant date requires judgment, including estimating expected dividendsand measuring volatility. In addition, judgment is also required in estimating the amount of share-based awardsthat are expected to be forfeited. If actual results differ significantly from these estimates, stock-basedcompensation expense and our results of operations could be materially impacted.
Income Taxes
We recognize taxes payable or refundable for the current year and deferred tax liabilities and assets for thefuture tax consequences of events in our financial statements. Accruals for uncertain tax positions are recognizedonly if it is more likely than not that the tax position will be sustained on examination by the taxing authorities,based on the technical merits of the position. The tax benefits recognized in the financial statements from such aposition are measured based on the largest benefit that has a greater than 50% likelihood of being realized uponultimate settlement. Judgment is required in assessing the future tax consequences of events that have beenrecognized in our financial statements or tax returns, including uncertain tax positions and the realizability ofdeferred tax assets, which is dependent on the timing of the underlying deductions and the Company’s ability togenerate future taxable income. Variations in the actual outcome of these future tax consequences couldmaterially impact our financial position, results of operations, or cash flows.
62

Results of Operations
Comparison of Year Ended December 31, 2012 to Year Ended December 31, 2011
2012 2011 $ Change
($ in thousands)
Total revenues . . . . . . . . . . . . . . . . . . . . . . . . . . . . . . . . . . . . . . . . . . . . . . . . . . . . . $23,372 $20,894 $ 2,478Cost of revenues . . . . . . . . . . . . . . . . . . . . . . . . . . . . . . . . . . . . . . . . . . . . . . . . . . . . 1,296 1,723 (427)Selling, general and administrative . . . . . . . . . . . . . . . . . . . . . . . . . . . . . . . . . . . . . 16,761 14,466 2,295Research and development . . . . . . . . . . . . . . . . . . . . . . . . . . . . . . . . . . . . . . . . . . . . 3,531 3,124 407Affiliated entity asset impairment . . . . . . . . . . . . . . . . . . . . . . . . . . . . . . . . . . . . . . 3,264 0 3,264TappIn earnout liability not earned . . . . . . . . . . . . . . . . . . . . . . . . . . . . . . . . . . . . . (1,303) 0 (1,303)Depreciation and amortization . . . . . . . . . . . . . . . . . . . . . . . . . . . . . . . . . . . . . . . . . 1,217 790 427
Total operating expenses . . . . . . . . . . . . . . . . . . . . . . . . . . . . . . . . . . . . . . . . . . . . . 24,766 20,103 4,663
Income from operations . . . . . . . . . . . . . . . . . . . . . . . . . . . . . . . . . . . . . . . . . . . . . . (1,394) 791 (2,185)Other income, net . . . . . . . . . . . . . . . . . . . . . . . . . . . . . . . . . . . . . . . . . . . . . . . . . . . (189) 13 (202)Income tax expense . . . . . . . . . . . . . . . . . . . . . . . . . . . . . . . . . . . . . . . . . . . . . . . . . 217 169 48
Net Income . . . . . . . . . . . . . . . . . . . . . . . . . . . . . . . . . . . . . . . . . . . . . . . . . . . . . . . . $ (1,800) $ 635 $(2,435)
In the discussions below, we refer to the year ended December 31, 2012 as “2012” and the year endedDecember 31, 2011, as “2011”. The percentage changes cited in our discussions below comparing our results ofoperations for the year ended December 31, 2012, to the year ended December 31, 2011, are based on 2012amounts compared to 2011 amounts.
Overview of 2012 Compared to 2011. Our business in 2012 involved our ongoing activities related tosoftware sales, maintenance and support and continuing development of our MFT, WAFS, managed emailattachment and professional services solutions (all of which were activities we conducted in 2011 also), whichwere affected by the following items occurring in 2012 that did not occur in 2011.
• Expenses associated with the integration into our business of the TappIn product line we acquired inDecember 2011.
• An affiliated entity asset impairment expense arising from our investments in and notes receivablefrom CoreTrace Corporation becoming unrealizable due to CoreTrace’s sale of substantially all itsassets, other than our appShield product, to an unrelated third party and substantially ceasingoperations and their development of our planned appShield product.
• A portion of the TappIn earnout liability not being earned in 2012 due to TappIn revenue not being atleast $3.0 million in 2012, which was a milestone that had to be achieved for the former TappInshareholders to receive that earnout payment. This event resulted in the elimination of a liability of$1.34 million previously included in our balance sheet with a corresponding credit to income.
These general items are discussed in more detail below.
Revenue. We derive our revenue primarily from the following activities:
• Software license revenue, which results from sales of our EFT Enterprise, EFT Standard, CuteFTP andWAFS products and solutions, which we typically recognize at the time of product shipment.
• Maintenance and support revenue under contracts to provide ongoing product support and softwareupdates to our customers who have purchased license software, which we typically recognize ratablyover the contractual period, which is typically one year, but can be up to three years.
63
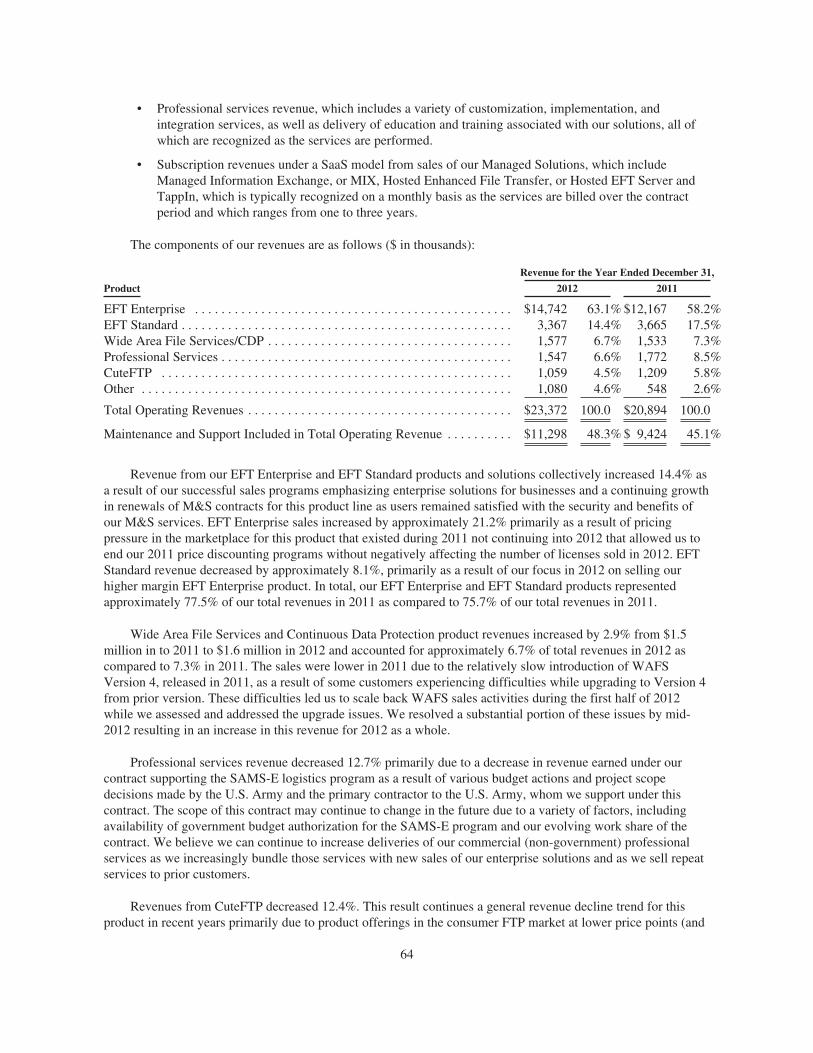
• Professional services revenue, which includes a variety of customization, implementation, andintegration services, as well as delivery of education and training associated with our solutions, all ofwhich are recognized as the services are performed.
• Subscription revenues under a SaaS model from sales of our Managed Solutions, which includeManaged Information Exchange, or MIX, Hosted Enhanced File Transfer, or Hosted EFT Server andTappIn, which is typically recognized on a monthly basis as the services are billed over the contractperiod and which ranges from one to three years.
The components of our revenues are as follows ($ in thousands):
Revenue for the Year Ended December 31,
Product 2012 2011
EFT Enterprise . . . . . . . . . . . . . . . . . . . . . . . . . . . . . . . . . . . . . . . . . . . . . . . . $14,742 63.1% $12,167 58.2%EFT Standard . . . . . . . . . . . . . . . . . . . . . . . . . . . . . . . . . . . . . . . . . . . . . . . . . . 3,367 14.4% 3,665 17.5%Wide Area File Services/CDP . . . . . . . . . . . . . . . . . . . . . . . . . . . . . . . . . . . . . 1,577 6.7% 1,533 7.3%Professional Services . . . . . . . . . . . . . . . . . . . . . . . . . . . . . . . . . . . . . . . . . . . . 1,547 6.6% 1,772 8.5%CuteFTP . . . . . . . . . . . . . . . . . . . . . . . . . . . . . . . . . . . . . . . . . . . . . . . . . . . . . 1,059 4.5% 1,209 5.8%Other . . . . . . . . . . . . . . . . . . . . . . . . . . . . . . . . . . . . . . . . . . . . . . . . . . . . . . . . 1,080 4.6% 548 2.6%
Total Operating Revenues . . . . . . . . . . . . . . . . . . . . . . . . . . . . . . . . . . . . . . . . $23,372 100.0 $20,894 100.0
Maintenance and Support Included in Total Operating Revenue . . . . . . . . . . $11,298 48.3% $ 9,424 45.1%
Revenue from our EFT Enterprise and EFT Standard products and solutions collectively increased 14.4% asa result of our successful sales programs emphasizing enterprise solutions for businesses and a continuing growthin renewals of M&S contracts for this product line as users remained satisfied with the security and benefits ofour M&S services. EFT Enterprise sales increased by approximately 21.2% primarily as a result of pricingpressure in the marketplace for this product that existed during 2011 not continuing into 2012 that allowed us toend our 2011 price discounting programs without negatively affecting the number of licenses sold in 2012. EFTStandard revenue decreased by approximately 8.1%, primarily as a result of our focus in 2012 on selling ourhigher margin EFT Enterprise product. In total, our EFT Enterprise and EFT Standard products representedapproximately 77.5% of our total revenues in 2011 as compared to 75.7% of our total revenues in 2011.
Wide Area File Services and Continuous Data Protection product revenues increased by 2.9% from $1.5million in to 2011 to $1.6 million in 2012 and accounted for approximately 6.7% of total revenues in 2012 ascompared to 7.3% in 2011. The sales were lower in 2011 due to the relatively slow introduction of WAFSVersion 4, released in 2011, as a result of some customers experiencing difficulties while upgrading to Version 4from prior version. These difficulties led us to scale back WAFS sales activities during the first half of 2012while we assessed and addressed the upgrade issues. We resolved a substantial portion of these issues by mid-2012 resulting in an increase in this revenue for 2012 as a whole.
Professional services revenue decreased 12.7% primarily due to a decrease in revenue earned under ourcontract supporting the SAMS-E logistics program as a result of various budget actions and project scopedecisions made by the U.S. Army and the primary contractor to the U.S. Army, whom we support under thiscontract. The scope of this contract may continue to change in the future due to a variety of factors, includingavailability of government budget authorization for the SAMS-E program and our evolving work share of thecontract. We believe we can continue to increase deliveries of our commercial (non-government) professionalservices as we increasingly bundle those services with new sales of our enterprise solutions and as we sell repeatservices to prior customers.
Revenues from CuteFTP decreased 12.4%. This result continues a general revenue decline trend for thisproduct in recent years primarily due to product offerings in the consumer FTP market at lower price points (and
64
sometimes even free) than our CuteFTP products and pressure from social media companies and services thatallow consumers to share images and video. With our release in November 2012 of CuteFTP Version 9 with itsimproved feature set, we believe we can reduce, if not eliminate, this revenue decline by appealing to the FTPclient program user with higher performance and security demands because CuteFTP is one of the only secureFTP client programs that support a wide range of security standards related to the FTP protocol
Other revenue increased by 97.1%. We earn this revenue primarily from our Mail Express, MIX, HostedEFT Server, CuteSendIt, CuteBackUp and TappIn product and solution sales. The increase was largely due to anincrease in MIX, Hosted EFT, Mail Express and TappIn revenue. This increase was due, in part, to 2012 beingsubstantially the first year in which we had MIX and Hosted EFT contracts in place for the full year as well as2012 being the first full year in which we earned TappIn revenue. We believe the MIX and Hosted EFT revenueincreases are particularly significant as they reflect the growing trend toward cloud-based rather than installedsolutions. In addition, these subscription services contribute to aggregate contract value, or ACV, and provide apredictable revenue stream in future periods.
Maintenance and support revenues increased 21.4%. This increase was due to our ongoing efforts toincrease M&S contract renewal rates. We also have had increasing success selling more of our higher-pricedPlatinum Support services. The combination of these results illustrates a continuing use of our software productsand services and a high level of satisfaction with our M&S services in the marketplace. As our enterpriseproducts become a larger portion of our total revenues, we believe M&S revenues will continue to increase.However, if sales of our on-premise enterprise products were to decrease, then new sales of M&S contracts coulddecrease as well given the typical bundling of M&S contracts with enterprise software solution sales. Theincrease in M&S activity is also evidenced by the increase in our deferred revenue balance from $7.6 million atDecember 31, 2011, to $9.8 million at December 31, 2012. Continued growth in this deferred revenue providesan increasingly predictable revenue stream for future periods.
M&S revenue as a percent of our total revenue was 48%, 45% and 42% in 2012, 2011 and 2010,respectively. Our M&S revenue is increasing as a percentage of our total revenue primarily due to the growinginstalled base of our software products in the marketplace. This growing installed base creates a compoundingeffect for M&S renewals due to the cumulative number of licensed software installations sold over multipleyears. As we continue to sell additional software licenses and potentially sustain a high rate of M&S contractrenewals, we expect this compounding effect to increase. We view this M&S revenue increase as a positiveindicator of our customers’ ongoing satisfaction with our products purchased in past years.
Cost of Revenues. Cost of revenues consists primarily of royalties, a portion of our bandwidth costs, hostedservice expenses for our Managed Solutions, and expenses directly associated with professional servicesdelivery. Cost of revenues decreased 24.8% primarily due to:
• A decrease of $450,000 in labor costs associated with professional services provided under oursubcontract supporting the U.S. Army SAMS-E logistics program, consistent with a reduction in ourlevel services provided under that contract as described in our revenue discussion above.
• A decrease of $137,000 in royalty expenses on certain product sales due to a favorable renegotiation ofthe terms of certain agreements.
Offset by:
• Increased hosted server expenses of $129,000 associated with the growth in our MIX and Hosted EFTServer solutions, particularly as a result of our expansion of these services outside the United States.
Selling, General and Administrative. These expenses increased 15.9% primarily due to:
• Direct TappIn expenses of $1.1 million in 2012 for which there were no similar expenses in the 2011period.
65
• Increased salaries for certain personnel of $396,000 in order to retain them in a competitiveenvironment for talent.
• Severance expense of $290,000 incurred in connection with the retirement of our Chief Executive Officer.
• Increased employee health plan expenses of $245,000 due to the rising costs of insurance and medicalcare.
• Increased legal fees of $209,000 related to litigation in which we are involved as described elsewherein this document and for additional SEC filings work primarily related to the TappIn acquisition.
• Increased sales commission expense of $166,000 due to increased sales.
• Increased costs of SEC filings of $50,000 due to those filings having additional XBRL taggingrequirements in the 2012 that were not required in 2011.
• A reduction in the needed allowance for doubtful accounts that was higher in the 2011 period than thereduction that occurred in the 2012 period due to collections experience improving at a reduced rate inthe 2012 period compared to the 2011 period which resulted in an increase of $130,000 in 2012.
All offset by:
• Lower stock based compensation expense of $117,000 due to a higher level of stock option forfeituresarising from normal personnel turnover.
• Lower advertising expense of $94,000 due to a higher emphasis on internet advertising through searchengine optimization in lieu of other forms of advertising.
• A reduction to the bonus accrual of $85,000 due to changes in the bonus structure.
• A reduction in expense of $1.3 million due to this portion of the TappIn earnout liability not beingearned.
Research and Development. Research and development expense increased 13.0% primarily due to:
• Costs of $414,000 incurred for the continuing evolution of our TappIn products currently on the marketfor which we did not have such expenses in the 2011 prior to our acquisition of TappIn.
• Increased third-party quality assurance testing of our products under development of $23,000 as wecontinue to enhance their features and functions.
All offset by:
• Decreased personnel costs of $39,000 resulting from reassignment of certain personnel from researchand development activities to selling, general and administrative activities and the related resultingadjustment to their compensation.
• Lower stock based compensation expense of $71,000 due to a higher level of stock option forfeituresarising from personnel turnover.
We capitalized $330,000 of software development costs in 2012. We did not capitalize any softwaredevelopment costs in 2011.
Affiliated Entity Asset Impairment. This expense relates the value of our investments in and notesreceivable from CoreTrace Corporation becoming unrealizable due to CoreTrace’s sale of substantially all itsassets, other than our appShield product, to an unrelated third party and substantially ceasing operations and theirdevelopment of our planned appShield product. There was no similar event in the 2011 period.
66

TappIn Earnout Liability Not Earned. This credit to expense in 2012 was due to TappIn revenue not beingat least $3.0 million in 2012, which was a milestone that had to be achieved for the former TappIn shareholdersto receive an earnout payment previously included in our liabilities in the amount of $1.34 million. Accordingly,we eliminated this liability as of December 31, 2012.
Depreciation and Amortization. Depreciation and amortization expense increased 54% primarily due to theamortization of intangible assets arising from the purchase of TappIn in December 2011.
Other Income (Expense), Net. Other income/expense increased primarily due to interest expense on thenotes payable to a bank arising from the TappIn acquisition. We incurred this expense during all of 2012 but foronly one month in 2011.
Income Taxes. Our effective income rates were approximately (13.7)% and 21% for 2012 and 2011,respectively. For 2012, the following items of significance affected our effective income tax rate when comparedto the statutory federal income tax rate of 34%:
• The TappIn earn out liability not earned of $1.3 million in 2012 for which there is no associatedincome tax benefit which would have been $443,000 at the statutory income tax rate.
• The reserve of $125,000 provided in our financial statements related to research and development taxcredits receivable currently under examination by the Internal Revenue Service.
• The valuation allowance of $1.1 million provided in our financial statements as a result of the affiliatedentity asset impairment related to CoreTrace Corporation.
For 2011, the following items of significance affected our effective income tax rate when compared to thestatutory federal income tax rate of 34%:
• A tax benefit of $358,000 recorded in our financial statements in 2011 related to research anddevelopment tax credits claimed on federal income tax returns for the years 2008, 2009, 2010 and2011.
• A tax expense of $185,000 in our financial statements related to costs incurred in connection with theacquisition of Tappin, Inc. which are capitalized and not currently deductible for federal income taxpurposes.
Comparison of Year Ended December 31, 2011 to Year Ended December 31, 2010
2011 2010 $ Change
($ in thousands)
Total revenues . . . . . . . . . . . . . . . . . . . . . . . . . . . . . . . . . . . . . . . . . . . . . . . . . . . . . $20,894 $18,565 $2,329Cost of revenues . . . . . . . . . . . . . . . . . . . . . . . . . . . . . . . . . . . . . . . . . . . . . . . . . . . . 1,723 601 1,122Selling, general and administrative . . . . . . . . . . . . . . . . . . . . . . . . . . . . . . . . . . . . . 14,466 12,815 1,651Research and development . . . . . . . . . . . . . . . . . . . . . . . . . . . . . . . . . . . . . . . . . . . . 3,124 3,016 108Depreciation and amortization . . . . . . . . . . . . . . . . . . . . . . . . . . . . . . . . . . . . . . . . . 790 852 (62)
Total operating expenses . . . . . . . . . . . . . . . . . . . . . . . . . . . . . . . . . . . . . . . . . . . . . 20,103 17,284 2,819
Income from operations . . . . . . . . . . . . . . . . . . . . . . . . . . . . . . . . . . . . . . . . . . . . . . 791 1,281 (490)Other income, net . . . . . . . . . . . . . . . . . . . . . . . . . . . . . . . . . . . . . . . . . . . . . . . . . . . 13 10 3Income tax expense . . . . . . . . . . . . . . . . . . . . . . . . . . . . . . . . . . . . . . . . . . . . . . . . . 169 410 (241)
Net Income . . . . . . . . . . . . . . . . . . . . . . . . . . . . . . . . . . . . . . . . . . . . . . . . . . . . . . . . $ 635 $ 881 $ (246)
67

Revenue. During 2011 and 2010, we earned revenue from the same sources as described above for 2012except that we did not earn revenue from TappIn in those years because we acquired that product line inDecember 2011.
• Software license revenue, which we typically recognize at the time of product shipment, resultsprimarily from sales of our EFT Enterprise, EFT Standard, CuteFTP and WAFS products andsolutions.
• We earn maintenance and support revenue under contracts to provide ongoing product support andsoftware updates to our customers who have purchased license software. We recognize this ratablyover the contractual period, which is typically one year, but can be up to three years.
• Professional services revenue includes a variety of customization, implementation, and integrationservices, as well as delivery of education and training associated with our solutions, all of which arerecognized as the services are performed.
• We earn subscription revenues under a software-as-a-services model from sales of our ManagedSolutions which include Mail Express, MIX and Hosted EFT. Subscription revenue is recognized on amonthly basis as the services are billed over the contract period, which ranges from one to three years.
Revenues increased from $18.6 million in 2010 to $20.9 million in 2011. The increase of approximately$2.3 million or 13% in revenues was largely due to an increase in maintenance and support sales, an increase inthe number of new EFT Enterprise licenses sold, and an increased contribution from professional services. Theincrease in maintenance and support sales was driven by an increase in sales of new multi-year agreements andan increase in Platinum Support sales.
The following table reflects revenue by product ($ in thousands) and the related maintenance and support:
Revenue for the Year Ended December 31,
Product 2011 2010
EFT Enterprise . . . . . . . . . . . . . . . . . . . . . . . . . . . . . . . . . . . . . . . . . . . . . . . . $12,167 58.2% $10,913 58.8%EFT Standard . . . . . . . . . . . . . . . . . . . . . . . . . . . . . . . . . . . . . . . . . . . . . . . . . . 3,665 17.6% 3,616 19.5%CuteFTP Professional . . . . . . . . . . . . . . . . . . . . . . . . . . . . . . . . . . . . . . . . . . . 983 4.7% 1,245 6.7%CuteFTP Home . . . . . . . . . . . . . . . . . . . . . . . . . . . . . . . . . . . . . . . . . . . . . . . . 226 1.1% 277 1.5%Wide Area File Services/CDP . . . . . . . . . . . . . . . . . . . . . . . . . . . . . . . . . . . . . 1,533 7.3% 1,869 10.1%Professional Services . . . . . . . . . . . . . . . . . . . . . . . . . . . . . . . . . . . . . . . . . . . . 1,772 8.5% 438 2.4%Other . . . . . . . . . . . . . . . . . . . . . . . . . . . . . . . . . . . . . . . . . . . . . . . . . . . . . . . . 548 2.6% 207 1.1%
Total Operating Revenues . . . . . . . . . . . . . . . . . . . . . . . . . . . . . . . . . . . . . . . . $20,894 100.0 $18,565 100.0
Maintenance and Support Included in Total Operating Revenues . . . . . . . . . $ 9,424 45.1% $ 7,762 41.8%
Total revenue from our EFT Enterprise and EFT Standard solutions increased by 9%, to $15.8 million in2011 from $14.5 million in 2010. EFT Enterprise revenues increased by 12% from $10.9 million in 2010 to$12.2 million in 2011, mainly due to an increase in maintenance and support contract renewals. Revenues fromnew license sales and new maintenance and support contracts remained relatively flat from 2010 to 2011 as aresult of pricing pressure on EFT Enterprise, a promotion during 2011 which discounted the price of EFTEnterprise for customers upgrading from EFT Standard and an increase in the number of customers purchasingcloud-based solutions rather than installed solutions. EFT Standard revenue increased by 2% from $3.6 million in2010 to $3.7 million in 2011. This increase was mainly due to an increase in the average price of softwarelicenses sold and growth in maintenance and support contracts. In total, our EFT Standard and EFT Enterpriseproducts represented approximately 75.7% of our total revenues in 2011 as compared to 78.3% in 2010.
68
Revenues from CuteFTP decreased by 20.6% from $1.5 million in 2010 to $1.2 million in 2011 andaccounted for approximately 5.8% of total revenues in 2011 and 8.2% in 2010. This decline continued thegeneral reduction in CuteFTP product revenues, both in absolute terms and as a percentage of revenues,experienced since 2006. The consumer FTP product market has substantial low-cost, and even free, solutions thathave put increasing pressure on CuteFTP product revenues. Additional pressure on this product line comes fromsocial media companies and services that allow consumers to share images and video. Our reliance on the currentCuteFTP products will continue to decline as we emphasize sales of our more complex enterprise products andpotentially enter adjacent markets. However, we released a new version of CuteFTP in 2012. This new versionmay slow, or even reverse, the prior-year decline in CuteFTP revenue.
Wide Area File Services and Continuous Data Protection product revenues decreased by 18% from $1.9million in to 2010 to $1.5 million in 2011 and accounted for approximately 7.3% of total revenues in 2011 ascompared to 10.1% in 2010. The decrease was due principally to a decrease in the average price of WAFSlicenses and a decrease in the number of WAFS maintenance and support renewals sold. The WAFS and CDPproducts are largely used by architecture, engineering and construction firms to transfer large documents betweenoffices. The decline in WAFS revenue in 2011 may be attributable in part to the economic outlook at that time inthe architecture, engineering, and construction sectors. In addition, we released WAFS 4 in the second half of2011. This new release included a new user interface, support for Unicode characters, and other significantenhancements from the prior Version 3 software. Some customers experienced difficulty while upgrading fromWAFS 3 versions to WAFS 4, which also led to delays in closing some sales opportunities while we identifiedand remediated the customer issues. We developed an update to WAFS 4 and released that software in mid-2012.We believe the updated software may allow us to return to prior historical levels of WAFS sales performance,depending on prevailing economic conditions in the primary market sectors served by WAFS.
Professional services increased by 305% from $438,000 in 2010 to $1.8 million in 2011and accounted for8.5% of revenues in 2011 as compared to 2.4% of revenue in 2010. The growth in professional services wasdriven largely by $1.1 million in revenue earned on the MAT contract during 2011. Our level of participation onthe MAT contract may change during U.S. Government’s FY2012 depending on a variety of factors, includingavailability of government budget authorization for the SAMS-E program and our evolving work share of thecontract. However, we believe we can continue to increase deliveries of our commercial (non-government)professional services as we increasingly bundle those services with new sales of our enterprise solutions and aswe sell repeat services to prior customers.
Products and services included in the “Other” revenue increased by 165% from $207,000 in 2010 to$548,000 in 2011. This category primarily consist of Mail Express, Managed Information Exchange (MIX) andHosted Enhanced File Transfer (Hosted EFT) sales. Other revenue accounted for 2.6% of revenue in 2011 ascompared to 1.1% in 2010. The increase in “Other” revenue was largely due to an increase in MIX, Hosted EFTand Mail Express revenue. We believe the MIX and Hosted EFT revenue increases are particularly significant asthey may reflect the growing trend toward cloud based rather than installed solutions. In addition, thesesubscription services contribute to aggregate contract value and provide a predictable revenue stream in futureperiods.
During 2011, we also continued to recognize increasing revenue from maintenance and support contracts.Maintenance and support revenues increased by 21.5%, to $9.4 million in 2011 from $7.8 million in 2010. Ourdeferred revenue balance increased from $6.7 million at December 31, 2010 to $7.6 million at December 31,2011 as a result of higher maintenance and support sales (including renewals) over a 12 month period, growingsales of our hosted and managed solutions, and increased sales of professional services engagements which wereinvoiced (and, in many cases, paid) but were not yet delivered. The increase also reflects increased sales of ourPlatinum Support services, which provide after-hours support and other benefits to customers contracting for thislevel of service instead of our standard support services. As our enterprise products become a larger portion ofour total revenues, we believe maintenance and support revenues will continue to increase. However, if sales ofour on-premise enterprise products decrease, then new sales of maintenance and support contracts will decrease
69
as well given the typical bundling of M&S contracts with enterprise software solution sales. Maintenance andsupport pricing is reflective of the license cost of the products and the additional support it takes to maintain andsupport the products and customers. With higher maintenance and support revenues, we will recognize additionaldeferred revenue as we earn the revenue over the life of the maintenance and support agreement.
Cost of Revenues. Cost of revenues consists primarily of royalties, a portion of our bandwidth costs, hostedservice expenses for our Managed Solutions, travel expenses associated with professional services delivery andcost of goods sold. Cost of revenues increased by approximately 187% primarily due to:
• An increase in royalties of $120,000 due to increased sales of a licensed technology.
• The addition of hosted server expenses of approximately $210,000 associated with the MIX and HostedEFT solutions which launched in July 2010 and February 2011, respectively.
• Other cost of goods sold of $851,000 primarily due to labor costs associated with the professionalservices performed for the MAT contract.
Selling, General and Administrative. Selling, general and administrative expenses increased 12% primarilydue to:
• An increase in salaries and wages and related payroll taxes of $673,000 due to an overall increase instaffing as compared to 2010.
• An increase in sales commission expense of $335,000 due to an overall increase in sales of 13%.
• An increase in legal fees of $156,000 primarily due to the TappIn acquisition.
• An increase in accounting fees of $87,000 due to audit and valuation fees related to the TappInacquisition.
• An increase in other professional fees of $452,000 of which $315,000 was related to investmentbanking fees incurred with the TappIn acquisition with the remainder of the increase related to feespaid a third-party to assist us in the computation of our research and development tax credit for federalincome tax purposes.
All offset by:
• A decrease in consulting fees of approximately $146,000 primarily due to the transition of oneconsultant to full-time employee status and an additional reduction in our use of outside consulting toassist with government sales.
• A reduction in bad debt expense of $183,000 due to a decrease in accounts receivable balances over 90days old.
Research and Development. Research and development expenses increased 4% primarily due to an increasein external research and development related to testing of our WAFS product.
Depreciation and Amortization. Depreciation and amortization expense decreased 7% primarily due tosoftware which became fully depreciated.
Other Income (Expense), Net. Other income/expense increased 30% primarily due to interest earned on theCoreTrace promissory note of $38,000 offset by interest expense of $25,000 on our notes payable to a bankobtained for the TappIn acquisition. Other income in 2010 was from interest on short-term investments andinterest on a Texas margins tax refund.
70
Income Taxes. Our effective income tax rate was 21% for both 2011 and 2010. For 2011, the followingitems of significance affected our effective income tax rate when compared to the statutory federal income taxrate of 34%:
• A tax benefit of $358,000 recorded in our financial statements in 2011 related to research anddevelopment tax credits claimed on federal income tax returns for the years 2008, 2009, 2010 and 2011.
• A tax expense of $185,000 in our financial statements related to costs incurred in connection with theacquisition of Tappin, Inc. which are capitalized and not currently deductible for federal income taxpurposes.
For 2010, the following items of significance affected our effective income tax rate when compared to thestatutory federal income tax rate of 34%:
• A tax benefit of $98,000 arising from a deduction on our federal income tax return for domesticproduction activities, or DPAD, that is not an expense on our financial statements.
• A $90,000 reserve for an uncertain tax position related to certain share-based compensation issued inthe form of incentive stock options that were characterized as non-qualified stock options on ourfederal income tax return.
• An income tax expense of $74,000 on our financial statements related to incentive stock optioncompensation expense that is not deducted as an expense our federal income tax return.
71
Item 8. Financial Statements and Supplementary Data
GlobalSCAPE, Inc.
Index to Consolidated Financial Statements
Years ending December 31, 2012, 2011 and 2010
Contents
Report of Independent Registered Public Accounting Firm . . . . . . . . . . . . . . . . . . . . . . . . . . . . . . . . . . . . . . . . 73
Consolidated Financial Statements
Consolidated Balance Sheets . . . . . . . . . . . . . . . . . . . . . . . . . . . . . . . . . . . . . . . . . . . . . . . . . . . . . . . . . . . 74
Consolidated Statements of Operations . . . . . . . . . . . . . . . . . . . . . . . . . . . . . . . . . . . . . . . . . . . . . . . . . . . 75
Consolidated Statements of Stockholders’ Equity . . . . . . . . . . . . . . . . . . . . . . . . . . . . . . . . . . . . . . . . . . . 76
Consolidated Statements of Cash Flows . . . . . . . . . . . . . . . . . . . . . . . . . . . . . . . . . . . . . . . . . . . . . . . . . . . 77
Notes to Consolidated Financial Statements . . . . . . . . . . . . . . . . . . . . . . . . . . . . . . . . . . . . . . . . . . . . . . . . . . . . 78
72
Report of Independent Registered Public Accounting Firm
Board of Directors and ShareholdersGlobalSCAPE, Inc.
We have audited the accompanying consolidated balance sheets of GlobalSCAPE, Inc. (a Delawarecorporation) and its wholly-owned subsidiary (the “Company”) as of December 31, 2012 and 2011, and therelated consolidated statements of operations, stockholders’ equity, and cash flows for each of the three years inthe period ended December 31, 2012. These financial statements are the responsibility of the Company’smanagement. Our responsibility is to express an opinion on these financial statements based on our audits.
We conducted our audits in accordance with the standards of the Public Company Accounting OversightBoard (United States). Those standards require that we plan and perform the audit to obtain reasonable assuranceabout whether the consolidated financial statements are free of material misstatement. The Company is notrequired to have, nor were we engaged to perform an audit of its internal control over financial reporting. Ouraudit included consideration of internal control over financial reporting as a basis for designing audit proceduresthat are appropriate in the circumstances, but not for the purpose of expressing an opinion on the effectiveness ofthe Company’s internal control over financial reporting. Accordingly, we express no such opinion. An audit alsoincludes examining, on a test basis, evidence supporting the amounts and disclosures in the financial statements,assessing the accounting principles used and significant estimates made by management, as well as evaluatingthe overall financial statement presentation. We believe that our audits provide a reasonable basis for ouropinion.
In our opinion, the consolidated financial statements referred to above present fairly, in all material respects,the financial position of GlobalSCAPE, Inc. and its wholly-owned subsidiary as of December 31, 2012 and 2011,and the results of their operations and their cash flows for each of the three years in the period endedDecember 31, 2012 in conformity with accounting principles generally accepted in the United States of America.
/s/ GRANT THORNTON LLP
Houston, TexasMarch 28, 2013
73
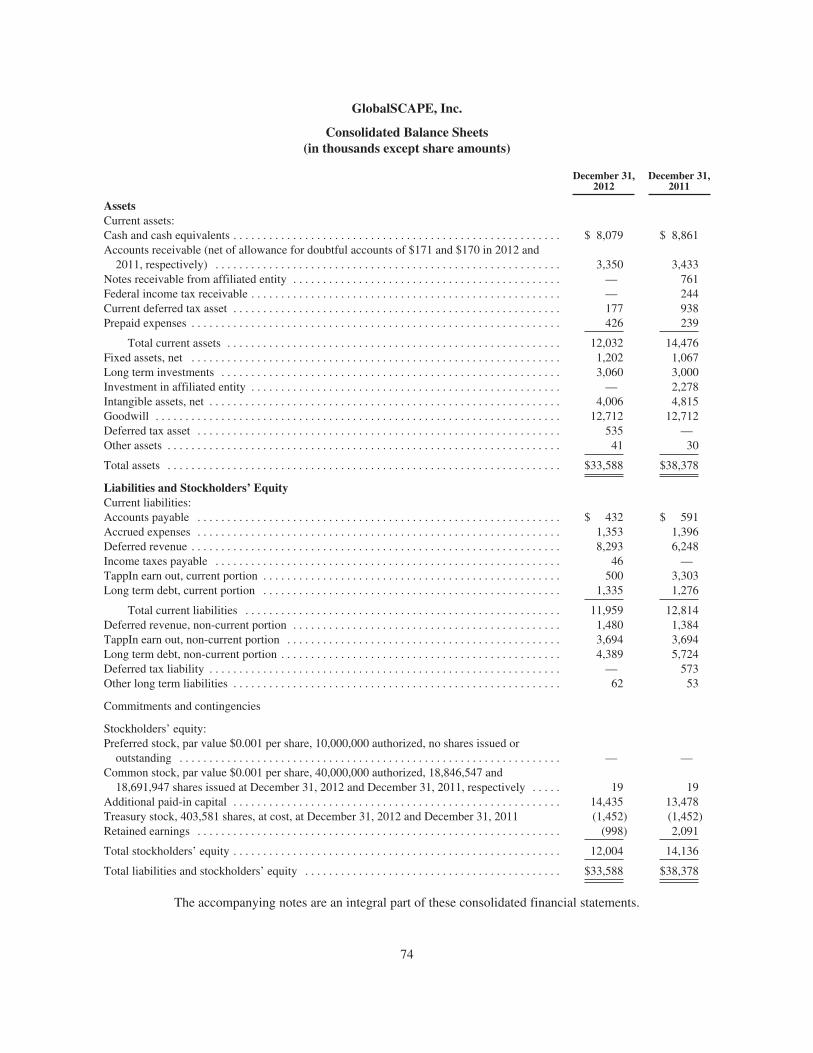
GlobalSCAPE, Inc.
Consolidated Balance Sheets(in thousands except share amounts)
December 31,2012
December 31,2011
AssetsCurrent assets:Cash and cash equivalents . . . . . . . . . . . . . . . . . . . . . . . . . . . . . . . . . . . . . . . . . . . . . . . . . . . . . . . $ 8,079 $ 8,861Accounts receivable (net of allowance for doubtful accounts of $171 and $170 in 2012 and
2011, respectively) . . . . . . . . . . . . . . . . . . . . . . . . . . . . . . . . . . . . . . . . . . . . . . . . . . . . . . . . . . 3,350 3,433Notes receivable from affiliated entity . . . . . . . . . . . . . . . . . . . . . . . . . . . . . . . . . . . . . . . . . . . . . — 761Federal income tax receivable . . . . . . . . . . . . . . . . . . . . . . . . . . . . . . . . . . . . . . . . . . . . . . . . . . . . — 244Current deferred tax asset . . . . . . . . . . . . . . . . . . . . . . . . . . . . . . . . . . . . . . . . . . . . . . . . . . . . . . . 177 938Prepaid expenses . . . . . . . . . . . . . . . . . . . . . . . . . . . . . . . . . . . . . . . . . . . . . . . . . . . . . . . . . . . . . . 426 239
Total current assets . . . . . . . . . . . . . . . . . . . . . . . . . . . . . . . . . . . . . . . . . . . . . . . . . . . . . . . . 12,032 14,476Fixed assets, net . . . . . . . . . . . . . . . . . . . . . . . . . . . . . . . . . . . . . . . . . . . . . . . . . . . . . . . . . . . . . . 1,202 1,067Long term investments . . . . . . . . . . . . . . . . . . . . . . . . . . . . . . . . . . . . . . . . . . . . . . . . . . . . . . . . . 3,060 3,000Investment in affiliated entity . . . . . . . . . . . . . . . . . . . . . . . . . . . . . . . . . . . . . . . . . . . . . . . . . . . . — 2,278Intangible assets, net . . . . . . . . . . . . . . . . . . . . . . . . . . . . . . . . . . . . . . . . . . . . . . . . . . . . . . . . . . . 4,006 4,815Goodwill . . . . . . . . . . . . . . . . . . . . . . . . . . . . . . . . . . . . . . . . . . . . . . . . . . . . . . . . . . . . . . . . . . . . 12,712 12,712Deferred tax asset . . . . . . . . . . . . . . . . . . . . . . . . . . . . . . . . . . . . . . . . . . . . . . . . . . . . . . . . . . . . . 535 —Other assets . . . . . . . . . . . . . . . . . . . . . . . . . . . . . . . . . . . . . . . . . . . . . . . . . . . . . . . . . . . . . . . . . . 41 30
Total assets . . . . . . . . . . . . . . . . . . . . . . . . . . . . . . . . . . . . . . . . . . . . . . . . . . . . . . . . . . . . . . . . . . $33,588 $38,378
Liabilities and Stockholders’ EquityCurrent liabilities:Accounts payable . . . . . . . . . . . . . . . . . . . . . . . . . . . . . . . . . . . . . . . . . . . . . . . . . . . . . . . . . . . . . $ 432 $ 591Accrued expenses . . . . . . . . . . . . . . . . . . . . . . . . . . . . . . . . . . . . . . . . . . . . . . . . . . . . . . . . . . . . . 1,353 1,396Deferred revenue . . . . . . . . . . . . . . . . . . . . . . . . . . . . . . . . . . . . . . . . . . . . . . . . . . . . . . . . . . . . . . 8,293 6,248Income taxes payable . . . . . . . . . . . . . . . . . . . . . . . . . . . . . . . . . . . . . . . . . . . . . . . . . . . . . . . . . . 46 —TappIn earn out, current portion . . . . . . . . . . . . . . . . . . . . . . . . . . . . . . . . . . . . . . . . . . . . . . . . . . 500 3,303Long term debt, current portion . . . . . . . . . . . . . . . . . . . . . . . . . . . . . . . . . . . . . . . . . . . . . . . . . . 1,335 1,276
Total current liabilities . . . . . . . . . . . . . . . . . . . . . . . . . . . . . . . . . . . . . . . . . . . . . . . . . . . . . 11,959 12,814Deferred revenue, non-current portion . . . . . . . . . . . . . . . . . . . . . . . . . . . . . . . . . . . . . . . . . . . . . 1,480 1,384TappIn earn out, non-current portion . . . . . . . . . . . . . . . . . . . . . . . . . . . . . . . . . . . . . . . . . . . . . . 3,694 3,694Long term debt, non-current portion . . . . . . . . . . . . . . . . . . . . . . . . . . . . . . . . . . . . . . . . . . . . . . . 4,389 5,724Deferred tax liability . . . . . . . . . . . . . . . . . . . . . . . . . . . . . . . . . . . . . . . . . . . . . . . . . . . . . . . . . . . — 573Other long term liabilities . . . . . . . . . . . . . . . . . . . . . . . . . . . . . . . . . . . . . . . . . . . . . . . . . . . . . . . 62 53
Commitments and contingencies
Stockholders’ equity:Preferred stock, par value $0.001 per share, 10,000,000 authorized, no shares issued or
outstanding . . . . . . . . . . . . . . . . . . . . . . . . . . . . . . . . . . . . . . . . . . . . . . . . . . . . . . . . . . . . . . . . — —Common stock, par value $0.001 per share, 40,000,000 authorized, 18,846,547 and
18,691,947 shares issued at December 31, 2012 and December 31, 2011, respectively . . . . . 19 19Additional paid-in capital . . . . . . . . . . . . . . . . . . . . . . . . . . . . . . . . . . . . . . . . . . . . . . . . . . . . . . . 14,435 13,478Treasury stock, 403,581 shares, at cost, at December 31, 2012 and December 31, 2011 (1,452) (1,452)Retained earnings . . . . . . . . . . . . . . . . . . . . . . . . . . . . . . . . . . . . . . . . . . . . . . . . . . . . . . . . . . . . . (998) 2,091
Total stockholders’ equity . . . . . . . . . . . . . . . . . . . . . . . . . . . . . . . . . . . . . . . . . . . . . . . . . . . . . . . 12,004 14,136
Total liabilities and stockholders’ equity . . . . . . . . . . . . . . . . . . . . . . . . . . . . . . . . . . . . . . . . . . . $33,588 $38,378
The accompanying notes are an integral part of these consolidated financial statements.
74
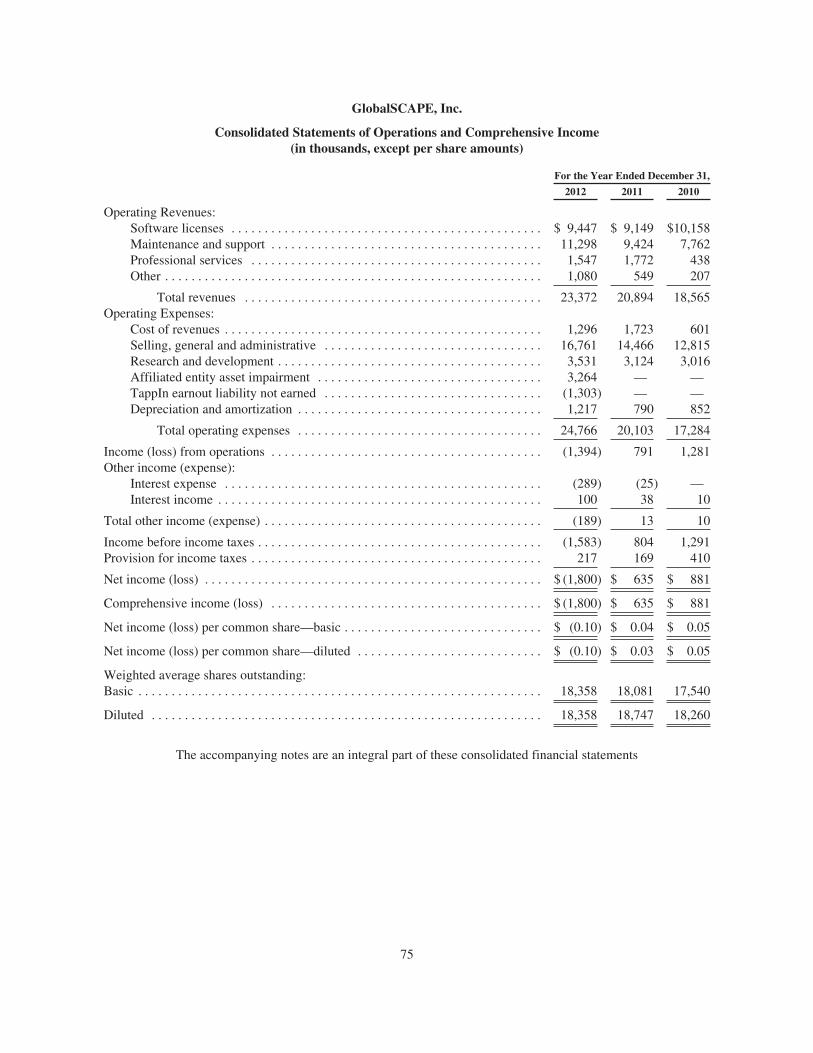
GlobalSCAPE, Inc.
Consolidated Statements of Operations and Comprehensive Income(in thousands, except per share amounts)
For the Year Ended December 31,
2012 2011 2010
Operating Revenues:Software licenses . . . . . . . . . . . . . . . . . . . . . . . . . . . . . . . . . . . . . . . . . . . . . . . $ 9,447 $ 9,149 $10,158Maintenance and support . . . . . . . . . . . . . . . . . . . . . . . . . . . . . . . . . . . . . . . . . 11,298 9,424 7,762Professional services . . . . . . . . . . . . . . . . . . . . . . . . . . . . . . . . . . . . . . . . . . . . 1,547 1,772 438Other . . . . . . . . . . . . . . . . . . . . . . . . . . . . . . . . . . . . . . . . . . . . . . . . . . . . . . . . . 1,080 549 207
Total revenues . . . . . . . . . . . . . . . . . . . . . . . . . . . . . . . . . . . . . . . . . . . . . 23,372 20,894 18,565Operating Expenses:
Cost of revenues . . . . . . . . . . . . . . . . . . . . . . . . . . . . . . . . . . . . . . . . . . . . . . . . 1,296 1,723 601Selling, general and administrative . . . . . . . . . . . . . . . . . . . . . . . . . . . . . . . . . 16,761 14,466 12,815Research and development . . . . . . . . . . . . . . . . . . . . . . . . . . . . . . . . . . . . . . . . 3,531 3,124 3,016Affiliated entity asset impairment . . . . . . . . . . . . . . . . . . . . . . . . . . . . . . . . . . 3,264 — —TappIn earnout liability not earned . . . . . . . . . . . . . . . . . . . . . . . . . . . . . . . . . (1,303) — —Depreciation and amortization . . . . . . . . . . . . . . . . . . . . . . . . . . . . . . . . . . . . . 1,217 790 852
Total operating expenses . . . . . . . . . . . . . . . . . . . . . . . . . . . . . . . . . . . . . 24,766 20,103 17,284
Income (loss) from operations . . . . . . . . . . . . . . . . . . . . . . . . . . . . . . . . . . . . . . . . . (1,394) 791 1,281Other income (expense):
Interest expense . . . . . . . . . . . . . . . . . . . . . . . . . . . . . . . . . . . . . . . . . . . . . . . . (289) (25) —Interest income . . . . . . . . . . . . . . . . . . . . . . . . . . . . . . . . . . . . . . . . . . . . . . . . . 100 38 10
Total other income (expense) . . . . . . . . . . . . . . . . . . . . . . . . . . . . . . . . . . . . . . . . . . (189) 13 10
Income before income taxes . . . . . . . . . . . . . . . . . . . . . . . . . . . . . . . . . . . . . . . . . . . (1,583) 804 1,291Provision for income taxes . . . . . . . . . . . . . . . . . . . . . . . . . . . . . . . . . . . . . . . . . . . . 217 169 410
Net income (loss) . . . . . . . . . . . . . . . . . . . . . . . . . . . . . . . . . . . . . . . . . . . . . . . . . . . $ (1,800) $ 635 $ 881
Comprehensive income (loss) . . . . . . . . . . . . . . . . . . . . . . . . . . . . . . . . . . . . . . . . . $ (1,800) $ 635 $ 881
Net income (loss) per common share—basic . . . . . . . . . . . . . . . . . . . . . . . . . . . . . . $ (0.10) $ 0.04 $ 0.05
Net income (loss) per common share—diluted . . . . . . . . . . . . . . . . . . . . . . . . . . . . $ (0.10) $ 0.03 $ 0.05
Weighted average shares outstanding:Basic . . . . . . . . . . . . . . . . . . . . . . . . . . . . . . . . . . . . . . . . . . . . . . . . . . . . . . . . . . . . . 18,358 18,081 17,540
Diluted . . . . . . . . . . . . . . . . . . . . . . . . . . . . . . . . . . . . . . . . . . . . . . . . . . . . . . . . . . . 18,358 18,747 18,260
The accompanying notes are an integral part of these consolidated financial statements
75
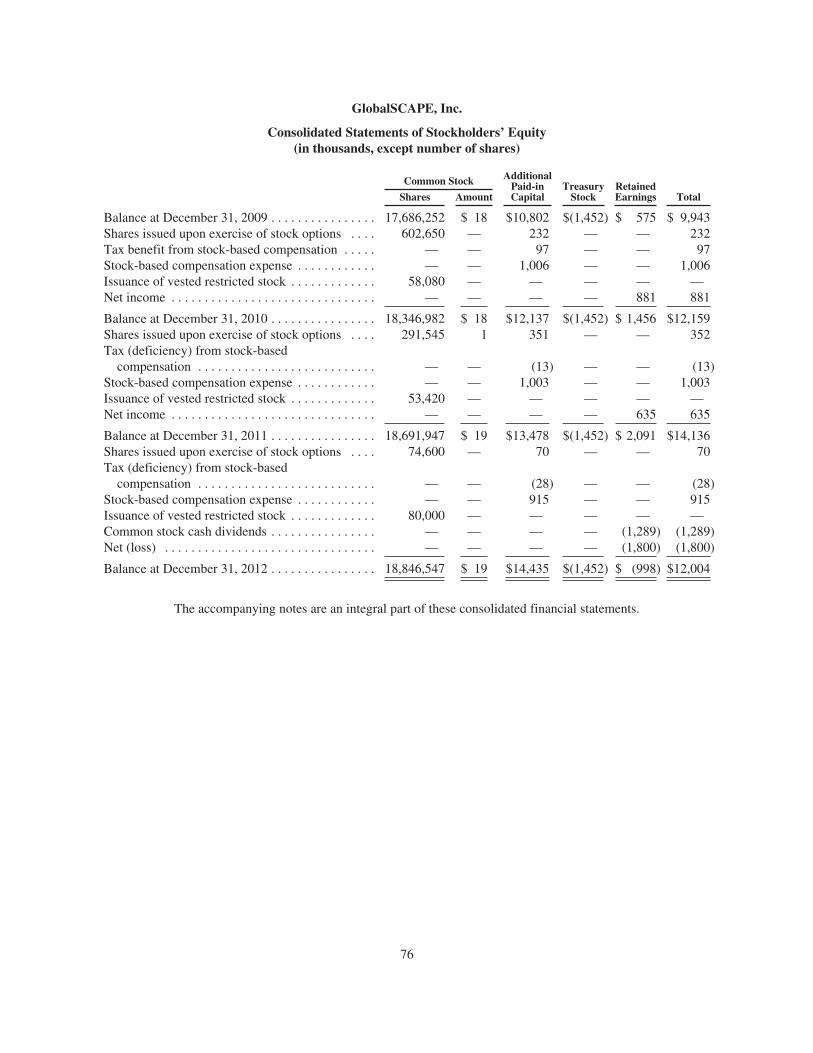
GlobalSCAPE, Inc.
Consolidated Statements of Stockholders’ Equity(in thousands, except number of shares)
Common Stock AdditionalPaid-inCapital
TreasuryStock
RetainedEarnings TotalShares Amount
Balance at December 31, 2009 . . . . . . . . . . . . . . . . 17,686,252 $ 18 $10,802 $(1,452) $ 575 $ 9,943Shares issued upon exercise of stock options . . . . 602,650 — 232 — — 232Tax benefit from stock-based compensation . . . . . — — 97 — — 97Stock-based compensation expense . . . . . . . . . . . . — — 1,006 — — 1,006Issuance of vested restricted stock . . . . . . . . . . . . . 58,080 — — — — —Net income . . . . . . . . . . . . . . . . . . . . . . . . . . . . . . . — — — — 881 881
Balance at December 31, 2010 . . . . . . . . . . . . . . . . 18,346,982 $ 18 $12,137 $(1,452) $ 1,456 $12,159Shares issued upon exercise of stock options . . . . 291,545 1 351 — — 352Tax (deficiency) from stock-based
compensation . . . . . . . . . . . . . . . . . . . . . . . . . . . — — (13) — — (13)Stock-based compensation expense . . . . . . . . . . . . — — 1,003 — — 1,003Issuance of vested restricted stock . . . . . . . . . . . . . 53,420 — — — — —Net income . . . . . . . . . . . . . . . . . . . . . . . . . . . . . . . — — — — 635 635
Balance at December 31, 2011 . . . . . . . . . . . . . . . . 18,691,947 $ 19 $13,478 $(1,452) $ 2,091 $14,136Shares issued upon exercise of stock options . . . . 74,600 — 70 — — 70Tax (deficiency) from stock-based
compensation . . . . . . . . . . . . . . . . . . . . . . . . . . . — — (28) — — (28)Stock-based compensation expense . . . . . . . . . . . . — — 915 — — 915Issuance of vested restricted stock . . . . . . . . . . . . . 80,000 — — — — —Common stock cash dividends . . . . . . . . . . . . . . . . — — — — (1,289) (1,289)Net (loss) . . . . . . . . . . . . . . . . . . . . . . . . . . . . . . . . — — — — (1,800) (1,800)
Balance at December 31, 2012 . . . . . . . . . . . . . . . . 18,846,547 $ 19 $14,435 $(1,452) $ (998) $12,004
The accompanying notes are an integral part of these consolidated financial statements.
76

GlobalSCAPE, Inc.
Consolidated Statements of Cash Flows(in thousands)
For the Year EndedDecember 31,
2012 2011 2010
Operating Activities:Net (loss) income . . . . . . . . . . . . . . . . . . . . . . . . . . . . . . . . . . . . . . . . . . . . . . . . . . . . . . . . . . . . $(1,800) $ 635 $ 881
Adjustments to reconcile net (loss) income to net cash provided by operating activities:Bad debt expense (recoveries) . . . . . . . . . . . . . . . . . . . . . . . . . . . . . . . . . . . . . . . . . . 68 (62) 121Depreciation and amortization . . . . . . . . . . . . . . . . . . . . . . . . . . . . . . . . . . . . . . . . . . 1,217 790 852Stock-based compensation . . . . . . . . . . . . . . . . . . . . . . . . . . . . . . . . . . . . . . . . . . . . . 915 1,003 1,006Deferred taxes . . . . . . . . . . . . . . . . . . . . . . . . . . . . . . . . . . . . . . . . . . . . . . . . . . . . . . . (377) (352) (698)Excess tax deficiency (benefit) from exercise of share based compensation . . . . . . . 28 13 (97)Affiliated entity asset impairment . . . . . . . . . . . . . . . . . . . . . . . . . . . . . . . . . . . . . . . 3,264 — —TappIn earnout liability not earned . . . . . . . . . . . . . . . . . . . . . . . . . . . . . . . . . . . . . . (1,343) — —Other . . . . . . . . . . . . . . . . . . . . . . . . . . . . . . . . . . . . . . . . . . . . . . . . . . . . . . . . . . . . . . 40
Changes in operating assets and liabilities:Accounts receivable . . . . . . . . . . . . . . . . . . . . . . . . . . . . . . . . . . . . . . . . . . . . . . . . . . (60) (78) (1,083)CoreTrace receivable . . . . . . . . . . . . . . . . . . . . . . . . . . . . . . . . . . . . . . . . . . . . . . . . . (150) (463) (298)Prepaid expenses . . . . . . . . . . . . . . . . . . . . . . . . . . . . . . . . . . . . . . . . . . . . . . . . . . . . . (187) 108 (187)Federal income taxes . . . . . . . . . . . . . . . . . . . . . . . . . . . . . . . . . . . . . . . . . . . . . . . . . 292 (52) 40Other assets . . . . . . . . . . . . . . . . . . . . . . . . . . . . . . . . . . . . . . . . . . . . . . . . . . . . . . . . . (11) — 23Accounts payable . . . . . . . . . . . . . . . . . . . . . . . . . . . . . . . . . . . . . . . . . . . . . . . . . . . . (159) 341 (66)Accrued expenses . . . . . . . . . . . . . . . . . . . . . . . . . . . . . . . . . . . . . . . . . . . . . . . . . . . . (43) 1 628Deferred revenues . . . . . . . . . . . . . . . . . . . . . . . . . . . . . . . . . . . . . . . . . . . . . . . . . . . . 2,141 690 1,483Other long-term liabilities . . . . . . . . . . . . . . . . . . . . . . . . . . . . . . . . . . . . . . . . . . . . . 9 252 106
Net cash provided by operating activities . . . . . . . . . . . . . . . . . . . . . . . . . . . . . . . . . . 3,844 2,826 2,711
Investing Activities:Proceeds from sale of property and equipment . . . . . . . . . . . . . . . . . . . . . . . . . . . . . . . . . — — —Software development costs . . . . . . . . . . . . . . . . . . . . . . . . . . . . . . . . . . . . . . . . . . . . . . . . (330) — —Purchase of property and equipment . . . . . . . . . . . . . . . . . . . . . . . . . . . . . . . . . . . . . . . . . (213) (201) (184)Purchase of TappIn, Inc. . . . . . . . . . . . . . . . . . . . . . . . . . . . . . . . . . . . . . . . . . . . . . . . . . . . (1,500) (9,190) —Purchase of short-term investments . . . . . . . . . . . . . . . . . . . . . . . . . . . . . . . . . . . . . . . . . . — — (350)Purchase of long-term investments . . . . . . . . . . . . . . . . . . . . . . . . . . . . . . . . . . . . . . . . . . . (60) (3,000) —Redemption of short-term investments . . . . . . . . . . . . . . . . . . . . . . . . . . . . . . . . . . . . . . . . — — 1,555
Net cash provided by (used in) investing activities . . . . . . . . . . . . . . . . . . . . . . . . . . . . . . . . . . (2,103) (12,391) 1,021
Financing Activities:Proceeds from exercise of stock options . . . . . . . . . . . . . . . . . . . . . . . . . . . . . . . . . . . . . . 70 352 232Tax deficiency (benefit) from stock-based compensation . . . . . . . . . . . . . . . . . . . . . . . . . (28) (13) 97Notes payable principle payments . . . . . . . . . . . . . . . . . . . . . . . . . . . . . . . . . . . . . . . . . . . (1,276) — —Proceeds from note payable . . . . . . . . . . . . . . . . . . . . . . . . . . . . . . . . . . . . . . . . . . . . . . . . — 7,000 —Dividends paid out . . . . . . . . . . . . . . . . . . . . . . . . . . . . . . . . . . . . . . . . . . . . . . . . . . . . . . . (1,289) — —
Net cash provided by (used in) financing activities . . . . . . . . . . . . . . . . . . . . . . . . . . . . . . . . . . (2,523) 7,339 329
Net (decrease) increase in cash . . . . . . . . . . . . . . . . . . . . . . . . . . . . . . . . . . . . . . . . . . . . . . . . . . (782) (2,226) 4,061Cash at beginning of period . . . . . . . . . . . . . . . . . . . . . . . . . . . . . . . . . . . . . . . . . . . . . . . . . . . . 8,861 11,087 7,026
Cash at end of period . . . . . . . . . . . . . . . . . . . . . . . . . . . . . . . . . . . . . . . . . . . . . . . . . . . . . . . . . $ 8,079 $ 8,861 $11,087
Supplemental disclosure of cash flow information:Cash paid during the period for:Interest . . . . . . . . . . . . . . . . . . . . . . . . . . . . . . . . . . . . . . . . . . . . . . . . . . . . . . . . . . . . . . . . . . . . $ 294 $ — $ —
Income taxes . . . . . . . . . . . . . . . . . . . . . . . . . . . . . . . . . . . . . . . . . . . . . . . . . . . . . . . . . . . . . . . . $ 271 $ 1,225 $ 1,128
Noncash—TappIn earn out . . . . . . . . . . . . . . . . . . . . . . . . . . . . . . . . . . . . . . . . . . . . . . . . . . . . . $ — $ 6,997 $ —
The accompanying notes are an integral part of these consolidated financial statements.
77

GlobalSCAPE, Inc.
Notes to Consolidated Financial StatementsDecember 31, 2012 and 2011
1. Nature of Business and Corporate Structure
We operate primarily in the Managed File Transfer industry by providing secure information exchangecapabilities for enterprises and consumers through the development and sale of software, delivery of managedand hosted solutions, and provisioning of associated services. Our product and solutions portfolio facilitatestransmission of critical information such as financial data, medical records, customer files, vendor files,personnel files and other similar information between diverse and geographically separated networkinfrastructures while supporting a range of information protection approaches to meet privacy and other securityrequirements. Our products provide the ability to monitor these activities, as well as access the underlying data,securely and flexibly, through a wide range of network-enabled, mobile devices, including tablets andsmartphones.
Throughout these notes unless otherwise noted, our references to 2012, 2011 and 2010 refer to the yearsended December 31, 2012, 2011 and 2010, respectively.
2. Significant Accounting Policies
Principles of Consolidation
The accompanying consolidated financial statements of GlobalSCAPE, Inc. and its wholly-ownedsubsidiary (collectively referred to as the “Company” or “we”) are prepared in conformity with generallyaccepted accounting principles in the United States (“GAAP”). All intercompany accounts and transactions havebeen eliminated.
Revenue Recognition
We develop, market and sell software products. We recognize revenue from a sale transaction when thefollowing conditions are met:
• Persuasive evidence of an arrangement exists.
• Delivery has occurred or services have been rendered.
• The amount is fixed or determinable.
• Collection is reasonably assured.
For a sale transaction not meeting any one of these four criteria, we defer recognition of revenue related tothat transaction until all the criteria are met.
We earn software license revenue from software products sold under perpetual, software license agreements.At the time our customers purchase these products, they typically also purchase a product maintenance andsupport agreement. These transactions are multiple element software sales for which we assess the presence ofvendor specific objective evidence (“VSOE”) of the fair value of the undelivered elements to determine theportion of these sales to recognize as revenue upon delivery of the software product and the portion of these salesto record as deferred revenue at the time the product is delivered. We amortize the deferred revenue componentto revenue in future periods as we deliver the related future services to the customer. For transactions for whichwe cannot establish VSOE of fair value of the undelivered elements, we initially record the entire transaction asdeferred revenue and amortize that amount to revenue in future periods as we deliver the related future servicesto the customer. Our deferred revenue consists primarily of revenue to be earned in the future as we deliverservices under maintenance and support agreements.
78

For our products delivered under a software-as-a-service transaction on a monthly or other periodicsubscription basis, we recognize subscription revenue, including initial setup fees, on a monthly basis over thecontractual term of the customer contract as we deliver our products and services. These amounts are in otherrevenue. Amounts invoiced or paid prior to this revenue recognition are presented as deferred revenue untilearned.
We provide professional services to our customers consisting of primarily of software installation support,operations support and training. We recognize revenue from these services as they are completed and accepted byour customers.
We collect sales tax on many of our sales. We do not include sales tax collected in our revenue. We record itas a liability payable to taxing authorities.
Concentrations of Credit Risk and Significant Customers
Our cash, cash equivalents and long term investments are on deposit in banks and are collectively insured bythe Federal Deposit Insurance Corporation for $500,000. Our balances in excess of that amount are not insured.With the exception of our long-term investment in certificate of deposit pledged as collateral for our notespayable described in Note 7, we may withdraw our cash deposits upon demand. We maintain our cash withmultiple financial institutions of reputable credit to minimize our risk of loss.
We generally provide credit to our customers under typical invoice payment terms (for example, net 30) thatgives rise to trade accounts receivable from those customers. We do not require collateral from our customers.We perform ongoing evaluations of the credit risk related to offering these payment terms. We provide anallowance for uncollectible accounts based on our historical collections experience and the profile of ouraccounts receivable.
In 2012, 2011 and 2010, no single customer accounted for more than 10% of revenues. As of December 31,2012 and 2011, we had no customer from whom accounts receivable from them individually comprised 10% ormore of our total accounts receivables.
Other Concentrations
Sales in Foreign Markets. In 2012, 2011 and 2010, approximately 26%, 31% and 31%, respectively, of ourrevenues came from sales to customers in foreign countries. We received substantially all of our revenues fromforeign countries in U.S. dollars resulting in limited exchange rate risks. Our foreign sales are concentratedmostly in Canada, Australia and Western Europe.
Labor. We use software developers outside the United States to perform a portion of the coding for thedevelopment and maintenance of our software products. If we were unable to continue using these developersbecause of political or economic instability, we may have difficulty finding comparably skilled developers ormay have to pay considerably more for the same work, which could have a material adverse impact on ourfinancial position and results of operations.
Cash and cash equivalents
Cash and cash equivalents includes all cash and highly liquid investments with original maturities of threemonths or less. Approximately $500,000 of our cash balance as of December 31, 2012, is insured by the FederalDeposit Insurance Corporation.
79

Property and Equipment
Property and equipment is comprised of furniture and fixtures, software, computer equipment and leaseholdimprovements which are recorded at cost and depreciated using the straight-line method over their estimateduseful lives. Expenditures for maintenance and repairs are charged to operations as incurred. Furniture, fixturesand equipment have a useful life of 5 to 7 years, computer equipment and software have a life of 3 years andleasehold improvements are depreciated over the shorter of the term of the lease under which the improvementswere made or the estimated useful life of the asset.
Goodwill
Goodwill is not amortized. On at least an annual basis, we test goodwill for impairment at the reporting unitlevel. As a result of organization and operating refinements during 2012, we operated as a single reporting unitduring that period.
When testing goodwill, we first assess qualitative factors to determine whether it is more likely than not(that is, a likelihood of more than 50 percent) that the fair value of our reporting unit is less than its carryingamount, including goodwill. In performing this qualitative assessment, we assess events and circumstancesrelevant to the Company including, but not limited to:
• Macroeconomic conditions.
• Industry and market considerations.
• Cost factors and trends for labor and other expenses of operating our business.
• Our overall financial performance and outlook for the future.
• Trends in the quoted market value and trading of our common stock.
In considering these and other factors, we consider the extent to which any adverse events andcircumstances identified could affect the comparison of our reporting unit’s fair value with its carrying amount.We place more weight on events and circumstances that most affect our reporting unit’s fair value or the carryingamount of our net assets. We consider positive and mitigating events and circumstances that may affect ourdetermination of whether it is more likely than not that the fair value of our reporting unit is less than its carryingamount. We evaluate, on the basis of the weight of the evidence, the significance of all identified events andcircumstances in the context of determining whether it is more likely than not that the fair value of our reportingunit is less than its carrying amount.
If, after assessing the totality of these qualitative events and circumstances, we determine it is not morelikely than not that the fair value of our reporting unit is less than its carrying amount, we conclude there is noimpairment of goodwill and perform no further testing in accordance with GAAP. If we conclude otherwise, weproceed with performing the first step, and if necessary, the second step, of the two-step goodwill impairment testprescribed by GAAP.
As of December 31, 2012 and December 31, 2011, after assessing the totality of the relevant qualitativeevents and circumstances, we determined it not more likely than not that the fair value of our reporting unit wasless than its carrying amount. Accordingly, we concluded there was no impairment of goodwill as of either ofthose dates and, in accordance with GAAP, performed no further testing.
Intangible Assets Being Amortized
We have intangible assets, other than goodwill, consisting of a patent, customer relationships and developedtechnology that we acquired through the purchase of other companies. We determined the value of thoseintangible assets at the time of acquisition through discounted cash flow and other similar valuation methods. Weamortize these intangible assets on straight-line basis over their estimated useful lives that range from seven to 18years.
80
We evaluate intangible assets being amortized for impairment at least annually and more frequently if thereare events or changes in circumstances indicating that the carrying amount of these assets may exceed their fairmarket value. In performing this evaluation, we consider general and company-specific qualitative factors thatare part of the environment in which we use those assets. We also perform quantitative analyses using discountedcash flow and other similar valuation methods. If this work indicates the carrying value of an intangible assetexceeds its fair market value, we adjust these assets to that fair market value. This work we performed as ofDecember 31, 2012 and 2011, resulted in no such adjustment to our intangible assets being necessary.
Contingent Consideration
Our TappIn acquisition included future contingent milestone payments based on achieving certain levels ofsales in the future and the introduction of new products (i.e. the TappIn earn out). We estimate the fair value ofthe TappIn earn out contingent consideration liability based on our assessment of the probabilities of achievingthe prescribed milestones. These estimates involve significant judgment. Changes in the fair value of the TappInearn out contingent consideration liability may result from changes in discount periods, changes in the timing andamount of sales and/or other specific milestone estimates and changes in probability assumptions with respect tothe likelihood of achieving the various earn-out criteria. At each reporting date, we assess the fair value of thiscontingent consideration liability. Changes in the fair value of these liabilities related are reflected in our netincome and could materially affect our operating results.
Royalty Expense
Certain of our products contain software components that we license from others. We pay royalties underthose licenses which we record as a cost of revenues when our product containing the applicable component issold. Our royalties expense was $329,000, $466,000 and $346,000, in royalty expense in 2012, 2011 and 2010,respectively.
Advertising Expense
We expense advertising costs as incurred as a component of our selling, general and administrativeexpenses. Advertising expense was $493,000, $582,000 and $624,000 in 2012, 2011 and 2010, respectively.
Income Taxes
We account for income taxes using the asset and liability method. We record deferred tax assets andliabilities based on the difference between the tax bases of assets and liabilities and their carrying amount forfinancial reporting purposes, as measured by the enacted tax rates and laws that will be in effect when thedifferences are expected to reverse. Deferred tax assets and liabilities are carried on the balance sheet with thepresumption that they will be realizable in future periods in which we generate taxable income.
We assess the likelihood that deferred tax assets will be realized from future taxable income. Based on thisassessment, we provide any necessary valuation allowance on our balance sheet with a corresponding increase inthe tax provision on our statement of operations. Any valuation allowances we establish are determined basedupon a number of assumptions, judgments, and estimates, including forecasted earnings, future taxable income,and the relative proportions of revenue and income before taxes in the various domestic jurisdictions in which weoperate.
We account for uncertainty in income taxes using a two-step process to determine the amount of tax benefitto be recognized. First, we evaluate the tax position to determine the likelihood that it will be sustained uponexternal examination. If the tax position is deemed “more-likely-than-not” to be sustained, we assess the taxposition to determine the amount of benefit to recognize in the financial statements. The amount of the benefitwe recognize is the largest amount that we believe has a greater than 50% likelihood of being realized uponultimate settlement. Unrecognized tax benefits represent tax positions for which reserves have been established.
81

Research and Development and Capitalized Software Development Costs
We expense research and development costs as incurred. When we complete research and development for asoftware product and have a completed a detail program design or a working model of that software product, wecapitalize production costs incurred for that software product from that point forward until it is ready for generalrelease to the public. Thereafter, we amortize capitalized software production costs to expense using the straight-line method over the estimated useful life of that product, which is generally three years. We capitalized$330,000 of software development costs in 2012 and none in 2011 or 2010.
Stock-Based Compensation
We measure the cost of share-based payment transactions at the grant date based on the calculated fair valueof the award. We recognize this cost as an expense ratably over the recipient’s requisite service period duringwhich that award vests or becomes unrestricted.
For stock option awards, we estimate their fair value at the grant date using the Black-Scholes option-pricing model considering the following factors:
• We estimate expected volatility based on historical volatility of our common stock.
• We use primarily the simplified method to derive an expected term which represents an estimate of thetime options are expected to remain outstanding. We use this method because our options are plain-vanilla options, and we believe our historical option exercise experience is not adequately indicative ofour future expectations.
• We base the risk-free rate for periods within the contractual life of the option on the U.S. treasury yieldcurve in effect at the time of grant.
The assumptions used to determine compensation cost for our stock options are as follows:
Year EndedDecember 31,
2012 2011 2010
Expected volatility . . . . . . . . . . . . . . . . . . . . . . . . . . . . . . . . . . . . . . . . . . . . . . . . 63% 77% 83%Expected annual dividend yield . . . . . . . . . . . . . . . . . . . . . . . . . . . . . . . . . . . . . . 0 0 0Risk free rate of return . . . . . . . . . . . . . . . . . . . . . . . . . . . . . . . . . . . . . . . . . . . . . 0.98% 2.46% 2.60%Expected option term (years) . . . . . . . . . . . . . . . . . . . . . . . . . . . . . . . . . . . . . . . . 6.00 6.00 5.00
For restricted stock awards, we use the quoted price of our common stock on the grant date as the fair valueof the award.
See Note 7, Stock Options and Stock Based Compensation, for additional disclosures regarding our stockcompensation programs.
82
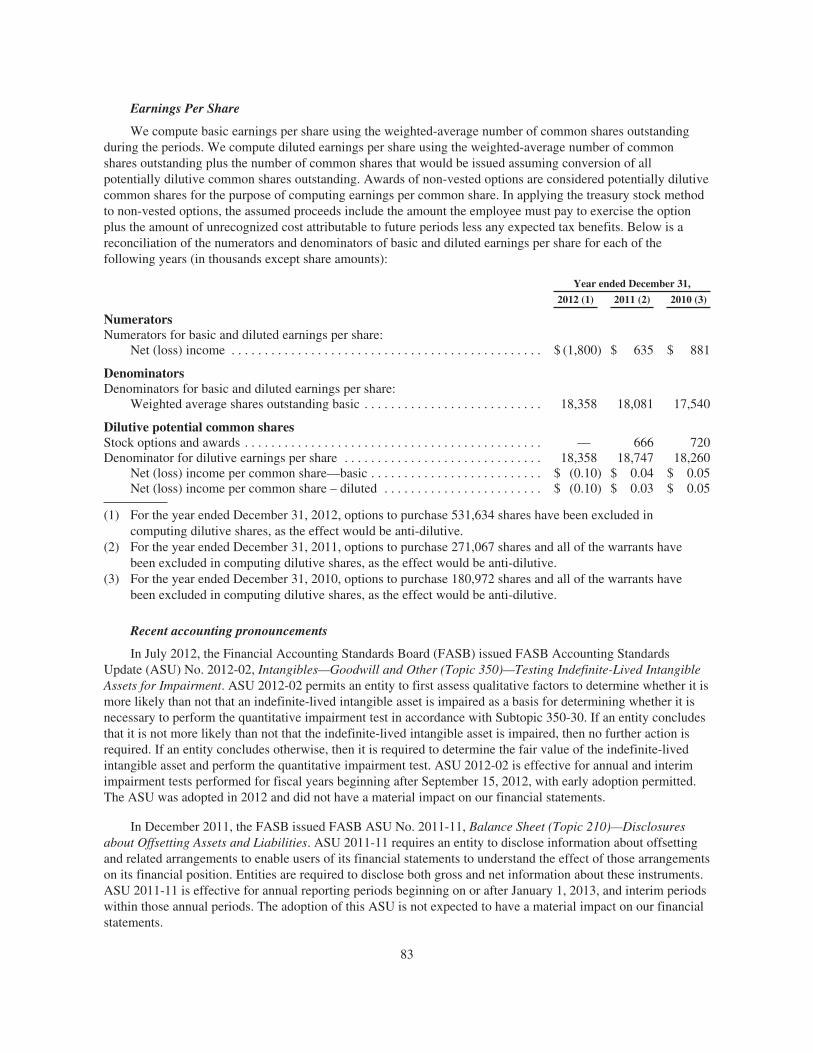
Earnings Per Share
We compute basic earnings per share using the weighted-average number of common shares outstandingduring the periods. We compute diluted earnings per share using the weighted-average number of commonshares outstanding plus the number of common shares that would be issued assuming conversion of allpotentially dilutive common shares outstanding. Awards of non-vested options are considered potentially dilutivecommon shares for the purpose of computing earnings per common share. In applying the treasury stock methodto non-vested options, the assumed proceeds include the amount the employee must pay to exercise the optionplus the amount of unrecognized cost attributable to future periods less any expected tax benefits. Below is areconciliation of the numerators and denominators of basic and diluted earnings per share for each of thefollowing years (in thousands except share amounts):
Year ended December 31,
2012 (1) 2011 (2) 2010 (3)
NumeratorsNumerators for basic and diluted earnings per share:
Net (loss) income . . . . . . . . . . . . . . . . . . . . . . . . . . . . . . . . . . . . . . . . . . . . . . . $ (1,800) $ 635 $ 881
DenominatorsDenominators for basic and diluted earnings per share:
Weighted average shares outstanding basic . . . . . . . . . . . . . . . . . . . . . . . . . . . 18,358 18,081 17,540
Dilutive potential common sharesStock options and awards . . . . . . . . . . . . . . . . . . . . . . . . . . . . . . . . . . . . . . . . . . . . . — 666 720Denominator for dilutive earnings per share . . . . . . . . . . . . . . . . . . . . . . . . . . . . . . 18,358 18,747 18,260
Net (loss) income per common share—basic . . . . . . . . . . . . . . . . . . . . . . . . . . $ (0.10) $ 0.04 $ 0.05Net (loss) income per common share – diluted . . . . . . . . . . . . . . . . . . . . . . . . $ (0.10) $ 0.03 $ 0.05
(1) For the year ended December 31, 2012, options to purchase 531,634 shares have been excluded incomputing dilutive shares, as the effect would be anti-dilutive.
(2) For the year ended December 31, 2011, options to purchase 271,067 shares and all of the warrants havebeen excluded in computing dilutive shares, as the effect would be anti-dilutive.
(3) For the year ended December 31, 2010, options to purchase 180,972 shares and all of the warrants havebeen excluded in computing dilutive shares, as the effect would be anti-dilutive.
Recent accounting pronouncements
In July 2012, the Financial Accounting Standards Board (FASB) issued FASB Accounting StandardsUpdate (ASU) No. 2012-02, Intangibles—Goodwill and Other (Topic 350)—Testing Indefinite-Lived IntangibleAssets for Impairment. ASU 2012-02 permits an entity to first assess qualitative factors to determine whether it ismore likely than not that an indefinite-lived intangible asset is impaired as a basis for determining whether it isnecessary to perform the quantitative impairment test in accordance with Subtopic 350-30. If an entity concludesthat it is not more likely than not that the indefinite-lived intangible asset is impaired, then no further action isrequired. If an entity concludes otherwise, then it is required to determine the fair value of the indefinite-livedintangible asset and perform the quantitative impairment test. ASU 2012-02 is effective for annual and interimimpairment tests performed for fiscal years beginning after September 15, 2012, with early adoption permitted.The ASU was adopted in 2012 and did not have a material impact on our financial statements.
In December 2011, the FASB issued FASB ASU No. 2011-11, Balance Sheet (Topic 210)—Disclosuresabout Offsetting Assets and Liabilities. ASU 2011-11 requires an entity to disclose information about offsettingand related arrangements to enable users of its financial statements to understand the effect of those arrangementson its financial position. Entities are required to disclose both gross and net information about these instruments.ASU 2011-11 is effective for annual reporting periods beginning on or after January 1, 2013, and interim periodswithin those annual periods. The adoption of this ASU is not expected to have a material impact on our financialstatements.
83
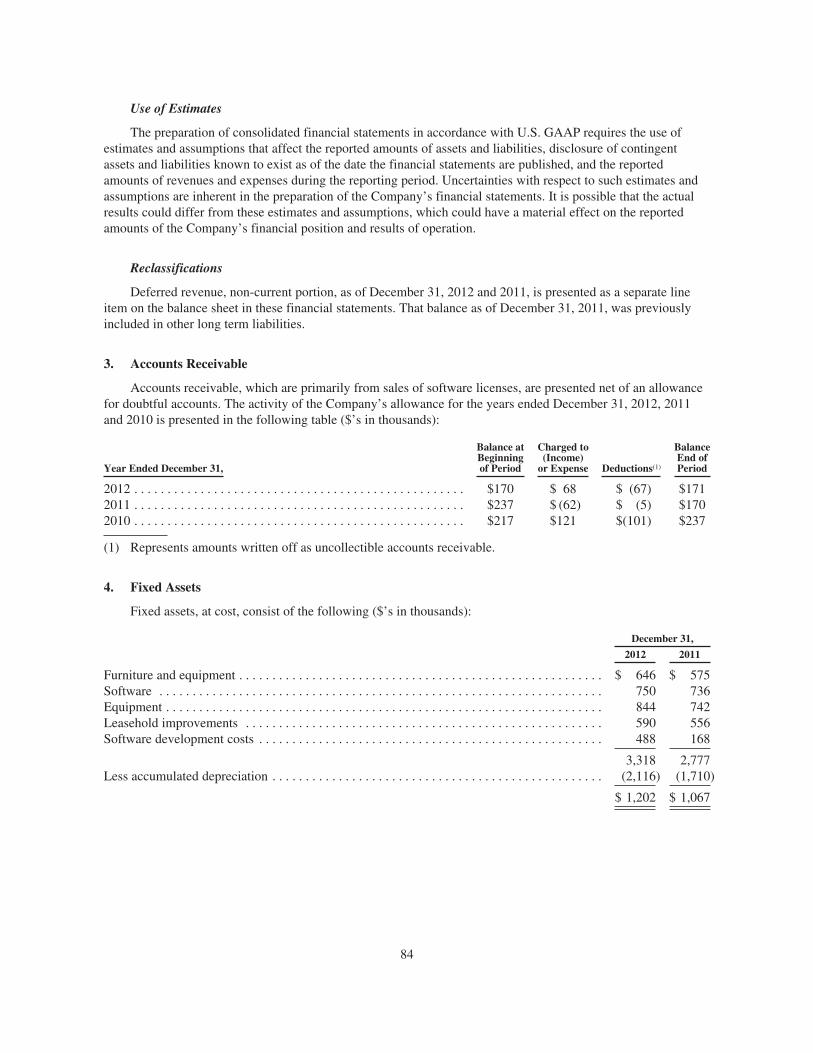
Use of Estimates
The preparation of consolidated financial statements in accordance with U.S. GAAP requires the use ofestimates and assumptions that affect the reported amounts of assets and liabilities, disclosure of contingentassets and liabilities known to exist as of the date the financial statements are published, and the reportedamounts of revenues and expenses during the reporting period. Uncertainties with respect to such estimates andassumptions are inherent in the preparation of the Company’s financial statements. It is possible that the actualresults could differ from these estimates and assumptions, which could have a material effect on the reportedamounts of the Company’s financial position and results of operation.
Reclassifications
Deferred revenue, non-current portion, as of December 31, 2012 and 2011, is presented as a separate lineitem on the balance sheet in these financial statements. That balance as of December 31, 2011, was previouslyincluded in other long term liabilities.
3. Accounts Receivable
Accounts receivable, which are primarily from sales of software licenses, are presented net of an allowancefor doubtful accounts. The activity of the Company’s allowance for the years ended December 31, 2012, 2011and 2010 is presented in the following table ($’s in thousands):
Year Ended December 31,
Balance atBeginningof Period
Charged to(Income)
or Expense Deductions(1)
BalanceEnd ofPeriod
2012 . . . . . . . . . . . . . . . . . . . . . . . . . . . . . . . . . . . . . . . . . . . . . . . . . . $170 $ 68 $ (67) $1712011 . . . . . . . . . . . . . . . . . . . . . . . . . . . . . . . . . . . . . . . . . . . . . . . . . . $237 $ (62) $ (5) $1702010 . . . . . . . . . . . . . . . . . . . . . . . . . . . . . . . . . . . . . . . . . . . . . . . . . . $217 $121 $(101) $237
(1) Represents amounts written off as uncollectible accounts receivable.
4. Fixed Assets
Fixed assets, at cost, consist of the following ($’s in thousands):
December 31,
2012 2011
Furniture and equipment . . . . . . . . . . . . . . . . . . . . . . . . . . . . . . . . . . . . . . . . . . . . . . . . . . . . . . . $ 646 $ 575Software . . . . . . . . . . . . . . . . . . . . . . . . . . . . . . . . . . . . . . . . . . . . . . . . . . . . . . . . . . . . . . . . . . . 750 736Equipment . . . . . . . . . . . . . . . . . . . . . . . . . . . . . . . . . . . . . . . . . . . . . . . . . . . . . . . . . . . . . . . . . . 844 742Leasehold improvements . . . . . . . . . . . . . . . . . . . . . . . . . . . . . . . . . . . . . . . . . . . . . . . . . . . . . . 590 556Software development costs . . . . . . . . . . . . . . . . . . . . . . . . . . . . . . . . . . . . . . . . . . . . . . . . . . . . 488 168
3,318 2,777Less accumulated depreciation . . . . . . . . . . . . . . . . . . . . . . . . . . . . . . . . . . . . . . . . . . . . . . . . . . (2,116) (1,710)
$ 1,202 $ 1,067
84
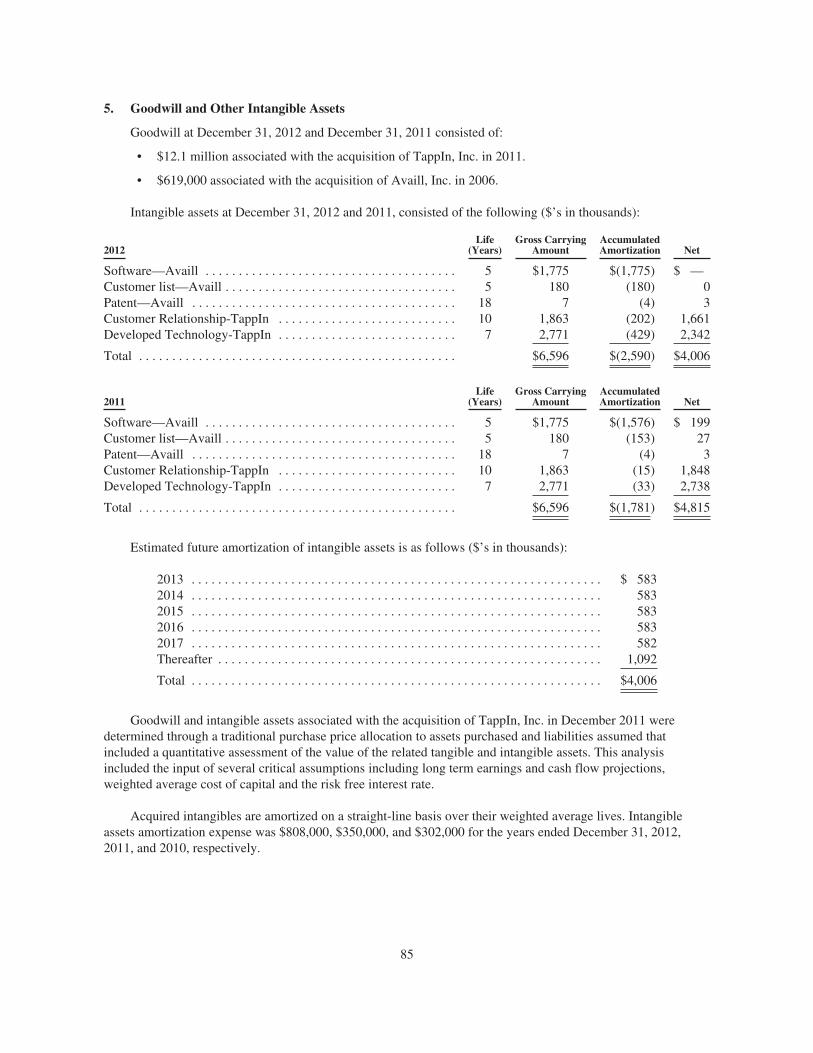
5. Goodwill and Other Intangible Assets
Goodwill at December 31, 2012 and December 31, 2011 consisted of:
• $12.1 million associated with the acquisition of TappIn, Inc. in 2011.
• $619,000 associated with the acquisition of Availl, Inc. in 2006.
Intangible assets at December 31, 2012 and 2011, consisted of the following ($’s in thousands):
2012Life
(Years)Gross Carrying
AmountAccumulatedAmortization Net
Software—Availl . . . . . . . . . . . . . . . . . . . . . . . . . . . . . . . . . . . . . . 5 $1,775 $(1,775) $ —Customer list—Availl . . . . . . . . . . . . . . . . . . . . . . . . . . . . . . . . . . . 5 180 (180) 0Patent—Availl . . . . . . . . . . . . . . . . . . . . . . . . . . . . . . . . . . . . . . . . 18 7 (4) 3Customer Relationship-TappIn . . . . . . . . . . . . . . . . . . . . . . . . . . . 10 1,863 (202) 1,661Developed Technology-TappIn . . . . . . . . . . . . . . . . . . . . . . . . . . . 7 2,771 (429) 2,342
Total . . . . . . . . . . . . . . . . . . . . . . . . . . . . . . . . . . . . . . . . . . . . . . . . $6,596 $(2,590) $4,006
2011Life
(Years)Gross Carrying
AmountAccumulatedAmortization Net
Software—Availl . . . . . . . . . . . . . . . . . . . . . . . . . . . . . . . . . . . . . . 5 $1,775 $(1,576) $ 199Customer list—Availl . . . . . . . . . . . . . . . . . . . . . . . . . . . . . . . . . . . 5 180 (153) 27Patent—Availl . . . . . . . . . . . . . . . . . . . . . . . . . . . . . . . . . . . . . . . . 18 7 (4) 3Customer Relationship-TappIn . . . . . . . . . . . . . . . . . . . . . . . . . . . 10 1,863 (15) 1,848Developed Technology-TappIn . . . . . . . . . . . . . . . . . . . . . . . . . . . 7 2,771 (33) 2,738
Total . . . . . . . . . . . . . . . . . . . . . . . . . . . . . . . . . . . . . . . . . . . . . . . . $6,596 $(1,781) $4,815
Estimated future amortization of intangible assets is as follows ($’s in thousands):
2013 . . . . . . . . . . . . . . . . . . . . . . . . . . . . . . . . . . . . . . . . . . . . . . . . . . . . . . . . . . . . . . $ 5832014 . . . . . . . . . . . . . . . . . . . . . . . . . . . . . . . . . . . . . . . . . . . . . . . . . . . . . . . . . . . . . . 5832015 . . . . . . . . . . . . . . . . . . . . . . . . . . . . . . . . . . . . . . . . . . . . . . . . . . . . . . . . . . . . . . 5832016 . . . . . . . . . . . . . . . . . . . . . . . . . . . . . . . . . . . . . . . . . . . . . . . . . . . . . . . . . . . . . . 5832017 . . . . . . . . . . . . . . . . . . . . . . . . . . . . . . . . . . . . . . . . . . . . . . . . . . . . . . . . . . . . . . 582Thereafter . . . . . . . . . . . . . . . . . . . . . . . . . . . . . . . . . . . . . . . . . . . . . . . . . . . . . . . . . . 1,092
Total . . . . . . . . . . . . . . . . . . . . . . . . . . . . . . . . . . . . . . . . . . . . . . . . . . . . . . . . . . . . . . $4,006
Goodwill and intangible assets associated with the acquisition of TappIn, Inc. in December 2011 weredetermined through a traditional purchase price allocation to assets purchased and liabilities assumed thatincluded a quantitative assessment of the value of the related tangible and intangible assets. This analysisincluded the input of several critical assumptions including long term earnings and cash flow projections,weighted average cost of capital and the risk free interest rate.
Acquired intangibles are amortized on a straight-line basis over their weighted average lives. Intangibleassets amortization expense was $808,000, $350,000, and $302,000 for the years ended December 31, 2012,2011, and 2010, respectively.
85
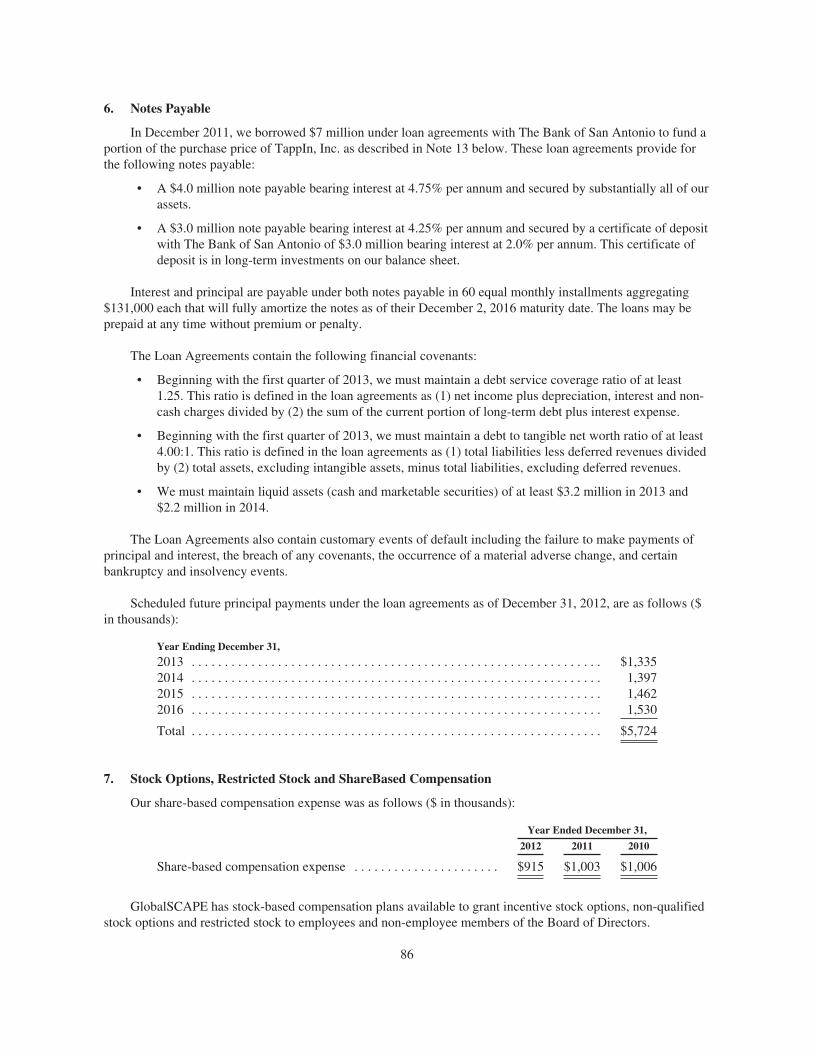
6. Notes Payable
In December 2011, we borrowed $7 million under loan agreements with The Bank of San Antonio to fund aportion of the purchase price of TappIn, Inc. as described in Note 13 below. These loan agreements provide forthe following notes payable:
• A $4.0 million note payable bearing interest at 4.75% per annum and secured by substantially all of ourassets.
• A $3.0 million note payable bearing interest at 4.25% per annum and secured by a certificate of depositwith The Bank of San Antonio of $3.0 million bearing interest at 2.0% per annum. This certificate ofdeposit is in long-term investments on our balance sheet.
Interest and principal are payable under both notes payable in 60 equal monthly installments aggregating$131,000 each that will fully amortize the notes as of their December 2, 2016 maturity date. The loans may beprepaid at any time without premium or penalty.
The Loan Agreements contain the following financial covenants:
• Beginning with the first quarter of 2013, we must maintain a debt service coverage ratio of at least1.25. This ratio is defined in the loan agreements as (1) net income plus depreciation, interest and non-cash charges divided by (2) the sum of the current portion of long-term debt plus interest expense.
• Beginning with the first quarter of 2013, we must maintain a debt to tangible net worth ratio of at least4.00:1. This ratio is defined in the loan agreements as (1) total liabilities less deferred revenues dividedby (2) total assets, excluding intangible assets, minus total liabilities, excluding deferred revenues.
• We must maintain liquid assets (cash and marketable securities) of at least $3.2 million in 2013 and$2.2 million in 2014.
The Loan Agreements also contain customary events of default including the failure to make payments ofprincipal and interest, the breach of any covenants, the occurrence of a material adverse change, and certainbankruptcy and insolvency events.
Scheduled future principal payments under the loan agreements as of December 31, 2012, are as follows ($in thousands):
Year Ending December 31,
2013 . . . . . . . . . . . . . . . . . . . . . . . . . . . . . . . . . . . . . . . . . . . . . . . . . . . . . . . . . . . . . . $1,3352014 . . . . . . . . . . . . . . . . . . . . . . . . . . . . . . . . . . . . . . . . . . . . . . . . . . . . . . . . . . . . . . 1,3972015 . . . . . . . . . . . . . . . . . . . . . . . . . . . . . . . . . . . . . . . . . . . . . . . . . . . . . . . . . . . . . . 1,4622016 . . . . . . . . . . . . . . . . . . . . . . . . . . . . . . . . . . . . . . . . . . . . . . . . . . . . . . . . . . . . . . 1,530
Total . . . . . . . . . . . . . . . . . . . . . . . . . . . . . . . . . . . . . . . . . . . . . . . . . . . . . . . . . . . . . . $5,724
7. Stock Options, Restricted Stock and ShareBased Compensation
Our share-based compensation expense was as follows ($ in thousands):
Year Ended December 31,
2012 2011 2010
Share-based compensation expense . . . . . . . . . . . . . . . . . . . . . . $915 $1,003 $1,006
GlobalSCAPE has stock-based compensation plans available to grant incentive stock options, non-qualifiedstock options and restricted stock to employees and non-employee members of the Board of Directors.
86

The GlobalSCAPE, Inc. 2010 Employee Long-Term Equity Incentive Plan, or 2010 Employee Plan, is ourcurrent stock-based incentive plan for our employees. It authorizes the issuance of stock options or restrictedstock awards for up to 3.0 million shares of our common stock. We issued stock options under this plan in 2012,2011 and 2010. We have issued no restricted stock awards under this plan. As of December 31, 2012, stock-based incentives for up to 1,678,340 shares remain available for issuance in the future under this plan.
The GlobalSCAPE, Inc. 2000 Stock Option Plan, or 2000 Employee Plan, preceded the 2010 EmployeePlan. We issued stock options under this plan during a portion of 2010 and in earlier years. We issued norestricted stock awards under this plan. We no longer issue stock-based incentives under this plan.
For stock options issued under both the 2010 Employee Plan and the 2000 Employee Plan, the exerciseprice, term and other conditions applicable to each stock option or stock award granted are determined by theCompensation Committee of the Board of Directors. The exercise price of stock options is set on the grant dateand may not be less than the fair market value per share of our common stock on that date. Stock options issuedunder these plans generally become exercisable over a three-year period (vesting 33%, 33% and 34% per year,respectively) and expire after ten years.
The 2006 Non-Employee Directors Long-term Equity Incentive Plan, or Director’s Plan, is our currentstock-based incentive plan for members of our Board of Directors. It authorizes the issuance of stock options orrestricted stock awards for up to 500,000 shares of our common stock as follows:
• For stock options issued under this plan, the exercise price, term and other conditions applicable toeach stock option granted are determined by the Compensation Committee of the Board of Directors.We have issued no stock options under this plan.
• For restricted stock awards, shares are to be initially issued with a legend restricting transferability ofthe shares until the recipient satisfies the vesting provision of the award, which is generally continuingservice for one year subsequent to the date the award is granted. This plan provides for an automaticaward of 20,000 shares of restricted stock to each non-employee member of the Board of Directors atthe conclusion of our annual stockholders’ meeting. The maximum annual award for any one person is20,000 shares of common stock.
As of December 31, 2012, stock-based incentives for up to 287,500 shares remain available for issuance inthe future under the Director’s Plan.
87

Our stock option activity under these plans was as follows:
Number ofShares
AverageExercise
Price
RemainingContractual
TermsIntrinsic
Value
(Years) (000’s)
Outstanding at December 31, 2009 . . . . . . . . . . . . . . . . . . . . . . . . . . . 3,653,327 $1.57 7.89 $1,250
2010Granted . . . . . . . . . . . . . . . . . . . . . . . . . . . . . . . . . . . . . . . . . . . . . . . . 390,000 $2.02Forfeitures . . . . . . . . . . . . . . . . . . . . . . . . . . . . . . . . . . . . . . . . . . . . . . 180,350 $1.74Exercised . . . . . . . . . . . . . . . . . . . . . . . . . . . . . . . . . . . . . . . . . . . . . . . 602,650 $0.39
Outstanding at December 31, 2010 . . . . . . . . . . . . . . . . . . . . . . . . . . . 3,260,327 $1.83 7.63 $1,480
2011Granted . . . . . . . . . . . . . . . . . . . . . . . . . . . . . . . . . . . . . . . . . . . . . . . . 1,293,500 $2.00Forfeitures . . . . . . . . . . . . . . . . . . . . . . . . . . . . . . . . . . . . . . . . . . . . . . 203,962 $2.28Exercised . . . . . . . . . . . . . . . . . . . . . . . . . . . . . . . . . . . . . . . . . . . . . . . 291,545 $1.21
Outstanding at December 31, 2010 . . . . . . . . . . . . . . . . . . . . . . . . . . . 4,058,320 $1.91 6.39 $ 540
2012Granted . . . . . . . . . . . . . . . . . . . . . . . . . . . . . . . . . . . . . . . . . . . . . . . . 422,000 $1.93Forfeitures . . . . . . . . . . . . . . . . . . . . . . . . . . . . . . . . . . . . . . . . . . . . . . 755,625 $4.09Exercised . . . . . . . . . . . . . . . . . . . . . . . . . . . . . . . . . . . . . . . . . . . . . . . 74,600 $0.94
Outstanding at December 31, 2012 . . . . . . . . . . . . . . . . . . . . . . . . . . . 3,650,095 $1.91 6.14 $ 300
Exercisable at December 31, 2012 . . . . . . . . . . . . . . . . . . . . . . . . . . . 2,649,455 $1.88 5.14 $ 290
Additional information about our stock options is as follows:
2012 2011 2010
Weighted average fair value of options granted during the year . . . . . . . . . 1.09 1.08 1.32Intrinsic value of options exercised during the year . . . . . . . . . . . . . . . . . . $ 63,820 $ 185,258 $1,200,000Cash received from stock options exercised during the year . . . . . . . . . . . . $ 70,000 $ 352,000 $ 232,000Number of options that vested during the year . . . . . . . . . . . . . . . . . . . . . . 382,772 376,409 124,597Fair value of options that vested during the year . . . . . . . . . . . . . . . . . . . . . $737,000 $ 946,000 $1,300,000Unrecognized compensation expense related to non-vested options at end
of year . . . . . . . . . . . . . . . . . . . . . . . . . . . . . . . . . . . . . . . . . . . . . . . . . . . . $963,000 $1,700,000 $1,200,000Weighted average years over which non-vested option expense will be
recognized . . . . . . . . . . . . . . . . . . . . . . . . . . . . . . . . . . . . . . . . . . . . . . . . 1.84 2.36 1.69
As of December 31, 2012
Options Outstanding Options Exercisable
Range of Exercise Prices
UnderlyingShares
Outstanding
WeightedAverage
RemainingContractual
Life
WeightedAverageExercise
Price
Number ofUnderlying
Shares
WeightedAverageExercise
Price
$0.15 - $0.33 . . . . . . . . . . . . . . . . . . . . . . . . . . . . . . . . 57,900 2.1 $0.27 57,900 $0.27$0.85 - $1.35 . . . . . . . . . . . . . . . . . . . . . . . . . . . . . . . . 681,740 6.2 $1.10 630,740 $1.08$1.41 - $2.13 . . . . . . . . . . . . . . . . . . . . . . . . . . . . . . . . 2,079,595 6.4 $1.77 1,271,945 $1.67$2.14 - $4.10 . . . . . . . . . . . . . . . . . . . . . . . . . . . . . . . . 830,860 5.7 $3.05 688,860 $3.14
Total options . . . . . . . . . . . . . . . . . . . . . . . . . . . . . . . . 3,650,095 2,649,445
88
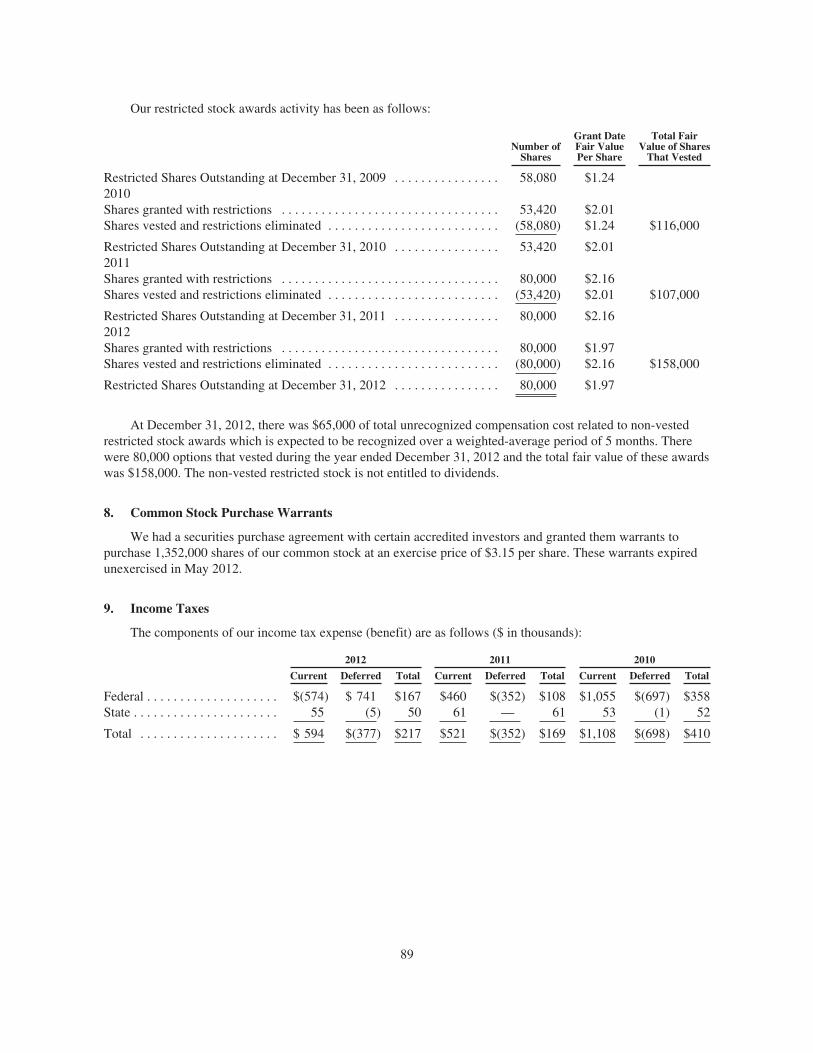
Our restricted stock awards activity has been as follows:
Number ofShares
Grant DateFair ValuePer Share
Total FairValue of Shares
That Vested
Restricted Shares Outstanding at December 31, 2009 . . . . . . . . . . . . . . . . 58,080 $1.242010Shares granted with restrictions . . . . . . . . . . . . . . . . . . . . . . . . . . . . . . . . . 53,420 $2.01Shares vested and restrictions eliminated . . . . . . . . . . . . . . . . . . . . . . . . . . (58,080) $1.24 $116,000
Restricted Shares Outstanding at December 31, 2010 . . . . . . . . . . . . . . . . 53,420 $2.012011Shares granted with restrictions . . . . . . . . . . . . . . . . . . . . . . . . . . . . . . . . . 80,000 $2.16Shares vested and restrictions eliminated . . . . . . . . . . . . . . . . . . . . . . . . . . (53,420) $2.01 $107,000
Restricted Shares Outstanding at December 31, 2011 . . . . . . . . . . . . . . . . 80,000 $2.162012Shares granted with restrictions . . . . . . . . . . . . . . . . . . . . . . . . . . . . . . . . . 80,000 $1.97Shares vested and restrictions eliminated . . . . . . . . . . . . . . . . . . . . . . . . . . (80,000) $2.16 $158,000
Restricted Shares Outstanding at December 31, 2012 . . . . . . . . . . . . . . . . 80,000 $1.97
At December 31, 2012, there was $65,000 of total unrecognized compensation cost related to non-vestedrestricted stock awards which is expected to be recognized over a weighted-average period of 5 months. Therewere 80,000 options that vested during the year ended December 31, 2012 and the total fair value of these awardswas $158,000. The non-vested restricted stock is not entitled to dividends.
8. Common Stock Purchase Warrants
We had a securities purchase agreement with certain accredited investors and granted them warrants topurchase 1,352,000 shares of our common stock at an exercise price of $3.15 per share. These warrants expiredunexercised in May 2012.
9. Income Taxes
The components of our income tax expense (benefit) are as follows ($ in thousands):
2012 2011 2010
Current Deferred Total Current Deferred Total Current Deferred Total
Federal . . . . . . . . . . . . . . . . . . . . $(574) $ 741 $167 $460 $(352) $108 $1,055 $(697) $358State . . . . . . . . . . . . . . . . . . . . . . 55 (5) 50 61 — 61 53 (1) 52
Total . . . . . . . . . . . . . . . . . . . . . $ 594 $(377) $217 $521 $(352) $169 $1,108 $(698) $410
89

Deferred income taxes on our balance sheet reflect the net tax effects of temporary differences between thecarrying amounts of assets and liabilities for financial reporting purposes and the amounts used for income taxpurposes. Significant components of our deferred tax assets and liabilities are as follows ($ in thousands):
As of December 31,
2012 2011
Deferred tax assets:Capital loss carryforward . . . . . . . . . . . . . . . . . . . . . . . . . . . . . . . . . . . . . . . . . $ 1,099 $ —Share-based compensation . . . . . . . . . . . . . . . . . . . . . . . . . . . . . . . . . . . . . . . . 1,017 810Deferred revenue . . . . . . . . . . . . . . . . . . . . . . . . . . . . . . . . . . . . . . . . . . . . . . . 470 387Net operating loss carryforward . . . . . . . . . . . . . . . . . . . . . . . . . . . . . . . . . . . 386 543Compensation and benefits . . . . . . . . . . . . . . . . . . . . . . . . . . . . . . . . . . . . . . . 102 70Allowance for doubtful accounts . . . . . . . . . . . . . . . . . . . . . . . . . . . . . . . . . . . 58 58Other . . . . . . . . . . . . . . . . . . . . . . . . . . . . . . . . . . . . . . . . . . . . . . . . . . . . . . . . 24 1
Total gross deferred tax assets . . . . . . . . . . . . . . . . . . . . . . . . . . . . . . . . . . . . . . . . . 3,156 1,869Valuation allowance . . . . . . . . . . . . . . . . . . . . . . . . . . . . . . . . . . . . . . . . . . . . . (1,099) 0
Net deferred tax assets . . . . . . . . . . . . . . . . . . . . . . . . . . . . . . . . . . . . . . . . . . . . . . . 2,057 1,869
Deferred tax liabilities:Intangible assets . . . . . . . . . . . . . . . . . . . . . . . . . . . . . . . . . . . . . . . . . . . . . . . . 1,142 1,356Depreciation . . . . . . . . . . . . . . . . . . . . . . . . . . . . . . . . . . . . . . . . . . . . . . . . . . . 203 148
Total gross deferred tax liabilities . . . . . . . . . . . . . . . . . . . . . . . . . . . . . . . . . . . . . . 1,345 1,504
Net deferred tax assets . . . . . . . . . . . . . . . . . . . . . . . . . . . . . . . . . . . . . . . . . . . . . . . $ 712 $ 365
As of December 31, 2012, we had federal income tax net operating loss carry forwards of $1.1 millionavailable to offset future federal taxable income, if any. These carry forwards arose from TappIn operationsbefore we purchased TappIn, Inc. and became available to us at the time we acquired that company. These carryforwards expire in 2030 and 2031.
In assessing the realizability of deferred tax assets, we consider whether it is more-likely-than-not that adeferred tax asset will not be realized. Our assessment of the likelihood of having sufficient taxable income in thefuture to support deduction or utilization of the items giving rise to our deferred tax assets indicates it is more-likely-than-not that we will realize the deferred tax assets listed in the table above with the exception of the $1.1million deferred tax asset related to the capital loss carryforward resulting from the reduction to zero of ourinvestments in and notes receivable from CoreTrace Corporation as described in Note 13. We can realize thiscapital loss carryforward deferred tax asset to the extent we have capital gains in future periods against whichthis capital loss can be deducted. We believe it uncertain that we will have sufficient capital gains in the future tosupport this deduction and have recorded a valuation allowance of $1.1 million for the capital loss carryforwarddeferred tax asset.
We claimed research and experimentation tax credits (“R&D tax credit”) on certain of our tax returns andhave included the effect of those credits in our provision for income taxes. Certain of those returns, and inparticular the R&D tax credit claimed on those returns, are under routine examination by the Internal RevenueService. We believe it more-likely-than-not this examination could result in $125,000 of such credits we claimednot being allowed by the Internal Revenue Service. During the year ended December 31, 2012, we recorded avaluation allowance for this amount due to the uncertainty of this item.
The R&D tax credit for 2012 was extended by legislation passed in 2013. GAAP requires that this creditrelated to 2012 be recorded in the year in which this legislation passed (i.e. 2013). Accordingly, our income taxprovision for 2012 does not include the effects of the R&D tax credit we will claim on our federal income taxreturn for 2012.
90
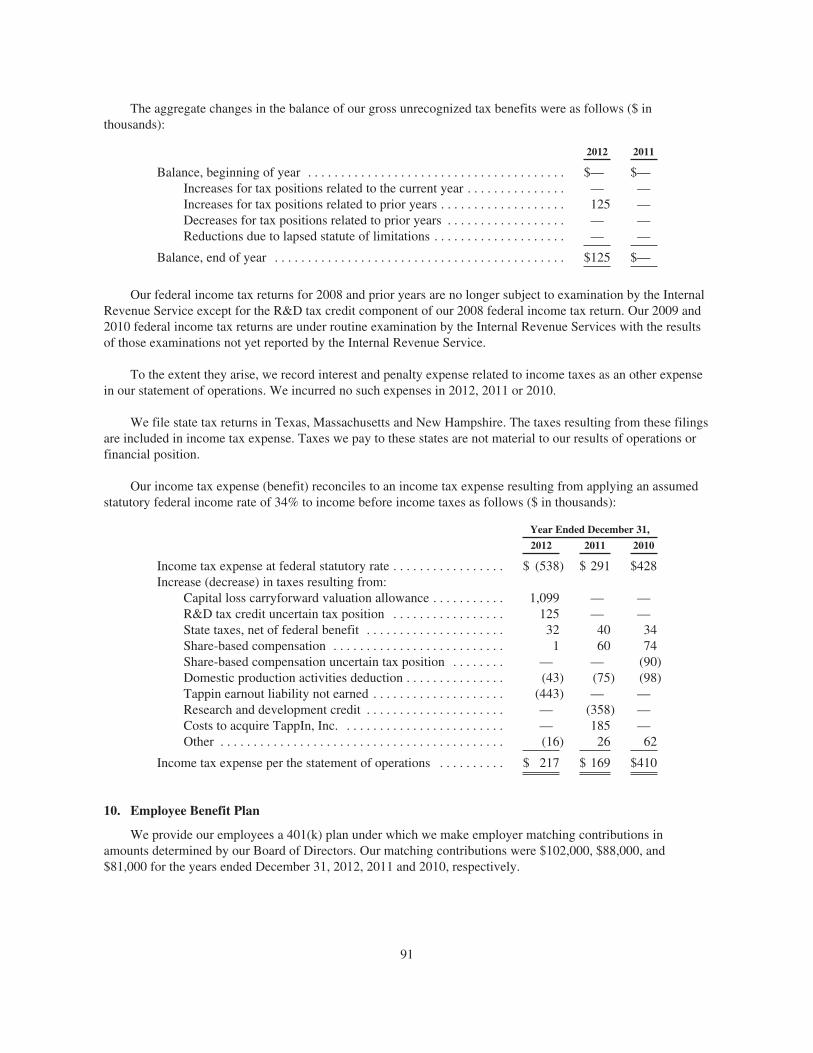
The aggregate changes in the balance of our gross unrecognized tax benefits were as follows ($ inthousands):
2012 2011
Balance, beginning of year . . . . . . . . . . . . . . . . . . . . . . . . . . . . . . . . . . . . . . . $— $—Increases for tax positions related to the current year . . . . . . . . . . . . . . . — —Increases for tax positions related to prior years . . . . . . . . . . . . . . . . . . . 125 —Decreases for tax positions related to prior years . . . . . . . . . . . . . . . . . . — —Reductions due to lapsed statute of limitations . . . . . . . . . . . . . . . . . . . . — —
Balance, end of year . . . . . . . . . . . . . . . . . . . . . . . . . . . . . . . . . . . . . . . . . . . . $125 $—
Our federal income tax returns for 2008 and prior years are no longer subject to examination by the InternalRevenue Service except for the R&D tax credit component of our 2008 federal income tax return. Our 2009 and2010 federal income tax returns are under routine examination by the Internal Revenue Services with the resultsof those examinations not yet reported by the Internal Revenue Service.
To the extent they arise, we record interest and penalty expense related to income taxes as an other expensein our statement of operations. We incurred no such expenses in 2012, 2011 or 2010.
We file state tax returns in Texas, Massachusetts and New Hampshire. The taxes resulting from these filingsare included in income tax expense. Taxes we pay to these states are not material to our results of operations orfinancial position.
Our income tax expense (benefit) reconciles to an income tax expense resulting from applying an assumedstatutory federal income rate of 34% to income before income taxes as follows ($ in thousands):
Year Ended December 31,
2012 2011 2010
Income tax expense at federal statutory rate . . . . . . . . . . . . . . . . . $ (538) $ 291 $428Increase (decrease) in taxes resulting from:
Capital loss carryforward valuation allowance . . . . . . . . . . . 1,099 — —R&D tax credit uncertain tax position . . . . . . . . . . . . . . . . . 125 — —State taxes, net of federal benefit . . . . . . . . . . . . . . . . . . . . . 32 40 34Share-based compensation . . . . . . . . . . . . . . . . . . . . . . . . . . 1 60 74Share-based compensation uncertain tax position . . . . . . . . — — (90)Domestic production activities deduction . . . . . . . . . . . . . . . (43) (75) (98)Tappin earnout liability not earned . . . . . . . . . . . . . . . . . . . . (443) — —Research and development credit . . . . . . . . . . . . . . . . . . . . . — (358) —Costs to acquire TappIn, Inc. . . . . . . . . . . . . . . . . . . . . . . . . — 185 —Other . . . . . . . . . . . . . . . . . . . . . . . . . . . . . . . . . . . . . . . . . . . (16) 26 62
Income tax expense per the statement of operations . . . . . . . . . . $ 217 $ 169 $410
10. Employee Benefit Plan
We provide our employees a 401(k) plan under which we make employer matching contributions inamounts determined by our Board of Directors. Our matching contributions were $102,000, $88,000, and$81,000 for the years ended December 31, 2012, 2011 and 2010, respectively.
91

11. Investment in and Notes Receivable From Affiliated Entity
We had an investment as a shareholder in and notes receivable from CoreTrace Corporation. We also had ajoint development and reseller agreement with CoreTrace for our appShield product under which:
• CoreTrace was to develop and support our appShield product at their expense, and
• We had a combination of exclusive and non-exclusive licenses to sell the appShield product and payCoreTrace a royalty on those sales.
In November 2012, CoreTrace announced the sale of a substantial portion of its assets, other than appShield,to an unrelated third party. That transaction triggered provisions of a software escrow agreement under which theappShield source code was released to us for our further development and sale at our expense with CoreTraceceasing further appShield development on our behalf. We retained our existing exclusive and non-exclusivelicenses to develop and sell the appShield product with an elimination of our obligation to pay CoreTrace aroyalty on those sales.
These events made it likely that substantially all of the value of our investment in and notes receivable fromCoreTrace was eliminated. Accordingly, during the quarter ended September 30, 2012, we reduced to zero thecarrying value of these assets related to CoreTrace and recorded a corresponding affiliated entity assetimpairment expense of $3.3 million.
12. Commitments and Contingencies
Minimum rental commitments under operating leases at December 31, 2012, are as follows ($ inthousands):
Year Ending December 31,
2013 . . . . . . . . . . . . . . . . . . . . . . . . . . . . . . . . . . . . . . . . . . . . . . . . . . . . . . . . . . . . . . $ 4752014 . . . . . . . . . . . . . . . . . . . . . . . . . . . . . . . . . . . . . . . . . . . . . . . . . . . . . . . . . . . . . . 4732015 . . . . . . . . . . . . . . . . . . . . . . . . . . . . . . . . . . . . . . . . . . . . . . . . . . . . . . . . . . . . . . 3582016 . . . . . . . . . . . . . . . . . . . . . . . . . . . . . . . . . . . . . . . . . . . . . . . . . . . . . . . . . . . . . . 3472017 . . . . . . . . . . . . . . . . . . . . . . . . . . . . . . . . . . . . . . . . . . . . . . . . . . . . . . . . . . . . . . 347Thereafter . . . . . . . . . . . . . . . . . . . . . . . . . . . . . . . . . . . . . . . . . . . . . . . . . . . . . . . . . . 463
Total . . . . . . . . . . . . . . . . . . . . . . . . . . . . . . . . . . . . . . . . . . . . . . . . . . . . . . . . . . . . . . $2,463
Operating lease expense was $468,000 in 2012, $356,000 in 2011 and $363,000 in 2010. We had a deferredrent credit of $62,000 at December 31, 2012, that we amortize as a credit to rent expense on a straight-line basisover the remaining life of the applicable lease.
GlobalSCAPE is named as one of a number of defendants in a patent infringement suit filed by AchatesReference Publishing, Inc. in the United States District Court for the Eastern District of Texas Marshall Division.The complaint alleges that GlobalSCAPE infringed on a patent that addresses product activation functionality.GlobalSCAPE believes that it has meritorious defenses to plaintiffs’ claims in this case and intends to defend thislawsuit vigorously. GlobalSCAPE believes any loss it may incur related to this matter would be immaterial to theCompany’s financial position and results of operations.
GlobalSCAPE is named as one of a number of defendants in a patent infringement suit filed by UnilocLuxembourg S.A. in the United States District Court for the Eastern District of Texas Marshall Division. Thecomplaint alleges that GlobalSCAPE infringed on a patent that addresses software piracy preventionfunctionality. GlobalSCAPE believes that it has meritorious defenses to plaintiff’s claims in this case and intendsto defend this lawsuit vigorously. GlobalSCAPE believes any loss it may incur in this matter would beimmaterial to the Company’s financial position and results of operations.
92

13. Acquisition of TappIn, Inc.
In December 2011, we acquired all of the issued and outstanding shares TappIn, Inc. At the time of theacquisition, we paid the TappIn selling shareholders $9 million cash which we funded with $2.0 million of ourcash on hand and $7.0 borrowed under our notes payable to a bank, the terms of which are described in Note 7above. In addition to these amounts, we paid $190,000 cash for TappIn’s working capital acquired at closing. Theformer shareholders of TappIn, Inc. are eligible to receive up to $8 million of additional payments uponachieving certain revenue milestones by December 31, 2014, as described below.
We allocated the total purchase price of this acquisition to assets and liabilities based on their estimated fairvalues at the acquisition date. In allocating the purchase price to intangible assets and goodwill, our firstallocation was to identifiable intangible assets, including developed technology and customer relationships, afterwhich we allocated the remainder to goodwill. These allocations were as follows ($ in thousands):
Accounts receivable . . . . . . . . . . . . . . . . . . . . . . . . . . . . . . . . . . . . . . . . . . . . . . . . . $ 169Current assets . . . . . . . . . . . . . . . . . . . . . . . . . . . . . . . . . . . . . . . . . . . . . . . . . . . . . . 28Property and equipment, net . . . . . . . . . . . . . . . . . . . . . . . . . . . . . . . . . . . . . . . . . . . 20Intangibles . . . . . . . . . . . . . . . . . . . . . . . . . . . . . . . . . . . . . . . . . . . . . . . . . . . . . . . . 4,634Goodwill . . . . . . . . . . . . . . . . . . . . . . . . . . . . . . . . . . . . . . . . . . . . . . . . . . . . . . . . . . 11,343Assumed liabilities . . . . . . . . . . . . . . . . . . . . . . . . . . . . . . . . . . . . . . . . . . . . . . . . . . (3)Deferred revenue . . . . . . . . . . . . . . . . . . . . . . . . . . . . . . . . . . . . . . . . . . . . . . . . . . . (4)
Net assets acquired . . . . . . . . . . . . . . . . . . . . . . . . . . . . . . . . . . . . . . . . . . . . . . . . . . $16,187
The total consideration agreed to be paid for TappIn at the time of the acquisition was as follows:
Cash paid at acquisition close date:Sourced from cash on hand . . . . . . . . . . . . . . . . . . . . . . . . . . . . . . . $ 2,000Sourced from note payable to a bank . . . . . . . . . . . . . . . . . . . . . . . . 7,000
Total . . . . . . . . . . . . . . . . . . . . . . . . . . . . . . . . . . . . . . . . . . . . . 9,000Contingent consideration . . . . . . . . . . . . . . . . . . . . . . . . . . . . . . . . . 6,997Additional cash paid for net working capital . . . . . . . . . . . . . . . . . . 190
Total purchase price . . . . . . . . . . . . . . . . . . . . . . . . . . . . . . . . . . . . . $16,187
The contingent consideration, which is described as the TappIn earn out on our balance sheet, provides forthe following possible milestone payments to the former shareholders of TappIn, Inc.:
• $2.0 million upon the completion of the development of a certain product. This milestone was achievedin 2012 for which we paid those former shareholders $1.5 million in 2012 and $500,000 in 2013.
• $1.5 million upon the achievement of a certain revenue milestone during 2012. This milestone was notachieved. Based on our prior estimates of the likelihood of achieving this milestone, we had recorded aliability of $3.3 million for this event. We eliminated this liability from our balance sheet as ofDecember 31, 2012, and recorded a corresponding credit to operating expense during 2012.
• $8.0 million upon achieving certain revenue milestones by no later than December 31, 2014. Ourbalance sheet at December 31, 2012, includes a liability of $4.2 million for these possible payments.We determined this liability based on our estimates of the likelihood of achieving these milestones.
93
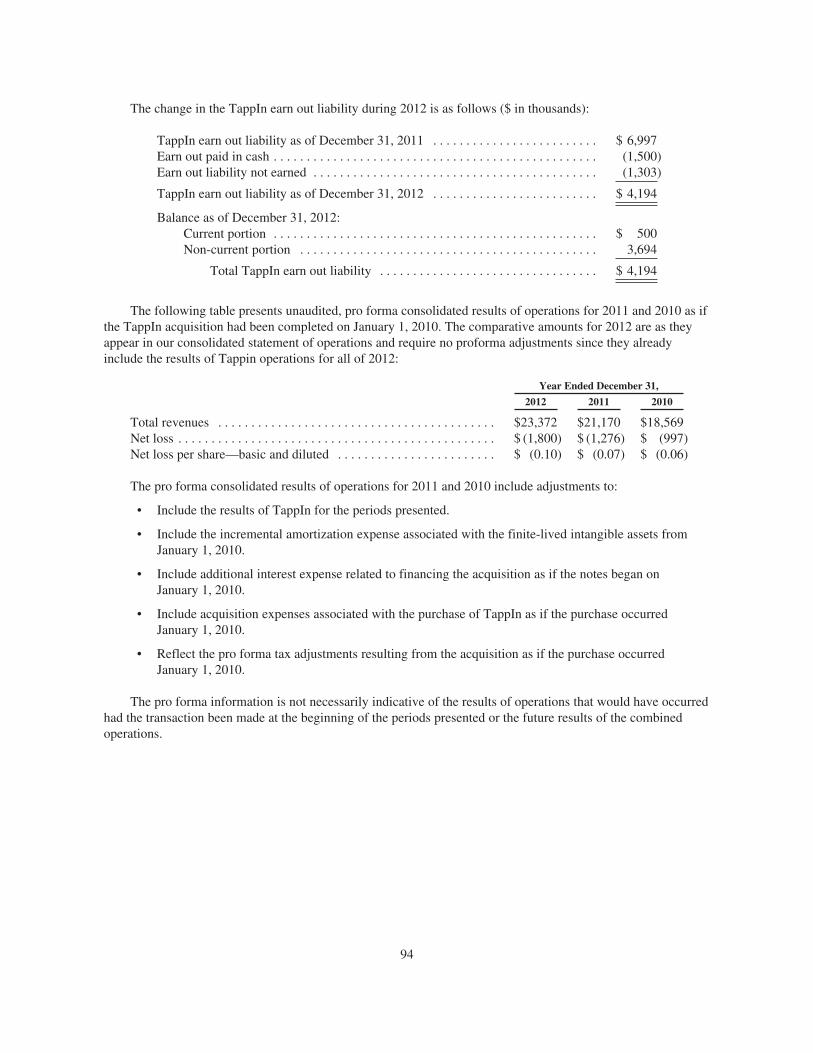
The change in the TappIn earn out liability during 2012 is as follows ($ in thousands):
TappIn earn out liability as of December 31, 2011 . . . . . . . . . . . . . . . . . . . . . . . . . $ 6,997Earn out paid in cash . . . . . . . . . . . . . . . . . . . . . . . . . . . . . . . . . . . . . . . . . . . . . . . . . (1,500)Earn out liability not earned . . . . . . . . . . . . . . . . . . . . . . . . . . . . . . . . . . . . . . . . . . . (1,303)
TappIn earn out liability as of December 31, 2012 . . . . . . . . . . . . . . . . . . . . . . . . . $ 4,194
Balance as of December 31, 2012:Current portion . . . . . . . . . . . . . . . . . . . . . . . . . . . . . . . . . . . . . . . . . . . . . . . . . $ 500Non-current portion . . . . . . . . . . . . . . . . . . . . . . . . . . . . . . . . . . . . . . . . . . . . . 3,694
Total TappIn earn out liability . . . . . . . . . . . . . . . . . . . . . . . . . . . . . . . . . $ 4,194
The following table presents unaudited, pro forma consolidated results of operations for 2011 and 2010 as ifthe TappIn acquisition had been completed on January 1, 2010. The comparative amounts for 2012 are as theyappear in our consolidated statement of operations and require no proforma adjustments since they alreadyinclude the results of Tappin operations for all of 2012:
Year Ended December 31,
2012 2011 2010
Total revenues . . . . . . . . . . . . . . . . . . . . . . . . . . . . . . . . . . . . . . . . . . $23,372 $21,170 $18,569Net loss . . . . . . . . . . . . . . . . . . . . . . . . . . . . . . . . . . . . . . . . . . . . . . . . $ (1,800) $ (1,276) $ (997)Net loss per share—basic and diluted . . . . . . . . . . . . . . . . . . . . . . . . $ (0.10) $ (0.07) $ (0.06)
The pro forma consolidated results of operations for 2011 and 2010 include adjustments to:
• Include the results of TappIn for the periods presented.
• Include the incremental amortization expense associated with the finite-lived intangible assets fromJanuary 1, 2010.
• Include additional interest expense related to financing the acquisition as if the notes began onJanuary 1, 2010.
• Include acquisition expenses associated with the purchase of TappIn as if the purchase occurredJanuary 1, 2010.
• Reflect the pro forma tax adjustments resulting from the acquisition as if the purchase occurredJanuary 1, 2010.
The pro forma information is not necessarily indicative of the results of operations that would have occurredhad the transaction been made at the beginning of the periods presented or the future results of the combinedoperations.
94

14. Quarterly Consolidated Financial Information (unaudited)
Fiscal Year 2012
1st Quarter 2nd Quarter 3rd Quarter 4th Quarter
Total revenues . . . . . . . . . . . . . . . . . . . . . . . . . . . . . . . . . . . . . . . . . . . $ 5,393 $ 5,702 $ 6,078 $ 6,199Total operating expenses . . . . . . . . . . . . . . . . . . . . . . . . . . . . . . . . . . . $ 5,728 $ 5,774 $ 8,867 $ 4,397Other income (expense) . . . . . . . . . . . . . . . . . . . . . . . . . . . . . . . . . . . . $ (66) $ (61) $ (11) $ (51)
Net income (loss) before provision for income taxes . . . . . . . . . $ (401) $ (133) $ (2,800) $ 1,751Net income (loss) . . . . . . . . . . . . . . . . . . . . . . . . . . . . . . . . . . . . . . . . . $ (253) $ (140) $(2,714) $ 1,307
Net income (loss) per share:Basic . . . . . . . . . . . . . . . . . . . . . . . . . . . . . . . . . . . . . . . . . . . . . . . $ (0.01) $ (0.01) $ (0.15) $ 0.07Diluted . . . . . . . . . . . . . . . . . . . . . . . . . . . . . . . . . . . . . . . . . . . . . $ (0.01) $ (0.01) $ (0.15) $ 0.07
Weighted average shares outstandingBasic . . . . . . . . . . . . . . . . . . . . . . . . . . . . . . . . . . . . . . . . . . . . . . . 18,288 18,320 18,398 18,421Diluted . . . . . . . . . . . . . . . . . . . . . . . . . . . . . . . . . . . . . . . . . . . . . 18,288 18,320 18,398 18,959
Fiscal Year 2011
1st Quarter 2nd Quarter 3rd Quarter 4th Quarter
Total revenues . . . . . . . . . . . . . . . . . . . . . . . . . . . . . . . . . . . . . . . . . . . $ 4,644 $ 5,710 $ 5,417 $ 5,123Total operating expenses . . . . . . . . . . . . . . . . . . . . . . . . . . . . . . . . . . . $ 4,552 $ 4,995 $ 4,886 $ 5,669Other income (expense) . . . . . . . . . . . . . . . . . . . . . . . . . . . . . . . . . . . . $ — $ 13 $ 9 $ (10)
Net income (loss) before provision for income taxes . . . . . . . . . $ 92 $ 728 $ 540 $ (556)Net income (loss) . . . . . . . . . . . . . . . . . . . . . . . . . . . . . . . . . . . . . . . . . $ 59 $ 471 $ 611 $ (505)
Net income (loss) per share:Basic . . . . . . . . . . . . . . . . . . . . . . . . . . . . . . . . . . . . . . . . . . . . . . . $ — $ 0.03 $ 0.03 $ (0.03)Diluted . . . . . . . . . . . . . . . . . . . . . . . . . . . . . . . . . . . . . . . . . . . . . $ — $ 0.03 $ 0.03 $ (0.03)
Weighted average shares outstanding . . . . . . . . . . . . . . . . . . . . . . . . .Basic . . . . . . . . . . . . . . . . . . . . . . . . . . . . . . . . . . . . . . . . . . . . . . . 17,943 17,997 18,121 18,262Diluted . . . . . . . . . . . . . . . . . . . . . . . . . . . . . . . . . . . . . . . . . . . . . 18,699 18,761 18,689 18,262
95
Item 9. Changes in and Disagreements with Accountants on Accounting and Financial Disclosure
None.
Item 9A. Controls and Procedures
Evaluation of Disclosure Controls and Procedures
We maintain disclosure controls and procedures designed to ensure that information required to be disclosedin reports filed under the Securities Exchange Act of 1934, as amended, is recorded, processed, summarized andreported within the time periods specified in the SEC’s rules and forms, and that such information is accumulatedand communicated to our management, including our President and Chief Operating Officer and our ChiefFinancial Officer, as appropriate, to allow timely decisions regarding required disclosure.
No system of controls, no matter how well designed and operated, can provide absolute assurance that theobjectives of the system of controls are met. No evaluation of controls can provide absolute assurance that thesystem of controls has operated effectively in all cases. Our disclosure controls and procedures are designed toprovide reasonable assurance that the objectives of disclosure controls and procedures are met.
As of the end of the period covered by this report, our Chief Executive Officer and Chief Financial Officerevaluated, with the participation of management, the effectiveness of our disclosure controls and procedures.Based on the evaluation, our Chief Executive Officer and Chief Financial Officer concluded that, as of the end ofthe period covered by this report, our disclosure controls and procedures were effective to provide reasonableassurance that the objectives of disclosure controls and procedures are met.
Management’s Report on Internal Control Over Financial Reporting
Our management is responsible for establishing and maintaining adequate internal control over financialreporting, as such term is defined in Exchange Act Rules 13a-15(e). Under the supervision and with theparticipation of our management, including our Chief Executive Officer and Chief Financial Officer, weconducted an evaluation of the effectiveness of our internal control over financial reporting as of December 31,2012 based on the framework in Internal Control – Integrated Framework issued by the Committee ofSponsoring Organization of the Treadway Commission (COSO). Based on that evaluation, our managementconcluded that our internal control over financial reporting was effective as of December 31, 2012.
This annual report does not include an attestation report of our independent registered public accountingfirm regarding internal control over financial reporting. Management’s report was not subject to audit by ourindependent registered public accounting firm pursuant to the Dodd-Frank Wall Street Reform and ConsumerProtection Act signed into law on July 21, 2010 that permits us to provide only management’s report in thisannual report.
Changes in Internal Control Over Financial Reporting
There were no changes in our internal control over financial reporting during the year ended December 31,2012 that have materially affected, or are reasonably likely to materially affect, our internal control over financialreporting.
Item 9B. Other Information
None.
96
PART III
Item 10. Directors, Executive Officers and Corporate Governance
The information required by this item is incorporated by reference to GlobalSCAPE’s Proxy Statement forits 2013 Annual Meeting of Stockholders to be filed with the SEC within 120 days after the end of the fiscal yearended December 31, 2012.
GlobalSCAPE has adopted a Code of Ethics that applies to all its employees, including its Chief ExecutiveOfficer and its Chief Financial Officer. GlobalSCAPE will provide a copy of its Code of Ethics to any personwithout charge upon written request to:
James W. Albrecht, Jr.Chief Financial Officer
GlobalSCAPE, Inc.4500 Lockhill-Selma, Suite 150
San Antonio, Texas 78249
Item 11. Executive Compensation
The information required by this item is incorporated by reference to GlobalSCAPE’s Proxy Statement forits 2013 Annual Meeting of Stockholders to be filed with the SEC within 120 days after the end of the fiscal yearended December 31, 2012.
Item 12. Security Ownership of Certain Beneficial Owners and Management and Related StockholderMatters
The information required by this item is incorporated by reference to GlobalSCAPE’s Proxy Statement forits 2013 Annual Meeting of Stockholders to be filed with the SEC within 120 days after the end of the fiscal yearended December 31, 2012.
Item 13. Certain Relationships and Related Transactions, and Director Independence
The information required by this item is incorporated by reference to GlobalSCAPE’s Proxy Statement forits 2013 Annual Meeting of Stockholders to be filed with the SEC within 120 days after the end of the fiscal yearended December 31, 2012.
Item 14. Principal Accountant Fees and Services.
The information required by this item is incorporated by reference to GlobalSCAPE’s Proxy Statement forits 2013 Annual Meeting of Stockholders to be filed with the SEC within 120 days after the end of the fiscal yearended December 31, 2012.
97

PART IV
Item 15. Exhibits, Financial Statement Schedules
(a) (1) Financial Statements and Schedules
The following financial statements of GlobalSCAPE, Inc. are included in Item 8:
• Consolidated Balance Sheets — December 31, 2012 and 2011
• Consolidated Statements of Operations — Years ended December 31, 2012, 2011 and 2010
• Consolidated Statements of Stockholders’ Equity — Years ended December 31, 2012, 2011 and 2010
• Consolidated Statements of Cash Flows — Years ended December 31, 2012, 2011 and 2010
• Notes to Consolidated Financial Statements — December 31, 2012 and 2011
(2) Schedules not listed above have been omitted because they are not applicable or required, or theinformation required to be set forth therein is included in the Financial Statements or Notes thereto.
(3) Exhibits
ExhibitNumber Description
2.1 Agreement and Plan of Merger dated December 2, 2011 by and among the Company, PlumberAcquisition Corporation and HomePipe Networks, Inc. (Filed as Exhibit 2.1 to Form 8-K filedDecember 8, 2011.
3.1 Amended Restated Certificate of Incorporation (Filed as Exhibit 3.1 to Form 8-K filed November 17,2006).
3.2 Amended and Restated Bylaws of the Company effective as of October 30, 2008 (Filed asExhibit 3.2 to Form 8-K filed November 5, 2008).
4.1 Specimen of Stock Certificate (Filed as Exhibit 4.1 to Form 10-K filed April 2, 2001).
*10.1 1998 Stock Option Plan as amended May 13, 1999 (Filed as Exhibit 4.2 to Form 10-K filed May 12,2000).
*10.2 2000 Stock Option Plan dated May 8, 2000 (Filed as Exhibit 4.3 to Form 10-K filed May 12, 2000).
*10.3 Form of 1998 Stock Option Plan Rights Termination Letter Agreement of Directors to Agree Not toClaim Any Right of Adjustment dated February 4, 2000 (Filed as Exhibit 4.6 to Form 10 filedMay 12, 2000).
*10.4 Form of 1998 Stock Option Plan Rights Termination Letter Agreement for Employees andConsultants to Cancel Options dated February 8, 2000 (Filed as Exhibit 4.7 to Form 10, filedMay 12, 2000).
*10.5 Form of 1998 Stock Option Plan Rights Termination Letter of Officer to Agree Not to Claim AnyRight of Adjustment dated February 8, 2000 (Filed as Exhibit 4.8 to Form 10 filed May 12, 2000).
*10.6 Form of 1998 Stock Option Plan Rights Termination Letter Agreement of Officer to Agree Not toExercise Options dated February 8, 2000 (Filed as Exhibit 4.9 to Form 10 filed May 12, 2000).
*10.7 Form of 1998 Stock Option Plan Reinstatement and Adjustment Letter for Employees datedDecember 19, 2000 (Filed as Exhibit 10.17 to Annual Report on Form 10-K filed April 2, 2001).
*10.8 Form of Release and Indemnity Agreement between GlobalSCAPE, Inc. and Employees datedDecember 19, 2000 (Filed as Exhibit 10.18 to Form 10-K filed April 2, 2001).
*10.9 Form of Incentive Stock Option Agreement under GlobalSCAPE, Inc. 2000 Stock Option Plan (Filedas Exhibit 10.21 to Form 10-K filed April 1, 2002).
98

10.10 Securities Purchase Agreement dated November 13, 2006 by and among GlobalSCAPE, Inc., theStockholders named in Schedule I thereto and the Purchasers named therein (Filed as Exhibit 10.1 toForm 8-K filed November 17, 2006).
10.11 Form of Common Stock Purchase Warrant (Filed as Exhibit 10.2 to Form 8-K filed November 17,2006).
*10.12 Form of Non-Qualified Stock Option Agreement under the GlobalSCAPE, Inc. 2000 Stock OptionPlan (Filed as Exhibit 10.2 to Form 10-Q filed November 13, 2006)
*10.13 GlobalSCAPE, Inc. 2006 Non-Employee Directors Long-Term Equity Incentive Plan (Filed asExhibit 10.1 to Form 8-K filed June 5, 2007).
*10.14 Form of Non-Statutory Stock Option Agreement under GlobalSCAPE, Inc. 2006 Non-EmployeeDirectors Long-Term Equity Incentive Plan (Filed as Exhibit 10.1 to Form 10-Q filed November 14,2007).
*10.15 Form of Employment Agreement for Executive Officers at Vice President-level and above (Filed asExhibit 10.1 to Form 8-K filed August 19, 2009).
*10.16 Second Amended and Restated Executive Employment Agreement by and between the Registrantand Craig Robinson, effective as of December 16, 2011 (Filed as Exhibit 10.2 to Form 8-K filedDecember 22, 2011).
*10.17 2010 Employee Long Term Equity Incentive Plan dated June 3, 2010 (Filed as Appendix A to theDefinitive Proxy Statement filed April 22, 2010).
*10.18 Amended and Restated Employment Agreement by and between the Registrant and Douglas Conyersdated January 9, 2012 (Filed as Exhibit 10.1 to Form 8-K filed January 13, 2012)Employment.
*10.19 Employment Agreement by and between the Registrant and Chris Hopen dated December 2, 2011(Filed herewith)
10.20 Business Loan Agreement dated December 2, 2011, by and between GlobalSCAPE, Inc. and SanAntonio National Bank ($4,000,000 Loan). (Filed as Exhibit 10.1 to Form 8-K filed December 8,2011.
10.21 Business Loan Agreement dated December 2, 2011, by and between GlobalSCAPE, Inc. and SanAntonio National Bank ($3,000,000 Loan). (Filed as Exhibit 10.2 to Form 8-K filed December 8,2011.
10.22 Employment Agreement by and between the Registrant and James W. Albrecht, Jr. dated July 10,2012. (Filed as Exhibit 10.1 to Form 8-K filed July 16, 2012).
14.1 Code of Ethics (Filed as Exhibit 14.1 to Form 10-K filed March 27, 2008)
21.1 Subsidiaries of GlobalSCAPE, Inc. (Filed as Exhibit 21.1 to Form 10-K filed March 29, 2012).
23.1 Consent of Grant Thornton LLP (Filed herewith).
31.1 Certification of Chief Executive Officer pursuant to Section 302 of the Sarbanes-Oxley Act of 2002(Filed herewith).
31.2 Certification of Chief Financial Officer pursuant to Section 302 of the Sarbanes-Oxley Act of 2002(Filed herewith).
32.1 Certification of Chief Executive and Chief Financial Officer pursuant to Section 906 of the Sarbanes-Oxley Act of 2002 (Filed herewith)
101 Interactive Data File.
* Management Compensatory Plan or Agreement
99

Signatures
Pursuant to the requirements of Section 13 or 15(d) of the Securities Exchange Act of 1934, the registranthas duly caused this report to be signed on its behalf by the undersigned, thereunto duly authorized, in SanAntonio, Texas on March 28, 2013.
GlobalSCAPE, Inc.
By: /S/ CRAIG A. ROBINSON
Craig A. RobinsonPresident and Chief Executive Officer
Pursuant to the requirements of the Securities Exchange Act of 1934, this report has been signed below bythe following persons on behalf of the registrant in the capacities indicated on March 28, 2013.
Signature Title
/S/ THOMAS W. BROWN
Thomas W. Brown
Chairman of the Board and Director
/S/ DAVID L. MANN
David L. Mann
Director
/S/ PHILLIP M. RENFRO
Phillip M. Renfro
Director
/S/ FRANK M. MORGAN
Frank M. Morgan
Director
/S/ CRAIG A. ROBINSON
Craig A. Robinson
President and Chief Executive Officer and Director(Principal Executive Officer)
/S/ JAMES W. ALBRECHT, JR.James W. Albrecht, Jr.
Chief Financial Officer (Principal Finance andAccounting Officer)
100

EXHIBIT 21.1
SUBSIDIARIES OF GLOBALSCAPE, INC.
TappIn, Inc., a Delaware Corporation.

EXHIBIT 23.1
CONSENT OF INDEPENDENT REGISTERED PUBLIC ACCOUNTING FIRM
We have issued our report dated March 28, 2013, with respect to the consolidated financial statements included in the Annual Report of GlobalSCAPE, Inc. on Form 10-K for the year ended December 31, 2012. We hereby consent to the incorporation by reference of said report in the Registration Statements of GlobalSCAPE, Inc. on Forms S-8 (File No. 333-61180, effective May 17, 2001; File No 333-61160, effective May 17, 2001, File No. 333-145771, effective August 29, 2007, and File No. 333-168871, effective August 16, 2010). /s/ Grant Thornton LLP
Houston, TexasMarch 28, 2013

EXHIBIT 31.1
CERTIFICATIONS
I, Craig A. Robinson, certify that:
1. I have reviewed this annual report on Form 10-K of GlobalSCAPE, Inc.;
2. Based on my knowledge, this report does not contain any untrue statement of a material fact or omit to state a material fact necessary to make the statements made, in light of the circumstances under which such statements were made, not misleading with respect to the period covered by this report;
3. Based on my knowledge, the financial statements, and other financial information included in this annual report, fairly present in all material respects the financial condition, results of operations and cash flows of the registrant as of, and for, the periods presented in this report;
4. The registrant’s other certifying officer and I are responsible for establishing and maintaining disclosure controls and procedures (as defined in Exchange Act Rules 13a-15(e) and 15d-15(e)) and internal control over financial reporting (as defined in Exchange Act Rules 13a-15(f) and 15d-15(f) for the registrant and have:
a) designed such disclosure controls and procedures, or caused such disclosure controls and procedures to be designed under my supervision, to ensure that material information relating to the registrant, including its consolidated subsidiaries, is made known to me by others within those entities, particularly during the period in which this report is being prepared;
b) designed such internal control over financial reporting, or caused such internal control over financial reporting to be designed under our supervision, to provide reasonable assurance regarding the reliability of financial reporting and the preparation of financial statements for external purposes in accordance with generally accepted accounting principles;
c) evaluated the effectiveness of the registrant’s disclosure controls and procedures and presented in this report our conclusions about the effectiveness of the disclosure controls and procedures, as of the end of the period covered by this report based on such evaluation; and
d) disclosed in this report any change in the registrant’s internal control over financial reporting that occurred during the registrant’s most recent fiscal year that has materially affected, or is reasonably likely to materially affect, the registrant’s internal control over financial reporting; and
5. The registrant’s other certifying officer and I have disclosed, based on our most recent evaluation of internal control over financial reporting, to the registrant’s auditors and the audit committee of registrant’s board of directors (or persons performing the equivalent functions):
a) all significant deficiencies and material weaknesses in the design or operation of internal controls over financial reporting which are reasonably likely to adversely affect the registrant’s ability to record, process, summarize and report financial information; and
b) any fraud, whether or not material, that involves management or other employees who have a significant role in the registrant’s internal control over financial reporting.
Date: March 28, 2013
/s/ Craig A. Robinson Craig A. RobinsonPresident and Chief Executive Officer
EXHIBIT 31.2
CERTIFICATIONS
I, James W. Albrecht, Jr., certify that:
1. I have reviewed this annual report on Form 10-K of GlobalSCAPE, Inc.;
2. Based on my knowledge, this report does not contain any untrue statement of a material fact or omit to state a material fact necessary to make the statements made, in light of the circumstances under which such statements were made, not misleading with respect to the period covered by this report;
3. Based on my knowledge, the financial statements, and other financial information included in this annual report, fairly present in all material respects the financial condition, results of operations and cash flows of the registrant as of, and for, the periods presented in this report;
4. The registrant’s other certifying officer and I are responsible for establishing and maintaining disclosure controls and procedures (as defined in Exchange Act Rules 13a-15(e) and 15d-15(e)) and internal control over financial reporting (as defined in Exchange Act Rules 13a-15(f) and 15d-15(f) for the registrant and have:
a) designed such disclosure controls and procedures, or caused such disclosure controls and procedures to be designed under my supervision, to ensure that material information relating to the registrant, including its consolidated subsidiaries, is made known to me by others within those entities, particularly during the period in which this report is being prepared;
b) designed such internal control over financial reporting, or caused such internal control over financial reporting to be designed under our supervision, to provide reasonable assurance regarding the reliability of financial reporting and the preparation of financial statements for external purposes in accordance with generally accepted accounting principles;
c) evaluated the effectiveness of the registrant’s disclosure controls and procedures and presented in this report our conclusions about the effectiveness of the disclosure controls and procedures, as of the end of the period covered by this report based on such evaluation; and
d) disclosed in this report any change in the registrant’s internal control over financial reporting that occurred during the registrant’s most recent fiscal year that has materially affected, or is reasonably likely to materially affect, the registrant’s internal control over financial reporting; and
5. The registrant’s other certifying officer and I have disclosed, based on our most recent evaluation of internal control over financial reporting, to the registrant’s auditors and the audit committee of registrant’s board of directors (or persons performing the equivalent functions):
a) all significant deficiencies and material weaknesses in the design or operation of internal controls over financial reporting which are reasonably likely to adversely affect the registrant’s ability to record, process, summarize and report financial information; and
b) any fraud, whether or not material, that involves management or other employees who have a significant role in the registrant’s internal control over financial reporting.
Date: March 28, 2013
/s/ James W. Albrecht, Jr. James W. Albrecht, Jr.Chief Financial Officer
Exhibit 32.1
CERTIFICATE PURSUANT TO 18 U.S.C. SECTION 1350, AS ADOPTED PURSUANT TO SECTION 906 OF THE
SARBANES-OXLEY ACT OF 2002
In connection with the Annual Report of GlobalSCAPE, Inc. on Form 10-K for the period ending December 31, 2012 as filed with the Securities and Exchange Commission on the date hereof (the “Report”), the undersigned, Craig A. Robinson, Chief Executive Officer and James W. Albrecht, Jr., Chief Financial Officer, certify, pursuant to 18 U.S.C. Section 1350, as adopted pursuant to Section 906 of the Sarbanes-Oxley Act of 2002, that:
March 28, 2013
(1) The Report fully complies with the requirements of section 13(a) or 15(d) of the Securities Exchange Act of 1934; and
(2) The information contained in the Report fairly presents, in all material respects, the financial condition and results of
operations of GlobalSCAPE, Inc.
/s/ Craig A. Robinson Craig A. RobinsonPresident and Chief Executive Officer
/s/ James W. Albrecht, Jr. James W. Albrecht, Jr.Chief Financial Officer


![ZYBO - Digilent Documentation [Reference.Digilentinc] Z7 B.2 out of 14 2017 MIPI, General I/O 10K R60 10K R62 10K R64 10K R67 GND VCC3V3 SW3 SW2 SW1 SW0 10K R57 10K R71 10K R72 GND](https://img.pdfslide.net/doc/110x75/5abecaa37f8b9a3a428d6851/zybo-digilent-documentation-z7-b2-out-of-14-2017-mipi-general-io-10k-r60.jpg)