Embed Size (px)
Citation preview

GLOBEC
Global Ocean Ecosystems Dynamics
A Component of the U.S. Global Change Research Program
GLOBEC Workshop on Acoustical Technology and theIntegration of Acoustical and Optical Sampling Methods
Report Number 4
September 1991

This is a report of the GLOBEC Workshop on Acoustical Technology and the Integration ofAcoustical and Optical Sampling Methods held in Woods Hole, Massachusetts, USA at theNational Oceanographic and Atmospheric Administration's NMFS Northeast Fisheries Center andat the Woods Hole Oceanographic Institution on April 2-4, 1991-- D.V. Holliday, convenor; T.K.Stanton, Marv Grosslein and Mark Berman, facilities.
The Editorial Committee for this workshop report included Chuck Greene, Charles Greenlaw, VanHolliday, Peter Ortner, Rick Pieper, Tim Stanton and Jim Traynor.
Produced by
U.S. GLOBEC Scientific Steering Coordinating OfficeDept. Integrative BiologyUniversity of CaliforniaBerkeley, CA 94720-3140
Phone: 510-643-0877Fax: 510-643-1142E-mail: [email protected]
Additional copies of this report may be obtained from the address above.

Executive Summary
Changes in global climate, whether from anthropogenic or natural causes, will producechanges in the ocean environment. One of the primary objectives of GLOBEC is to assess theultimate predictability of the response of life in the sea to changes in ocean physics. Understandingthe mechanisms and processes that relate an animal's ability to survive and reproduce to the ocean'sdynamic environment are essential to the success of GLOBEC. Understanding these complexinteractions will require the advancement of technology on a variety of fronts. Ready access toconventional oceanographic technology, as well as the development of new instrumentation andmethodology, is required to achieve GLOBEC's objectives.
The GLOBEC science community is interdisciplinary. It includes a diverse group oftechnologists who develop instrumentation that biological oceanographers, physicaloceanographers, and mathematical modelers will use in the design and interpretation ofexperiments. This integration of technologists and scientists provides the means for effectivelystudying and understanding the structure and dynamics of marine ecosystems. Establishment of acoherent approach for use in addressing GLOBEC science issues, especially to quantify thephysical environment and the relation of ocean physics to the animals that live in the sea, is acontinuing concern in GLOBEC.
To facilitate achieving the goals of GLOBEC, a coherent approach to GLOBEC relatedstudies is advised. To enhance communication and cooperation between scientists, the GLOBECSteering Committee is sponsoring a series of focused, interdisciplinary workshops that address therole of advanced technology in the GLOBEC program. In this context, over 50 biological andphysical oceanographers, fisheries scientists, mathematical modelers, physicists, and engineersmet at NOAA/NMFS and WHOI in Woods Hole, MA in April 1991 to discuss the existingcapabilities and potential developments in acoustical and optical technology, methodology, andinstrumentation for measuring spatial and temporal distributions and assessing the behavior ofanimals in the sea.
The group identified a variety of acoustical and optical instruments and techniques that canbe used in pursuit of GLOBEC's science objectives. It was determined that the integration ofacoustical and optical technology would be highly beneficial and that the technologies were bothcomplementary and synergistic in their potential utility. Synoptic sampling of both the biologicaland physical characteristics of the water column was stressed. Sensors which operate on quasi-continuous spatial and temporal scales were viewed as essential if GLOBEC is to link small scaleprocess measurements to population parameters. The importance of quickly establishing adefinition of data archiving and retrieval protocols for GLOBEC was recognized. Several methodsfor enhancing an individual investigator's access to complex acoustical and optical instrumentswere examined. Similarities were identified in the acoustical technologies used to examinezooplankton, micronekton, macroplankton, and fish, but it was recognized that system parameters(e.g., operating frequencies, beamwidths, signal and data processing algorithms) are often sodifferent that alternate implementations of the same basic technologies may be necessary toexamine different elements of the food web. An emphasis on the acquisition, integratedprocessing, and display of multifrequency acoustic data was a recurring theme in working groupsdealing with different trophic levels. Specific requirements for new research regarding thesynthesis and display of multifrequency data sets were identified. Calls for new research alsoincluded the advancement of theory and supporting measurements in describing scattering fromindividual organisms and the development and validation of methods for quantitative fusion ofmultisensor data.

Table of Contents
Executive Summary1. Introduction
11.1 Background 1
a. What is GLOBEC? 1b. Steering Committee Function and Objectives 1c. The Role of New Measurement Technology 1
1.2 Objectives of the Workshop 21.3 Workshop Organization 3
2. Fisheries Acoustics 52.1 Scientific Context 52.2 Status of Instrumentation for Fisheries 6
a. Modifications to Existing Equipment 7b. New Technology Needs 7c. Experimental Study Needs 7
3. Macrozooplankton/Micronekton Acoustics 83.1 Introduction 83.2 Overview of Sonar Techniques 8
a. One Beam per Frequency 9b. Multiple Beams per Frequency -- Target Strength
Estimation Techniques 103.3 Overview of Acoustic Sampling Methods 10
a. Modes of Deployment 10Ship-mounted or towed survey systems 10Ship-based cast or tow-yo systems 10Remotely deployed systems 11
3.4 Recommendations for Sonar Design 11a. Acoustic Frequencies 12b. Sonar Resolution 12c. Survey System 12d. ROV, Profiling, and Towed Systems 12e. Free-Drifting Buoy and Bottom Mounted/Moored Systems 13
3.5 Team Responsible for Acoustic Systems 143.6 Format of Data/Data Management 143.7 Other Systems 15
a. 3-D Imaging Sonar 15b. Acoustic Doppler Current Profiler 15c. Passive Localization 15
3.8 Summary of Recommendations 16
4. Small Zooplankton Acoustics 174.1 Introduction 174.2 Modes of Deployment 174.3 Priorities for Instrumentation Development 17

a. Priority 1 17Procurement Considerations and Timing 19Other considerations 19
b. Priority2 19c. Priority3 20
4.4 Development of Backscattering Models and Bioacoustical Instruments 20
5. Acoustical and Optical Sensor Integration 215.1 Scientific Context 215.2 Working Group Deliberations 21
a. Distribution 21b. ScaleLinkage 21c. Processes 22d. Available Technology 23
5.3 Specific Recommendations 25
6. Discussion on Education and Training 276.1 Human Resources Development in Bioacoustical Oceanography 27
7. Summary and Recommendations 29
8. Acknowledgements 31
9. References and Bibliography 32
10. Glossary of Terms 39
11. Appendices 5011.1 Appendix A - GLOBEC Steering Committee 5011.2 Appendix B - Workshop Participants 5311.3 Appendix C - Meeting Agenda 63

1
1. Introduction
1.1 Background
a. What is GLOBEC?
GLOBEC (GLOBal Ocean ECosystems Dynamics) is a science component of the U.S.Global Change Research Program. Planning efforts for the U.S. component of the GLOBECresearch initiative are sponsored by NSF with NOAA and ONR participation. The GLOBECconcept involves gaining an understanding of how physical processes, both direct and indirect,influence the success of individual animals in the sea through their feeding, reproduction, andsurvivorship. GLOBEC also addresses relationships between the success of the individual and thedynamics of the population. Additional information on GLOBEC can be obtained by requestingthe U.S. GLOBEC Report Series from JOI, Inc. (1755 Massachusetts Avenue, NW, Suite 800,Washington, DC 20036-2102). A list of the reports that are currently available are included in theReferences.
b. Steering Committee Function and Objectives
The U.S. GLOBEC Steering Committee was established to plan, promote, and coordinatethe physical sciences-biological sciences partnership needed to assess the consequences ofchanging global climate on marine animal production. The current membership of the SteeringCommittee is provided in Appendix A. One goal of the Steering Committee is to provide anassessment of the current and future availability of appropriate technology to groups planning thescience components of GLOBEC. Specifically, there is a need to describe the research,development, organization, and resources needed to make advanced technology available to assistthe community in reaching GLOBEC's science goals. It is also timely to provide the interestedfunding agencies with the science and technology community's view of the potential, cost, andtime required to develop or acquire candidate instrumentation and technology in support of theGLOBEC effort.
c. The Role of New Measurement Technology
The Steering Committee for the U.S component of GLOBEC is attempting to anticipateand describe the necessary technological tools and advances for support of the GLOBEC researchinitiative during the 1990's.
It is anticipated that substantial progress will arise from the development and application ofnew technologies for sampling of both the biota and the physical environment. Additionaladvancements are expected from the interactive collaboration of physical oceanographers,technologists, and biological oceanographers, as well as from the stimulation and opportunities thatthe GLOBEC initiative provides to investigators in the ocean sciences community. One of the keysto advancing our understanding of the relationship between ocean physics and the distributions ofanimals in the sea is the rapid, simultaneous measurement of each. Given the potential gains inunderstanding ocean ecosystem dynamics through application of new technology, it is evident thattimely development of necessary sampling technology and measurement tools is of criticalimportance to GLOBEC.
2
Underwater acoustics and underwater optics appear to be appropriate tools for quantitativeassessment of fish and zooplankton. Additionally, simultaneous and complementary uses ofacoustical and optical technology may bring advantages to both disciplines. In support of theGLOBEC science planning activities, a Workshop on Acoustical Technology and the Integrationof Acoustical and Optical Sampling Methods was held in Woods Hole, Massachusetts on April 2-4, 1991. The Woods Hole Oceanographic Institution and the NOAA National Marine FisheriesService, Northeast Fisheries Center were hosts for the meeting. This report attempts to documentthe key findings of the workshop participants.
1.2 Objectives of the Workshop
Fisheries acoustics is relatively advanced compared to the state of the development ofacoustic technology for studying micronekton and macrozooplankton. The use of acoustics forstudying small zooplankton is also relatively new and the joint use of acoustics and optics is anunexplored area. It was recognized that, since the different working groups were dealing withdisciplines which varied in their maturity, not all of the issues would be appropriate for each group.Consequently, the order and priority in which issues were addressed was left to each group.
The following issues and challenges were identified as being of interest to the GLOBEC SteeringCommittee.
• The issues of priority, protocol, cost, and time frame for instrument acquisition andtechnology development need to be addressed in 3 categories: 1) off-the-shelfinstrumentation; 2) modification or adaptation of off-the-shelf gear at moderate cost; and 3)critical new research or development focuses for instrumentation or methodology.
• Development of a protocol for instrument calibration to ensure valid comparisons ofmeasurement results among different geographic areas, times, projects, and investigators.
• Protocols within which unique or complex instruments can be accessed by investigatorswithin the GLOBEC community, and definition of a route to the development andconstruction of an infrastructure for GLOBEC that will assure and support such access.
• The role of acoustical and optical technology in quantifying and linking different scales ofmeasurement in time and space for GLOBEC.
• As appropriate for each working group, recommendations for "calls for proposals" inspecific areas of acoustical and acoustical/optical technology which should be considered bythe GLOBEC Steering Committee and possibly to be forwarded by that group to appropriatefunding agencies.
• Any other areas in acoustics, optics, and the integration of those two disciplines that theworking groups might deem critical or important in preparing the science and technologycommunities to address GLOBEC science issues.
As one examines the individual working group reports, it will be evident that some issueswere considered to have a higher priority than others. Some issues were addressed in detail andothers were only discussed briefly or not at all. It should be noted that the time constraint of a littlemore than one day for working group meetings precluded addressing all issues in equal detail.
3
1.3 Workshop Organization
To achieve an adequate representation of the technical disciplines needed to addressGLOBEC's acoustical and optical technology requirements meant bringing together biologicaloceanographers, fisheries scientists, physical oceanographers, mathematical modelers, physicists,electrical engineers, and a variety of other technical specialties (see Appendix B for list ofworkshop participants). A small, informal poll of the invitees, before the workshop convened,revealed that individual participants knew a third or fewer of the other workshop attendees. Thesuccess of such interdisciplinary meetings is often the clear definition of the common problem tobe addressed. To provide a common starting base, one-half of the first day was dedicated todefinition of GLOBEC and a description of the science problems and environments of interest topotential GLOBEC investigators. The second half of the first day included several presentationsthat reviewed the history and the state-of-the-art in the acoustical and optical technologies on whichGLOBEC technologists will likely draw in developing instrumentation and methodology. Inrecognition of the diverse backgrounds of the workshop participants, the speakers attempted toemphasize concepts, general methods, and results rather than technical detail.
On the morning of the first day a description of the developing GLOBEC science focusand of several GLOBEC field programs under discussion for the 1990's was presented (seeAppendix C- Meeting Agenda). These presentations provided examples of the science issuesrelated to GLOBEC that would benefit from the application of existing, modified, and/or newacoustic technology as it impacts our ability to understand the dynamics of typical oceanecosystems. They also provided an indication of the range of ocean environments that may beencountered in GLOBEC studies. The ocean environment is often a limiting factor in theperformance of acoustic and optical instrumentation.
The afternoon of the first day was dedicated to review and survey papers by investigatorswho are active in four related research areas: 1) fisheries acoustics; 2) mesopelagic fish acoustics;3) euphausiid (krill) acoustics; and 4) zooplankton acoustics.
On the second day, several working groups were convened. Three of these strived toidentify applicable acoustic instrumentation and technologies in historically distinct, butoverlapping bioacoustic disciplines of: fisheries acoustics, micronekton/macro-zooplanktonacoustics, and small zooplankton acoustics. A fourth working group focused on the possibleintegration of acoustical and optical techniques. The groups were asked to address the following:the availability of off-the-shelf instrumentation; existing instrumentation that could be modifiedquickly and at moderate cost; existing technology that is not yet widely available, but could bemade so in the time-frame of GLOBEC; and new concepts that could have a major impact on thescience in the 1990's if the necessary resources were made available for research and development.
Applicable technology and methods as well as instruments were identified. In areas wherea consensus evolved from the deliberations, general priorities for funding of instrument acquisitionas well as research and development were recommended. Ways to increase the availability ofnecessary instrumentation to all GLOBEC investigators were also solicited. For example, in somecases, acquisition of low cost instruments by individual investigators, or small groups, within thecontext of their science proposals may be most appropriate. In other cases, the acquisition ofunique or high-cost instruments or facilities by larger coalitions of scientists interested in providing
4
a service to the community may be the most practical approach. Following brief meetings of theworking groups, a panel discussion of mechanisms for developing educational and trainingopportunities for undergraduates, graduate students, and postdoctoral scientists opened the plenarysession on the third morning. The workshop concluded at noon with presentations by the workinggroup chairmen summarizing the findings of each group. The Editorial Committee (see insidecover) then turned its attention to the integration of the separate working group reports into acompatible format.
Working groups were organized within traditional acoustic subject divisions rather thanthose possibly more common to the biological disciplines. The acoustical method of grouping theorganisms that live in the sea is largely based on size, numbers/m3, and to some degree, theirbehavior, environment, and distribution. These are all important parameters in determining theacoustic methods and operating parameters to be used for detecting and quantifying distribution,abundance, and characteristics of the animals. Both the acoustical and the biological method ofgrouping subjects is somewhat artificial. There is often overlap in the types of acoustic technologyused to examine the range of sizes between egg and adult life stages, and interactions betweentrophic levels in the food web. Likewise, the complexity of the marine food web makes it difficultto examine any individual species or group in total isolation.
The fisheries acoustics group dealt principally with adult nekton. Themicronekton/macroplankton group included scientists with interests in juvenile and larval fishes,myctophids, euphausiids, and large zooplankton. In general, these animals are complex scatterersof sound, requiring application of either very simple (e.g., empirical regression models) orreasonably complex mathematical formulations (e.g., rough, bent cylinder scattering models) todescribe their acoustic reflectivities. While improvements in scattering models applicable to smallzooplankton will probably be a natural outcome of continued work on those organisms, variationson the fluid sphere model have been used with some success since 1950 (Anderson, 1950) todescribe the acoustic reflectivity of small crustaceans such as copepods. The original division ofthe micronekton/macroplankton group and the small zooplankton group was based on the type ofscattering model that might be most appropriate to describe the scattering from the targetorganisms. Subsequently, the working group dealing with small zooplankton decided that, in viewof the range of capabilities of the technologies under discussion in the group, they should alsoconsider organisms at least as large as the smaller euphausiids. The group charged with examiningthe potential for integrating acoustical and optical sampling technologies dealt with all sizes andgenera for which those techniques appeared to be appropriate.
5
2. Fisheries Acoustics
Chair: Jim TraynorRapporteur: Gordie Swartzman
Participants: Lee Culver, Steve Brandt, Len Zedel, John Simmonds, Ken Foote, Steve Clark, PatTwohig, Charles Thompson, Bill Michaels, Janusz Burczynski
2.1 Scientific Context
The Fisheries Acoustics Working Group addressed how fisheries acoustics techniques canbe applied to answer questions important to accomplishing GLOBEC objectives. The list belowincludes the questions posed and potential acoustic techniques for addressing these questions.
Does a change in ocean environment result in a change in fish distribution and migration?
Echo integration was considered the most important technique for studying fishdistribution. For fish distribution studies near physical phenomena such as ocean fronts, vesselsurveys must extend over sufficient distances to describe the distributional (vertical and horizontal)characteristics at an appropriate scale to characterize each environment. To facilitate scaling of echointegration information, target strength data should be collected when possible. The group felt that,in most marine situations, it is dangerous to scale echo integration results by simultaneouslycollected target strength data because of limitations in target strength measurements related to thestringent conditions required for target strength measurement procedures. Because the interactionbetween fish species and other trophic levels is going to be important to many GLOBECquestions, multiple frequency instruments are recommended. Frequencies commonly used forecho integration systems include 38, 120, 200, and 420 kHz. We recommend their use, if possible,because information about target strength for many species is available at these frequencies. Someapplications which can tolerate lower accuracy in the estimation of density can benefit from the useof sonar, providing better horizontal detail of the spatial distribution of fish schools. In addition,sonars may be used to locate and track the movement of individual fish schools.
Does a change in the ocean environment affect early life history processes (e.g., larval drift,larvae distribution)?
Investigations of early life history (larvae/post larvae) require measurements of size andspatial distribution using multiple frequency systems. Ship-mounted systems can be used forstudying short-term variations in distributions over larger areas. Moored systems are appropriatefor studies of temporal changes in density at a few key locations over longer time periods. Werecommend that multiple frequency systems be developed to assess larval and post-larval fishscatterers.
Does a change in the ocean environment result in changes in species overlap and resultantinteractions (e.g., predation processes)?
When a fish predator and its prey are in the same area, the acoustic system must be able toassess a wide range of target sizes. For example, if the larval stage has a mature fish predator, theacoustic system must be capable of obtaining absolute density estimates for both groups. A
6
multiple frequency system (either echo integration/target strength measurement system, or amultiple frequency system using an inversion technique) should provide more appropriateinformation. As discussed above, fish schools may be tracked through prey density fields to studylocal interactions (e.g., predation rates).
How is fish behavior and physiology affected by changes in environmental conditions?
Throughout the studies of fish and their relationship with their environment, informationabout the behavior and physiology of individual fish will be important, particularly sinceGLOBEC is interested in making process-oriented measurements at the level of individualorganisms. Acoustic tags can be used for the study of fish depth, orientation, swimming speeds,and physiology over time. In addition, doppler sonar systems can be used to study swimmingspeed of both individuals and schools of fish.
How accurate are the various sampling devices (including acoustics)?
Any sampling technique may be affected by the presence of the vessel or samplingequipment. Nets are often used to obtain biological samples. Acoustic apparatus can be used toinvestigate the possibilities of bias when using nets. For example, sonars mounted on top of thetrawl have been used to observe avoidance near the trawl. Body-mounted or vessel-mountedsystems have been used to observe avoidance that occurs in front of the trawl or in reaction to thepassage of the vessel. Remote, free-floating systems have been used to demonstrate avoidance ofthe vessel by fish, affecting both echo integration and trawl survey results.
2.2 Status of Instrumentation for Fisheries
The working group proceeded to discuss: 1) equipment that was available off the shelf; 2)equipment that was available by modifying existing equipment; 3) new technology needs; and 4)new experimental studies necessary to accomplish GLOBEC objectives relative to fisheriesacoustics.
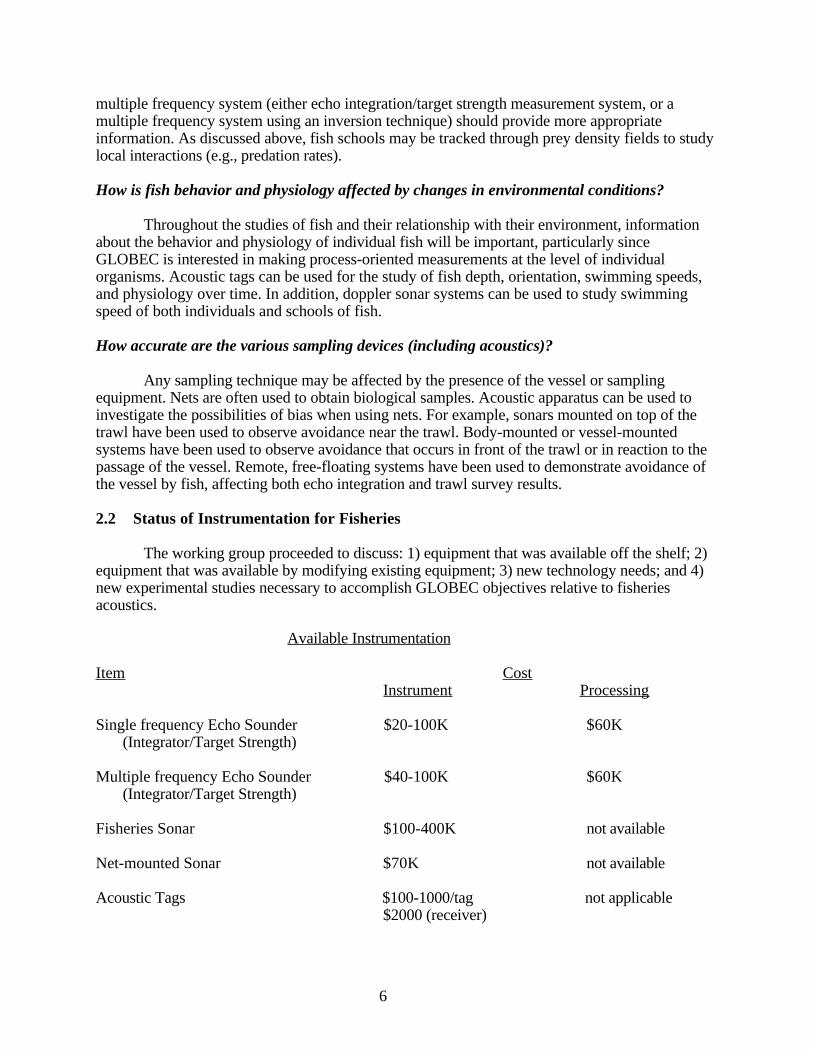
Available Instrumentation
Item CostInstrument Processing
Single frequency Echo Sounder $20-100K $60K (Integrator/Target Strength)
Multiple frequency Echo Sounder $40-100K $60K (Integrator/Target Strength)
Fisheries Sonar $100-400K not available
Net-mounted Sonar $70K not available
Acoustic Tags $100-1000/tag not applicable$2000 (receiver)
7
a. Modifications to Existing Equipment
The working group identified commercially available sonar systems as candidates formodification to make them suitable for measuring fish distribution. The signals in most systemsare modified using an automatic gain control. Although this procedure facilitates and enhances thedisplay capability of such systems, it removes the ability to reference to absolute echo intensity. Itshould be relatively easy to modify these sonars to allow measurement of absolute echo levels, fordetermining fish density estimates, providing the appropriate scaling data can be obtained.(Approximate cost: $25-100K, 1 year development time.)
b. New Technology Needs
The working group identified a critical need for algorithms and computer software to aid inprocessing, analyzing, and displaying acoustic data from multifrequency echo integration andsonar systems. Several multifrequency systems are currently in use in the community and moreare under development. However, their ability to produce data is currently far greater than thecommunity is able to digest. Methods and software have not yet been developed to quickly extractdesired data from a group of pings or compare echo characteristics across frequency. Data storageschemes have not been standardized. The need for sophisticated and standardized data analysis,display, and archiving schemes is urgent. Without them we are in danger of being swamped bymore data than we can comfortably digest and interpret. (Approximate cost: $1,500 K over 1 to 5years.)
For some studies, the use of a number of single frequency, autonomous echo rangingdevices, mounted on the bottom or looking horizontally from vertical moorings, may beappropriate to answer particular research needs. (Approximate cost: $200 K over one year for a tentransducer system.)
As mentioned above, doppler sonar may be appropriate to answer some behavioralquestions. (Approximate cost: $200 K over one year.)
c. Experimental Study Needs
Fish target strength measurements as a function of tilt angle, depth, size, and behavior willbe needed for fish species of interest to GLOBEC. This is an ongoing need for any programinvolved with the estimation of fish density using echo integration techniques. It is also imperativeif investigators plan to attempt size estimation using target strength data. (Approximate fundingrequired, $800 K over 3 to 5 years).
There is an urgent need to develop acoustic classification techniques (species and sizeidentification) using echo signatures at single frequencies, multiple frequency echo intensity andtarget strength information, and other acoustic information from individual fish or fish schools.(Approximate cost: $500 K over 3 to 5 years.)
Since many of the processes that GLOBEC is interested in may occur near the bottom,attention should be paid to developing improved techniques for assessing fish near this boundary.(Approximate cost: $500 K over 3 to 5 years.)
Another need discussed was for studies of the relationship between fish larvae feeding andwater turbulence. (Approximate cost: $200 K over one year.)
8
3. Macrozooplankton/Micronekton Acoustics
Chair: Tim Stanton
Participants: Steve Bollens, Dezhang Chu, Clarence Clay, Chuck Greene, Charles Greenlaw(briefly), Lee Gordon, Roger Hewitt, Van Holliday (briefly), Bob Miyamoto, Dave Potter, DougSameoto, Yvan Simard, Sharon Smith, Peter Wiebe, Alan Wirtz.
3.1 Introduction
Animals ranging in size from approximately 0.5 to 5.0 cm were considered in this workinggroup. This range overlaps with the sizes discussed in the small zooplankton group, and hence,there will be overlap of the sonar frequencies used to study the two classes of animals.
Acoustical methods can support several major science objectives involving themacrozooplankton and micronekton studies within GLOBEC. In general, the acoustic techniquescan help quantify the spatial and temporal distribution, abundance, and associated size distributionof the macrozooplankton and micronekton, and their predators. By varying the deploymentscheme, acoustic methods can be used in studies examining biological processes in ship, Eulerian,and Lagrangian coordinate systems. Acoustic techniques can be used to examine populationgrowth, mortality, and physical dispersion. It should be stressed that the acoustic techniquesshould be used simultaneously (when possible) with other methods involving: 1) nets and pumpsfor direct species identification; and 2) measurements of physical properties of the ocean such assalinity, conductivity, temperature, etc. for quantitative tests of coherence.
The complexity of the biological processes that need to be measured require a variety ofsonar* configurations and deployment schemes. Much time was spent discussing theserequirements with the recommendation that versatile modular sonars be developed that can bedeployed in many ways. In order to improve reliability and simplicity, the sonars should have asmany identical components as possible.
3.2 Overview of Sonar Techniques
A variety of techniques are available which affect the design of sonars and theirdeployment. The techniques can be split into two broad categories: one beam per frequency, wheremore emphasis is on the statistical interpretation of the echoes; and multiple beams (2 or more) perfrequency, where more hardware is involved so that direct measurements of target strength areobtained when the animals are resolved as individuals. The "split-beam" sonar is placed in thislatter category. The output of this phase-sensitive system provides both range and arrival angle ofechoes from individually resolved animals.
* In this working group report only, the term "sonar" is used generically to indicate an acousticsystem. This is in agreement with the original, broad sense of the term (See Glossary). Inunderwater acoustics, this is often the practice, as opposed to the general usage in fisheriesacoustics (hydroacoustics). In fisheries acoustics, "sonar" usually refers to horizontal echo rangingwith an active acoustical system. In underwater acousfics, the term would include vertical echosounders and passive acoustic systems, as well as horizontal detection and echo rangingsystems.

9
All methods assume the availability of an acoustic scattering model for the transformationof echo data from voltage levels to estimates of animal size. When individual animals are notresolvable by sonar, an inversion of multifrequency, volume scattering strength data cansometimes produce an estimate of the size-frequency distribution. The assumed scattering model(or models) are implicit in the inversion algorithm. The inversion method will only work when thetransition point between Rayleigh and geometric scattering is within the range of frequencies usedin the acoustic system. For frequencies typically used in the assessment of macrozooplankton (10'sto 100's of kHz), the inversion method would only apply to populations involvingmacrozooplankton of a few centimeters in size or smaller.
When the individual animals are resolved, deconvolution, dual-beam, and split-beammethods can be used to produce distributions of echo amplitude or target strength. With the use ofan appropriate scattering model, that data can then be used to estimate size-frequency distributions.When individual animals are not resolved, systems involving the deconvolution, dual-beam, orsplit-beam methods can produce echo integration data, scaled by target strengths of individuals(perhaps measured at a nearby location where the animals are similar), to estimate biomass.
The advantages of the different methods were discussed. Clearly, when individual animalscan not be resolved, echo integration techniques need to be used. One beam per frequency issufficient in that case. If the individual animals can be resolved, tradeoffs arise between the use ofone beam and multiple beam per frequency systems. One beam per frequency systems requireless hardware per frequency, but more effort in the development of processing algorithms.Whereas, multiple beam per frequency systems require more hardware per frequency, but lesseffort in the development of algorithms. We concluded that comparative studies between theapproaches should be conducted as soon as possible.
a. One Beam per Frequency
Two inversion techniques have been developed for extracting animal size information fromacoustic backscattering data. One uses a multifrequency sonar, the MAPS (MultifrequencyAcoustic Profiling System; Holliday et al., 1989; Pieper and Holliday, 1984), while the other,which involves a deconvolution, can be used on single frequency or multiple frequency systems(Clay, 1983; Stanton and Clay, 1986). Both methods involve "accepting" scattering data from theanimals in all parts of the acoustic beam. The MAPS is particularly successful when individualanimals are not resolved. It can, however, work equally well in a uniform distribution of resolvedtargets, if given enough time at each point in space. Beam effects are taken into account once thedata are averaged. The deconvolution approach requires that the individual animals be resolved.Beam effects are removed from the data using this technique and the result is a set of echoamplitude histograms. Both techniques rely on applying mathematical inversion methods in thepost-processing software. While the software that contains the algorithms currently resides in thelaboratories of Holliday, Pieper, and Clay, the math is well known (Lawson and Hansen, 1974;Holliday, 1977; Leih and Holliday, 1982; Clay, 1983) and is standard in other disciplines such asseismology.
The MAPS technique has been used in a number of field studies involving zooplanktonwhile the deconvolution technique has been applied almost exclusively to echoes from larger sizedtargets such as fish. The latter method has been used at least once to extract zooplankton sizedistributions from echo data (Stanton and Clay, unpublished). The agreement between size
10
distributions estimated acoustically and from net/pump collected samples has been veryencouraging with both acoustic methods.
b. Multiple Beams per Frequency—Target Strength Estimation Techniques
Two techniques have been developed to directly estimate the target strengths of fish: thedual-beam technique (e.g., Ehrenberg, 1974; Traynor and Ehrenberg, 1979); and the split-beamtechnique (Ehrenberg, 1979; Traynor and Ehrenberg, in press). The methods involve comparingthe outputs of each of the two (dual-beam) or four (split-beam) beam channels so that the targetstrengths can be determined directly. While both methods were originally developed for detectionand quantification of fish schools, the dual-beam technique has recently been used in studies ofzooplankton and micronekton (Richter, 1985a,b; Greene et al., 1989; Wiebe et al., 1990), and asplit-beam system has been used to study deep-sea micronekton (Smith et al., 1989). Recenttechnological advances in the dual-beam technique have made it feasible to analyze in situ thesingle echoes returning from individual zooplankters as small as several millimeters. Finally, it isimportant to stress that, although the dual- and split-beam systems produce a single value of targetstrength for each echo, the target strength is highly variable with each animal. This variabilitymandates the collection of a statistical ensemble of echoes for the animals to be studied. For agiven sampling volume, the same number of pings are required for all methods, single or multiplebeam.
3.3 Overview of Acoustic Sampling Methods
The design of acoustic measurements is tied intimately to the length of the organismrelative to the acoustic wavelength and the density (number/unit volume) relative to the resolutionof the sonar. The specific instrumentation packages and deployments change for the different sizesand densities (number/unit volume) of objects and biological processes being studied. Because ofthe wide variety of organism sizes (including predator and prey) and their spatial and temporalvariability, there is no standard mode of deployment or commercially available sonar system thatcan meet all GLOBEC science objectives concerning macrozooplankton and micronekton. Wetherefore recommend the following sonars with a variety of deployment modes.
a. Modes of Deployment
The following three deployment modes are recommended as particularly useful inGLOBEC studies.
Ship-mounted or towed survey systems
This system would provide survey data during transects taken in conjunction with physicalmeasurements of the ocean (CTD, etc.). These data could loosely be called "synoptic". Weconcluded, however, that given the finite amount of time it takes to conduct a transect, the featuresmay change enough so that the data are not a true acoustic snapshot of the region, hence theterminology "survey".
Ship-based cast or tow-yo systems
These systems, deployed from the ship, would provide a data set to complement thesurvey by providing a closer look at the organisms via the cast or tow-yo methods. Higher spatial
11
resolution is obtainable in this mode. Furthermore, by use of a side scan configuration at thedeeper depths, one can measure horizontal spatial distribution.
Remotely deployed systems
These systems would involve a sonar(s) mounted on freely drifting buoys, freely driftingneutrally buoyant platforms, remotely operated vehicles (ROV's), bottom mounted/mooredplatforms, or yo-yo platforms (standalone systems that periodically move up and down in thewater column). The drifting systems address the requirement for performing times series analysisin Lagrangian coordinates while the latter two conduct times series measurements in Euleriancoordinates.
The details of the above modes of deployment will be discussed in later sections in thecontext of the acoustic measurements.
3.4 Recommendations for Sonar Design
We envision a number of sonars for eventual use in the GLOBEC program. In order toimprove on the reliability and flexibility of the systems, we recommend that most components ofthe above sonars be modular and identical. Naturally, the remotely deployed systems requirechanges in power and sampling strategies. The sampling or ping rate, for example, could be aprogrammable feature.
The various functions of the sonars such as logic or transceiver electronics should beconstructed on separate electronic "cards" that plug into a card cage or rack. The size of the cageand number of cards would depend upon the number of frequencies used. The sampling strategyor sequence of pings that is specific to the particular sonar configuration, deployment, andbiological process can be programmed into the logic card that all systems would have in common.For example, a shipboard survey system may be acquiring data on all sonar channels continuouslyand simultaneously, hence requiring a continuous supply of power. Because of power constraints,the remotely deployed Systems would need to turn off automatically between pinging sequences.As a result, the system would be turned off most of the time to minimize depletion of batterypower. There would be a difference in power supply sections of the cages depending upon whetherthe system would receive AC shipboard power or DC battery power in a remotely deployedsystem.
We listed all commercially available sonars and came to the conclusion that no suchsystem as described above exists. Furthermore, there is no system available that could be easilymodified to fulfill the needs of the GLOBEC program. The system that comes closest to meetingthe needs of this program is one currently under development by Clay at the University ofWisconsin (NSF funding). It is modular and can provide acoustic signals at a variety offrequencies, although it requires AC power. As a minimum, the system would need to bemodified so that it could: 1) accept DC power at low consumption rates (e.g., by use of low powerintegrated circuit components); and 2) have adaptive sampling modes to allow for variablesampling schemes that depend upon the available power. With all of these factors included, werecommend that a sonar system be developed, with attention initially being paid to the design ofprototype systems, such as that under development at the University of Wisconsin.
Since deployment of sonars are specific to each biological process under investigation, we

12
recommend that the "platform" for each type of deployment be addressed on a case-by-case basisby the user (science P.1.) and be built by, or subcontracted to be built for, the user.
a. Acoustic Frequencies
It is clear from the scattering behavior of animals, that in order to discriminate various sizesof the animals, one must use a broad range of frequencies. Practical limits on the size oftransducers provide the lower limit of frequency, while absorption of sound determines the upperlimit of frequency. We recommend frequencies between 38-420 kHz be used. These end pointscorrespond to the frequencies of systems that are available commercially. Although the systemdescribed here should be built from the ground up, we recommend that some of the frequencies beidentical to those of off-the-shelf units to allow comparisons between historical data and datacollected with the new system. The number of frequencies required depends upon interpretationmethods used and power requirements (when the units are remotely deployed). We recommendthat a minimum of 3 frequencies be used and a maximum of approximately 8-10.
b. Sonar Resolution
Since animals may sometimes occur at densities much greater than one per cubic meter, itis not practical for all sonars to be able to resolve individual animals in all situations. Somesystems under certain deployment schemes, however, should be able to resolve individuals so thatdirect estimates of density and statistical properties of patchiness can be made.
c. Survey System
Acoustical surveys from surface-deployed systems can rapidly map in three-dimensionsthe distributions of biological sound scatterers within large volumes of water Surveys such asthese can be used to assess patchiness on the scales of 10's to 100's of meters, the spatio-temporalcoupling of predator and prey populations, and the effects of physical and topographic features onanimal distributions.
This system, as well as the use of other remote sonar systems, could provide water columnacoustic data (echograms) during transects and help direct the location and timing of "point"sample methods (nets, etc.) The echogram would also help place the various point measurementsinto the context of the complex ocean structure during later analysis. The system would includethe maximum number of acoustic frequencies, store massive amounts of raw data at high speed,and provide high quality acoustic data for sophisticated interpretation.
We recommend that the system be operated at fixed depth with the option of being loweredto depths near scattering layers to examine the layers at higher resolution. All sonars on the towbody should transmit their signals simultaneously (as opposed to sequentially) and the echoesshould be acquired simultaneously so that the various echoes can be associated with the samesampling volume. The beamwidths should be similar or identical to help achieve this goal. Theapproach of using simultaneous transmissions and acquisition also minimizes the time betweenacoustic transmissions for each frequency and allows for maximum resolution of the patchstructures.
d. ROV, Profiling, and Towed Systems
While the survey system can provide a picture of the distributions of the sound scatterersover a large volume of the ocean, much of the data collected represents organisms located at great

13
distance from the sonar. The spatial resolution of each sonar decreases with increasing distancefrom the sonar, and as a result there is a loss of the lower end of spatial scale that can be measuredat those ranges. The survey system can occasionally be lowered to increase the resolution, but thismay result in the loss of survey data. We recommend that other sonars be deployed in or near aregion of scatterers in order to improve the spatial resolution of the measurements.
There are a variety of platforms that can be used to deploy sonars from a ship --submersibles, remotely operated vehicles, vertically profiling instruments (e.g., MAPS), towedvehicles (e.g., Batfish, MAPS, V-fin, etc.), nets (e.g., MOCNESS or BIONESS), and trawls. Thefirst few platforms can be used to acoustically explore concentrations of interest while deploying asonar on a net or trawl, thereby providing some degree of ground truth and species identificationinformation in concert with the acoustical data set.
e. Free-Drifting Buoy and Bottom Mounted/Moored Systems
Measurements need to be performed in coordinate systems besides that of a ship. It isimportant to study distributions of animals at fixed locations (Eulerian) and on platforms that areallowed to drift with the flow of the water (Lagrangian).
The changes in acoustic scattering levels at the proposed GLOBEC study sites will vary ontime scales ranging from daily to seasonal to yearly. While in some of these areas the generallevels of volume reverberation are predictable to some extent, the biological and physical factorswhich affect the levels are not well understood. As a result, the reverberation levels are notsufficiently predictable. Most studies of acoustic backscattering in the oceans have been conductedfrom ships which limit the duration, areal coverage, and vertical extent of the data. Autonomousfree-drifting buoys and bottom mounted moorings can solve this problem. They should beequipped with echo sounder electronics and transducers, a digital signal processor, data storage,and satellite and radio communications systems. These systems can be used to periodically andfrequently collect high frequency backscattering information (for example, 120 kHz and 420 kHz)from remote locations and relay the information to a ship or shore location in real-time. Becausethe systems are autonomous, with finite electrical energy and computer memory, the samplingstrategies must be carefully adapted to the biological process of interest to make the most of thosequantities.
Envisioned in both the surface free-drifting system and the moored instrument is anacoustic system which includes two or three frequencies which can be sequentially activated.Profiles of acoustic backscattering would be obtained at depth intervals (nominally 1 m) to amaximum range of operation which is frequency dependent (typically 10's of meters to ca 200 m).In order to adapt the sampling protocols to the phenomena being studied, the instrument packageneeds to be programmable so that a duty cycle of choice can be selected and echo sounderparameters such as pulse length and processing criteria can be altered. Data to be collected couldinclude individual target strengths as a function of range and average backscattering strength foreach depth interval. Data would be stored on a mass storage unit (e.g., an optical disk) in the buoyor mooring unit for post processing. Reduced data in the form of a target strength histogram, andintegrated intensity for a reduced set of depth intervals at each frequency averaged over some timeinterval (i.e., 2 hrs), would be produced for daily transmission via satellite to shore. Real-time,two-way radio telemetry should also be available.
Bottom mounted acoustic systems can be used to measure the acoustic scattering by
14
animals located at and near the bottom. Depending on the application, the systems could be used tolook vertically (up or down), horizontally, or at other angles. Because of the difficulty of bottominterference with measurements in the horizontal or downward directions, new acoustic techniquesmust be applied. These new techniques should utilize vertical split beams to resolve bottom versusnear bottom animals and make comparisons between pings to determine slight changes in theacoustic scattering due to bottom animals. This ability to measure macrozooplankton on, or veryclose to, the bottom will be an exceedingly important capability in areas such as Georges Bankwhere very large demersal shoals occur during the daytime. For maximum coverage of thesurrounding volume of water, one may consider mounting the sonar on a rotating vertical shaft sothat the region may be scanned much like a radar system (electronic steering via beamforming isalso a possibility, although the complexity of the electronics is increased).
3.5 Team Responsible for Acoustic Systems
The maintenance, calibration, refinement, and further development (especially of software)of the above acoustic systems is beyond the experience of most biologists and end users of suchsystems. Therefore, it is essential that a team of experts (2 or 3) in acoustics, electronics, andsoftware be assigned responsibility of ensuring that the system is calibrated and operating to theproper specifications before and after each cruise. This type of facility-level support is certainlyavailable in other disciplines, such as geoacoustics, where the operation and maintenance of the SeaBeam multibeam bathymetry system is provided.
Specific tasks of the team would include: 1) ensuring that the mechanical terminations ofthe cable and the various wire connections are maintained during the cruises; 2) developing thebasic software for recording and storing the data which would be modified to suit the varioususers; 3) matching the acoustic system to the different ships before each cruise; 4) responsibilityfor trouble shooting problems during the cruise; 5) maintenance and operation of the winch andcare of the tow cable and the towed body; 6) ensuring that acquired data is of the highest quality,and that the researcher is notified of any malfunction during the survey. This means that the teammust be responsible for data acquisition at all times; and 7) documenting the protocol forcalibration and maintenance so that changes in personnel will not affect calibration andmaintenance procedures.
The above mentioned responsibilities, which do not represent all of the anticipated tasks,are a consuming job and justify a dedicated team.
3.6 Format of Data/Data Management
Data must be archived and easily exchanged between programs to meet GLOBECobjectives. To facilitate this exchange we recommend the following actions. Data should bedigitized and in scientific units (e.g., m2, dB//µPa, etc.). The type of data should be explicitlydescribed (e.g., raw acoustic, biomass, target strength). All relevant information should be fused tothe data and should include synchronization of date, time, position, instrument values (e.g., samplerates, noise levels, bandwidths), calibration information, processing information (ping averages,bin depths), and any other ancillary information (temperature, salinity, etc.). Finally, a datainterchange format should be developed that will permit archiving and exchange of acoustic data.An interchange format is desirable since many commercial instruments will have proprietary dataformats and it is unlikely that one format can be defined for all data acquisition systems.

15
Data should be archived and merged with non-acoustic information at a central datamanagement facility. This facility is essential to maintaining information for the climatic time scaleexperiments.
3.7 Other Systems
While we recommend the use of the modular sonar approach described above, which canperform a suite of measurements under a wide variety of conditions, there are other systems thatshould be considered. These systems can provide types of data not otherwise obtainable.
a. 3-D Imaging Sonar
This planar sonar array can be used to produce three-dimensional images of the volume ofinterest. The "images" indicate the location of animals and their echo levels so that the spatialdensity and inter-animal separations can be directly measured. No indirect interpretation techniqueis required to provide such information. By tracking the animal through the acoustic beam andrecording the statistics of its time-varying echo levels, classification would be possible by use ofscattering models. This type of system is currently under development both at SIO (Jaffe) andWHOI (Stanton).
b. Acoustic Doppler Current Profiler
The Acoustic Doppler Current Profiler (ADCP) estimates water motion by measuring thefrequency of reverberation from different depths in the water column. In comparison to mostacoustic instruments used to study oceanic organisms, this instrument transmits very long pulsesso that the doppler shift induced by motions of the animals can be detected and resolved. Animplementation of this technology is commercially available from RDI. This system is usedroutinely to obtain estimates of water current profiles under the assumption that the compositemotion of the animals which dominate the sound scattering reflect the motions of the water mass.
The motions measured include both active swimming and passive advection. Researcherscould potentially use doppler information to study animal behavior, e.g., vertical migration. Aquantity related to volume backscattering strength can also be measured with currently availableADCP's. With absolute system acoustic calibration and careful attention to a variety of stabilityissues (Flagg and Smith, 1989a, 1989b), such information is potentially useful to biologicaloceanographers.
c. Passive Localization
While all of the above-mentioned techniques involve active acoustic methods in which aburst of sound is transmitted into the water and the resultant echoes are detected for localizationand classification purposes, one can also take advantage of the fact that some animals (fishincluded) generate their own sound. In particular, some species of fish generate sound during thetime of spawning. A grid of hydrophones could be used to pick up sounds from individuals orschools. Triangulation or even tomographic methods could then be used to estimate the location ofthe animals. Classification of animals by the nature of the sounds they make could be possible ifthe properties of the sounds that are generated by various species were known.
16
3.8 Summary of Recommendations
We must address the complex needs of the GLOBEC science objectives with a versatile set ofsonars and deployment schemes. This requires:
1) The development of a sonar whose components are modular and interchangeable sothat the same design can be used to meet all needs of the program. Ultimately a numberof duplicate system components would be constructed so that a variety of acousticsystems could be assembled;
2) The establishment of a facility(ies) where a permanent team of specialists maintains,operates, and refines the acoustic hardware and software. Such a facility would besimilar to what is available in other disciplines and would allow the user to concentrateon achieving the science objectives;
3) Use of other acoustic systems such as a 3-D imager, doppler profiler, or passivelocalizer to provide other forms of data; and
4) The establishment of data archive protocols to facilitate long term (10's of years) use ofthe data.
The development and construction of sonars with the attributes discussed above wasconsidered to be appropriate for inclusion within future "Calls for Proposals" from the GLOBECprogram.
Finally, it was agreed that any hardware associated with the deployment of the sonars suchas tow-body, drifting buoy, etc. should be treated on a case-by-case basis by the users in theirrespective science proposals.

17
4. Small Zooplankton Acoustics Working Group
Chair: Rick PieperRapporteur: Mark Ohman
Participants: Marvin Blizard, Jack Green, Charles Flagg, Van Holliday (briefly), Mark Huntley(briefly)
4.1 Introduction
The organisms addressed by this group were initially defined as those for which the fluidsphere acoustic scattering model is appropriate. We later extended this definition to encompasssomewhat larger, euphausiid-sized organisms.
A high priority was placed on developing multiple-frequency instruments thatsimultaneously sense several size classes of zooplankton. This resolution of body size is importantgiven that zooplankton growth rates and predator-prey interactions are known to vary with bodysize. The ability to interpret acoustic backscattering profiles, to understand behavioral differencesamong species, and to distinguish changes in marine ecosystem structure also require resolution ofacoustic backscattering into several size classes. Acoustic validation of population and ecosystemmodels will also require size class resolution.
4.2 Modes of Deployment
The mode of deployment for zooplankton acoustics instruments may vary with theGLOBEC study site. We discussed the advantages and limitations of both Eulerian andLagrangian techniques and agreed that a system must be sufficiently flexible to be deployed inseveral ways: 1) from surface ships on vertically profiling instruments, or on nets; 2) onmoorings; or 3) on drifters.
4.3 Priorities for Instrumentation Development
The following subjects pertaining to the development and acquisition of instrumentationand related basic research are considered appropriate for inclusion in future "Calls for Proposals"in support of GLOBEC science objectives.
a. Priority 1
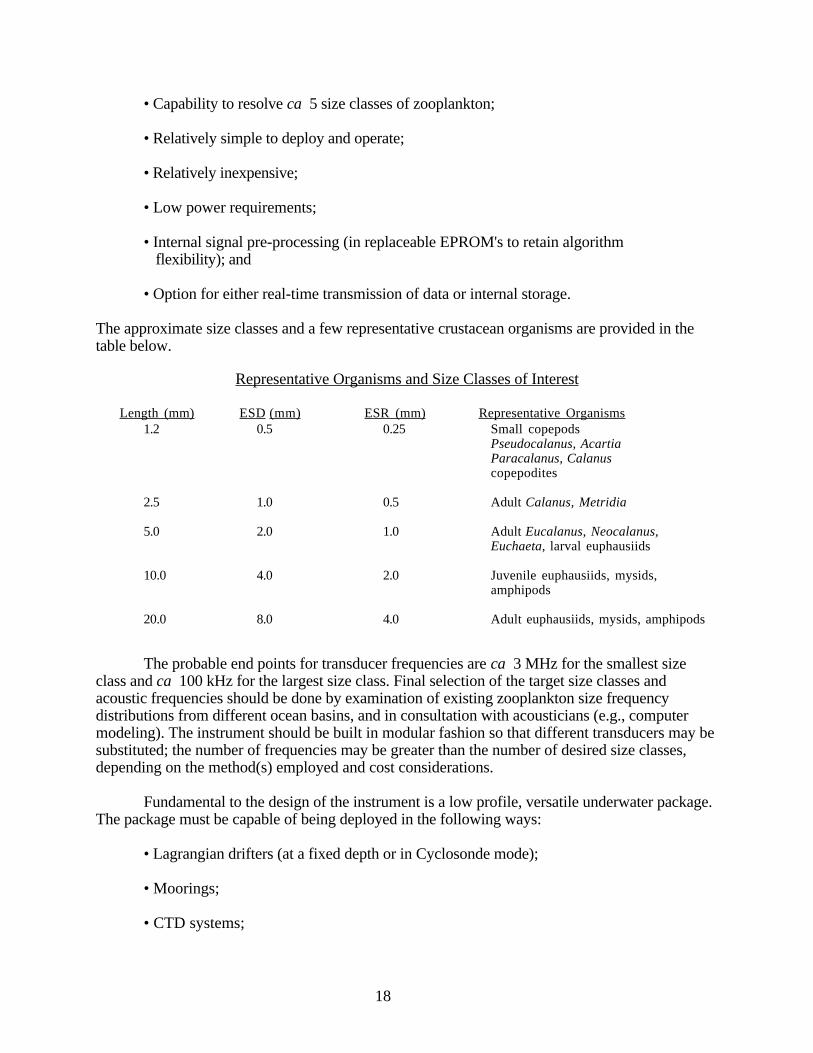
The highest priority was placed on the development of a single, standardized acoustic system toresolve multiple classes of zooplankton. Such a system must be sufficiently versatile to serve avariety of purposes and sufficiently inexpensive to allow deployment of several within one studyregion. The Working Group agreed that resolving ca 5 size classes of zooplankton in the sizerange of 1-20 mm in length would be useful for many purposes, while retaining the essentialattributes of instrument portability and low cost. The processed output from the instrument shouldbe either number of organisms per m3 or biomass of organisms per m3 in each size class. Thechief characteristics of such a system would include the following:
18
• Capability to resolve ca 5 size classes of zooplankton;
• Relatively simple to deploy and operate;
• Relatively inexpensive;
• Low power requirements;
• Internal signal pre-processing (in replaceable EPROM's to retain algorithmflexibility); and
• Option for either real-time transmission of data or internal storage.
The approximate size classes and a few representative crustacean organisms are provided in thetable below.
Representative Organisms and Size Classes of Interest
Length (mm) ESD (mm) ESR (mm) Representative Organisms1.2 0.5 0.25 Small copepods
Pseudocalanus, AcartiaParacalanus, Calanuscopepodites
2.5 1.0 0.5 Adult Calanus, Metridia
5.0 2.0 1.0 Adult Eucalanus, Neocalanus,Euchaeta, larval euphausiids
10.0 4.0 2.0 Juvenile euphausiids, mysids,amphipods
20.0 8.0 4.0 Adult euphausiids, mysids, amphipods
The probable end points for transducer frequencies are ca 3 MHz for the smallest sizeclass and ca 100 kHz for the largest size class. Final selection of the target size classes andacoustic frequencies should be done by examination of existing zooplankton size frequencydistributions from different ocean basins, and in consultation with acousticians (e.g., computermodeling). The instrument should be built in modular fashion so that different transducers may besubstituted; the number of frequencies may be greater than the number of desired size classes,depending on the method(s) employed and cost considerations.
Fundamental to the design of the instrument is a low profile, versatile underwater package.The package must be capable of being deployed in the following ways:
• Lagrangian drifters (at a fixed depth or in Cyclosonde mode);
• Moorings;
• CTD systems;

19
• Surface vessels; and
• MOCNESS/BIONESS towed net systems.
The instrument should have an internal built-in-test capability to verify the stability of theelectronics and should also be calibrated periodically (e.g., annually) at a transducer calibrationfacility.
Flexible post-collection data processing software should be developed in conjunction withthe acoustic device. This software should permit data to be aggregated in variable bin sizes; meansand standard errors computed by depth, time, or scan; contouring; and plotting of vertical profiles,sections, and time series plots. The software should have "open architecture" to allow othervariables (e.g., fluorescence, CTD, or thermistor data) to be processed in a similar manner andshould accommodate user customization (e.g., flexible database structure).
Procurement Considerations and Timing
The development and construction of an acoustic instrument with attributes similar to thosediscussed above were considered to be appropriate for inclusion within future "Calls forProposals" from the GLOBEC program. In order to have a maximal impact on GLOBEC science,development of this instrument should strive for prototype completion within 18 months,including comparisons with pump and net zooplankton samples. Potential manufacturers for theproduction instrument should be identified as early as possible. The manufacturer(s) should beencouraged to vigorously pursue construction and marketing. The advantage of such an instrumentto a manufacturer is the establishment of a "standard" instrument with a worldwide market. Twoof the operational advantages of this instrument to the scientific community are the broad base ofuser knowledge and the ability to compare results between study sites.
Other considerations
We recognize that gelatinous zooplankton (e.g., salps, larvaceans, medusae, ctenophores)can dominate marine zooplankton assemblages. In some cases, they do so as transients in rapidpopulation bursts. Better methods are needed to acoustically distinguish gelatinous organismsfrom non gelatinous. Experimental study of target strengths and unique acoustic signatures ofthese organisms are needed.
We recognize the need to sample eggs, nauplii, and juvenile stages of many species ofzooplankton. We recommend that acoustic methods be compared to other methods for achievingthis. If sensor costs imposed by the need to offset the extreme acoustical attenuation at highfrequencies substantially increase the overall system cost, then sampling these smaller organismsmight best be done with optical measurements (e.g., High Definition TV) in combination with theacoustic instrument described here.
We underscore the need for collection of pump and net samples to collect "ground truth"data, (e.g., species identification) for the acoustic instrument. This will necessitate accelerateddevelopment of rapid, automated means to enumerate and identify zooplankton samples.
b. Priority 2
Swimming speed of zooplankton is a critical parameter for prey-predator encountermodels. Swimming speed is also useful for understanding vertical migration behavior and may
20
help identify the organisms in specific acoustic size classes. We recommend using dopplershift/spread from swimming zooplankton to estimate swimming speeds of organisms in situ.High frequencies (ca 3 MHz) will likely be most useful for this purpose.
The doppler shift due to swimming zooplankton can be obtained by Fast FourierTransform methods (among others). Changes in the average doppler shift and the dopplerspectrum width of volume reverberation from a volume of water may indicate the mean andextreme swimming speeds of a group of zooplankters. Relatively straightforward modifications tothe Priority 1 instrument should permit the doppler parameters to be measured, combiningmeasurements of zooplankton abundance with measurements of zooplankton swimming speeds.
c. Priority 3
A low-cost Expendable Acoustic Profiler (EAP) could be a useful tool to aid in conductingrapid surveys. Deployment of EAP's from ships-of-opportunity, or possibly aircraft, wouldincrease spatial and/or temporal coverage of more isolated study sites. EAP's could also enable alarge-scale region to be mapped prior to conducting more detailed sampling. Although there wasnot unanimous agreement on the utility of this instrument, some working group memberssupported development of an EAP capability. EAP's might be manufactured with a variety ofsingle frequency transducers.
4.4 Development of Backscattering Models and Bioacoustical Instruments
The working group concentrated its efforts on the specifications and need to develop asimplified, standardized acoustic system for use by the general community of researchers. We alsorecognize and support the need to refine and improve acoustic backscattering models andinstrument design. In conjunction with the simplified system described above, we support thecontinued development of more sophisticated multi-frequency acoustic systems, along withacoustic scattering model development, for advanced research and development.
21
5. Acoustical and Optical Sensor Integration
Chairman: Peter OrtnerRapporteur: Lewis Incze
Participants: Charles Barans, Mark Berman, Cabell Davis, Brad Doyle, Charles Greenlaw, AlexHerman, Van Holliday (briefly), Mark Huntley (briefly), Jules Jaffe, Gus Paffenhöfer and RudiStrickler
5.1 Scientific Context
GLOBEC intends to study the population dynamics of key species and the processescontrolling their abundance in a variety of marine ecosystems. The first field program will studyGeorges Bank and will focus, at least initially, on the copepod Calanus finmarchicus and on theearly life history of cod, Gadus morhua. Virtually all biological rates are assumed to bemodulated by physical conditions and motions. The influence of physics on biology occurs over awide range of spatial and temporal scales. The population-level response of Calanus on GeorgesBank depends upon, among other factors, the spatial extent, seasonal timing, frequency andamplitude of external forcing from atmospheric weather, oceanic anomalies (e.g., Gulf Streamrings), cross-bank advection, and the migrations of predator populations (e.g., fish). The goal ofGLOBEC is to understand, and ultimately to predict, population changes by determining (fromfirst principles) the processes affecting variability in population abundance. That is, GLOBECseeks to understand the combination of physical and biological interactions affecting reproduction,distribution, and mortality of selected taxa. This requires identification and documentation ofsmall-scale processes and distributions and then quantitative linkage between these processes andlarger-scale forcing functions.
5.2 Working Group Deliberations
Members of the working group agreed that the following observation problems wouldhave to be resolved to meet GLOBEC's stated goals.
a. Distribution
• We must be able to describe a population's distribution pattern quasi-synoptically at lowresolution and with high spatial and temporal resolution at critical points within thiscoarse field pattern. Therefore, we must be able to rapidly assess and identify selectedtarget species.
• We must be able to follow a study unit of the population through time, studying itsstructure in three dimensions as its dynamics affect organism-organism interactions.
b. Scale Linkage
We must discover and document whatever linkages exist among the various temporal andspatial scales in order to relate small-scale processes (those affecting the individual) to populationlevel responses. We must understand how these various time and space scales are mechanisticallyconnected and must design appropriate observational techniques to obtain the necessary data tovalidate models of population response to climatic conditions.
22
c. Processes
We must be able to measure relevant biological processes and understand their variabilityamong individuals under different conditions at spatial and temporal scales relevant to theparticular process. Such processes include grazing, predator/prey interactions, and mating andreproduction. We felt our principal task was to consider whether, and to what degree, anintegration of biooptical and bioacoustic sensor technology could address these problems and howthey might be addressed realistically given the state-of-the-art and the prospects for advances insampling technology.
As an initial exercise we attempted to specify, a priori, what reciprocal benefits could beobtained by merging technologies or obtaining complementary data. From the viewpoint of bio-optical system users, bioacoustics could fill the following needs:
1) Provide a spatial map of the broad scale distribution of selected taxa and pinpoint features ofinterest for fine-scale process studies;
2) Provide data on vertical migrations;
3) Provide data on larger-scale three dimensional structure;
4) Make it possible to track a group of organisms over periods enabling a series of processstudies to be made;
5) Provide doppler measurements of swimming speeds and statistics on population behavior(e.g., number swimming up/down/not at all); and
6) Provide information on larger, rarer organisms that might constitute predators upon organismswhose interactions are being studied with current bio-optical systems.
From the viewpoint of bio-acousticians, bio-optics could fill the following needs:
1) Provide information on target orientation;
2) Provide independent size distribution estimates perhaps as transect sample series data (e.g.,utilizing current towed platforms like UOR, SeaSoar, or Batfish) within a bioacoustic map; and
3) Provide taxonomic identification of bioacoustic targets.
All participants agreed simultaneous sampling with traditional sampling devices (nets,pumps) was still essential since no single method was sufficient, and confidence in accuracy couldonly be obtained by using independent methods and ascertaining the degree to which theirestimates converged. All participants agreed that GLOBEC's objectives implied concomitantphysical (temperature, salinity, and current) data collection. Quite likely physical, bio-optical, andbioacoustical methods would have to be integrated to obtain estimates of micro- and fine-scaleturbulence and its effects on behavior and organism-organism interactions.
Current bio-optical methods sample in close proximity to the sensor. Bioacoustic methods

23
sample on nearly the same scale but can also sample larger water volumes much further awayfrom the sensor. At these large scales bioacoustic methods sacrifice resolution. This loss, however,may not be the greatest problem to be faced in linking various scales. The group felt the moredifficult problem will be confidently linking 1 mm to 1 cm individual organism behavioral scalesto 100 m to km subpopulation scales. Last, although we felt the scale problem was likely to be aprimary issue in the Fisheries Acoustic Working Group, the participants recognized that whileGLOBEC is focusing on key species in the plankton the bioacoustic survey systems used willhave to encompass the lower frequencies necessary to sample larger organisms such aseuphausiids and fish.
d. Available Technology
Prior to detailing specific recommendations the group enumerated promising bio-optical orbioacoustic technologies and instruments and tried to characterize their relative costs andavailability. We described the following general groups.
Some instruments holding promise for GLOBEC are currently available off-the-shelf forcomparatively moderate cost. These include the following devices:
1) Optical Plankton Counter (laboratory or towed) - A towed or profiling sensor used tocount and size zooplankton in the 0.25 mm - 3.0 cm range. It was developed by A.Herman of the Bedford Institute and is commercially available from Focal Technology,Inc.;
2) CritterCam [R] (laboratory, lowered on a cable, mounted on a submersible or a ROV) -This camera system using an IR diode laser was developed by J.R. Strickler. It iscommercially available from LNG Technical Services;
3) ADCP Backscatter (vessel mounted or moored) - Software and hardware are nowcommercially available for this purpose from RDI, Inc. The method was described inthe literature by C. Flagg and S. Smith;
4) Commercial Echo Integration (dual- or split-beam on towed bodies or vessel mounted)- Dual-beam systems at various frequencies currently are available from variousmanufacturers including BioSonics, Inc. Results using these systems to samplemicronekton have been published by C. Greene and P. Wiebe. Split-beam systems areavailable from Simrad.
Other instrument systems require modification or adaptation to be applicable to GLOBECproblems. Others have only been developed as prototypes in certain laboratories. As a result thesewill likely cost more money to bring on-line. These include the following instruments:
1) Moored: OPC, CritterCam [R] (video systems or serial plankton recorders) - The OPCsystem that might be used in this application is under development and is substantiallydifferent from that commercially available today. A plankton recorder of this type hasbeen developed and used at WHOI (C. Butman). Field trials with a mooredCritterCam[R] are planned for the fall of 1991;
2) Video Plankton Recorder (VPR) - A towed video camera system under development at
24
WHOI. It is intended to sample on centimeter scales over many kilometer transects;
3) Plankton Image Analyzer- A device developed at URI/NMFS-Narragansett toenumerate samples of zooplankton or their recorded images and classify individualsinto taxonomic groups;
4) Simple Multiple-frequency Systems- Systems of this type are under development at anumber of institutions. A prototype of a fully modular quantitative echo-integrationsystem employing up to six frequencies, and capable of real-time data analysis anddisplay, has been deployed on MOCNESS and in situ plankton cameras byNOAA/AOML and Tracor investigators. Development is also underway on suchsystems in Norway (Dalen), at BIO in Canada (Sameoto), and at the University ofWisconsin (Clay);
5) Commercial ROVS with Bioacoustic Imaging/Location Systems - (Greene et al.,1991).
6) High Resolution "Shadowgraph" Side-scan Sonar- A system of this type was used byC. Barans and V. Holliday to sample large demersal fish species.
The final category includes systems or methods that are likely to be costly either initiallybecause of large research and development commitments (although the individual units eventuallymay be produced at moderate cost), or because they are inherently complex and likely to remainexpensive. For the latter group a "facility" model of operation and maintenance may be required.
1) Major Research and Development Projects
• Improve video image analysis from broad taxa to species level identification; and
• Provide visual verification of bioacoustic sampling of large fish to attain species-level identification.
2) Potential Facilities
• Laser range-gated imaging-- Such a system is under development at MBARI andis theoretically capable of resolving millimeter scales at distances of many meters;
• Holographic imaging;
• Confocal imaging;
• 3-D bioacoustic imaging- Such a system is under development at SIO/MPL andWHOI, and will resolve three dimensional structure in zooplankton communitiesat distances of tens of meters; and
• Multifrequency Acoustic Profiling System (MAPS)- This system was developedseveral years ago by Holliday and Pieper. It employs 21 individual transducersranging from 100 kHz to 10 MHz to generate size frequency distributions in 21independent size classes.

25
5.3 Specific Recommendations
Integrate bioacoustic and bio-optical sampling technology so as to reduce the ambiguityinherent to purely bioacoustical measurements.
Without target identification bioacoustic measurements of the biota will not provide theinformation required by GLOBEC. Optical data can efficiently provide much of the requisitecalibration data (including e.g., target orientation information). In addition to these bio-optical datatraditional sampling will be required to ground-truth indirect methodologies. Such integrationcurrently is being pursued and needs to be more explicitly emphasized as especially fundamental toGLOBEC.
Utilize bioacoustic sampling to extrapolate bio-optically based process information to largertime and space scales.
Video and camera information on organism behavior and feeding are typically obtained on smallsample volumes over comparatively short time scales. By nesting such experiments inside larger-scale bioacoustic maps the results can be generalized to the regional or population level.Develop bioacoustic and bio-optical techniques that provide information within a 1 m3 volumeto characterize processes operating on scales <1 cm.
At the present time no such systems are readily available but are considered to be essentialto GLOBEC's fundamental process orientation given the size of the target organisms selected.Both technologies can resolve targets on these scales and would be employed most fruitfully inconjunction with one another.
Develop processing and analysis technology to the point where population distributions oftarget organisms can be visualized in near real-time.
Without such advances it will be impossible to accomplish certain GLOBEC requirementsincluding sampling a coherent population over time and conducting a series of process orbehavioral experiments at the scales implicit in the GLOBEC program.
Develop integrated bio-optical and bioacoustic systems that can be deployed at various depthson fixed moorings instrumented with physical (temperature, salinity, and current) andchemical (fluorescence) sensors.
Such systems are likely to be required by GLOBEC in its initial field program tocharacterize the advection of biological populations on and off shallow banks. They should bedesigned with the capability of 2-way telemetry so that sampling rates can be modified if unusualevents are detected, and to monitor system performance. They also could be equipped with samplecollection systems of various kinds.
Explicitly recognize the significant problems of data assimilation, archiving, and retrievalinherent in utilization of such bioacoustic and bio-optical sampling systems.
These systems generate volumes of data orders of magnitude larger than we are currently
26
equipped to process and store. Simple storage of raw data is likely precluded. Whatever systemsare eventually adopted will doubtless be dependent upon the availability of sufficient computercapability at sea to analyze raw data and transform it into manageable processed units like imagesor maps. An advanced computer system needs to be placed on at least one ship to be used inGLOBEC. Moreover, the accumulation of data may well exceed even enhanced shipboard storagecapacities and a high-speed data link to shore via satellite communication will be essential. Thesame facility may be critical to coordinate the activities of multiple platforms during a GLOBECfield experiment.
Develop bio-optically and bioacoustically instrumented Lagrangian platforms that can bedeployed at various depths (or are capable of changing depth) so as to follow a targetedpopulation.
This application presents special technical challenges beyond deploying similar systems onfixed moorings. It may not be essential to GLOBEC in its early phase but may become essentialwhen the behavioral responses of target populations and the most significant regulatory processesare better understood.
Modify commercial echo sounder technology to the higher frequencies suitable for initialGLOBEC target organisms (copepods) to permit routine (although perhaps not entirelyquantitative) mapping.
This approach is felt to present few technical challenges and to be especially cost-efficient.
27
6. Discussion on Education and Training
Chairman: Chuck GreenePanel Members: Steve Brandt, Rudi Strickler
6.1 Human Resources Development in Bioacoustical Oceanography
Bioacoustical oceanographic technology will contribute to the achievement of GLOBECobjectives in direct proportion to the size and quality of its user group. At present, the user group issmall and training is done on a relatively informal basis. In the next few years, it is imperative thatwe begin to develop a more formal training program which will be available to the whole oceansciences community and will provide rigorous, high-quality training to the next generation ofbioacoustical oceanographers. The alternative is a situation in which the technological needs ofGLOBEC overwhelm the ocean science community's ability to respond.
The foundation for a formal training program in bioacoustical oceanography could be abasic graduate-level course modeled after the bio-optical oceanography course taught at FridayHarbor Laboratories. This course has provided rigorous training in bio-optical oceanography fordozens of graduate students over the last seven or eight years. In turn, these students have gone onto become the critical mass for bio-optical oceanography's rapid advancement and acceptancewithin the biological oceanographic community. The potential for a similar course in bioacousticaloceanography is great; a possible course outline might include the following topics.
• Principles of Underwater Sound -- Week 1
• Bioacoustical Oceanographic Methods -- Weeks 2 and 3multi-frequency inversion methodsmulti- and split-beam methodsdoppler methods
• Group Field Study -- Week 4
The bioacoustical oceanography basic course should emphasize: 1) a practical, "hands on"approach to learning; 2) an equal emphasis on acoustical methods and biological oceanographicapplications; and 3) exposure to the expertise and instruction of visiting lecturers from a variety ofinstitutions. This multi-institutional aspect of the course is something that should be encouraged inother elements of the overall training program.
The next logical element in the training of graduate students is a full degree program inbioacoustical oceanography. It was suggested that one approach to such a program might includehaving students, regardless of home institution, traveling to other institutions for portions of theirgraduate education. A multi-institutional education of this type, although unconventional, wouldoffer the following benefits:
1) Students would be exposed to greater expertise in a variety of subject areas critical totheir education as bioacoustical oceanographers;
2) Students would develop a sense of belonging to a closely-knit network of well-trainedbioacoustical oceanographers; and

28
3) Students might be supported through a training grants program that would beindependent of their home institution.
After graduate school, there is a critical need to support the new or continued training ofpostdoctoral fellows in bioacoustical oceanography. It was recommended that a postdoctoralprogram in bioacoustical oceanography be initiated within the biological oceanography section atNSF comparable to the one recently initiated in biotechnology. It was further suggested thatNOAA and ONR be encouraged to support similar postdoctoral programs.
At the level of the working professional, mechanisms must be developed so that basic aswell as advanced training in bioacoustical oceanography becomes more readily available. Short-term (1-2 week) workshops may meet some of these needs, but a longer term (0.5-1 year)"mentorship" program might be necessary for those professionals interested in retoolingthemselves as independent, competent practitioners of bioacoustical oceanography. NOAA, NSF,and ONR appear to be the most appropriate funding sources to support professional training grantsand fellowships of this nature.
29
7. Summary and Recommendations
In addition to the recommendations documented in the individual working group reports,several common themes evolved from the meeting.
• It was recognized that development, acquisition, and use of new sampling technologywas needed to successfully address GLOBEC science issues. Acoustical and opticaltechnologies were acknowledged as leading candidates from which the necessary toolscould be drawn to support the pursuit of GLOBEC's science goals.
• Based on their quasi-continuous sampling characteristics, acoustical and optical toolsdeployed in various ways (e.g., towed or hull-mounted sensors vs. moored, bottom-mounted, or drifting sensors) are essential to relating small-scale processes important atthe level of the individual to large-scale processes that impact populations. This conceptwas described as "nesting" of sensors that measure small-scale temporal and spatialphenomena within measurements at incrementally increasing temporal and spatial scalesup to those that include populations and their dynamics.
• Several groups stressed the importance of the mode of deployment of any acoustical,optical, or integrated sensor package. The same mode is not, in general, appropriate forall the different kinds of GLOBEC science questions. The ability to use an instrument ina diversity of deployment modes, e.g., cast, towed, hull-mounted, bottom-moored, etc.,was considered a valuable sensor characteristic, substantially enhancing the usefulness ofa particular instrument.
• Each of the working groups recognized the value of examining the same distribution ofanimals with more than one frequency of sound. It was recognized that the range andnumbers of frequencies required depends on the sizes of the animals present, whichanimals present are of interest, their abundances, their physical characteristics, theirdistribution, and the mode in which the sensor is to be used.
• Several groups noted that modularity, standardization of instrumentation, and simplicityof operation and deployment were important. At the same time, arguments for versatility,flexibility in deployment mode and signal processing algorithms, sophisticated internaldata processing, and low cost were presented. On the surface some of these criteria seemconflicting, thus requiring thoughtful tradeoffs when designing instrumentation.
• It was determined that the integration of acoustical and optical technology could yieldsynergistic benefits and that the technologies are complementary. Acoustic sensors couldplace optical measurements in the context of larger scale biological distributions. Theymay also be used to detect rare organisms that may prey on the relatively small and morenumerous animals under study with the optical system. Acoustic sensors could alsocontribute data on vertical migration and swimming behavior to aid in betterunderstanding optical observations. Optical data could provide important measurementsof animal orientation, provide independent information on particle size spectra, and offera potential for taxonomic identification of acoustically sensed individuals anddistributions (e.g., aggregations, schools, patches, layers).
30
• There was a strong sense that sampling of both the biological environment (e.g., withacoustics and/or optics) and the physical environment (temperature, salinity, light,currents, turbulence, etc.) should be done synoptically rather than serially. There was alsoa sense that traditional methods will remain important in sampling the marineenvironment, but that the use of alternative sensors will result in major improvements inthe efficiency of these conventional sampling tools.
• The establishment of data archiving protocols to facilitate long term (10's of years) use ofdata is explicitly recognized as a particular problem for acoustical data as it is forGLOBEC data in general.
• In some cases, access by the community of biological oceanographers to complexbioacoustic instrumentation is limited by acquisition cost and the multidisciplinary talents(electronics, acoustics, and machine level programming) required to operate, calibrate,adapt, and maintain such gear. The establishment and staffing of a limited number of"facilities" or "teams" to provide and maintain bioacoustic devices for data collectionunder the direction of individual or groups of investigators, is recognized as a viableapproach to expansion of the biological communities' access to such devices.
• Finally, there was a consensus that there was a need for continued basic research anddevelopment in order to advance the state-of-the-art in remote underwater sensing ofmarine animals. Specifically, advances would be welcomed in the following areas:
1) Development of new methods for quantitative combination of multifrequencyacoustic data;
2) Continued analytical research and supporting measurements directed towards thedevelopment of better and more comprehensive descriptions of acoustic scatteringfrom all marine genera (e.g., adult fish, larval fish, micronekton, macrozooplanktonand small zooplankton); and
3) Development and validation of methods for quantitative combination ofmultisensor data (i.e., data fusion).

31
8. Acknowledgments
The success of this workshop was enhanced by the efforts of the speakers and thechairmen of the working groups. Special thanks are due Eileen Hofmann, for her opening talk onGLOBEC's history and the objectives of the GLOBEC initiative; Mark Huntley described thedeveloping GLOBEC component of the Atlantic program on Georges Bank and the anticipatedproject in the Antarctic; Mark Ohman, for his description of the science problems, ecology and theenvironment of the eastern Pacific; and to Sharon Smith, for her lucid description of the ArabianSea and potential GLOBEC links to JGOFS.
Thanks are also due Ken Foote, for his overview of acoustic techniques, acousticterminology and fisheries acoustics. Charles Greenlaw described the history and state of the art inacoustic assessment of mesopelagic animals. Doug Sameoto provided an update on the acousticsampling of euphausiids and some interesting comments on comparison of acoustic and netsampling technologies. Van Holliday described techniques for assessing the abundance anddistribution of small zooplankton. Alex Herman provided an overview of optical techniquesincluding an excellent description of the optical particle counter. Gus Paffenhöfer contributedadditional information on optical techniques with a recording of the swimming and feedingbehavior of small zooplankton.
We also appreciate the invaluable participation of our colleagues who came from Canada(Doug Sameoto, Alex Herman, Yvan Simard and Len Zedel), Norway (Ken Foote) and Scotland(John Simmonds).
Lew Incze, Gordie Swartzman and Mark Ohman served as rapporteurs for the workinggroups and assisted the working group chairmen in the preparation of this report. We would alsolike to thank Chuck Greene for leading the panel discussion with Steve Brandt and Rudi Strickleron educational opportunities.
We also would like to acknowledge the assistance of Beth Irlandi (University of NorthCarolina) in the final editing process.
Finally, thanks to Tim Stanton, Marv Grosslein and Mark Berman for arranging thelogistics of the meeting.
Travel for this meeting was provided by the National Science Foundation, Division ofOcean Sciences, Biological Oceanography (Phil Taylor) through Grant OCE9O-06957 to JOI Inc.We would like to thank the JOI staff for their efforts in making travel arrangements and in thepublication of this report.

32
9. References and Bibliography
Andersen, N.R. and B.J. Zahuranec (Eds.). 1977. Ocean sound scattering prediction. PlenumPress, New York.
Anderson, V.C. 1950. Sound scattering from a fluid sphere. J. Acoust. Soc. Am. 22: 426-431.
Arnone, R.A., R.W. Nero, J.M. Jech and I. De Palma. 1990. Acoustic imaging of biological andphysical processes within Gulf Stream meanders. Eos 71: 982.
Balls, R. 1948. Herring fishing with the echometer. J. Cons. Int. Explor. Mer 15:193-206.
Baraclough, W.E., R.J. Lebrasseur and O.D. Kennedy. 1969. Shallow scattering layer in thesubarctic Pacific Ocean: Detection by high frequency echosounder. Science 166: 611-613.
Bary, B. McK. 1966a. Backscattering at 12 kc/s in relation to biomass and numbers ofzooplanktonic organisms in Saanich Inlet, British Columbia. Deep-Sea Res. 13: 655-666.
Bary, B. McK. 1966b. Quantitative observations of scattering of 12 kc/s sound in Saanich Inlet,British Columbia. Deep-Sea Res. 13: 667-677.
Beamish, P. 1971. Quantitative measurements of acoustic scattering from zooplanktonorganisms. Deep-Sea Res. 18: 811-822.
Castile, B.D. 1975 Reverberation from plankton at 330 KHz in the Western Pacific. J. Acoust.Soc. Am. 58: 972-976.
Clay, C. 5. 1983. Deconvolution of the fish scattering PDF from the echo PDF for a singletransducer sonar. J. Acoust. Soc. Am. 73:1989-1994.
Clay, C.S. and H. Medwin. 1977. Acoustical oceanography: Principles and Applications. Wiley-Interscience, New York.
Craig, R.E. and S.T. Forbes. 1969. Design of a sonar for fish counting. FiskDir. Skr. Ser.HavUnders. 15: 210-219.
Costello, J.H., R.E. Pieper and D.V. Holliday. 1989. Comparison of acoustic and pump samplingtechniques for the analysis of zooplankton distributions. J. Plankton Res. 11: 703-709.
Duvall, G.E. and R.J. Christiansen. 1946. Stratification of sound scatterers in the ocean. J. Acoust.Soc. Am. 20: 254.
Ehrenberg, J.E. 1972. A method for extracting the fish target strength distribution for acousticechoes. Proc. IEEE mt. Conf. Eng. Ocean Environ. 1: 61-64.
Ehrenberg, J.E. 1974. Two applications for a dual beam transducer in hydroacoustic fishassessment systems. Proc. 1974 IEEE Int. Conf. Eng. Ocean. Environ. 1: 152-155.

33
Ehrenberg, J.E. 1979. A comparative analysis of in situ methods for directly measuring theacoustic target strength of individual fish. IEEE 3. Ocean. Eng. OE-4: 141-152.
Ehrenberg, J.E. 1983. A review of in situ target strength estimation techniques. FAO Fish. Rep.300: 90-95.
Ehrenberg, J.E. 1989. A review of target strength estimation techniques. In: Y. T. Chan (Ed.),Underwater Acoustic Data Processing, pp. 161-176. Kluwer Academic Publishers,Dordrecht, The Netherlands.
Ehrenberg, J.E., T.J. Carlson, J.J. Traynor and N.J. Williamson. 1981. Indirect measurement ofthe mean acoustic backscattering strength of fish. J. Acoust. Soc. Am. 69: 955-962.
Ehrenberg, J.E. D.W. Lytle. 1972. Acoustic techniques for estimating fish abundance. IEEETrans. Geosci. Electron. 10: 138-145.
Ehrenberg, J.E., P.H. Wiebe, W.H. Hanot, H.G. McMichael and R.T. Miyamoto. 1989.BIOSPAR, a buoy system for acoustic monitoring of biological populations. Oceans '89,4, Mar. Tech Soc. and IEEE, Seattle, WA, 1032-1035.
Everson, I., J.L. Watkins, D.G. Bone and K.G. Foote. 1990. Implications of a new acoustic targetstrength for abundance estimates of Antarctic krill. Nature 345: 338-340.
Eyring, C.F., R.J. Christiansen and R.W. Raitt. 1948. Reverberation in the sea. J. Acoust. Soc.Am. 20: 462-475.
Falk-Petersen, S. and A. Kristiansen. 1985. Acoustic assessment of krill stocks in Ullsfjorden,north Norway. Sarsia 70: 83-90.
Farmer, D.M. and R.D. Huston. 1988. Novel application of acoustic backscatter to biologicalmeasurements. In: B.J. Rothschild (Ed.), Toward a Theory on Biological-PhysicalInteractions in the World Ocean, pp.599-614. Kluwer Academic Publishers, Dordrecht,The Netherlands.
Farquhar, G.B. (Ed.). 1971. Biological Sound Scattering in the Ocean. Proc. Int. Symp. MauryCenter Ocean Sci., Washington, DC.
Flagg, C.N. and S.L. Smith. 1989a. On the use of the acoustic doppler current profiler to measurezooplankton abundance. Deep-Sea Res. 36: 455-474.
Flagg, C.N. and S.L. Smith. 1989b. Zooplankton abundance measurements from acoustic dopplercurrent profilers. Oceans '89, Mar. Tech Soc. and IEEE, Seattle, WA, 4:1318-1323.
Foote, K.G. 1987. Fish target strengths for use in echo integrator surveys. J. Acoust. Soc. Am.82(3): 981-987.
Foote, K.G., A. Aglen and 0. Nakken. 1986. Measurement of fish target strength with a splitbeamecho sounder. 3. Acoust. Soc. Am. 80(2): 612-621.
34
Forbes, S. and 0. Nakken. 1972. Manual of methods for fisheries resource survey and appraisal.Part 2. The use of acoustic instruments for fish detection and abundance estimation. FAOMan. Fish. Sci. 5:138 pp.
GLOBEC. 1988. Global Ocean Ecosystem Dynamics. Joint Oceanogr. Inst., Inc., Washington,DC.
GLOBEC 1991a. Theory and Modeling in GLOBEC: A First Step, February 1991, JointOceanogr. Inst., Inc., Washington, DC.
GLOBEC 1991b. Initial Science Plan, GLOBEC Report Number 1, February 1991, JointOceanogr. Inst., Inc., Washington, DC.
GLOBEC 1991c. Northwest Atlantic Program, Canada/U.S. Meeting on N.W. Atlantic Fisheriesand Climate, GLOBEC Report Number 2, February 1991, Joint Oceanogr. Inst., Inc.,Washington, DC.
GLOBEC 1991d. Workshop on Biotechnology Applications to Field Studies of Zooplankton,GLOBEC Report Number 3, February 1991, Joint Oceanogr. Instit., Inc., Washington,DC.
Goodman, N.R. 1965. Measurement of matrix frequency response functions and multiplecoherence functions. Tech. Rept. AFFDL-TR-65-56, Air Force Flight DynamicsLaboratory, Research and Technology Division, Air Force Systems Command, Wright-Patterson Air Force Base, Ohio. NTIS Document Center No. AD 619995.
Greene, C.H., T.K. Stanton, P.H. Wiebe and S. McClatchie. 1991. Acoustic estimates of Antarctickrill. Nature 349:110.
Greene, C.H., P.H. Wiebe and J. Burczynski. 1989. Analyzing zooplankton size distributionsusing high-frequency sound. Limnol. Oceanogr. 34:129-139.
Greene, C.H., P.H. Wiebe, R.T. Miyamoto and J. Burczynski. 1991. Probing the fine structure ofocean sound-scattering layers with ROVERSE technology. Limnol. Oceanogr. 36:193-204.
Greenlaw, C.F. 1979. Acoustic estimation of zooplankton populations. Limnol. Oceanogr. 24:226-242.
Greenlaw, C.F. and W.G. Pearcy. 1985. Acoustical patchiness of mesopelagic micronekton. J.Mar. Res. 43:163-178.
Greenlaw, C.F., and R.K. Johnson. 1983. Multiple-frequency acoustical estimation. Biol.Oceanogr. 2: 227-252.
Harden-Jones, F.R. and B.S. McCartney. 1962. The use of electronic sector-scanning sonar forfollowing the movements of fish shoals: sea trials on RRS Discovery II. J. Cons. Int.Explor. Mer 27:141-149.
35
Helstrom, C.W. 1968. Statistical Theory of Signal Detection. Permagon Press, New York, 470pp.
Herman, A.W. 1988. Simultaneous measurement of zooplankton and light attenuance with a newoptical plankton counter. Cont. Shelf Res. 8: 205-221.
Herman, A.W. and T.M. Dauphinee. 1980. Continuous and rapid profiling of zooplankton with anelectronic counter mounted on a "Batfish" vehicle. Deep-Sea Res. 27: 79-96.
Hersey, J.R. and R.H. Backus 1954. Sound scattering by marine organisms. In: M.N. Hill (Ed.),The Sea, Vol.1. Interscience, New York.
Hewitt, R.P., P.E. Smith and J.C. Brown 1976. Development and use of sonar mapping forpelagic stock assessment in the California Current area. Fish. Bull. 74 (2): 281-300.
Holliday, D.V. 1972. Resonance structure in echoes from schooled pelagic fish. J. Acoust. Soc.Am. 51(4): 1322-1334.
Holliday, D.V. 1974. Doppler structure in echoes from schools of pelagic fish. J. Acoust. Soc.Am. 55(6): 1313-1322.
Holliday, D.V. 1977. Extracting biophysical information from the acoustic signatures of marineorganisms. In: N.R. Anderson and B.J. Zahuranec (Eds.), Oceanic Sound ScatteringPrediction, pp.619-625. Plenum Press, New York.
Holliday, D.V. 1980. Use of acoustic frequency diversity for marine biological measurements. In:F.P. Diemer et al. (Eds.), Advanced Concepts in Ocean Measurements for MarineBiology, pp.423-460. Univ. South Carolina Press, Columbia, SC.
Holliday, D.V. 1985. Active acoustic characteristics of nekton. In: J.W. Foerster (Ed.), TheBiology and Target Acoustics of Marine Life, pp.115-144. U.S. Naval Academy.
Holliday, D.V. and R.E. Pieper. 1980. Volume scattering strengths and zooplankton distributionsat acoustic frequencies between 0.5 and 3 MHz. J. Acoust. Soc. Am. 67(1): 135-146.
Holliday, D.V. and R.E. Pieper. 1988. Applications of underwater acoustics to the study ofmicronekton and zooplankton. In: M.F. Thompson and M.N. Tirmizi (Eds.), Proc. Int.Conf. on Mar. Sci of the Arabian Sea, AIB 5, pp.77-86.
Holliday, D.V., R.E. Pieper, C.F. Greenlaw and J.K. Dawson. 1990. Acoustic assessment ofzooplankton in the Irish Sea, C.M. 1990/L: 17, 78th Statutory Meeting of the InternationalCouncil for the Exploration of the Sea (ICES), October 6, 1990, 40 pp.
Holliday, D.V., R.E. Pieper and G.S. Kleppel. 1989. Determination of zooplankton size anddistribution with multi-frequency acoustic technology. J. Cons. Int. Explor. Mer 41: 226-238.
Johnson, M.W. 1948. Sound as a tool in marine ecology, from data on biological noises and thedeep scattering layer. J. Mar. Res. 7: 443-458.

36
Johnson, R.K. 1977a. Sound scattering from a fluid sphere revisited. J. Acoust. Soc. Am. 61:375-377.
Johnson, R.K. 1977b. Acoustic estimation of scattering layer composition. J. Acoust. Soc. Am.61:1636-1639.
Kalish, J.M., C.F. Greenlaw, W.G. Pearcy and D.V. Holliday. 1986. The biological and acousticalstructure of sound scattering layers off Oregon. Deep-Sea Res. 33(5): 631-653.
Kristensen, A. and J. Dalen. 1986. Acoustic estimation of size distribution and abundance ofzooplankton. J. Acoust. Soc. Am. 80: 601-611.
Lawson, C.L. and R.J. Hansen. 1974. Solving Least Squares Problems. Prentice-Hall, EnglewoodCliffs, New Jersey, 340 pp.
Leih, T. and D.V. Holliday. 1982. Uniqueness of the non-negative least squares solution in thebioacoustic inverse problem. Tracor Document No. T-81-SD-026-U, 34 pp.
Love, R.H. 1969. Maximum side aspect target strength of an individual fish. J. Acoust. Soc. Am.46: 746-752.
Macaulay, M.C. 1978. Quantitative acoustic assessment of zooplankton standing stock. PhDThesis, Univ. Washington. 149 pp.
MacLennan, D.N. and S.T. Forbes, 1984. Fisheries acoustics: A review of general principles.Rapp. P.-v. Cons. Int. Explor. Mer 184: 7-18.
Maclennan, D.N. and E.J. Simmonds. 1991. Fisheries Acoustics. Chapman and Hall, London,336 pp.
Marine Zooplankton Colloquium I. 1989. Future marine zooplankton research: A perspective.Mar. Ecol. Prog. Ser. 55:197-206.
Midttun, L. and 0. Nakken. 1971. On acoustic identification, sizing and abundance estimation offish. FiskDir. Skr. Ser. HavUnders. 16: 36-48.
Mitson, R.B. 1983. Fisheries Sonar, Fishing News Books Ltd., Farnham, Surrey, England, 287pp.
McNaught, D.C. 1968. Acoustical determination of zooplankton distributions. Proc. 11th Conf.Great Lakes Res. 1968: 76-84.
Nakken, 0. and K. Olsen. 1977. Target strength measurements of fish. Rapp. P.-v. Reun. Cons.Int. Explor. Mer 170: 52-69.
Northcote, T.G. 1964. Use of a high-frequency echosounder to record distribution and migrationof Chaoborus larvae. Limnol. Oceanogr. 9: 87-91.
37
Paffenhöfer, G.A., T.B. Stewart, M.J. Youngbluth and T.G. Bailey. 1991. High resolution verticalprofiles of pelagic tunicates. J. Plankton Res. (In Press).
Peterson, M.L., C.S. Clay and S.B. Brandt. 1976. Acoustic estimates of fish density and scatteringfunction. J. Acoust. Soc. Am. 60: 618-622.
Pieper, R.E. 1979. Euphausud distribution and biomass determined acoustically at 102 KHz.Deep-Sea Res. 26: 687-702.
Pieper, R.E. and D.V. Holliday. 1984. Acoustic measurements of zooplankton distributions in thesea. J. Cons. Int. Explor. Mer 41: 226-238.
Pieper, R.E., D.V. Holliday and G.S. Kleppel. 1990. Quantitative zooplankton distributions frommultifrequency acoustics. J. Plankton Res. 12: 433-441.
Price, H.J., G.A. Paffenhöfer, C.M. Boyd, T.J. Cowles, P.L. Donaghay, W.M. Hamner, W.Lampert, L.B. Quetin, R.M. Ross, J.R. Strickler and M.J. Youngbluth. 1988. Futurestudies of zooplankton behavior: Questions and technological developments. Bull. Mar.Sci. 43: 853-872.
Rayleigh, Lord. 1945. Theory of Sound. Second Edition. Dover Publications, New York. 984 pp.
Richter, K.E. 1985a. Acoustic scattering at 1.2 MHz from individual zooplankters and copepodpopulations. Deep-Sea Res. 32:149-161.
Richter, K.E. 1985b. Acoustic determination of small-scale distributions of individualzooplankters and zooplankton aggregations. Deep-Sea Res. 32:163-182.
Sameoto, D.D. 1976. Distribution of sound scattering layers caused by euphausiids and theirrelationship to chlorophyll a concentrations in the Gulf of St. Lawrence estuary. J. Fish.Res. Brd. Can. 33: 681-687.
Sameoto, D.D. 1980. Quantitative measurements of euphausiids using a 120-KHz sounder andtheir in situ orientation. Can. J. Fish. Aquat. Sci. 37: 693-702.
Sameoto, D.D. 1982. Zooplankton and micronekton abundance in acoustic scattering layers on theNova Scotian slope. Can. J. Fish. Aquat. Sci. 39: 760-777.
Sameoto, D.D., L.O. Jaroszynski and W.B. Fraser. 1980. The BIONESS -- new design inmultiple net zooplankton samplers. J. Fish. Res. Bd. Can. 37: 722-724.
Simard, Y., R. de Ladurantaye and J.C. Therriault. 1986. Aggregation of euphausiids along acoastal shelf in an upwelling environment. Mar. Ecol. Prog. Ser. 32: 203-315.
Smith, K.L., Jr., D. Alexandrou and J.L. Edelman. 1989. Acoustic detection and tracking ofabyssopelagic animals: description of an autonomous split-beam acoustic array. Deep-SeaRes. 36:1427-1441.
Stanton, T.K. 1985a. Density estimates of biological sound scatterers using sonar echo peak
38
PDFs. J. Acoust. Soc. Am. 78(5): 1868-1873.
Stanton, T.K. 1985b. Volume scattering: Echo peak PDF. J. Acoust. Soc. Am. 77(4): 1358-1366.
Stanton, T.K. 1988. Sound scattering by cylinders of finite length. I. Fluid cylinders. J. Acoust.Soc. Am. 83: 55-63.
Stanton, T.K. 1989a. Sound scattering by cylinders of finite length. III. Deformed cylinders. J.Acoust. Soc. Am. 86: 691-705.
Stanton, T.K. 1989b. Simple approximate formulas for backscattering of sound by spherical andelongated objects. J. Acoust. Soc. Am. 86:1499-1510.
Stanton, T.K. 1991. Sound scattering by spherical and elongated shelled bodies. J. Acoust. Soc.Am. (In Press).
Stanton, T.K. and C.S. Clay. 1986. Sonar echo statistics as a remote-sensing tool: volume and seafloor. IEEE J. Ocean. Eng. OE-11: 79-96.
Stanton, T.K., R.D.M. Nash, R.L. Eastwood and R.W. Nero. 1987. A field examination ofacoustical scattering from marine organisms at 70 kHz. IEEE J. Ocean. Eng. 12: 339-348.
Strickler, J.R. 1977. Observations of swimming performances of planktonic copepods. Limnol.Oceanogr. 22:165-170.
Sund, 0. 1935. Echo sounding in fisheries research. Nature 135: 956.
Traynor, J. J. and J.E. Ehrenberg. 1979. Evaluation of the dual beam acoustic fish target strengthmeasurement method. J. Fish. Res. Brd. Can. 36:1065-1071.
Traynor, J. J. and J.E. Ehrenberg. 1987. Fish and standard sphere target strength measurementsobtained with a split beam-dual beam system. Proc. Int. Symp. Fish. Acoust., Seattle,1987. (In Press).
Van Leer, J.C., W. Duing, R. Erath, E. Kennelly and A. Speidel. 1974. The Cyclesonde: Anunattended vertical profiler for scalar and vector quantities in the upper ocean. Deep-SeaRes. 21: 385-400.
Weston, D.E. 1967. Sound propagation in the presence of bladder fish. In: V.M. Albers (Ed.),Underwater Acoustics, Vol.2, Chap. 5, pp.56-88. Plenum Press, New York.
Wiebe, P.H., K.H. Burt, S.H. Boyd and A.W. Morton. 1976. A multiple opening/closing net andenvironmental sensing system for sampling zooplankton. J. Mar. Res. 34: 313-326.
Wiebe, P.H., C.H. Greene and T.K. Stanton. 1990. Sound scattering by live zooplankton andmicronekton: empirical studies with a dual-beam acoustical system. J. Acoust. Soc. Am.88: 2346-2360.

39
10. Glossary of Terms
Active Acoustics—A subdiscipline of the branch of physics that deals with the man-madegeneration, propagation, and scattering of sound projected into a medium (e.g., air, water or theearth) by an investigator for the purpose of remotely determining some characteristic of thetransmission medium along the propagation path.
Acoustic Doppler Current Profiler (ADCP)—An acoustic sensor that measures the Doppler shiftof acoustic scatterers in the water column and estimates the magnitude and direction of the 3-Dmotions of the "water" versus depth using the assumption that the scatterers are passive tracers ofthe water mass.
Acoustic echo—A pressure (or its representation in voltage) signal that results from the scatteringof sound from an acoustic impedance discontinuity (target) in the medium in which the sound ispropagating (e.g., an "echo" from a zooplankter or a school of fish). (Also see "Target".)
Acoustic Resolution, Resolved—In space, the minimum distance between two objects for whichan active acoustic system can determine that there are two, rather than one, objects present. Infrequency, the minimum separation between two frequency components (e.g., tones or lines) forwhich an analysis system can distinguish the presence of both frequency components. Objects orfrequency components are said to be resolved, when there is sufficient precision in themeasurement to separate the objects or components into distinguishable entities. The criteria forwhen this is the case may vary, depending on the characteristics of the system and the intended useof the information. The Rayleigh resolution criteria from geometric optics is often, but notuniformly, applied.
Acoustic scattering—The diversion of sound energy from its original direction of propagation.
Acoustic scattering models—A mathematical expression used to describe the sound scatteringprocess from "targets" (e.g., marine organisms). Models range in complexity from empiricallybased linear regressions of acoustic scattering on size for a particular acoustic frequency, tocomplex expressions based on first principles of physics, the acoustic frequency, and theorganism's shape, size, morphology, physical structure, compressibility, and density contrasts withthe surrounding medium and the target's relative orientation with respect to the acoustic sensor.
Acoustic signatures—Any set of characteristics used to describe a sound signal, including echoesfrom "targets", radiated, and ambient noise. For an echo, the signature might include targetstrength, spectral reflectivity versus frequency, doppler shift, doppler spread, or target range extent(size).
Acoustic size classes—A term that loosely refers to acoustic estimates of the relative or absoluteabundance of "targets" of different sizes. The degree with which the "acoustic size" matches thephysical size depends on the accuracy of the mathematical model one uses to transform from theacoustic measurements to the estimated physical dimensions of the scatterers.
Acoustic tag—These devices, which are typically attached to fish, have also been used to detect andtrack whales and crabs. They come in at least two types. One is an instrument that periodicallytransmits a sound, allowing one to detect that sound at a remote location, determining the presenceof the animal and its direction. The transponding acoustic tag makes a sound only when

40
interrogated, thereby saving battery power in the tag and extending the tag life. By using the timedelay between the interrogating signal and the reception of the acoustic response, the range to theanimal can be estimated as well as its direction. Information about the animal, such as its depth orheart rate, can be encoded into the signal on either the simple or transponding tag.
Amphipod—Any of the relatively common and numerous small crustaceans of the orderAmphipoda. Often found in assemblages of marine zooplankton.
Anthropogenic—Related to man's activities; man-made or caused by man.
Attenuation—Reduction in acoustic intensity experienced by a signal in transit between twospatially separated points. Parameters that contribute to attenuation include absorption, scattering,refraction (multiple paths), and geometric spreading.
Automatic gain control (AGC)—A form of signal processing used to maintain the amplitude ofelectrical signals within preset bounds. Signals are amplified or attenuated according to somemeasure of their amplitude or intensity, often by the mean square, or root mean square amplitude.
Backscattering cross-section—The ratio of the acoustic power scattered at an angle of 180 degreesfrom the incident acoustic wave, referenced to a stated unit distance, e.g., 1 m, to the acousticintensity incident on a unit volume or unit area. This measure is the ratio of the reflected acousticpower to incident acoustic power/area, giving rise to units of area (m2) for backscattering cross-section.
Bandwidth—The frequency range spanned by an acoustic or electronic signal of interest to theinvestigator (or used by an acoustic instrument). For some common types of acoustic signals (CWpulses), the acoustic bandwidth is inversely related to the pulse length of the pulse (ping) length.
Batfish—A towed body, used as an instrument platform, which can be actively controlled in depthby manipulation of its control surface. Often used to make measurements in a "tow-yo" modealong a transect. (See, e.g., Herman and Dauphinee, 1980)
Beam—Many acoustic systems either transmit or receive sound preferentially in some direction,either vertically or horizontally. The intensity of sound transmitted or the response to soundarriving at a sensor, as a function of angle around a preferred direction, defines an acoustic "beam".Roughly analogous to the light "beam" transmitted from a flashlight or the angle of acceptance oflight in a telescope.
Beamforming—Measures taken to focus sound in a particular direction. Three typical means ofbeamforming include placement of a reflector (e.g., a cone or parabola) behind an acoustic source;phasing of narrowband signals emitted or received by an array of transducers or transducerelements; and shifting replicas of signals emitted or received by individual elements in such a wayas to maximize the acoustic response in some direction. Can also refer to processing of data fromthe elements of an array to reject information from a particular direction.
Beamwidth—The angular extent around a maximum response axis within which the signals aresome percent of the response in the direction of the maximum. The half (maximum) power pointsare often taken as the limit for the purpose of defining the beamwidth.

41
Bent cylinder models—Mathematical algorithms that describe the acoustic scattering from variousclasses of cylinders which have been characterized as having a radius of curvature along theirlength. (See, e.g., Stanton, 1989a, b.) Their proposed use has been to characterize and understandthe magnitude, directionality, and mechanisms that give rise to acoustic scattering fromzooplankton such as euphausiids and shrimp.
Bioacoustic, bio-acoustics—Refers to the use of acoustic technology to study plants or animals.Bioacoustics, as used in this document, refers to applications involving animals in the marineenvironment. It may employ either active or passive acoustic technology. Bioacoustics is alsoemployed in the terrestrial environment, for example, in the detection of insects in grain andespecially with the vocalizations of numerous species, such as apes, birds, and insects.
Biomass—A measure of the quantity of living material, usually in units of weight per unit volume.
BIONESS—A multiple net system with the capability of opening and closing nets on commandfrom the surface in order to sample different depth strata on a single tow. (See Sameoto, et al.,1980.)
Calibration—In this document, calibration refers to the process of establishing the sensitivity of anacoustic sensor or system to an acoustic stimulus and to the quantitative relationship between theelectrical and acoustical parameters of an acoustic system. In acoustics, calibrations are expressedin absolute terms, with units that are traceable to the National Institute for Standards andTechnology (e.g., meters, seconds, kg, etc.) or some comparable source of standards. In the strictsense, an experiment that compared a net haul with echo integrator outputs from an acousticsystem would not be a calibration, rather it would be a comparison. A calibration on a stableacoustic system is deterministic, repeatable, and does not depend in any way on the populationunder study. A valid calibration allows absolute comparisons between different equipments anddifferent investigators based on widely accepted physical or electronic standards (e.g., source level212 dB // 1µPa or beamwidth = 14.22 degrees). The word calibration is often misused inbioacoustics when substituted for the word comparison. (See Comparison.)
Classification—In acoustic remote sensing, one can often quantify some set of characteristicsassociated with a "target" or sound scattering organism, school or aggregation. Examples arequantitative measurement of single frequency reflectivity or target strengths, reflectivity spectra(reflectivity versus frequency), location in the water column, geographic location, time of the year,target size, motion characteristics, etc. Other measures may be qualitative, e.g., compact, dispersed,weak, strong, layer-like, etc. From the entire set of remote measurements ("classification clues"),one can sort the detected acoustic contacts (targets) into "classes" with similar or identicalcharacteristics. If enough is known about the possible set of targets present, this "classification"may lead to an "identification" with some probability and confidence level.
Coherence—A mathematical algorithm expressing a quantitative measure of the spatial ortemporal relationships between two or more parameters. Simple coherence is the ratio of thesquare of the absolute magnitude of the cross spectral density function between two parametersand the product of the power spectral densities for each individual parameter. (For a generalizeddefinition of coherence, including multiple and partial coherence, see Goodman, 1965.)
Comparison—The process of relating acoustic measurements (e.g., volume backscattering or echointegrator outputs) to the biomass or numerical abundance of some organism or assemblage of
42
species. A regression between a series of biomass measurements from a net haul and the values ofa comparable series of echo integrator values (or derived quantities) is a comparison -- not acalibration (See Calibration).
Confocal Imaging—An optical technique that uses a source point and a confocal point to image anobject. The source and image point are scanned to produce a multi-dimensional image.Advantages of this technique for oceanographic optical imaging are a large reduction inbackscattered light.
Copepod—An important component of the zooplankton consisting of at least 4,500 pelagicspecies, order Calanoida and Cyclopoida. Minute "shrimplike" organisms which range betweenabout 0.05 and 10 mm in length. A major food for fish, these animals often dominate the marinezooplankton biomass.
Crustacean—Primarily marine, this class of zooplankton consists of about 26,000 species. It ischaracterized by a thin, chitinous exoskeleton.
CritterCam [R]—A camera system using an IR diode laser that was developed by J.R. Strickler
CTD—An instrument that measures conductivity, temperature, and depth.
Cyclosonde—A device that can be used as a platform for a variety of instruments, it profiles thewater column by alternately rising to the surface and sinking. The device rises and sinks byadjusting the package buoyancy in a programmed manner (See Van Leer, et al., 1974).
Density—In underwater acoustics and in bioacoustics, when discussing target strengths or acousticcharacteristics of animals, the term usually refers to the mass per unit volume of an animal orsome part thereof, given in kg/m3. When discussing volume scattering strengths, the usage mayrefer to abundance, i.e. numbers/m3.
Deconvolution—Mathematically a procedure or calculation that is used to remove the influenceproduced in a data set by a known system response function. For applications involving theremoval of the effects of beam patterns from measurements of target strengths of fish, see Clay,1983 and Stanton and Clay, 1986.
Detected, detection—This term and its variants have at least two meanings, one involving thecalculation of the envelope of an acoustic signal or its analog or digital electronic waveform. In thecontext of the current report the word is used to mean identified as separate from a noise field inwhich it is usually embedded. Helstrom, 1968 is a good reference text on detection theory.
Doppler sonar—An acoustic instrument that measures the change in the acoustic frequency of thescattered sound or echo from that of the transmitted pulse. The magnitude and direction of the shiftin frequency is related to the relative motion of the sensor and the scatterer.
Doppler shift/spread, spectrum width—The Doppler shift of an echo is the change in the meanfrequency of an echo from the mean frequency of the acoustic signal originally transmitted into thewater by an acoustic system. When the scattering is from acoustic reflectors (e.g., fish in a school)that are moving with different speeds or directions in relation to the location of the sensor, theneach echo will have a different Doppler shift. If different parts of an individual are moving with

43
different velocity components in the direction of the sensor or the relative velocity changes during ameasurement (pulse length), then the signal spectrum will be distorted or spread. When the echoesare added together, the result will be a distribution of energy around some mean frequency. Thewidth of the energy distribution is termed the Doppler spread or spectrum width of the echo. Notall of the spectral spread or width is necessarily due to motion, however, since each finite lengthwaveform has a characteristic shape, independent of the Doppler effect.
Drifters—Originally developed to measure currents, this term refers to oceanographic instrumentswhose path is determined by the sum total of the forces imparted by wind, waves, and currents,i.e., they drift. Physical oceanographers have collectively put significant energy into minimizing theeffects of wind and waves in attempting to design instrument platforms to follow particular "waterparcels" in Lagrangian studies.
Dual-beam method—A technique for comparing echo voltage differences received on coaxialnarrow- and wide- beams of an echo sounding or sonar system to determine whether the target isnear the principal axis of the coaxial beams, assuring that the measurement of the target strength ofan organism is near the point of maximum (known) response of the beam (e.g., see Traynor andEhrenberg, 1979). This allows one to place approximate bounds on the acoustic system relatedmeasurement errors associated with estimates of the ratio of incident to reflected acoustic intensityfrom the target of interest, i.e., its target strength.
Echo—A distinct acoustic signal resulting from the reflection of sound from an object.
Echogram—A form of display used to present acoustic data from an echo sounder. Originally, astrip of treated paper moved by a vertically rotating stylus which marked signals detected by theecho sounder on the paper electrically. The rate of the movement of the stylus down the paper wasproportional to the speed of sound in the water. Echoes from near the surface appeared near the topof the paper and echoes from deeper in the water column appeared nearer the bottom of the paperrecord. More modern versions present the same basic kind of display electronically on a computerdisplay or CRT. Colors are sometimes used in this case to encode echo amplitude or some otheracoustic characteristic of the echo (e.g., doppler shift).
Echo integrator, echo integration—An electronic instrument or software package which sums echointensities over a time interval to estimate echo energy. Used in quantifying the scattering fromschools of fish or plankton in bioacoustics. (For example, see Forbes and Nakken, 1972 orMitson, 1983)
Echo sounder—An acoustic system which produces (usually) short acoustic pulses, transmitsthem into the water column vertically and then detects echoes from impedance discontinuities (e.g.,fish, the bottom, or plankton) and displays the result to an operator. Originally used to "sound" forthe bottom for navigation purposes, the technique was adapted for use by fishery biologists byBalls (1948) and refined by successive investigators. It is extensively used by fishermen to locatefish and by fisheries scientists to assess fish populations when the data are quantitatively processby techniques such as echo integration.
ESD—The Equivalent Spherical Diameter is the diameter of a sphere of the same volume as theparticle or animal being described.
ESR—The Equivalent Spherical Radius is the radius of a sphere of the same volume as the
44
particle or animal being described.
Eulerian—For the purposes of this report, Eulerian methods measure processes and/or waterproperties at points in a coordinate system fixed to the earth.
Euphausiid—Common "shrimplike" marine crustaceans which grow to as much as 8 cm inlength, many species of which migrate vertically in the water column. These animals are known tooccur in dense shoals and patches. Euphausiids, or krill, are an important component of manymarine food chains. Adult euphausiids are sufficiently good swimmers that they are consideredby some investigators to be micronekton.
Expendable Acoustic Profiler (EAP)—A low cost active acoustic sensor concept for assessingzooplankton that could be employed (especially from the air) in remote areas such as the Antarctic,where it is costly to send surface research vessels. The device would be expendable, telemeter datato an aircraft and be somewhat analogous to an AXBT.
Fine-scale, fine structure—Structure in any ocean feature or parameter with energy in the spatialrange from about 1 meter to about 100 meters.
Fish larvae—Post-egg, but pre-juvenile fish.
Fluid sphere model—A mathematical description of the spatial scattered acoustic field around aspherical object whose density, compressibility, or both contrast with that of the surroundingmedium. This model, first developed by Anderson (1950) and several variations have been widelyused to describe scattering from zooplankton in the sea. Its popularity, while having some basis ina proven utility for describing some zooplankters and assemblages of small plankton, is also partlydue to its relative analytical tractability and simplicity.
Fluorescence—In the context of this document, the emission of red light by chlorophyll (andphaeopigments) in phytoplankton when stimulated by ultraviolet light. The effect is used to obtainan index of abundance of phytoplankton.
Food web—The interrelated food relationships in an ecosystem.
Frequency—In acoustics, the rate at which an periodic event, e.g., the upward "zero crossing" of apressure waveform, occurs in time. Frequency is the inverse of the period of a signal. The periodis the time interval between two identical points on a repetitive waveform.
Gelatinous zooplankton—Examples include salps, larvaceans, medusae, and ctenophores. These"jellylike" organisms have neither an exoskeleton nor an endoskeleton. Occasionally found inextremely high concentrations.
Geoacoustics—A sub-discipline of geophysics which uses sound reflection and propagation tostudy the subsurface structure of the terrestrial and marine environments.
Geometric scattering—Acoustic scattering in which the wavelength of the sound used is muchsmaller than the size of object causing the scattering.
Georges Bank—A relatively shallow, biologically productive, oceanographic area located off the
45
northeast coast of the United States.
GLOBEC—Global Ocean Ecosystems Dynamics
Holographic Imaging—A method which uses interferometric techniques to record the interferencepattern between an object in 3-D and a reference wave. By shining a laser through the recordingmedium, usually a film, a virtual image of the object can be seen. By focusing the reconstructedimage at different planes, a three dimensional volume can be scanned.
Hydrophone—An underwater microphone. This term describes an acoustic transducer thatreceives sound and converts acoustic pressure to an analogous electrical signal.
Identification—In applications of acoustics to biological issues, usually reserved for association ofa remotely sensed organism with a genera or species. For example, the vocalization of a marinemammal or bird may lead to a unique determination of the species.
Inversion method, algorithm, technique—Any mathematical process which, in the context of thisworkshop report, estimates some property or combination of properties of the ocean environmentfrom observed characteristics acoustic scattering or propagation in the sea. This is in contrast to"forward" calculations, which assume or measure the ocean properties and calculate thecharacteristics of the acoustic parameters one can sense. In most instances, in this document,reference to inverse methods, means the calculation of the abundance and/or sizes of acousticallysensed organisms. The mathematics of many of the inverse methods used in bioacoustics wereadapted from some other field, e.g., geophysics, space technology, or medical research.
Imaging, 3-D—Remote sensing that produces a three dimensional "picture" or analogous displayof an object or some property of an object within a volume, e.g., the acoustic impedance map of anobject or group of objects. One technique uses a sound beam, which may be focused or scanned tointerrogate different look directions as a function of time (or simultaneously with multiple beams).The analysis of the backscattered information can be used to discern the position as well as otherfeatures of animals in the three dimensional field of view.
IR diode laser—A solid state electronic device that is a source of collimated, narrowband light inthe infrared part of the optical spectrum.
JGOFS—Joint Global Ocean Flux Study.
JOI—Joint Oceanographic Institutions Inc.
kHz—The abbreviation for kilohertz, this refers to the units of electronic or acoustic frequency(one thousand cycles per second).
Krill—Norwegian term for euphausiids, originally referring to the North Atlantic speciesMeganyctiphanes norvegica, Thysanoessa inermis, and occasionally T. raschii. The term is oftenused to refer to other species of euphausiids that aggregate in dense swarms or patches.
Lagrangian—Measurements in a Lagrangian coordinate system imply that water properties orbiological processes are measured while following the mean flow of a water parcel, e.g., from adrifter.
46
Laser rangegated imaging—An optical technique which synchronizes the firing of a laser and theopening of a camera shutter after a precise time delay. The method can be used to circumventoptical backscatter limitations of traditional imaging as well as to collect information about only athin slab of targets at a specific range from the camera and light source.
Macrozooplankton—Large (e.g., cm size) plankton that have significant swimming capabilities.An example might be Euphausia superba. Usage varies among different communities.
MAPS—Multifrequency Acoustic Profiling System - Holliday et al., 1989; Pieper and Holliday,1984.
MBARI—Monterey Bay Aquarium Research Institute
Mesopelagic—Referring to mid-depths in the open ocean.
Mesoscale—Oceanic features with scales on the order of 100 to 300 km.
MHz—The abbreviation for megahertz, this is the units of frequency (one million cycles persecond).
Micronekton—A transition term commonly used to describe those animals in the "fish" that aresmall in size, but can effectively swim in the presence of at least moderate currents. Usage variesamong different communities. (Also see macroplankton.)
Micropascal (µPa)—A unit of pressure equal to one millionth of a newton per square meter.
Micro-scale, microstructure—Spatial structure in any ocean feature or parameter with energy atdimensions of less than about 1 meter.
MOCNESS—A multiple net system for sequentially sampling zooplankton at different depths orcollecting serial samples at the same depth (see Wiebe, et al., 1976.)
Mysid—Pelagic or demersal crustaceans of the order Mysidaceae. These organisms are known toswarm and occur both in freshwater lakes and in the marine environment.
Nekton—Aquatic organisms that can effectively swim against relatively strong horizontal currents,e.g., adult fish of many species.
NMFS—National Marine Fisheries Service
NOAA—National Oceanographic and Atmospheric Administration
NSF—National Science Foundation
ONR—Office of Naval Research
Open architecture—A form of instrument or "smart" sensor in which there is planned access tohardware, firmware, or software which allows the "user" to modify or adapt the operating
47
characteristics to fit special circumstances and needs.
Ping—A pulse or other acoustic signal of finite temporal duration introduced into the water by anacoustic system, usually for the purpose of echo ranging on an object (target), detecting itspresence, determining its location, and classifying or identifying it.
Planar sonar array—A group of acoustic transducers, arranged in some pattern on a plane for thepurpose of converting sound into electrical signals or vice versa.
Plankton Image Analyzer—A device developed at URI/NMFS-Narrragansett to enumeratesamples of zooplankton from their recorded images and classify individuals into taxonomicgroups.
Rayleigh scattering—Scattering of a propagating wave, in our case acoustic, when the dimensionof the region or object which is causing the scattering is much less than the wavelength of theensonifying sound.
Reverberation—Acoustic energy reflected from all of the distributed, and often randomly located,scatterers in the path of an acoustic wave. Consists of returns from the surface, inhomogeneities inthe volume and the bottom. A dominant characteristic of reverberation is the stochastic nature ofthe signal, thus multiple samples (pings) must be averaged in order to obtain estimates of thestrength of the process.
ROV—Remotely Operated Vehicle
Sea Beam—An acoustic system usually used by the geophysics community to acquire multibeambathymetry. Has also been used to a limited extent to examine volume scattering.
Shadowgraph—A side-scan sonar with exceptionally high spatial resolution.
SIO/MPL—Scripps Institution of Oceanography, Marine Physical Laboratory
Size-frequency distribution—Histograms, tables, plots or other displays of the abundance oforganisms versus size. Sometimes called "size-abundance distributions" in papers on bioacousticsto minimize confusion with alternate uses of the word "frequency" (See the definition ofFrequency, above.)
Small zooplankton—For the purposes of this workshop and this document, the term "smallzooplankton" was taken to mean zooplankton for which some variant of the fluid sphere scatteringmodel is an appropriate (or at least approximate) mathematical description of the scatteringprocess. This is in contrast to, for example, adult euphausiids, for which there is evidence thatalternate models are better descriptors of the scattering process.
Sonar—Originally an acronym that stands for Sound Navigation and Ranging. In hydroacoustics,it has come to mean an active acoustic sensor which uses a propagation path to the targetorganisms, school or aggregation that is dominantly horizontal as opposed to an echo sounder,where the propagation path for the sound is principally vertical.
Split-beam method—A multibeam target strength measurement technique that uses the phase
48
relationships of a target in the various beams to estimate the location of target and therefore beampattern correction in the composite beam (see Foote, et al., 1986.)
Target—A target is an inhomogeneity in the surrounding medium (in underwater acoustics, thewater), which reflects sound and has finite bounds in relation to the physical volume sampled bythe acoustic system with which the entity was detected. The manifestation of the reflection processis an "echo". This is in contrast to "reverberation", which is the result the reflection of sound froma zone or volume with indefinite size, at least insofar as the measurement system can distinguish.
Target strength—A measure of the reflectivity of an acoustically detected entity with definedphysical bounds (fish, plankter, fish school, etc.). Technically, it is ten times the commonlogarithm of the ratio of the incident intensity of a sound wave of distant origin to the intensityreflected in some specified direction, referred to a fixed reference distance, usually 1 meter fromthe target's "acoustic center". The target strength usually depends on the size, shape and internalstructure of the sound scatterer, the frequency used in the acoustic system, and the contrast of thephysical properties of the target material with the surrounding medium.
Tilt angle—For fish, in particular, the angle at which the animal is ensonified (usually near dorsalaspect for echo sounders) will affect the target strength one would wish to use in estimating thebiomass in a layer or school. If a species swims with other than a horizontal orientation (on theaverage), the tilt angle, or deviation from the horizontal, should be known in order to make anaccurate biomass estimate.
Thermistor—An electronic resistor which has a known dependence on temperature. The change inresistance is used to measure the temperature of the surrounding medium.
Tomographic methods—Mathematical techniques for reconstructing three dimensional volumesfrom the integrated projections along rays. In medical imaging tomography, x-rays are used todetermine the x-ray attenuation coefficient inside of the body. This can then be related to anatomy.Potential uses in oceanography encompass both light and acoustic tomography.
Transducer—In acoustics, a device that is used to convert acoustic energy to electrical energy orvice versa. There are several distinct technologies that are commonly used to accomplish this task.
Triangulation—In general, the unique location of the source of a sound (or echo) from somecombination of at least three ranges and/or bearings in three dimensional space.
Trophic levels—Successive stages of nourishment as represented by links of the food chain.
Underwater Acoustics, Hydroacoustics, Fisheries Acoustics—A branch of physics involving thegeneration, propagation, scattering and reception of sound in the marine environment. The termhydroacoustics is sometimes used in place of underwater acoustics, especially in the fisheriesacoustics community.
Video Plankton Recorder (VPR)—A towed video camera system under development at WHOIwhich is intended to sample on centimeter scales over many kilometer transects.
V-fin—A specially shaped towed body whose hydrodynamics produce a net force downward.Shaped in "end-on" cross section like an inverted "V" or "U", it can be used as a depressor for

49
another body or net system, or as a platform for an oceanographic instrument or sensor such as anacoustic transducer.
Volume reverberation—Acoustic scattering from randomly positioned particles, organisms orother random acoustic impedance discontinuities in the water column. Characterized by thestochastic nature of the acoustic signal, most volume reverberation is of biological origin.
Volume scattering strength—Ten times the common logarithm of the ratio of the acoustic intensityscattered through 1800 from a unit volume (e.g., 1 m3) at a specified reference distance (e.g., 1 m)to the incident plane wave intensity. Usually written SV
WHOI—Woods Hole Oceanographic Institution
Zooplankton—Aquatic animals whose horizontal movements are largely subject to local watercurrents. While the word plankton originated from the Greek work "drifter", many zooplanktersare good swimmers. They do not have the option of changing geographic locations over largedistances, however, without resorting to such tactics as vertical migration to position themselves infavorable currents.

50
11. Appendices
11.1 Appendix A - GLOBEC Steering Committee Members - April 1991
Charles H. Peterson, ChairmanUniversity of North Carolina, Chapel HillInstitute of Marine SciencesMorehead City, NC 28557Phone: (919) 726-6841Omnet/Telemail: C.PETERSON.UNC
James B. EckmanSkidaway Institute of OceanographyP.O. Box 13687Savannah, CA 31416Phone: (912) 356-2467Omnet/Telemail: J.ECKMAN
Dennis HedgecockBodega Marine LaboratoryUniversity of California, DavisP.O. Box 247Bodega Bay, CA 94923Phone: (707) 875-2075Omnet/Telemail: D.HEDGECOCK
Eileen B. HofmannDepartment of OceanographyOld Dominion UniversityNorfolk, VA 23529Phone: (804) 683-5334Omnet/Telemail: E.HOFMANN
D.V. HollidayTracor Applied Sciences9150 Chesapeake DriveSan Diego, CA 92123Phone: (619) 268-9777Omnet/Telemail: V.HOLLIDAY
John R. HunterNOAA I NMFSSouthwest Fisheries CenterP.O. Box 271La Jolla, CA 92038Phone: (619) 546-7127Omnet/Telemail: J.HUNTER
51
Mark B. HuntleyA-002, Marine Biological Resources DivisionScripps Institution of OceanographyLa Jolla, CA 92093Phone: (619) 534-3417Omnet/Telemail: M.HUNTLEY
David L. MackasInstitute of Ocean SciencesP.O. Box 6000Sidney, British ColumbiaCANADA V8L 4B2Phone: (604) 356-6442Omnet/Telemail: via IOS.BC
Donald B. OlsonRosenstiel School of Marine and Atmospheric SciencesUniversity of Miami4600 Rickenbacker CausewayMiami, FL 33149Phone: (305) 361-4063Omnet/Telemail: D.OLSON.RSMAS
Thomas R. Osborn *Department of Earth and Planetary SciencesThe John Hopkins UniversityBaltimore, MD 21218Phone: (301) 338-6326Omnet/Telemail: T.OSBORN
* T. Osborn is on leave 1990-1992Current address is:IOC/UNESCO/7 Place de Fontenoy75700 Paris, FRANCEPhone: (33-1) 45-68-40-25Omnet/Telemail: T.OSBORN
Thomas M. PowellDivision of Environmental StudiesUniversity of California, DavisDavis, CA 95616Phone: (916)752-1180Omnet/Telemail: T.POWELL
52
Allan R. RobinsonCenter for Earth and Planetary PhysicsPierce HallHarvard UniversityCambridge, MA 02138Phone: (617) 495-2819Omnet/Telemail: A.ROBINSON
Brian J. RothschildChesapeake Biological LaboratoryUniversity of MarylandP.O. Box 38Solomons, MD 20688Phone: (301) 326-4281Omnet/Telemail: B ROTHSCHILD
Sharon L. SmithBrookhaven National LaboratoryBuilding 318Upton, NY 11973Phone: (516) 282-2835Omnet/Telemail: S.SMITH.SHARON
John H. SteeleOffice of the PresidentWoods Hole Oceanographic InstitutionWoods Hole, MA 02543Phone: (617) 548-1400Omnet/Telemail: J.STEELE
Leonard J. WalstadCollege of OceanographyOregon State UniversityCorvallis, OR 97331Phone: (503) 737-2070Omnet/Telemail: LWALSTAD
GLOBEC Planning OfficeJoint Oceanographic Institutions, Inc.Suite 8001755 Massachusetts Ave, NWWashington, DC 20036Phone: (202) 232-3900Omnet/Telemail: GLOBEC.STEERING

53
11.2 Appendix B- Workshop Participants
GLOBECWorkshop On
Acoustical Technology and the Integration of Acoustical and OpticalSampling Methods
Charles BaransP.O. Box 12559South Carolina Marine Resources CenterCharleston, S.C. 29412Phone: (803) 762-5084FAX: (803) 762-5001
Mark BermanNOAA/NMFSNarragansett Laboratory28 Tarzwell DriveNarragansett, RI 02882Phone: (401) 782-3210FAX: (401) 782-3201Omnet/Telemail: via K.SHERMAN
Marvin BlizardONR Code 11250A800 North Quincy StreetArlington, VA 22217-5000Phone: (703) 696-4204FAX: (703) 696-3945Omnet/Telemail: M.BLIZARD
Stephen BollensBiology DepartmentWoods Hole Oceanographic InstitutionWoods Hole, MA 02543Phone: (508) 548-1400 x3213
Steven BrandtChesapeake Biological LaboratoryUniversity of MarylandP.O. Box 36Solomons, MD 20688Phone: (301) 326-4281FAX: (301) 326-6342

54
Janusz BurczynskiBiosonics3670 Stone Way, NorthSeattle, WA 98103Phone: (206) 634-0123FAX: (206) 634-0511
Charles ByrneNOAA I NMFS166 Water StreetWoods Hole, MA 02543Phone: (508) 548-5123FAX: (508) 548-5124
Dezhang ChuBigelow Bldg.Woods Hole Oceanographic InstitutionWoods Hole, MA 02543Phone: (508) 548-1400FAX: (508) 457-2195Internet: [email protected]
Larry ClarkNational Science FoundationOcean Sciences DivisionOceanographic Technology Program1800 G Street, NWWashington, DC 20550Phone: (202) 357-7837FAX: (202) 357-7621Omnet/Telemail: L.CLARK
Clarence Clay5033 St. Cyr RoadMiddleton, WI 53562Phone: (608) 238-3225FAX: (608) 262-0693
Lee CulverApplied Research LaboratoryPenn State UniversityP.O. Box 30State College, PA 16804Phone: (814) 865-3383FAX: (814) 865-1615Internet: [email protected]
55
Cabell DavisWoods Hole Oceanographic InstitutionWoods Hole, MA 02543Phone: (508) 548-1400FAX: (508) 457-2195Omnet/Telemail: C.DAVIS.WHOIInternet: [email protected]
Brad DoyleNaval Underwater System CenterNewport Naval BaseNewport, RI 02841Phone: (401) 841-3158FAX: (401) 841-2146
David DowNOAA/NMFS/NEFC166 Water StreetWoods Hole, MA 02543-1099Phone: (508) 548-5123 (Ext. 249)FAX: (508) 548-5124
Charlie FlaggBrookhaven National LaboratoriesOceanographic Science DivisionBldg. 318Upton, NY 11973Phone: (516) 282-3128FAX: (516) 282-2060Omnet/Telemail: C.FLAGG
Kenneth C. FooteInstitute of Marine ResearchP.O. Box 1870 Nordnes5024 BergenNORWAYPhone: 011-475-238-500FAX: 011-475-238-531
Louis GoodmanCode 8219Naval Underwater System CenterNewport Naval BaseNewport, RI 02841Phone: (401) 841-2051FAX: (401) 841-2146Omnet/Telemail: L.GOODMAN
56
Lee GordonRD Instruments9855 Businesspark AveSan Diego, CA 92131Phone: (619) 693-1178FAX: (619) 695-1459Omnet/Telemail: L.GORDON
Jack GreenNOAA I NMFSNarragansett Laboratory28 Tarzwell DriveNarragansett, RI 02882Phone: (401) 782-3240FAX: (401) 782-3201
Charles GreeneBiological Resources ProgramCorson HallCornell UniversityIthaca, NY 14853Phone: (607) 255-5449FAX: (607) 255-8088Omnet/Telemail: C.GREENE
Charles GreenlawTracor Applied Sciences9150 Chesapeake DriveSan Diego, CA 92123Phone: (619) 268-9777FAX: (619) 268-9775Omnet/Telemail: via V.HOLLIDAY
Marvin GrossleinNOAA I NMFS166 Water StreetWoods Hole, MA 02543Phone: (508) 548-5123FAX: (508) 548-5124
Alex HermanBedford Institute of OceanographyP.O. Box 1006Dartmouth, Nova ScotiaCANADA B2Y 4A2Phone: (902) 426-2447FAX: (902) 426-2256Omnet/Telemail: via BEDFORD.INST

57
Roger HewittNOAANational Marine Fisheries ServiceSouthwest Fisheries CenterP.O. Box 271La Jolla, CA 92038Phone: (619) 546-7000FAX: (619) 546-7003Omnet/Telemail: via R.HOLTInternet: [email protected]
Eileen E. HofmannDepartment of OceanographyOld Dominion UniversityNorfolk, VA 23529Phone: (804) 683-5334FAX: (804) 683-5303Omnet/Telemail: E.HOFMANN
D.V. HollidayTracor Applied Sciences9150 Chesapeake DriveSan Diego, CA 92123Phone: (619) 268-9777FAX: (619) 268-9775Omnet/Telemail: V.HOLLIDAY
Mark HuntleyA-002, Marine Biological Resource DivisionScripps Institution of OceanographyLa Jolla, CA 92093Phone: (619) 534-3417FAX: (619) 534-0701Omnet/Telemail: M.HUNTLEY
Lew InczeBigelow LaboratoryWest Boothbay Harbor, ME 04575Phone: (207) 633-2173FAX: (207) 633-6584Omnet/Telemail: L.INCZE
Jules JaffeA-005 Marine Physical LaboratoryScripps Institution of OceanographyLa Jolla, CA 92093Phone: (619) 534-6101FAX: (619) 534-6849Omnet/Telemail: J.JAFFEInternet: [email protected]

58
Adam JillingNaval Underwater System CenterNewport Naval BaseNewport, RI 02841Phone: (401) 841-3158FAX: (401) 841-2146
Phillip LobelBiology DepartmentWoods Hole Oceanographic InstitutionWoods Hole, MA 02543Phone: (508) 457-2000 (Ext. 2634)FAX: (508) 457-2176
William MichaelsNOAA/NMFS/NEFC166 Water StreetWoods Hole, MA 02543Phone: (508) 548-5123FAX: (508) 548-5124
Robert MiyamotoApplied Physics LaboratoryUniversity of Washington1013 NE 40th StreetSeattle, WA 98195Phone: (206) 685-1303FAX: (206) 543-6785Omnet/Telemail: R.MIYAMOTOInternet: [email protected]
Mark OhmanScripps Institution of Oceanography 0227La Jolla, CA 92093Phone: (619) 534-2754FAX: (619) 534-5306Omnet/Telemail: M.OHMAN
Peter OrtnerNOAA I AOML4301 Rickenbacker CausewayMiami, FL 33149Phone: (305) 361-4380FAX: (305) 361-4449Omnet/Telemail: P.ORTNER
59
G.A. PaffenhöferSkidaway Institute of OceanographyP.O. Box 13687Savannah, GA 31416Phone: (912) 356-2489FAX: (912) 356-2751Omnet/Telemail: G.PAFFENHOFER
Richard E. PieperUniversity of Southern CaliforniaHancock Institute for Marine Studies820 South Seaside AvenueTerminal Island, CA 90731Phone: (213) 743-5133FAX: (213) 830-6328Omnet/Telemail: R.PIEPER
David PotterNOAA/NMFS166 Water StreetWoods Hole, MA 02543Phone: (508) 548-5123FAX: (508) 548-5124
Doug SameotoBedford Institute of OceanographyP.O. Box 1006Dartmouth, Nova ScotiaCANADA B2Y 4A2Phone: (902) 426-3272FAX: (902) 426-2256Omnet/Telemail: via BEDFORD INST
Matthew J. SavoieNaval Underwater System CenterNewport Naval BaseNewport, RI 02841Phone: (401) 841-3158FAX: (401) 841-2146
Yvan SimardInstitute Maurice LamontagneP.O. Box 1000Mont Joli, Quebec G5H 3Z4CANADAPhone: (418) 775-6527FAX: (418) 775-6542
60
John SimmondsThe Scottish OfficeAgriculture and Fisheries DepartmentMarine LaboratoryP.O. Box 101Victoria RoadAberdeenSCOTLAND AB9 9DBPhone: 011-44-224-876-544FAX: 011-44-224-879-156
Michael P. SissenwineNOAA/NMFS1335 East-West HighwayRoom 9316, Code FX3Silver Spring, MD 20910Phone: (301) 427-2239FAX: (301) 427-2258Omnet/Telemail: M.SISSENWINE
Sharon SmithBrookhaven National LaboratoriesOceanographic Science DivisionBldg. 318Upton, NY 11973Phone: (516) 282-2835FAX: (516) 282-2060Omnet/Telemail: S .SMITH.SHARON
Tim StantonBigelow Bldg.Woods Hole Oceanographic InstitutionWoods Hole, MA 02543Phone: (508) 548-1400 ext. 2757FAX: (508) 457-2195Omnet/Telemail: T.STANTON.WHOI
John SteeleWoods Hole Oceanographic InstitutionWoods Hole, MA 02543Phone: (508) 548-1400 ext. 2220FAX: (508) 457-2184Omnet/Telemail: J.STEELE
Cindy StraneyNaval Underwater System CenterNewport Naval BaseNewport, RI 02841Phone: (401) 841-3158FAX: (401) 841-2146

61
Rudi StricklerCenter for Great Lakes StudiesUniversity of Wisconsin600 East Greenfield AvenueMilwaukee, WI 53204Phone: (414) 649-3000FAX: (414) 649-3005
Gordon SwartzmanApplied Physics LaboratoryUniversity of Washington1013 NE 40th StreetSeattle, WA 98195Phone: (206) 543-0061FAX: (206) 543-6785Internet: [email protected]
Phillip TaylorNational Science FoundationOcean Sciences DivisionBiological Oceanography Program1800 G Street, NWWashington, DC 20550Phone: (202) 357-9600FAX: (202) 357-7621Omnet/Telemail: P.TAYLOR
Charles ThompsonNOARL Code 243Stennis Space Center, MS 39529Phone: (601) 688-5226FAX: (601) 688-4673
Jim J. TraynorNOAA/NMFSNorthwest and Alaska Fisheries Center,Bldg. # 47600 Sand Point Way NESeattle,WA 98115Phone: (206) 526-4164FAX: (206) 526-6723
Peter WiebeWoods Hole Oceanographic InstitutionWoods Hole, MA 02543Phone: (508) 548-1400FAX: (508) 457-2184Omnet/Telemail: P.WIEBE

62
Alan WirtzPrecision Acoustic Systems7557 Sunnyside Ave, NorthSeattle, WA 98103Phone: (206) 524-4218FAX: (206) 524-4218
Bernard ZahuranecONR Code 1123B800 North Quincy StreetArlington, VA 22217-5000Phone: (703) 696-4590FAX: (703) 696-3945 or (703) 696-4884Omnet/Telemail: B.ZAHURANEC
Len ZedelInstitute of Ocean SciencesP.O. Box 6000Sidney, British ColumbiaCANADA V8L 4B2Phone: (604) 363-6339FAX: (604) 363-6390Omnet/Telemail: via IOS.BC

63
11.3 Appendix C- Meeting Agenda
GLOBECAcoustical Technology Workshop
Woods Hole, MAApril 2 - 4, 1991
Tuesday April 2
0900 Welcome and Logistics Peter WiebeTim Stanton
0910 GLOBEC Program Overview Eileen Hofmann
0945 Atlantic Project Mark Huntley
1020 Pacific Project Mark Ohman
1105 Break
1120 Antarctic Project Mark Huntley
1135 Arabian Sea Project Sharon Smith
1210 Lunch
1315 Fisheries Acoustics Ken Foote
1355 Mesopelagic Fish Acoustics Charles Greenlaw
1425 Euphausiid Acoustics Doug Sameoto
1500 Break
1515 Acoustics & Small Zooplankton Van Holliday
1550 Optical & Acoustical Technology Alex Herman
1640 Organization of Working Groups Van Holliday
1650- 1700 Meeting of Working Group Chairmen

64
Wednesday, April 3
0830-1200 Working Group Discussions
Zooplankton Acoustics Rick Pieper
Macrozooplankton/Micronekton Tim StantonAcoustics
Fisheries Acoustics Jim Traynor
Acoustical I Optical Sensor Integration Peter Ortner
1330-1700 Working Group Discussions (continued)
Thursday. April 4
0800-0930 Working Groups (finalize individual reports)
0930-1030 Group Discussion: Educational and Training Chuck GreeneOpportunities in Bio-acoustical and Steve BrandtBio-optical Oceanography Rudi Strickler
1030-1045 Report of Working Group on Zooplankton Acoustics
1045-1100 Report of Working Group on Macrozooplankton &Micronekton Acoustics
1100-1115 Report of Working Group on Fisheries Acoustics
1115-1130 Report of Working Group on Acoustical & Optical Sensor Integration