Embed Size (px)
Citation preview
Page 1 of 39

This project was supported by funding from the Commonwealth Government Agency Safe Work Australia, SafeWork SA, Australian Research Council Discovery Grants [DP0879007 & DP140103429] and an Australian Research Council Linkage Grant [LP100100449]. Harry Becher is Research Assistant, and Maureen Dollard is Professor of Work and Organisational Psychology, at the University of South Australia.
Correspondence regarding this report may be sent to Maureen Dollard at [email protected]
Page 2 of 39
Creative Commons
ISBN 978-1-76028-921-8 (PDF) 978-1-76028-922-5 (DOCX)
With the exception of the Safe Work Australia logo, this report is licensed by Safe Work Australia under a Creative Commons 3.0 Australia Licence. To view a copy of this licence, visit https://creativecommons.org/licenses/by/3.0/au/deed.en.
In essence, you are free to copy, communicate and adapt the work, as long as you attribute the work to Safe Work Australia and abide by the other licensing terms. The report should be attributed as Psychosocial Safety Climate and Better Productivity in Australian Workplaces: Costs, Productivity, Presenteeism, Absenteeism.
Enquiries regarding the licence and any use of the report are welcome at:
Safe Work Australia
GPO Box 641 Canberra ACT 2601
Email: [email protected]
Disclaimer
The information provided in this document can only assist you in the most general way. This document does not replace any statutory requirements under any relevant state and territory legislation. Safe Work Australia is not liable for any loss resulting from any action taken or reliance made by you on the information or material contained on this document. Before relying on the material, users should carefully make their own assessment as to its accuracy, currency, completeness and relevance for their purposes, and should obtain any appropriate professional advice relevant to their particular circumstances. The views in this report should not be taken to represent the views of Safe Work Australia unless otherwise expressly stated.
Page 3 of 39

Glossary and abbreviationsAbsenteeism: Absence from work.
Depression: Mental health condition characterised by pervasive low mood.
Engagement (work): Fulfilment from work, characterised by vigour, dedication, and absorption.
GDP: Gross Domestic Product, i.e. the value of a country’s net output per year.
Human Capital: The economic value of labour, including knowledge and skills.
Intervention (primary/secondary): Primary interventions aim to prevent disease, secondary interventions aim to reduce the influence of the disease after it has occurred.
Knowledge Application: The ability of employees to translate their knowledge into economic output.
Organisational Climate: Properties of the work environment as perceived by employees.
Quality of Life: General well-being of individuals and society.
Performance (loss): The degree to which the individual achieves their maximum possible productivity. Performance loss refers to the difference between their achieved and possible performance.
Presenteeism: Being present at work but with reduced output.
Productivity: The effectiveness of converting effort into output.
Productivity Commission: Commonwealth Agency that advises the government on microeconomic policy and regulation.
Productivity Growth: Producing more output (e.g., goods and services) without any additional input (e.g., labour, capital).
Psychological Distress: Negative emotional state including anxiety, sadness, and depression.
Psychosocial Safety Climate: Type of organisational climate, characterised by prioritising employee psychological health.
Resources: Resources are aspects of a job that assist in meeting demands.
Sickness Absence: Absence from work due to sickness.
Page 4 of 39
SummaryWhy has this research been done?
Previous research has indicated that addressing psychosocial hazards by improving Psychosocial Safety Climate (PSC) and also improving three psychological health outcomes: depression, psychological distress, and engagement may be effective in reducing sickness absence and presenteeism.
Addressing psychosocial hazards that contribute to human capital costs is an innovative strategy that could improve productivity while also making substantial improvements to the well-being of workers.
Who did we study? Data from the 2014─15 Australian Workplace Barometer (AWB) project were
used in this report. Participants were randomly selected across all states and territories and the data were weighted to ensure the sample was representative of the working population in respective states and territories.
What did we find? The total cost of low levels of PSC to Australian employers is estimated to be
approximately $6 billion per annum.
Workers in low PSC workplaces had significantly higher sickness absence and presenteeism than those in high PSC environments: they took 43 per cent more sick days per month and had a 72 per cent higher performance loss at work, equating to $1887 per employee per year in cost to employers.
The total cost of depression to Australian employers through presenteeism and absenteeism is estimated to be approximately $6.3 billion per annum.
Workers with severe depression took 20 times more sick days per month and had a 270 per cent higher performance loss than those without depression.
Depressed workers cost employers, on average, between $2791 per year (mild depression) to $23 143 per year (severe depression).
Workers with psychological distress took four times as many sick days per month and had a 154 per cent higher performance loss at work than those not experiencing psychological distress. This equates to an average cost of $6309 per annum in comparison with those not experiencing psychological distress.
Relative to workers with high engagement, workers with low engagement have approximately 12 per cent more sick days per month and an average performance loss of 8 per cent, costing employers $4796 per annum.
What do the findings suggest? The results of this study demonstrate a financial impetus for action on employee
psychological health.
What can be done? The productivity of organisations and the health of workers could be improved by
improving the PSC of organisations.
To improve PSC in their organisation, employers can:
Page 5 of 39
o Prioritise measures designed to foster and protect the psychological health of their employees – improving PSC may be an efficient way to start this process.
o Reduce work conditions that predispose poor psychological health, such as excessive demands and work pressure, and insufficient support and job control.
o Monitor PSC, as PSC provides early indications of risks for poor psychological health outcomes - establish PSC as an organisational KPI.
o Encourage employee involvement in developing systems and work conditions that are safe for psychological health.
o Develop communication systems around psychosocial risks and psychological health in order to prevent and manage risks and outcomes.
These findings suggest that establishing and maintaining good PSC in organisations mitigates psychosocial hazards that can result in poor psychological health outcomes. The outcomes of this report are designed to support employers to ensure psychologically healthy workplace for their workers. They do not provide a justification for not employing workers with mental illnesses.
Page 6 of 39
Executive SummaryThis report explores the productivity growth decline problem in Australia and presents an analysis of human capital focused solutions for improving productivity. A boom in productivity growth from the early nineties to the turn of the millennium has been followed by stalled progress in the past decade. The Productivity Commission considers this a matter of high priority, as improving productivity standards is a key component of improving quality of life in society. Improving productivity allows for increased outputs (i.e. goods and services) without the need for additional inputs (e.g., labour, capital). Addressing the psychosocial hazards that contribute to human capital costs is an innovative strategy that can improve productivity while also making substantial improvements to the well-being of workers.
Most Australian workers believe that a psychologically healthy workplace is important. Given that most Australian workers also believe that their workplace is not psychologically healthy, this presents a critical societal issue that the majority want addressed. Poor psychological health leads to reduced productivity as it inhibits workers’ ability to apply their knowledge and skills to their work. In other words, they are unable to convert human capital into output effectively. The primary mechanisms involved in this problem are absence (e.g., sickness absence) and sub-par performance (e.g., presenteeism). Workers with compromised psychological health have more sickness absence and are less productive at work; these issues contribute to productivity loss.
Not addressing psychosocial issues places a burden on society and organisations. The cost of untreated psychological health problems on Australian organisations was recently suggested to be approximately $10.9 billion per year, through absenteeism, presenteeism and workers’ compensation. Psychosocial Safety Climate (PSC) is a recently identified aspect of organisational climate that supports psychological health through policies and practices within an organisation that arise from feedback from listening to workers’ concerns and prioritising and protecting their mental health over production demands. Previous research has suggested that PSC reduces the likelihood of developing psychological health problems that are associated with reduced productivity and increased human capital costs.
Potential psychological health outcomes that PSC may influence include depression, psychological distress, and engagement. A recent estimate of the cost burden of depression on Australian businesses via presenteeism and sickness absence suggested that it costs employers $8 billion per annum. Depression is associated with a 220 per cent higher rate of sickness absence from work, leading to many non-productive days for affected workers. The majority of associated costs emerge from those with mild depression, due to the widespread nature of the disorder. The role of psychological distress (a combination of anxiety, sadness and depression), and engagement (fulfilment from work with vigour, dedication, and absorption) in the prevalence of sickness absence and presenteeism is less well understood.
PSC is essentially the shared perception of employees that senior management have prioritised their mental wellbeing by creating a psychologically healthy workplace. Previous research into creating psychologically healthy workplaces suggests that there is a lucrative Return on Investment (ROI) of $2.30 for every $1 spent on improving individual skills and resilience; supporting employees with mental health conditions, and improving workplace climate to that end. This is due to reduced sick days, presenteeism, and workers’ compensation claims. This suggests that mitigating psychosocial hazards and improving psychological health outcomes is a strong potential target for reducing lost productivity.
Some organisations attempt to improve productivity via increasing pressure on their workers, reducing their workers’ job control and reducing available job rewards. These methods are typically counterproductive, as any short-term productivity increases are more than counteracted by the physical and psychological health problems known to be associated with increased demands and reduced resources (e.g. job strain). These health problems lead to significantly reduced productivity. Providing a psychologically healthy workplace
Page 7 of 39
requires consultation with all key stakeholders, workers and their representatives, employers, and policy makers in order to understand psychosocial issues and methods to address them.
In this study we focus on one psychosocial hazard mitigator and three psychological health outcomes that can potentially reduce human capital costs, improve psychological health and increase productivity growth: PSC; depression; psychological distress; and engagement. Previous research has indicated that addressing PSC and these psychological health outcomes may be effective in reducing sickness absence and presenteeism and therefore, theoretically improving productivity.
The present study interviewed 4242 people (2404 women, 1838 men) in the third round of data collection in the Australian Workplace Barometer project, in 2014-15. These data were weighted to accurately reflect the demographics of the Australian population as per ABS statistics.
We found support for the following hypotheses:
1) Low PSC is related to higher sickness absence and presenteeism
2) Depression is related to higher sickness absence and presenteeism
3) Psychological distress is related to higher sickness absence and presenteeism
4) Higher engagement is related to lower sickness absence and presenteeism (partially supported).
In relation to Hypothesis 1, we found that those in low PSC environments had significantly higher sickness absence and presenteeism than those in high PSC environments. Low PSC workers take 43 per cent more sickness hours per month and have 72 per cent higher performance loss at work. They cost an average of $1887 more per year due to sickness absence and presenteeism than those in high PSC environments. The total cost of low PSC to Australian employers is estimated to be approximately $6 billion per annum.
In relation to Hypothesis 2, we found that those with depression had significantly higher sickness absence and presenteeism than those without depression. Those with severe depression take 20 times more sick days per month and had 270 per cent higher performance loss than those without depression. These workers cost an average of between $2791 per year (for mild depression) to $23 143 per year (for severe depression) more in sickness absence and presenteeism than those without depression. The total cost of depression to Australian employers is estimated to be approximately $6.3 billion per annum.
In relation to Hypothesis 3, we found that those with psychological distress were: taking four times as many sick days per month; have 154 per cent higher performance loss at work; and cost an average of $6309 per year (for mild to severe psychological distress) more in sickness absence and presenteeism than those without psychological distress. The total cost of psychological distress to Australian employers is estimated to be approximately$1 billion per annum.
In relation to Hypothesis 4, we found that those with low engagement were taking 12 per cent more sick days than those with high engagement (and 46 per cent more than those with medium-high engagement). Also, the average performance loss for those with low engagement was 8.1 per cent, costing an average of $4594 per year. Conversely, those with high engagement had no detectable performance loss. The total cost of low engagement to Australian employers is estimated to be approximately $5.4 billion per annum.
We estimate that a medium-sized business with 100 employees and poor PSC could expect to save over $180 000 per year in lost productivity by improving their organisation to meet high PSC benchmarks. Large cost savings are plausible through addressing depression, psychological distress, and engagement, although employers have less direct control over these than PSC. Given that PricewaterhouseCoopers estimates a ROI of 130 per cent when investing in improving psychological health in the workplace and since PSC increases
Page 8 of 39
psychological health, improving PSC has the potential to also improve productivity and worker wellbeing.
The Productivity Commission has outlined potential improvements in technical efficiency via improving labour outputs; we counter with potential obstacles and alternative methods to overcome them. Policy makers are encouraged to utilise this knowledge to set a policy agenda that improves national productivity growth via enhanced organisational standards for PSC.
To improve PSC in their organisations, employers should conduct monitoring of PSC and psychosocial risk levels. This strategy is considered best practice and has been recently adopted by the Australian Public Service Commission as part of its annual census (APSC, 2015). We recommend that employers allow and encourage employees at all levels of the organisation to monitor, establish controls, raise awareness, and participate in education and training, regarding factors that affect psychological health. Finally, utilising job redesign interventions by reducing work conditions that predispose poor psychological health, such as excessive demands and work pressure, and insufficient control and power, will have a positive effect on PSC in the organisation.
Page 9 of 39
IntroductionWorkplace productivity is important for quality of life and standard of living in Australia. Yet concerns have been raised in recent times that national productivity has stalled. In response, economically-focused solutions have been posed such as seeking greater performance from employees without additional resources (e.g., salary, job security; Blinder, 2011). What is not yet generally understood by policy makers and employers is that improving the human capital of the workforce has potential economic benefits for the organisation (e.g. through reduced sickness absence and presenteeism) and society (GDP), in addition to improving the health and wellbeing of workers, and is an important area of future development and further exploration (PricewaterhouseCoopers, 2014).
A very recent survey of 1126 Australian workers (including senior leaders, a mix of lower management, and other employees) revealed that most – over nine out of ten Australian workers – consider it important to safeguard psychological health in the workplace (beyondblue, 2015). Yet approximately half the workers surveyed believed that their workplace is not mentally healthy (beyondblue, 2015). A psychologically healthy workplace is an organisation where the psychological health of employees is valued and support is provided for those with psychological health problems – in other words these organisations have a strong Psychosocial Safety Climate (PSC; Dollard & Bakker, 2010). These workplaces have leaders that prioritise psychological health and establish policies and procedures that support psychological health. High PSC workplaces have manageable demands and working hours, adequate resources and are usually physically safe too. Given that 20 per cent of Australians experience a mental health condition each year (incidence rate; Australian Bureau of Statistics, 2008) with potentially serious outcomes associated with these conditions, tackling work conditions that negatively affect worker psychological health and providing support for these people is a critical area to address in order to improve their health, productivity at work, and the overall wellbeing, quality of life, and productivity of society.
This report focuses on human capital and organisational climate as a means to influence productivity through reducing sickness absence and presenteeism. Human capital is made up of the knowledge-based capabilities of the organisation (e.g., organisational, market knowledge), health, and any other attributes that enhance worker productivity (Gordon, Zhao, & Gretton, 2015), such as worker psychological health, and worker engagement. Loss to productivity occurs when workers are absent, or when they are at work but not performing at their usual capacity (i.e., presenteeism). In this report we consider PSC and three psychosocial health outcomes that could be targeted within Australian organisations to improve human capital, particularly the psychological health of workers, in relation to workplace productivity. First we consider PSC, the workplace climate for psychological health and safety, a climate that is largely driven by senior management; we estimate the dollar improvements that could be made when PSC levels in organisations are raised above evidence-based national benchmarks of poor PSC levels (Bailey, Dollard, & Richards, 2015). Next, we consider worker depression and psychological distress that may arise from any cause, and estimate the cost of depression and psychological distress to Australian employers. Finally, we examine worker engagement in Australia and its influence on sickness absence and presenteeism. We use data from the Australian Workplace Barometer project to estimate these productivity costs.
Productivity in Australia – Growth, Decline in growthProductivity growth is considered the solution to improving living standards in society according to many members of the business community, media commentators, and politicians (Gordon et al., 2015). Productivity improvements provide increased output without additional input costs (Blinder, 2011). From an economic and business perspective, improvements in worker productivity contribute towards a business’s economic
Page 10 of 39
competitiveness and potential profits. In turn productivity growth leads to an increase in Gross Domestic Product (GDP) or per capita income (Productivity Commission, 2008). From a social perspective, this increased income means increased consumption and saving, funding of social activities, and funding of society’s institutions.
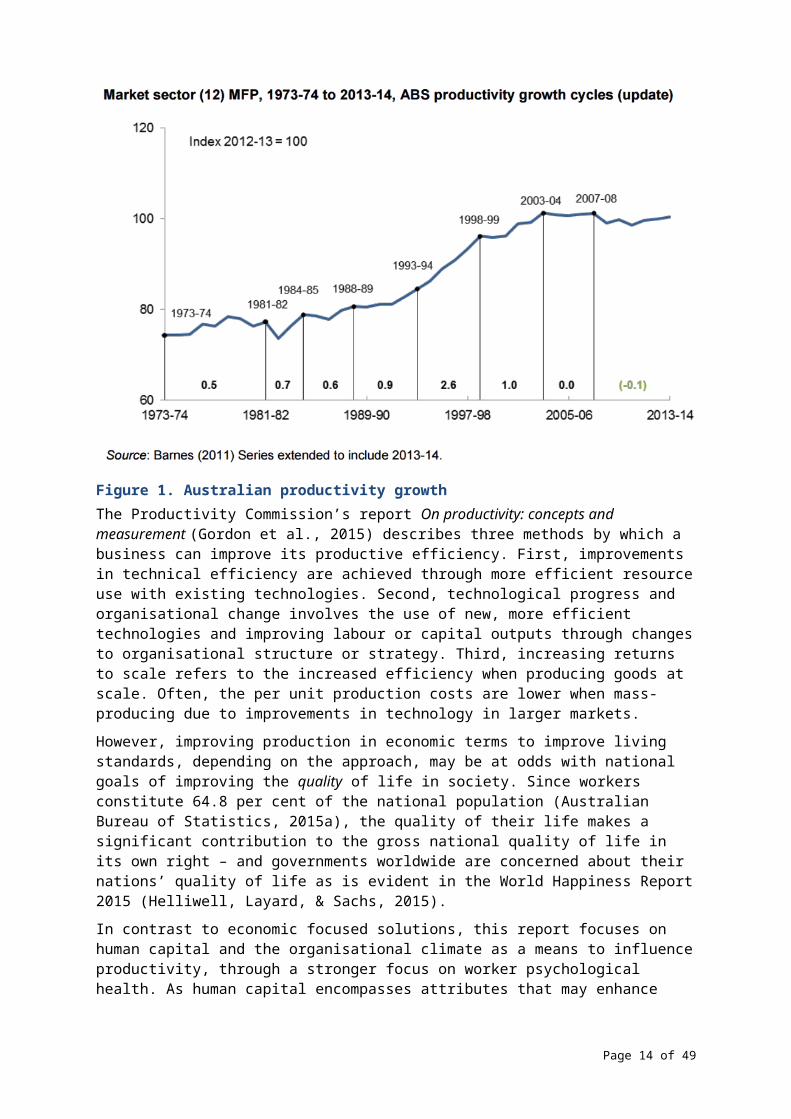
Australian productivity growth has stalled in recent years (Figure 1), prompting examination of potential methods to boost the figure. There are multiple factors contributing towards the plateauing productivity growth. Two of the most pertinent factors are the drought, which reduced productivity in the agricultural sector; and the export boom, which reduced productivity in the mining sector (Productivity Commission, 2008).
Figure 1. Australian productivity growthThe Productivity Commission’s report On productivity: concepts and measurement (Gordon et al., 2015) describes three methods by which a business can improve its productive efficiency. First, improvements in technical efficiency are achieved through more efficient resource use with existing technologies. Second, technological progress and organisational change involves the use of new, more efficient technologies and improving labour or capital outputs through changes to organisational structure or strategy. Third, increasing returns to scale refers to the increased efficiency when producing goods at scale. Often, the per unit production costs are lower when mass-producing due to improvements in technology in larger markets.
However, improving production in economic terms to improve living standards, depending on the approach, may be at odds with national goals of improving the quality of life in society. Since workers constitute 64.8 per cent of the national population (Australian Bureau of Statistics, 2015a), the quality of their life makes a significant contribution to the gross national quality of life in its own right – and governments worldwide are concerned about their nations’ quality of life as is evident in the World Happiness Report 2015 (Helliwell, Layard, & Sachs, 2015).
In contrast to economic focused solutions, this report focuses on human capital and the organisational climate as a means to influence productivity, through a stronger focus on worker psychological health. As human capital encompasses attributes that may enhance productivity, they are a priority in addressing productivity in Australia.
Page 11 of 39
Here we are concerned with workplace factors and health-related quality of life, that may affect workplace performance (e.g., the application of knowledge capabilities), and reduce productivity – in particular deficits that relate to sickness absence and presenteeism. Psychological health problems compromise human capital by diminishing an employee’s ability to apply their knowledge and skills at work. In the context of this study, those suffering from mental health conditions may need to take more sick days to preserve their psychological state, and may be less productive at work due to being disabled by their condition (Lerner & Henke, 2008; Merrill et al., 2013). A recent study concluded that untreated mental health conditions cost Australian organisations $4.7 billion in absenteeism, $6.1 billion in presenteeism, and $146 million in workers’ compensation claims; the total cost to productivity is estimated to be $10.9 billion per year (beyondblue, 2015).
Psychosocial Safety ClimatePSC is “the shared belief held by workers that their psychological safety and well-being is protected and supported by senior management” (Bond, Tuckey, & Dollard, 2010, p. 41). PSC is evident from organisational practices, policies and procedures that promote the psychological safety and wellbeing of workers (Flin & Yule, 2004). By creating a psychologically safe environment, the risk of psychological and social harm for workers is minimised (Dollard & Bakker, 2010). This requires commitment and involvement from senior management to prioritise psychological health to enable workers to utilize resources available to help them cope with their demands (Law, Dollard, Tuckey, & Dormann, 2011).
The state of PSC in Australia is highlighted in a recent report, which found that only 56 per cent of workers believe that their most senior manager considers psychological health important (beyondblue, 2015). While PSC was not measured directly, a psychologically safe workplace is indicative of strong PSC. It is critical that senior management drive the organisational change required to promote the psychological health of their employees. Senior management are in a position to establish positive workplace climate and management practices, and influence the experience of their employees (beyondblue, 2015).
Psychosocial Safety Climate and Job DesignManagers set the tone of an organisation, and have a primary role to play in how jobs are designed. PSC is argued to proceed and inform the way jobs are designed, how demanding jobs will be, and the nature and extent of resources provided to employees to manage the demands (Dollard & McTernan, 2012). Managers who value worker psychological health will design work that is not too demanding, and provide the opportunity for worker autonomy, and social support. PSC has been theorised as an extension of the Job Demand Resources model, and two of its main theoretical pathways. The extended health erosion path predicts that PSC negatively relates to job demands; high demands in turn lead to health erosion, and a reduction in productivity due to sickness absence and presenteeism. The extended motivational pathway predicts that PSC positively relates to resources that in turn positively relate to work engagement, increased productivity because of performance increases and less absence.
There are a number of studies that show that PSC negatively predicts work demands, and positively predicts work resources (Dollard & Bakker, 2010). Research has shown that PSC is a pre-eminent predictor of psychosocial work conditions including job design (i.e., job demands, job resources) and social relational aspects of work (i.e., bullying/harassment), along with employee health and motivational outcomes, such as engagement (Dollard & Bakker, 2010; Law et al., 2011). Evidence from hundreds of studies show that high-strain jobs (jobs that have high demands and low control; e.g., Häusser, Mojzisch, Niesel, & Schulz-Hardt, 2010) and jobs with high effort-reward imbalance (rewards do not match the demands of the job) have a negative impact on psychological and physical health (e.g., increased cardiovascular disease) and health-related quality of life (Silva, Souza, Borges, &
Page 12 of 39
Fischer, 2010). Research shows that PSC predicts both job strain (Bailey, Dollard, & Richards, 2015) and effort-reward imbalance (Owen, Bailey & Dollard, 2016).
PSC and ProductivitySince PSC is a precursor to work quality and productivity enhancing states (positive psychological health, engagement), significant and efficient improvements in productivity could be achieved via PSC and the extended health erosion and extended motivational paths. Results from this research (e.g. Dollard & Bakker, 2010) imply that trying to improve productivity via increasing work pressure, or by reducing job control (job strain) or the level of rewards (i.e., effort-reward imbalance), will in all likelihood lead to psychological health conditions, physical health problems, and productivity decrement.
Yet, in considering how to improve productivity at work, there is often a focus on change and efficiencies, doing more with less (increasing demands, reducing resources). Scaling up and mass production can reduce meaningfulness of work and control at work. The work that humans perform must remain meaningful for basic human psychological needs (e.g., the need for autonomy and competence) to be met, and for workers to maintain their health and keep motivated and engaged at work (Arnold, Turner, Barling, Kelloway, & McKee, 2007).
Knowledge is considered to be the primary competitive advantage in modern firms (Chen, 2004; Matusik & Hill, 1998; Spender & Grant, 1996). Social interaction in the workplace leads to improved knowledge application capabilities (Chen & Huang, 2007). Social interaction acts as a mediator between organisational climate and knowledge management. Psychologically healthy workplaces have employees who are more likely to provide social support for each other, reinforcing the role that senior management play setting the tone for a supportive environment (beyondblue, 2015). Creating a supportive environment in a psychologically healthy workplace improves workers’ abilities to function productively.
Interventions to improve PSCA primary intervention approach to improve productivity via PSC would focus on reducing stressors at their source and improving work conditions. This would include improving communication between management and employees, providing conflict management skills training to management, and job redesign to eliminate unnecessary stressors (Lamontagne, Keegel, Louie, Ostry, & Landsbergis, 2007; Parker, 2015). At a policy level, progress has been made in some countries toward a legislative platform for managing psychosocial risks. For example, the UK has adopted the Management Standards for work-related stress by requiring organisations to meet specific thresholds for the level of psychosocial risks (HSE, 2007; Iavicoli et al., 2014). A secondary intervention approach to improve productivity via PSC would be to target employee psychological and physical reactions to work. Australian return on investment research shows that in addition to direct benefits to psychological wellbeing, creating psychologically healthy workplaces via helping employees resist or manage demands, or unfavourable reactions, has a positive financial/economic return of 130 per cent (PricewaterhouseCoopers, 2014). That is, for every dollar spent on creating psychologically healthy workplaces, the organisation reaps $2.30 in return from reduced lost productivity due to absenteeism and presenteeism and from reduced workers’ compensation claims. Examples of investments that improve the psychological health of an organisation focusing on workers, include:
Worksite physical activity programs
Coaching and mentoring programs
Mental health first aid and education
Resilience training
Cognitive Behaviour Therapy based return-to-work programs
Page 13 of 39
Well-being checks or health screenings
Encouraging employee involvement (PricewaterhouseCoopers, 2014, p. 4).
Given the utility of PSC as both a primary and secondary target for productivity improvements we expect to find a substantial reduced cost associated with productivity loss as PSC increases. Next we explore the link between depression, psychological distress, engagement and productivity loss.
Employee productivity lossDepressionPoor worker health and work stress are detrimental to productivity (LaMontagne, Keegel, Vallance, Ostry, & Wolfe, 2008; McTernan, Dollard, & LaMontagne, 2013). Prior evidence from the AWB project showed that depression costs the Australian economy approximately $8 billion per year through lost productivity at work (McTernan et al., 2013). Furthermore, approximately $693 million of this lost productivity was attributable to workplace bullying and job strain; considering that these social-relational and job design aspects of work are modifiable, we consider that this cost is preventable.
Depression is linked to productivity loss via increased absenteeism rates (Laitinen-Krispijn & Bijl, 2000; Lim, Sanderson, & Andrews, 2000). Depression can lead to an absence rate 220 per cent higher than average (Kessler et al., 1999), costing potentially billions of dollars per year in lost productivity, in addition to the harm caused to individual wellbeing. The hidden cost of even mild depression is becoming more evident, with a recent study suggesting that it makes up the bulk (61 per cent) of depression-linked productivity loss (McTernan et al., 2013). Furthermore, more severe depression is linked to greater productivity deficits.
Given its link to a serious detriment to productivity, addressing depression is also a key target for improving productivity. Treatments for psychological illness may reduce sick days and improve productivity enough to exceed the cost of treatment (Zhang, Rost, Fortney, & Smith, 1999). However, Lim et al. (2000) note the lack of representative samples supporting the efficacy of this individual focused strategy, and identify it as an area in need of closer examination. The present study uses a population-based sample to fill the need for generalisable analyses between work-related impairment and psychological health outcomes.
Greater insight into the depression to sickness absence pathway provides researchers and policy makers with the necessary detail to allow for the development of effective strategies to prevent sickness absence (Laitinen-Krispijn & Bijl, 2000).
Psychological DistressPsychological Distress refers to a collection of related negative emotional states, consisting of anxiety, sadness, and depression (Kessler & Mroczek, 1994). Psychological distress is affected by job design. For example, structural equation modelling analysis has shown a lack of skill discretion and excessive job demands are linked to increased psychological distress (Barnett & Brennan, 1995). Psychological distress has already been shown to lead to increased absenteeism in a sample (n = 323) of UK employees (Hardy, Woods, & Wall, 2003). Researchers also found that the effect is bidirectional; increases in absenteeism are linked to subsequent increases in psychological distress. Other studies have also provided evidence for the causal effect of psychological distress on employee absenteeism and presenteeism (Hardy et al., 2003; Laitinen-Krispijn & Bijl, 2000).
Mental health care training for employees has the effect of improving their own psychological health outcomes as well as improving their ability to support those with psychological health problems around them (beyondblue, 2015).
Page 14 of 39
EngagementEngagement is the opposite of burnout (Schaufeli, Salanova, González-Romá, & Bakker, 2002), and refers to directing one’s energy into physical, cognitive, and emotional labour at work (R. L. Kahn & Byosserie, 1992; W. A. Kahn, 1992). Engagement is characterised by three sets of behaviour: vigour, dedication, and absorption. Vigour is characterised as an energetic and mentally resilient mindset while working. Dedication is reflective of an enthusiastic, proud, and inspired mindset. Finally, absorption is reflective of deep concentration and focus on one’s work. Higher levels of engagement are linked to better job performance and less sickness absence (Merrill et al., 2013). According to Merrill et al. (2013), those who scored highly on one measure of engagement were 70 per cent more likely to rate their job performance as “high” and 35 per cent less likely to have recent absenteeism. They go on to recommend that efforts to improve worker productivity should include employee health improvement and engagement strategies.
CostsAbsenteeismAbsenteeism is the commonly used “hard” measure of productivity loss often used by employers (McLinton & Dollard, 2014). Employees take more time off work when they are stressed, anxious, depressed or psychologically unhealthy; one in five Australian workers report taking time off work for these reasons each year (beyondblue, 2015). This problem is more noticeable in workplaces that employees don’t consider psychologically healthy; 46 per cent of employees take time off for these issues in psychologically unhealthy workplaces. Conversely, in perceived psychologically healthy workplaces, this figure is just 13 per cent. Therefore, workers in perceived psychologically unhealthy workplaces are almost four times more likely to take “mental health days” off work. This again highlights the importance of creating and maintaining a strong PSC in order to preserve well-being and reduce lost productivity. Previous research by PricewaterhouseCoopers estimated the cost of absenteeism caused by psychological health conditions to be approximately $10.8 billion per year in Australia (PricewaterhouseCoopers, 2014).
PresenteeismPresenteeism is a more nuanced form of productivity loss which occurs when employees are at work but do not engage with their work productively due to health problems (McLinton & Dollard, 2014).
In order to make a positive financial return on investment, changes to the psychological health of the workplace made by an organisation should achieve at least a 33 per cent reduction in presenteeism, absenteeism, and workers’ compensation claims (PricewaterhouseCoopers, 2014). At this point, employees will experience the following changes to productivity:
Mild psychological health condition:
o 10 more productive work hours per year
Moderate psychological health condition:
o 52 more productive work hours per year
o 2 fewer days absent
Severe psychological health condition:
o 127 more productive work hours per year
o 13 fewer days absent (PricewaterhouseCoopers, 2014).
Page 15 of 39
HypothesesWe predict the following:
1) PSC is significantly negatively related to sickness absence and presenteeism.
2) Depression is significantly positively related to sickness absence and presenteeism.
3) Psychological Distress is significantly positively related to sickness absence and presenteeism.
4) Engagement is significantly negatively related to sickness absence and presenteeism.
Page 16 of 39
MethodProcedureThis study employs a cross-sectional survey design. The data were collected as part of the Australian Workplace Barometer (AWB; Dollard et al., 2009), a national project for surveillance of workplace trends in psychological health. The AWB is a longitudinal study consisting of representative data from 2009, 2010, 2011, and 2014–2015. The current study used data from all Australian States and Territories from 2014–2015. Participants were randomly chosen from the Australian Electronic White Pages [AEWP]. Continuing and new participants were sent information letters about the study to inform them of its purpose and the intent to contact them by telephone over the coming weeks.
ParticipantsAn initial sample of 20 000 phone numbers from the AEWP were retrieved and 10 908 were excluded due to being unsuitable for the study or unable to be contacted. Only one participant per household could be chosen. Participants were eligible if they were currently employed, over 18 years old, and their birthday was the most recent in the household. This resulted in a sample of 2790 participants for the first study (2009). This method was repeated for all subsequent states and territories.
For follow up surveys (Wave 2, 2010–11, and Wave 3, 2014–15), the same participants were contacted via letter and followed up with a telephone interview. Where participants were no longer available or willing to participate, new participants were recruited to ensure an adequate sample size and representation of the study population. Additional participants were recruited through random mobile phone sampling in addition to the AEWP. There were 2404 females (Mean age = 49.2 years, SD = 11.8) and 1838 males (Mean age = 47.7 years, SD = 12.7). Participants were from NSW (n = 697), WA (n = 700), SA (n = 723), ACT (n = 242), Tasmania (n = 307), NT (n = 164), Queensland (n = 708), and Victoria (n = 701). Weighting was applied to the data to ensure the sample was representative of the populations of the respective States and Territories using the latest Australian Bureau of Statistics (ABS) Labour Force Survey. The weighting changes the distribution of participants in each state as follows: NSW (n = 1482), WA (n = 541), SA (n = 374), ACT (n = 34), Tasmania (n = 45), NT (n = 11), Queensland (n = 786), and Victoria (n = 969).
MeasuresAbsenteeism (sickness absence)We measured sickness absenteeism and presenteeism using questions from the World Health Organization Health and Work Performance Questionnaire (HPQ; Kessler et al., 2003). The sickness absence measure consists of one item, asking “In the past 4 weeks (28 days), how many days did you miss an entire work day because of problems with your physical or mental health?”
Presenteeism (performance loss)Presenteeism was based on the participant’s self-reported performance over the past four weeks (e.g., 60/100; Kessler et al., 2004; Kessler et al., 2003). This was reversed coded and divided by 10, so that scores represented the participant’s shortfall of full productivity (i.e., 4/10). Higher numbers indicate a greater severity of performance loss. We can compare the difference in performance loss across different high-risk groups, e.g., the difference in typical presenteeism between those low in psychological distress and those high in psychological distress. This allows us to determine the influence of PSC and the three psychological health outcomes in the prevalence of presenteeism, and therefore derive their cost burden to
Page 17 of 39
productivity. Absenteeism and presenteeism are commonly measured in this way, e.g., Pricewaterhouse Coopers (2014).
Psychosocial Safety ClimatePSC was measured using the PSC-12, a 12 item questionnaire consisting of four sub-scales (Dollard & Kang, 2007), each with three items. These sub-scales are Management Commitment (e.g., “Senior management show support for stress prevention through involvement and commitment“), Management Priority (e.g., “Senior management considers psychological health to be as important as productivity”), Organisational Communication (e.g., “There is good communication here about psychological safety issues which affect me”), and Participation (e.g., “Employees are encouraged to become involved in psychological safety and health matters”). Responses are scored on a 5-point Likert scale from 1 (strongly disagree) to 5 (strongly agree). PSC benchmarks are derived from Bailey, Dollard, and Richards (2015).
DepressionDepression was measured using nine questions assessing the participant’s mood over the past month using the Patient Health Questionnaire 9 (PHQ-9; Kroenke, Spitzer, & Williams, 2001). Responses are graded based on the frequency of the phenomenon over the past month (e.g., “During the last month, how often were you bothered by little interest or pleasure in doing things?”) with responses ranging between 1 (not at all), 2 (several days), 3 (more than half the days), and 4 (nearly every day). Higher scores are indicative of a greater severity of depression. Benchmarks for the presence of depression were based on Kroenke, Spitzer, and Williams (2001).
Psychological DistressPsychological Distress measures symptoms of anxiety and depression over the previous four-week period using the Kessler 10 scale (Kessler & Mroczek, 1994). The tool includes ten questions that require a response on a five-point Likert scale measuring frequency, ranging from 1 (never) to 5 (all of the time). An example of a question used is “how often did you feel hopeless?” (Kessler & Mroczek, 1994). Higher scores indicate greater severity of stress. While there are no universally agreed groupings of psychological distress severity, interpretation of the presence of psychological distress is based on previous work by Pirkis and Callaly (2010), and Andrews and Slade (2001).
EngagementEngagement was measured using the nine-item version of the Utrecht Work Engagement Scale (UWES-9; Schaufeli, Bakker, & Salanova, 2006), encompassing three sub-scales, vigour (e.g., “At my work, I feel bursting with energy”), dedication (e.g., “My job inspires me”), and absorption (e.g., “I am immersed in my work”). Each sub-scale contains three items. Responses are scored on a seven-point Likert scale, ranging from 1 (never) to 7 (every day). As at the time of writing, there does not appear to be published literature detailing benchmarks for work engagement. As such, low and high engagement will be defined using a median split.
All measures (including absenteeism and presenteeism) included in this report were based on self-reported data collected by the AWB. As a result, these measures are susceptible to bias caused by individuals’ perceptions. Those with negative perceptions about their work environment and psychological health may also have negative perceptions about their own performance.
Page 18 of 39
Statistical AnalysisThere are two main sets of analysis conducted.
1. Estimate the costs to employers of sickness absence and presenteeism that are associated with PSC and the three psychological health outcomesIn preparation, employees were dichotomised into different levels of PSC, psychological distress, depression, and engagement. PSC was dichotomised between those falling within the “low” benchmark (high risk) (≤ 37; prevalence rate [PR] = 32.9 per cent) and everyone else (> 37). Depression was dichotomised between those with no depression (≤ 4) and those with mild to severe depression (≥ 5; PR = 30.0 per cent). Psychological distress was dichotomised between those with no psychological distress (≤ 2) and those with mild to severe psychological distress (≥ 2.1; 13.6 per cent). Engagement was dichotomised between those with below average (< 53; PR = 44.4 per cent) and above average (≥ 53) engagement. The outcomes were also dichotomised. Sickness absence was split between those with no sickness absence days in the last month, and those with one or more. Presenteeism was split between those with 0-20 per cent performance loss in the last month (low presenteeism) and those with 30-90 per cent performance loss (high presenteeism).
Relative Risk Ratios. Logistic binominal regression models with robust variance were conducted in SPSS to determine whether PSC and the three psychological health outcomes predicted sickness absence and presenteeism. Age, sex, and income were entered as covariates. These demographic variables were controlled as previous studies have suggested that these factors also influence psychological health (LaMontagne et al., 2008; Mirowsky & Ross, 1992; Nolen-Hoeksema, 2001). The logistic regressions were conducted to produce the relative risk ratios of each psychosocial risk factor to sickness absence and presenteeism. Since PSC is known to predict depression, distress and engagement (Dollard & Bakker, 2010), and these are likely mediators between PSC and sickness absence and presenteeism, we first considered the relationship between PSC and these outcomes without the other psychological health outcomes in the model.
Population Attributable Risk (PAR) analysis was conducted to estimate the proportion of costs associated with sickness absence and presenteeism that could be eliminated by changing levels of PSC, depression, psychological distress, and engagement in the workplace. PAR is calculated using the following formula: PAR¿100∗¿¿, where P = prevalence of the psychosocial risk factor in the sample, and RR refers to the relative risk ratio of that factor to the relevant outcome, either sickness absence or presenteeism. The combined PAR of PSC and the three psychological health outcomes combined was calculated as 1−(1−PAR1 ) (1−PAR2 ) et cetera, with the PAR of each psychosocial risk factor entered into the equation (Nurminem & Karjalainen, 2001). Productivity costs. For presenteeism we estimated the cost in terms of the annual salary. The average wage is estimated at $58,702 per annum by the Australian Bureau of Statistics (2015b). For absenteeism we estimated costs in terms of the cost of hours lost. We divided the average wage by the average yearly hours worked (1,677) according to AWB data to find the average wage ($34.99 per hour). Performance loss was calculated by taking a worker’s self-assessed productivity over the last month from the average healthy worker’s self-assessed productivity (8.36 out of 10). Healthy workers were those with high PSC and engagement, and low psychological distress and depression. Cost via presenteeism was calculated by taking their annual salary (minus sickness absence cost) and multiplying it by their performance loss. The cost of sickness absence and presenteeism was added to find a combined annual cost. Adjusted costs were then calculated to determine the difference between the two conditions: low PSC vs
Page 19 of 39
medium-high PSC, no depression vs depression, no psychological distress vs mild to severe psychological distress, and low engagement vs high engagement.
These estimates assume an all-cause burden of presenteeism of approximately $27 billion per annum based on baseline productivity in healthy workplaces, i.e., those with low levels of depression and psychological distress, and high levels of PSC and engagement.
Presenteeism costs = ((Average health worker’s productivity 8.36) - (Current Productivity out of 10)) x (average salary $58,702).
Annual sickness absence was calculated by multiplying sickness absence (days in the last month) by 90 [7.5 hours per day x 12 months] to find the amount of hours missed due to sickness absence each year. This number was then multiplied by the average wage to calculate the average cost of sickness absence per person per annum.
Sickness absence costs = (sickness days missed in past 4 weeks) x (7.5 hours worked per day) x (12 months per year) x (average wage $34.99 per hour); see Appendix 1 for clarification on this calculation.
2. Determine average costs of sickness absence and presenteeism per severity levelTo show the average costs of sickness absence and presenteeism for the average worker in different severity levels of a psychosocial risk factor, e.g., low, medium, and high PSC, a compare means analysis was conducted for each of PSC, psychological distress, depression, and engagement, with sickness absence (days of work missed in last 4 weeks for health reasons) and presenteeism (self-reported rating of productivity at work).
For comparing means, PSC, using national benchmarks (Bailey et al., 2015) was split between low (≤ 37; n = 1281), moderate (> 37 and < 41; n = 277), and high (≥ 41; n = 2178). Depression was split, using clinical cut-points (Kroenke, Spitzer, & Williams, 2001) between: None (0-4; n = 2677); Mild (subclinical; 5-9; n = 877); Moderate (clinical; 10-14; n = 245); Moderately severe (clinical; 15-19; n = 77); and Severe (clinical; 20-27; n = 35). Psychological Distress was dichotomised between no psychological distress (≤ 2.0; n = 3667) and mild to severe psychological distress (≥ 2.1; n = 575). Engagement was split into four quartiles: low (≤ 46; n= 1170); moderate-low (46.01-51.99; n = 664); moderate-high (52-57.99; n = 1269); and high (≥ 58; n = 1140).
Page 20 of 39
ResultsDescriptive results for the study variables are shown in Table 1.
Table 1 Descriptive statistics of key variables
N Minimum Maximum M SD
PSC 3753 12 60 40.88 10.26
Depression 4242 0 27 3.75 4.03
Psychological Distress 4242 1 5 1.51 0.52
Engagement 4242 9 63 50.49 10.09
Presenteeism (/100) 4117 0 100 79.65 10.75
Sickness Absence 4159 0 28 0.56 2.30
1. Estimate the costs to employers of sickness absence and presenteeism that are associated with PSC and the three psychological health outcomes Table 2 Logistic regression, sickness absence attributable to PSC and covariates
Prevalence
(per cent)
B
RRa95 per cent C.I. S.E. Sig
PAR
(per cent)
Only PSC in model
Low PSC 32.9 0.33 1.40 1.08-1.80 0.13 0.01 11.6
All factors in model
Low PSC 32.9 0.06 1.06 0.83-1.36 0.13 0.625 n/s
Depression 30.0 0.64 1.89 1.43-2.49 0.14 <.001 21.1
Psychological Distress 13.6
0.321.38 1.03-1.84 0.15 0.031 4.9
Low Engagement 44.4 0.18 1.20 0.92-1.56 0.13 0.172 n/s
Only PSC in model
Annual sickness absence cost attributable to Low PSC
$2,391,733,921
All factors in model
Annual sickness absence cost attributable to Low PSC
n/s
Page 21 of 39
Annual sickness absence cost attributable to Depression
$4,353,608,658
Annual sickness absence cost attributable to Psychological Distress
$1,006,412,938
Annual sickness absence cost attributable to Low Engagement
n/s
Annual sickness absence cost attributable to Low PSC
n/s
All variables are controlled for gender, age, and income. a Relative risk of a sick day in the past 4 weeks.
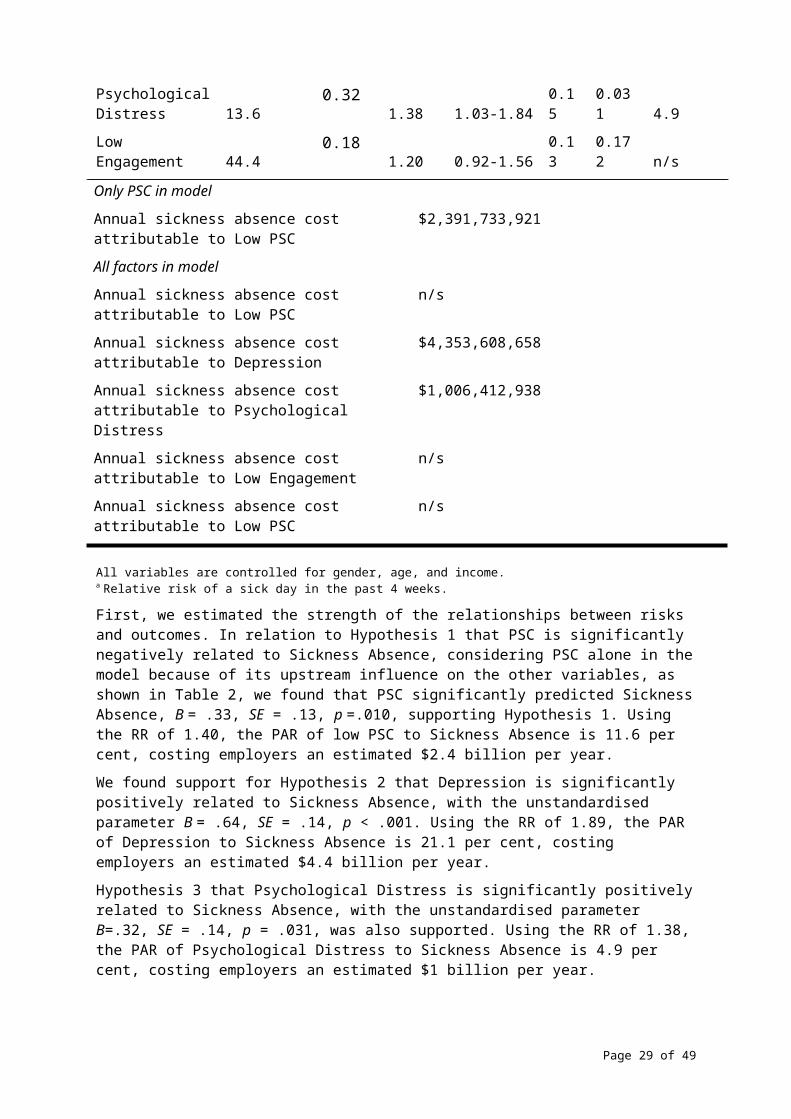
First, we estimated the strength of the relationships between risks and outcomes. In relation to Hypothesis 1 that PSC is significantly negatively related to Sickness Absence, considering PSC alone in the model because of its upstream influence on the other variables, as shown in Table 2, we found that PSC significantly predicted Sickness Absence, B = .33, SE = .13, p =.010, supporting Hypothesis 1. Using the RR of 1.40, the PAR of low PSC to Sickness Absence is 11.6 per cent, costing employers an estimated $2.4 billion per year.
We found support for Hypothesis 2 that Depression is significantly positively related to Sickness Absence, with the unstandardised parameter B = .64, SE = .14, p < .001. Using the RR of 1.89, the PAR of Depression to Sickness Absence is 21.1 per cent, costing employers an estimated $4.4 billion per year.
Hypothesis 3 that Psychological Distress is significantly positively related to Sickness Absence, with the unstandardised parameter B=.32, SE = .14, p = .031, was also supported. Using the RR of 1.38, the PAR of Psychological Distress to Sickness Absence is 4.9 per cent, costing employers an estimated $1 billion per year.
Results did not support Hypothesis 4, that Engagement would be significantly negatively related to Sickness Absence, controlling for covariates, B = -.18, SE = .13, p = .08. Despite not achieving statistical significance here, univariate tests suggest that Engagement is significantly associated with presenteeism but suffers from high collinearity with covariates (see Appendix 2 and 3).
Table 3 Logistic regression, presenteeism attributable to PSC and covariates
Prevalence
(per cent) B RRa95 per cent C.I. S.E. Sig
PAR
(per cent)
Only PSC in model
Low PSC 32.9 0.38 1.46 1.22-1.74 0.09 <.001 13.1
All factors in model
Low PSC 32.9 0.14 1.15 0.96-1.37 0.09 0.143 n/s
Depression 30.0 0.30 1.35 1.10-1.64 0.10 0.003 9.4
Psychological Distress 13.6 0.14 1.15 0.90-1.47 0.12 0.251 n/s
Low Engagement 44.4 0.44 1.56 1.27-1.90 0.10 <.001 19.8
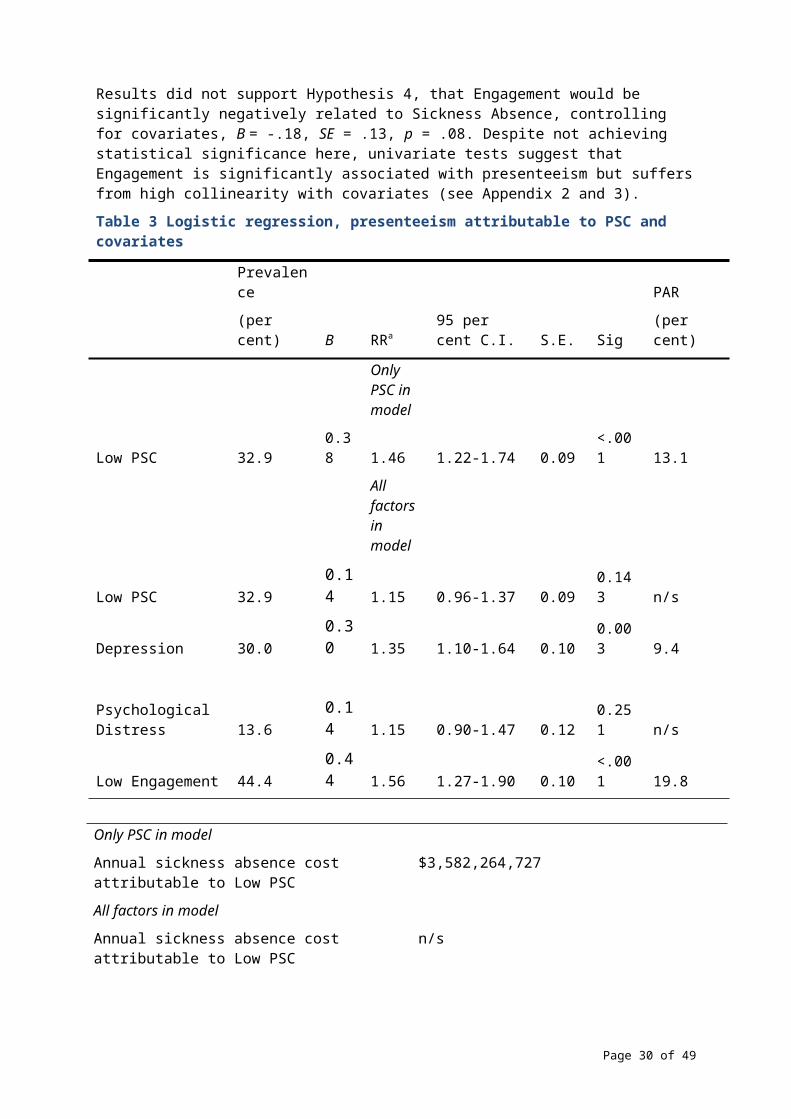
Page 22 of 39
Only PSC in model
Annual sickness absence cost attributable to Low PSC
$3,582,264,727
All factors in model
Annual sickness absence cost attributable to Low PSC
n/s
Annual sickness absence cost attributable to Depression
$1,938,639,454
Annual sickness absence cost attributable to Psychological Distress
n/s
Annual sickness absence cost attributable to Low Engagement
$5,420,184,980
Annual sickness absence cost attributable to Low PSC
n/s
All variables are controlled for gender, age, and income. a Relative risk of high presenteeism in the past 4 weeks.
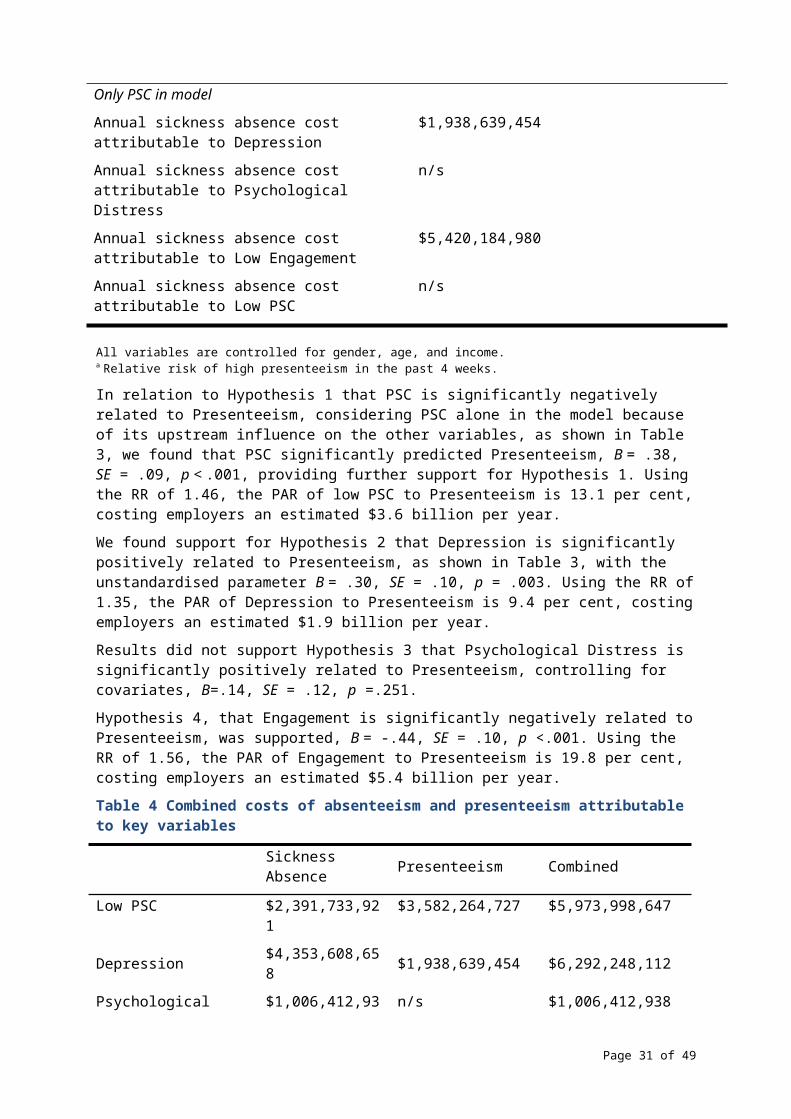
In relation to Hypothesis 1 that PSC is significantly negatively related to Presenteeism, considering PSC alone in the model because of its upstream influence on the other variables, as shown in Table 3, we found that PSC significantly predicted Presenteeism, B = .38, SE = .09, p < .001, providing further support for Hypothesis 1. Using the RR of 1.46, the PAR of low PSC to Presenteeism is 13.1 per cent, costing employers an estimated $3.6 billion per year.
We found support for Hypothesis 2 that Depression is significantly positively related to Presenteeism, as shown in Table 3, with the unstandardised parameter B = .30, SE = .10, p = .003. Using the RR of 1.35, the PAR of Depression to Presenteeism is 9.4 per cent, costing employers an estimated $1.9 billion per year.
Results did not support Hypothesis 3 that Psychological Distress is significantly positively related to Presenteeism, controlling for covariates, B=.14, SE = .12, p =.251.
Hypothesis 4, that Engagement is significantly negatively related to Presenteeism, was supported, B = -.44, SE = .10, p <.001. Using the RR of 1.56, the PAR of Engagement to Presenteeism is 19.8 per cent, costing employers an estimated $5.4 billion per year.
Table 4 Combined costs of absenteeism and presenteeism attributable to key variables
Sickness Absence Presenteeism Combined
Low PSC $2,391,733,921 $3,582,264,727 $5,973,998,647
Depression $4,353,608,658 $1,938,639,454 $6,292,248,112
Psychological Distress $1,006,412,938 n/s $1,006,412,938
Low Engagement n/s $5,420,184,980 $5,420,184,980
All factors (ex PSC) $5,148,118,028 $7,474,503,368 $12,622,621,396
Page 23 of 39
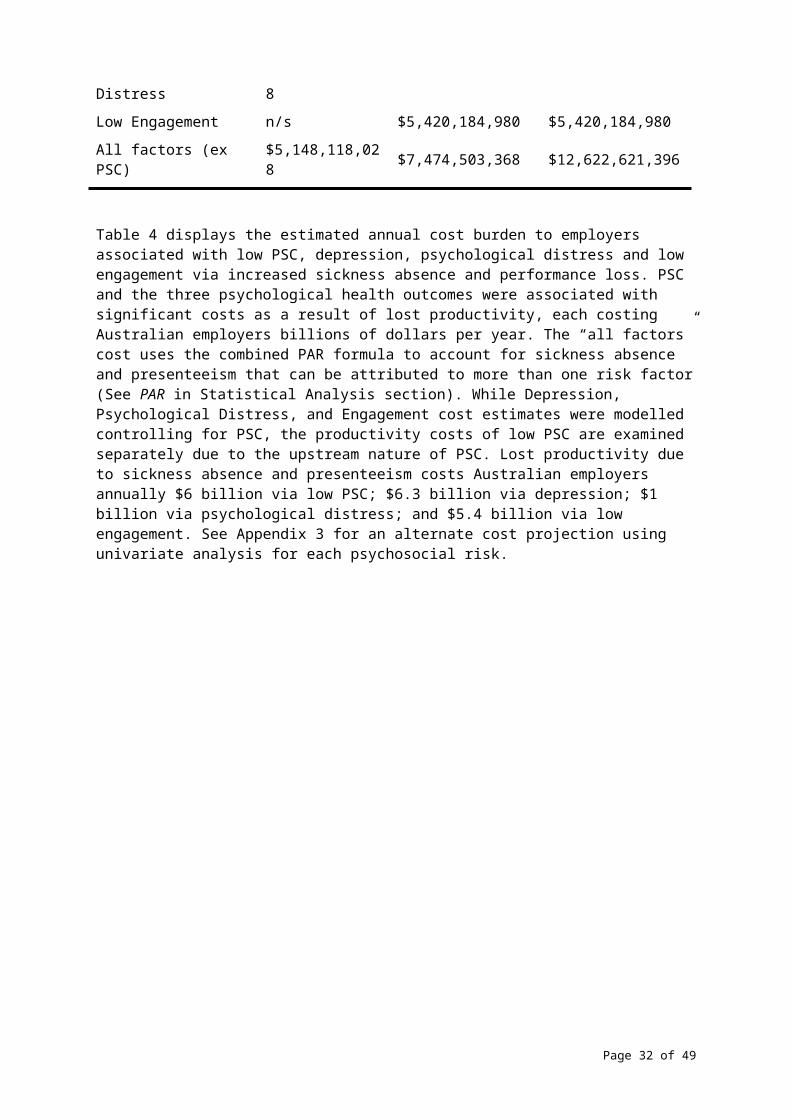
Table 4 displays the estimated annual cost burden to employers associated with low PSC, depression, psychological distress and low engagement via increased sickness absence and performance loss. PSC and the three psychological health outcomes were associated with significant costs as a result of lost productivity, each costing Australian employers billions of dollars per year. The “all factors” cost uses the combined PAR formula to account for sickness absence and presenteeism that can be attributed to more than one risk factor (See PAR in Statistical Analysis section). While Depression, Psychological Distress, and Engagement cost estimates were modelled controlling for PSC, the productivity costs of low PSC are examined separately due to the upstream nature of PSC. Lost productivity due to sickness absence and presenteeism costs Australian employers annually $6 billion via low PSC; $6.3 billion via depression; $1 billion via psychological distress; and $5.4 billion via low engagement. See Appendix 3 for an alternate cost projection using univariate analysis for each psychosocial risk.
Page 24 of 39
2. Determine average costs of sickness absence and presenteeism per severity level Table 5 Sickness absence and presenteeism costs compared in low and high PSC environments
Workers PSCAnnual sickness absence (hours)
Cost via sickness absence
Productivity Loss
(per cent)Cost via presenteeism
Combined annual cost
Adjusted sickness absence cost
Adjusted performance loss cost
Adjusted combined cost
Low 60.3 $2,109 5.5 $3,113 $5,222 $630 $1,257 $1,887
Moderate 59.1 $2,067 5.4 $3,042 $5,108 $588 $1,186 $1,774
High 42.3 $1,479 3.2 $1,856 $3,335 NA NA NA
Low PSC is ≤ 37. Moderate is between 37 and 41 (not inclusive). High PSC is ≥ 41. Based on average income of $58,702.
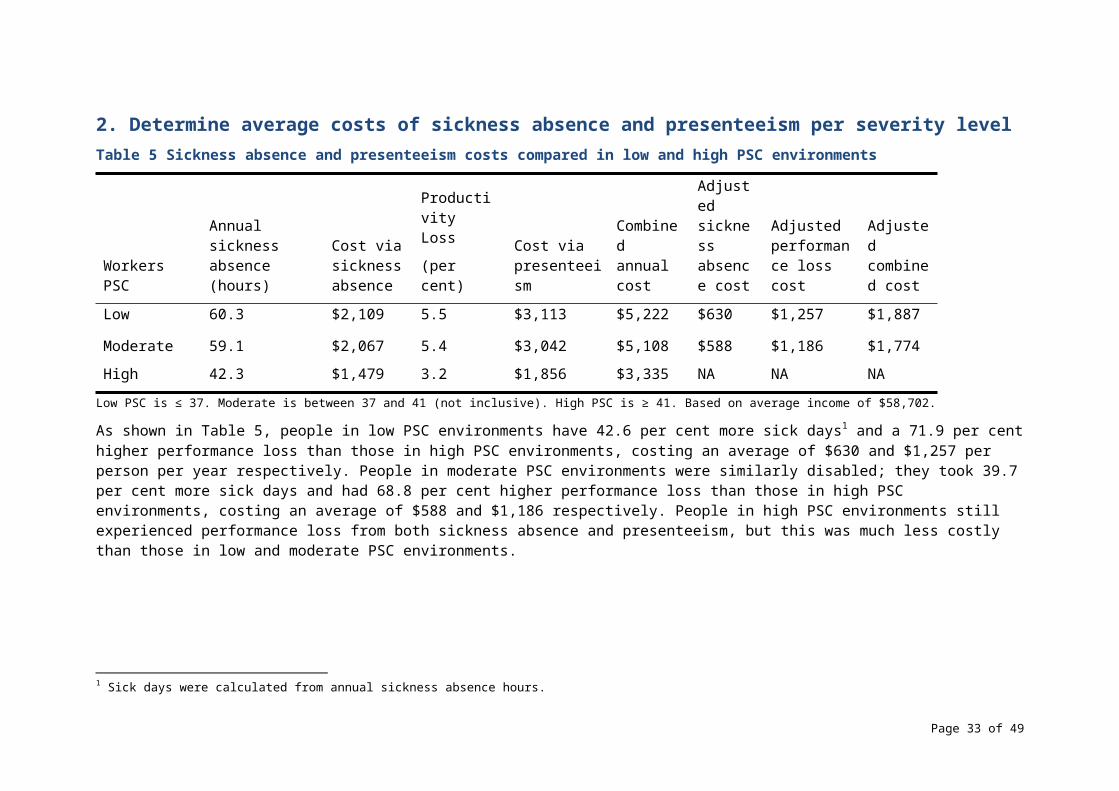
As shown in Table 5, people in low PSC environments have 42.6 per cent more sick days1 and a 71.9 per cent higher performance loss than those in high PSC environments, costing an average of $630 and $1,257 per person per year respectively. People in moderate PSC environments were similarly disabled; they took 39.7 per cent more sick days and had 68.8 per cent higher performance loss than those in high PSC environments, costing an average of $588 and $1,186 respectively. People in high PSC environments still experienced performance loss from both sickness absence and presenteeism, but this was much less costly than those in low and moderate PSC environments.
1 Sick days were calculated from annual sickness absence hours.
Page 25 of 39
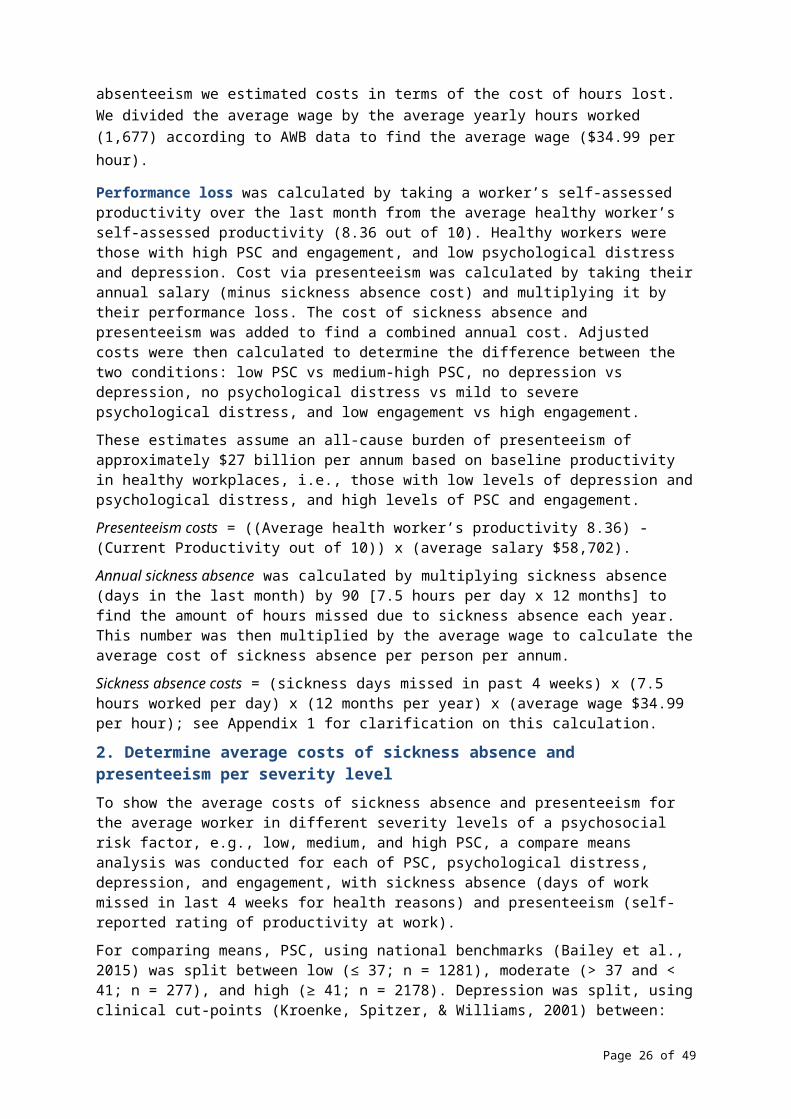
Table 6 Sickness absence and presenteeism costs compared for severity of depression
Depression Annual sickness absence (hours)
Cost via sickness absence
Performance loss
(per cent)
Cost via presenteeism
Combined annual cost
Adjusted sickness absence cost
Adjusted performance loss cost
Adjusted combined cost
None 31.5 $1,102 2.6 $1,498 $2,600 NA NA NA
Mild 59.4 $2,078 5.9 $3,313 $5,391 $976 $1,815 $2,791
Moderate 77.4 $2,708 7.6 $4,272 $6,980 $1,606 $2,775 $4,381
Moderately Severe
249.3 $8,723 12.0 $6,002 $14,725 $7,621 $4,505 $12,126
Severe 633.6 $22,170 9.8 $3,573 $25,743 $21,068 $2,075 $23,143
No depression 0-4; Mild (subclinical) 5-9; Moderate (clinical) 10-14; Moderately severe (clinical) 15-19; Severe (clinical) 20-27. Based on an average income of $58,702.
As shown in Table 6, people with severe depression have approximately 20 times more sick days and 276.9 per cent higher performance loss than those with no depression, costing an average of $21,068 and $2,075 per person per year respectively. Note that there was a relatively small sample size for severely depressed respondents (n = 35) and many of them had taken every day as sickness absence in the past month. While those with mild depression did not have increased sickness absence and presenteeism to the same degree, it is worth noting they make up a larger proportion of the depressed population and therefore produce a larger proportion of the cost burden associated with depression.
Page 26 of 39

Table 7 Psychological distress benchmarks, absenteeism, presenteeism
None ≤ 2.0; Mild to Severe ≥ 2.1. Based on an average income of $58,702.
As shown in Table 7, people with mild to severe psychological distress have 285.4 per cent more sick days than those without psychological distress, costing an average of $3,685 per person per year. Those without psychological distress have an average of 3.3 per cent performance loss. Those with mild to severe psychological distress suffer an average of 8.4 per cent performance loss, costing an additional $2,624 per person per year.
Page 27 of 39
Psychological distress
Annual sickness absence (hours)
Cost via sickness absence
Performance Loss
(per cent)Cost via presenteeism
Combined annual cost
Adjusted sickness absence cost
Adjusted performance loss cost
Adjusted combined cost
None 36.9 $1,291 3.3 $1,889 $3,180 NA NA NA
Mild to Severe 142.2 $4,976 8.4 $4,513 $9,489 $3,685 $2,624 $6,309
Table 8 Engagement benchmarks, absenteeism, presenteeism
Engagement
Annual sickness absence (hours)
Cost via sickness absence
Performance Loss
(per cent)Cost via presenteeism
Combined annual cost
Adjusted sickness absence cost
Adjusted performance loss cost
Adjusted combined cost
Low 60.1 $2,102 8.1 $4,594 $6,696 $200 $4,596 $4,796
Medium-Low 45.2 $1,581 4.6 $2,612 $4,194 -$320 $2,614 $2,294
Medium-High 41.2 $1,440 3.4 $1,950 $3,391 -$461 $1,952 $1,491
High 54.3 $1,902 0.0 -$2 $1,900 NA NA NA
Low is ≤ 46. Medium-Low is 46.01-51.99. Medium-High is 52-57.99. High is ≥ 58. Based on average income of $58,702.
As shown in Table 8, people with low engagement have 10.6 per cent more sick days than those with high engagement, costing an average of $200 per person per year respectively. People with moderate levels of engagement took the fewest sick days, but still had higher presenteeism than the most engaged workers. Those with high engagement meet the benchmark productivity level considered to have no performance loss, whereas the disengaged have an average of 8.1 per cent performance loss, costing an average of $4,596 per person per year.
Page 28 of 39
DiscussionIn this study, we estimated the combined annual costs to organisations from presenteeism and absenteeism attributable to low PSC, depression (clinical and sub-clinical), psychological distress, and low engagement in Australian workplaces to be $6 billion,$6.3 billion, $1 billion, and $5.4 billion respectively.
Sickness AbsenceLost productivity due to sick days is 43 per cent higher for those in low PSC work environments, 20 times higher in severely depressed workers, 285 per cent higher in psychologically distressed workers, and 11 per cent higher in disengaged workers. The combined cost of depression and psychological distress via sickness absence is over $5.1 billion per year, according to our relative risk PAR estimates. Low PSC accounts for almost $2.4 billion per year via sickness absence.
PresenteeismA strong PSC is crucial for workers to be productive at work; people in low PSC environments were found to have 72 per cent higher performance loss at work than those in high PSC environments, costing approximately $1,257 per worker per year. These results are consistent with previous research in the area showing that psychologically unhealthy workplaces suffer greater productivity costs than their psychologically healthy counterparts due to absenteeism and presenteeism (e.g., beyondblue, 2015). The combined cost of depression and low engagement via presenteeism is approximately $7.5 billion per year to employers, according to our relative risk PAR estimates. Low PSC accounts for approximately $3.6 billion per year via presenteeism.
Alternate projectionsMany studies use log odds instead of relative risk ratios to determine the cost burden of disease via population attributable risk analysis. We have chosen to use relative risk due to its suitability for more common risks (i.e. >10 per cent prevalence) and for its ease of comprehension.
Previous studies (e.g., McTernan et al., 2013) used different baseline measurements of productivity compared to our method. For example, McTernan et al. used a baseline productivity of 10/10, and described presenteeism as the percentage below this rate that the participant achieved (e.g., 8/10 = 20 per cent presenteeism). We used a more conservative baseline productivity of 8.36. We believe that 100 per cent self-rated productivity possibly overestimates levels of productivity loss. Using a baseline of 10, all-cause presenteeism costs would be approximately $140 billion per annum, whereas our method suggests all-cause presenteeism costs are approximately $27 billion per annum. While any baseline is somewhat arbitrary, the baseline of 8.36 was established based on the average performance of mentally healthy employees. That is, those with high PSC and engagement, and low depression and psychological distress. As such, we believe that an average of 8.36 is a realistic benchmark to set for employees and organisations.
Implications for businessThese results establish a financial impetus for organisational action on employee psychological health. A medium-sized business with 100 employees and poor PSC could expect to save over $180,000 in lost productivity per year by improving their organisation to meet high PSC benchmarks, based on a difference of $1,887 per employee between low and high PSC organisations. Other per employee costs include $2,791 for mild
Page 29 of 39
depression, $23,143 for severe depression, $6,309 for psychological distress, and $4,796 for low engagement. Addressing any of these areas has potential for cost savings.
The Productivity Commission outlines improvements in technical efficiency such as improving labour outputs as a means to improve productive efficiency at an organisational level. Within this report, we outline psychosocial obstacles to productive efficiency within the labour market. Specifically, we highlight how poor PSC, engagement, and high levels of depression and psychological distress can impact organisations’ output due to sickness absence and presenteeism.
Improvements in technical efficiency are achieved through more efficient resource use with existing technologies. Technological progress and organisational change involve the use of new, more efficient technologies and improving labour or capital outputs with changes to organisational structure or strategy.
We propose that employers prioritise measures to protect employee psychological health. PricewaterhouseCooper’s projections suggested that these secondary measures have a 130 per cent return on investment. That means that the cost of initiatives such as encouraging employee involvement, free mental health screenings, and Cognitive Behaviour Therapy (CBT)-based return to work programs are significantly outweighed by the reduced employers’ costs related to sickness absence, presenteeism and workers compensation. Establishing PSC as a KPI in organisations, alongside common KPIs such as sales and turnover, will encourage management to prioritise psychological health and therefore reduce productivity loss. In order to remain competitive, making these changes may soon become a necessity.
LimitationsIt is important to note that the estimate of lost productivity is a conservative one, due to the use of average wages to calculate lost productivity losses. In most cases, a worker’s economic input to their organisation will exceed their income, so that the organisation will profit. Therefore, if the worker’s actual productive contribution to their organisation was measured, the estimated costs of productivity loss due to absenteeism and presenteeism would likely be significantly higher. The use of average wages to estimate lost productivity has precedent in peer-reviewed research (Gates, Succop, Brehm, Gillespie, & Sommers, 2008; Goetzel et al., 2004). Also, the use of self-report performance data may be inaccurate, as participants’ perception of their own productivity may be influenced by their appraisal style.
Areas for future researchAddressing the self-report performance data problem in future research is critical. Linking self-reported performance to an objective, measureable measure of performance will improve confidence in interpreting self-report performance data in survey-based studies. While PSC, depression, psychological distress, and engagement are significant predictors of sickness absence and presenteeism, they do not explain all of the variance. Including other predictors in future studies will provide businesses with more avenues to improve productivity via human capital.
Policy ImplicationsThis study highlights the importance of addressing psychosocial and human capital costs in order to improve living standards in Australia. Given that productivity growth has declined in recent years, addressing PSC and psychological health outcomes appears to be an innovative method of improving productivity. While organisations can make changes to reduce these costs associated with human capital, policy makers also have the power to make changes via increased standards for psychologically healthy workplaces.
Page 30 of 39
Workplaces are currently required to meet certain standards for the physical safety of their workplace.
Seven jurisdictions (ACT, Cth, NSW, NT, Qld, SA, Tas) have implemented the model Work Health and Safety (WHS) laws. These laws impose a primary duty of care on a person conducting a business or undertaking (PCBU) to ensure the health and safety of their workers at work, so far as is reasonably practicable. The model WHS laws explicitly define health to include physical and psychological health.
Victoria and Western Australia have not implemented the model WHS laws, but the occupational health and safety laws in those jurisdictions impose an equivalent duty on employers.
A worker’s physical and psychological health can be adversely affected by exposure to a poorly designed or managed work environment, a traumatic event, workplace violence, fatigue, bullying, harassment or excessive or prolonged work pressures. Any of these factors can increase the likelihood of a worker experiencing a stress response. If job stress is excessive or prolonged, it may lead to psychological or physical injury.
A PCBU (or employer, in Vic or WA) must manage the risks of physical or psychological harm by eliminating the risks, so far as is reasonably practicable. If elimination is not reasonably practicable, the risks must be minimised so far as is reasonably practicable. They can do this by implementing effective control measures aimed at the work environment and systems of work. Control measures aimed at individuals are usually less effective. The types of controls that should be used may vary depending on what is reasonably practicable for the PCBU (or employer) or workplace. A combination of controls may be required.
At a workplace level, possible controls may include leadership commitment to a mentally healthy workplace, policies and procedures for the prevention of unreasonable behaviours such as bullying, aggression or violence, managing work-related fatigue and a process for consultation with workers.
At an organisational level, possible controls may include designing safe systems of work, workforce planning to ensure the balance between work demands and time pressures are within the workers’ capacity, role clarity, autonomy, recognition and reward and flexible work arrangements.
Safe Work Australia and work health and safety jurisdictions have published a wide range of material relating to psychosocial hazards and their health effects including the Fact Sheet on Preventing Psychological Injury under Work Health and Safety Laws, the Guide for Preventing and Responding to Workplace Bullying, Dealing with Workplace Bullying – a Worker’s Guide, the Guide for Managing the Risk of Fatigue at Work, and Fatigue Management – a Worker’s Guide (Safe Work Australia 2014; 2013a,b,c,d).
Given the evident societal and economic benefits of a psychologically healthy workplace, policy makers could consider legislating to ensure all organisations provide a psychologically healthy workplace, i.e. an organisation high in PSC. While legislation exists to curtail these risks, there appears to be a gap between policy and practice in this area; psychosocial risk management is still somewhat of a rarity in Australian workplaces. Policy developments in some countries (e.g., the Management Standard for work-related stress in the UK) highlight the future of government’s role and responsibility in psychosocial risk management. Legislative requirements for organisations to meet certain safe thresholds for psychosocial risks provides a similar level of consideration to psychosocial safety as is currently afforded to physical safety; a necessary measure to reduce workplace psychological injury.
To improve PSC in their organisation, employers should conduct monitoring of PSC and psychosocial risk levels. This strategy is considered best practice and has been recently adopted by the Australian Public Service Commission as part of ITS annual census
Page 31 of 39
(APSC, 2015). We recommend that employers allow and encourage employees at all levels of the organisation to monitor, establish controls, raise awareness, and participate in education and training, regarding factors that affect psychological health. Finally, utiliSing job redesign interventions by reducing work conditions that predispose poor psychological health, such as excessive demands and work pressure, and insufficient control and power, will have a positive effect on PSC in the organisation.
These findings suggest that establishing and maintaining good PSC in organisations mitigates psychosocial hazards that can result in poor psychological health outcomes. The outcomes of this report are designed to support employers to ensure psychologically healthy workplace for their workers, rather than be used to justify not employing workers with mental illnesses.
Page 32 of 39
ReferencesAndrews, G., & Slade, T. (2001). Interpreting scores on the Kessler psychological distress
scale (K10). Australian and New Zealand Journal of Public Health, 25(6), 494-497.
Arnold, K. A., Turner, N., Barling, J., Kelloway, E. K., & McKee, M. C. (2007). Transformational leadership and psychological well-being: the mediating role of meaningful work. Journal of Occupational Health Psychology, 12(3), 193.
Australian Bureau of Statistics. (2008). 2007 National Survey of Mental Health and Wellbeing: Summary of Results, Table 1. April 28, 2015, from http://www.ausstats.abs.gov.au/ausstats/subscriber.nsf/0/6AE6DA447F985FC2CA2574EA00122BD6/$File/43260_2007
Australian Bureau of Statistics. (2015a). 6202.0 - Labour Force, Australia, Mar 2015 Retrieved May 6, 2015, from http://www.abs.gov.au/AUSSTATS/[email protected]/Lookup/6202.0Main+Features1Mar%202015?OpenDocument
Australian Bureau of Statistics. (2015b). 6302.0 - Average Weekly Earnings, Australia, Nov 2014. April 16 2015, from http://www.abs.gov.au/ausstats/[email protected]/mf/6302.0
Australian Public Service Commission. (2015). State of the service report, psychosocial safety climate. Retrieved from: http://stateoftheservice.apsc.gov.au/2015/11/psychosocial-safety-climate/
Bailey, T. S., Dollard, M. F., & Richards, P. A. (2015). A national standard for psychosocial safety climate (PSC): PSC 41 as the benchmark for low risk of job strain and depressive symptoms. Journal of Occupational Health Psychology, 20(1), 15.
Barnes, P. (2011). Multifactor productivity growth cycles at the industry level. Productivity Comission Staff Working Paper, Canberra.
Barnett, R. C., & Brennan, R. T. (1995). The relationship between job experiences and psychological distress: A structural equation approach. Journal of Organizational Behavior, 16(3), 259-276.
beyondblue. (2015). State of Workplace Mental Health in Australia. Sydney: Beyond Blue.
Blinder, A. S. (2011). Paying for productivity: A look at the evidence: Brookings Institution Press.
Bond, S., Tuckey, M., & Dollard, M. (2010). Psychosocial safety climate, workplace bullying, and symptoms of posttraumatic stress. Organization Development Journal, 28, 37–56.
Chen, C. J. (2004). The effects of knowledge attribute, alliance characteristics, and absorptive capacity on knowledge transfer performance. R&D Management, 34(3), 311-321.
Chen, C. J., & Huang, J. W. (2007). How organizational climate and structure affect knowledge management—The social interaction perspective. International Journal of Information Management, 27(2), 104-118.
Dollard, M. F., & Bakker, A. B. (2010). Psychosocial safety climate as a precursor to conducive work environments, psychological health problems, and employee engagement. Journal of Occupational and Organizational Psychology, 83(3), 579-599.
Dollard, M. F., Hall, G. B., LaMontagne, A. D., Taylor, A. W., Winefield, A. H., Smith, P., & Bakker, A. B. (2009). Australian Workplace Barometer (AWBQ2009). Centre For Applied Psychological Research, University of South Australia.
Page 33 of 39
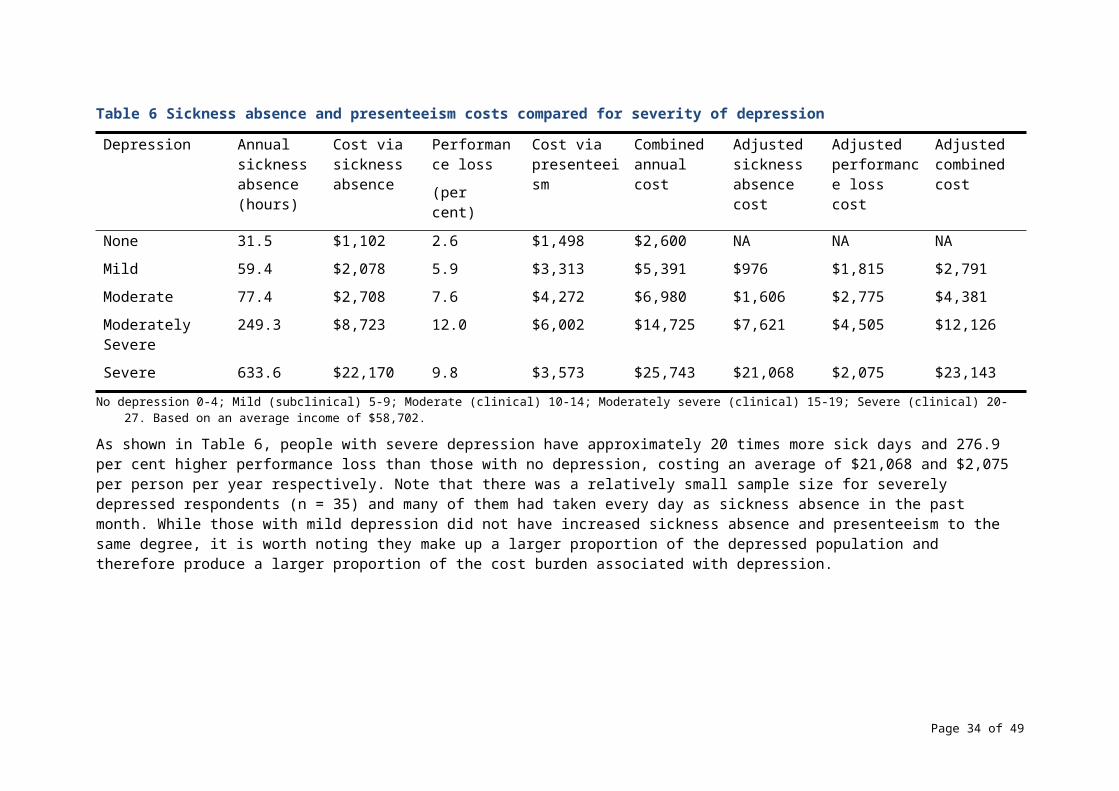
Dollard, M. F., & Kang, S. (2007). Psychosocial safety climate measure. Work & Stress Research Group, University of South Australia, Adelaide.
Flin, R., & Yule, S. (2004). Leadership for safety: Industrial experience. Quality and Safety in Health Care, 13(2), 45.
Gates, D. M., Succop, P., Brehm, B. J., Gillespie, G. L., & Sommers, B. D. (2008). Obesity and presenteeism: the impact of body mass index on workplace productivity. Journal of Occupational and Environmental Medicine, 50(1), 39-45.
Goetzel, R. Z., Long, S. R., Ozminkowski, R. J., Hawkins, K., Wang, S., & Lynch, W. (2004). Health, absence, disability, and presenteeism cost estimates of certain physical and mental health conditions affecting US employers. Journal of Occupational and Environmental Medicine, 46(4), 398-412.
Gordon, J., Zhao, S., & Gretton, P. (2015). On Productivity: Concepts and measurement. Canberra: Productivity Commission.
Hardy, G. E., Woods, D., & Wall, T. D. (2003). The impact of psychological distress on absence from work. Journal of Applied Psychology, 88(2), 306.
Helliwell, J. F., Layard, R., & Sachs J. (Eds.). 2015. World Happiness Report 2015. New York: Sustainable Development Solutions Network.
HSE [Health and Safety Executive] (2007). Managing the causes of work-related stress: A step-by-step approach using the management standards (HSG218). 2nd ed. Sudbury: HSE Books.
Iavicoli, S., Leka, S., Jain, A., Persechino, B., Rondinone, B. M., Ronchetti, M., & Valenti, A. (2014). Hard and soft law approaches to addressing psychosocial risks in Europe: Lessons learned in the development of the Italian approach. Journal of Risk Research, 17(7), 855-869.
Kahn, R. L., & Byosserie, P. (1992). Stress in organizations. In M. D. Dunnete & L. M. Hough (Eds.), Handbook of Industrial and Organizational Psychology (Vol. 3, pp. 571-650). Palo Alto, CA: Consulting Psychologists Press.
Kahn, W. A. (1992). To be fully there: Psychological presence at work. Human Relations, 45(4), 321-349.
Kessler, R. C., Ames, M., Hymel, P. A., Loeppke, R., McKenas, D. K., Richling, D. E., . . . Ustun, T. B. (2004). Using the World Health Organization Health and Work Performance Questionnaire (HPQ) to evaluate the indirect workplace costs of illness. Journal of Occupational and Environmental Medicine, 46(6), S23-S37.
Kessler, R. C., Barber, C., Beck, A., Berglund, P., Cleary, P. D., McKenas, D., . . . Ustun, T. B. (2003). The world health organization health and work performance questionnaire (HPQ). Journal of Occupational and Environmental Medicine, 45(2), 156-174.
Kessler, R. C., Barber, C., Birnbaum, H. G., Frank, R. G., Greenberg, P. E., Rose, R. M., . . . Wang, P. (1999). Depression in the workplace: effects on short-term disability. Health Affairs, 18(5), 163-171.
Kessler, R. C., & Mroczek, D. (1994). Final versions of our non-specific psychological distress scale (Vol. 10). Ann Arbor, MI: Survey Research Centre of the Institute for Social Research.
Kroenke, K., Spitzer, R. L., & Williams, J. B. (2001). The PHQ‐9. Journal of General Internal Medicine, 16(9), 606-613.
Laitinen-Krispijn, S., & Bijl, R. (2000). Mental disorders and employee sickness absence: the NEMESIS study. Social Psychiatry and Psychiatric Epidemiology, 35(2), 71-77.
Page 34 of 39
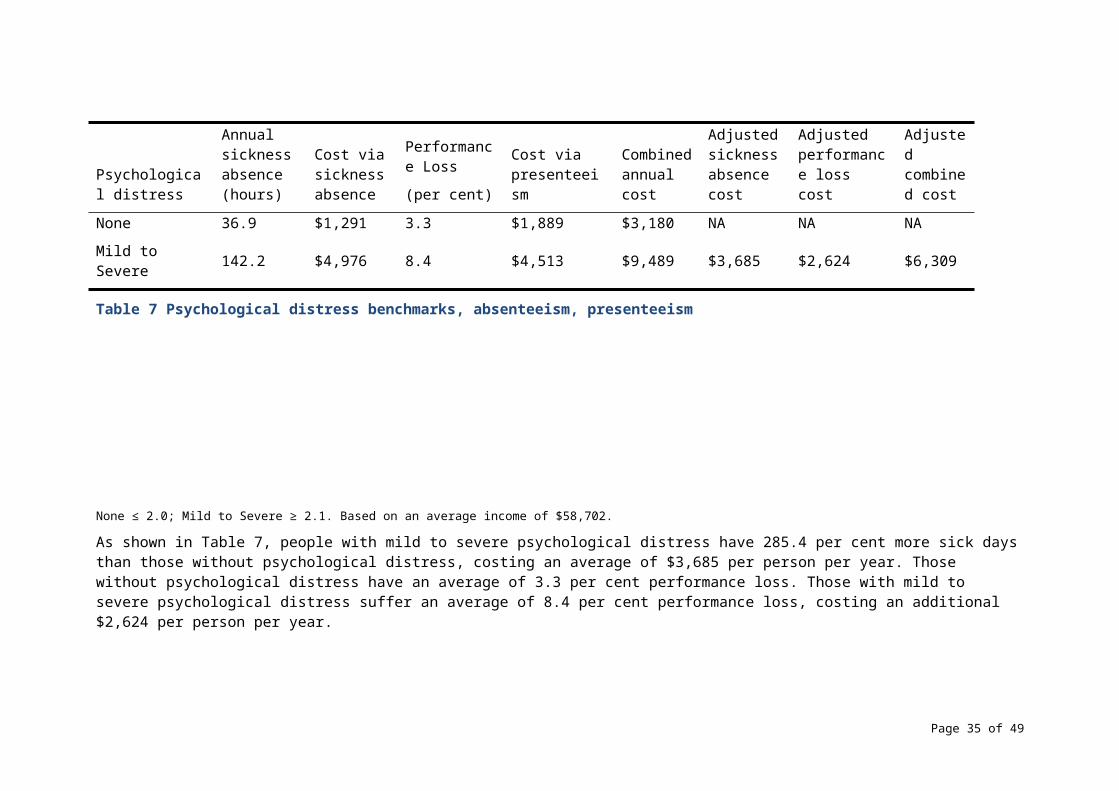
Lamontagne, A. D., Keegel, T., Louie, A. M., Ostry, A., & Landsbergis, P. A. (2007). A systematic review of the job-stress intervention evaluation literature, 1990–2005. International Journal of Occupational and Environmental Health, 13(3), 268-280.
LaMontagne, A. D., Keegel, T., Vallance, D., Ostry, A., & Wolfe, R. (2008). Job strain-attributable depression in a sample of working Australians: Assessing the contribution to health equalities. BMC Public Health, 8, 1-9.
Law, R., Dollard, M. F., Tuckey, M. R., & Dormann, C. (2011). Psychosocial safety climate as a lead indicator of workplace bullying and harassment, job resources, psychological health and employee engagement. Accident Analysis & Prevention, 43(5), 1782-1793).
Lerner, D., & Henke, R. M. (2008). What does research tell us about depression, job performance, and work productivity? Journal of Occupational and Environmental Medicine, 50(4), 401-410.
Lim, D., Sanderson, K., & Andrews, G. (2000). Lost productivity among full‐time workers with mental disorders. The Journal of Mental Health Policy and Economics, 3(3), 139-146.
Matusik, S. F., & Hill, C. W. (1998). The utilization of contingent work, knowledge creation, and competitive advantage. Academy of Management Review, 23(4), 680-697.
McLinton, S., & Dollard, M. (2014). Outcomes that influence workplace productivity: Sickness absence, presenteeism, and engagement. In M. Dollard & T. Bailey (Eds.), The Australian Workplace Barometer: Psychosocial safety climate and working conditions in Australia. Sydney: Australian Academic Press.
McTernan, W. P., Dollard, M. F., & LaMontagne, A. D. (2013). Depression in the workplace: An economic cost analysis of depression-related productivity loss attributable to job strain and bullying. Work & Stress, 27(4), 321-338.
Merrill, R. M., Aldana, S. G., Pope, J. E., Anderson, D. R., Coberley, C. R., Grossmeier, J. J., & Whitmer, R. W. (2013). Self-rated job performance and absenteeism according to employee engagement, health behaviors, and physical health. Journal of Occupational and Environmental Medicine, 55(1), 10-18.
Mirowsky, J., & Ross, C. E. (1992). Age and depression. Journal of Health and Social Behavior, 187-205.
Nolen-Hoeksema, S. (2001). Gender differences in depression. Current Directions In Psychological Science, 10(5), 173-176.
Nurminen, M., & Karjalainen, A. (2001). Epidemiologic estimate of the proportion of fatalities related to occupational factors in Finland. Scandinavian Journal of Work, Environment & Health, 27(3), 161-213.
Kahn, R. L., & Byosserie, P. (1992). Stress in organizations. In M. D. Dunnete & L. M. Hough (Eds.), Handbook of Industrial and Organizational Psychology (Vol. 3, pp. 571-650). Palo Alto, CA: Consulting Psychologists Press.
Owen, M. S., Bailey, T. B., & Dollard, M. F. (in press, 2015). Work stress in Australia. In J. Siegrist & M. Wahrendorf (Ed.), Work stress and health in a globalized economy: The model of effort-reward imbalance (pp.xx-xx). Location, Location (TBC): Springer.
Parker, S. (2015). Does the evidence and theory support the good work design principles. Canberra: Safe Work Australia.
Pirkis, J., & Callaly, T. (2010). Mental health outcome measurement in Australia. In T. Trauer (Ed.) Outcome Measurement in Mental Health: Theory and Practice (pp. 15–23). New York, NY: Cambridge University Press.
Page 35 of 39
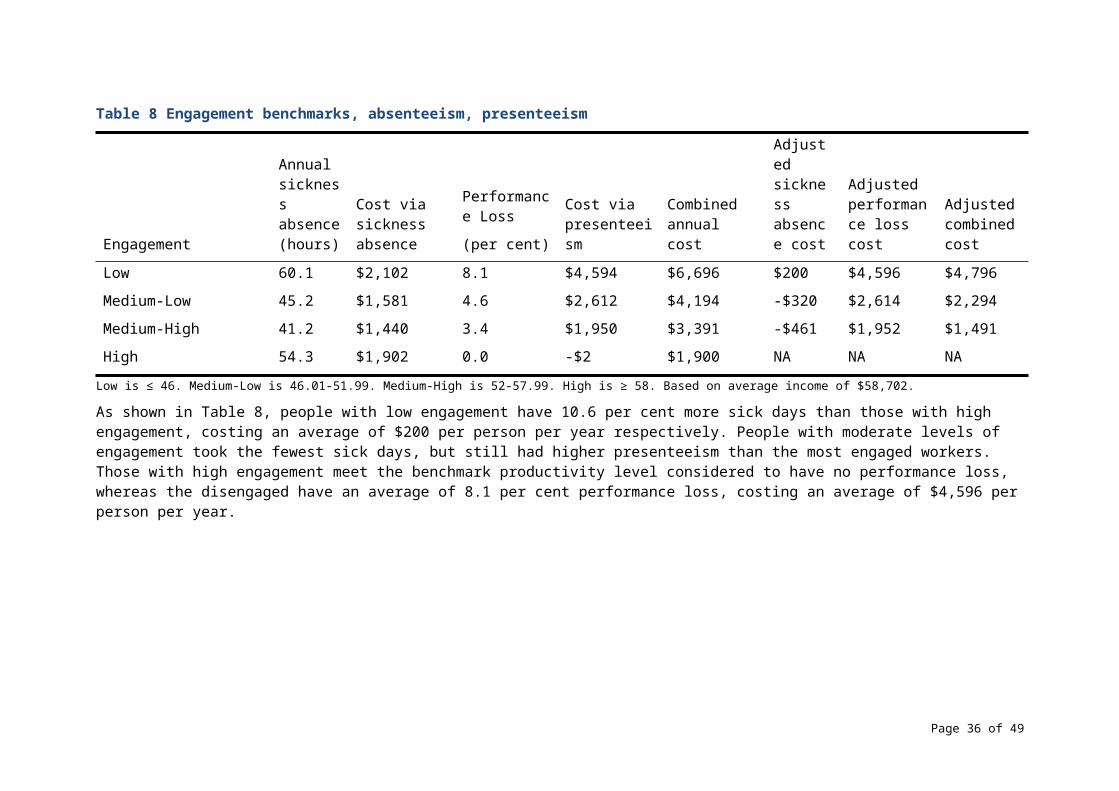
PricewaterhouseCoopers. (2014). Creating a mentally health workplace: Return on investment analysis. National Mental Health Commission.
Productivity Commission. (2008). Annual Report 2007-2008. Canberra: Annual Report Series.
Safe Work Australia (2014). Preventing Psychological Injury Under Work Health and Safety Laws. Canberra: Safe Work Australia.
Retrieved August 310, 2016. Retrieved from:
http://www.safeworkaustralia.gov.au/sites/SWA/about/Publications/Documents/855/Preventing-Psychological-Injury-Under-WHS-Laws.pdf
Safe Work Australia (2013a). Guide For Preventing and Responding to Workplace Bullying, November 2013. Retrieved April 5 2016. Retrieved from: http://www.safeworkaustralia.gov.au/sites/SWA/about/Publications/Documents/827/Guide-preventing-responding-workplace-bullying.pdf
Safe Work Australia (2013b). Dealing with Workplace Bullying – A Worker’s Guide. Canberra: Safe Work Australia.
Retrieved on 310 August, 2016.
Retrieved from: http://www.safeworkaustralia.gov.au/sites/SWA/about/Publications/Documents/828/Workers-Guide-workplace-bullying.pdf
Safe Work Australia (2013c). Safe Work Australia (2013c). Guide for Managing the Risk of Fatigue at Work. Canberra: Safe Work Australia.
Retrieved August 31, 2016.
Retrieved from: http://www.safeworkaustralia.gov.au/sites/SWA/about/Publications/Documents/825/Managing-the-risk-of-fatigue.pdf
Safe Work Australia (2013d). Fatigue Management: A Worker’s Guide. Canberra: Safe Work Australia.
Retrieved on 31 August 2016.
Retrieved from: http://www.safeworkaustralia.gov.au/sites/SWA/about/Publications/Documents/826/Fatigue-Management-A-Workers-Guide.pdf
Schaufeli, W. B., Bakker, A. B., & Salanova, M. (2006). The measurement of work engagement with a short questionnaire a cross-national study. Educational and Psychological Measurement, 66(4), 701-716.
Schaufeli, W. B., Salanova, M., González-Romá, V., & Bakker, A. B. (2002). The measurement of engagement and burnout: A two sample confirmatory factor analytic approach. Journal of Happiness Studies, 3(1), 71-92.
Silva, A. A., Souza, J. M. P. d., Borges, F. N. d. S., & Fischer, F. M. (2010). Health-related quality of life and working conditions among nursing providers. Revista de Saúde Pública, 44(4), 718-725.
Spender, J. C., & Grant, R. M. (1996). Knowledge and the firm: overview. Strategic Management Journal, 17(S2), 5-9.
Zhang, M., Rost, K. M., Fortney, J. C., & Smith, G. R. (1999). A community study of depression treatment and employment earnings. Psychiatric Services, 50(9), 1209-1213.
Page 36 of 39
Appendix 1The formula to calculate sickness absence costs is as follows:
Sickness absence costs = (days missed in past 4 weeks) x (7.5 hours worked per day) x (12 months per year) x (average wage $34.99 per hour).
The average hours per day lost due to a sick day is set at 7.5 hours, despite the presence of part-time and casual workers in the dataset. Participants’ shift lengths were not measured. While some part-time workers may have shorter shifts, this is likely offset by other part-time workers and some full-time workers who work considerably more than 7.5 hours per shift. The amount of lost hours in the past month were multiplied by 12 to extrapolate to a year, even though most full time workers only work 11 months per year after recreational leave. We operated under the assumption that participants were equally as likely to take recreational leave during the study period as any other time, and so any recreational leave would be automatically accounted for.
Page 37 of 39
Appendix 2 Correlation matrix of dichotomised key variables
* Significant at the < .01 level (two-tailed).
Page 38 of 39
1 2 3 4 5 6
1. Low PSC 1
2. Depression .22* 1
3. Psychological Distress .17* .51* 1
4. Low Engagement .25* .23* .17* 1
5. Sickness Absence .09* .21* .21* .08* 1
6. Presenteeism .08* .14* .14* .21* .08* 1
Appendix 3Combined costs of absenteeism and presenteeism attributable to key variablesEstimations based on univariate relative risk, therefore not accounting for covariance. All univariate relative risks were significant, p < .001.
Condition Sickness Absence Presenteeism Combined
Low PSC $2,441,223,910 $2,933,037,137 $5,374,261,047
Depression $6,430,544,077 $4,459,866,213 $10,890,410,290
Psychological Distress $3,969,982,195 $2,742,146,189 $6,712,128,384
Low Engagement $3,442,718,935 $9,238,180,746 $12,680,899,681
All factors $12,218,100,342 $15,171,398,378 $27,389,498,720
Page 39 of 39


![Review of Safe Work Australia’s Role and Functions€¦ · Web viewReview of Safe Work Australia’s Role and Functions August 2016 ISBN 978-1-76028-872-3 [DOCX] With the exception](https://img.pdfslide.net/doc/110x75/5eb3e1dd5fc48409ae118e3a/review-of-safe-work-australiaas-role-and-functions-web-view-review-of-safe-work.jpg)


![Post-implementation review of theFair Work Amendment Act …ris.pmc.gov.au/sites/default/files/posts/2016/04/Amendments-to-the-Fair-Work-Act-2009.pdf978-1-76028-456-5 [PRINT] 978-1-76028-454-1](https://img.pdfslide.net/doc/110x75/5e5c60782125fb56f6238f5c/post-implementation-review-of-thefair-work-amendment-act-rispmcgovausitesdefaultfilesposts201604amendments-to-the-fair-work-act-2009pdf.jpg)
![AUDIT CRITERIA REVIEW EXPLANATION OF … · Web viewAUDIT CRITERIA REVIEW EXPLANATION OF CHANGES April 2015 ISBN 978-1-76028-149-6 978-1-76028-150-2 [DOCX] With the exception of the](https://img.pdfslide.net/doc/110x75/5b0a3d9a7f8b9aba628bd90e/audit-criteria-review-explanation-of-viewaudit-criteria-review-explanation-of-changes.jpg)


![Contents€¦ · Web viewJobs and Training Compact Evaluation Report June 2013 employment.gov.au ISBN 978-1-76028-044-4 978-1-76028-045-1 [DOCX] With the exception of the Commonwealth](https://img.pdfslide.net/doc/110x75/5f0cb02c7e708231d436a497/contents-web-view-jobs-and-training-compact-evaluation-report-june-2013-isbn-978-1-76028-044-4.jpg)


![Managing Risks of Methyl Bromide Exposure when ... · Web viewISBN 978-1-76028-656-9 Multi-VolISBN 978-1-76028-652-1 ISBN 978-1-76028-653-8 [DOCX] Managing risks of methyl bromide](https://img.pdfslide.net/doc/110x75/5e5bb1703e5a1c68e534b55d/managing-risks-of-methyl-bromide-exposure-when-web-view-isbn-978-1-76028-656-9.jpg)


![Guide to handling isocyanates - Safe Work Australia Web view978-1-76028-116-8 978-1-76028-117-5 [DOCX] Guide to handling isocyanatesJuly 2015Page 13 of 13](https://img.pdfslide.net/doc/110x75/5a76773d7f8b9a93088d28d9/guide-to-handling-isocyanates-safe-work-australia-a-doc-fileaa-web.jpg)