Embed Size (px)
Citation preview

GLOW ENERGY PLC.
Date : 11 November 2015
Results for 9M/2015

Disclaimer
The views expressed here may contain information derived from publicly available sources that
have not been independently verified. No representation or warranty is made as to the accuracy,
completeness or reliability of the information. Any forward looking information contained in this
presentation has been prepared based on number of assumptions which may be incorrect and/or
not properly represent actual situation incurring in the future. The actual information contained in
this presentation is for the purpose of illustration and presentation only. Should there be any
discrepancies with audited/reviewed financial statements, annual report, and other official filings to
SEC, the information presented in such documents should be relied upon as official information.
This presentation should not be relied upon as a recommendation or forecast by Glow Group.
This presentation shall not be construed as either an offer to sell or a solicitation of an offer to buy
or sell shares in any jurisdiction.
GLOW GROUP – Results of 9M/2015 – 11/11/2015 2

HEADLINE
COMMENTS
GLOW GROUP – Results of 9M/2015 – 11/11/2015 3

GLOW GROUP – Results of 9M/2015 – 11/11/2015
Headline Comments
• NNP 3Q/15 reported at 2.9 billion THB, up 17.2% YoY.
• Excellent availability of all the main units.
• NNP 9M/15 reported at 7.9 billion THB, up 3.4% YoY.
• Excluding Other Income items (Doosan Settlement, CFB3 Insurance): 7.3 billion THB, down 4.5% YoY.
• Main YTD trends remain valid:
• Cogen: robust volumes and spreads (3 Stg reduction in Ft in September; Tariff rebase in
November).
• Gheco-One: inspection and corresponding impact on availability payments, energy margin and
maintenance costs.
• GIPP: APR step-down and lower dispatch (but also lower depreciation).
• HHPC: lower dispatch.
• THB weakening.
• Favorable impact, mostly from higher availability payments (USD linkage: 50% for Gheco-One with
“deadband”; 90% for GIPP; 85% for HHPC; 50/80% for SPP).
• Core NNP metric disregards unrealized forex gains and losses.
4

GLOW GROUP – Results of 9M/2015 – 11/11/2015
RESULTS
OVERVIEW
5
GLOW GROUP – Results of 9M/2015 – 11/11/2015
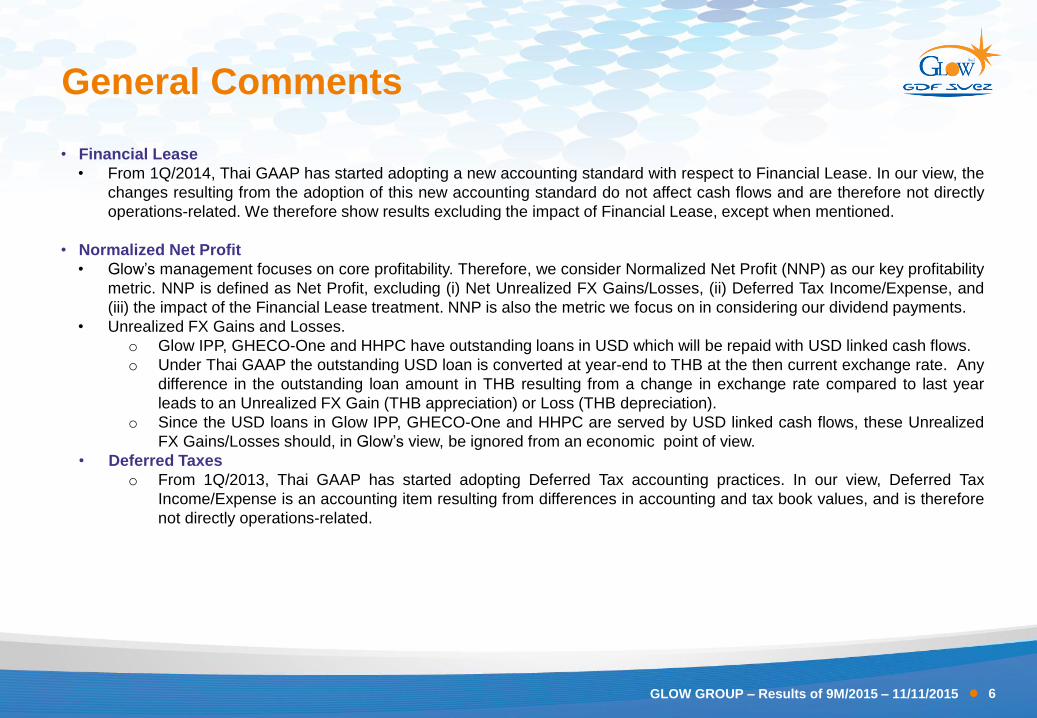
• Financial Lease
• From 1Q/2014, Thai GAAP has started adopting a new accounting standard with respect to Financial Lease. In our view, the
changes resulting from the adoption of this new accounting standard do not affect cash flows and are therefore not directly
operations-related. We therefore show results excluding the impact of Financial Lease, except when mentioned.
• Normalized Net Profit
• Glow’s management focuses on core profitability. Therefore, we consider Normalized Net Profit (NNP) as our key profitability
metric. NNP is defined as Net Profit, excluding (i) Net Unrealized FX Gains/Losses, (ii) Deferred Tax Income/Expense, and
(iii) the impact of the Financial Lease treatment. NNP is also the metric we focus on in considering our dividend payments.
• Unrealized FX Gains and Losses.
o Glow IPP, GHECO-One and HHPC have outstanding loans in USD which will be repaid with USD linked cash flows.
o Under Thai GAAP the outstanding USD loan is converted at year-end to THB at the then current exchange rate. Any
difference in the outstanding loan amount in THB resulting from a change in exchange rate compared to last year
leads to an Unrealized FX Gain (THB appreciation) or Loss (THB depreciation).
o Since the USD loans in Glow IPP, GHECO-One and HHPC are served by USD linked cash flows, these Unrealized
FX Gains/Losses should, in Glow’s view, be ignored from an economic point of view.
• Deferred Taxes
o From 1Q/2013, Thai GAAP has started adopting Deferred Tax accounting practices. In our view, Deferred Tax
Income/Expense is an accounting item resulting from differences in accounting and tax book values, and is therefore
not directly operations-related.
General Comments
6

GLOW GROUP – Results of 9M/2015 – 11/11/2015
9M/2015 Headline P&L
9M/2015 Act 9M/2015 Act without lease
with lease without lease vs with lease
Revenue 50,691 51,509 818
Gross Margin 18,766 19,584 818
Depreciation 3,233 3,484 251
EBIT 11,882 12,449 567
Exchange Gain(Loss) (1,327) (1,327) 0
- Realised exchange gain / loss 47 47 0
- Unrealised exchange gain / loss (1,374) (1,374) 0
Profit Before Tax 8,291 8,858 567
Corporate Income Tax 903 903 0
Deferred Tax (3) 105 108
Net Profit 6,461 6,897 436
7

GLOW GROUP – Results of 9M/2015 – 11/11/2015
9M/2015 P&L Comparison (without lease) Difference
2015 Act 2015 Act
2014 Act 2015 Act vs 2014 Act vs 2014 Act (%)
Revenue 56,515 51,509 (5,006) -8.9%
Gross Margin 19,450 19,584 134 0.7%
EBITDA 16,265 15,933 (332) -2.0%
EBIT 12,467 12,449 (18) -0.1%
Exchange Gain(Loss) 252 (1,327) (1,579) (626.6%)
- Realised exchange gain / loss 60 47 (13) -21.7%
- Unrealised exchange gain / loss 192 (1,374) (1,566) -815.6%
Profit Before Tax 10,207 8,858 (1,349) -13.2%
Corporate Income Tax 886 903 17 1.9%
Deferred Tax 70 105 35 50.0%)
Net Profit 7,762 6,897 (865) -11.1%
Normalized Net Profit 7,650 7,934 284 3.7%
8

GLOW GROUP – Results of 9M/2015 – 11/11/2015
Quarterly P&L Comparison (without lease) Comparison Comparison
3Q/2015 vs. 3Q/2015 vs.
3Q/2014 2Q/2015 3Q/2015 3Q/2014 2Q/2015
Revenue 18,010 17,398 17,855 (155) 457
Gross Margin 6,366 6,783 6,544 178 (239)
EBITDA 5,216 5,535 5,446 230 (89)
EBIT 3,928 4,345 4,339 411 (6)
Exchange Gain(Loss) 45 (425) (1,011) (1,056) (586)
- Realised exchange gain / loss 11 79 37 26 (42)
- Unrealised exchange gain / loss 34 (504) (1,048) (1,082) (544)
Profit Before Tax 3,149 3,162 2,599 (550) (563)
Corporate Income Tax 240 234 241 1 7
Deferred Tax 17 38 42 25 4
Net Profit 2,457 2,462 2,116 (341) (346)
Normalized Net Profit 2,442 2,787 2,861 419 74
9

GLOW GROUP – Results of 9M/2015 – 11/11/2015
SELECTED
KEY DRIVERS
10

4111
3642
YTD Sep/2014 YTD Sep/2015
GLOW GROUP – Results of 9M/2015 – 11/11/2015
IPP Availability and Dispatch IPP Business
GHECO-One Dispatch (GWh)
HHPC Dispatch (GWh)
3359
2348
YTD Sep/2014 YTD Sep/2015
463
334
YTD Sep/2014 YTD Sep/2015
GIPP Dispatch (GWh)
-30.1%
963 (+21.0%)
510 (-47.1%)
839 (+64.6%)
796 1,000 (+19.2%)
458
126 212
272
426
265
83 75
351 316 241 282
415
279 306
0
200
400
600
Jul-14 Aug-14 Sep-14 Oct-14 Nov-14 Dec-14 Jan-15 Feb-15 Mar-15 Apr-15 May-15 Jun-15 Jul-15 Aug-15 Sep-15
492 471 448 475 473 450
43
371
490 431 396
474 490 484 461
0
100
200
300
400
500
600
Jul-14 Aug-14 Sep-14 Oct-14 Nov-14 Dec-14 Jan-15 Feb-15 Mar-15 Apr-15 May-15 Jun-15 Jul-15 Aug-15 Sep-15
1,398 (-0.9%)
904 (-35.4%)
1,301 (+44.0%)
1,411 1,435 (+10.3%)
146 (+22.9%)
98 (-33.1%)
189 (+93.5%)
119 48 (-74.6%)
65
26 28
68
43 35
10
26
61 70 67
52
17 17 14
0
20
40
60
80
Jul-14 Aug-14 Sep-14 Oct-14 Nov-14 Dec-14 Jan-15 Feb-15 Mar-15 Apr-15 May-15 Jun-15 Jul-15 Aug-15 Sep-15
29 days outage YTD-Sep 2015 (29 days unplanned outage), 1 day outage in the quarter.
EGAT requested reserved shutdown from time-to-time during 2015 (Unit1: 64 days and
Unit2: 67 days).
Major planned maintenance during Jan-Feb/2015.
49 days outage YTD-Sep 2015 (37 days planned maintenance , 12 days unplanned outage),
1 day outage in the quarter.
Planned maintenance during 13/Jan-05/Feb/2015.
38 days outage YTD-Sep 2015 (24 days planned maintenance, 14 days unplanned
outage), 10 days outage in the quarter.
-11.4%
-27.7%
11
81.59%
94.45%
95.15%
94.45%
YTD-Sep 15 w/ PlannedMaintenance
YTD-Sep 14 w/ PlannedMaintenance
YTD-Sep 15 w/o PlannedMaintenance
YTD-Sep 14 w/o PlannedMaintenance
GIPP Availability
94.74%
97.53%
YTD-Sep 15
YTD-Sep 14
GHECO-One Availability
2206 2190
YTD Sep/2014 YTD Sep/2015
-0.7%
GLOW GROUP – Results of 9M/2015 – 11/11/2015
2107
2236
YTD Sep/2014 YTD Sep/2015
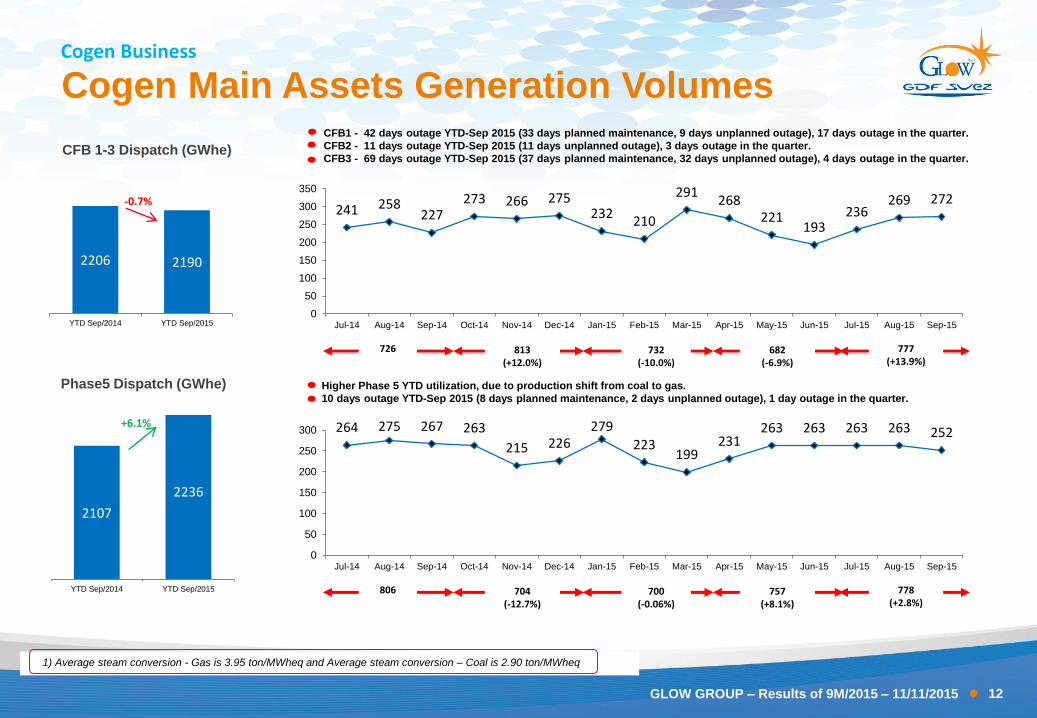
Cogen Main Assets Generation Volumes Cogen Business
CFB 1-3 Dispatch (GWhe)
+6.1%
Phase5 Dispatch (GWhe)
813 (+12.0%)
732 (-10.0%)
682 (-6.9%)
726 777 (+13.9%)
241 258 227
273 266 275 232
210
291 268
221 193
236 269 272
0
50
100
150
200
250
300
350
Jul-14 Aug-14 Sep-14 Oct-14 Nov-14 Dec-14 Jan-15 Feb-15 Mar-15 Apr-15 May-15 Jun-15 Jul-15 Aug-15 Sep-15
CFB1 - 42 days outage YTD-Sep 2015 (33 days planned maintenance, 9 days unplanned outage), 17 days outage in the quarter.
CFB2 - 11 days outage YTD-Sep 2015 (11 days unplanned outage), 3 days outage in the quarter.
CFB3 - 69 days outage YTD-Sep 2015 (37 days planned maintenance, 32 days unplanned outage), 4 days outage in the quarter.
704 (-12.7%)
700 (-0.06%)
757 (+8.1%)
806 778 (+2.8%)
264 275 267 263
215 226 279
223 199
231 263 263 263 263 252
0
50
100
150
200
250
300
Jul-14 Aug-14 Sep-14 Oct-14 Nov-14 Dec-14 Jan-15 Feb-15 Mar-15 Apr-15 May-15 Jun-15 Jul-15 Aug-15 Sep-15
1) Average steam conversion - Gas is 3.95 ton/MWheq and Average steam conversion – Coal is 2.90 ton/MWheq
Higher Phase 5 YTD utilization, due to production shift from coal to gas.
10 days outage YTD-Sep 2015 (8 days planned maintenance, 2 days unplanned outage), 1 day outage in the quarter.
12

5600 5556
YTD Sep/2014 YTD Sep/2015
3881 3832
YTD Sep/2014 YTD Sep/2015
GLOW GROUP – Results of 9M/2015 – 11/11/2015
Industrial Customer Volumes Cogen Business
IC Power Sales (GWh)
IC Steam Sales (ktons)
1,219 (-8.5%)
1,247 (+2.3%)
1,257 (+0.8%)
1,332 1,327 (+5.6%)
434 451 447 444 372
403 437
390 420
379 446 432 444 448 435
0
100
200
300
400
500
Jul-14 Aug-14 Sep-14 Oct-14 Nov-14 Dec-14 Jan-15 Feb-15 Mar-15 Apr-15 May-15 Jun-15 Jul-15 Aug-15 Sep-15
1,785 (-8.4%)
1,756 (-1.6%)
1,870 (+6.5%)
1,948 1,929 (+3.1%)
654 664 630 630 539
616 630 559 568 577
651 642 631 651 647
0
100
200
300
400
500
600
700
Jul-14 Aug-14 Sep-14 Oct-14 Nov-14 Dec-14 Jan-15 Feb-15 Mar-15 Apr-15 May-15 Jun-15 Jul-15 Aug-15 Sep-15
Volumes in line YoY, especially if corrected for the one-off higher demand (throughout 2014) of a large customer.
Lower April volumes reflect scheduled maintenance for another large customer.
Generally high utilization factors for MTP customers, reflecting favorable petrochemical market conditions.
Demand in Pluak Daeng also strong (up 6% YoY).
-1.3%
-0.8%
13
Maintenance (and tie-in) activities for 2 large customers at the start of the year.
Strong demand since Q2 (up 3% YoY).

0.5
0.7
0.9
1.1
1.3
1.5
1.7
1.9
2.1
2.3
2.5
1.50
2.00
2.50
3.00
3.50
4.00
4.50
GLOW GROUP – Results of 9M/2015 – 11/11/2015
Normalized Spread Trends Cogen Business
1) PEA Price = Base Tariff at 2.8 THB/kWh + actual FT 2) Gas Cost = Blended Cogen gas price in THB/mmBTU x normalized gas-fired
heat-rate at 8,600* BTU/kWh / 10^6 3) Coal Cost = Average FOB coal price in THB/mmBTU x normalized coal-fired
heat-rate at 10,300 BTU/kWh / 10^6
Note :
2.36 THB/kWh
0.53 THB/kWh
14
Avg. PEA Price Gas Cost
Coal Cost
Spread Average High Low
Gas 0.54 0.79 0.13
Coal 1.84 2.54 0.94
Mar07 – Sep15
GLOW GROUP – Results of 9M/2015 – 11/11/2015
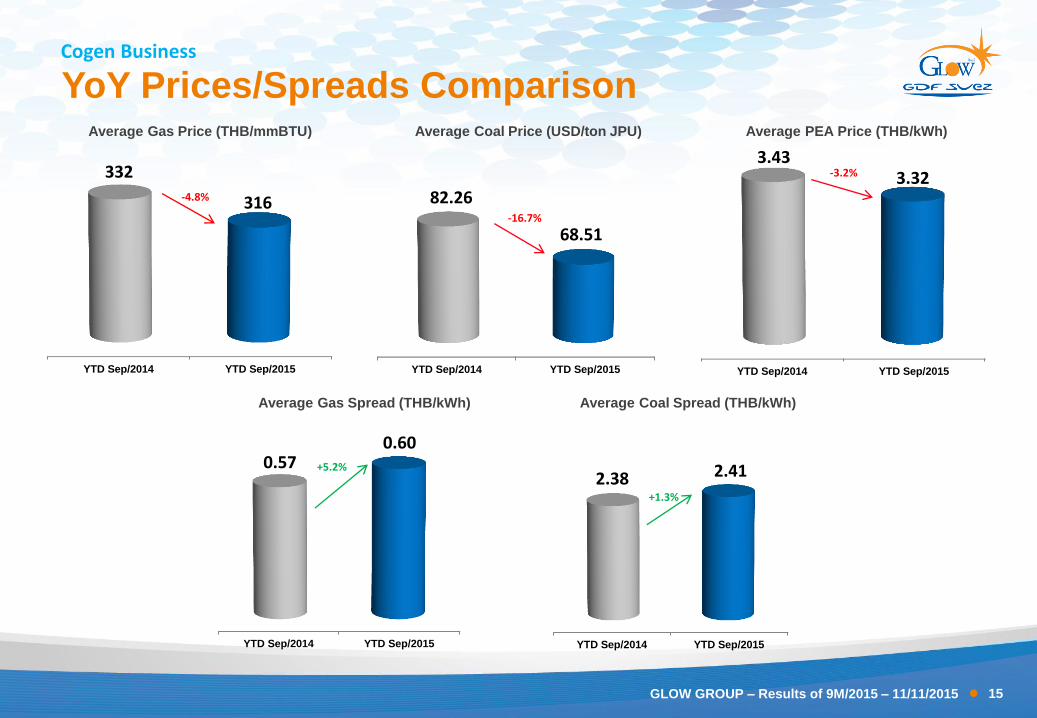
YoY Prices/Spreads Comparison Cogen Business
YTD Sep/2014 YTD Sep/2015
332
316
Average Gas Price (THB/mmBTU)
-4.8%
YTD Sep/2014 YTD Sep/2015
82.26
68.51
Average Coal Price (USD/ton JPU)
YTD Sep/2014 YTD Sep/2015
3.43 3.32
Average PEA Price (THB/kWh)
-16.7%
YTD Sep/2014 YTD Sep/2015
0.57 0.60
Average Gas Spread (THB/kWh)
YTD Sep/2014 YTD Sep/2015
2.38 2.41
Average Coal Spread (THB/kWh)
+1.3%
+5.2%
-3.2%
15

GLOW GROUP – Results of 9M/2015 – 11/11/2015
VARIANCE
ANALYSIS
16

GLOW GROUP – Results of 9M/2015 – 11/11/2015
3Q/2015 vs. 2Q/2015
NNP 2Q/2015 Act Cogen Business GIPP GHECO-1 HHPC NNP 3Q/2015 Act
2,787 197 25 (68) (80) 2,861
NNP 4Q/2014Act
NNP 1Q/2015Act
NNP 2Q/2015Act
BI Payment NNP 2Q/2015Act
(Exc. One-timeitem)
Gross Profit MaintenanceCosts
Other OperatingCosts
Depreciation FinanceExpenses
Income Tax MinorityInterest(MI)
NNP 3Q/2015Act
2,018 2,286
2,787 2,734 (173) 53 83 32 (20) 2,861
EBITDA Impact -24 MTHB
Below EBITDA +95 MTHB
(53) 96
55
17

NNP 9M/2014Act
Gross Profit MaintenanceCosts
Other OperatingCosts
Depreciation AssetReplacements
FinanceExpenses
Income Tax MinorityInterest(MI)
NNP 2015 Act(Exc. One-time
item)
BI Payment LD's Payment NNP 9M/2015Act
GLOW GROUP – Results of 9M/2015 – 11/11/2015
9M/2015 vs. 9M/2014
NNP 9M/2014 Act Cogen Business GIPP GHECO-1 HHPC NNP 9M/2015 Act
7,650 515 (48) (67) (116) 7,934
7,650
EBITDA Impact -1,380 MTHB
Below EBITDA +754 MTHB
(913)
18 287 27 249
191 7,934
(485)
380 254 7,300
18
275

GLOW GROUP – Results of 9M/2015 – 11/11/2015
FINANCIAL
STATUS
19

2015 2016 2017 2018 2019 2020 2021 2022 2023 2024 2025 2026 2027 2028
23 17 18 13
7 7 8
8
9 10 10 11 10
66
60 57 63
37 33 30 36 35
29 24 29 25
88
GLOW GROUP – Results of 9M/2015 – 11/11/2015
Debt Maturity Profile
4,000
5,500
1,000
1,500
4,600
4,000 3,400
5,555
4,000
Glow Cogen Repayment Profile (MTHB)
5,500 5,600
4,000
3,400
5,555
Bond Bank Loan
GHECO-One
HHPC
Glow IPP
Consolidated Glow Group Gross Debt
Jun-15 Sep-15
23,139 24,380
29,232 28,791
USD loans (excluding tranches swapped into THB), as of Sep 2015
• GIPP: 58 MUSD
• GHECO-One: 341 MUSD
• HHPC: 77 MUSD
Total gross consolidated debt was
• 53,171 MTHB in Sep 2015 versus
• 52,371 MTHB in Jun 2015
Cogen Business
IPP Business
52,371 53,171
2014 Outstanding
Bank Loan
- 19,055 MTHB
Bond
- 10,500 MTHB
2014 Outstanding
GIPP
- 79 MUSD
GHECO-One
- 612 MUSD
HHPC
- 81 MUSD
20
4,000
2015 2016 2017 2018 2019 2020 2021 2025
5,500
(New)

GLOW GROUP – Results of 9M/2015 – 11/11/2015
Key Financial Ratios
1H-2015
9M-2015
D/E Ratio
Conso: Gross D/E (Net D/E) 1.11 (0.99) 1.12 (0.96)
Cogen: Gross D/E (Net D/E) 0.62 (0.60) 0.61 (0.59)
Debt to EBITDA (Conso)
Gross Debt to EBITDA (Net Debt to EBITDA) 2.58 (2.31) 2.59 (2.23)
Note: 1.) Trailing 12 months
2.) Gross D/E = Total Outstanding Debt / Total Equity
Net D/E = (Total Outstanding Debt – Cash) / Total Equity
Gross Debt to EBITDA = Total Outstanding Debt / EBITDA
Net Debt to EBITDA = (Total Outstanding Debt – Cash) / EBITDA
ROCE = (EBIT-Tax)/(Total Equity + L-T Debt)
Profitability Ratio
EBITDA Margin 31.16% 30.93%
Normalized Net Profit Margin 15.07% 15.40%
ROCE(1) 13.16% 12.39%
ROE(1) 19.01% 18.11%
21

GLOW GROUP – Results of 9M/2015 – 11/11/2015
Dividends Policy and History
• Our policy is (in simplified terms) to pay “a normal dividend of not less than 50% of NNP”.
• Additionally, since our IPO (2005) we have grown our (normal) dividend by at least 5% per year.
• 2013 and 2014 dividend growth reflects strong increase in profitability following the completion of our 2008/2012 expansion
program (80% increase in installed capacity).
2005 2006 2007 2008 2009 2010 2011 2012 2013 2014 2015
0.600 0.600 0.600 0.700 0.735 0.772 0.810 0.851 1.100
1.388 1.500
0.975 1.054 1.136 1.123
1.179 1.238
1.300
1.904
2.205
0.750
Special
Annual
Interim
Dividend Split (THB/share)
2.250
1.575 1.654
1.736 1.823
1.914 2.010
2.110
2.755
3.305
+5% +5% +5% +5%
+5% +5%
+31%
+20%
38% 36% 35% 38% 38% 38% 38% 31% 33%
22
+5% +5% +5% +5% +5% +13% +26%
+5%

GLOW GROUP – Results of 9M/2015 – 11/11/2015
General Updates • Gheco-One’s ongoing dispute with the Revenue Department
• Dispute is with respect to tax on unrealized foreign exchange gains (derived from translation of USD
debt) during the construction period.
• Gheco-One has paid the disputed tax amounts, and has subsequently filed for return of such payments.
• The Central Tax Court has ruled in favor of Gheco-One in October 2015 with respect to our claim for the
tax year 2010 (466 MTHB).
• It is expected that the Revenue Department will appeal, and that the case will go to the Supreme Court.
• Bond issuance
• Glow Energy has successfully issued (in September) a 10-year bullet bond, in an amount of 4 billion
THB, with a coupon of 3.95%.
• Proceeds have been used to roll-over maturing debt.
• Base Tariff (PEA tariff) adjustment/Rebase
• See next slide
• SPP Scheme
• Limited updates from the previous briefings.
• Ongoing discussions with respect to:
• Extensions of PPA’s (only for contracts expiring in 2017/2018, including Glow Phase 2, currently
2*90 MW).
• Replacement PPA’s.
23

GLOW GROUP – Results of 9M/2015 – 11/11/2015 24
New Electricity Tariff
• The Base Tariff has been rebased effective November 2015.
o The “starting point” was the Tariff and Ft for the period May-August 2015.
The Base Tariff was revised downwards slightly (by 1 Stg).
The Ft (for that reference period) was “embedded”.
o As the Ft was reduced by 3 Stg for the period September-December 2015 (i.e. after the reference period for the
rebase), the Ft for November becomes negative.
• The change in total Tariff (i.e. Base Tariff + Ft) between October and November is marginal (-1 Stg).
*Note: Indications for illustration only, for the 115kv TOU Tariff, assuming a given load profile.
2.7837 2.7837 3.2693
0.4961 0.4638
-0.323 -1
1
3
5
7
9
11
May - Aug 2015 Sep - Oct 2015 Nov - Dec 2015
THB/kWh
Ft
Base*
Total = 3.2798 Total = 3.2475
Total = 3.2370 -0.0323 -0.0105
New Tariff

• Suthiwong Kongsiri (CFO since 2005) will move to the US to be the
CFO of GDFSuez Energy North America.
• Pajongwit Pongsivapai (Volk) will take over as CFO effective January
2016.
• Volk has been within Glow Group for almost 20 years:
• He was COO in the past period 2008-2013.
• He is currently (since 2014) EVP in charge of Business Development.
• Educations and certifications:
• Master Degree of Sciences in Chemical Engineering, Oregon State University,
USA
• Bachelor Degree of Chemical Engineering, Chulalongkorn University, Thailand
• General Management course, European Center for Executive Development,
INSEAD Fontainebleau, France
• Finance for Executives Program, The University of Chicago, USA
• Leadership Development Program organized by IMD (Switzerland) and Thai
Listed Companies Association (Thailand)
• Advanced Certificate Course in Politics and Governance in Democratic Systems
for Executives, The College of Politics and Governance, King Prajadhipok’s
Institute, Thailand
• Certificate of Executive Development Program (EDP), Thai Institute of Director
Association (IOD), Thailand
GLOW GROUP – Results of 9M/2015 – 11/11/2015
CFO Succession
25

GLOW GROUP – Results of 9M/2015 – 11/11/2015
THANK YOU
26


![Korea Herald 20151111[1]](https://img.pdfslide.net/doc/110x75/58790bd31a28ab6f658b5d91/korea-herald-201511111.jpg)

