Embed Size (px)
Citation preview

Glu Mobile Q313 Earnings Call
October 30, 2013
© Glu Mobile Inc. – Proprietary
Page 2
Safe-Harbor Statement This presentation contains "forward-looking" statements including those regarding: that we have an expanding global presence,
particularly in APAC; estimated growth and expected trends in smartphone users and global mobile traffic; momentum in global tablet
growth; our expectation of the quad screen future; our belief that there is a significant opportunity for increased mobile ad spending,
particularly in the U.S.; expected trends in wearable computing; our expectation of a strong Q4-2013; the expected launch dates of our
games to be released in Q4-2013 and Q1-2014; that Glu is building on its momentum in Asia and its pipeline is positioned for APAC
success; our plans for growing our publishing business and expanding our publishing volume in 2014; the expected number of games that
we expect to publish during 2013 and 2014; that we are poised for growth; our guidance for Q4 2013, FY2013 and FY 2014; and that Glu
has a strong secular growth opportunity. These forward-looking statements are subject to material risks and uncertainties that could cause
actual results to differ materially from those in the forward-looking statements. Investors should consider important risk factors, which
include: the risk that consumer demand for smartphones, tablets and next-generation platforms does not grow as significantly as we
anticipate or that we will be unable to capitalize on any such growth; the risk that we do not realize a sufficient return on our investment
with respect to our efforts to develop free-to-play games for smartphones and tablets, the risk that we do not maintain our good
relationships with Apple and Google; the risk that our development expenses for games for smartphones are greater than we anticipate;
the risk that our recently and newly launched games are less popular than anticipated; the risk that our newly released games will be of a
quality less than desired by reviewers and consumers; the risk that the mobile games market, particularly with respect to social, free-to-
play gaming, is smaller than anticipated; risks related to the restatement of certain of our historical financial statements and other risks
detailed under the caption "Risk Factors" in our Form 10-Q filed with the Securities and Exchange Commission on August 9, 2013 and our
other SEC filings. You can locate these reports through our website at http://www.glu.com/investors.
These "forward-looking" statements are based on estimates and information available to us on October 30, 2013 and we are under no
obligation, and expressly disclaim any obligation, to update or alter our forward-looking statements whether as a result of new information,
future events or otherwise.
© Glu Mobile Inc. – Proprietary
Use of Non-GAAP Financial Measures Glu uses in this presentation certain non-GAAP measures of financial performance. The presentation of these non-GAAP financial measures is not intended to be considered in isolation from, as a substitute for, or superior to, the financial information prepared and presented in accordance with GAAP, and may be different from non-GAAP financial measures used by other companies. In addition, these non-GAAP measures have limitations in that they do not reflect all of the amounts associated with Glu's results of operations as determined in accordance with GAAP. The non-GAAP financial measures used by Glu include non-GAAP revenues, non-GAAP smartphone revenues, non-GAAP freemium revenues, non-GAAP cost of revenues, non-GAAP gross profit, non-GAAP gross margin, non-GAAP operating expenses, non-GAAP operating margin, non-GAAP net income/(loss), non-GAAP net income/(loss) per share and Adjusted EBITDA. These non-GAAP financial measures exclude the following items from Glu's unaudited consolidated statements of operations:
• Change in deferred revenues and deferred cost of revenues;
• Amortization of intangible assets;
• Non-cash warrant expense;
• Stock-based compensation expense;
• Restructuring charges;
• Change in fair value of Blammo earnout;
• Transitional costs;
• Impairment of goodwill;
• Release of tax liabilities; and
• Foreign currency exchange gains and losses primarily related to the revaluation of assets and liabilities.
In addition, Glu has included in this presentation “Adjusted EBITDA” figures which are used to evaluate Glu’s operating performance and is defined as non-GAAP operating income/(loss) excluding depreciation.
Glu believes that these non-GAAP financial measures, when taken together with the corresponding GAAP financial measures, provide meaningful supplemental information regarding Glu's performance by excluding certain items that may not be indicative of Glu's core business, operating results or future outlook. Glu's management uses, and believes that investors benefit from referring to, these non-GAAP financial measures in assessing Glu's operating results, as well as when planning, forecasting and analyzing future periods. These non-GAAP financial measures also facilitate comparisons of Glu's performance to prior periods.
For a reconciliation of these non-GAAP financial measures to their most directly comparable GAAP financial measures, please refer to the tables attached to Glu’s earnings press release for the quarter ended September 30, 2013, which is available on our website at http://www.glu.com/investors.
© Glu Mobile Inc. – Proprietary Page 3

Page 4
Page 5
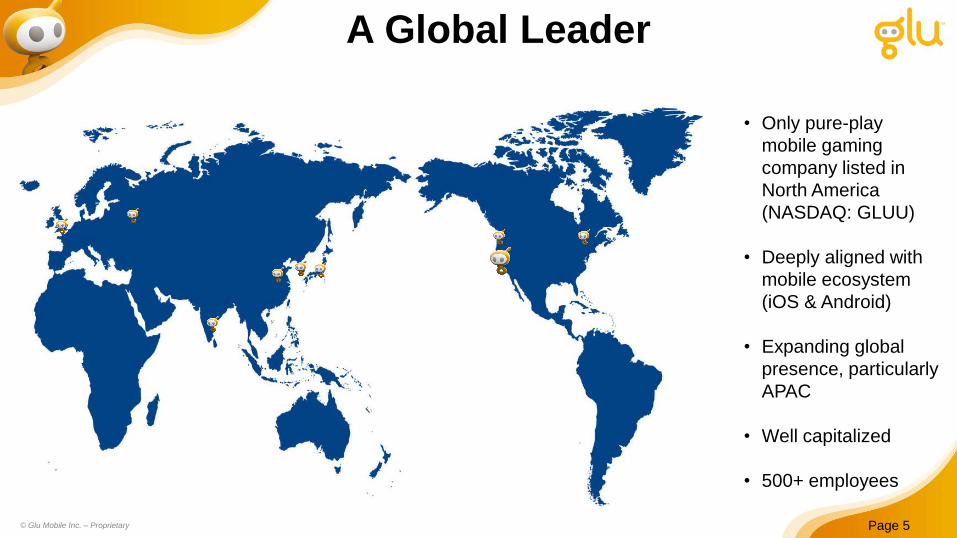
A Global Leader
© Glu Mobile Inc. – Proprietary
• Only pure-play
mobile gaming
company listed in
North America
(NASDAQ: GLUU)
• Deeply aligned with
mobile ecosystem
(iOS & Android)
• Expanding global
presence, particularly
APAC
• Well capitalized
• 500+ employees
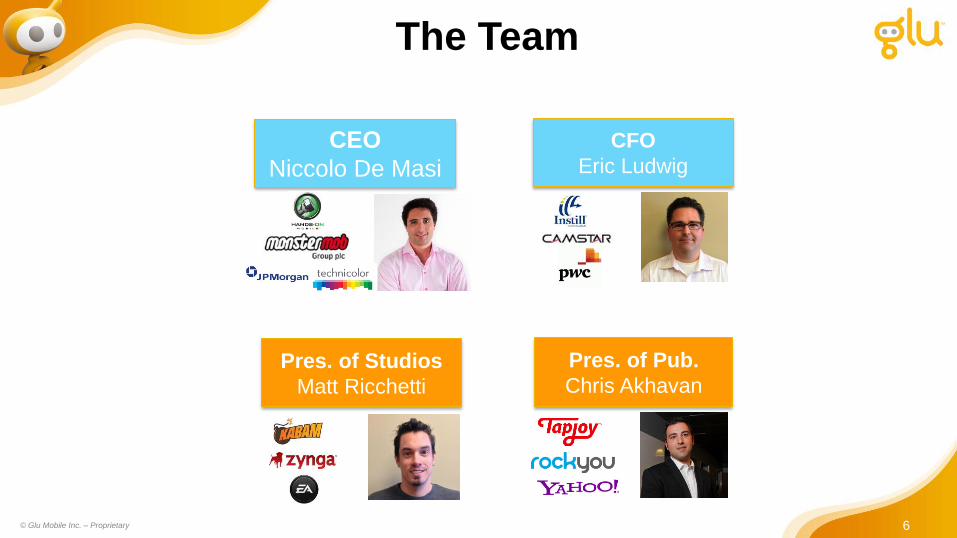
The Team
6
Pres. of Studios
Matt Ricchetti
Pres. of Pub.
Chris Akhavan
CFO
Eric Ludwig
CEO
Niccolo De Masi
© Glu Mobile Inc. – Proprietary
Page 7
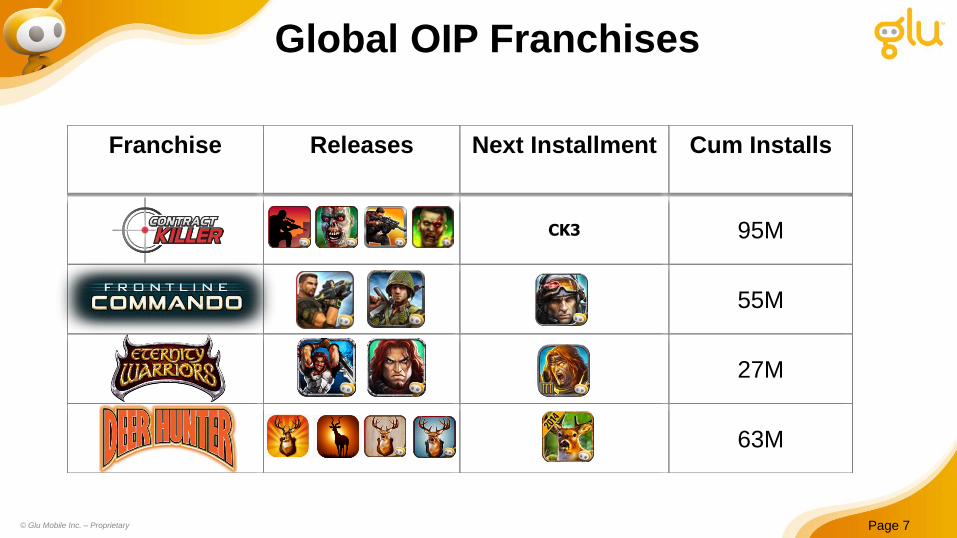
Global OIP Franchises
© Glu Mobile Inc. – Proprietary
Franchise Releases Next Installment Cum Installs
CK3 95M
55M
27M
63M

Market
Page 8 © Glu Mobile Inc. – Proprietary
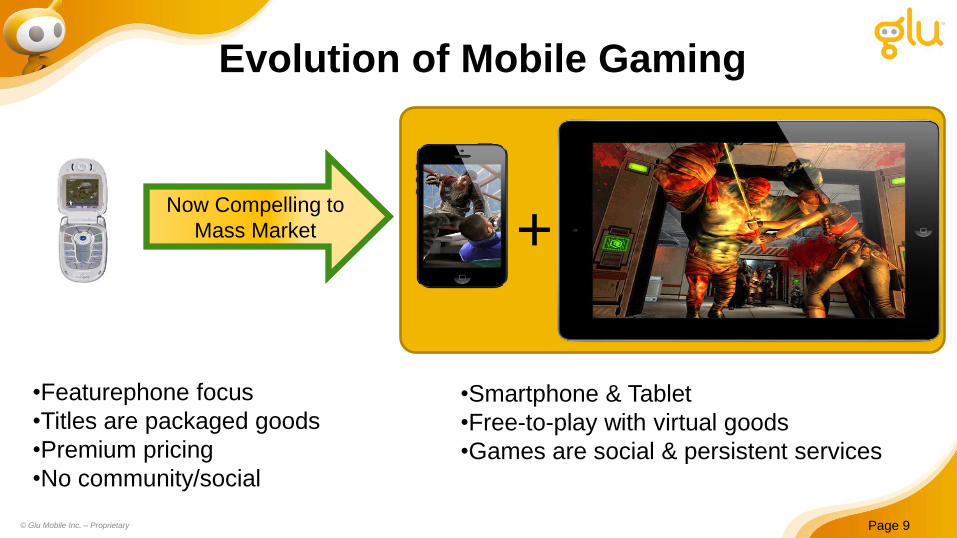
•Featurephone focus
•Titles are packaged goods
•Premium pricing
•No community/social
Page 9
Evolution of Mobile Gaming
Now Compelling to
Mass Market +
•Smartphone & Tablet
•Free-to-play with virtual goods
•Games are social & persistent services
© Glu Mobile Inc. – Proprietary
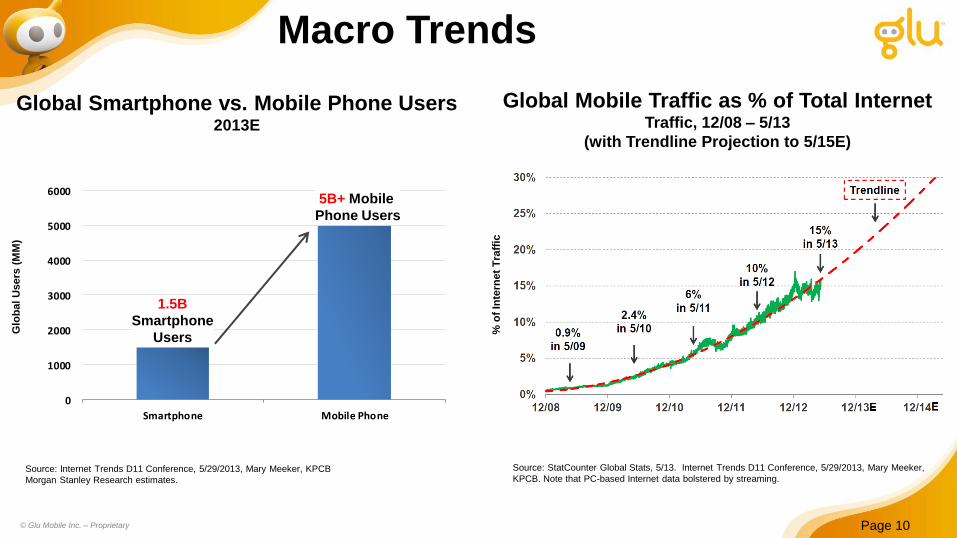
Macro Trends
Page 10
Glo
ba
l U
sers
(M
M)
Global Smartphone vs. Mobile Phone Users 2013E
0
1000
2000
3000
4000
5000
6000
Smartphone Mobile Phone
1.5B
Smartphone
Users
5B+ Mobile
Phone Users
% o
f In
tern
et
Tra
ffic
Global Mobile Traffic as % of Total Internet Traffic, 12/08 – 5/13
(with Trendline Projection to 5/15E)
Source: Internet Trends D11 Conference, 5/29/2013, Mary Meeker, KPCB
Morgan Stanley Research estimates.
Source: StatCounter Global Stats, 5/13. Internet Trends D11 Conference, 5/29/2013, Mary Meeker,
KPCB. Note that PC-based Internet data bolstered by streaming.
© Glu Mobile Inc. – Proprietary

Global Tablet Momentum
Page 11
Quarters After Launch
Glo
bal U
nit
s S
hip
men
ts (
000)
First 12 Quarters Cumulative Unit Shipments, iPhone vs. iPad
Source: Internet Trends D11 Conference, 5/29/2013, Mary Meeker, KPCB; Katy Huberty, Ehud Gelblum,
Morgan Stanley Research. Gartner.
Apple, as of CQ1:13 (12 quarters post iPad launch). Launch Dates: iPhone (6/29/07), iPad (4/3/10)
© Glu Mobile Inc. – Proprietary
Page 12
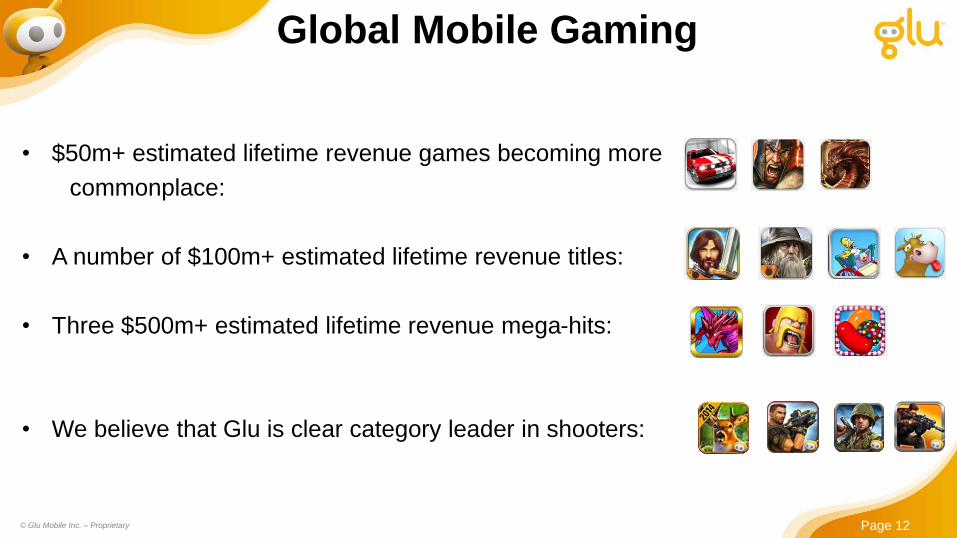
• $50m+ estimated lifetime revenue games becoming more
commonplace:
• A number of $100m+ estimated lifetime revenue titles:
• Three $500m+ estimated lifetime revenue mega-hits:
• We believe that Glu is clear category leader in shooters:
© Glu Mobile Inc. – Proprietary
Global Mobile Gaming

Strategic Overview
Page 13 © Glu Mobile Inc. – Proprietary
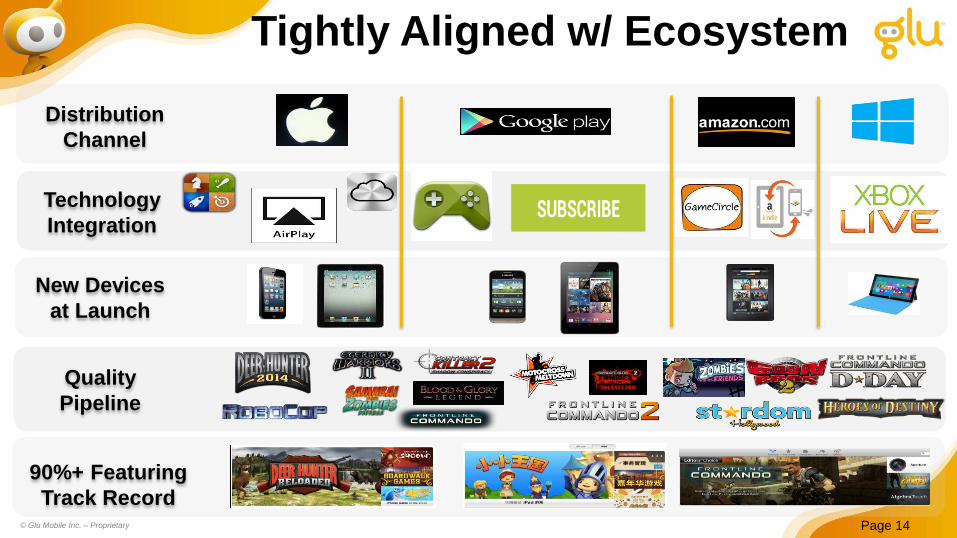
Technology
Integration
90%+ Featuring
Track Record
New Devices
at Launch
Tightly Aligned w/ Ecosystem
Distribution
Channel
Quality
Pipeline
Page 14 © Glu Mobile Inc. – Proprietary
Page 15
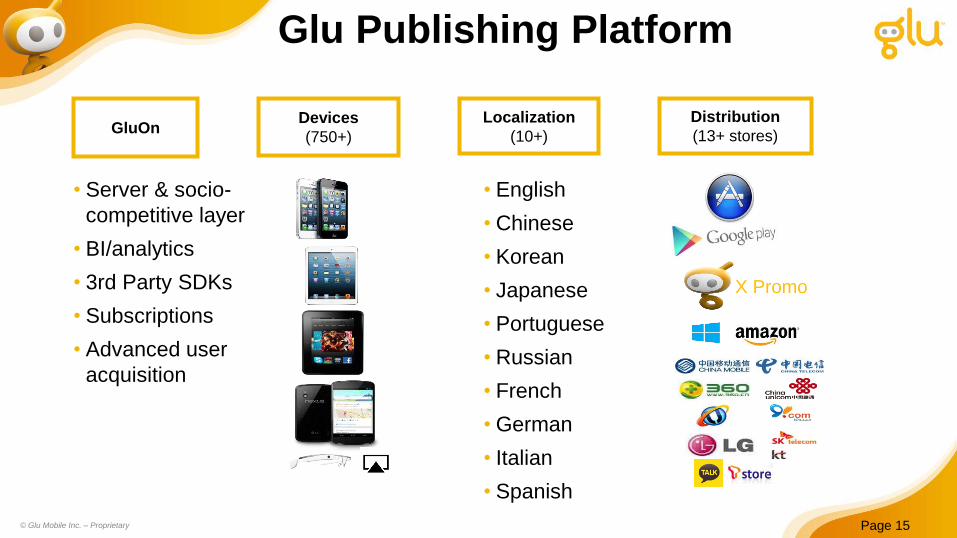
Glu Publishing Platform
Devices
(750+)
Localization
(10+)
Distribution
(13+ stores)
• English
• Chinese
• Korean
• Japanese
• Portuguese
• Russian
• French
• German
• Italian
• Spanish
X Promo
GluOn
• Server & socio-
competitive layer
• BI/analytics
• 3rd Party SDKs
• Subscriptions
• Advanced user
acquisition
© Glu Mobile Inc. – Proprietary

Page 16 © Glu Mobile Inc. – Proprietary
Glu Publishing Models
1st Party
2nd Party
3rd Party
Gross
Margin
Risk
Supermajority currently
Introduced 2013
Pipeline validated

Growth Opportunities
Page 17 © Glu Mobile Inc. – Proprietary

Page 18
Quad Screen Future
© Glu Mobile Inc. – Proprietary
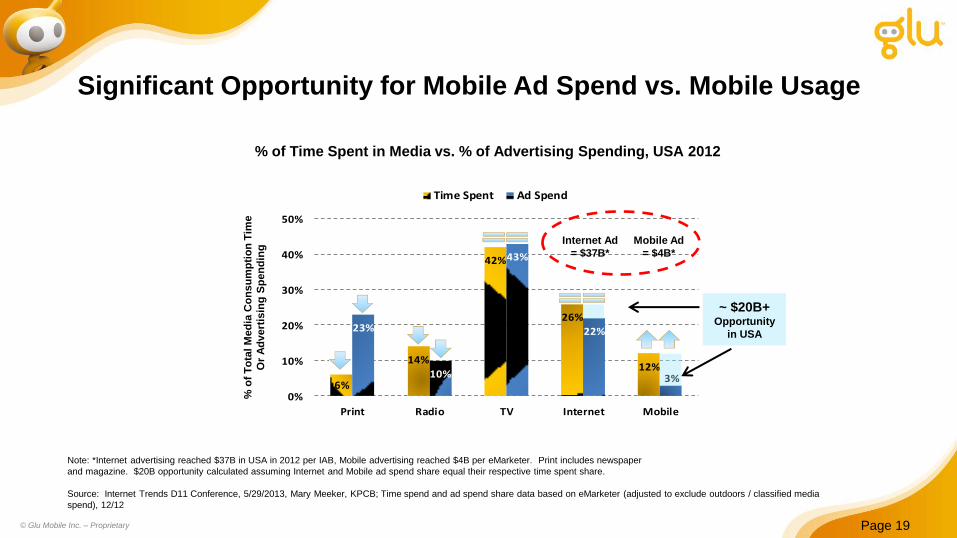
6%
14%
42%
26%
12%
23%
10%
43%
22%
3%
0%
10%
20%
30%
40%
50%
Print Radio TV Internet Mobile
Time Spent Ad Spend
Page 19
Significant Opportunity for Mobile Ad Spend vs. Mobile Usage
% of Time Spent in Media vs. % of Advertising Spending, USA 2012
Note: *Internet advertising reached $37B in USA in 2012 per IAB, Mobile advertising reached $4B per eMarketer. Print includes newspaper
and magazine. $20B opportunity calculated assuming Internet and Mobile ad spend share equal their respective time spent share.
Source: Internet Trends D11 Conference, 5/29/2013, Mary Meeker, KPCB; Time spend and ad spend share data based on eMarketer (adjusted to exclude outdoors / classified media
spend), 12/12
% o
f T
ota
l M
ed
ia C
on
su
mp
tio
n T
ime
Or
Ad
vert
isin
g S
pe
nd
ing
~ $20B+ Opportunity
in USA
Internet Ad
= $37B*
Mobile Ad
= $4B*
© Glu Mobile Inc. – Proprietary
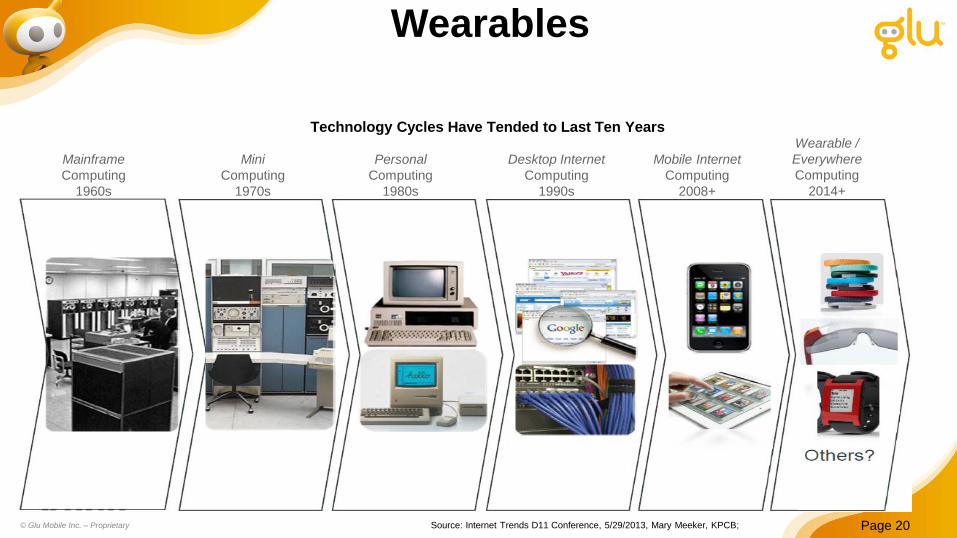
Wearables
Page 20 Source: Internet Trends D11 Conference, 5/29/2013, Mary Meeker, KPCB;
xxx
Mainframe
Computing
1960s
Technology Cycles Have Tended to Last Ten Years
Mini
Computing
1970s
Personal
Computing
1980s
Desktop Internet
Computing
1990s
Mobile Internet
Computing
2008+
Wearable /
Everywhere
Computing
2014+
© Glu Mobile Inc. – Proprietary
Strong Q4 Line-Up
Deer Hunter 2014 – launched late Sep
• Franchise sequel
• Peak iOS US rankings: #1 free, #5 grossing app
• Consistently over 4m DAU since global launch of iOS and Android versions
• On track to be Glu’s largest cumulative revenue title thus far
Eternity Warriors 3 – expected to launch in Dec’13
• Franchise sequel
• Deep PVE
• Online-only
• Solid beta performance thus far
Page 21 © Glu Mobile Inc. – Proprietary

Strong Q1 Line-Up
Robocop – expected to launch in Jan’14
• Coincides with theatrical release; FLC engine
Defenders & Dragons – expected to launch in Jan‘14
SvZ2 engine
Motocross Meltdown – expected to launch in Feb ‘14
• PVP; online-only
Frontline Commando 2 – expected to launch in Mar’14
• Franchise sequel; PVP and PVE
Page 22 © Glu Mobile Inc. – Proprietary
• Largest and fastest growing mobile market globally
• Increasing percentage of Glu revenue (30% and growing)
• Glu strong in China, expanding presence in key markets of Japan and Korea
• Glu pipeline positioned for APAC success
Localizing content
Expanding user acquisition channels
Page 23
APAC Momentum
© Glu Mobile Inc. – Proprietary

Q3 Fundraise
Page 24 © Glu Mobile Inc. – Proprietary
Page 25
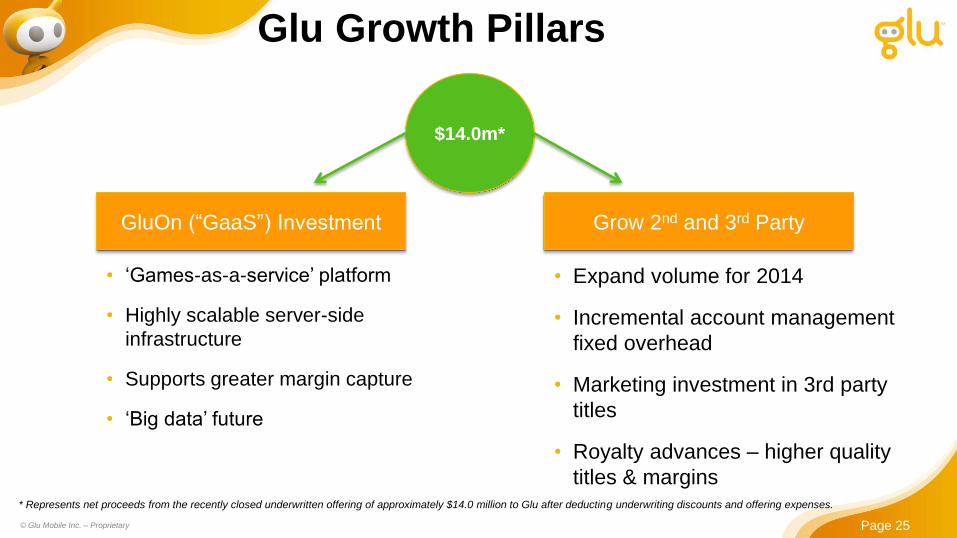
GluOn (“GaaS”) Investment Grow 2nd and 3rd Party
• Expand volume for 2014
• Incremental account management
fixed overhead
• Marketing investment in 3rd party
titles
• Royalty advances – higher quality
titles & margins
• ‘Games-as-a-service’ platform
• Highly scalable server-side
infrastructure
• Supports greater margin capture
• ‘Big data’ future
Glu Growth Pillars
$14.0m*
* Represents net proceeds from the recently closed underwritten offering of approximately $14.0 million to Glu after deducting underwriting discounts and offering expenses.
© Glu Mobile Inc. – Proprietary
Page 26
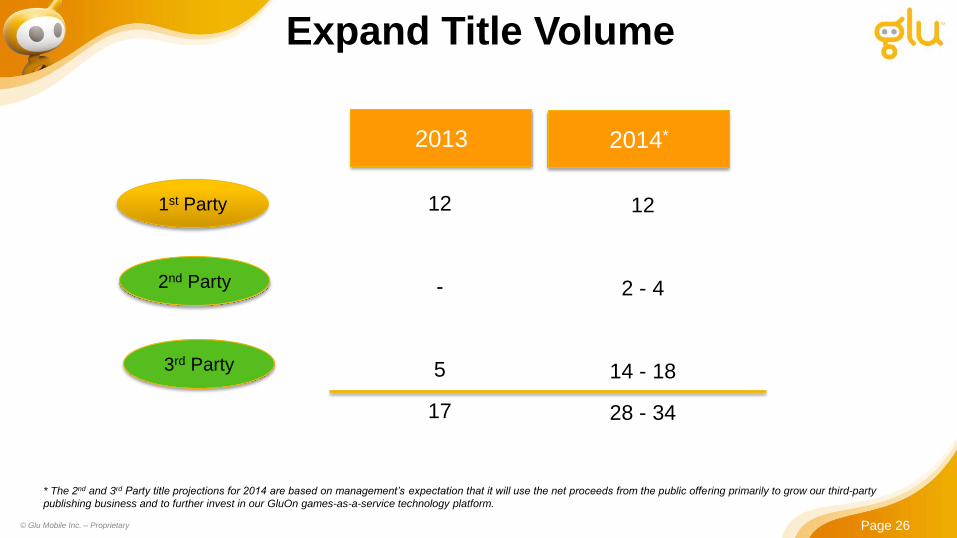
2013 2014*
12
-
5
17
Expand Title Volume
1st Party
2nd Party
3rd Party
12
2 - 4
14 - 18
28 - 34
* The 2nd and 3rd Party title projections for 2014 are based on management’s expectation that it will use the net proceeds from the public offering primarily to grow our third-party
publishing business and to further invest in our GluOn games-as-a-service technology platform.
© Glu Mobile Inc. – Proprietary

Financial Summary
Page 27 © Glu Mobile Inc. – Proprietary
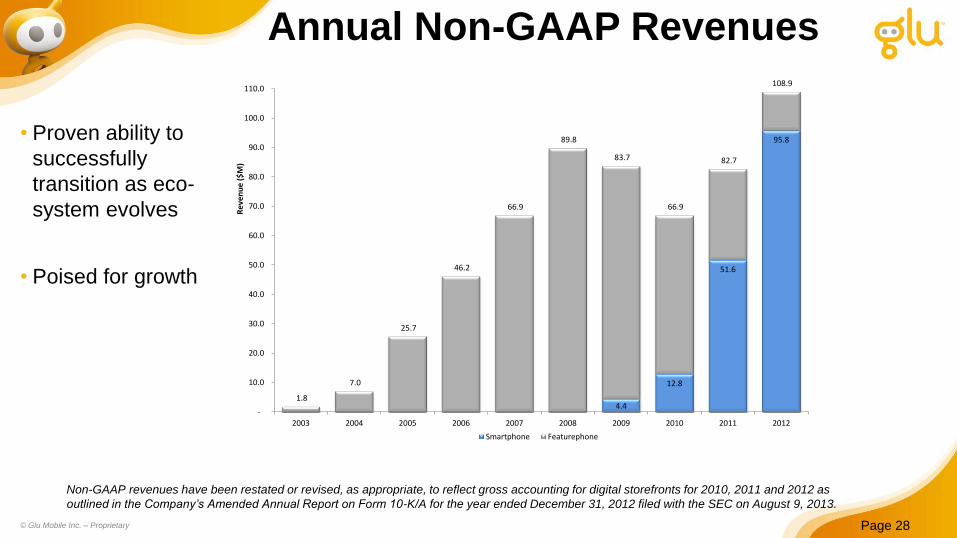
Annual Non-GAAP Revenues
Page 28 © Glu Mobile Inc. – Proprietary
Non-GAAP revenues have been restated or revised, as appropriate, to reflect gross accounting for digital storefronts for 2010, 2011 and 2012 as
outlined in the Company’s Amended Annual Report on Form 10-K/A for the year ended December 31, 2012 filed with the SEC on August 9, 2013.
• Proven ability to
successfully
transition as eco-
system evolves
• Poised for growth
4.4
12.8
51.6
95.8
1.8
7.0
25.7
46.2
66.9
89.8
83.7
66.9
82.7
108.9
-
10.0
20.0
30.0
40.0
50.0
60.0
70.0
80.0
90.0
100.0
110.0
2003 2004 2005 2006 2007 2008 2009 2010 2011 2012
Re
ven
ue
($M
)
Smartphone Featurephone
Page 29
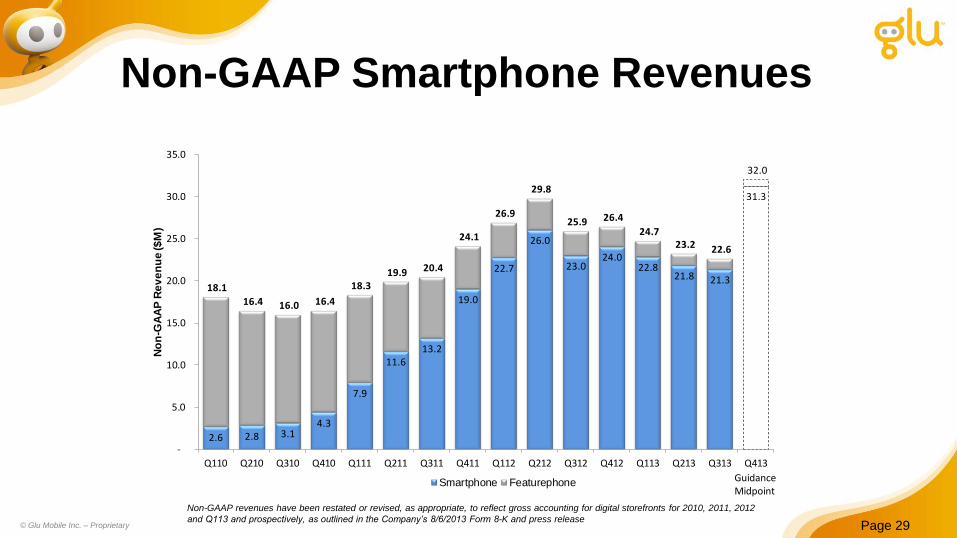
Non-GAAP Smartphone Revenues
© Glu Mobile Inc. – Proprietary
2.6 2.8 3.14.3
7.9
11.613.2
19.0
22.7
26.0
23.024.0
22.821.8 21.3
31.3
18.1
16.4 16.0 16.4
18.3 19.9 20.4
24.1
26.9
29.8
25.9 26.4
24.7 23.2 22.6
32.0
-
5.0
10.0
15.0
20.0
25.0
30.0
35.0
Q110 Q210 Q310 Q410 Q111 Q211 Q311 Q411 Q112 Q212 Q312 Q412 Q113 Q213 Q313 Q413
No
n-G
AA
P R
ev
en
ue
($
M)
Smartphone Featurephone GuidanceMidpoint
Non-GAAP revenues have been restated or revised, as appropriate, to reflect gross accounting for digital storefronts for 2010, 2011, 2012
and Q113 and prospectively, as outlined in the Company’s 8/6/2013 Form 8-K and press release
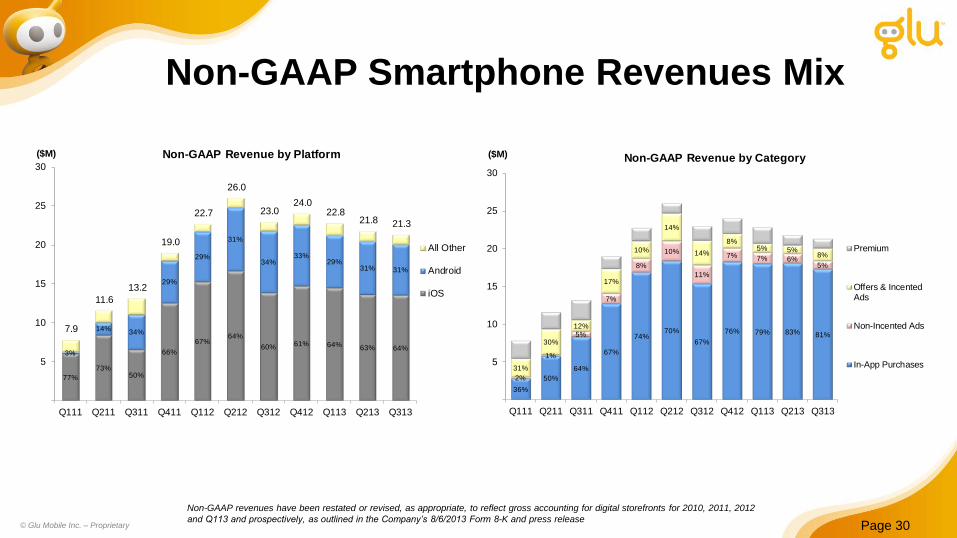
Non-GAAP Smartphone Revenues Mix
Page 30 © Glu Mobile Inc. – Proprietary
77%
73%50%
66%
67%64%
60% 61% 64% 63% 64%3%
14% 34%
29%
29%
31%
34%33%
29%31% 31%
7.9
11.6
13.2
19.0
22.7
26.0
23.0 24.0
22.8 21.8 21.3
5
10
15
20
25
30
Q111 Q211 Q311 Q411 Q112 Q212 Q312 Q412 Q113 Q213 Q313
($M) Non-GAAP Revenue by Platform
All Other
Android
iOS
36%
50%
64%
67%
74%70%
67%
76% 79% 83% 81%
2%
1%
5%
7%
8%
10%
11%
7% 7% 6%5%
31%
30%
12%
17%
10%
14%
14%
8%5% 5%
8%
5
10
15
20
25
30
Q111 Q211 Q311 Q411 Q112 Q212 Q312 Q412 Q113 Q213 Q313
($M) Non-GAAP Revenue by Category
Premium
Offers & IncentedAds
Non-Incented Ads
In-App Purchases
Non-GAAP revenues have been restated or revised, as appropriate, to reflect gross accounting for digital storefronts for 2010, 2011, 2012
and Q113 and prospectively, as outlined in the Company’s 8/6/2013 Form 8-K and press release

Q412, 2,701 , 13%
Q411, 1,849 , 9%
Q313, 4,177 , 20%
Q312, 2,888 , 13%
Q113, 6,735 , 31%
Other, 2,997 , 14%
Page 31
$21.3M Non-GAAP Smartphone Revenues in Q313
Frontline Commando: D-Day $3.3M
Stardom: Hollywood $1.4M
Heroes of Destiny $0.8M
Samurai vs Zombies 2 $0.8M
Eternity Warriors 2 $2.0M
Indestructible $0.4M
Blood & Glory: Legend $0.4M
Deer Hunter 2014 $2.7M
Zombies Ate My Friends $1.1M
Black Gate Inferno $0.3M
Contract Killer 2 $2.2M
Contract Killer Zombies 2 $0.3M
Dragon Slayer $0.1M
© Glu Mobile Inc. – Proprietary
Frontline Commando $1.2M
Contract Killer Zombies $0.3M
Stardom: The A-List $0.3M

-
5.0
10.0
15.0
20.0
25.0
30.0
35.0
Q1
07
Q2
07
Q3
07
Q4
07
Q1
08
Q2
08
Q3
08
Q4
08
Q1
09
Q2
09
Q3
09
Q4
09
Q1
10
Q2
10
Q3
10
Q4
10
Q1
11
Q2
11
Q3
11
Q4
11
Q1
12
Q2
12
Q3
12
Q4
12
Q1
13
Q2
13
Q3
13
ROW/LATAM
APAC/China
EMEA
North America
Quarterly GAAP Revenues Trend by Region ($, in millions)
Page 32 © Glu Mobile Inc. – Proprietary
GAAP revenues have been restated or revised, as appropriate, to reflect gross accounting for digital storefronts for 2010, 2011, 2012 and
Q113 and prospectively, as outlined in the Company’s 8/6/2013 Form 8-K and press release

Quarterly GAAP Revenues Trend by Region (% contribution)
Page 33 © Glu Mobile Inc. – Proprietary
0%
10%
20%
30%
40%
50%
60%
70%
80%
90%
100%
Q1
07
Q2
07
Q3
07
Q4
07
Q1
08
Q2
08
Q3
08
Q4
08
Q1
09
Q2
09
Q3
09
Q4
09
Q1
10
Q2
10
Q3
10
Q4
10
Q1
11
Q2
11
Q3
11
Q4
11
Q1
12
Q2
12
Q3
12
Q4
12
Q1
13
Q2
13
Q3
13
ROW/LATAM
APAC/China
EMEA
North America
GAAP revenues have been restated or revised, as appropriate, to reflect gross accounting for digital storefronts for 2010, 2011, 2012 and
Q113 and prospectively, as outlined in the Company’s 8/6/2013 Form 8-K and press release
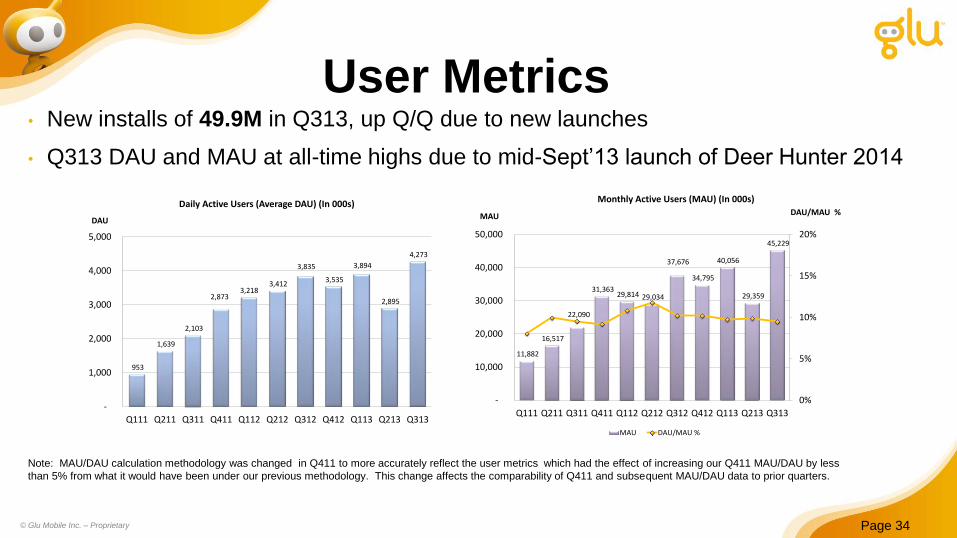
• New installs of 49.9M in Q313, up Q/Q due to new launches
• Q313 DAU and MAU at all-time highs due to mid-Sept’13 launch of Deer Hunter 2014
User Metrics
Note: MAU/DAU calculation methodology was changed in Q411 to more accurately reflect the user metrics which had the effect of increasing our Q411 MAU/DAU by less
than 5% from what it would have been under our previous methodology. This change affects the comparability of Q411 and subsequent MAU/DAU data to prior quarters.
Page 34 © Glu Mobile Inc. – Proprietary
11,882
16,517
22,090
31,363 29,814 29,034
37,676
34,795
40,056
29,359
45,229
0%
5%
10%
15%
20%
-
10,000
20,000
30,000
40,000
50,000
Q111 Q211 Q311 Q411 Q112 Q212 Q312 Q412 Q113 Q213 Q313
DAU/MAU %MAU
Monthly Active Users (MAU) (In 000s)
MAU DAU/MAU %
953
1,639
2,103
2,873 3,218
3,412
3,835
3,535
3,894
2,895
4,273
-
1,000
2,000
3,000
4,000
5,000
Q111 Q211 Q311 Q411 Q112 Q212 Q312 Q412 Q113 Q213 Q313
DAU
Daily Active Users (Average DAU) (In 000s)

Q313 Financial Results Summary
Page 35 © Glu Mobile Inc. – Proprietary
Figures reflect Non-GAAP Revenues and Cost of Revenues on a Gross basis
($ in millions) Q313 Q213 Q/Q Q312 Y/Y
Featurephone Revenues 1.3 1.4 (8%) 2.9 (57%)
Smartphone Revenues 21.3 21.8 (2%) 23.0 (7%)
Total Revenue $ 22.6 $ 23.2 (3%) $ 25.9 (13%)
Gross Profit 14.9 15.9 (6%) 18.9 (21%)
Gross Margin 66.0% 68.7% (275) bp 73.2% (718) bp
Operating Expense 19.7 19.5 (1%) 21.6 9%
Operating Income/(Loss) (4.8) (3.6) (33%) (2.7) (77%)
Adjusted EBITDA $ (4.1) $ (2.9) (42%) $ (2.1) (93%)

Strong Balance Sheet
Page 36 © Glu Mobile Inc. – Proprietary
($ in millions) Q313 Q213 Q312
Cash and cash equivalents $ 27.7 $ 19.1 $ 24.0
Accounts receivable, net 11.3 10.4 14.6
Prepaid expenses, royalties and other current assets 4.7 5.0 5.4
Other assets 7.4 6.3 5.1
Intangible assets & goodwill 25.9 27.2 31.7
Total Assets $ 77.0 $ 68.1 $ 80.9
Accounts payable and accrued liabilities 10.7 10.8 9.3
Accrued compensation, royalties and other liabilities 7.6 7.2 15.3
Deferred revenue 10.5 10.1 11.3
Common stock/Paid in capital 296.6 280.6 269.8
Accumulated deficit & other comprehensive income (248.4) (240.7) (224.8)
Total Liabilities and Stockholders’ Equity $ 77.0 $ 68.1 $ 80.9
Q413, FY2013 and FY2014
Guidance
Page 37 © Glu Mobile Inc. – Proprietary

Q413 Non-GAAP Guidance
Page 38 © Glu Mobile Inc. – Proprietary
($ in millions, except EPS) Q313
Actual
(Gross
Basis)
Low High
Featurephone Revenues 1.3 0.8 0.8
Smartphone Revenues 21.3 30.8 31.8
Total Revenues 22.6$ $ 31.5 $ 32.5
Cost of Revenues 7.7 8.7 9.0
Gross Profit 14.9$ $ 22.8 $ 23.5
Gross Margin 66.0% 72.3% 72.3%
Operating Expense 19.7 22.7 22.9
Operating Income/(Loss) (4.8) 0.1 0.6
Depreciation Addback 0.6 0.7 0.7
Adjusted EBITDA (4.14)$ $ 0.75 $ 1.25
Net Income/(Loss) (4.7) 0.0 0.4
Basic Weighted-Average Shares 71.5 78.0 78.0
Diluted Weighted-Average Shares 73.3 81.3 81.3
Earnings/(Loss) Per Basic Share (0.07)$ n/a n/a
Earnings/(Loss) Per Diluted Share n/a $ 0.00 0.01$
Cash Balance 27.7$
Q413 Guidance
(Gross Basis)
$27.7
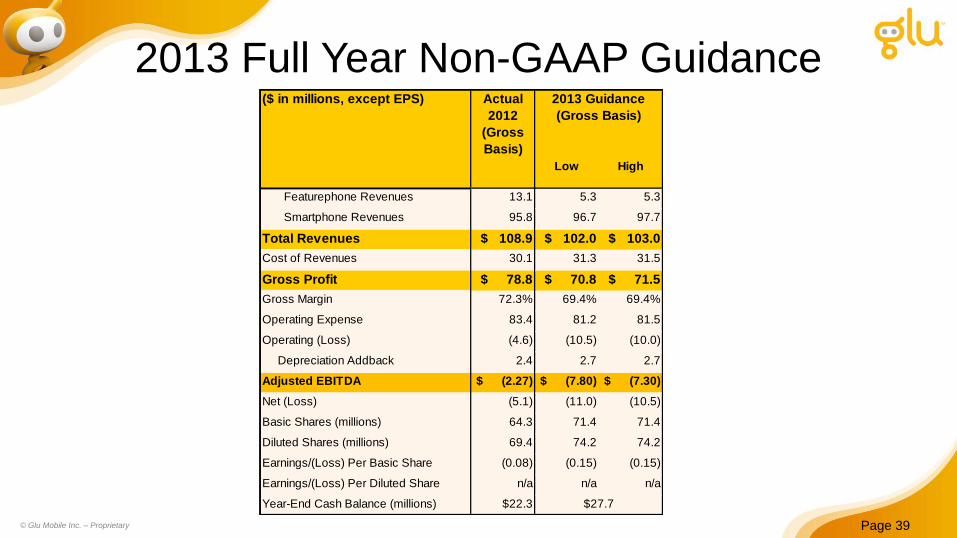
2013 Full Year Non-GAAP Guidance
Page 39 © Glu Mobile Inc. – Proprietary
($ in millions, except EPS) Actual
2012
(Gross
Basis)
Low High
Featurephone Revenues 13.1 5.3 5.3
Smartphone Revenues 95.8 96.7 97.7
Total Revenues $ 108.9 $ 102.0 $ 103.0
Cost of Revenues 30.1 31.3 31.5
Gross Profit $ 78.8 $ 70.8 $ 71.5
Gross Margin 72.3% 69.4% 69.4%
Operating Expense 83.4 81.2 81.5
Operating (Loss) (4.6) (10.5) (10.0)
Depreciation Addback 2.4 2.7 2.7
Adjusted EBITDA $ (2.27) $ (7.80) $ (7.30)
Net (Loss) (5.1) (11.0) (10.5)
Basic Shares (millions) 64.3 71.4 71.4
Diluted Shares (millions) 69.4 74.2 74.2
Earnings/(Loss) Per Basic Share (0.08) (0.15) (0.15)
Earnings/(Loss) Per Diluted Share n/a n/a n/a
Year-End Cash Balance (millions) $22.3
2013 Guidance
(Gross Basis)
$27.7
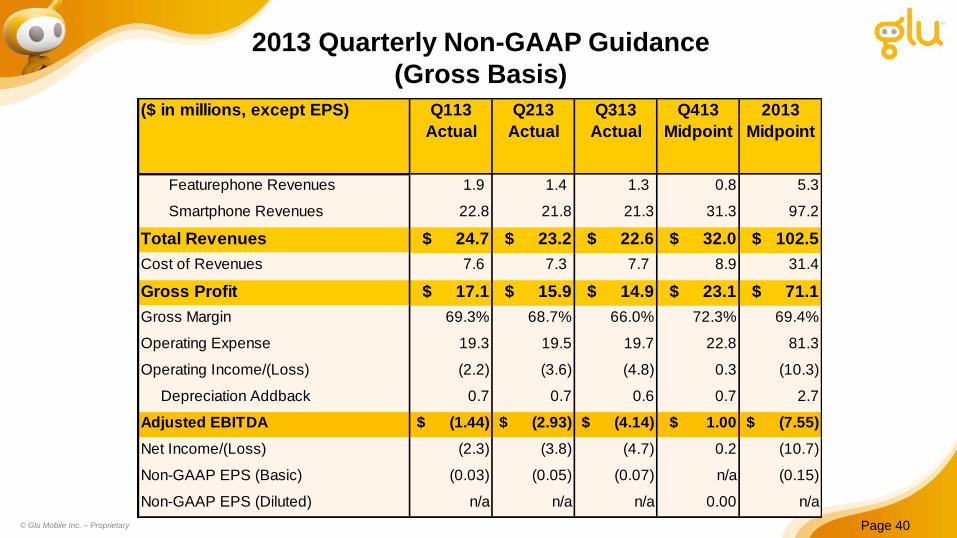
2013 Quarterly Non-GAAP Guidance
(Gross Basis)
Page 40 © Glu Mobile Inc. – Proprietary
($ in millions, except EPS) Q113
Actual
Q213
Actual
Q313
Actual
Q413
Midpoint
2013
Midpoint
Featurephone Revenues 1.9 1.4 1.3 0.8 5.3
Smartphone Revenues 22.8 21.8 21.3 31.3 97.2
Total Revenues $ 24.7 $ 23.2 $ 22.6 $ 32.0 $ 102.5
Cost of Revenues 7.6 7.3 7.7 8.9 31.4
Gross Profit $ 17.1 $ 15.9 $ 14.9 $ 23.1 $ 71.1
Gross Margin 69.3% 68.7% 66.0% 72.3% 69.4%
Operating Expense 19.3 19.5 19.7 22.8 81.3
Operating Income/(Loss) (2.2) (3.6) (4.8) 0.3 (10.3)
Depreciation Addback 0.7 0.7 0.6 0.7 2.7
Adjusted EBITDA $ (1.44) $ (2.93) $ (4.14) $ 1.00 $ (7.55)
Net Income/(Loss) (2.3) (3.8) (4.7) 0.2 (10.7)
Non-GAAP EPS (Basic) (0.03) (0.05) (0.07) n/a (0.15)
Non-GAAP EPS (Diluted) n/a n/a n/a 0.00 n/a
Page 41
• Estimated initial baseline total non-GAAP revenue growth rate of
approximately 15% to 20% for 2014 from the full year 2013 guidance
• However, investors should bear in mind that this estimated growth reflects
current estimates as Glu is in the early stages of its 2014 planning process
© Glu Mobile Inc. – Proprietary
2014 Full Year Guidance
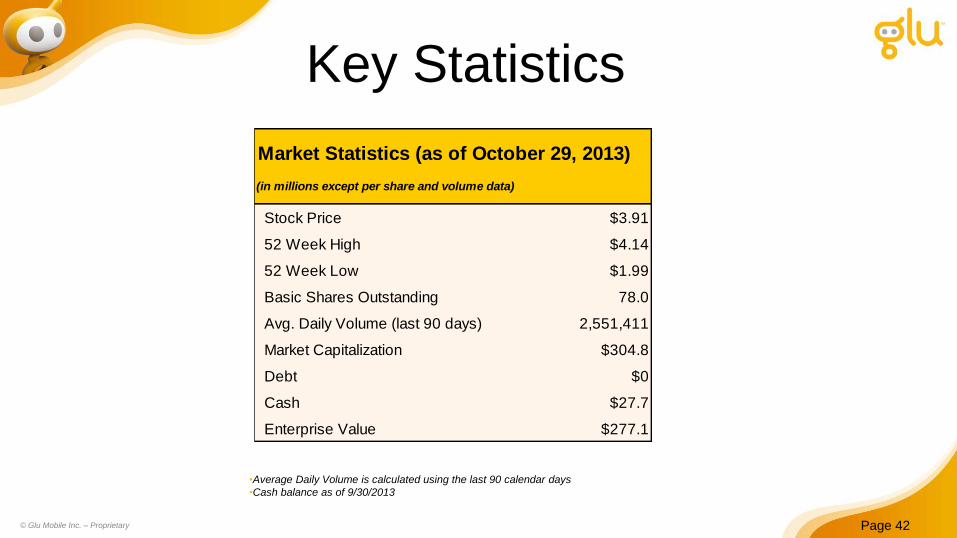
Key Statistics
•Average Daily Volume is calculated using the last 90 calendar days
•Cash balance as of 9/30/2013
Page 42 © Glu Mobile Inc. – Proprietary
Stock Price $3.91
52 Week High $4.14
52 Week Low $1.99
Basic Shares Outstanding 78.0
Avg. Daily Volume (last 90 days) 2,551,411
Market Capitalization $304.8
Debt $0
Cash $27.7
Enterprise Value $277.1
Market Statistics (as of October 29, 2013)
(in millions except per share and volume data)
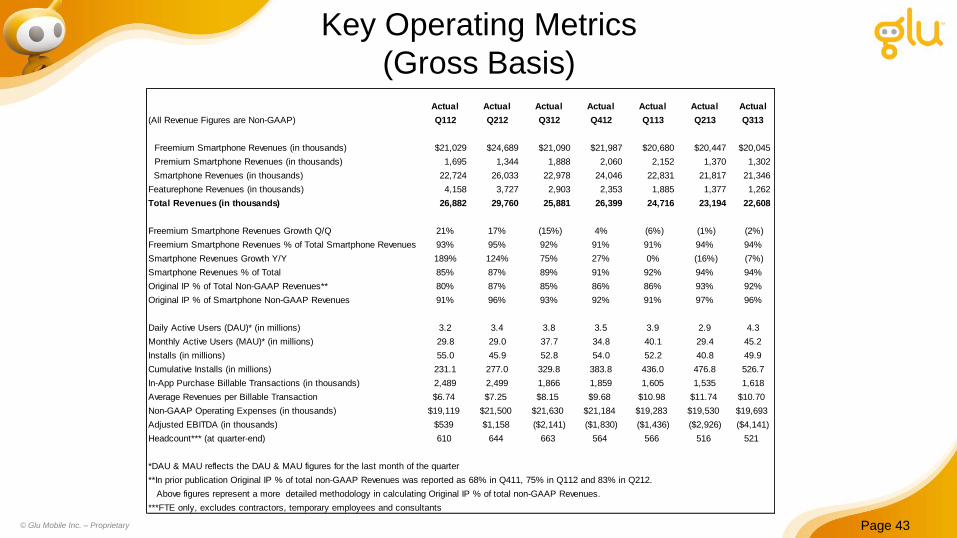
Key Operating Metrics
(Gross Basis)
Page 43 © Glu Mobile Inc. – Proprietary
Actual Actual Actual Actual Actual Actual Actual
(All Revenue Figures are Non-GAAP) Q112 Q212 Q312 Q412 Q113 Q213 Q313
Freemium Smartphone Revenues (in thousands) $21,029 $24,689 $21,090 $21,987 $20,680 $20,447 $20,045
Premium Smartphone Revenues (in thousands) 1,695 1,344 1,888 2,060 2,152 1,370 1,302
Smartphone Revenues (in thousands) 22,724 26,033 22,978 24,046 22,831 21,817 21,346
Featurephone Revenues (in thousands) 4,158 3,727 2,903 2,353 1,885 1,377 1,262
Total Revenues (in thousands) 26,882 29,760 25,881 26,399 24,716 23,194 22,608
Freemium Smartphone Revenues Growth Q/Q 21% 17% (15%) 4% (6%) (1%) (2%)
Freemium Smartphone Revenues % of Total Smartphone Revenues 93% 95% 92% 91% 91% 94% 94%
Smartphone Revenues Growth Y/Y 189% 124% 75% 27% 0% (16%) (7%)
Smartphone Revenues % of Total 85% 87% 89% 91% 92% 94% 94%
Original IP % of Total Non-GAAP Revenues** 80% 87% 85% 86% 86% 93% 92%
Original IP % of Smartphone Non-GAAP Revenues 91% 96% 93% 92% 91% 97% 96%
Daily Active Users (DAU)* (in millions) 3.2 3.4 3.8 3.5 3.9 2.9 4.3
Monthly Active Users (MAU)* (in millions) 29.8 29.0 37.7 34.8 40.1 29.4 45.2
Installs (in millions) 55.0 45.9 52.8 54.0 52.2 40.8 49.9
Cumulative Installs (in millions) 231.1 277.0 329.8 383.8 436.0 476.8 526.7
In-App Purchase Billable Transactions (in thousands) 2,489 2,499 1,866 1,859 1,605 1,535 1,618
Average Revenues per Billable Transaction $6.74 $7.25 $8.15 $9.68 $10.98 $11.74 $10.70
Non-GAAP Operating Expenses (in thousands) $19,119 $21,500 $21,630 $21,184 $19,283 $19,530 $19,693
Adjusted EBITDA (in thousands) $539 $1,158 ($2,141) ($1,830) ($1,436) ($2,926) ($4,141)
Headcount*** (at quarter-end) 610 644 663 564 566 516 521
*DAU & MAU reflects the DAU & MAU figures for the last month of the quarter
**In prior publication Original IP % of total non-GAAP Revenues was reported as 68% in Q411, 75% in Q112 and 83% in Q212.
Above figures represent a more detailed methodology in calculating Original IP % of total non-GAAP Revenues.
***FTE only, excludes contractors, temporary employees and consultants
Glu Mobile:
Investment Overview
• Strong secular global growth opportunity
• New Monetization and User Acquisitions teams starting to show
tangible results
• Games as a Service strategy bolsters title lifetime revenue
fundamentals
Page 44 © Glu Mobile Inc. – Proprietary


![Corso-Chim-Org-zuccheri.ppt [modalità compatibilità] · 17 Maltosio α-Glu α-Glu Saccarosio legame glicosidico 1α-Glu 2β-Fru β-Fru α-Glu legame glicosidico 1α-Glu 4α-Glu](https://img.pdfslide.net/doc/110x75/5baa638609d3f260698c1f45/corso-chim-org-modalita-compatibilita-17-maltosio-glu-glu-saccarosio.jpg)